An Integrated Quantitative Safety Assessment Framework Based on the STPA and System Dynamics


Abstract
:1. Introduction
- (1)
- How to extract risk factors and their qualitative cause–effect correlations from socio-technical systems.
- (2)
- How to quantify the causal relationships between the risk factors.
- (3)
- How to quantify the safety level of socio-technical systems and provide early warning of their weaknesses.
2. Methodology
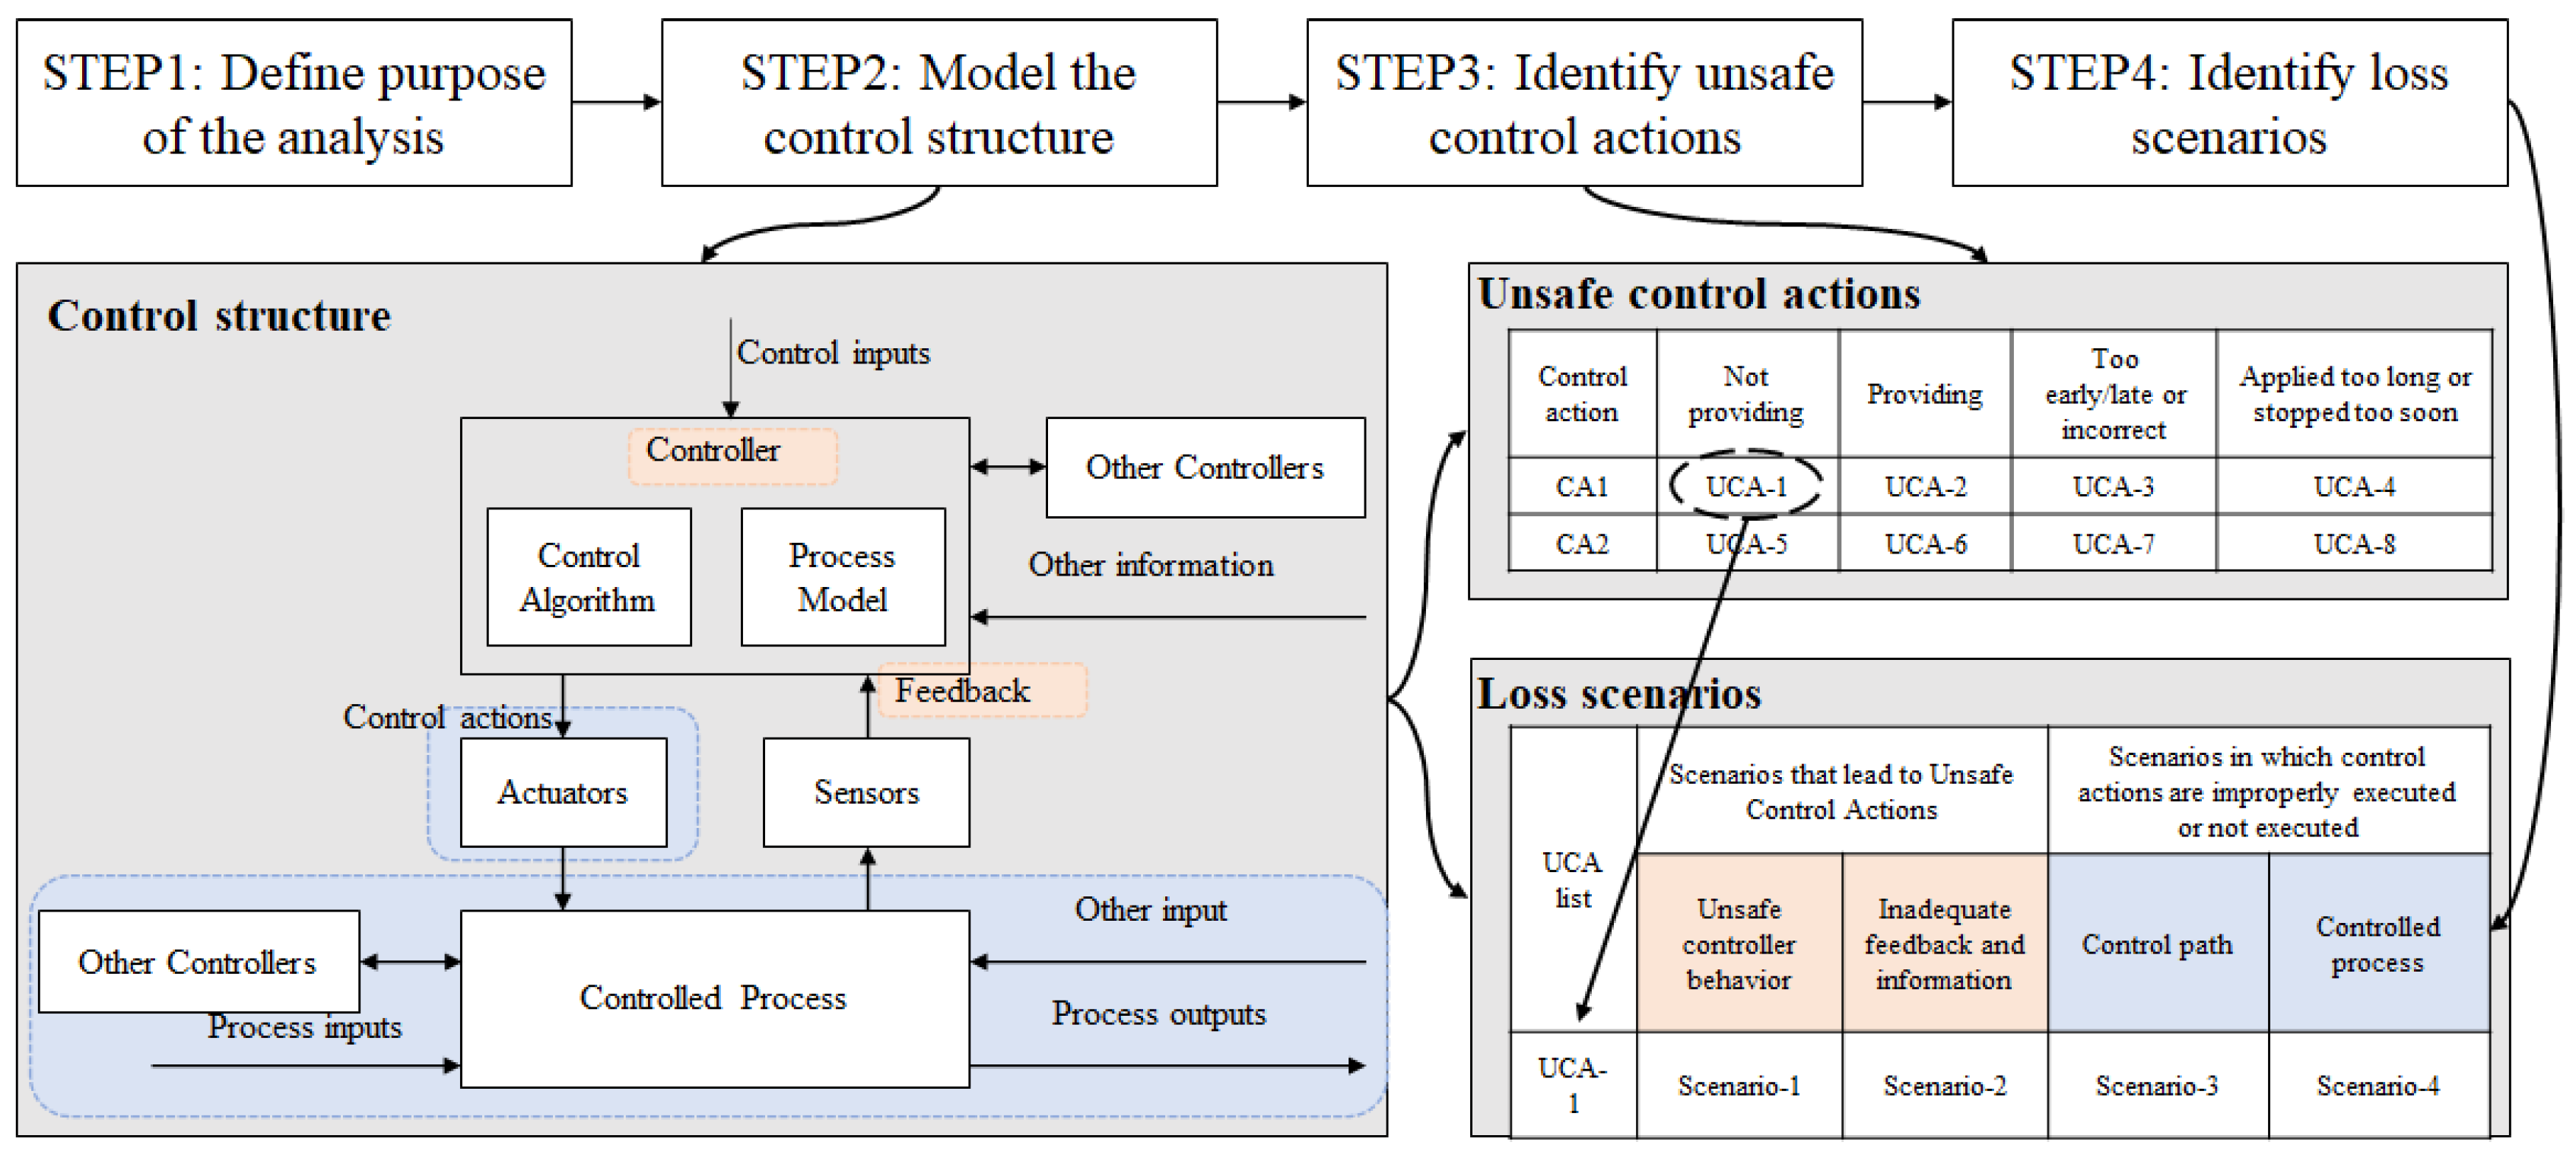
2.1. System Theoretic Process Analysis (STPA)
- (1)
- Not providing the control action leads to a hazard.
- (2)
- Providing the control action incorrectly or when not needed leads to a hazard.
- (3)
- Providing the CA too early or too late or in the wrong order leads to a hazard.
- (4)
- Providing the CA too long or too short leads to a hazard.
2.2. Analytic Network Process (ANP)
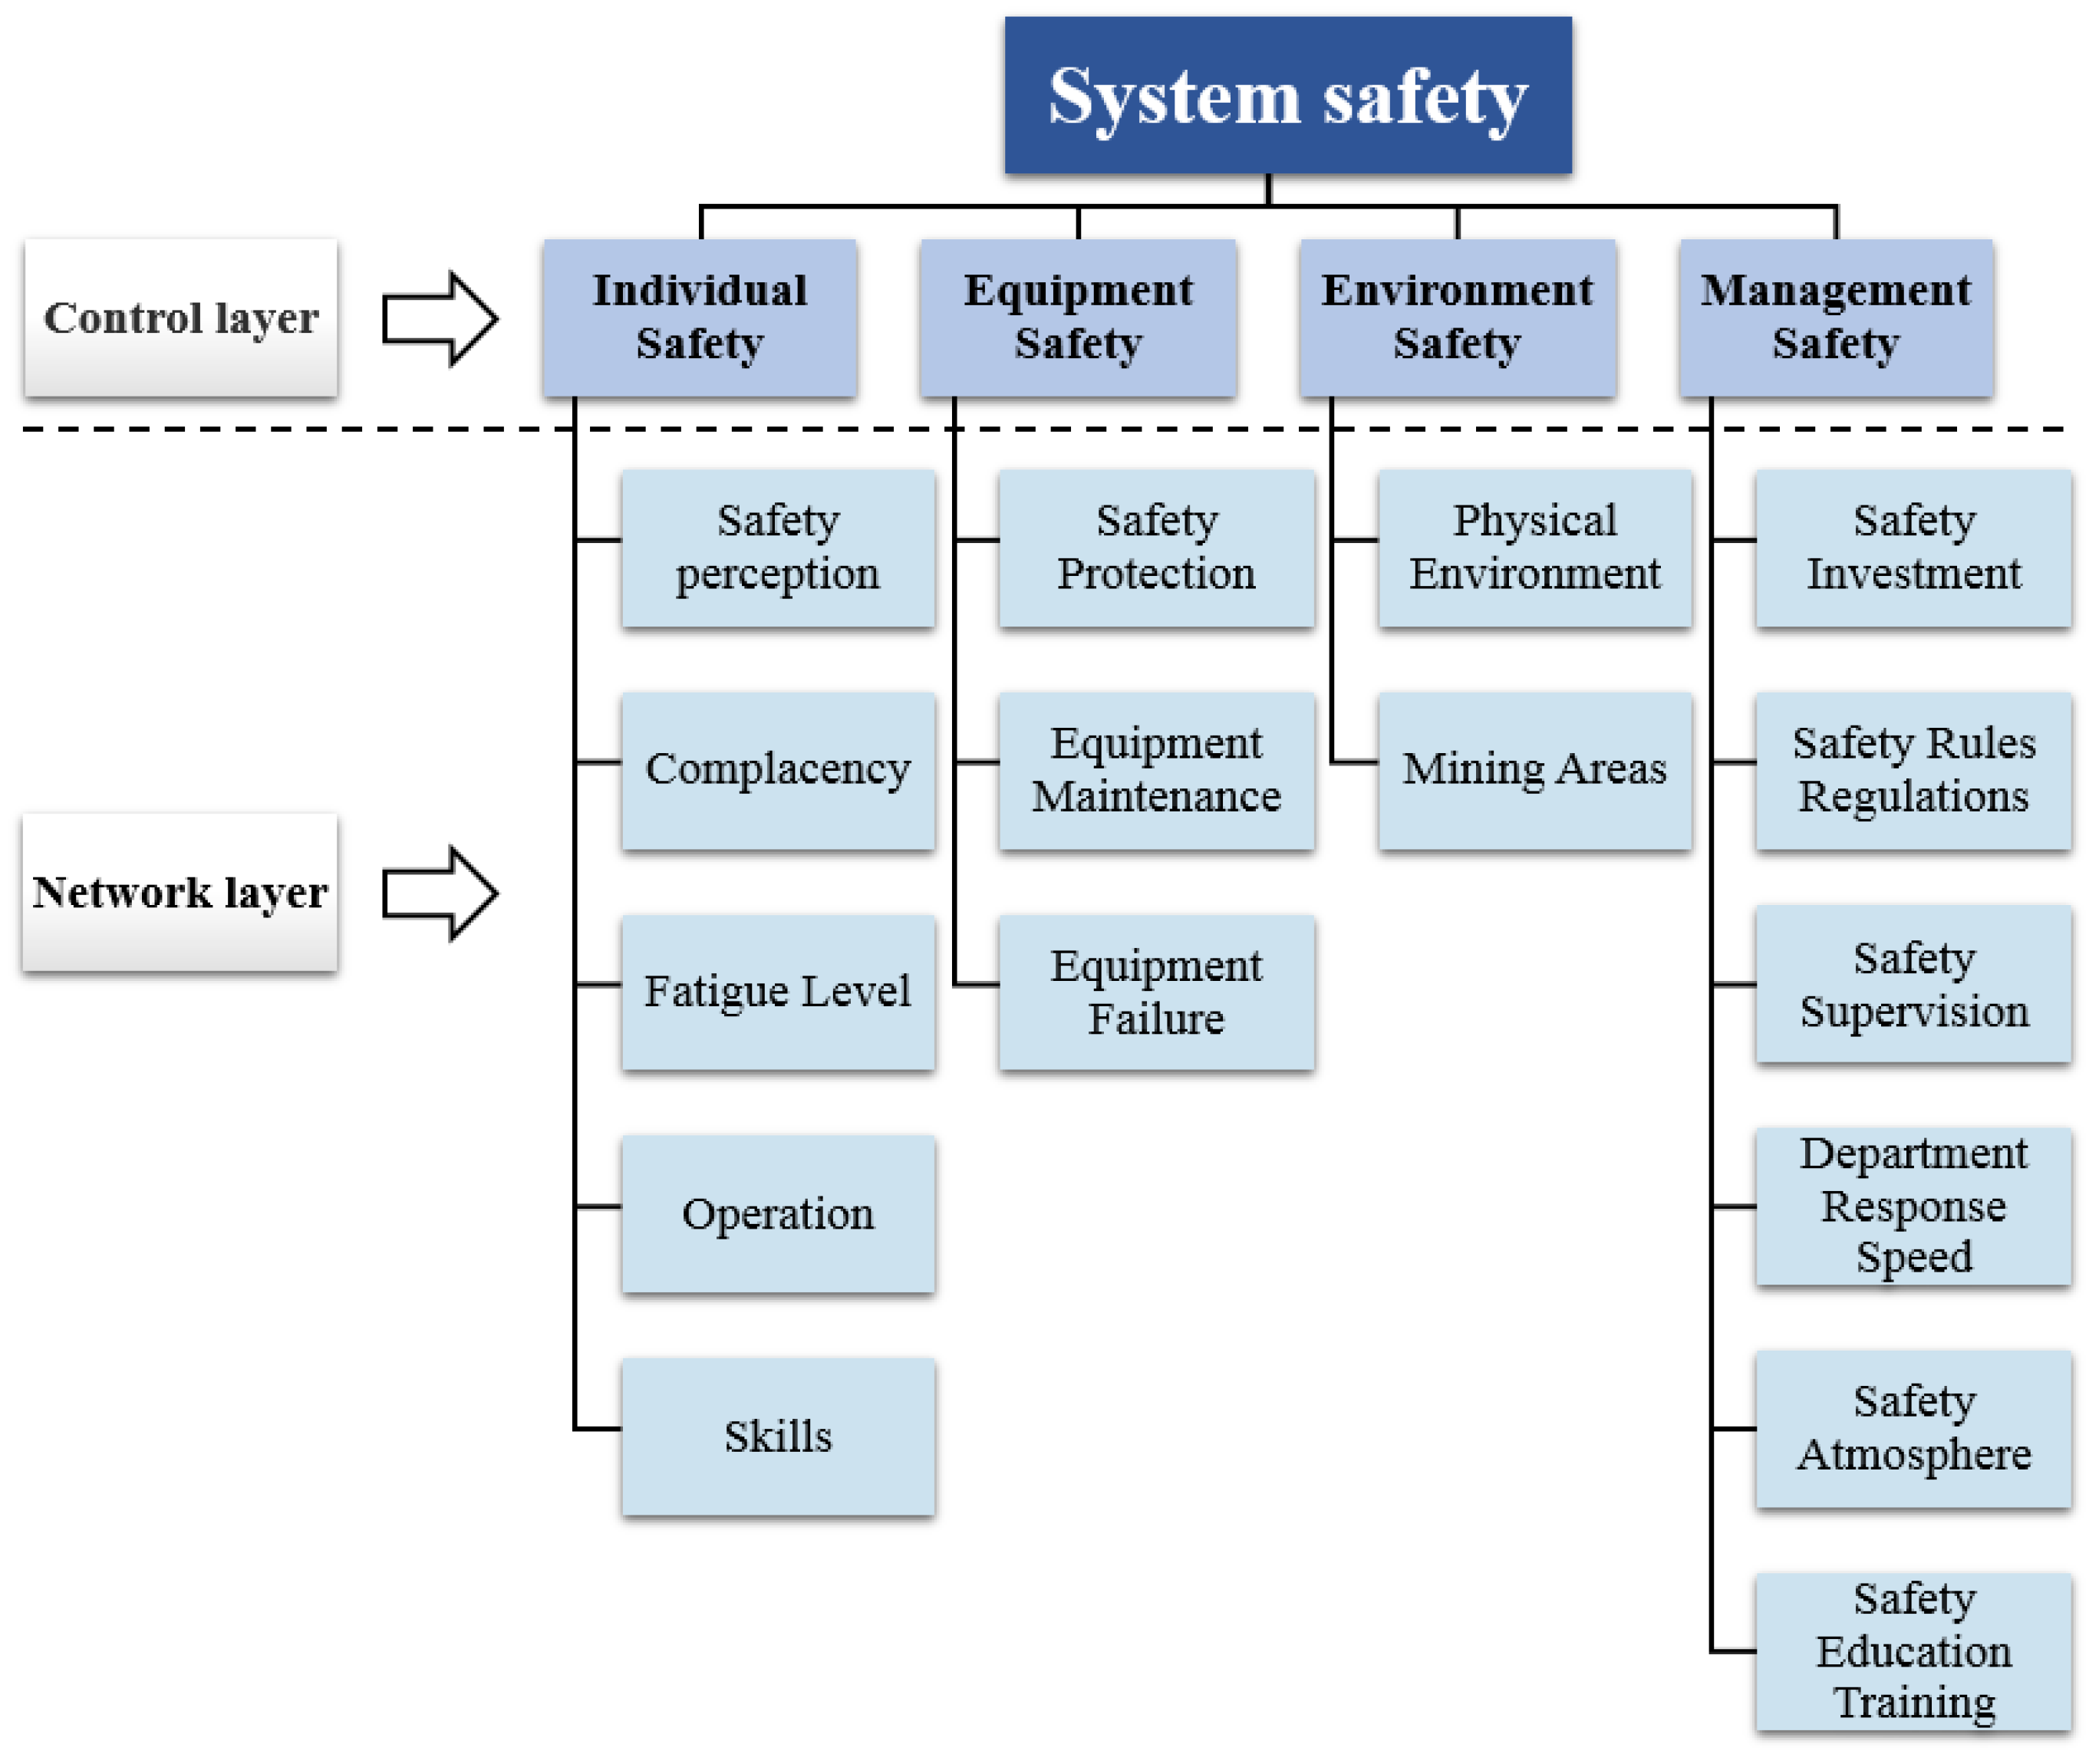
- Establishment of the network structure model
- 2.
- Determination of the weights of the influencing factors
2.3. System Dynamics (SD)
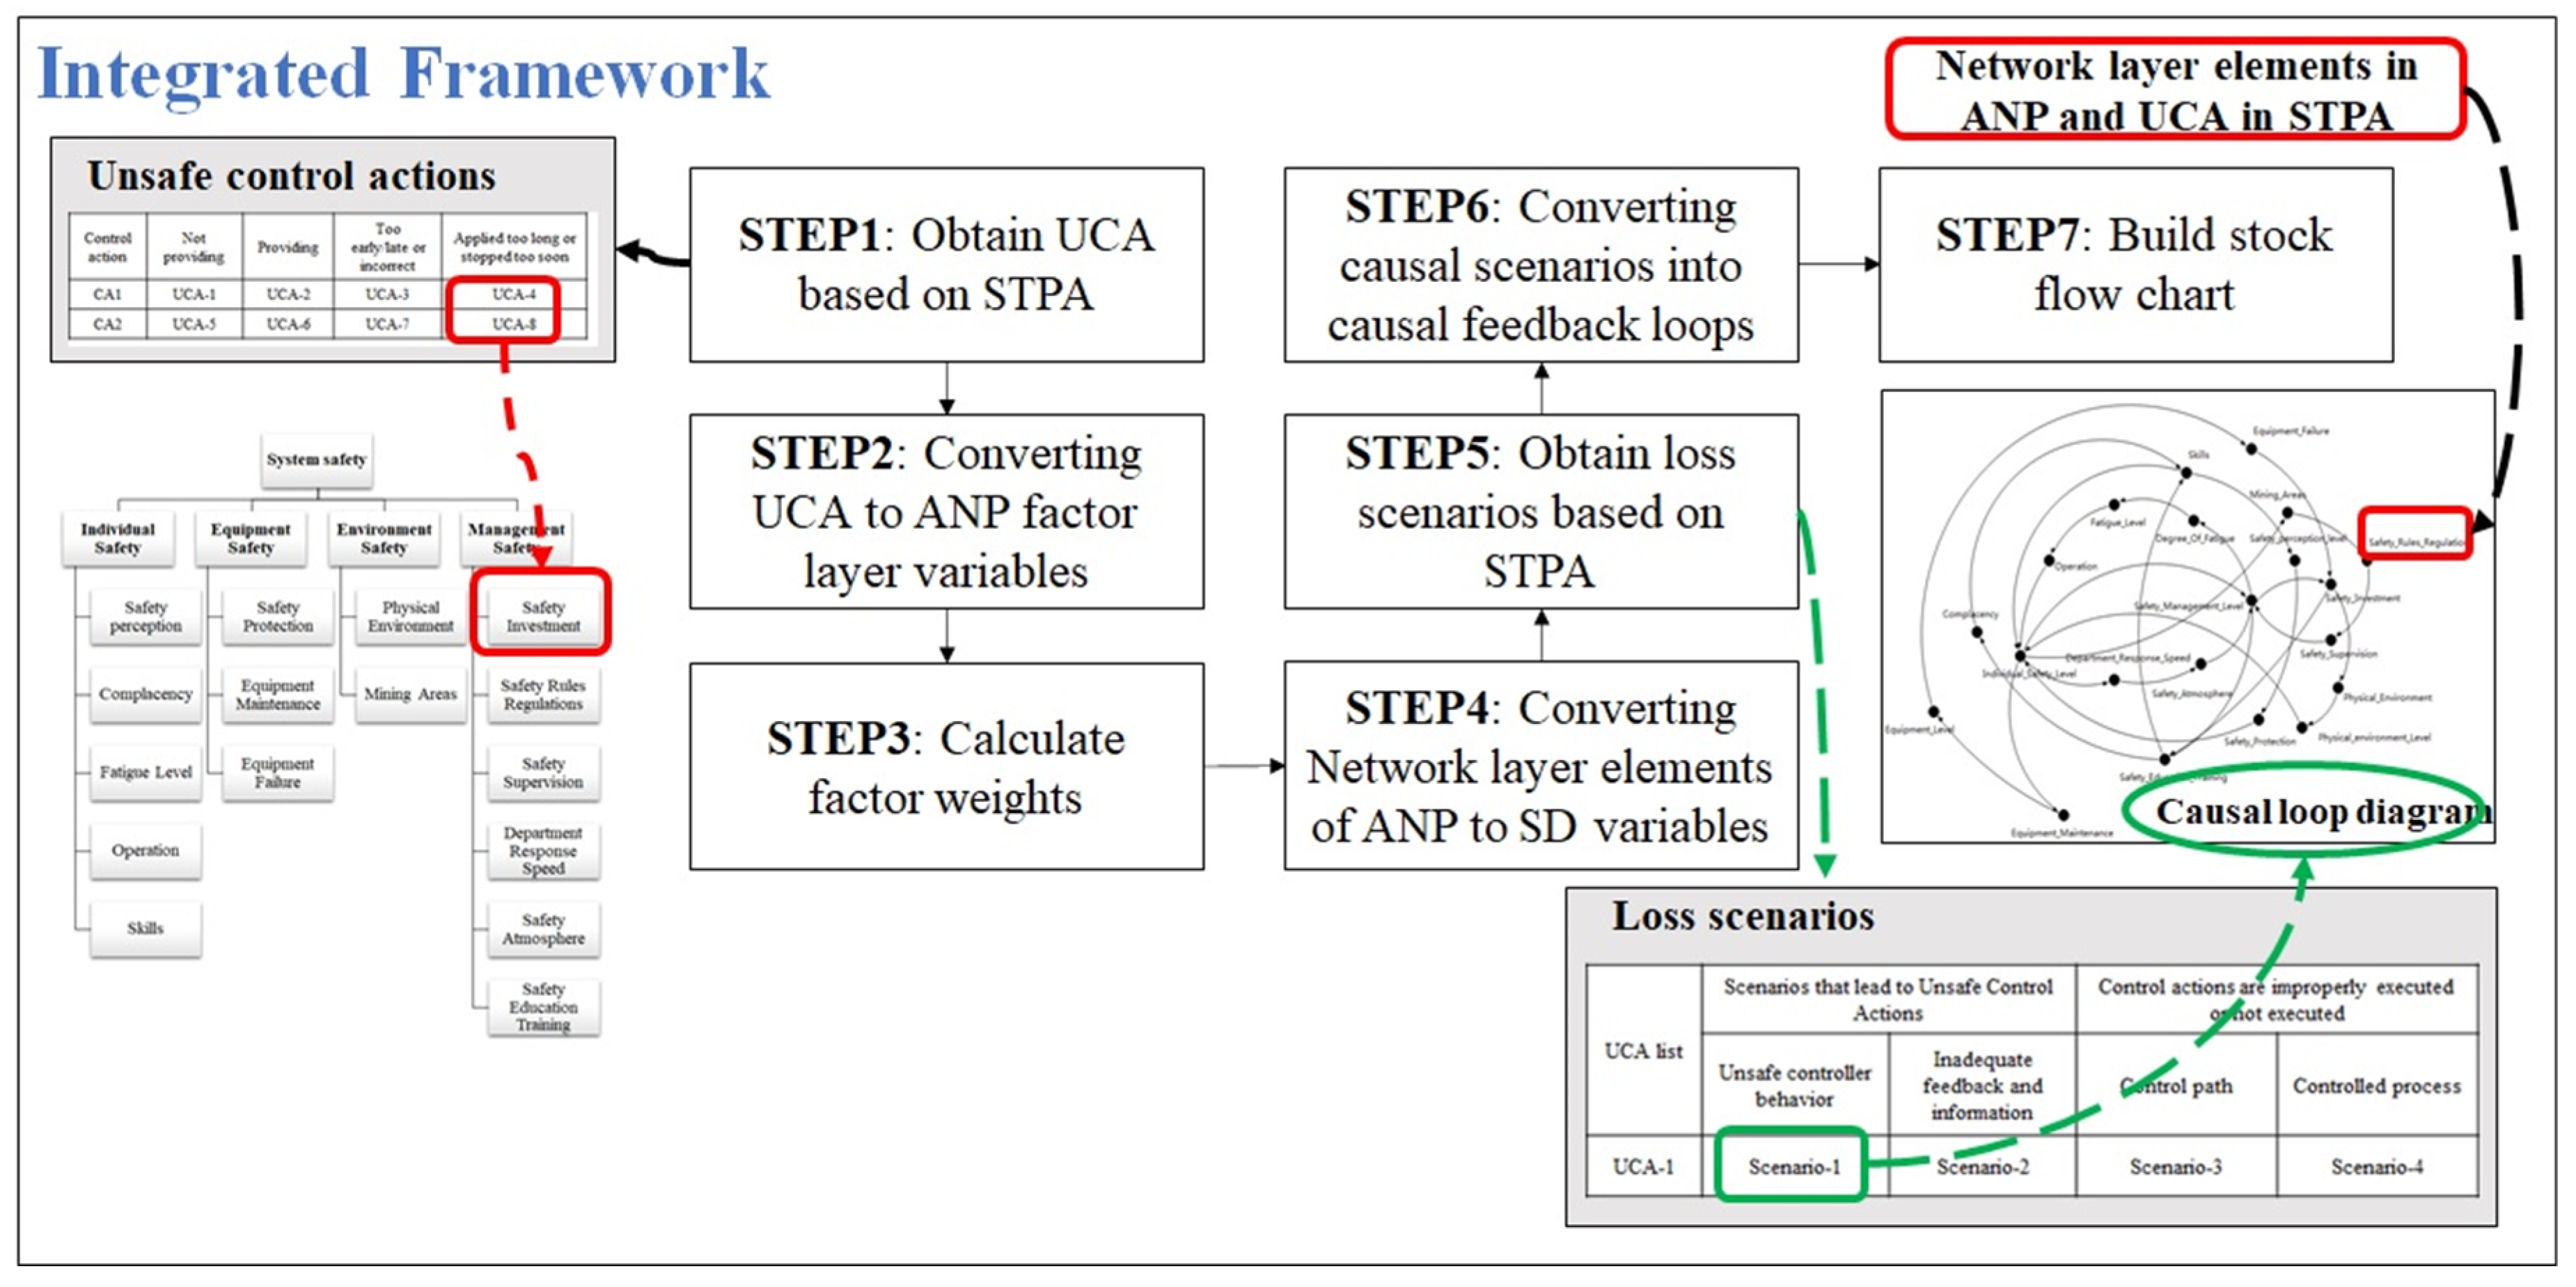
- UCA: Miners use personal protective equipment (PPE) too late when the oxygen content of the workplace is below 18% (data from the literature [34]).
- Loss scenario: Coal mining site supervisors low safety awareness and cannot require miners to use self-rescue devices in a timely manner when the oxygen concentration in the workplace is below 18%.
- The network layer element in ANP: Safety perception, safety protection.
- Causal loop (part of): Safety perception→safety protection. (The reduced safety awareness will reduce the proportion of people wearing PPE.)
2.4. Framework for the Proposed Method
3. Case Study
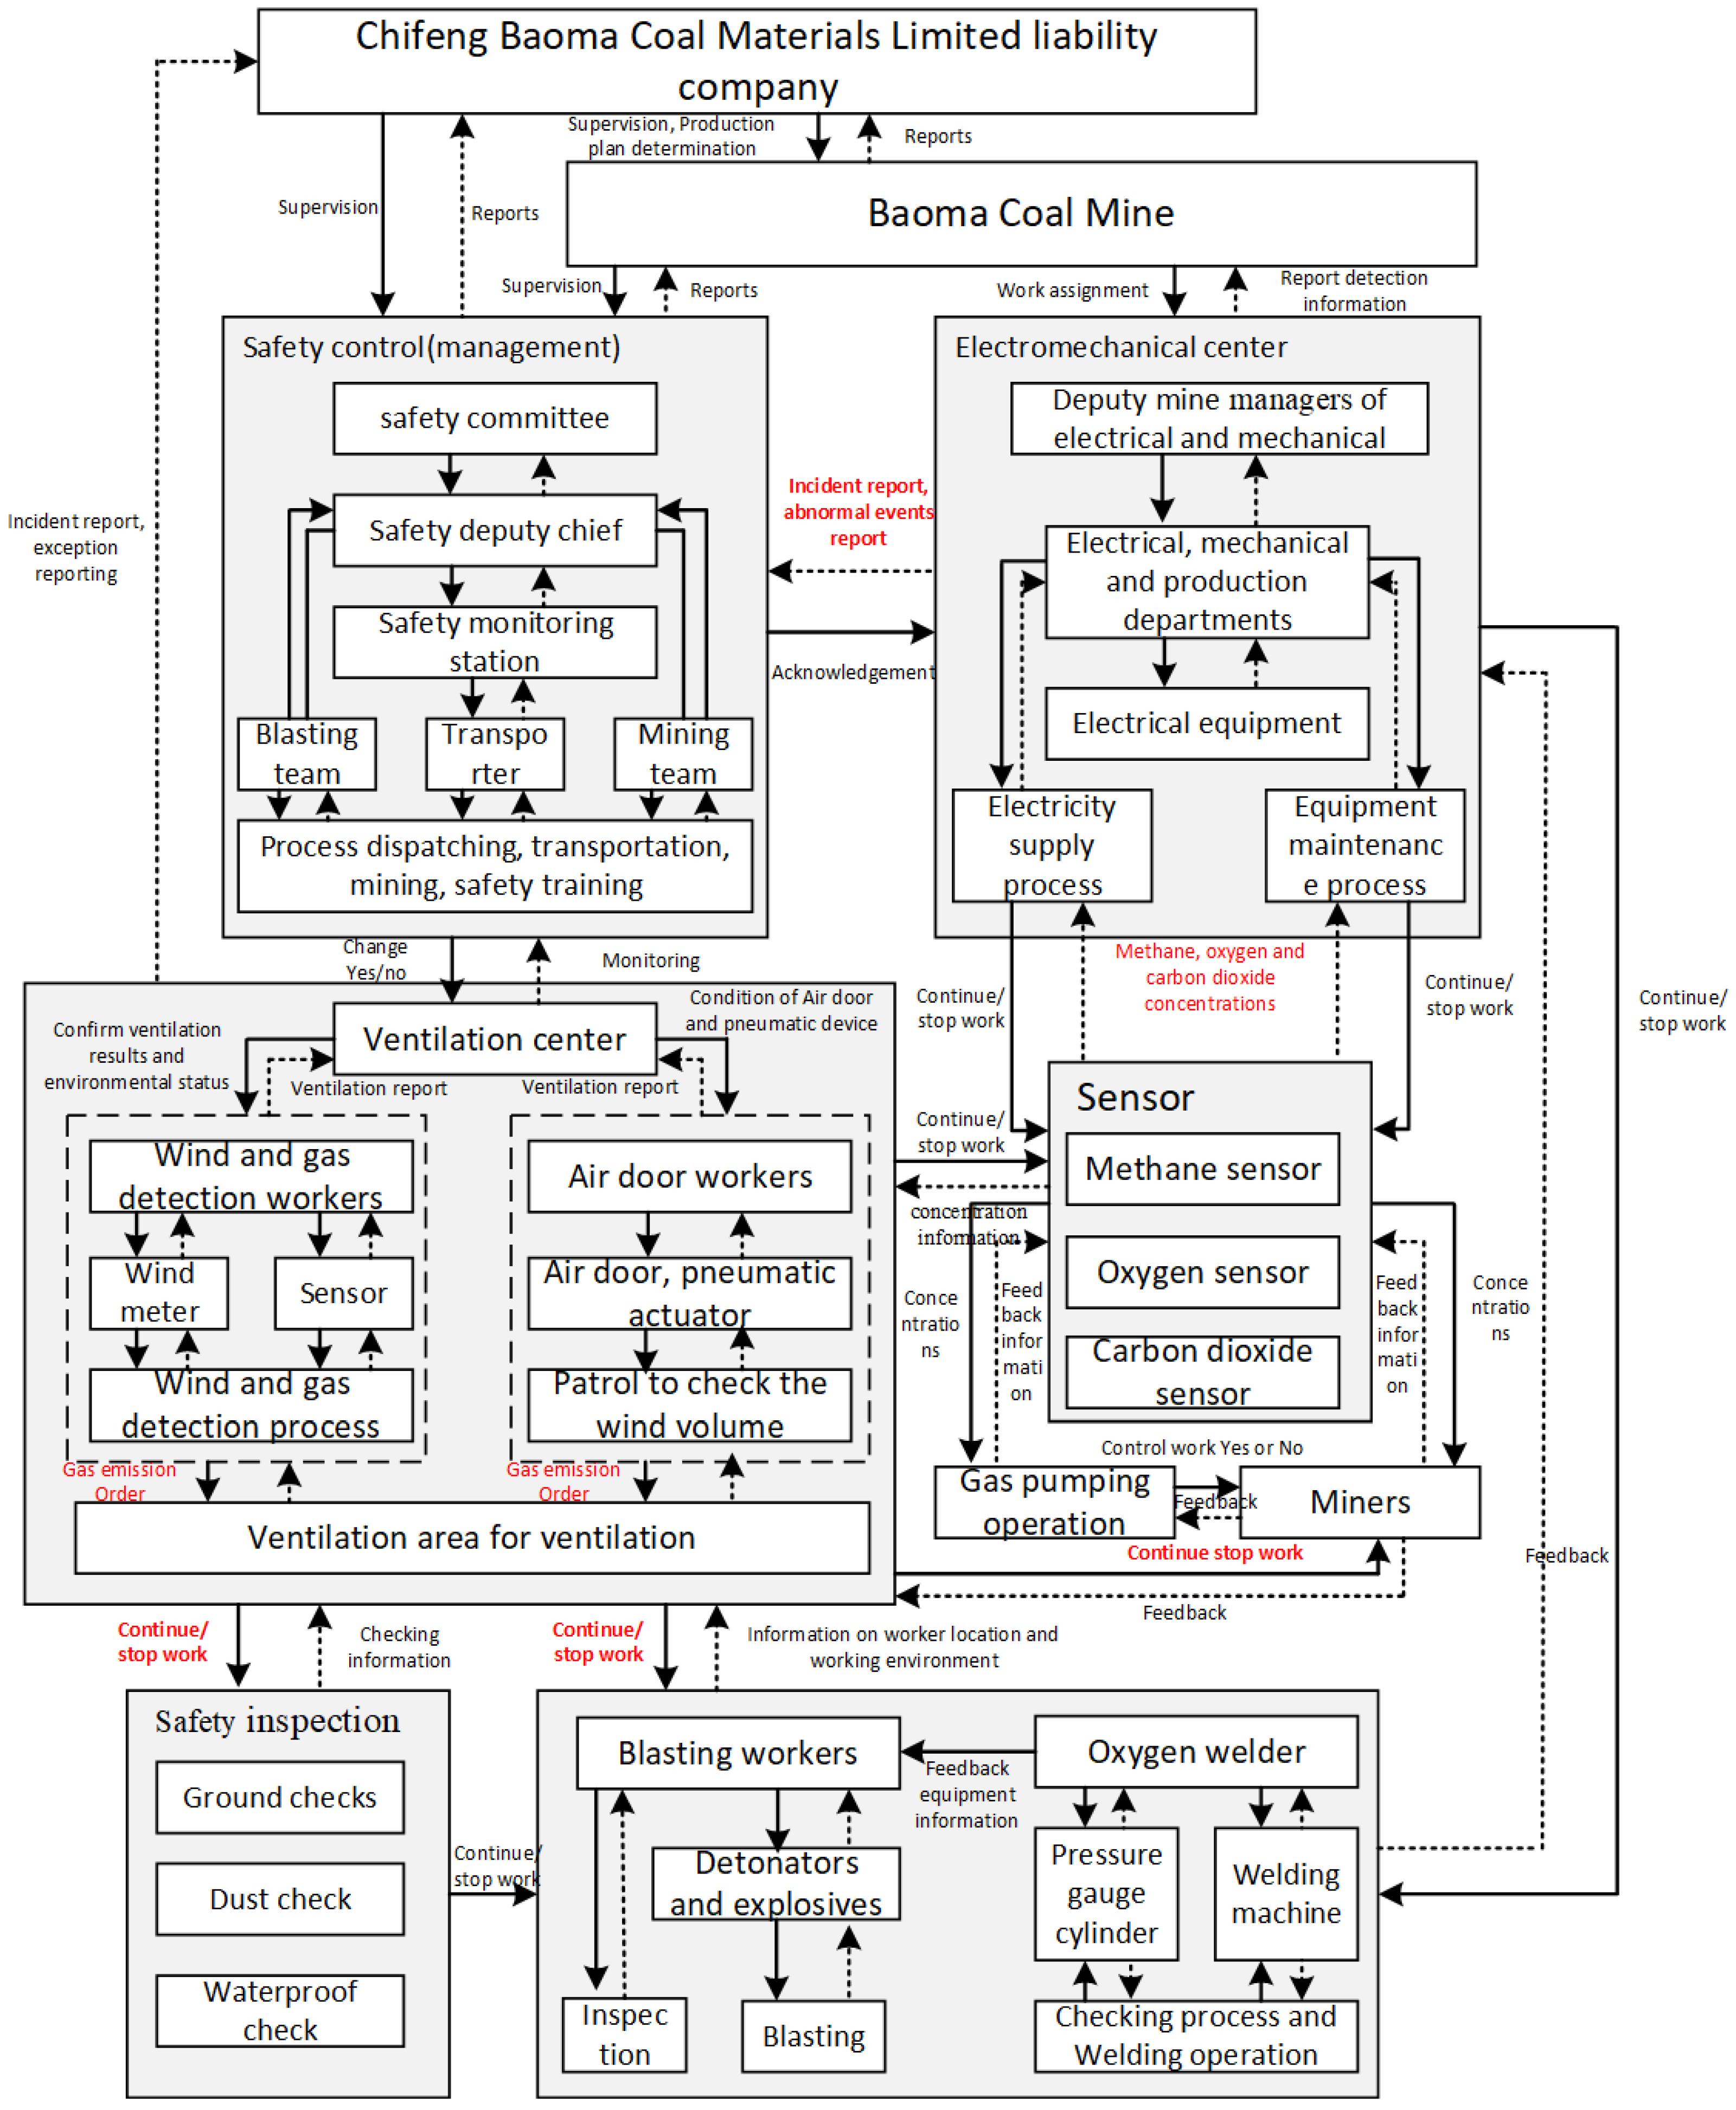
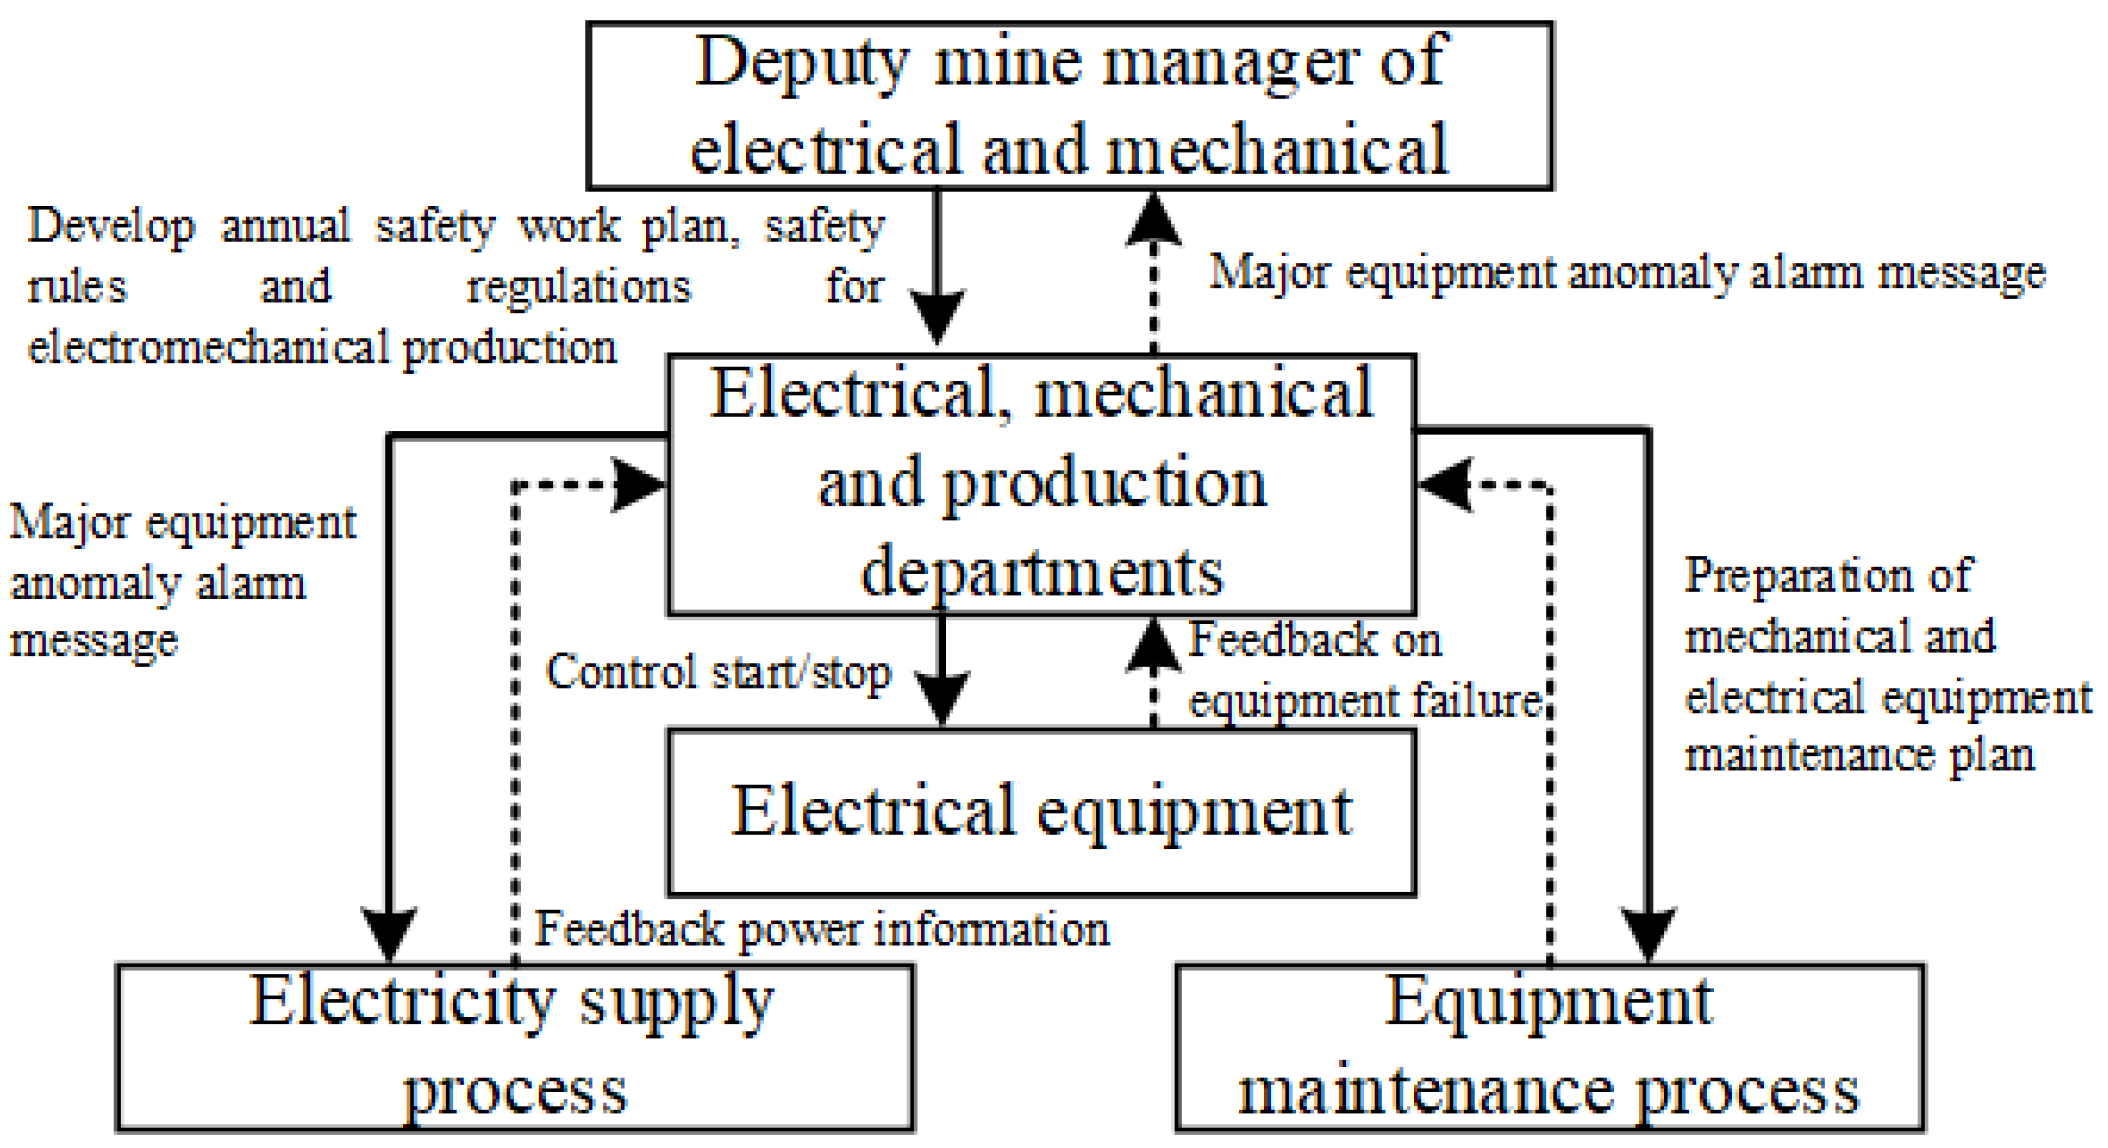
3.1. Safety Analysis of the Baoma Coal Mine System Using the STPA Method
3.1.1. Defining the Purpose of the Analysis
3.1.2. Model the Control Structure
3.1.3. Identify Unsafe Control Actions
3.1.4. Identify Loss Scenarios
3.2. Calculate the Factor Weights Using the ANP Method
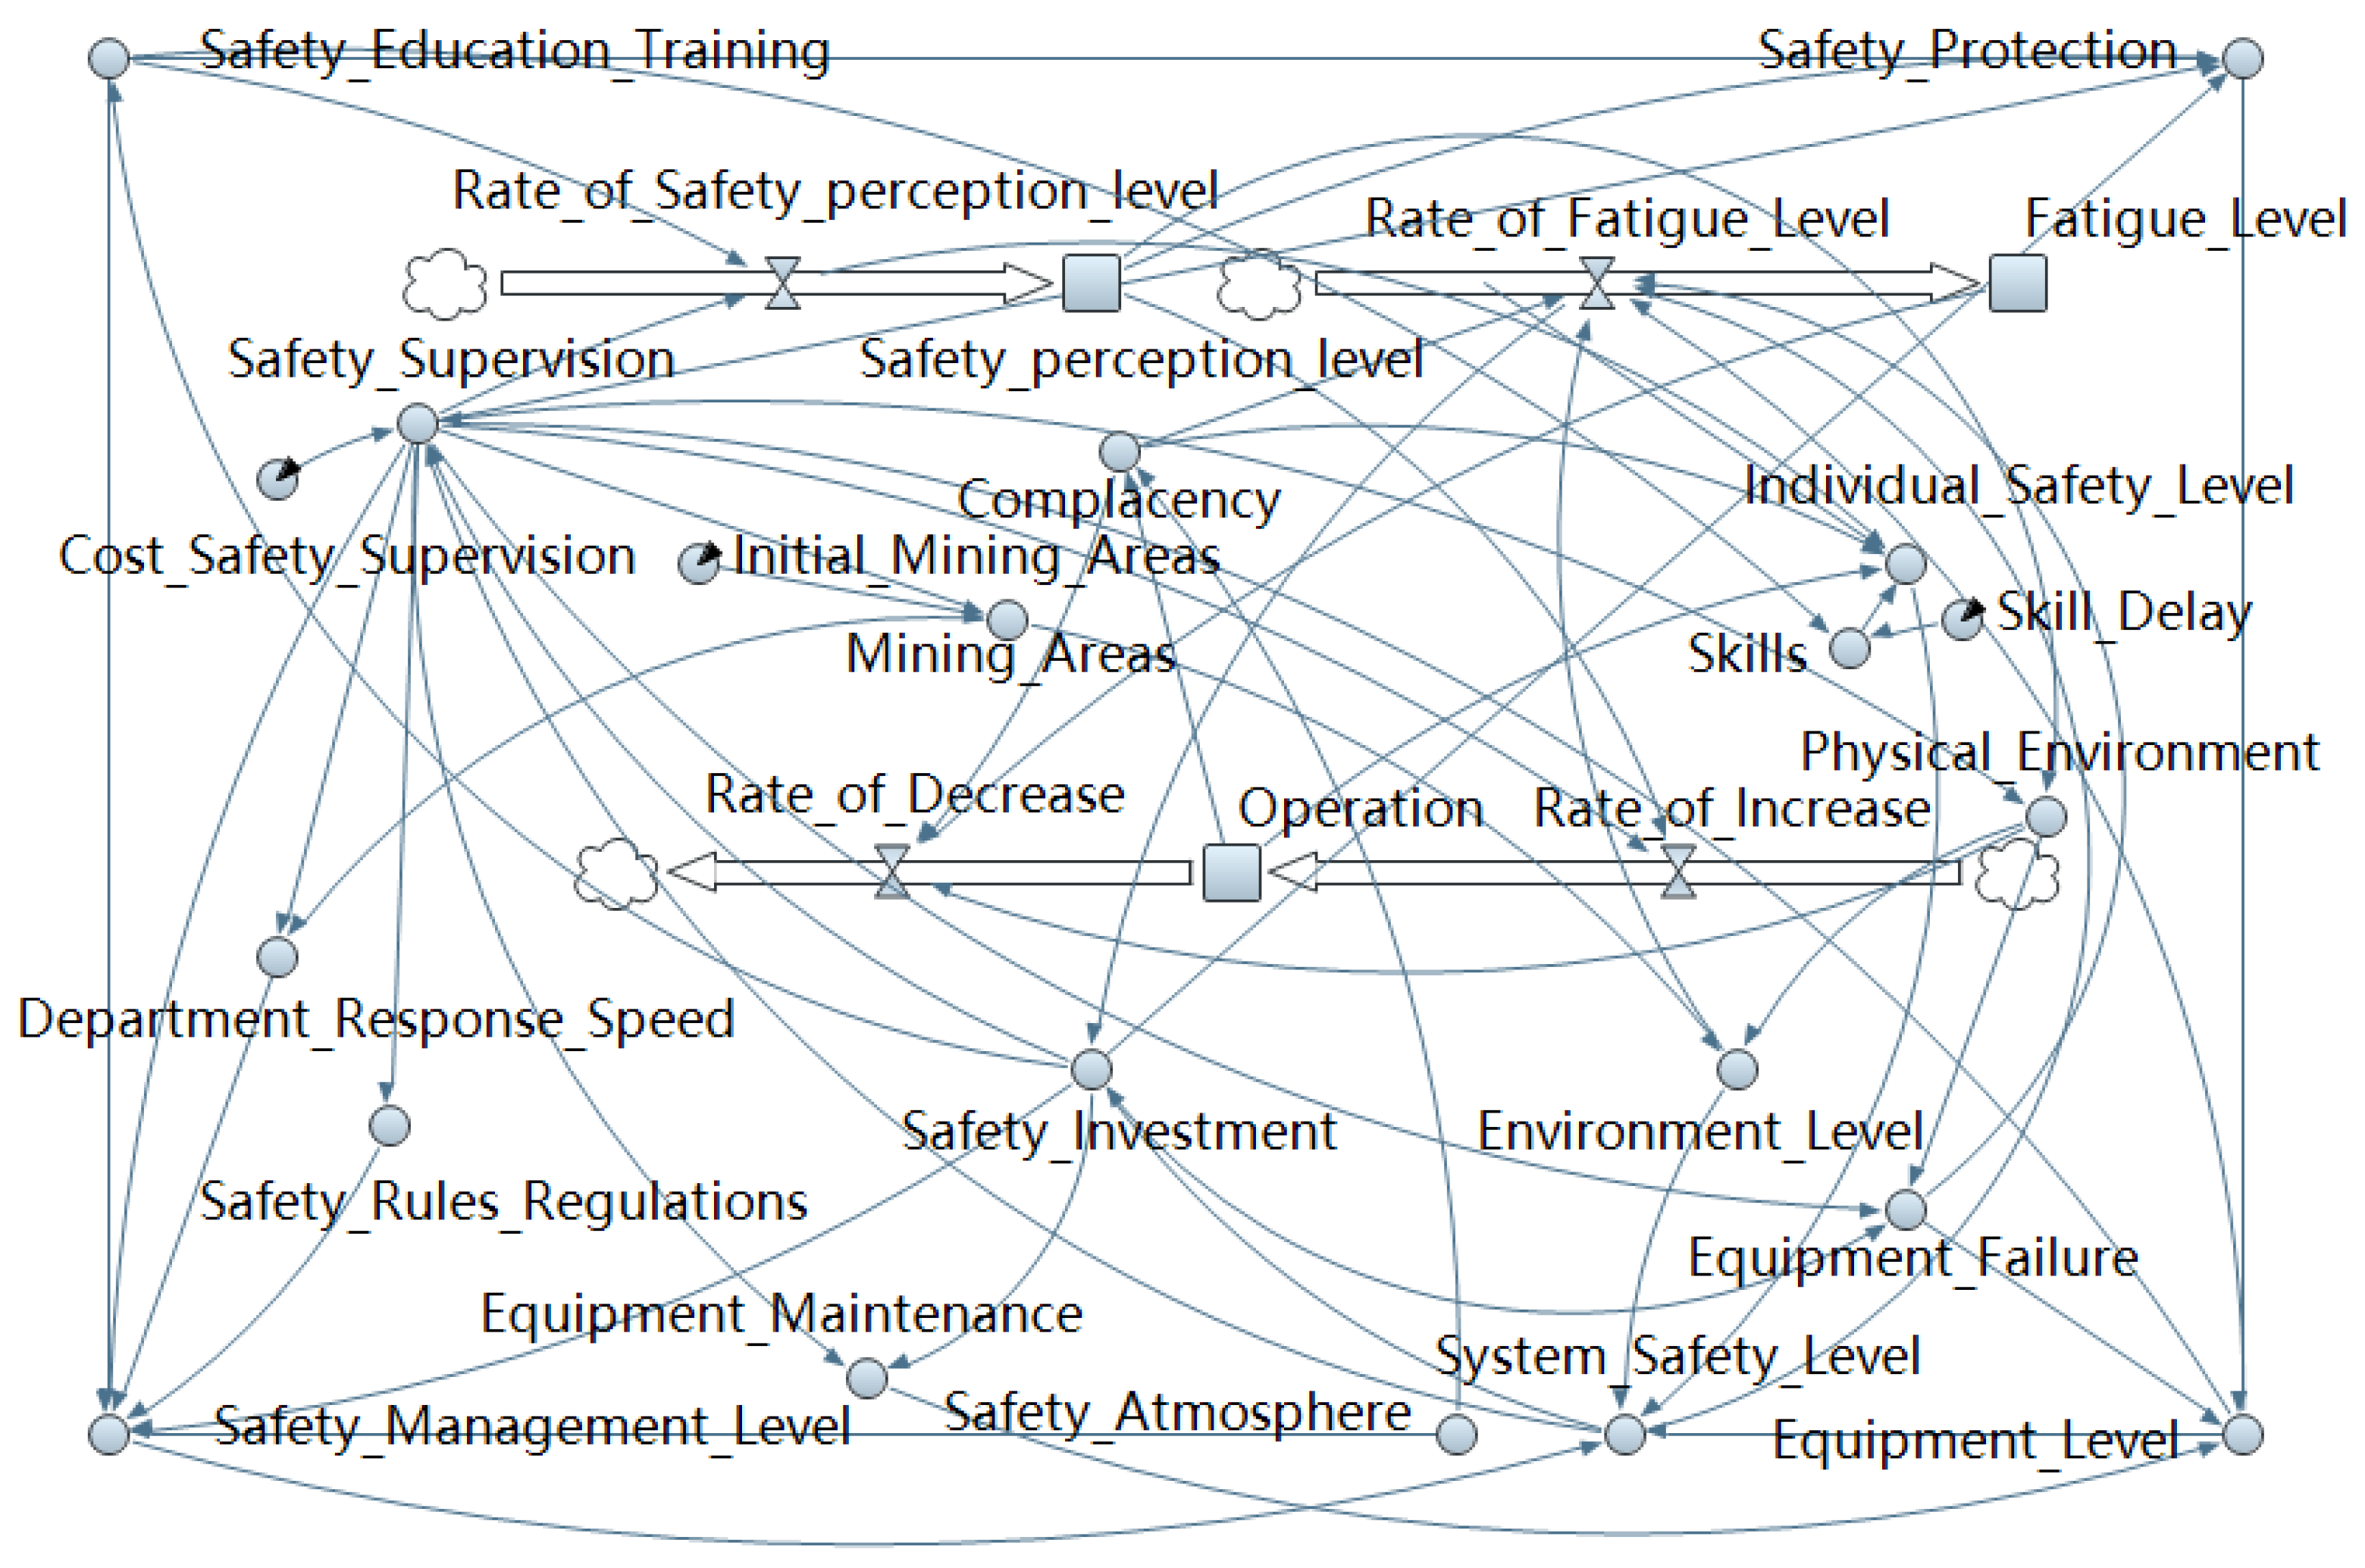
3.3. Coal Mine System Dynamics Model Construction
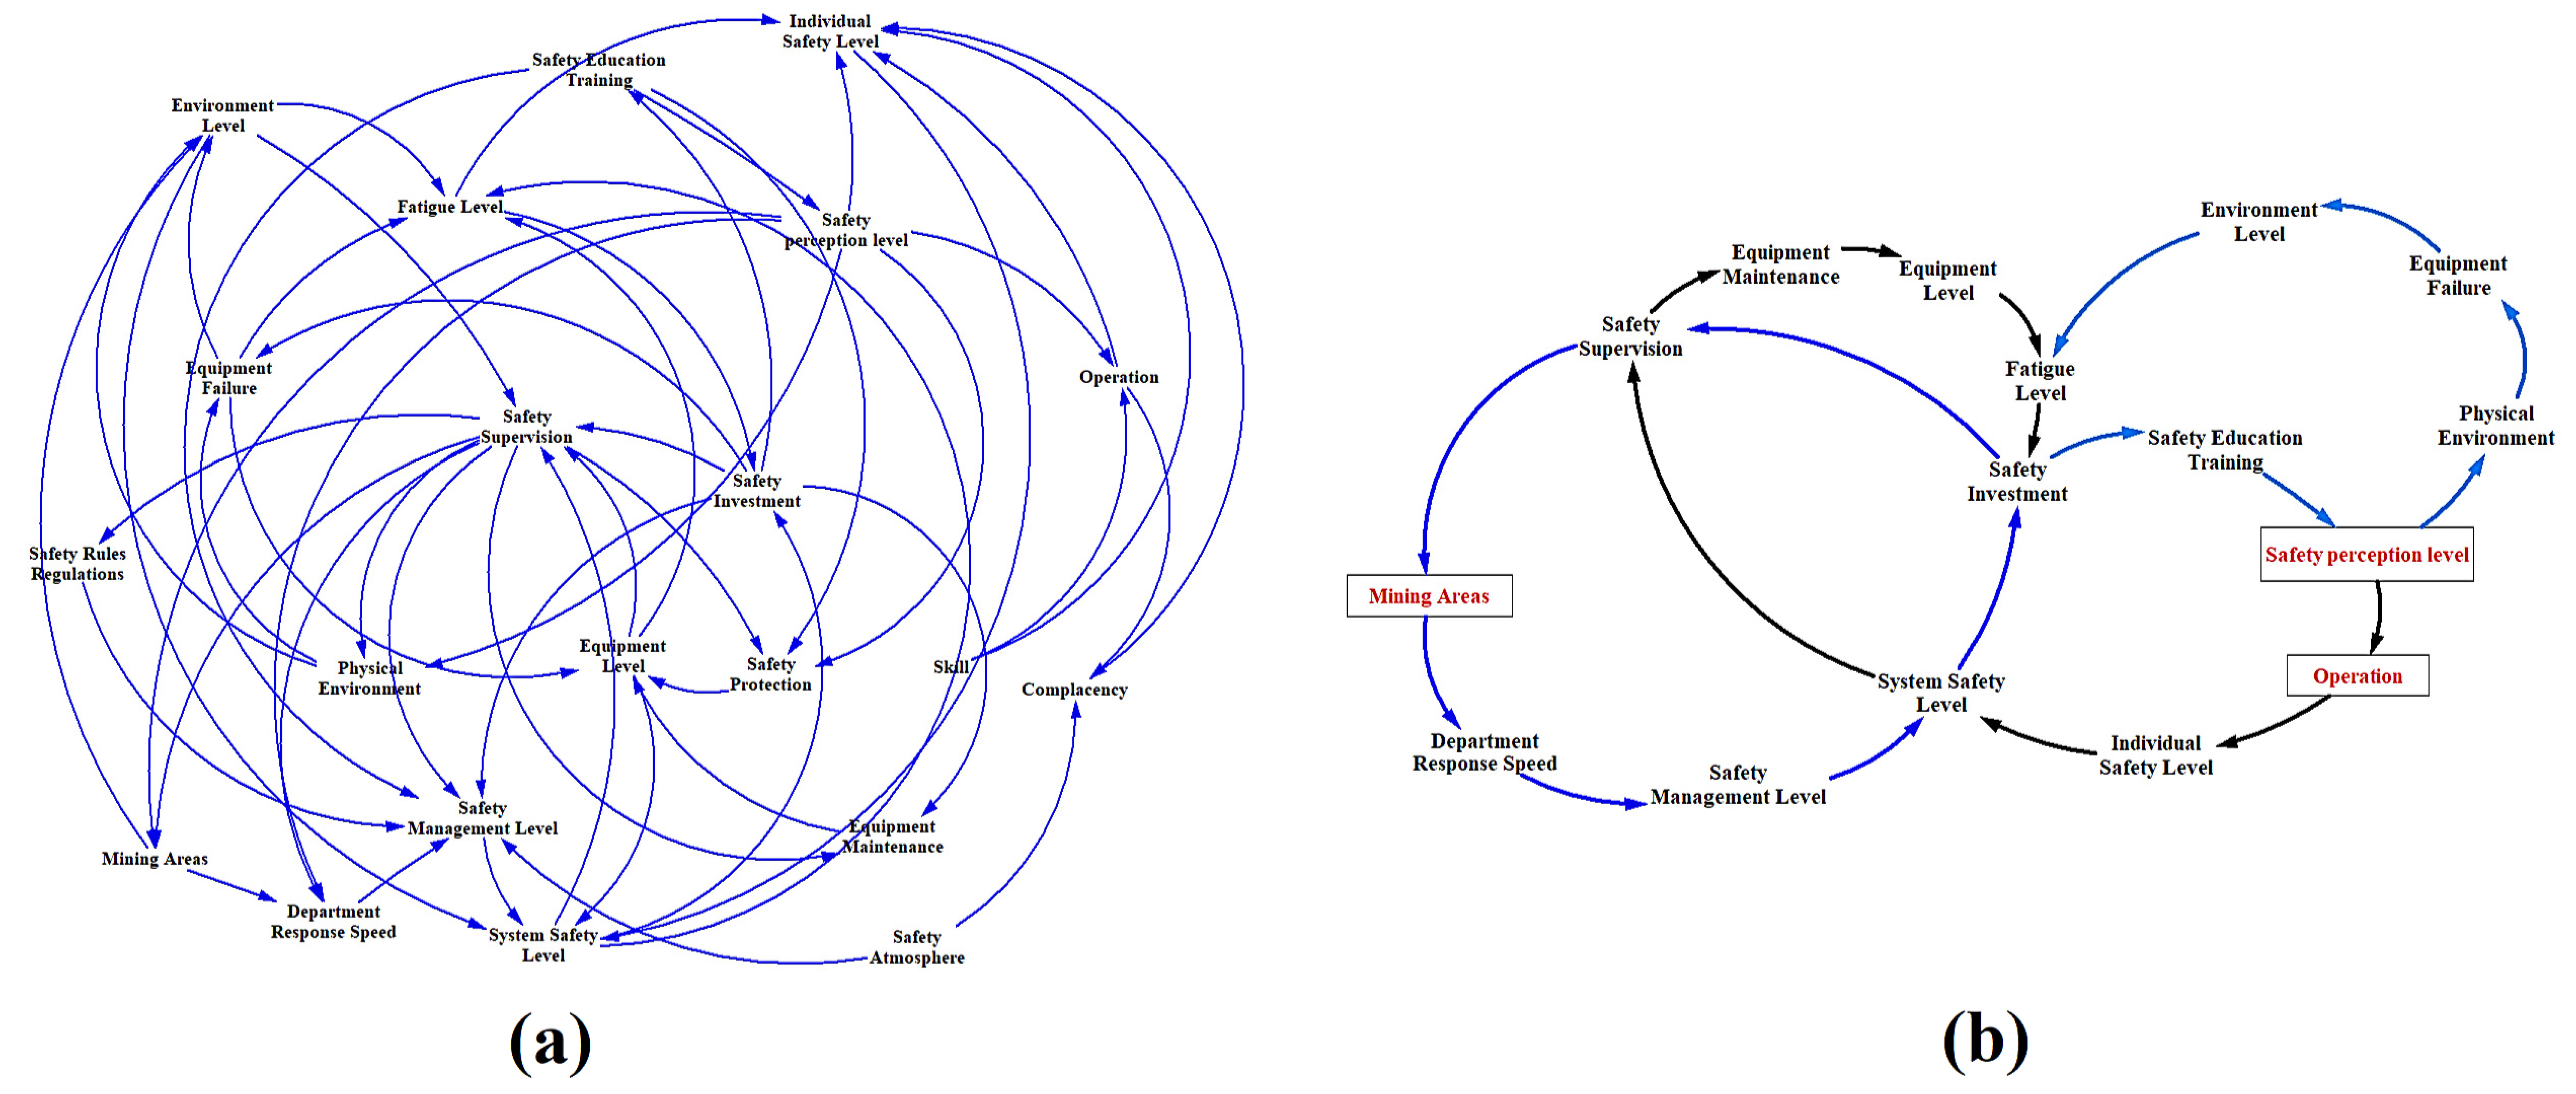
- (1)
- Mining Areas→Department Response Speed→Safety Management Level→System Safety Level→Safety Investment→Safety Supervision→Mining Areas
- (2)
- Operation→Individual Safety Level→System Safety Level→Safety Supervision→Equipment Maintenance→Equipment Level→Fatigue Level→Safety In-vestment→Safety Education Training→Safety perception level→Operation
- (3)
- Safety perception level→Physical Environment→Equipment Failure→Equipment Level→Fatigue Level→Safety Investment→Safety Education Training→Safety perception level.
4. Discussion
5. Conclusions
Author Contributions
Funding
Institutional Review Board Statement
Informed Consent Statement
Data Availability Statement
Acknowledgments
Conflicts of Interest
References
- Li, C.; Tang, T.; Chatzimichailidou, M.M.; Jun, G.T.; Waterson, P. A Hybrid Human and Organisational Analysis Method for Railway Accidents Based on STAMP-HFACS and Human Information Processing. Appl. Ergon. 2019, 79, 122–142. [Google Scholar] [CrossRef] [PubMed]
- Xing, J.; Meng, H.; Meng, X. An Urban Pipeline Accident Model Based on System Engineering and Game Theory. J. Loss Prev. Process Ind. 2020, 64, 104062. [Google Scholar] [CrossRef]
- Di Bona, G.; Forcina, A.; Falcone, D.; Silvestri, L. Critical Risks Method (CRM): A New Safety Allocation Approach for a Critical Infrastructure. Sustainability 2020, 12, 4949. [Google Scholar] [CrossRef]
- Di Bona, G.; Silvestri, A.; Forcina, A.; Petrillo, A. Total Efficient Risk Priority Number (TERPN): A New Method for Risk Assessment. J. Risk Res. 2018, 21, 1384–1408. [Google Scholar] [CrossRef]
- Liu, H.-C.; Liu, L.; Liu, N. Risk Evaluation Approaches in Failure Mode and Effects Analysis: A Literature Review. Expert Syst. Appl. 2013, 40, 828–838. [Google Scholar] [CrossRef]
- Underwood, P.; Waterson, P. Systems Thinking, the Swiss Cheese Model and Accident Analysis: A Comparative Systemic Analysis of the Grayrigg Train Derailment Using the ATSB, AcciMap and STAMP Models. Accid. Anal. Prev. 2014, 68, 75–94. [Google Scholar] [CrossRef]
- Hulme, A.; Stanton, N.A.; Walker, G.H.; Waterson, P.; Salmon, P.M. What Do Applications of Systems Thinking Accident Analysis Methods Tell Us about Accident Causation? A Systematic Review of Applications between 1990 and 2018. Saf. Sci. 2019, 117, 164–183. [Google Scholar] [CrossRef]
- Patriarca, R.; Di Gravio, G.; Woltjer, R.; Costantino, F.; Praetorius, G.; Ferreira, P.; Hollnagel, E. Framing the FRAM: A Literature Review on the Functional Resonance Analysis Method. Saf. Sci. 2020, 129, 104827. [Google Scholar] [CrossRef]
- Qiao, W.; Li, X.; Liu, Q. Systemic Approaches to Incident Analysis in Coal Mines: Comparison of the STAMP, FRAM and “2–4” Models. Resour. Policy 2019, 63, 101453. [Google Scholar] [CrossRef]
- Celik, M.; Cebi, S. Analytical HFACS for Investigating Human Errors in Shipping Accidents. Accid. Anal. Prev. 2009, 41, 66–75. [Google Scholar] [CrossRef]
- Chen, S.; Khastgir, S.; Jennings, P. Analyzing National Responses to COVID-19 Pandemic Using STPA. Saf. Sci. 2021, 138, 105195. [Google Scholar] [CrossRef] [PubMed]
- Leveson, N. A New Accident Model for Engineering Safer Systems. Saf. Sci. 2004, 42, 237–270. [Google Scholar] [CrossRef]
- Shin, S.-M.; Lee, S.H.; Shin, S.K.; Jang, I.; Park, J. STPA-Based Hazard and Importance Analysis on NPP Safety I&C Systems Focusing on Human–System Interactions. Reliab. Eng. Syst. Saf. 2021, 213, 107698. [Google Scholar] [CrossRef]
- Bas, E. STPA Methodology in a Socio-Technical System of Monitoring and Tracking Diabetes Mellitus. Appl. Ergon. 2020, 89, 103190. [Google Scholar] [CrossRef] [PubMed]
- Li, M.; Yan, F.; Niu, R.; Xiang, N. Identification of Causal Scenarios and Application of Leading Indicators in the Interconnection Mode of Urban Rail Transit Based on STPA. J. Rail Transp. Plan. Manag. 2021, 17, 100238. [Google Scholar] [CrossRef]
- Chaal, M.; Bahootoroody, A.; Basnet, S.; Valdez Banda, O.A.; Goerlandt, F. Towards System-Theoretic Risk Assessment for Future Ships: A Framework for Selecting Risk Control Options. Ocean Eng. 2022, 259, 111797. [Google Scholar] [CrossRef]
- Abaei, M.M.; Hekkenberg, R.; BahooToroody, A. A Multinomial Process Tree for Reliability Assessment of Machinery in Autonomous Ships. Reliab. Eng. Syst. Saf. 2021, 210, 107484. [Google Scholar] [CrossRef]
- Leveson, N.; Couturier, M.; Thomas, J.; Dierks, M.; Wierz, D.; Psaty, B.M.; Finkelstein, S. Applying System Engineering to Pharmaceutical Safety. J. Healthc. Eng. 2012, 3, 391–414. [Google Scholar] [CrossRef]
- Dakwat, A.L.; Villani, E. System Safety Assessment Based on STPA and Model Checking. Saf. Sci. 2018, 109, 130–143. [Google Scholar] [CrossRef]
- Sterman, J. Business Dynamics: Systems Thinking and Modeling for a Complex World; McGraw-Hill: Boston, MA, USA, 2000. [Google Scholar]
- Mohammadi, A.; Tavakolan, M. Identifying Safety Archetypes of Construction Workers Using System Dynamics and Content Analysis. Saf. Sci. 2020, 129, 104831. [Google Scholar] [CrossRef]
- Amiri, A.; Mehrjerdi, Y.Z.; Jalalimanesh, A.; Sadegheih, A. Food System Sustainability Investigation Using System Dynamics Approach. J. Clean. Prod. 2020, 277, 124040. [Google Scholar] [CrossRef]
- Leveson, N.; Dulac, N.; Zipkin, D.; Cutcher-Gershenfeld, J.; Carroll, J.; Barrett, B. Engineering Resilience into Safety-Critical Systems. In Resilience Engineering; CRC Press: London, UK, 2006; ISBN 978-1-315-60568-5. [Google Scholar]
- Rong, H.; Tian, J. STAMP-Based HRA Considering Causality within a Sociotechnical System: A Case of Minuteman III Missile Accident. Hum. Factors 2015, 57, 375–396. [Google Scholar] [CrossRef] [PubMed]
- Couturier, M.; Matthieu, J. A Case Study of Vioxx Using STAMP. Master’s Thesis, Massachusetts Institute of Technology, Cambridge, MA, USA, 2010. [Google Scholar]
- Valipour, A.; Yahaya, N.; Md Noor, N.; Kildienė, S.; Sarvari, H.; Mardani, A. A Fuzzy Analytic Network Process Method for Risk Prioritization in Freeway PPP Projects: An Iranian Case Study. J. Civ. Eng. Manag. 2015, 21, 933–947. [Google Scholar] [CrossRef]
- Giannakis, M.; Dubey, R.; Vlachos, I.; Ju, Y. Supplier Sustainability Performance Evaluation Using the Analytic Network Process. J. Clean. Prod. 2020, 247, 119439. [Google Scholar] [CrossRef]
- Saaty, T.L. Fundamentals of the Analytic Network Process—Dependence and Feedback in Decision-Making with a Single Network. J. Syst. Sci. Syst. Eng. 2004, 13, 129–157. [Google Scholar] [CrossRef]
- Chen, L.; Jiao, J.; Zhao, T. A Novel Hazard Analysis and Risk Assessment Approach for Road Vehicle Functional Safety through Integrating STPA with FMEA. Appl. Sci. 2020, 10, 7400. [Google Scholar] [CrossRef]
- Adams, W.; Saaty, R. Super Decisions Software Guide. Super Decis. 2003, 9, 43. [Google Scholar]
- Asadabadi, M.R.; Chang, E.; Saberi, M. Are MCDM Methods Useful? A Critical Review of Analytic Hierarchy Process (AHP) and Analytic Network Process (ANP). Cogent Eng. 2019, 6, 1623153. [Google Scholar] [CrossRef]
- Herrera, H.; Schütz, L.; Paas, W.; Reidsma, P.; Kopainsky, B. Understanding Resilience of Farming Systems: Insights from System Dynamics Modelling for an Arable Farming System in the Netherlands. Ecol. Model. 2022, 464, 109848. [Google Scholar] [CrossRef]
- Ding, Y.; Chen, S.; Zheng, Y.; Chai, S.; Nie, R. Resilience Assessment of China’s Natural Gas System under Supply Shortages: A System Dynamics Approach. Energy 2022, 247, 123518. [Google Scholar] [CrossRef]
- Li, Y.; Su, H.; Ji, H.; Cheng, W. Numerical Simulation to Determine the Gas Explosion Risk in Longwall Goaf Areas: A Case Study of Xutuan Colliery. Int. J. Min. Sci. Technol. 2020, 30, 875–882. [Google Scholar] [CrossRef]
- Rejzek, M.; Hilbes, C. Use of STPA as a Diverse Analysis Method for Optimization and Design Verification of Digital Instrumentation and Control Systems in Nuclear Power Plants. Nucl. Eng. Des. 2018, 331, 125–135. [Google Scholar] [CrossRef]
- Qiao, W. Analysis and Measurement of Multifactor Risk in Underground Coal Mine Accidents Based on Coupling Theory. Reliab. Eng. Syst. Saf. 2021, 208, 107433. [Google Scholar] [CrossRef]
- Cheng, L.; Guo, H.; Lin, H. Evolutionary Model of Coal Mine Safety System Based on Multi-Agent Modeling. Process Saf. Environ. Prot. 2021, 147, 1193–1200. [Google Scholar] [CrossRef]
- Qiao, W.; Chen, X.; Xia, W. STAMP-Based Causal Analysis of the Coal Mine Major Accident: From the Perspective of Safety Process. Energy Rep. 2021, 7, 116–124. [Google Scholar] [CrossRef]
- Investigation Reports on Two Particularly Significant Coal Mine Gas Explosion Accidents Released. Available online: http://www.mempe.org.cn/news/show-26507.html (accessed on 12 May 2022).
- Lian-jun, C. The Law of Safety in Production and Security Production Management of the Coal Enterprise. China Min. Mag. 2009, 5, 35–37. [Google Scholar]
- Yu, K.; Cao, Q.; Xie, C.; Qu, N.; Zhou, L. Analysis of Intervention Strategies for Coal Miners’ Unsafe Behaviors Based on Analytic Network Process and System Dynamics. Saf. Sci. 2019, 118, 145–157. [Google Scholar] [CrossRef]
- Wang, L.; Cao, Q.; Zhou, L. Research on the Influencing Factors in Coal Mine Production Safety Based on the Combination of DEMATEL and ISM. Saf. Sci. 2018, 103, 51–61. [Google Scholar] [CrossRef]
- Shi, X.; Xi, T. Race to Safety: Political Competition, Neighborhood Effects, and Coal Mine Deaths in China. J. Dev. Econ. 2018, 131, 79–95. [Google Scholar] [CrossRef]
- Tong, L.; Dou, Y. Simulation Study of Coal Mine Safety Investment Based on System Dynamics. Int. J. Min. Sci. Technol. 2014, 24, 201–205. [Google Scholar] [CrossRef]
- You, M.; Li, S.; Li, D.; Cao, Q.; Xu, F. Evolutionary Game Analysis of Coal-Mine Enterprise Internal Safety Inspection System in China Based on System Dynamics. Resour. Policy 2020, 67, 101673. [Google Scholar] [CrossRef]
- Yu, K.; Zhou, L.; Hu, C.; Wang, L.; Jin, W. Analysis of Influencing Factors of Occupational Safety and Health in Coal Chemical Enterprises Based on the Analytic Network Process and System Dynamics. Processes 2019, 7, 53. [Google Scholar] [CrossRef] [Green Version]

| Scale | Definition | Explanation |
|---|---|---|
| 1 | Element 1 is as vital as element 2. | Both elements have an equal impact on the criterion. |
| 3 | Element 1 is somewhat more valuable than element 2. | Element 1 has a somewhat larger impact on the criterion than element 2. |
| 5 | Element 1 is significantly more important than element 2. | The degree of influence of both on the criterion, element 1 is significantly greater than element 2. |
| 7 | Element 1 is intensively more important than element 2. | The degree of influence of both on the criterion, element 1 is intensively greater than element 2. |
| 9 | Element 1 is exceedingly more important than element 2. | The degree of influence of both on the criterion, element 1 is exceedingly greater than element 2. |
| 2, 4, 6, 8 | The middle of two adjacent scales. | Adopt when you need a compromise. |
| Reciprocal Value | If element 1 compares to element 2, use one of the values listed above; if element 2 compares to element 1, use the reciprocal value of the numbers listed above. | |
| Loss ID | Desciption |
|---|---|
| L-1 | Loss of human life and human injury. |
| L-2 | The coal mining mission failed. |
| Hazard ID | Description |
|---|---|
| H-1 | Insufficient ventilation in working environment. [L-1, L-2] |
| H-2 | Oxygen concentration in the workplace is too low. [L-1] |
| H-3 | The concentration of methane in the system is too high (over 5.0% [34]). [L-1, L-2] |
| H-4 | The power system does not provide sufficient and stable power. [L-2] |
| H-5 | Welding sparks in the working environment during the welding process. [L-1, L-2] |
| H-6 | Gas sensors do not detect the correct gas concentration. [L-1, L-2] |
| Control Action | Not Providing Causes Hazard | Providing Causes Hazard | Too Early/Late or Incorrect Order | Applied too Long or Stopped too Soon |
|---|---|---|---|---|
| Electromechanical center provides abnormal events and accident information to the safety control. | UCA-1: The electromechanical center does not offer safety management with aberrant information in the event of abnormal occurrences or accidents. | UCA-2: When there are no abnormal events or workplace accidents, the electromechanical center provides safety management with information regarding abnormal events. | UCA-3: When anomalous occurrences or accidents occur in the workplace, electromechanical centers supply information too late. | N/A |
| The ventilation center provided orders to the miners to continue or stop work. | UCA-4: When ventilation is turned off, miners do not evacuate the workplace. | N/A | UCA-6: When the oxygen level in the workplace falls below 18%, miners wear personal protective equipment (PPE) too late. | N/A |
| UCA-5: When methane levels exceed 5%, miners do not abandon their workplace. | ||||
| The sensor sends the electromechanical center with gas concentration data. | UCA-7: The sensor does not detect the behaviors of methane levels prior to construction blasting. | UCA-8: If the gas concentration exceeds the limit, the sensor reports an incorrect gas concentration. | N/A | UCA-9: The sensor fails to detect methane levels too early prior to construction blasting. |
| The ventilation center provides stop work orders to welders and blasters. | UCA-10: When the gas concentration is too high, the ventilation center does not send stop-work orders to the welders and blasters. | UCA-11: When the gas concentration is too high, the ventilation center instructs the welders and blasters to continue working. | UCA-12: When the gas concentration in the workplace returns to normal, it is too late for the ventilation center to provide an order to continue work. | N/A |
| Gas emission Order. | UCA-13: After electricity is restored, the ventilation center does not send gas emission orders. | UCA-14: The ventilation center provides excessive gas emission orders when gas concentration is normal. | UCA-15: The gas center sends gas emission orders too late following the restoration of power. | UCA-16: When the gas concentration is still above the standard concentration, the gas station stops sending pumping orders. |
| UCA-17: When the gas concentration is excessive, the ventilation center does not issue gas emission orders. | UCA-18: Insufficient gas extraction by the ventilation center (resulting in failure to reduce the gas concentration below the standard). | UCA-19: Before sending gas extraction orders, the gas center fails to confirm gas concentration. |
| UCA List | Description | Causal Factors |
|---|---|---|
| UCA-1 | The electromechanical center does not offer safety management with aberrant information in the event of abnormal occurrences or accidents. | Safety perception Department response speed |
| UCA-2 | When there are no abnormal events or workplace accidents, the electromechanical center provides safety management with information regarding abnormal events. | Fatigue Level Operation Skill |
| UCA-3 | When anomalous occurrences or accidents occur in the workplace, electromechanical centers supply information too late. | Department response speed |
| UCA-4 | When ventilation is turned off, miners do not evacuate the workplace. | Safety perception Complacency Safety rules regulation Safety atmosphere |
| UCA-5 | When methane levels exceed 5%, miners do not abandon their workplace. | Complacency Equipment failure Safety atmosphere |
| UCA-6 | When the oxygen level in the workplace falls below 18%, miners wear personal protective equipment (PPE) too late. | Safety protective Safety perception |
| UCA ID | Components in the Control Structure | Loss Scenarios | Causal Relationship |
|---|---|---|---|
| UCA-1 | Unsafe controller actions | Out-of-bounds production due to unreasonable production planning by the deputy mine manager of electrical and mechanical, resulting in the inability to provide information to the safety control center after an abnormal event or accident, which may result in high methane concentrations in the workplace. | Mining Areas→department response speed→safety management level→system safety level |
| Inadequate feedback and information | The failure of the power supply system due to the low level of operation, low level of safety awareness or excessive fatigue of employees who adjust the technical parameters of electrical equipment and actuators without authorization, combined with the failure of the supervisory department to detect them in time, may result in the inability of the workplace to maintain a stable power supply. | Safety perception→operation→individual safety level→system safety level | |
| Control path | Because of the lack of safety awareness of the staff, when the switch trips, the fault point is not detected and the power supply is restored before the fault point is removed. As a result, there may be insufficient ventilation in the workplace, employee strain, and methane levels in the environment that exceed the norm. | Safety perception level→physical environment→equipment failure→equipment level→fatigue level | |
| Controlled process | During the power supply process, the mechanical and electrical center did not implement the power shutdown and delivery system in accordance with regulations, and there was no safety confirmation prior to power delivery, which may resulted in inadequate ventilation in the workplace. | Safety supervision→safety rules regulations→safety management level→system safety level |
| Control Layer | Weights of Control Layer | Network Layer | Coupling Relationship | Global Weights | Sequence |
|---|---|---|---|---|---|
| Individual Safety | 0.290 | Operation S1 | M6, S3, S2 | 0.065 | 7 |
| Complacency S2 | D2, M5, S4, S1, E2, E3, M4 | 0.029 | 13 | ||
| Fatigue Level S3 | S1, S2, M4 | 0.021 | 14 | ||
| Safety percpection S4 | M5, S2, E2, M4 | 0.037 | 12 | ||
| Skill S5 | S1, S2 | 0.065 | 6 | ||
| Equipment Safety | 0.152 | Safety protective E1 | E3 | 0.021 | 15 |
| Equipment maintenance E2 | M5, D1, M4 | 0.157 | 1 | ||
| Equipment failure E3 | M1, D1, E2 | 0.078 | 5 | ||
| Environment Safety | 0.117 | Physical environment D1 | S1, S3, E3 | 0.145 | 2 |
| Mining areas D2 | E1, E3, S3, D1 | 0.003 | 16 | ||
| Management Safety | 0.441 | Safety investment M1 | M5, D1, E3, M4 | 0.046 | 10 |
| Safety rules regulation M2 | D2, M5, S3, E1, E2, M4 | 0.054 | 9 | ||
| Safety supervision M3 | D2, M5, S4, E1, D1 | 0.063 | 8 | ||
| Department response speed M4 | D1, E2 | 0.096 | 3 | ||
| Safety atmosphere M5 | S4, E1, D1, M4 | 0.080 | 4 | ||
| Safety education training M6 | M5, S4, E1, S1 | 0.040 | 11 |
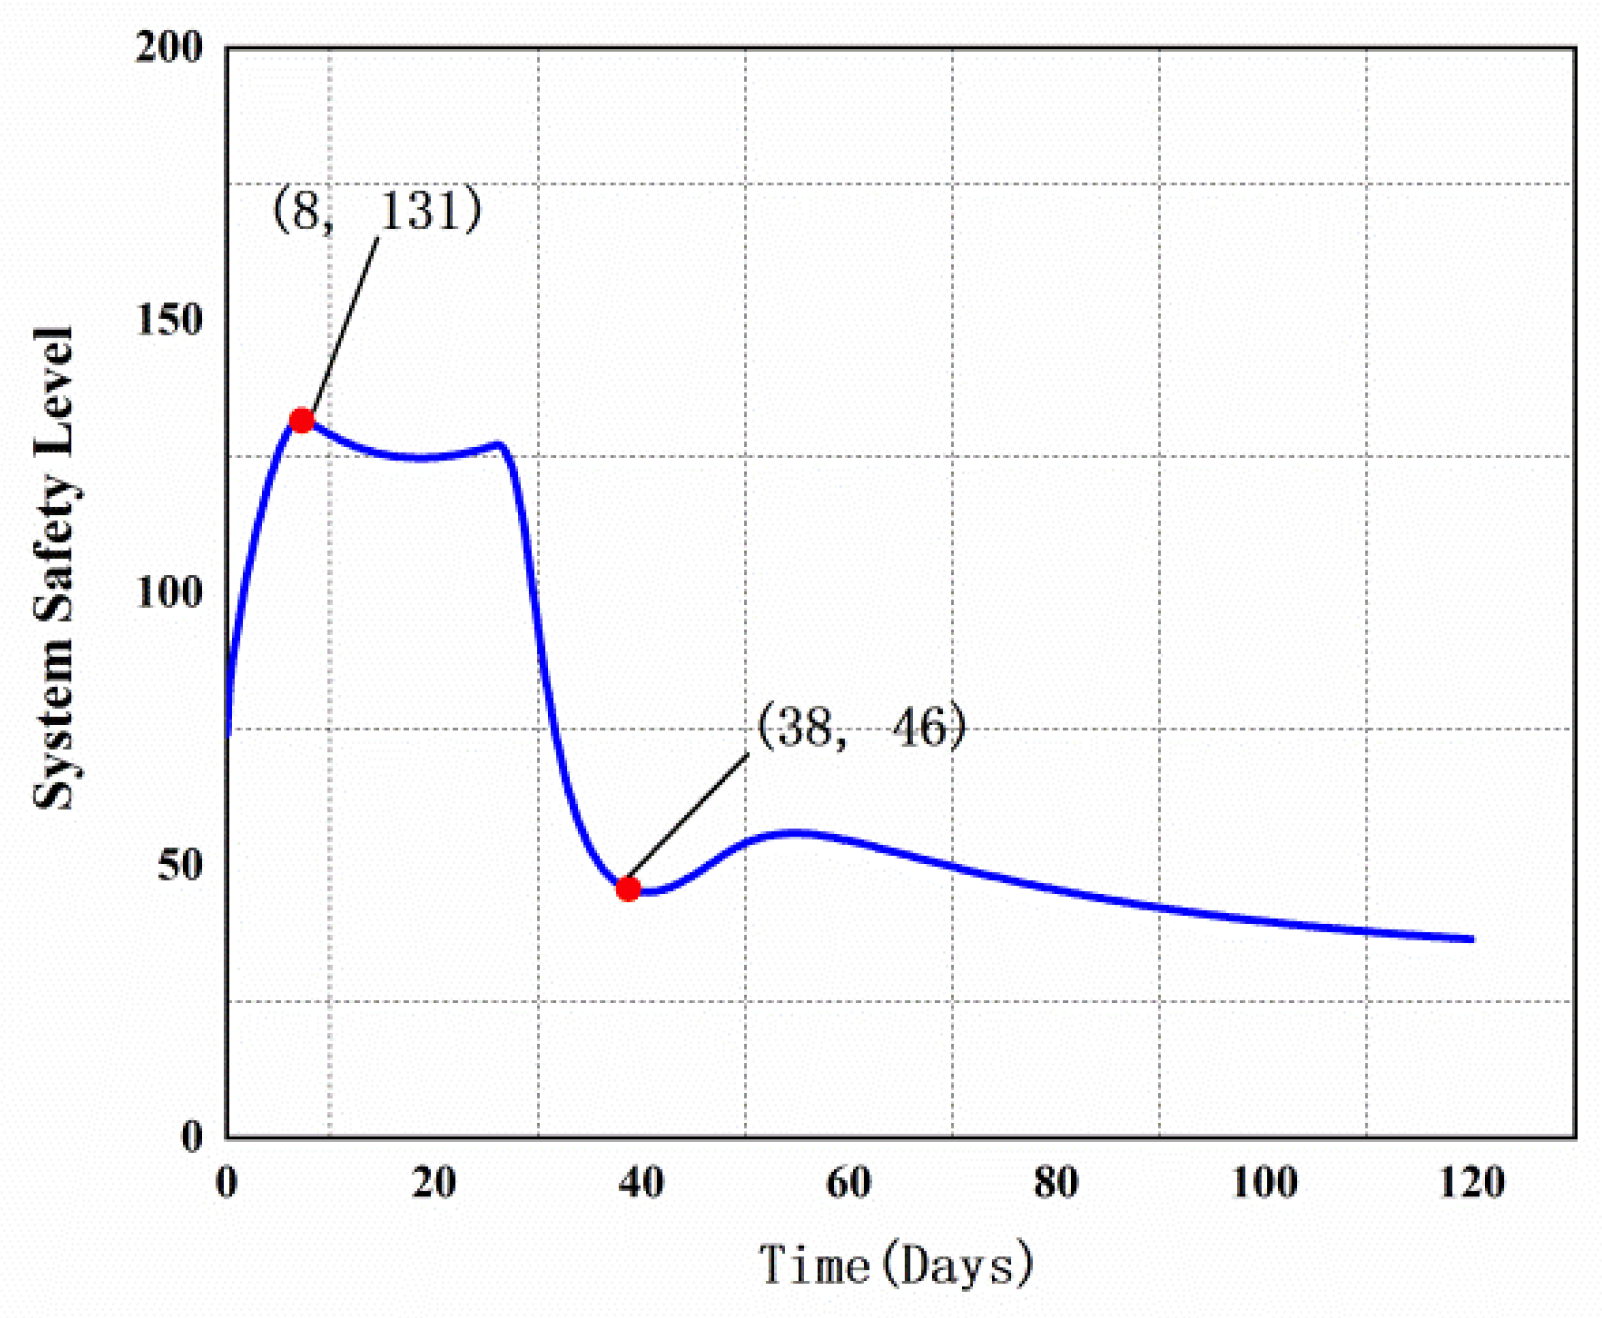
| Time (Days) | System Safety Level | Time (Days) | System Safety Level | Time (Days) | System Safety Level |
|---|---|---|---|---|---|
| 1 | 93 | 22 | 125 | 43 | 46 |
| 2 | 104 | 23 | 126 | 44 | 47 |
| 3 | 112 | 24 | 126 | 45 | 48 |
| 4 | 120 | 25 | 127 | 46 | 49 |
| 5 | 126 | 26 | 127 | 47 | 51 |
| 6 | 130 | 27 | 125 | 48 | 52 |
| 7 | 132 | 28 | 119 | 49 | 53 |
| 8 | 131 | 29 | 108 | 50 | 54 |
| 9 | 130 | 30 | 94 | 51 | 55 |
| 10 | 129 | 31 | 82 | 52 | 55 |
| 11 | 128 | 32 | 71 | 53 | 56 |
| 12 | 127 | 33 | 64 | 54 | 56 |
| 13 | 127 | 34 | 58 | 55 | 56 |
| 14 | 126 | 35 | 53 | 56 | 56 |
| 15 | 125 | 36 | 50 | 57 | 56 |
| 16 | 125 | 37 | 48 | 58 | 55 |
| 17 | 125 | 38 | 46 | 59 | 55 |
| 18 | 125 | 39 | 46 | 60 | 55 |
| 19 | 125 | 40 | 45 | 61 | 54 |
| 1 | 93 | 22 | 125 | 43 | 46 |
Publisher’s Note: MDPI stays neutral with regard to jurisdictional claims in published maps and institutional affiliations. |
© 2022 by the authors. Licensee MDPI, Basel, Switzerland. This article is an open access article distributed under the terms and conditions of the Creative Commons Attribution (CC BY) license (https://creativecommons.org/licenses/by/4.0/).
Share and Cite
Jiao, J.; Jing, Y.; Pang, S. An Integrated Quantitative Safety Assessment Framework Based on the STPA and System Dynamics. Systems 2022, 10, 137. https://doi.org/10.3390/systems10050137
Jiao J, Jing Y, Pang S. An Integrated Quantitative Safety Assessment Framework Based on the STPA and System Dynamics. Systems. 2022; 10(5):137. https://doi.org/10.3390/systems10050137
Chicago/Turabian StyleJiao, Jian, Yongfeng Jing, and Shujie Pang. 2022. "An Integrated Quantitative Safety Assessment Framework Based on the STPA and System Dynamics" Systems 10, no. 5: 137. https://doi.org/10.3390/systems10050137
APA StyleJiao, J., Jing, Y., & Pang, S. (2022). An Integrated Quantitative Safety Assessment Framework Based on the STPA and System Dynamics. Systems, 10(5), 137. https://doi.org/10.3390/systems10050137