1. Introduction
Venture capital (VC) is an important driving force for the development of high-tech industry, new economy, and scientific and technological innovation. Existing studies generally believe that VC is conducive to accelerating the process of enterprise commercialization and improving the management performance of entrepreneurial enterprises [
1,
2,
3]. Different from traditional investment, high risk and high return are the distinctive features of VC. As the first country to develop the VC industry, America has gradually formed a relatively complete VC mechanism suitable for its own. Other countries in the world have also introduced and developed VC mechanisms to promote their economic structure upgrading and technological innovation [
4]. However, due to different economic systems and institutional environments, the practice operation of VC mechanisms exhibits significant differences in motivation tendency, behavioral characteristics, and investment performance. In addition, due to the uncertainty of the VC project itself and the information asymmetry between investors and financiers, there is also uncertainty in the investment results of VC institutions.
In recent years, with the introduction of relevant preferential tax policies in China, capital sources such as direct investment by securities firms and government-guided funds have been expanded, which has greatly promoted the development of China’s VC industry. However, it also faces the same problem that the effect theory and practical experience of VC based on the mature market conditions in the West are not fully applicable to the operational practice of the Chinese VC mechanism. To promote the stable and healthy development of the VC market, revealing the action mechanism between the characteristics of VC funds and investment performance is one of the focal issues of scholarly research. The development of a VC mechanism suitable for China’s VC industry is conducive to the flourishing of China’s VC and entrepreneurial industries, which in turn will lead to rapid capital appreciation.
Due to the uncertainty of the entrepreneurial project itself and the information asymmetry between the investment and financing sides, there is also uncertainty about the investment results of VC institutions. In terms of equity investment, Polzin et al. [
5] found that entrepreneurs believe that investors rely more on financial and other hard criteria to evaluate the commercial viability of VC rather than investors’ unique perception, which may mislead entrepreneurs’ propensity to perform and send the wrong signals. With the gradual maturity and transparency of the VC market, Bengtsson and Hsu [
6] suggest that it is helpful for the VC market to achieve healthy and stable development if investors and financiers understand each other’s motives, status, concerns, evaluation criteria, and priorities. Therefore, based on the principle of optimal matching, an empirical analysis is conducted on the impact of the matching characteristics of VC institutions and venture enterprises on business performance to reveal the endogenous influencing factors of VC market operation matching on business performance, which has important practical significance for the development of the VC industry.
Previous studies have mainly studied the impact mechanism of various factors on the performance of VC funds by methods of linear regression, and investment performance is predicted based on the regression model and characteristic information provided. However, the regression prediction results of these linear models are not very suitable. Recently, machine learning (ML) techniques have been mostly used for information feature extraction and data mining of internal connections to achieve more accurate predictions for the target value. Moreover, ML techniques have also been effectively applied in the field of economics. For example, Morano et al. analyzed the impact of noise pollution on housing prices using genetic algorithms [
7]. In addition, Arroyo et al. applied ML data-driven methods to the VC industry to make up for the limitations of existing tools, and their research results demonstrated that ML techniques can effectively assess the investment risk of venture investors in the investment process and provide assistance in investment decisions [
8]. Therefore, the purpose of this paper is to comprehensively use linear regression methods and ML algorithms to investigate the influence of VC characteristics on investment performance based on matching influencing factors and determine the weight of each characteristic, establish the risk investment fund performance prediction model for investors, and fund investment management providing certain guidance advice.
2. Research Questions
This paper started from the factors affecting the performance of VC funds to establish a more comprehensive performance prediction model. However, due to the privacy of the investment data of VC institutions, empirical studies on VC performance in the existing Chinese literature are not sufficient, and the numbers of explanatory variables and sample size are generally insufficient in these studies. Therefore, to establish an effective model for predicting the investment performance of VC funds, a systematic and comprehensive analysis of its influencing factors is needed first.
After sorting and summarizing the published literature, it can be found that, from the perspective of venture enterprises, the evaluation factors of VC funds can be divided into three categories: project characteristics, investment scheme, and institutional characteristics, among which the project characteristics can be subdivided into investment scale, stage, region, and industry. Investment program mainly refers to the exit type. Institutional characteristics refer to the type of institution, type of fund, investment experience, capital nature, number of funds under management, exit number, and number of limited partners (LP). Regarding the factors influencing the performance of VC, the following hypotheses are presented.
VC market has the characteristics of non-openness and non-transaction. The larger the investment scale is, the more difficult it is to recover the funds, and the greater the resulting risk, thus resulting in lower returns. Currently, after an empirical analysis of 146 Growth Enterprise Market (GEM) listed companies supported by private equity funds, Li Zhou and Jing Mei et al. [
9] found that the return on investment was negatively correlated with the investment amount, i.e., the larger the investment scale, the lower the return obtained after the investment was completed. However, the researches of Rajarishi, Stephen, Kathleen, Christian, and Fan [
10,
11,
12] have shown that VC fund projects can attract more investment institutions or amount of investment, which on the one hand reflects the suitable quality of projects and on the other hand exhibits that the more investors involved in the project are likely to be able to provide the project with the more value-added services and investment experience, which is more beneficial to the smooth operation of the project and the successful exit at a later stage. The above literature shows that there is no unified conclusion on the impact of investment scale on investment performance. Additionally, to reduce risk and increase investment performance, VC institutions usually establish multiple funds, that is, the number of managed funds. Based on this, the following hypotheses were made with respect to both investment size and the number of funds under management of VC funds.
Hypothesis 1. Investment size has a significant impact on VC fund performance, and the larger the investment size, the lower the performance that can be reaped.
Hypothesis 2. The number of funds under management has a significant effect on the performance of VC funds, and the higher the number of funds under management, the higher the performance of VC funds.
M Wright and Palomino et al. [
13,
14] studied the stage of the project at the time of VC fund investment, and their findings indicated that the more advanced the stage of the project at the time of investment, the higher the investment risk and the lower the investment performance. Similarly, Ni and Sun [
15] investigated the factors influencing the performance of China’s VC funds exiting VC projects between 1997 and 2005 and also found a significant positive correlation between investment performance and investment stage, i.e., the more advanced the stage of investment, the higher the performance that can be obtained. Therefore, the following hypothesis was made for the stage of investment.
Hypothesis 3. Investment stage has a significant effect on the performance of VC funds, and the more advanced the investment stage, the higher the performance that can be obtained.
In general, the area where VC funds are active usually has more developed economies than other areas. According to the findings of Ni et al. [
15], the investment performance of areas with active investment represented by Beijing, Shanghai, Guangzhou, and Shenzhen, China, is significantly higher than in other regions. Similarly, Qian and Zhang [
16] also obtained a similar conclusion when studying the relationship between investment regions and investment performance. Therefore, the following hypothesis is proposed for the investment region:
Hypothesis 4. There is a significant effect of investment area on the investment performance of VC funds, and the investment performance is higher where the investment area is more active.
Ami and Cumming et al. [
17,
18] found that the investment performance of VC funds investing in high-tech enterprises and high-value-added industries is higher compared to traditional industries. However, Chinese scholars such as Ni et al. found that if the risk of the above high-risk projects is controlled, the performance of high-tech enterprises or high-value-added industries is not more advantageous than that of traditional industries. Regarding the published data, the investment projects of China’s VC funds are highly concentrated in high-tech and high-value-added industries such as the Internet, IT, biotechnology/medical health, machinery manufacturing, telecommunications and value-added services, and finance. Based on this, the following hypothesis is presented for the investment industry:
Hypothesis 5. The investment industry has a significant impact on the performance of VC funds, and the performance is higher in high technology and high value-added industries.
Numerous studies have shown that the choice of exit type of a VC fund at the completion of a project has a significant impact on the final investment performance obtained. Stephen and Kathleen et al. [
11,
19] found that the investment performance of exit in IPO was significantly higher than that of exit in other ways. Therefore, some scholars often believe [
20] that whether to exit in the form of an IPO can be used as a substitute variable to measure the investment performance of VC funds. Based on this, the following hypothesis is made for the exit mode of VC funds:
Hypothesis 6. The exit type has a significant effect on the performance of VC funds, where the performance of funds exiting by IPO is higher than other methods.
Di and Kun et al. [
21], in their study on the investment performance of VC funds, found that the nature of capital affects investment performance, i.e., non-local VC funds have higher investment performance than local ones. This may be because local investment funds have a shorter development life and do not have advantages in investment experience and value-added services for the investee. However, in the results of Fan’s studies, VC institutions in China do not provide value-added services for the invested projects. Moreover, after the research, we found that there was no such information in the published data, so this paper focused on the influence of investment experience on investment performance. In addition to investment experience, the number of projects completed and successfully exited is also one of the important reference indicators for VC funds. The higher the number of projects that a VC institution can successfully exit, the more times it will obtain benefits, which means that it may obtain higher performance. Meanwhile, the more LP of VC institutions, the more investment experience and value-added services that can provide for investment projects, which can provide a certain guarantee for higher project performance. Therefore, the following hypotheses were presented for investment experience, the number of exits, and the number of LPs.
Hypothesis 7. Investment experience has a significant impact on the performance of VC funds, i.e., the more investment experience, the higher the investment performance.
Hypothesis 8. The exit number has a significant impact on the performance of VC funds, i.e., the higher the exit number from VC funds’ investment projects, the higher the investment performance brought about.
Hypothesis 9. The number of LPs has a significant effect on VC fund performance, i.e., VC institutions with a high number of LPs are likely to achieve higher performance when investing in projects than VC institutions with a single LP.
In addition to the above variables, there are also other variables such as institution type, fund type, and capital nature that have an effect on investment performance.
For the institutional type variable, to unify the research object, this paper focused on the impact of VC on institutional performance. In the published VC data, there are two main forms of missing data related to different fund types, one is incomplete fund type types, and the other is that some fund types have less than five sets of data, which will lead to the results of the analysis are not universal. Therefore, the control fund type is the VC fund. As for the capital nature, the data of foreign capital investment institutions are not easy to obtain, and the number is small. Moreover, the research object of this paper is the performance of Chinese VC funds, so local funds are selected for their capital nature. The performance of VC funds studied in this paper is not considered in terms of fund performance continuity but based on a large amount of data on VC fund investment projects so as to discover the influencing factors of VC fund performance and then to model using different methods, in the hope of VC fund investment projects for the future performance of acute prediction.
Meanwhile, the model for solving the problem was also studied in this paper. The traditional model usually uses the linear regression model, which needs to satisfy several classical hypotheses, and there is not necessarily a linear relationship between the above-mentioned influencing factors and the performance of VC funds. Therefore, there are limitations in using a linear regression model to study the performance of VC funds. Combined with the development of ML technology in recent years, which has great advantages in outcome prediction, this paper applied ML methods to the prediction model of VC fund performance. Based on the analysis of influencing factors, this paper used ML techniques to establish a variety of VC fund performance prediction models and then compare the prediction effects and explanatory power of different models to come up with the optimal regression prediction model, and on this basis for further research. The regression models selected in this paper are multiple linear (MuL) regression model, random forest (RF) regression model, RF model optimized by particle swarm algorithm (PSO-RF), extreme learning machine (ELM) regression model, and ELM regression model optimized by particle swarm algorithm (PSO-ELM).
3. Research Design
3.1. Data Processing and Variable Definition
The data sources of this paper were 6573 sets of exit event data, 3917 sets of investment institution data, and 9684 sets of VC fund data of Chinese VC funds from 2008 to 2020 in the Zero2IPO database. After excluding the funds with missing data from the above variables, the data with the same name of investment funds were integrated together to obtain 130 sets of data available for empirical evidence. In addition to the above explanatory and control variables, this paper expressed the performance of VC funds by combining internal rate of return (
IRR) and multiple of return on investment (
MROI) and obtained the weight of the two by the CRITIC weighting method [
22], which was calculated by the following formula.
where
denotes the correlation coefficient between the
i-th indicator and the
j-th indicator,
represents the mean value of (column) data for each indicator.
After the data processing was completed, the dependent, explanatory, and control variables were extracted, and all the variables involved in this paper are shown in
Table 1.
- (1)
Dependent variable
To ensure the robustness of the prediction results, this paper selected two indicators as dependent variables:
IRR and
MROI. The
IRR was calculated by taking into account the time value of capital at the time of investment and thus can fully reflect the capital return of VC institutions, which has become a commonly accepted indicator of investment performance of VC institutions. The formula for calculating
IRR was as follows.
where
T is the number of investment periods, and
CFt is the amount of cash flow in period
t. Although
IRR provided a feasible method for the performance evaluation of VC institutions, it could be known from the solution formula that when the number of investment periods is uncertain,
IRR cannot directly reflect the level of investment performance of VC institutions, and the
MROI can well avoid this problem.
MROI, which is defined as the ratio between the total expected value and the paid-in capital, is a simple indicator to measure the investment performance of VC institutions, and its calculation formula is as follows.
where
is the distributed returns received by the investor,
is the surplus value, and
is the invested capital.
- (2)
Explanatory variables
In the selection of explanatory variables, several explanatory variables from three aspects such as project characteristics, investment program, and institutional characteristics were selected in this paper, including investment scale, the number of funds under management, investment stage, investment area, investment industry, exit type, investment experience, exit number, and the number of limited partners. The investment scale was expressed by the raised scale (RMB/million yuan) of VC funds. Investment experience was represented by the number of historical investments in VC funds. For some data with text type, to enable it to be applicable to the ML prediction model, text data need to be quantified numerically, and the following processing was performed for this part of the data.
The investment stages are divided into venture period, growth period, and maturity period, which were replaced by 0.25, 0.50, and 0.75, respectively. Investment areas were mainly provinces or municipalities directly under the central government, which were classified into four categories based on their GDP in the past 5 years and numbered with 1~4. Investment industries were divided into 15 categories, including IT, semiconductor and electronic equipment, telecom and value-added business, Internet, chemical materials and processing, machinery manufacturing, automotive, clean technology, biotechnology, entertainment and media, and others, which were numbered from 1 to 11. The exit types were mainly initial public offerings (IPO), mergers and acquisitions (M&A), dividends, equity transfer, buyback, backdoor, etc., which were numbered from 11 to 16, respectively.
- (3)
Control variables
As for the two influencing factors of VC institution type and fund type, due to insufficient data, this paper set the institution type as VC. The fund type was chosen as the VC fund. For the background of VC funds, this paper focused on Chinese VC funds, so VC funds with non-local capital backgrounds were excluded.
3.2. Model Specification
The solution models used in this paper were the multiple linear regression model and ML prediction model. The linear regression model was used to study the effect of numerical variables on the performance of VC funds. The ML prediction model was used to predict the performance of future VC fund investment projects. For the variables with text type, a one-way analysis of variance (ANOVA) was used to investigate the relationship between them and the performance of VC funds.
3.2.1. Influence Factor Analysis Model
- (1)
Multiple linear regression model
The multiple linear regression model was mainly used to analyze the effects of five variables, including investment size, number of funds under management, investment experience, exit number, and number of limited partners, on the performance of VC funds. The specific model was presented as follows.
where
is the error. To verify the robustness of the model, the adjusted
was used instead of y to establish the multiple linear regression model again for the whole sample data. If the two results were consistent, the model could be proved to be robust. Among them, the adjustment method used was the classical Newey–West method. The stability test model was as follows.
- (2)
One-way ANOVA
ANOVA can also be known as the “
F-test”, which is mainly used to test the significance of mean differences between multiple samples (two or more). The basic idea is to determine the significance of the influence of controllable factors (inter-group differences) on the results by analyzing the contribution of controllable factors and random factors to the total variation, i.e., to analyze the contribution of between-group differences and within-group differences, thus determining the significance of the effect of the controllable factors (between-group differences) on the results. One-way ANOVA, in this case, was to study the significance of the effect of different levels of a factor on the outcome, i.e., to compare the means of the dependent variables of the categorical factors at two or more levels. The key to this was the construction of the
F-statistic, which was calculated as follows.
where
MSA was the between-group mean square with
k-1 degrees of freedom, and MSE was the mean square within groups with
n-k degrees of freedom.
3.2.2. ML Prediction Models
To solve the nonlinear problem of influencing factors, the RF ridge regression model, the PSO-RF model, the ELM model, and the PSO-ELM model were proposed in this paper. The RF algorithm is a combinatorial algorithm based on the CART decision tree algorithm proposed by Breiman in 2001 [
23]. The basic principle is to generate a forest containing multiple mutually independent CART decision trees by a random method, and the final regression prediction result of the algorithm is generated by voting on all decision trees. Two important parameters are randomized in the RF algorithm, which will affect the accuracy of the constructed model, so it is necessary to optimize these two parameters to realize the optimization of the model performance. In this paper, the ant colony algorithm was used to optimize these two parameters. The optimization content was mainly divided into the following two parts: one was to optimize the number of feature variables at the tree nodes that reflected the situation of a single decision tree; the other was to optimize the number of trees that reflect the overall size of the RF [
24]. The model established based on the RF algorithm can not only obtain the prediction results but also output the importance ranking of variables, to intuitively compare the importance degree of each variable in the model. The index to measure this degree is Mean Decrease Accuracy, whose basic idea is to add interference noise to all the features of the sample and evaluate the importance of the features by the change of the accuracy of the model. The larger the value indicates, the higher the importance of the features [
25].
In recent years, neural network algorithms in ML have been widely used in various industries [
26]. The prototype of a neural network is the perceptron. A single perceptron has a strong ability to solve linear problems. The neural network is a model integrating multiple perceptrons. Its principle is similar to the network that transmits information between neurons in an organism. The advantage is that the output layer can be single-layer or multi-layer [
27]. Therefore, it has strong applicability for regression and classification problems. Commonly used neural networks include back propagation (BP) neural network, ELM, etc. Among them, ELM has more advantages in small sample processing [
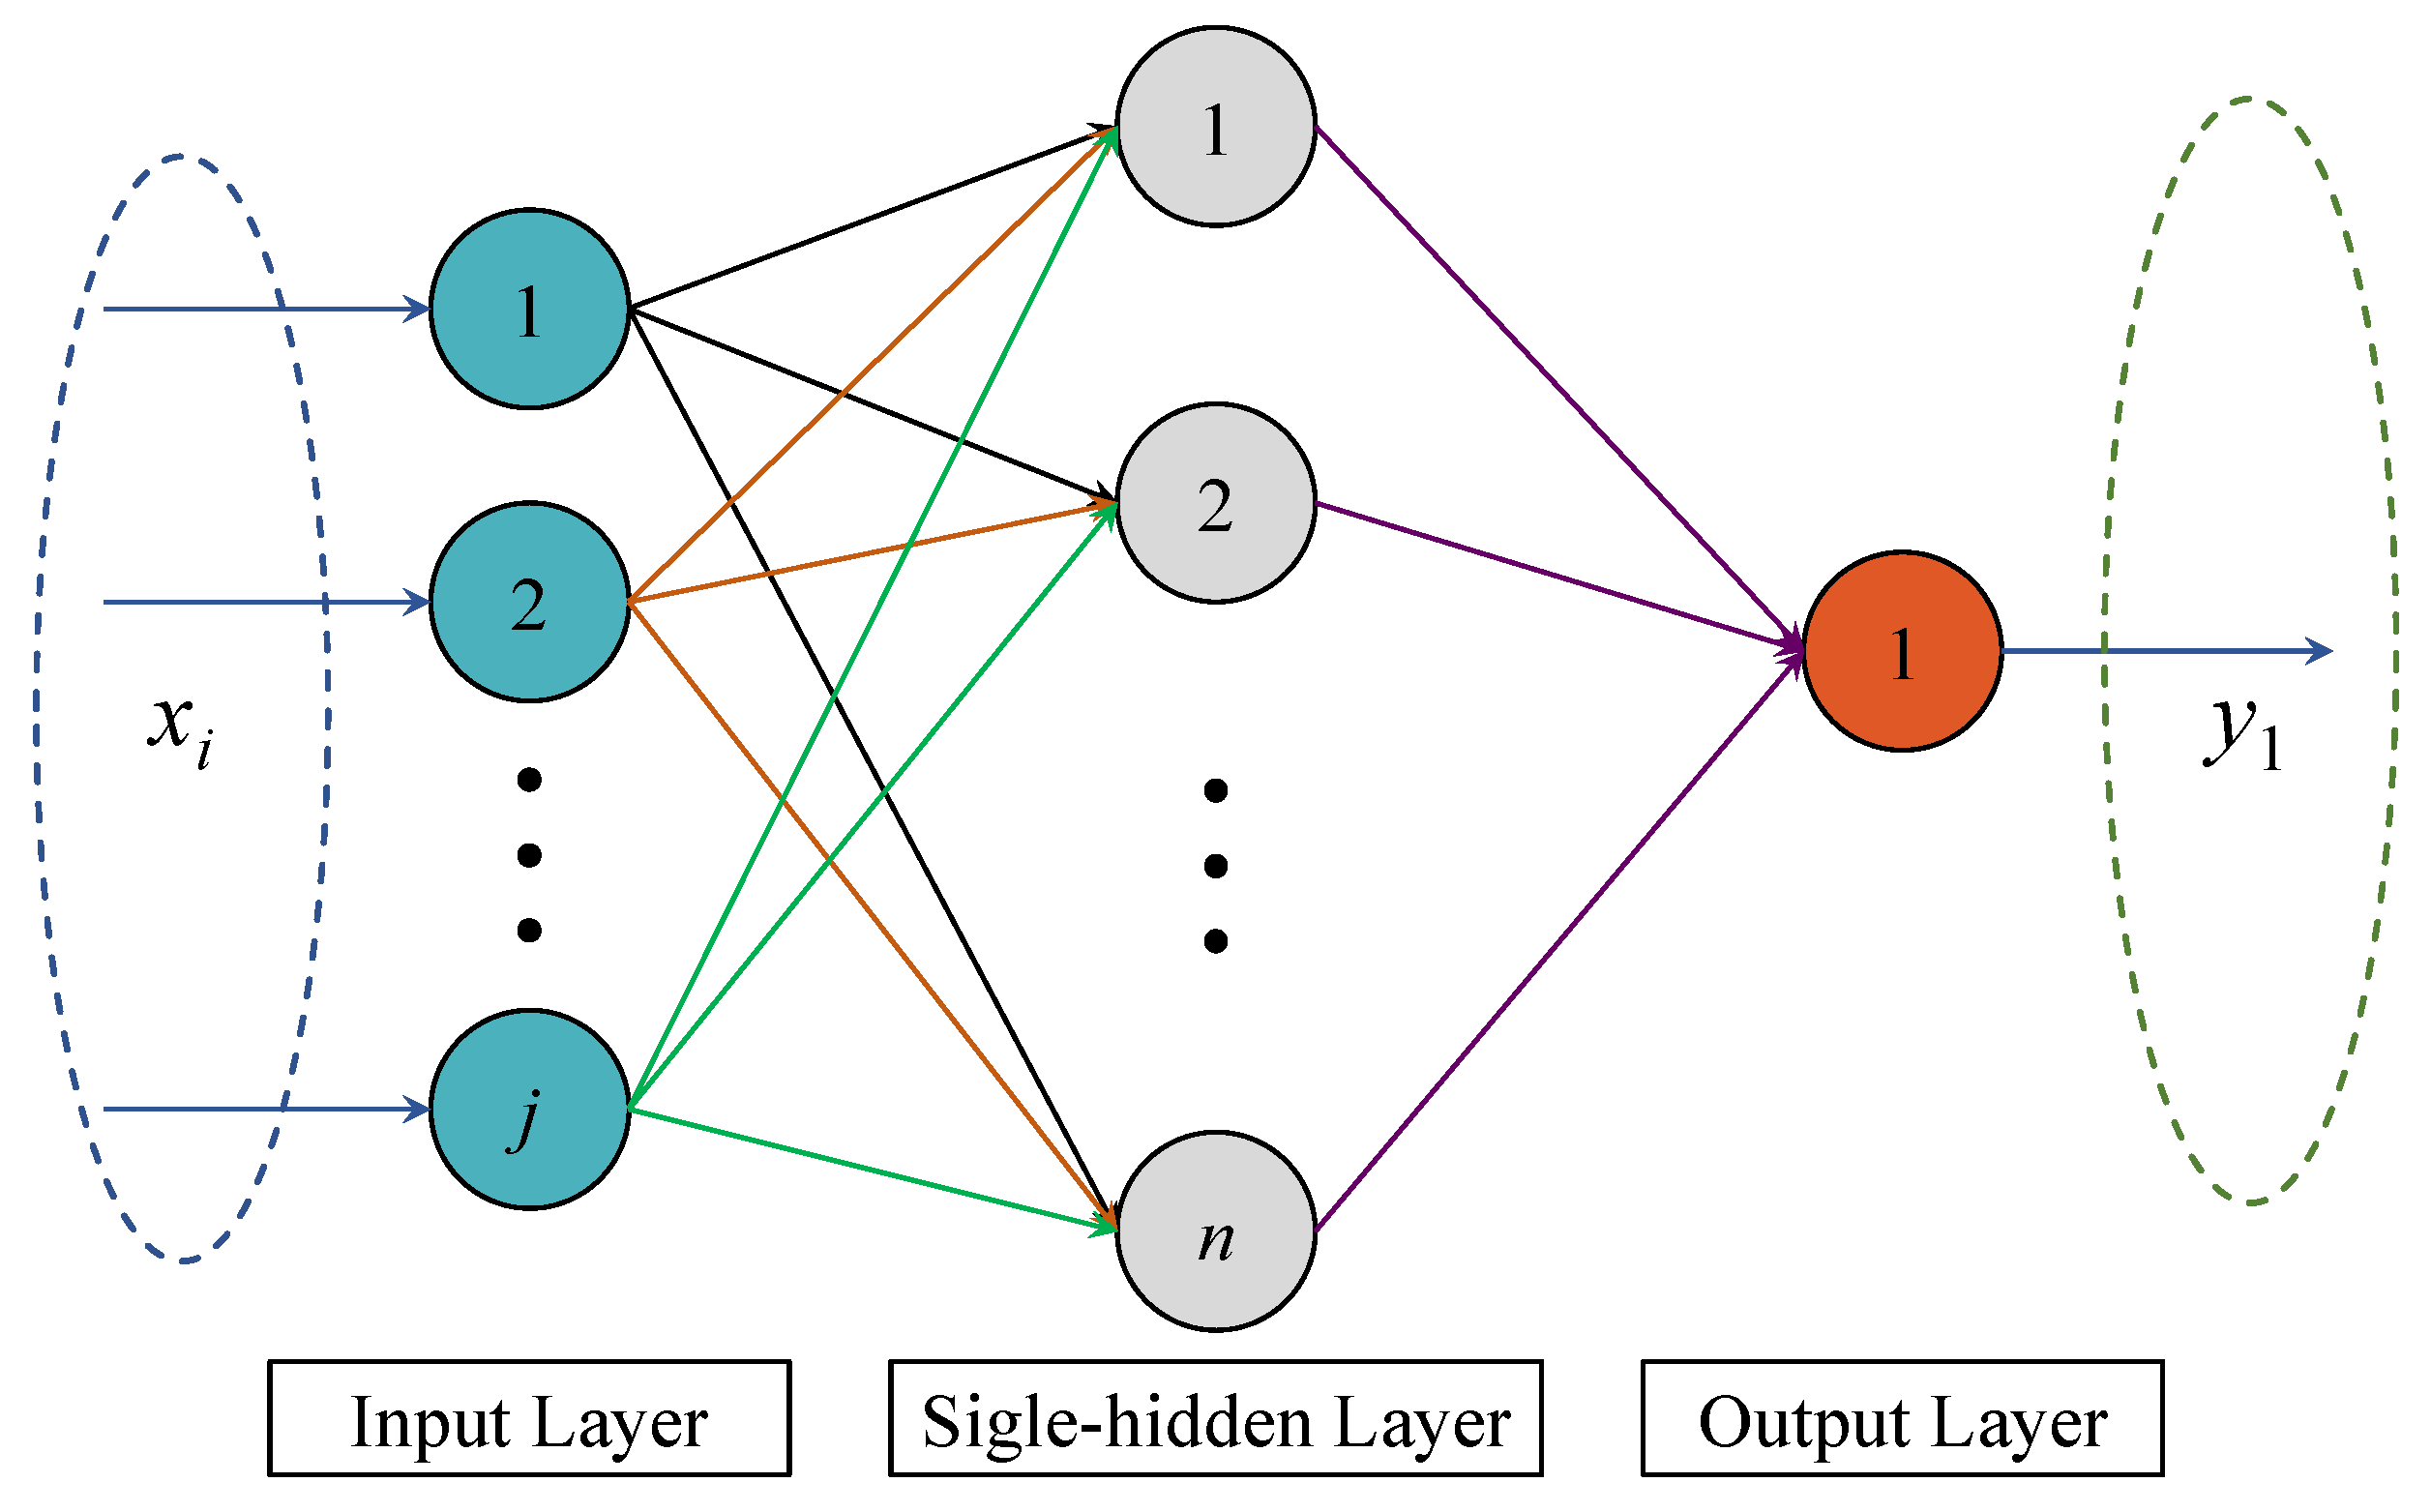
28]. Through the ELM algorithm, the neural network can learn and discover the hidden mapping relationship without a clear mathematical equation. The principle of the ELM is shown in
Figure 1 [
29]. The ELM also has random parameters. The weights and thresholds of each input are random, which will lead to the randomness of the established model and the randomness of the prediction results. To solve this kind of problem, this paper used the ant colony algorithm to optimize the ELM algorithm to establish the optimization model, and the results of the two models were compared.
For the different regression models mentioned above, this paper intended to evaluate the results of the training model by the goodness-of-fit
R2, which was calculated as follows.
After establishing the model, the established model was used to predict the performance. The prediction performance of each model was evaluated by
MAE,
MAPE,
MSE, and
RMSE. The solution formula of the evaluation index was as follows.
4. Influence Factors of VC Institutions
4.1. Numerical Variable Analysis
Before solving, it is necessary to use the CRITIC weight method to obtain the value of investment performance. The
MROI and the
IRR were used as input to obtain the weight of the two, as shown in
Table 2.
- (1)
Descriptive statistics of main variables
To facilitate subsequent regression analysis and test, after obtaining the relevant data of a number of VC institutions from 2008 to 2020, the numerical variables (including investment performance, investment size, number of funds under management, investment experience, exit number, and number of limited partners) in the study population were first subjected for descriptive statistics, and the results of descriptive statistics were shown in
Table 3.
From the results of descriptive statistics, it could be found that the maximum value of fund performance in the samples selected is 3.05, the minimum value is −0.92, and the average value of return is 0.447. This indicates that the performance of VC funds is high, but the gap of lumpy performance is large, which means that there is a greater risk of investment. From the perspective of investment size, the maximum value is 6733 million far, the minimum value is 5 million yuan, and the average value is 509.873 million yuan, which indicates that the overall investment amount of the VC industry is relatively high, but there is no clear threshold for capital access.
The large difference between the average and median of the investment size and the huge variance illustrate the skewness of the investment size distribution. That is, the distribution is concentrated when the investment size is small and discrete when the investment size is large, indicating that most investments tend to be small because the risk is also smaller when the size is small. Additionally, the average investment size is much larger than the median, manifesting that the investment size of VC funds has a tendency of investment concentration, i.e., the number of larger funds is small but accounts for the vast majority of the investment amount, which proves from one side that high investment can also bring high returns. From the number of funds under management, the maximum number by a VC institution is 112, and the minimum number is 1, with an average value of 11–12, indicating that VC institutions in China usually establish multiple funds to reduce the risk to invest in a single fund.
In terms of investment experience, the maximum value of historical investment events of VC institutions in China is 374, the minimum value is 1, and the average value is 38–39, which suggests that the VC institutions have a more obvious gap in investment experience. The maximum value of the number of completed investments by VC institutions is 86 from the exit number, the minimum value is 1, and the average value is 7–8, indicating that Chinese VC institutions tend to invest multiple times but stop after a certain number of times to obtain higher returns. From the number of LPs, the maximum number is 46, the minimum is 1, and the average is 7–8, which indicates that most of the VC institutions in China have multiple LPs, proving that VC institutions themselves need to reduce risk. All the above statistical results show that the sample selection of this paper is reasonable.
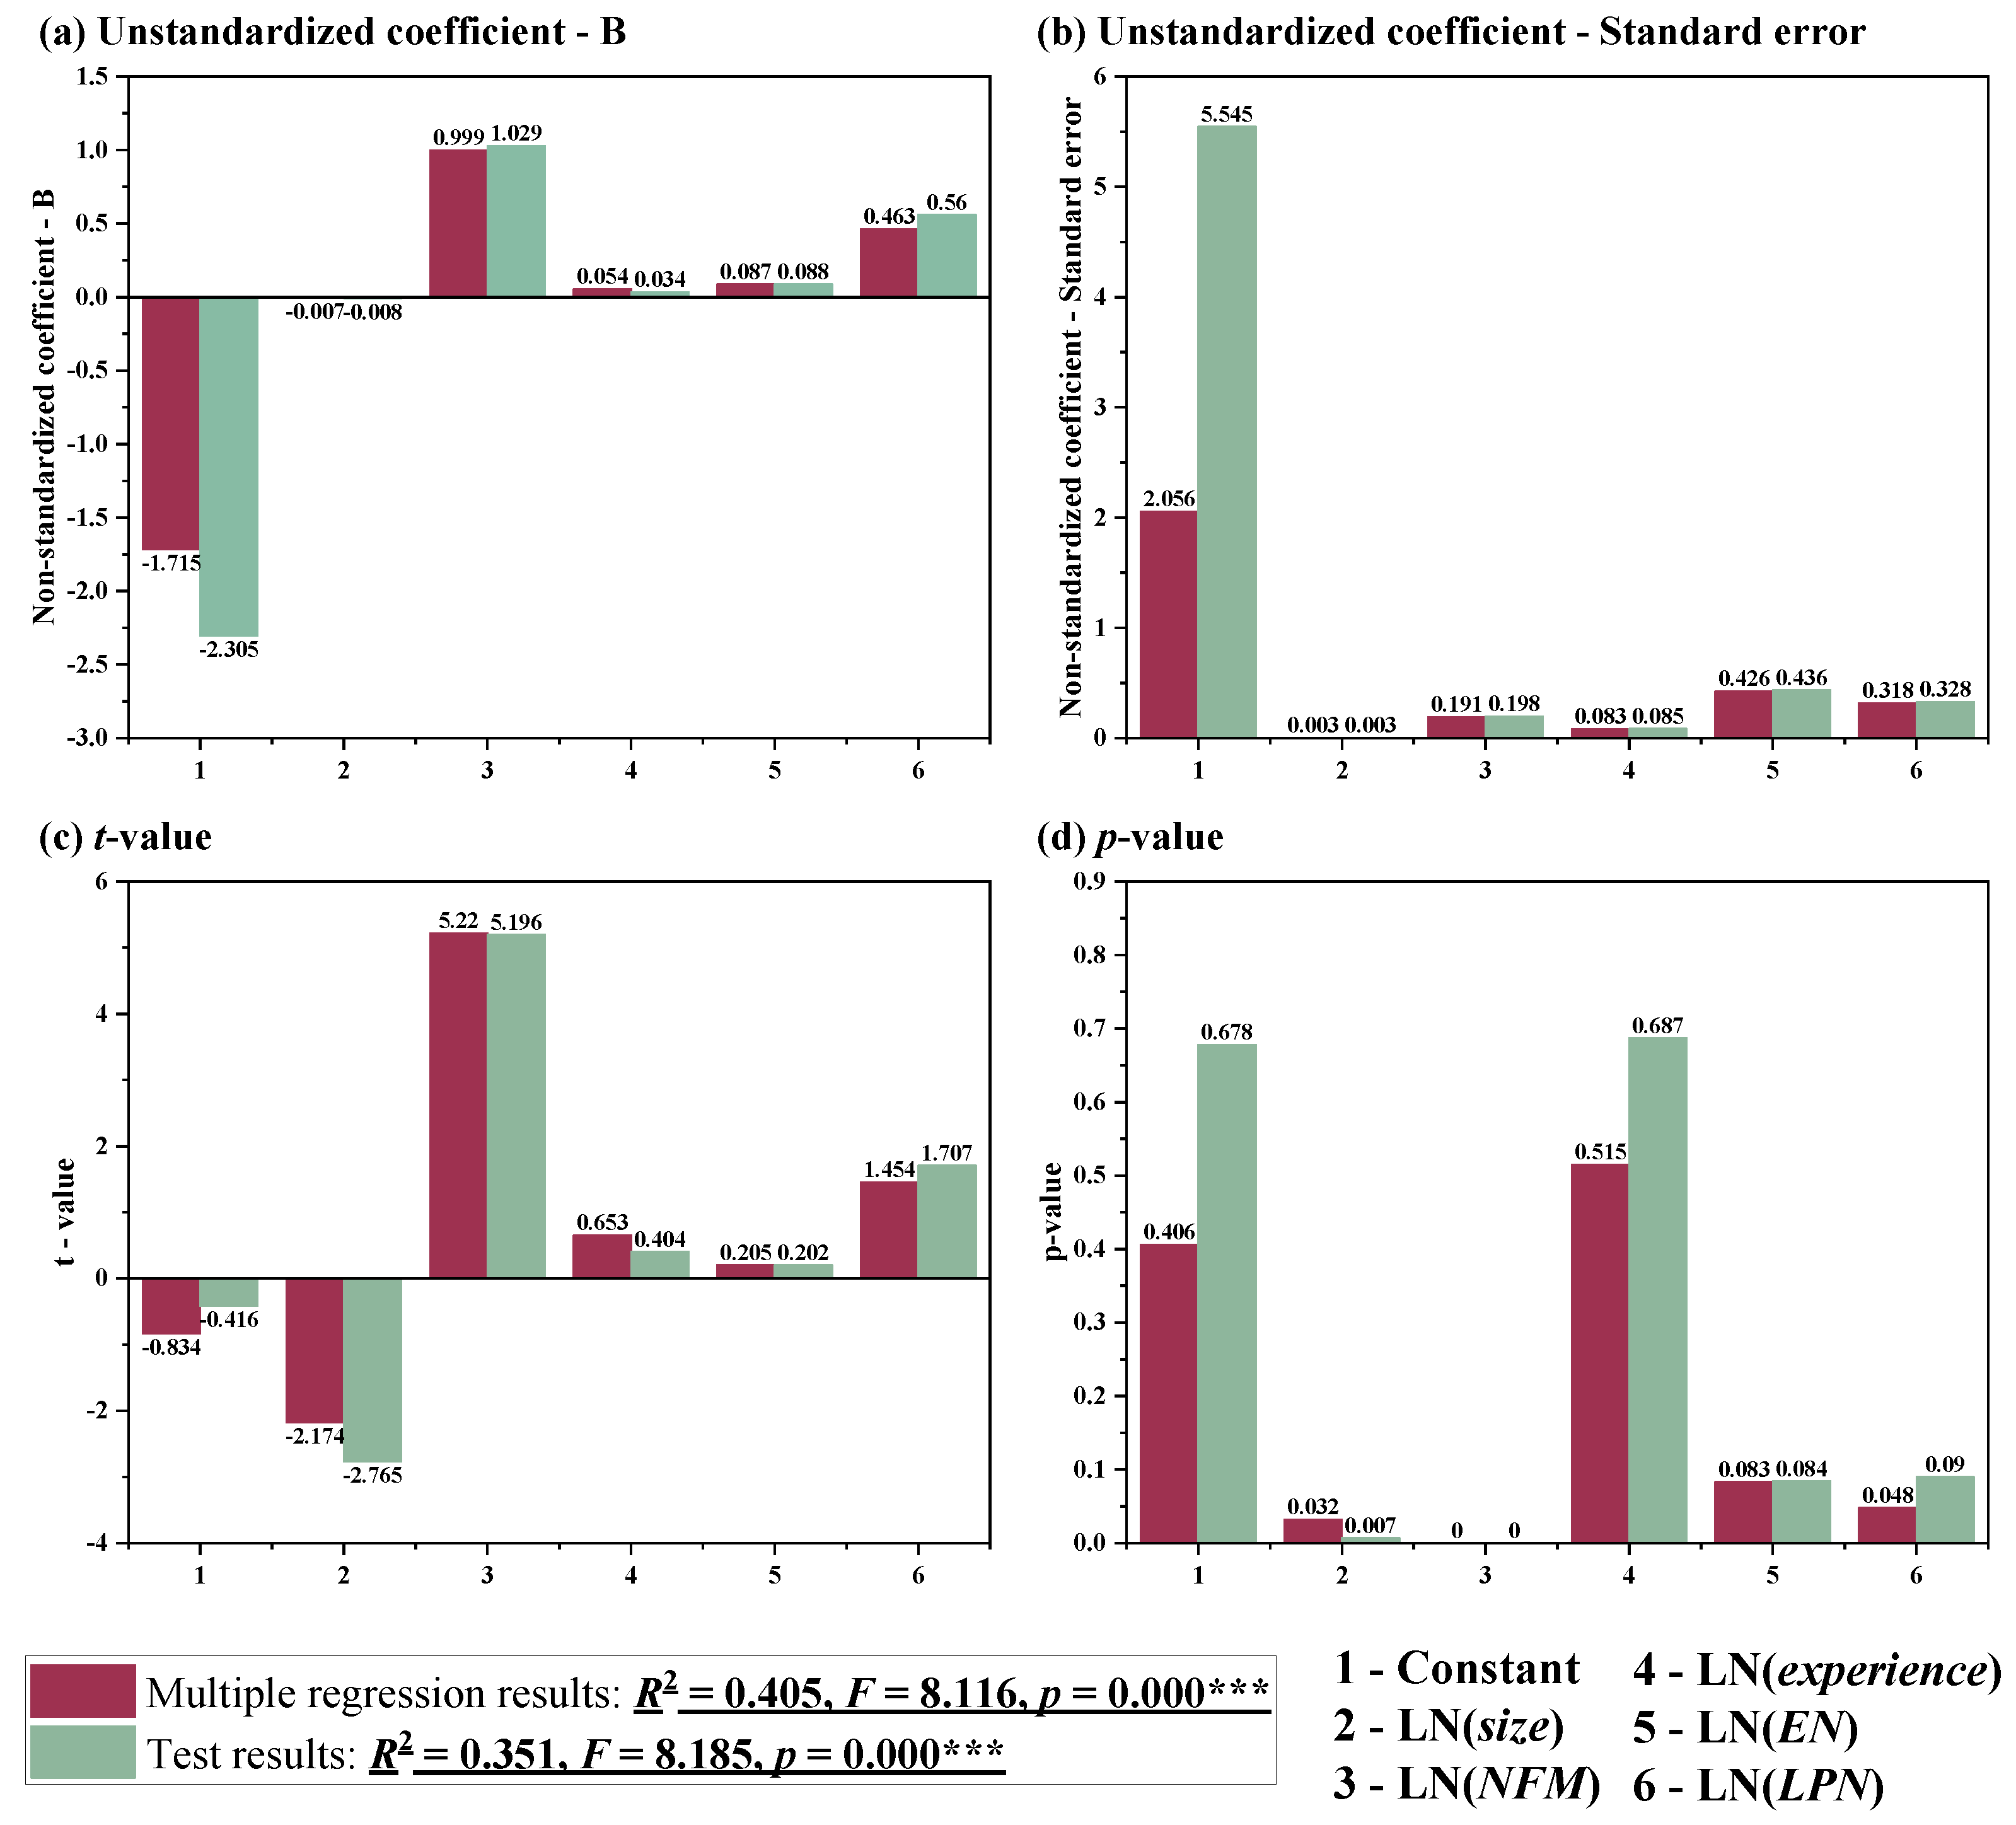
During statistical processing, it was found that CV of investment size, investment experience, and exit number was greater than 0.15, suggesting that there were outliers in these data, which needed to be eliminated before the next analysis. After the outliers were removed, 130 groups of data remained. On this basis, a multiple linear regression model with all numerical variables was established to comprehensively analyze the impact of multiple factors on the performance of VC funds. To eliminate the influence of dimension and data heteroscedasticity, some data were taken logarithm before regression, then MuL regression was performed, and the robustness of the MuL regression model was tested using the adjusted investment performance instead of the original investment performance for the 130 groups of sample data. Meanwhile, the “F-test” was used to test whether there is a linear relationship between the MuL and test model. The final model regression and test results are shown in
Figure 2.
From
Figure 2, it can be seen that there is a significant effect of investment size, NFM, EN, and LPN on the performance of VC funds, and there is no significant relationship between investment experience and investment performance. In addition, among the variables with significant effects, all of them have positive effects on investment performance except for investment size, which has a negative effect on investment performance. The F-value and
p-value of the regression model show that the model has a linear relationship and is significant at the 1% level. The test results also eliminate heteroskedasticity and autocorrelation, and there is no multicollinearity among the numerical variables of the test model. Comparing the analysis results of the two models shows that the results of the regression with adjusted investment performance on the numerical variables remain highly consistent with the MuL regression results, which indicates that the MuL regression model is robust.
4.2. Categorical Variable Analysis
The above MuL regression model aims to analyze the effect of numerical variables on investment performance, and for variables of text type (categorical variables), one-way ANOVA was performed in this paper. The dependent variable was first tested for normality, and then one-way ANOVA was applied to test whether the effect of each factor on investment performance was significant. The test results of investment performance normality are shown in
Table 4. Since the sample size was less than 5000, the Shapiro–Wilk (S-W) test was used to test whether it conformed to the normal distribution.
The significance
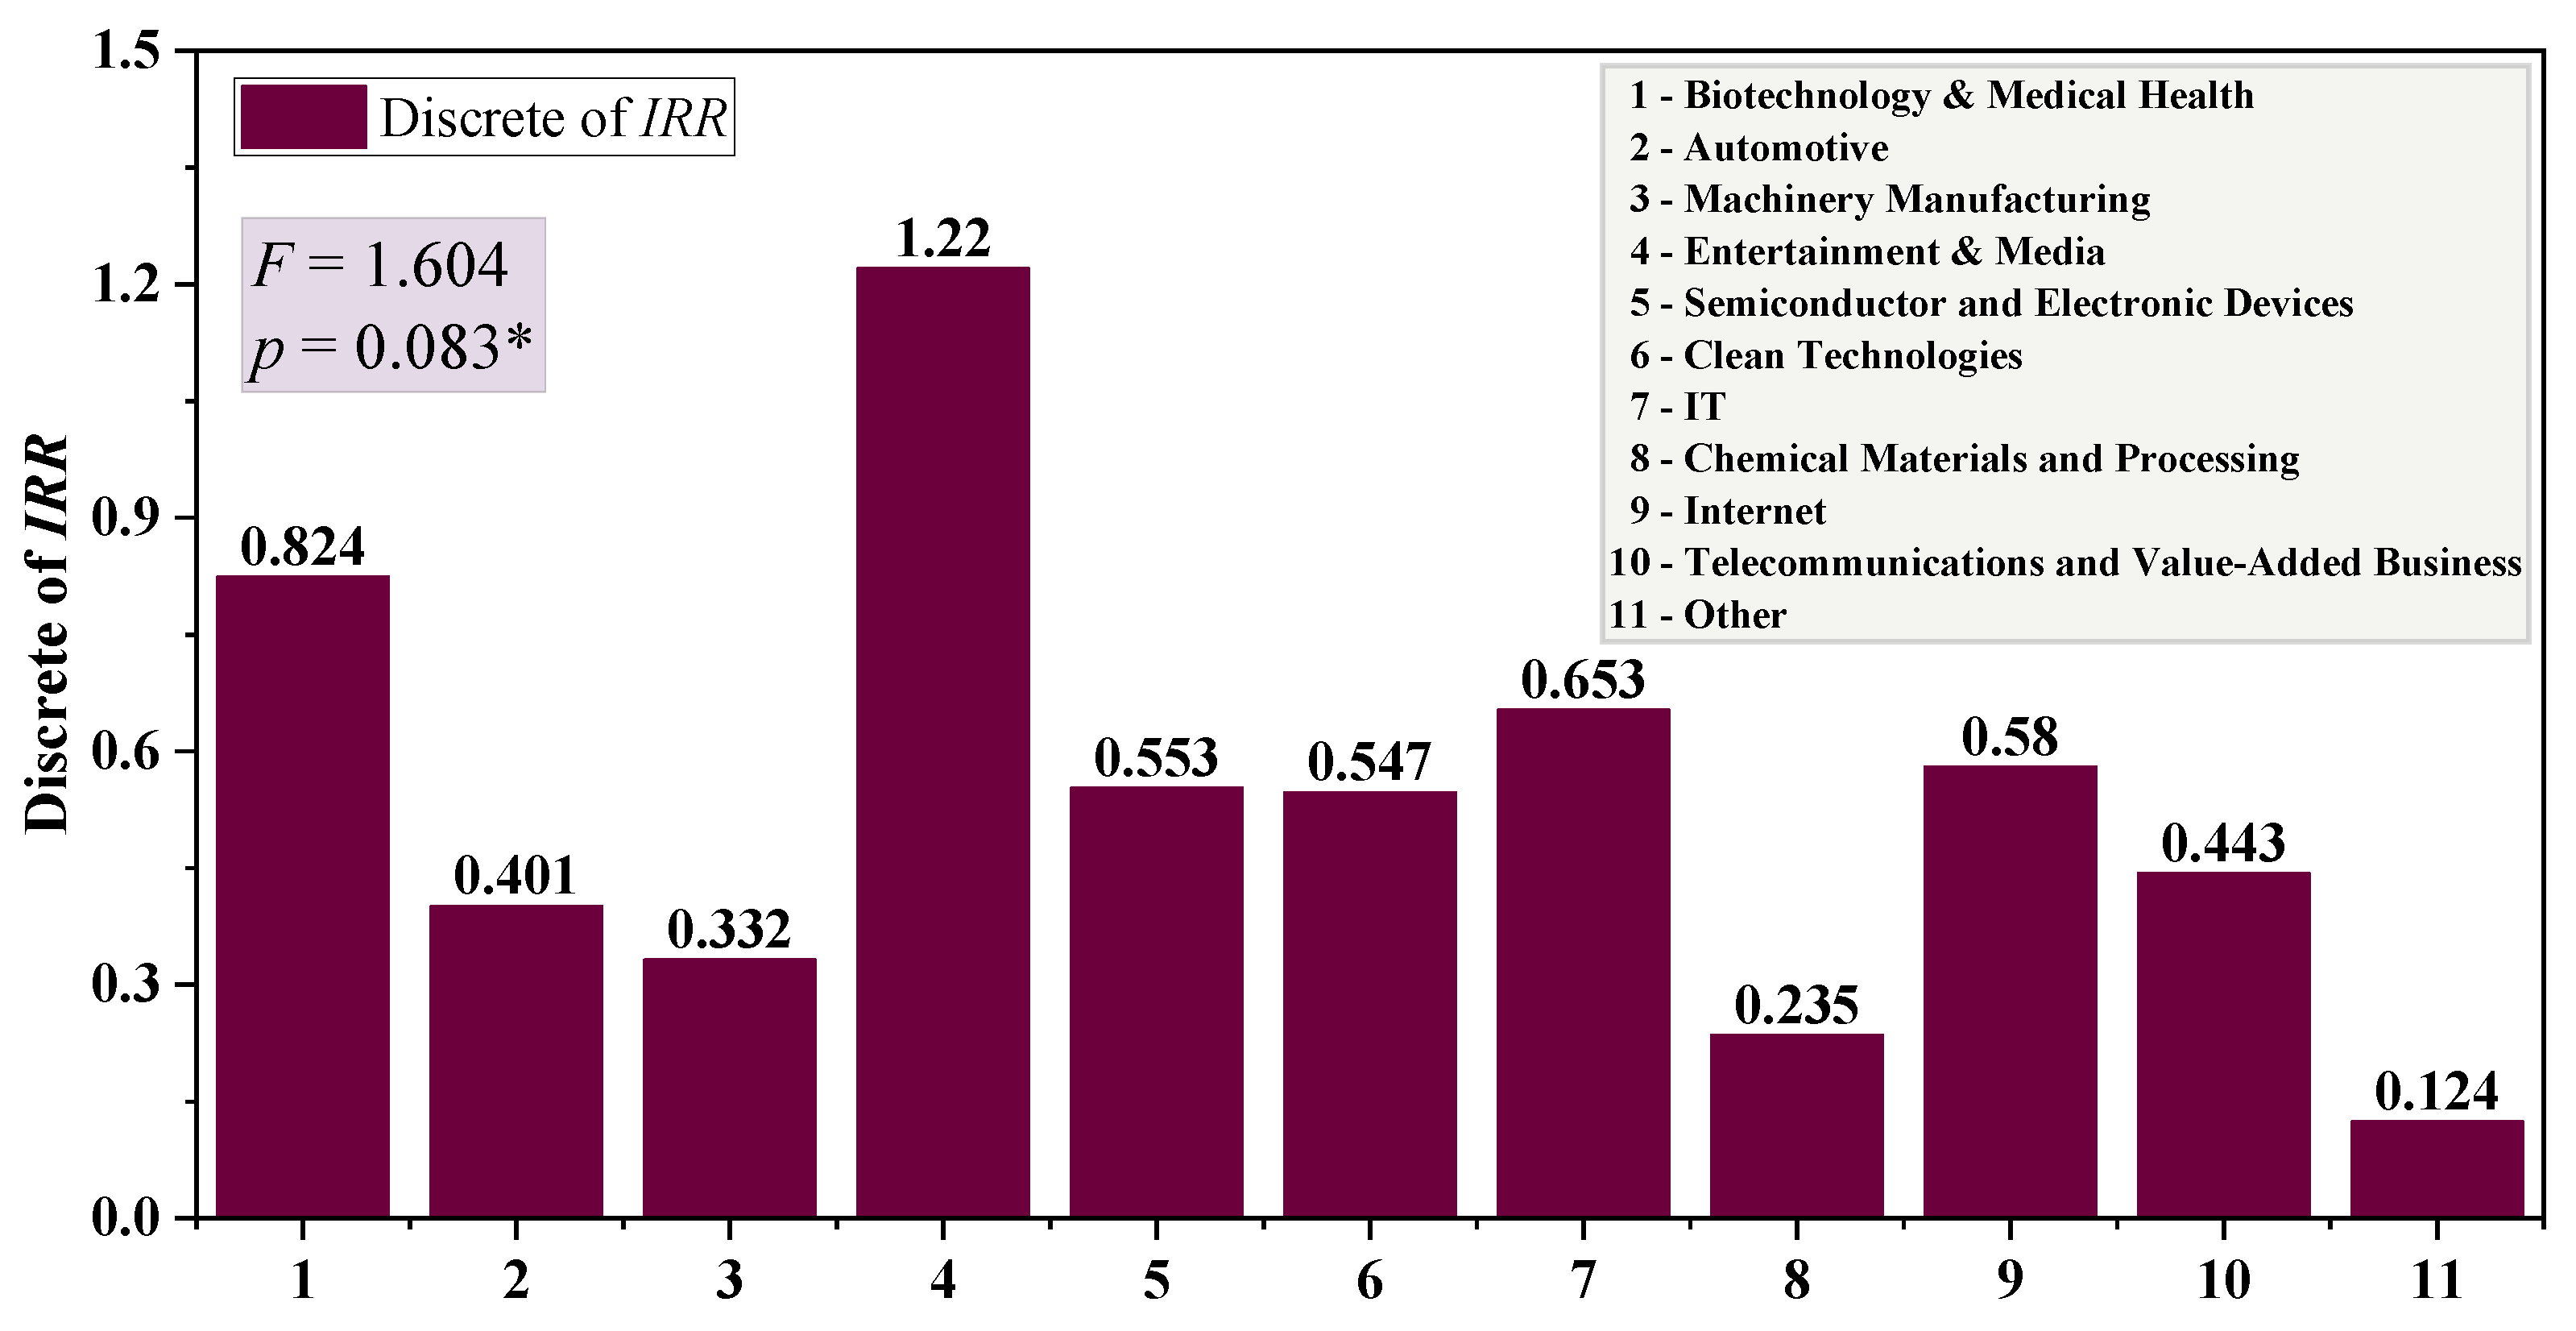
p-value of investment performance using the Shapiro–Wilk test is 0.001, which presents significance at a 1% level. Additionally, the absolute value of kurtosis of investment performance is less than 10, and the absolute value of skewness is less than 3, indicating that it is basically acceptable for normal distribution. According to the classification of the Zero2IPO database, there are currently 28 main industries invested by VC funds in China. However, due to the lack of data or insufficient sample size, this paper mainly investigated 11 types of industries, including IT, semiconductor and electronic equipment, telecommunication and value-added business, Internet, machinery manufacturing, chemical and raw materials, automobile, clean technology, biotechnology, entertainment and media, and others. The results of the homogeneity test for variance and ANOVA of the investment industry are presented in
Figure 3 and
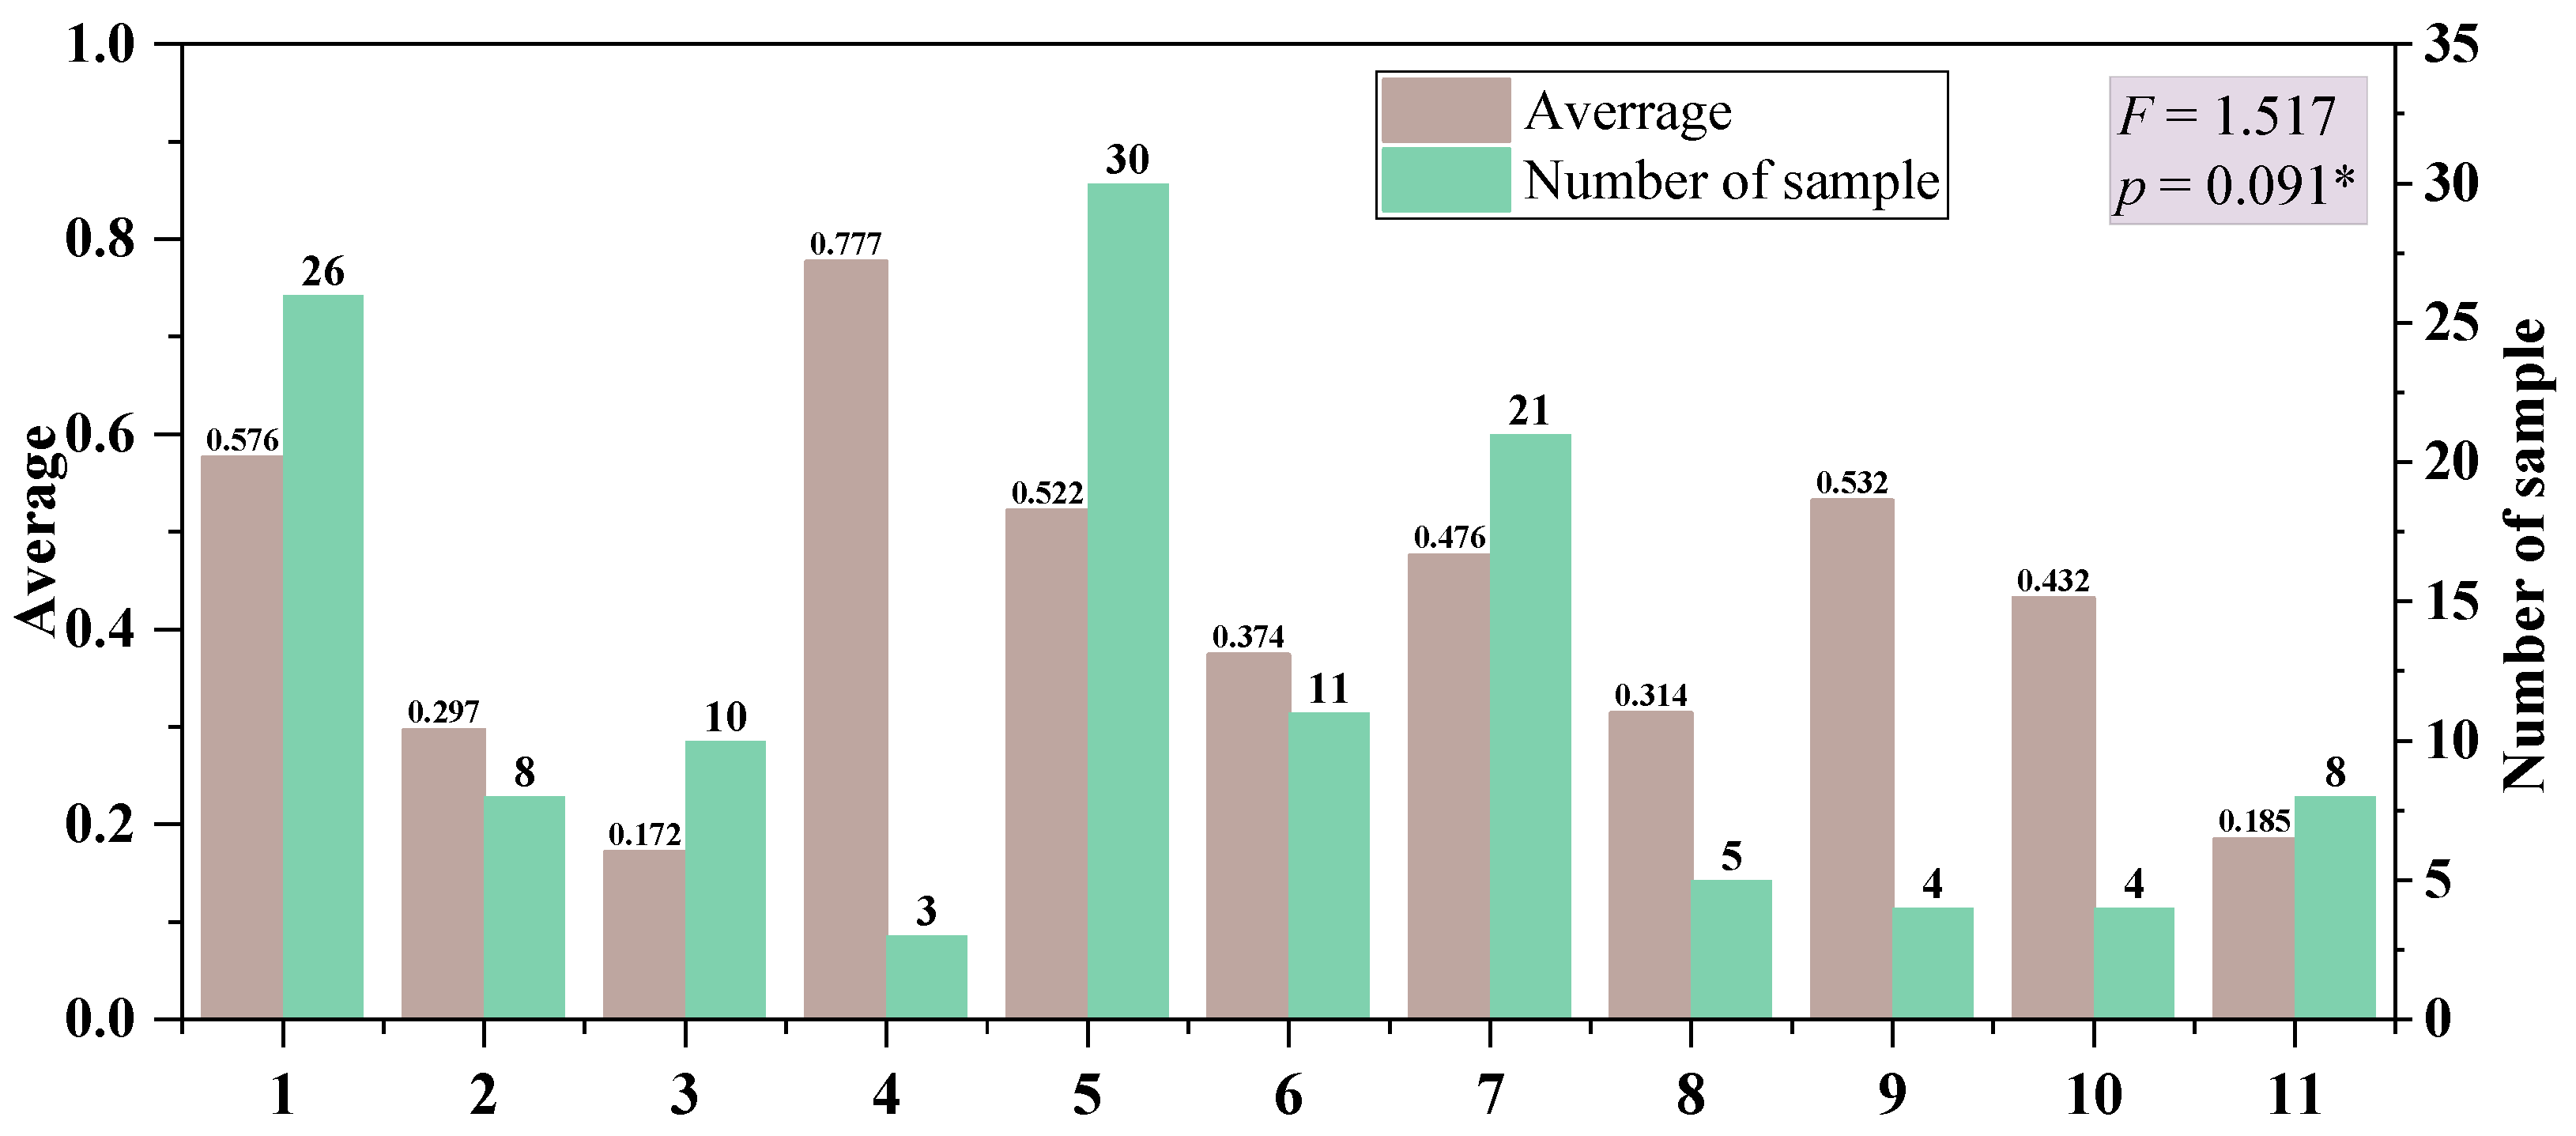
Figure 4.
It can be seen that there is a significant difference in the investment performance of investments in the entertainment and media industry compared to other industries, followed by the biotechnology/healthcare and IT industries, indicating that VC funds have higher returns from investing in high technology and high added-value industries. In addition, the results of the homogeneity test for variance show a significant
p-value of 0.083, which presents significance at the 10% level. Similarly, as seen in
Figure 3, the significance
p-value is 0.091, which presents significance at the 10% level, suggesting that there are significant differences in the investment performance of different industries. The sample size of investment in each industry shows that the industries with a high number of investments are basically concentrated in high technology or high added-value industries. Similar to the investment industry, the same analysis was performed for the investment areas, and the results are shown in
Figure 5 and
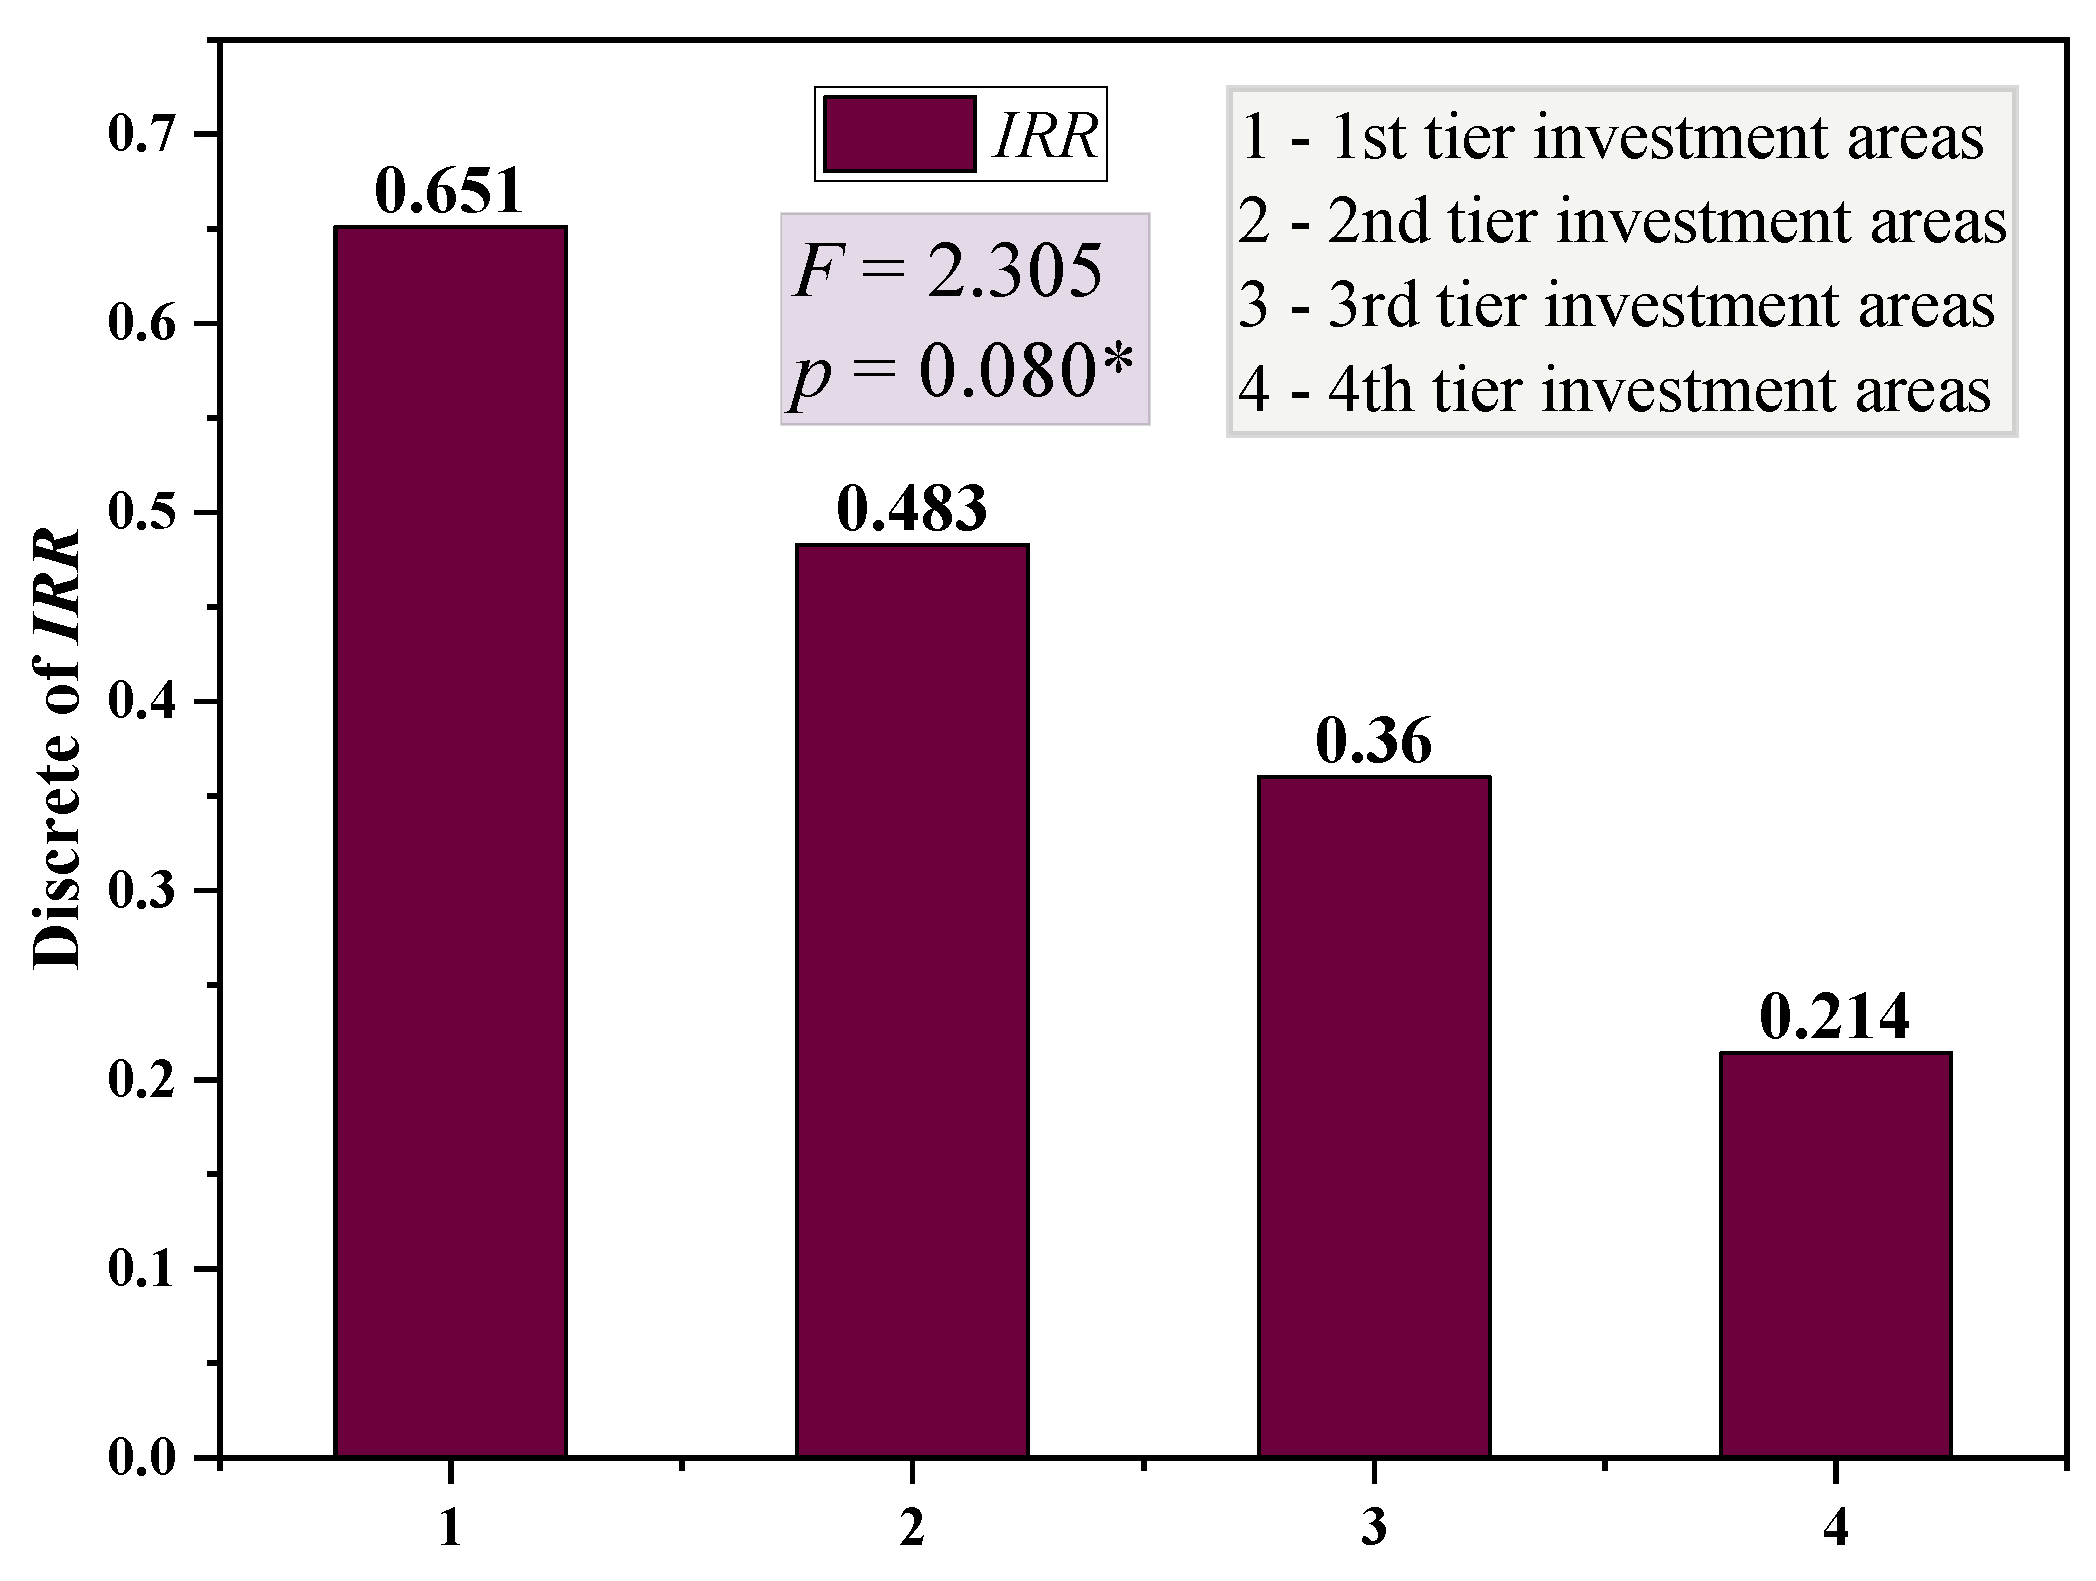
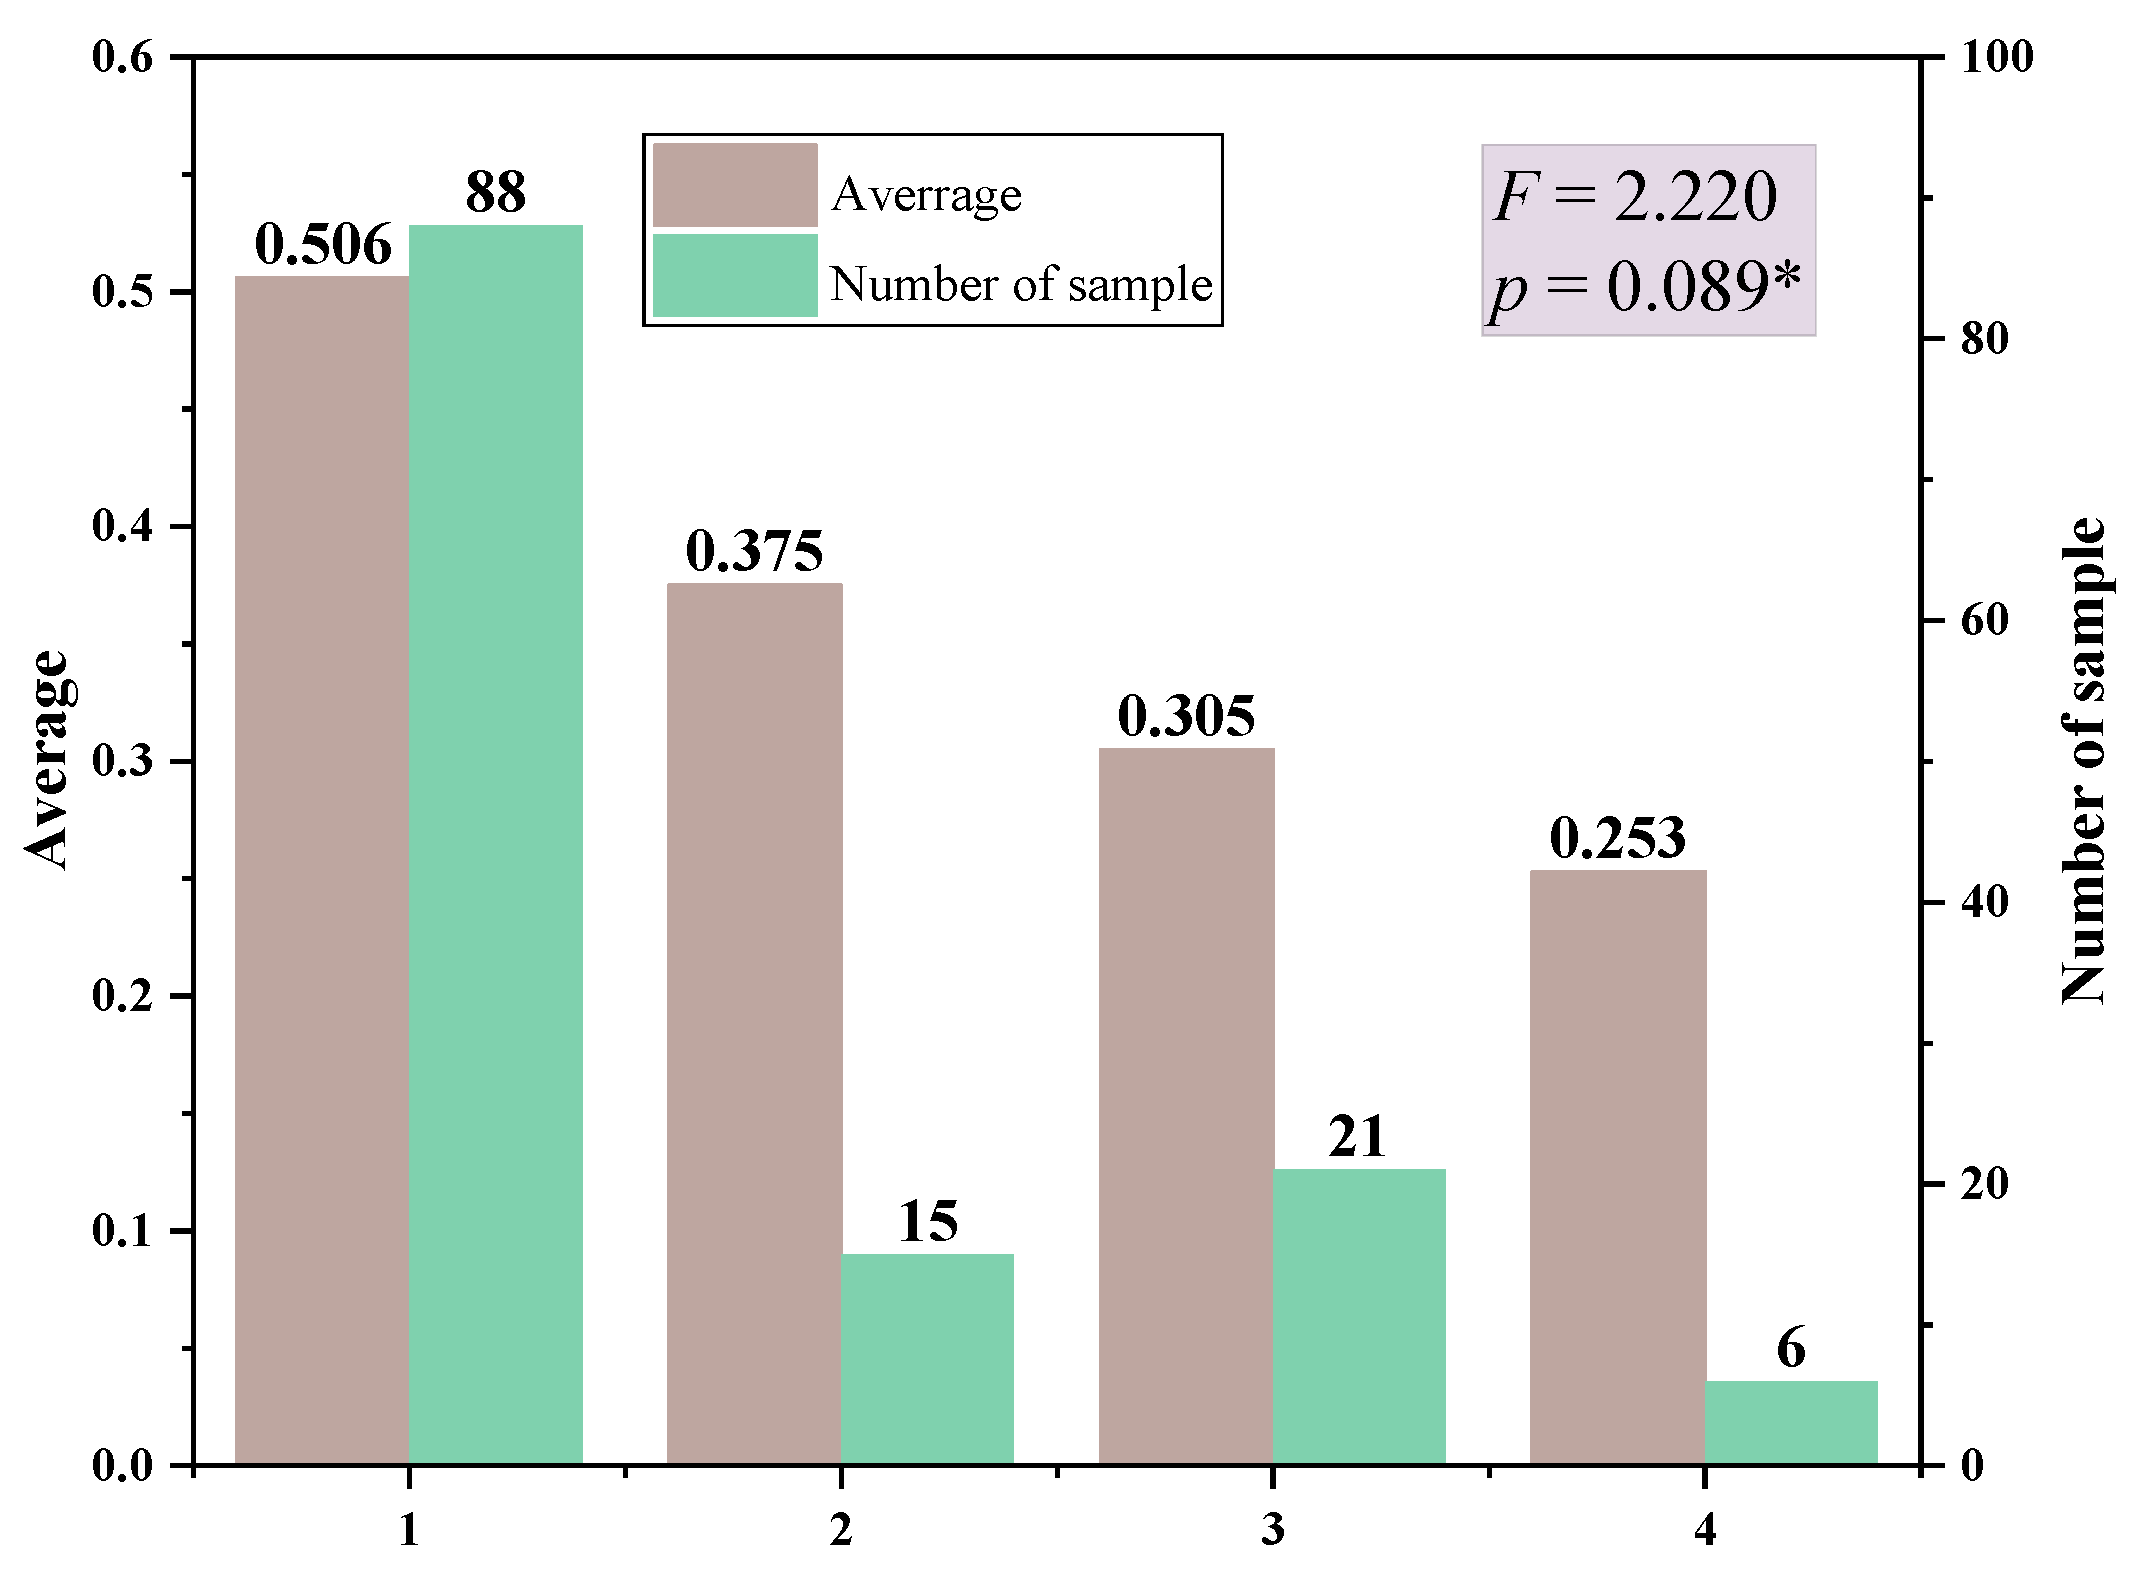
Figure 6. The investment areas were divided into four categories based on the GDP of the province or municipality in the previous 5 years and divided into the first, second, third, and fourth tiers from high to low.
It is obvious that investment performance decreases when the investment tier rises, i.e., all projects of VC funds have higher investment performance in areas with high GDP output than that in areas with low GDP output, and it is also evident from the number of investments in each tier that VC institutions also prefer to invest in areas with higher GDP. Results of the homogeneity test for variance display that the significant
p-value is 0.080, which manifests significance at the 10% level. Similarly, as seen in
Figure 6, the significance
p-value is 0.089, which presents significance at the 10% level, indicating that there are significant differences in investment performance between areas. It can also be seen from
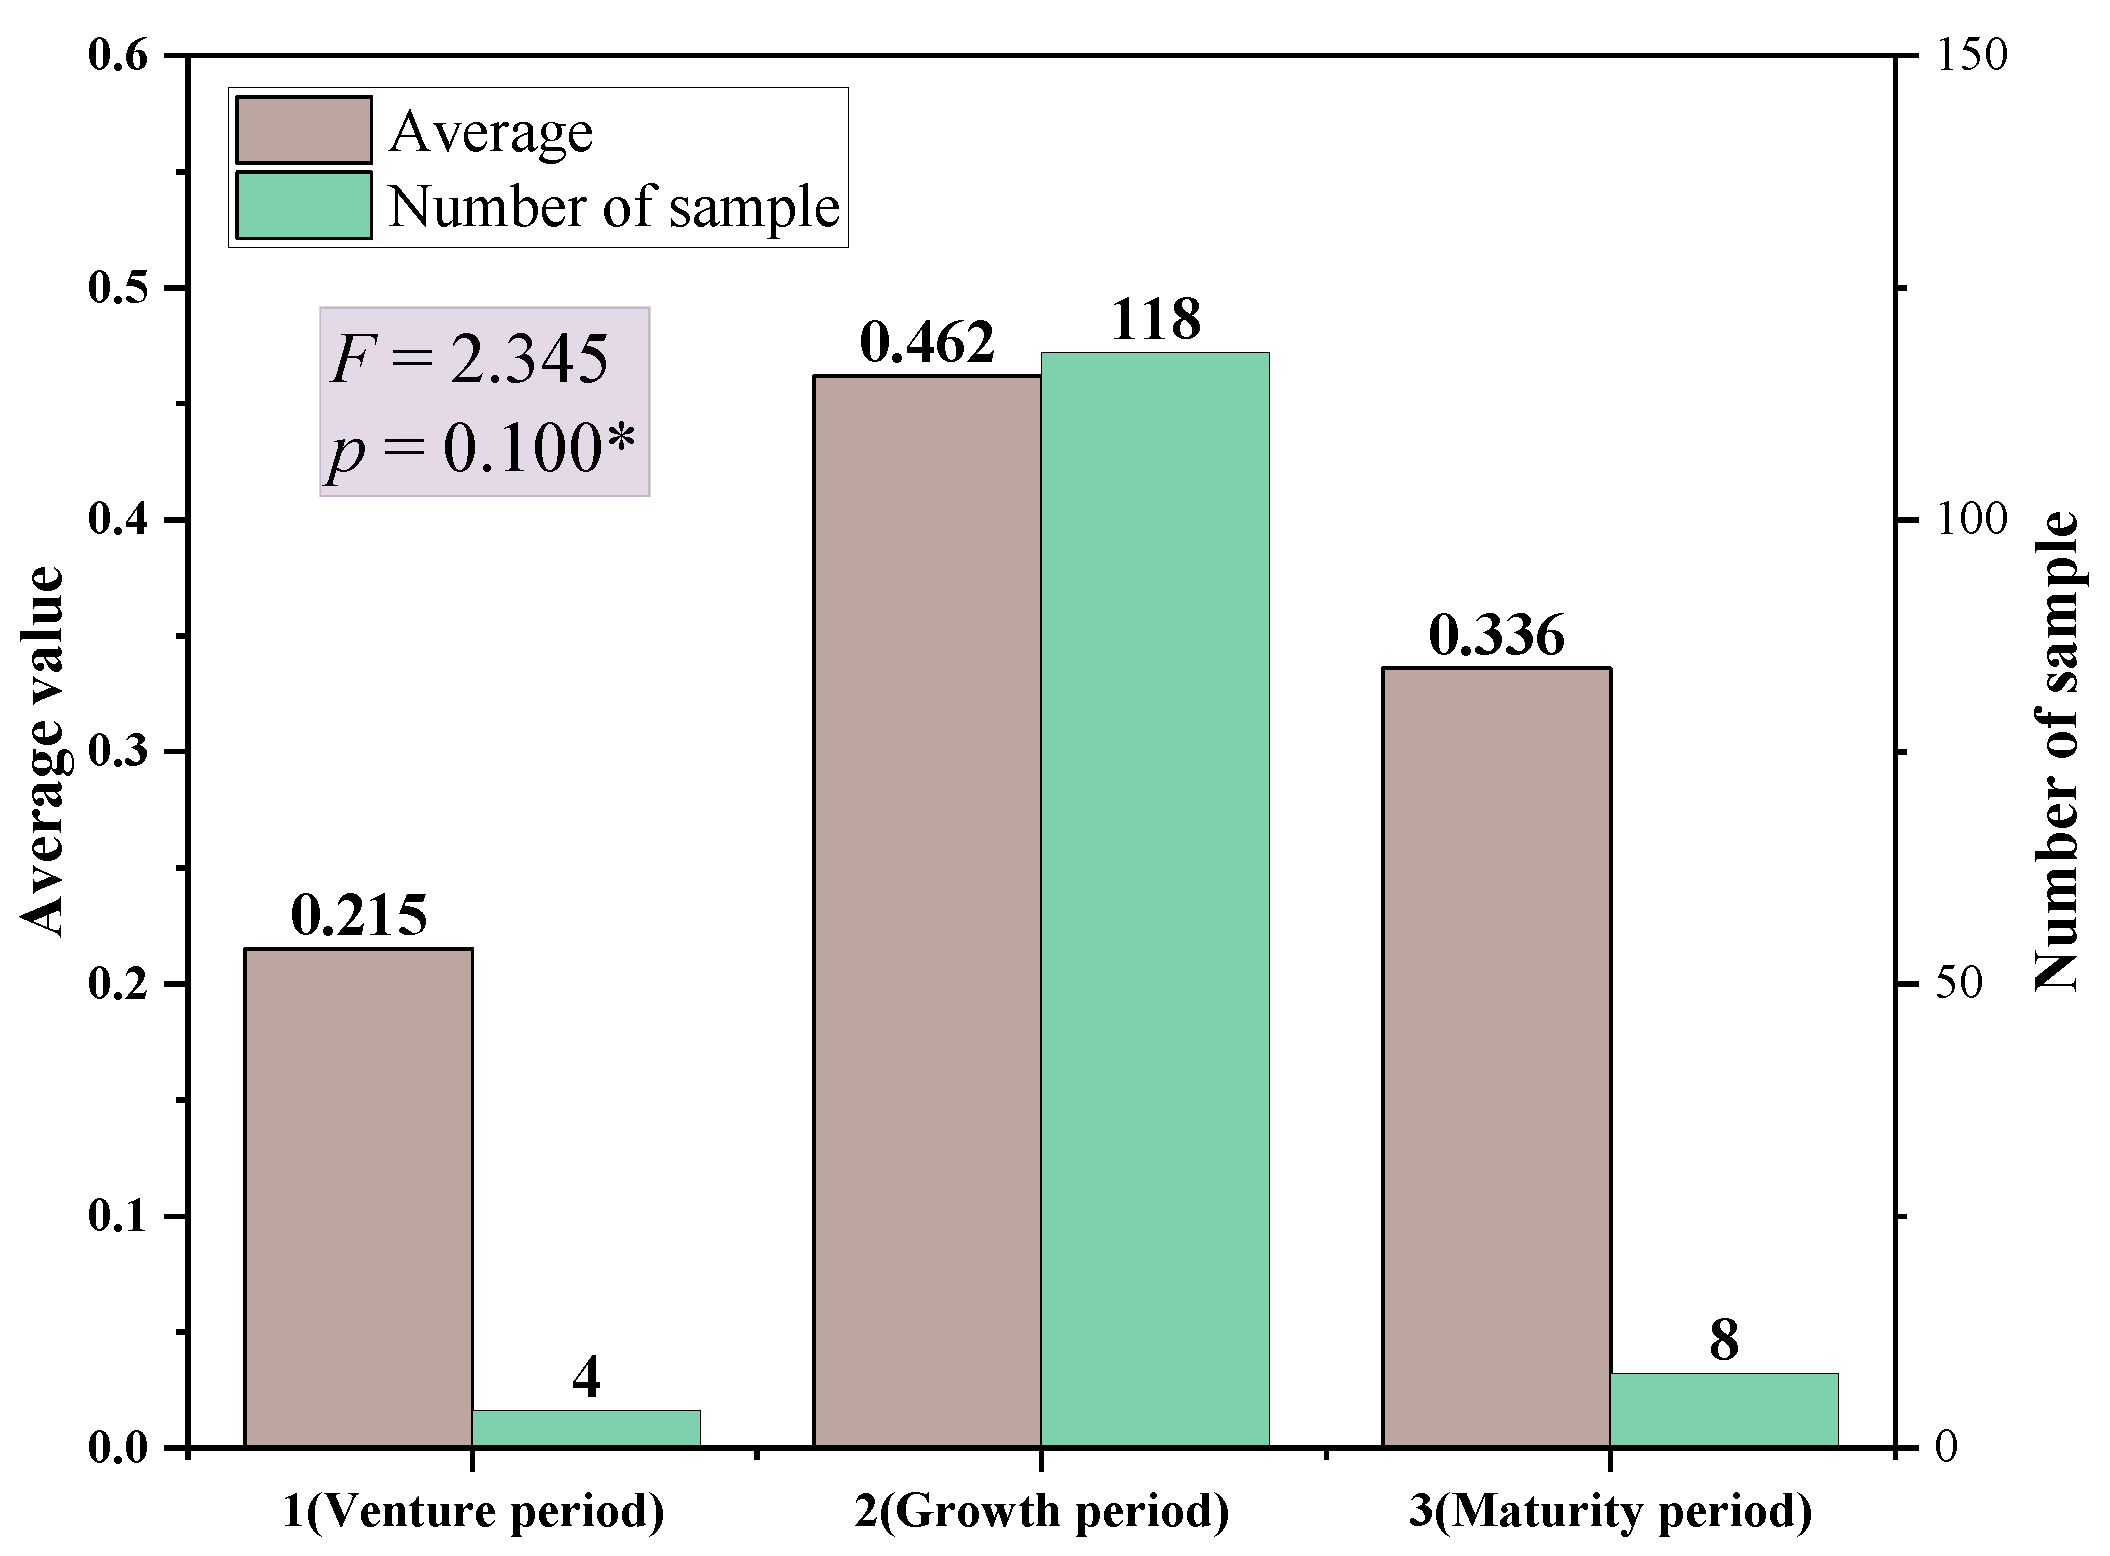
Figure 4 that the number of investment projects invested by VC institutions in each area is basically consistent with GDP, i.e., the higher the GDP, the more projects invested. The investment stages of VC projects can be divided into the venture period, growth period, and maturity period, which is also performed for the same analysis, and the results are shown in
Figure 7 and
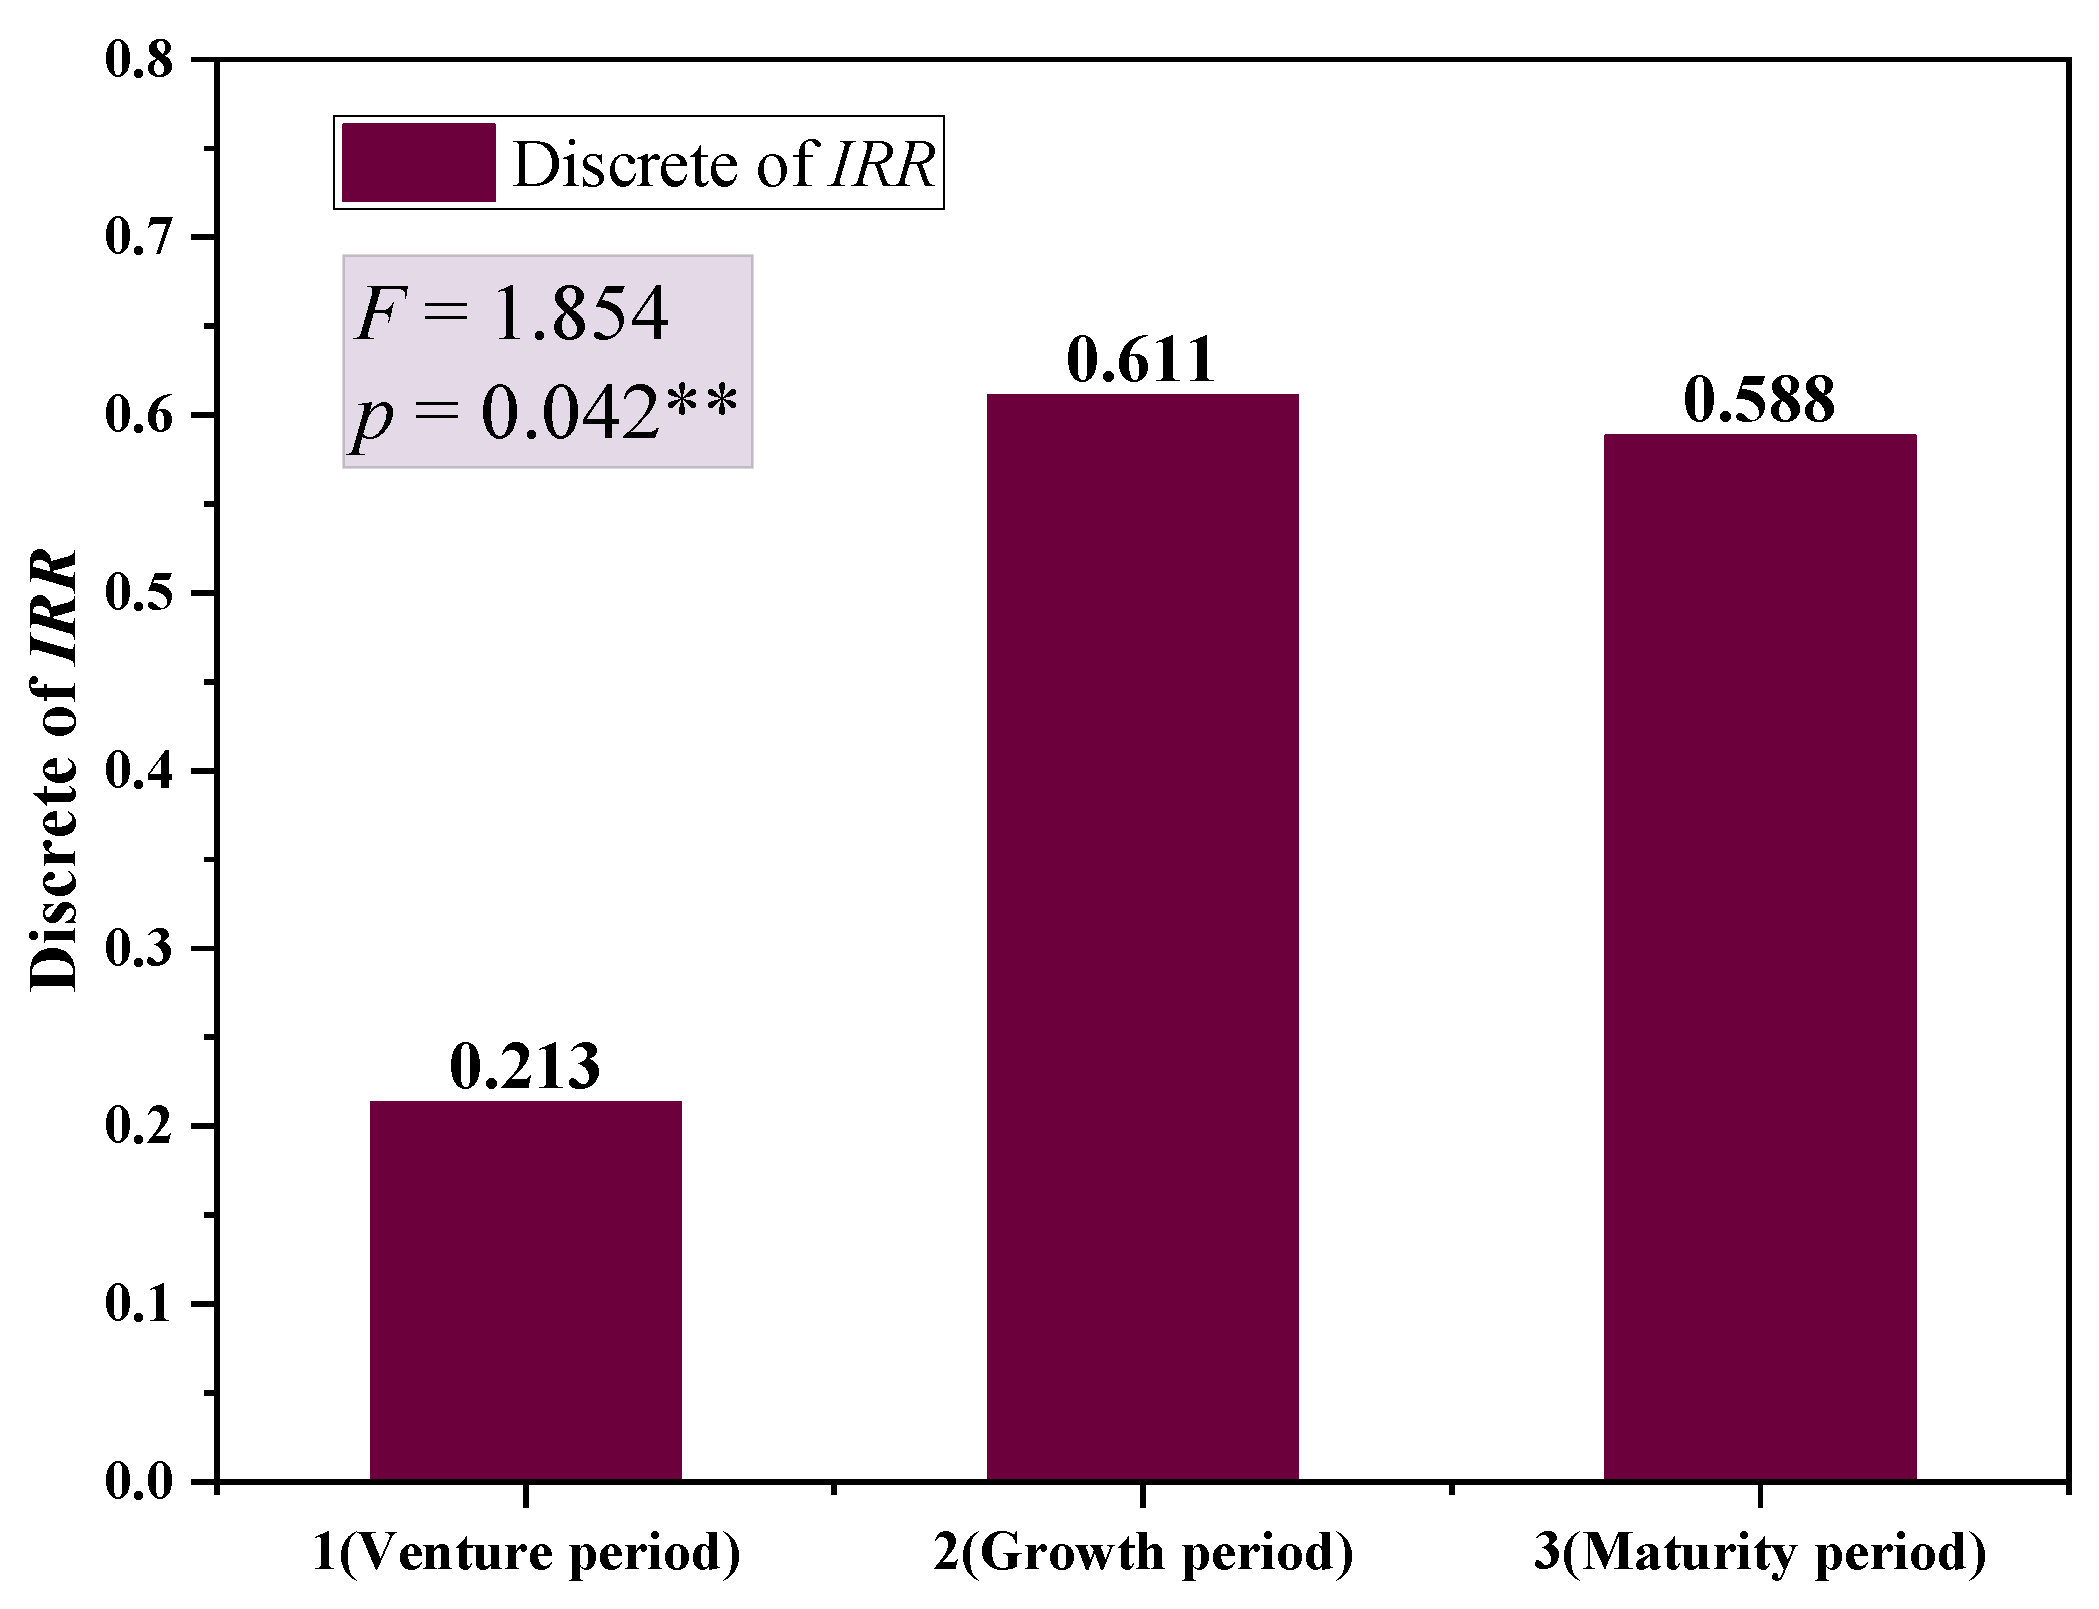
Figure 8.
It is evident to see that the performance obtained varies depending on the stage of the project at the time of investment. The later the investment stage, the higher the performance is likely to be obtained. This indicates that the earlier the stage of the project, the more likely it is to fail and, therefore, to obtain a lower performance. The significance p-value of 0.042 from the results of the homogeneity test for variance represents the significance presented at the 5% level. The significance
p-value is 0.100 from
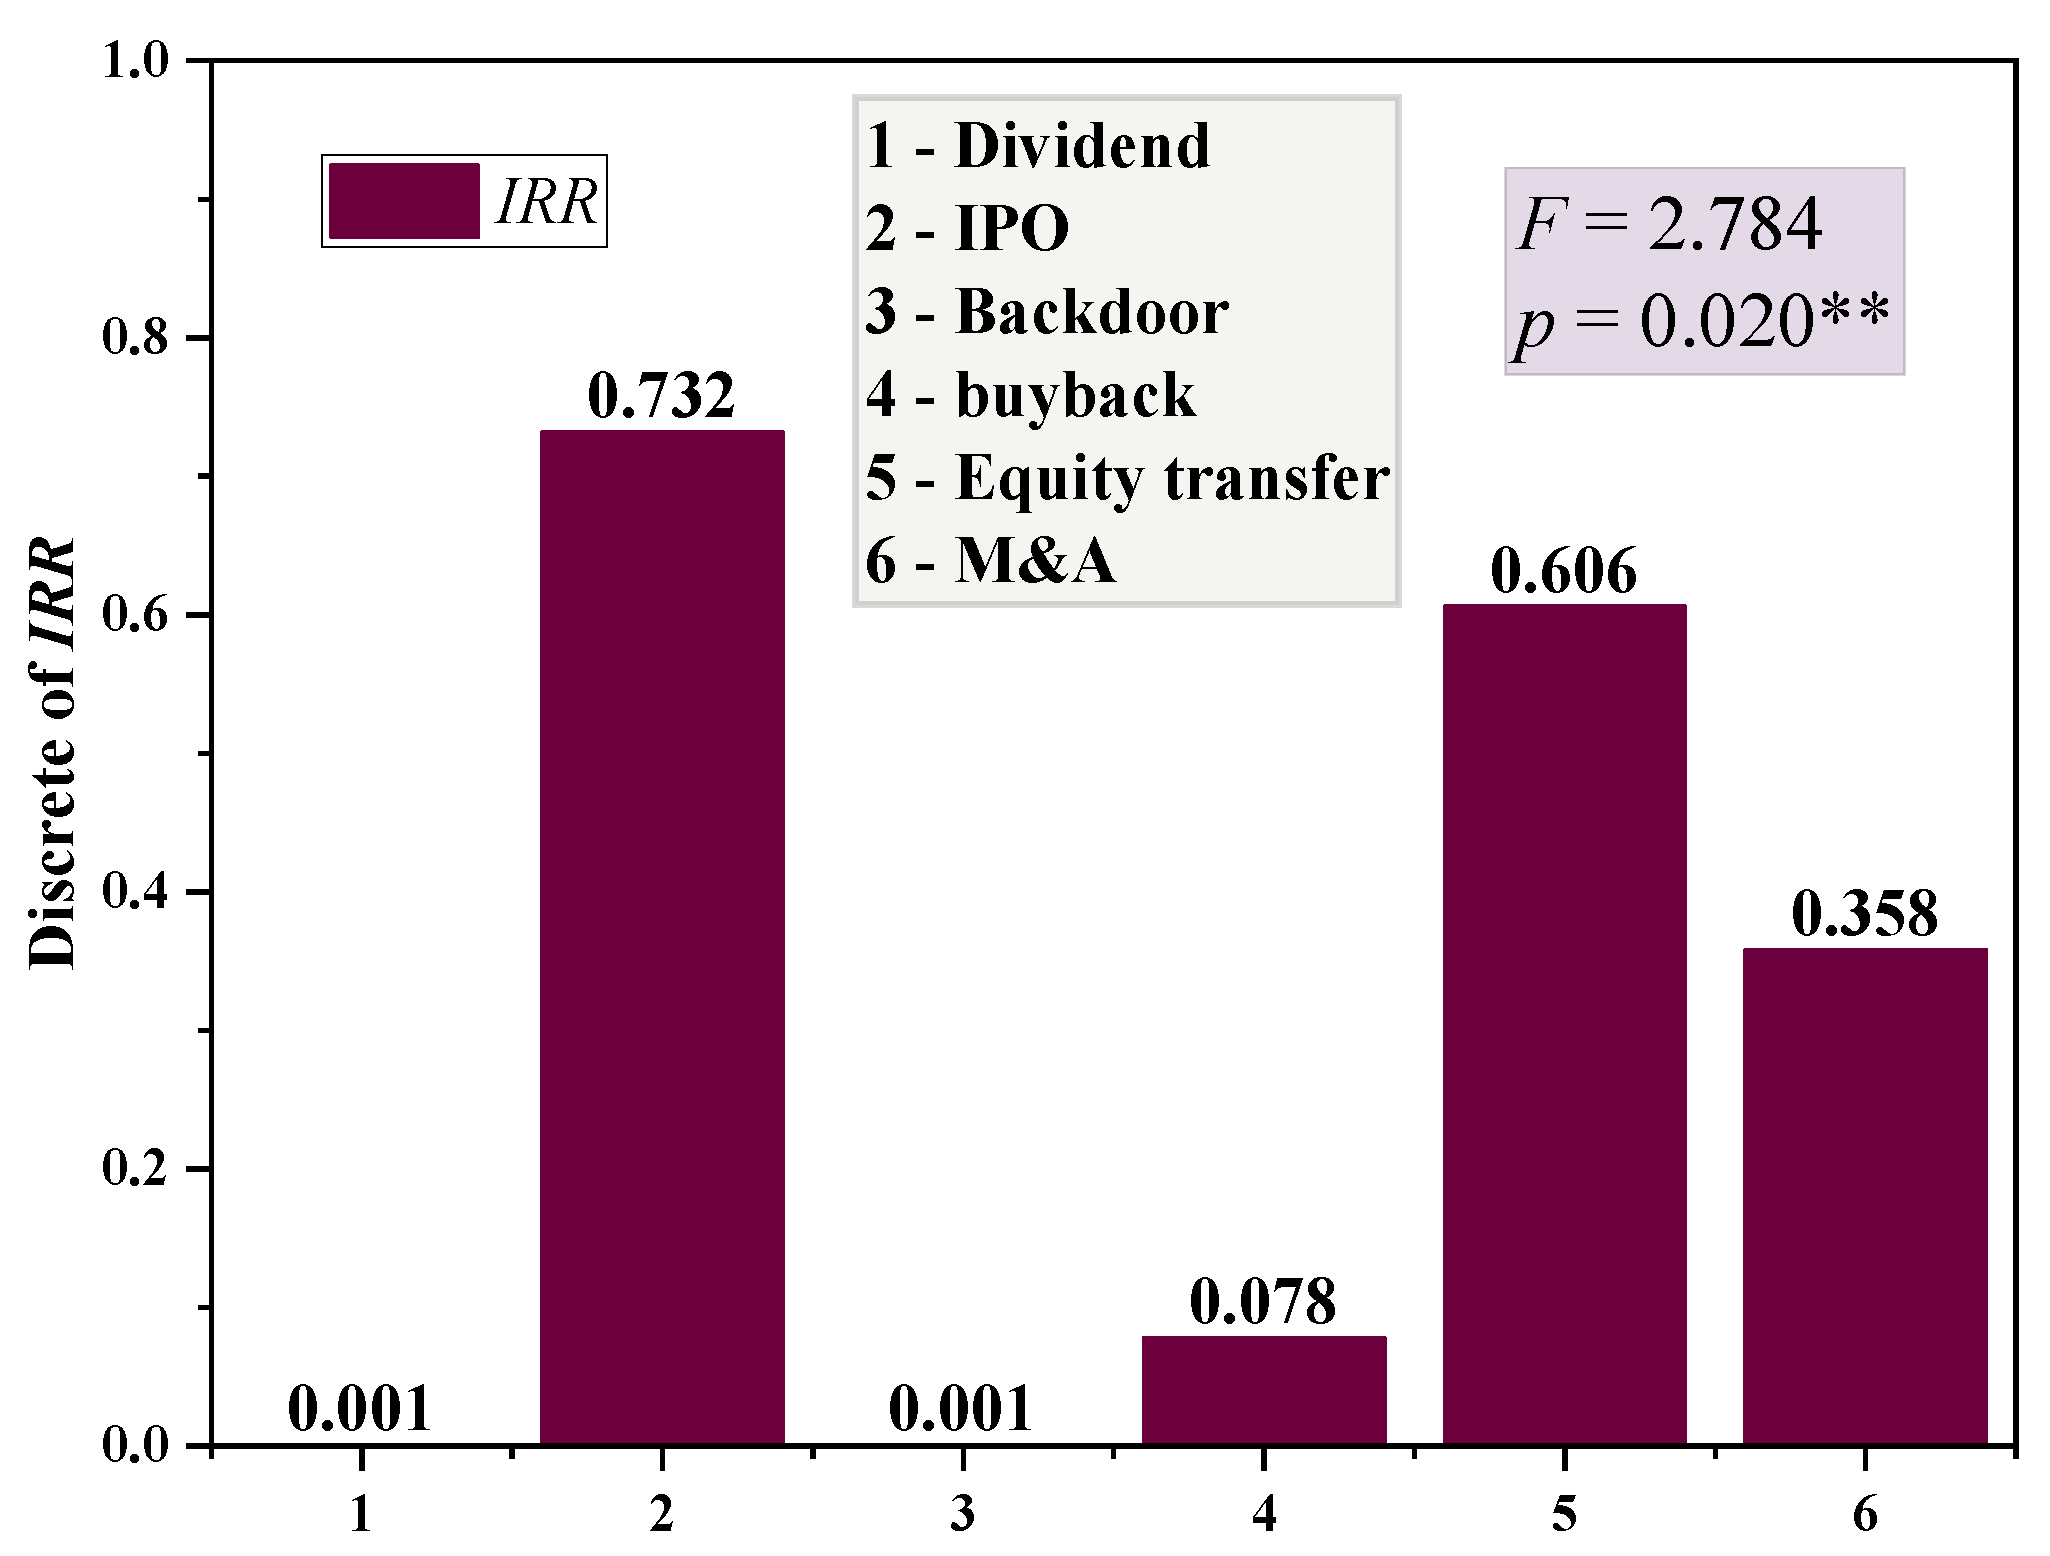
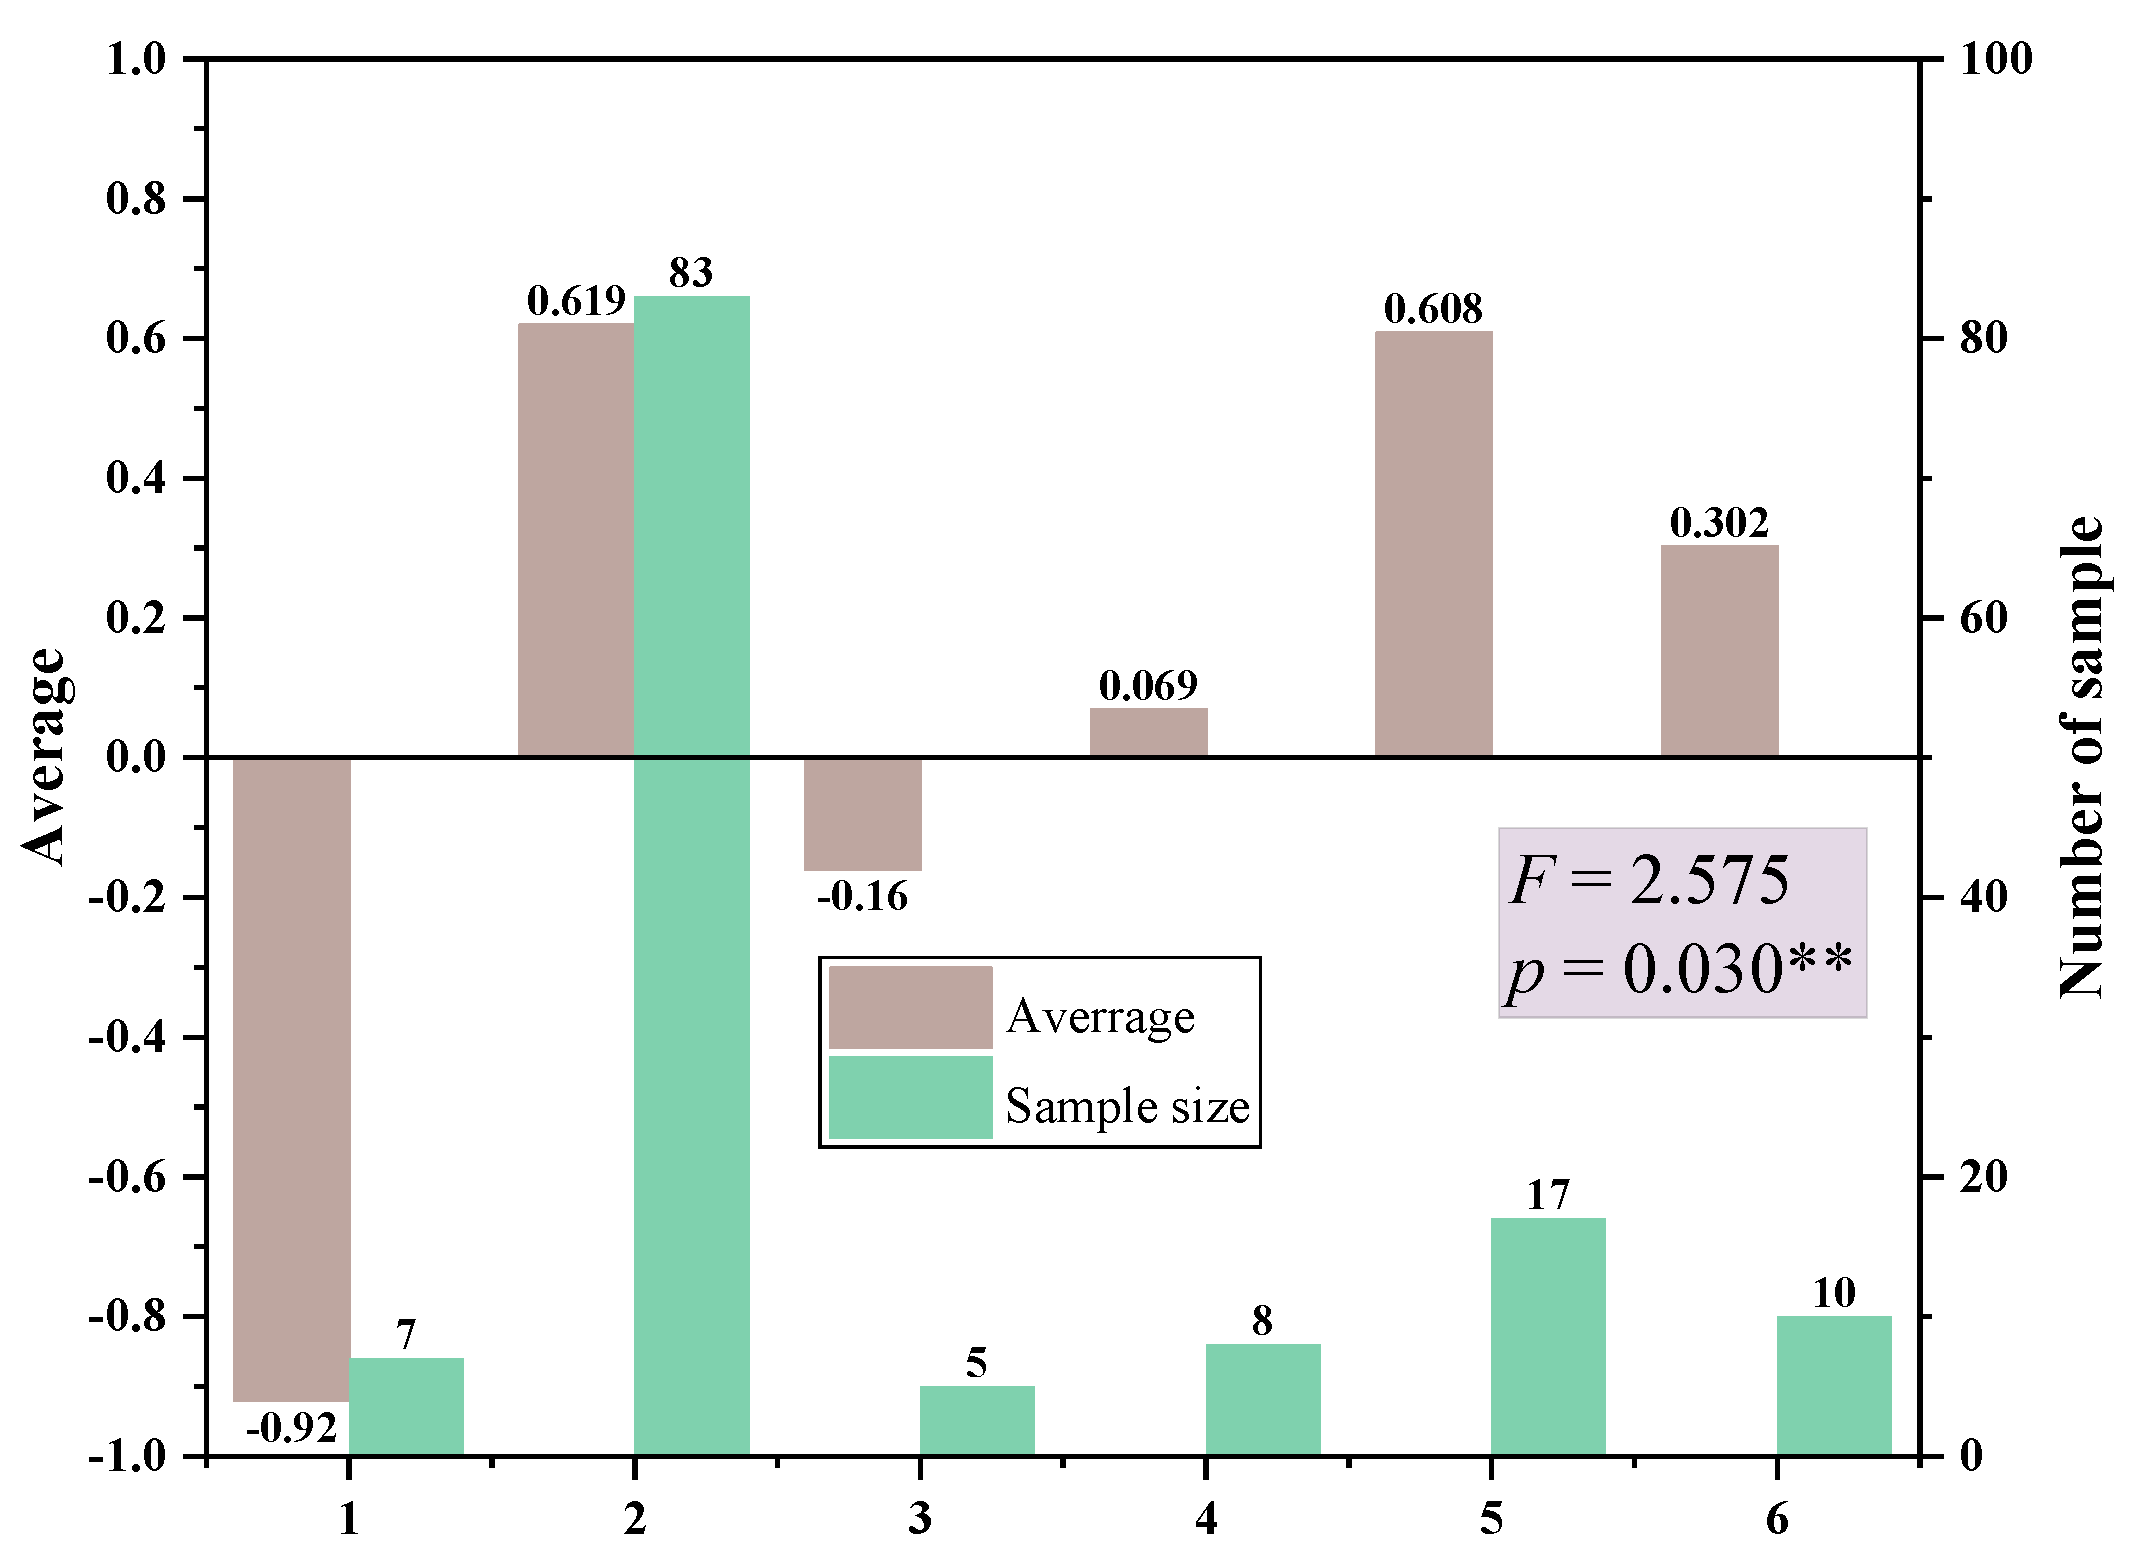
Figure 8, which exhibits significance at the 10% level, indicating that there is a significant difference in the investment stage. From the sample size of the investment, the later the stage of the VC project, the more likely the VC funds will invest. The same analysis was carried out for the exit type, and the analysis results are shown in
Figure 9 and
Figure 10. There are six main types to exit, including IPO, M&A, dividend, equity transfer, buyback, and backdoor.
It can be seen that the performance obtained after the investment is completed varies depending on the exit type. The lowest investment performance is obtained when the exit type is dividend or backdoor, and as seen in
Figure 10, there may even be negative performance. The highest investment performance is acquired when the exit type is IPO, followed by equity transfer. Significant
p-values likewise indicate that there is a significant difference in investment performance between the different exit types. In terms of the number of projects invested, two exit methods of IPO or equity transfer with high investment performance are more likely to be invested than those exited by other types.
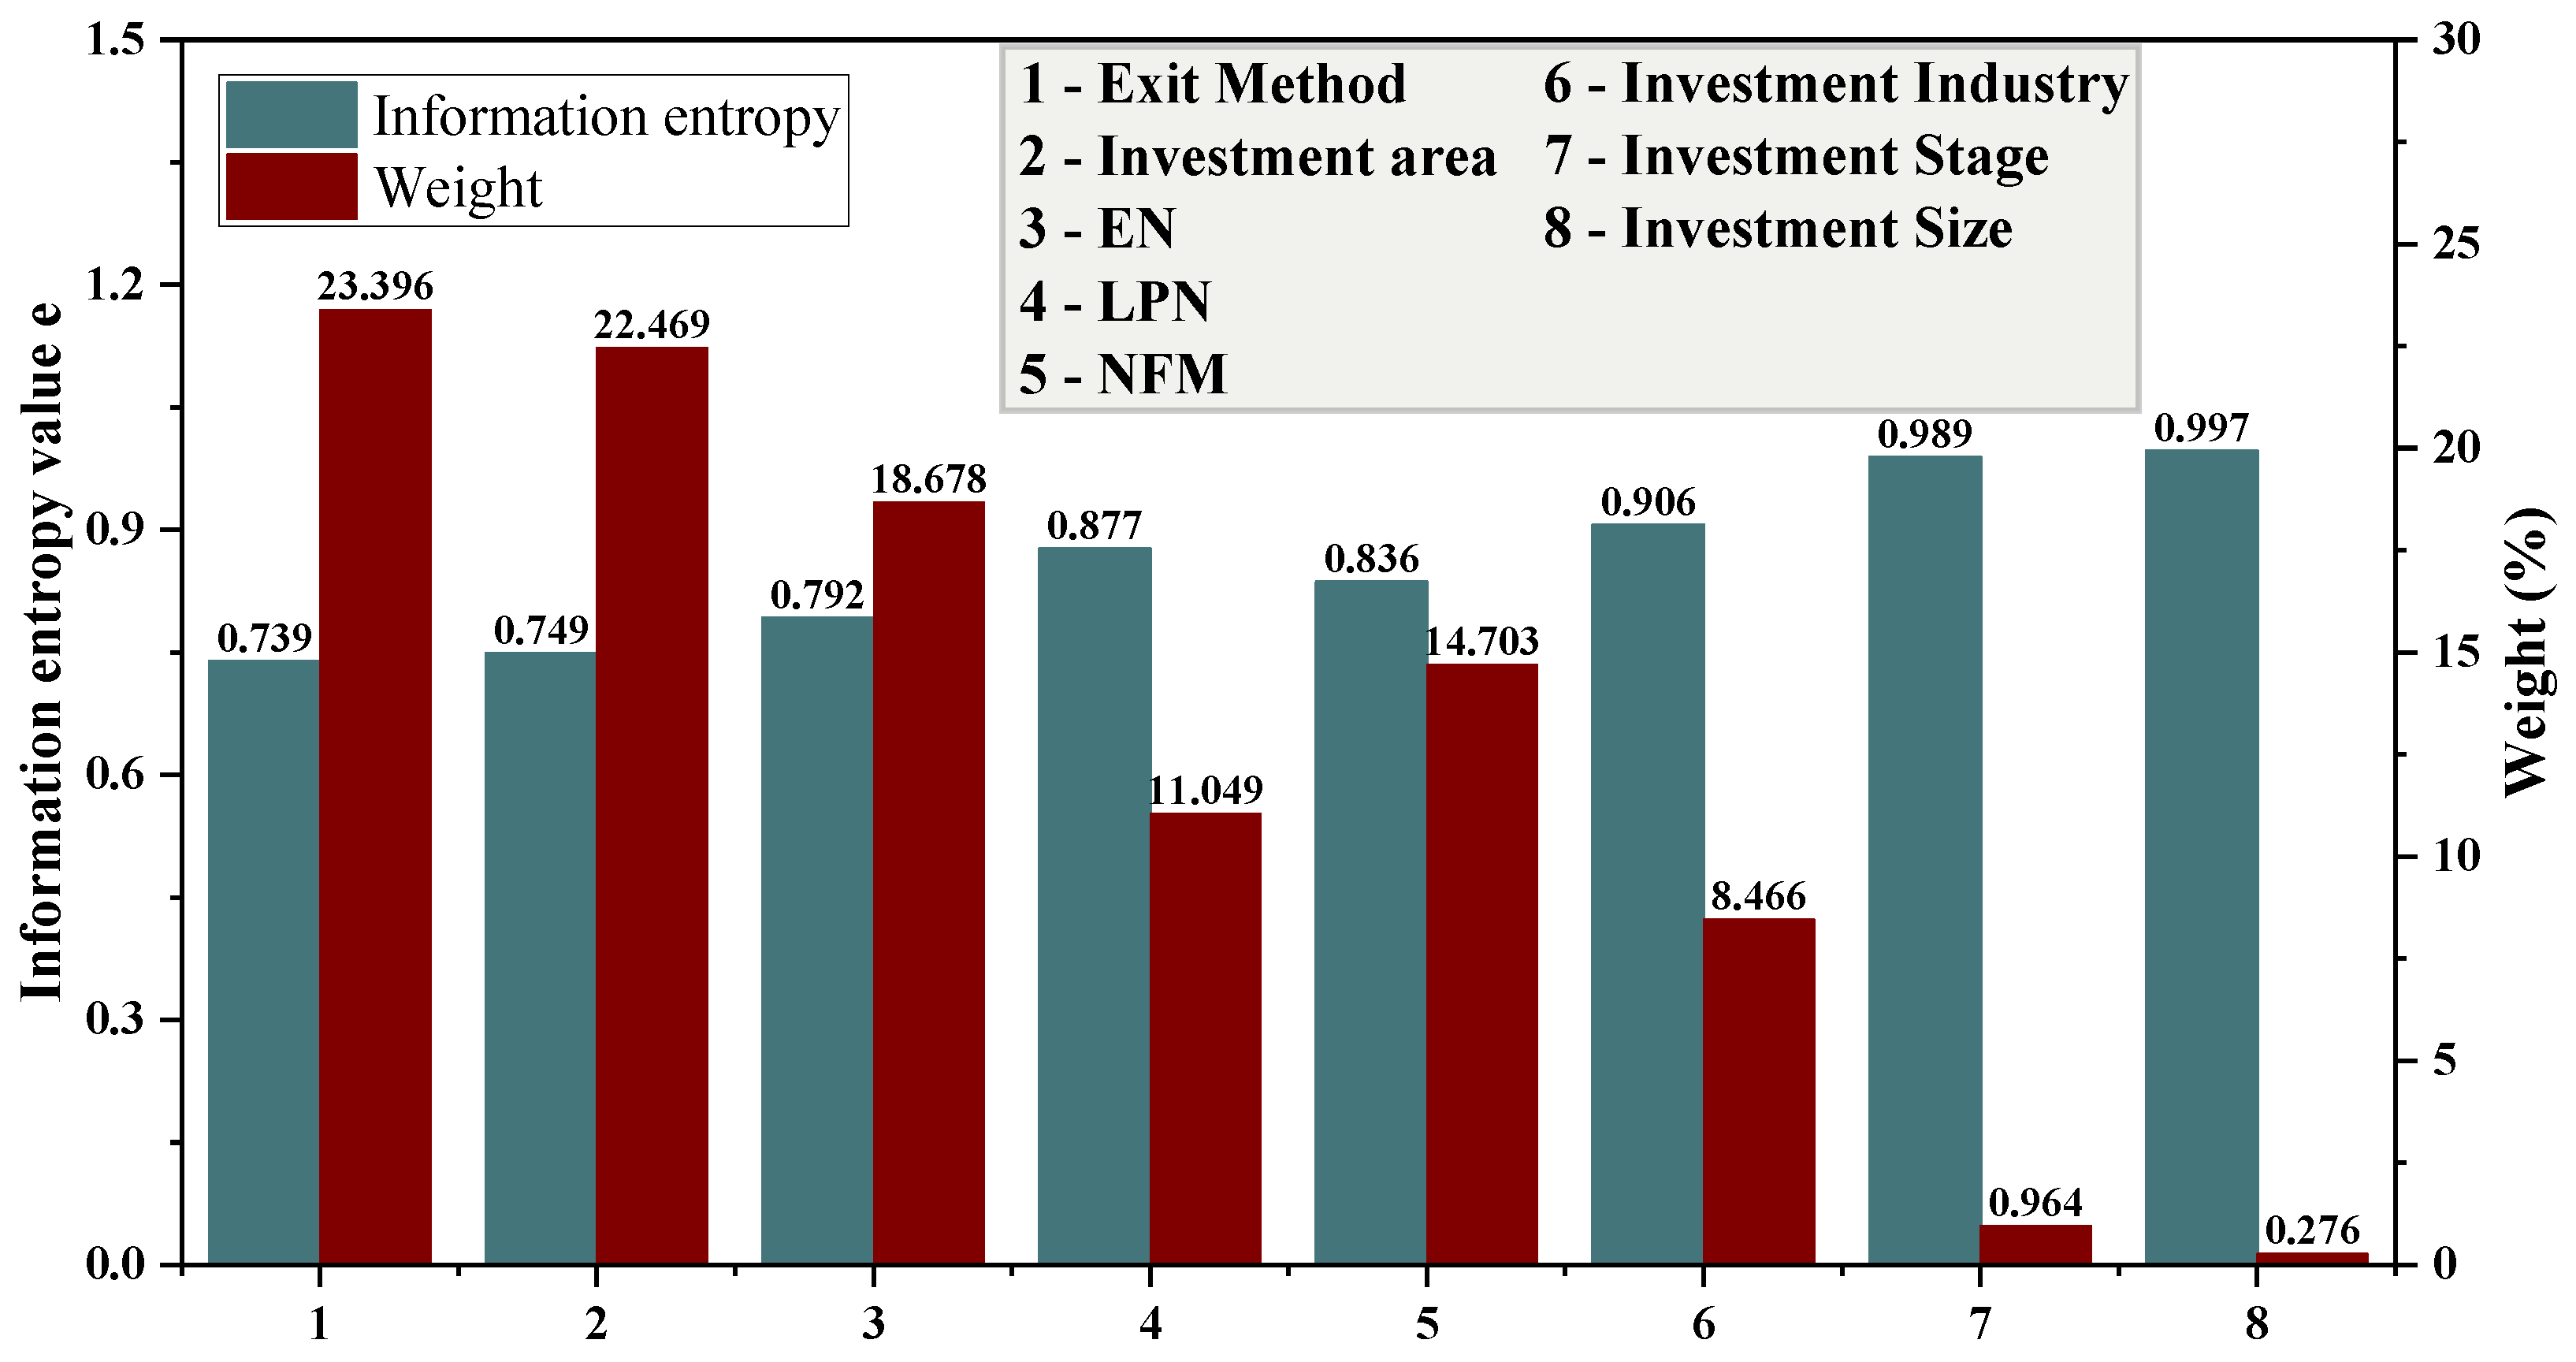
After completing the above studies, this paper comprehensively gives the weight of the impact of each influencing factor on investment performance obtained using linear regression and one-way ANOVA, as shown in
Figure 11. The three control variables were not added when calculating the weights because their types were single, and the obtained weights were 0%, so they were not considered.
Figure 11 shows that exit type has the greatest impact on investment performance, followed by investment area, suggesting that the type at the exit and the area of investment are some of the first issues that VC funds need to consider. To sum up, the main conclusions of the relationship between variables and investment performance are as follows:
There is a negative relationship between the investment size of VC funds and investment performance, and hypothesis 1 holds. There is a convex relationship between the number of funds under management and the investment performance of VC institutions, and hypothesis 2 partially holds. There is a significant effect of the project stage on investment performance, and hypothesis 3 holds. For the investment area, venture capitalists prefer to choose economically active areas and can obtain higher returns in economically active areas, i.e., there is a positive relationship between investment area and investment performance, and hypothesis 4 holds. The investment performance of projects in different industries also varies. VC funds tend to choose high technology or high added-value industries for obtaining higher performance, and hypothesis 5 holds. The performance obtained after the investment is completed varies by exit type, and the performance of funds exiting through IPO is higher than other types, and hypothesis 6 holds. There is no significant relationship between investment experience and VC performance. Empiricism may appear to affect the judgment of investment, so its investment performance is not easy to estimate, and hypothesis 7 does not hold. There is a positive correlation between the number of VC exits and investment performance, and hypothesis 8 holds. The number of limited partners has a significant impact on the performance of VC funds, mainly in a convex relationship, and hypothesis 9 is partially valid. Additionally, from the perspective of linear regression, the influence of the above factors on investment performance varies in the following order of influence: exit type > investment area > exit number > number of LP > number of funds under management > investment industry > investment stage > investment size. As a whole, the first five influencing factors occupy more than 90% of the weight, indicating that the weight distribution of different influencing factors is too concentrated.
5. Performance Forecasting Model
After obtaining 130 sets of sample data, it is observed that the variables have large variability in units and values, which usually required standardization before modeling. In this paper, all functions were implemented in MATLAB language, and the standardization method used was to normalize the data to eliminate the effects of units and magnitudes. The core idea is to map all data to the range of 0~1 through the maximum and minimum values, which is more conducive to the operation of the data and improves the accuracy of the model while transforming the dimensionality to dimensionless. The normalized data were randomly divided into two groups, one as the test set and one as the training set. According to the requirements, 120 sets of data were randomly selected as the training set, and the remaining 10 sets were used as the test set. These randomly grouped data were used for all models to facilitate the performance comparison among subsequent models. To address the uneven distribution of the dependent variable data at different levels, the createDataPartition function was created to partition the data, and later random sampling was performed. The advantage of this method is that the function is similar to stratified sampling so that a random portion of the data from each level of the dependent variable can be selected to form the training set, making the training and testing of the model more scientific. It is important to note that the impact of each variable on investment performance has been obtained in the previous section; therefore, only factors that have an impact on investment performance were selected for modeling here, i.e., 8 impact factors including investment size, number of LP, exit type, number of funds under management, exit number, investment industry, investment area, and investment stage were selected.
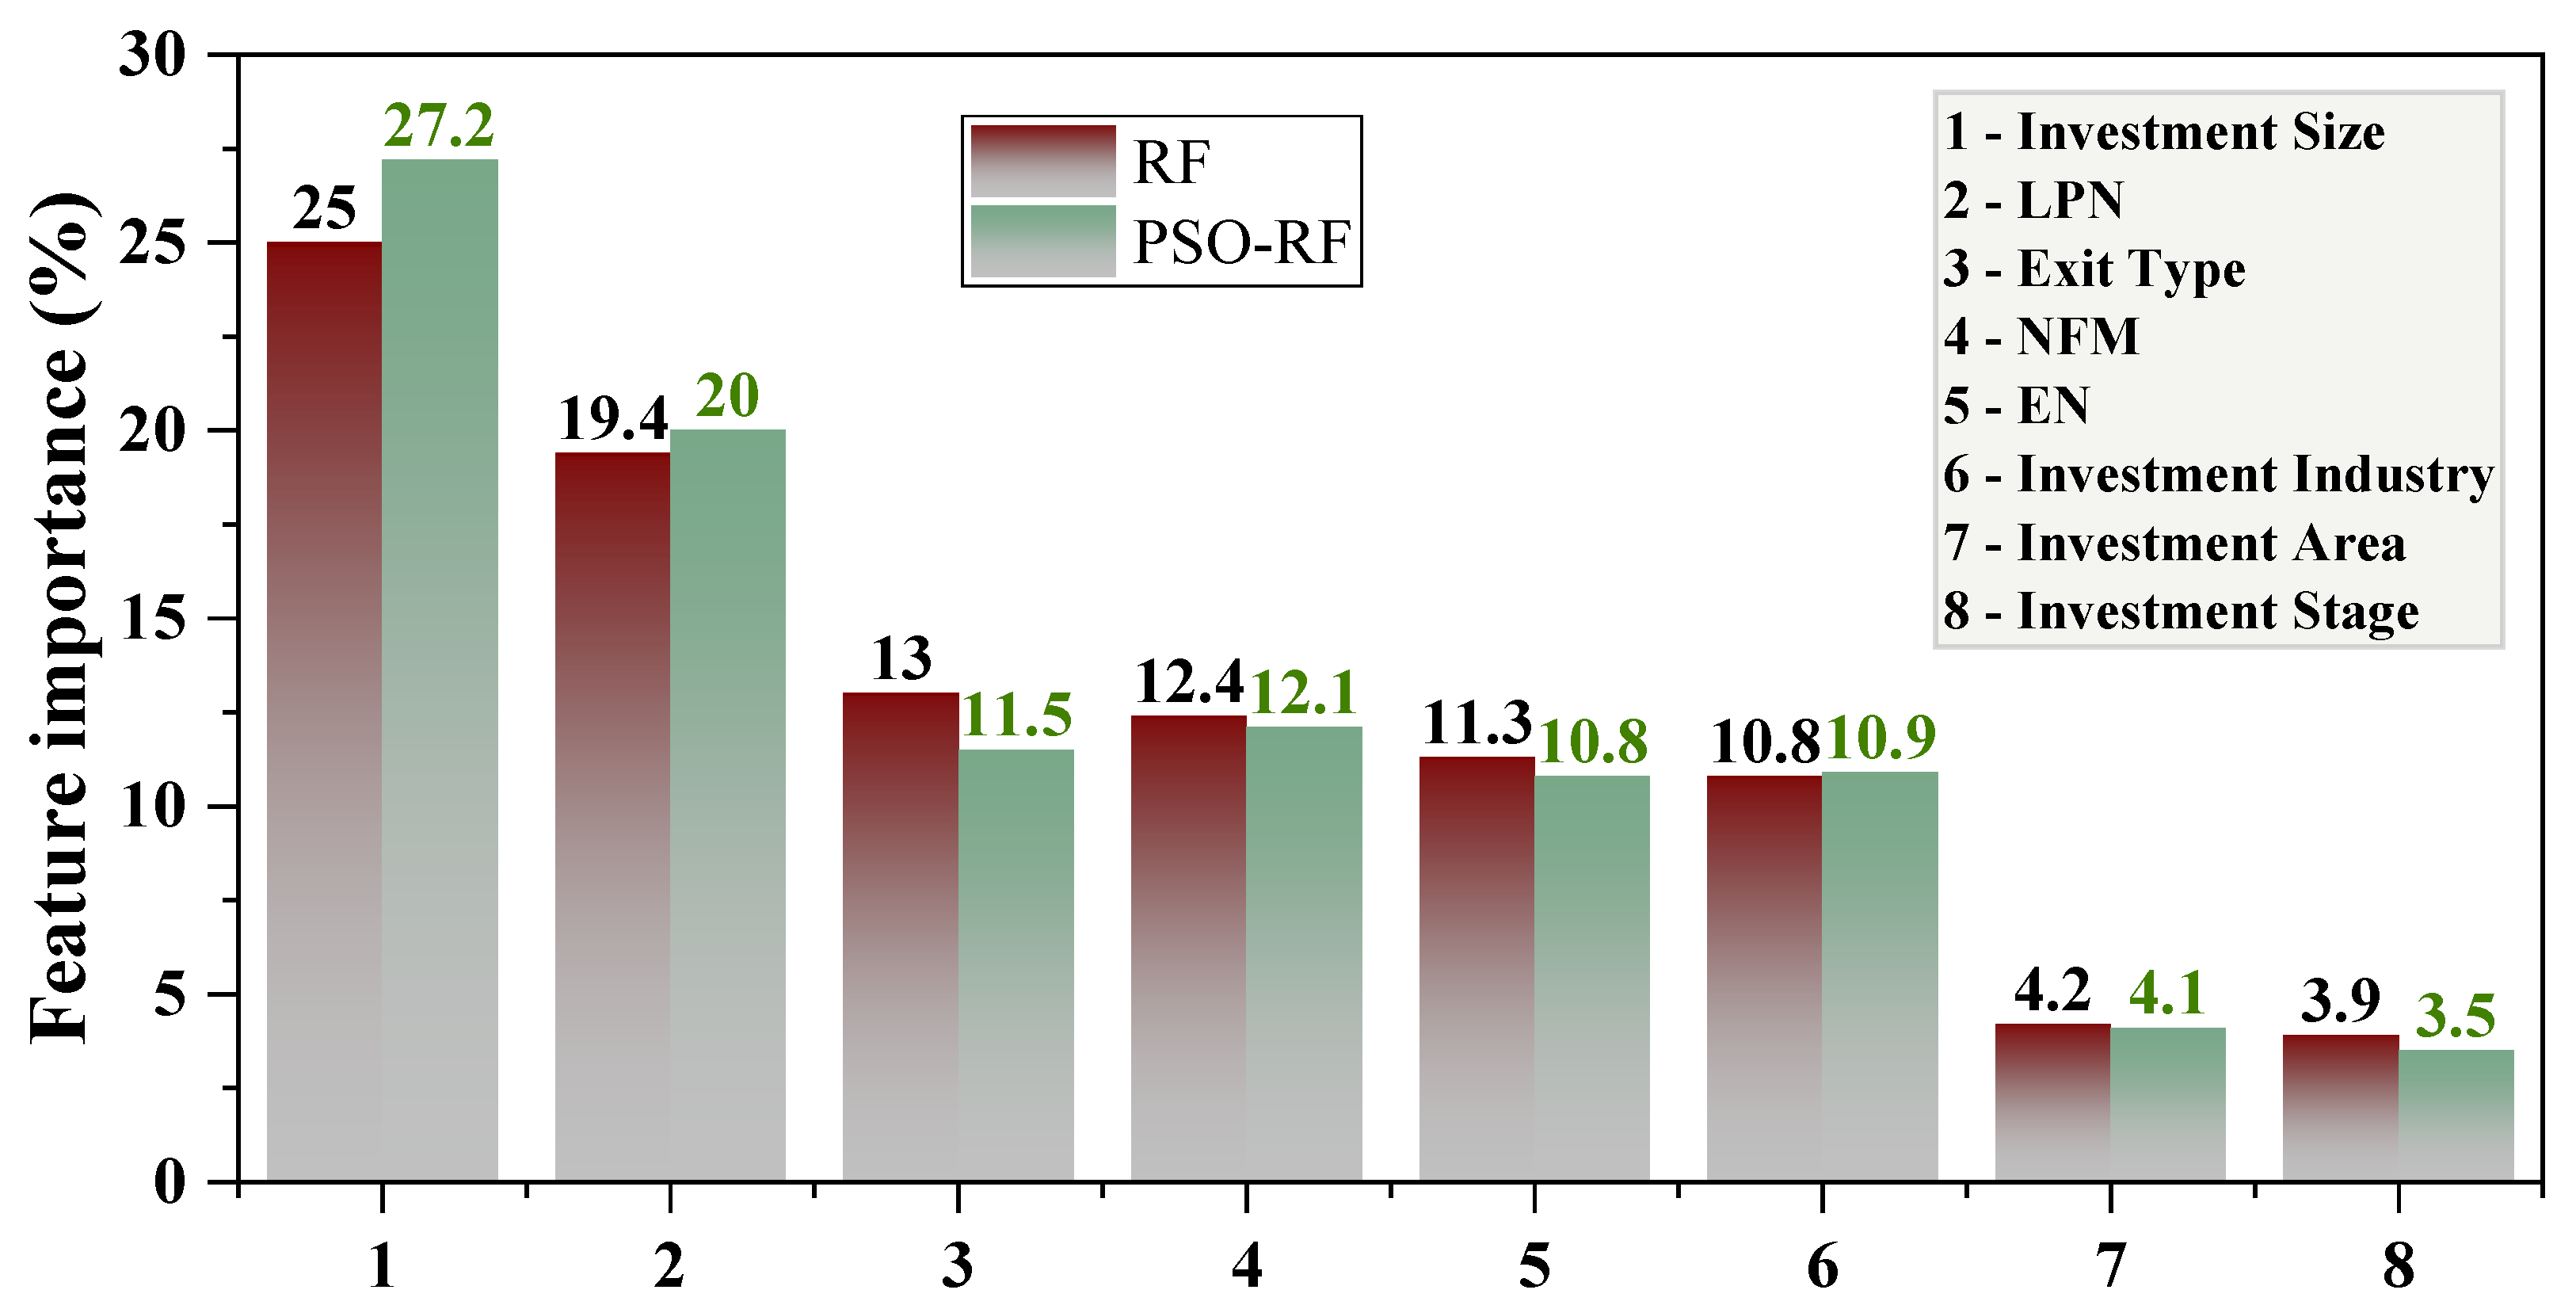
The findings in the existing literature suggest that the traditional multiple linear regression model has a poor-fitting effect on VC funds and cannot accurately predict future performance. To find better prediction models for VC fund performance, this paper compared various ML-based algorithms to build regression models on sample data. When modeling with RF algorithm and PSO-RF algorithm, it not only can predict the relevant results but also can output the importance ranking of variables, helping analyze the influence degree of various variables on the performance of VC funds from a nonlinear perspective. The variable importance obtained after building the RF model and PSO-RF model is presented in
Figure 12.
From a nonlinear perspective, it can be seen that investment size (reaching 25%) has the greatest impact on the performance of VC funds, followed by LPN, exit type, etc., and the investment stage has the lowest impact. On the whole, the importance distribution of different impact factors is relatively balanced, and the weight does not appear to be concentrated in a few impact factors. The variable importance rankings obtained by various regression methods are relatively different. The top three influencing factors in linear regression are exit type, investment area, and EN, while the top three influencing factors in nonlinear regression are investment size, LPN, and exit type, which illustrates that the exit type is an important factor no matter what method is used to return. The PSO was used to optimize the uncertain results due to the randomness of the number of feature variables and the number of trees. It is found that the importance ranking of the features before and after optimization is basically the same, and only some variables showed slight changes, which indicates that the model based on the RF algorithm has certain stability. In addition, the weight of each influencing factor after optimization is more discrete than before optimization, which proves that there may be an over-optimization phenomenon that needs to be further studied. Although RF can solve the regression prediction problem, it cannot output a continuous type value and make predictions beyond the range of the training set data, which leads to overfitting when modeling data with some heterogeneous points. In contrast, the ELM can solve this problem well. ELM also suffers from the problem of the randomness of weights and thresholds, which is also optimized in this paper using the PSO. The explanatory strength of each regression model built with the training set data is shown in
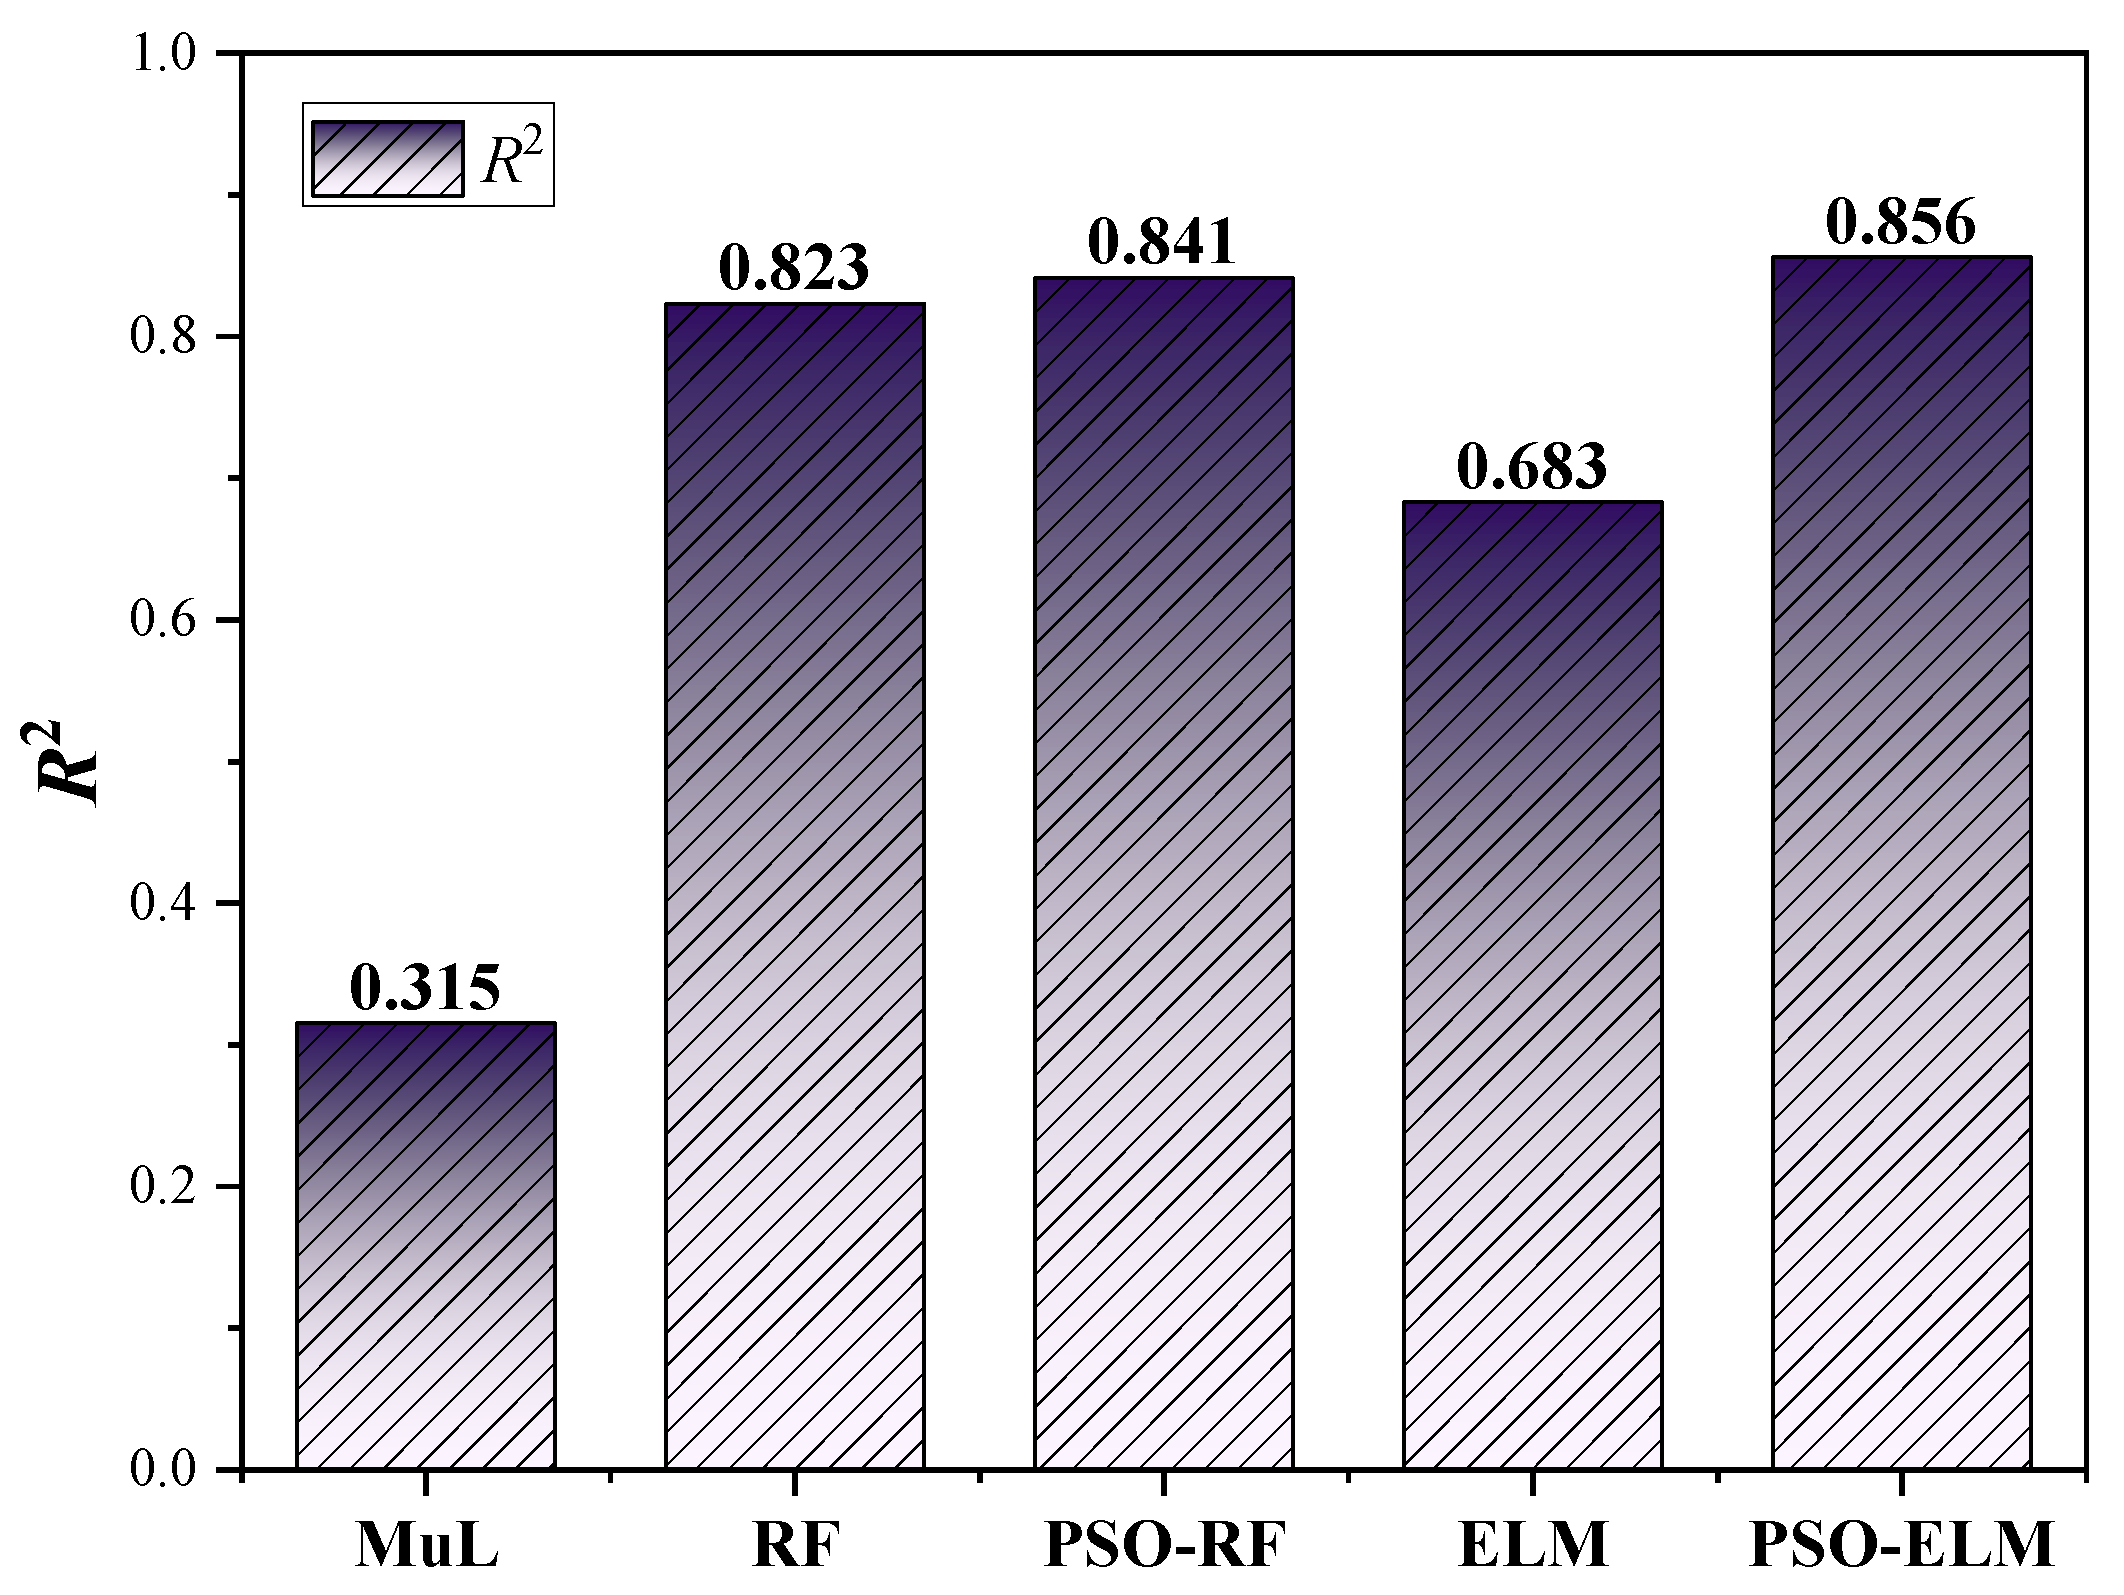
Figure 13.
Among the five regression models, the PSO-ELM model has the best fit with an R
2 of 0.956, which means that this training model explains 95.6% (≈100%) of the performance of VC funds significantly better than the traditional multiple linear regression model (R
2 = 0.315). The models based on the RF algorithm also fit better, with R
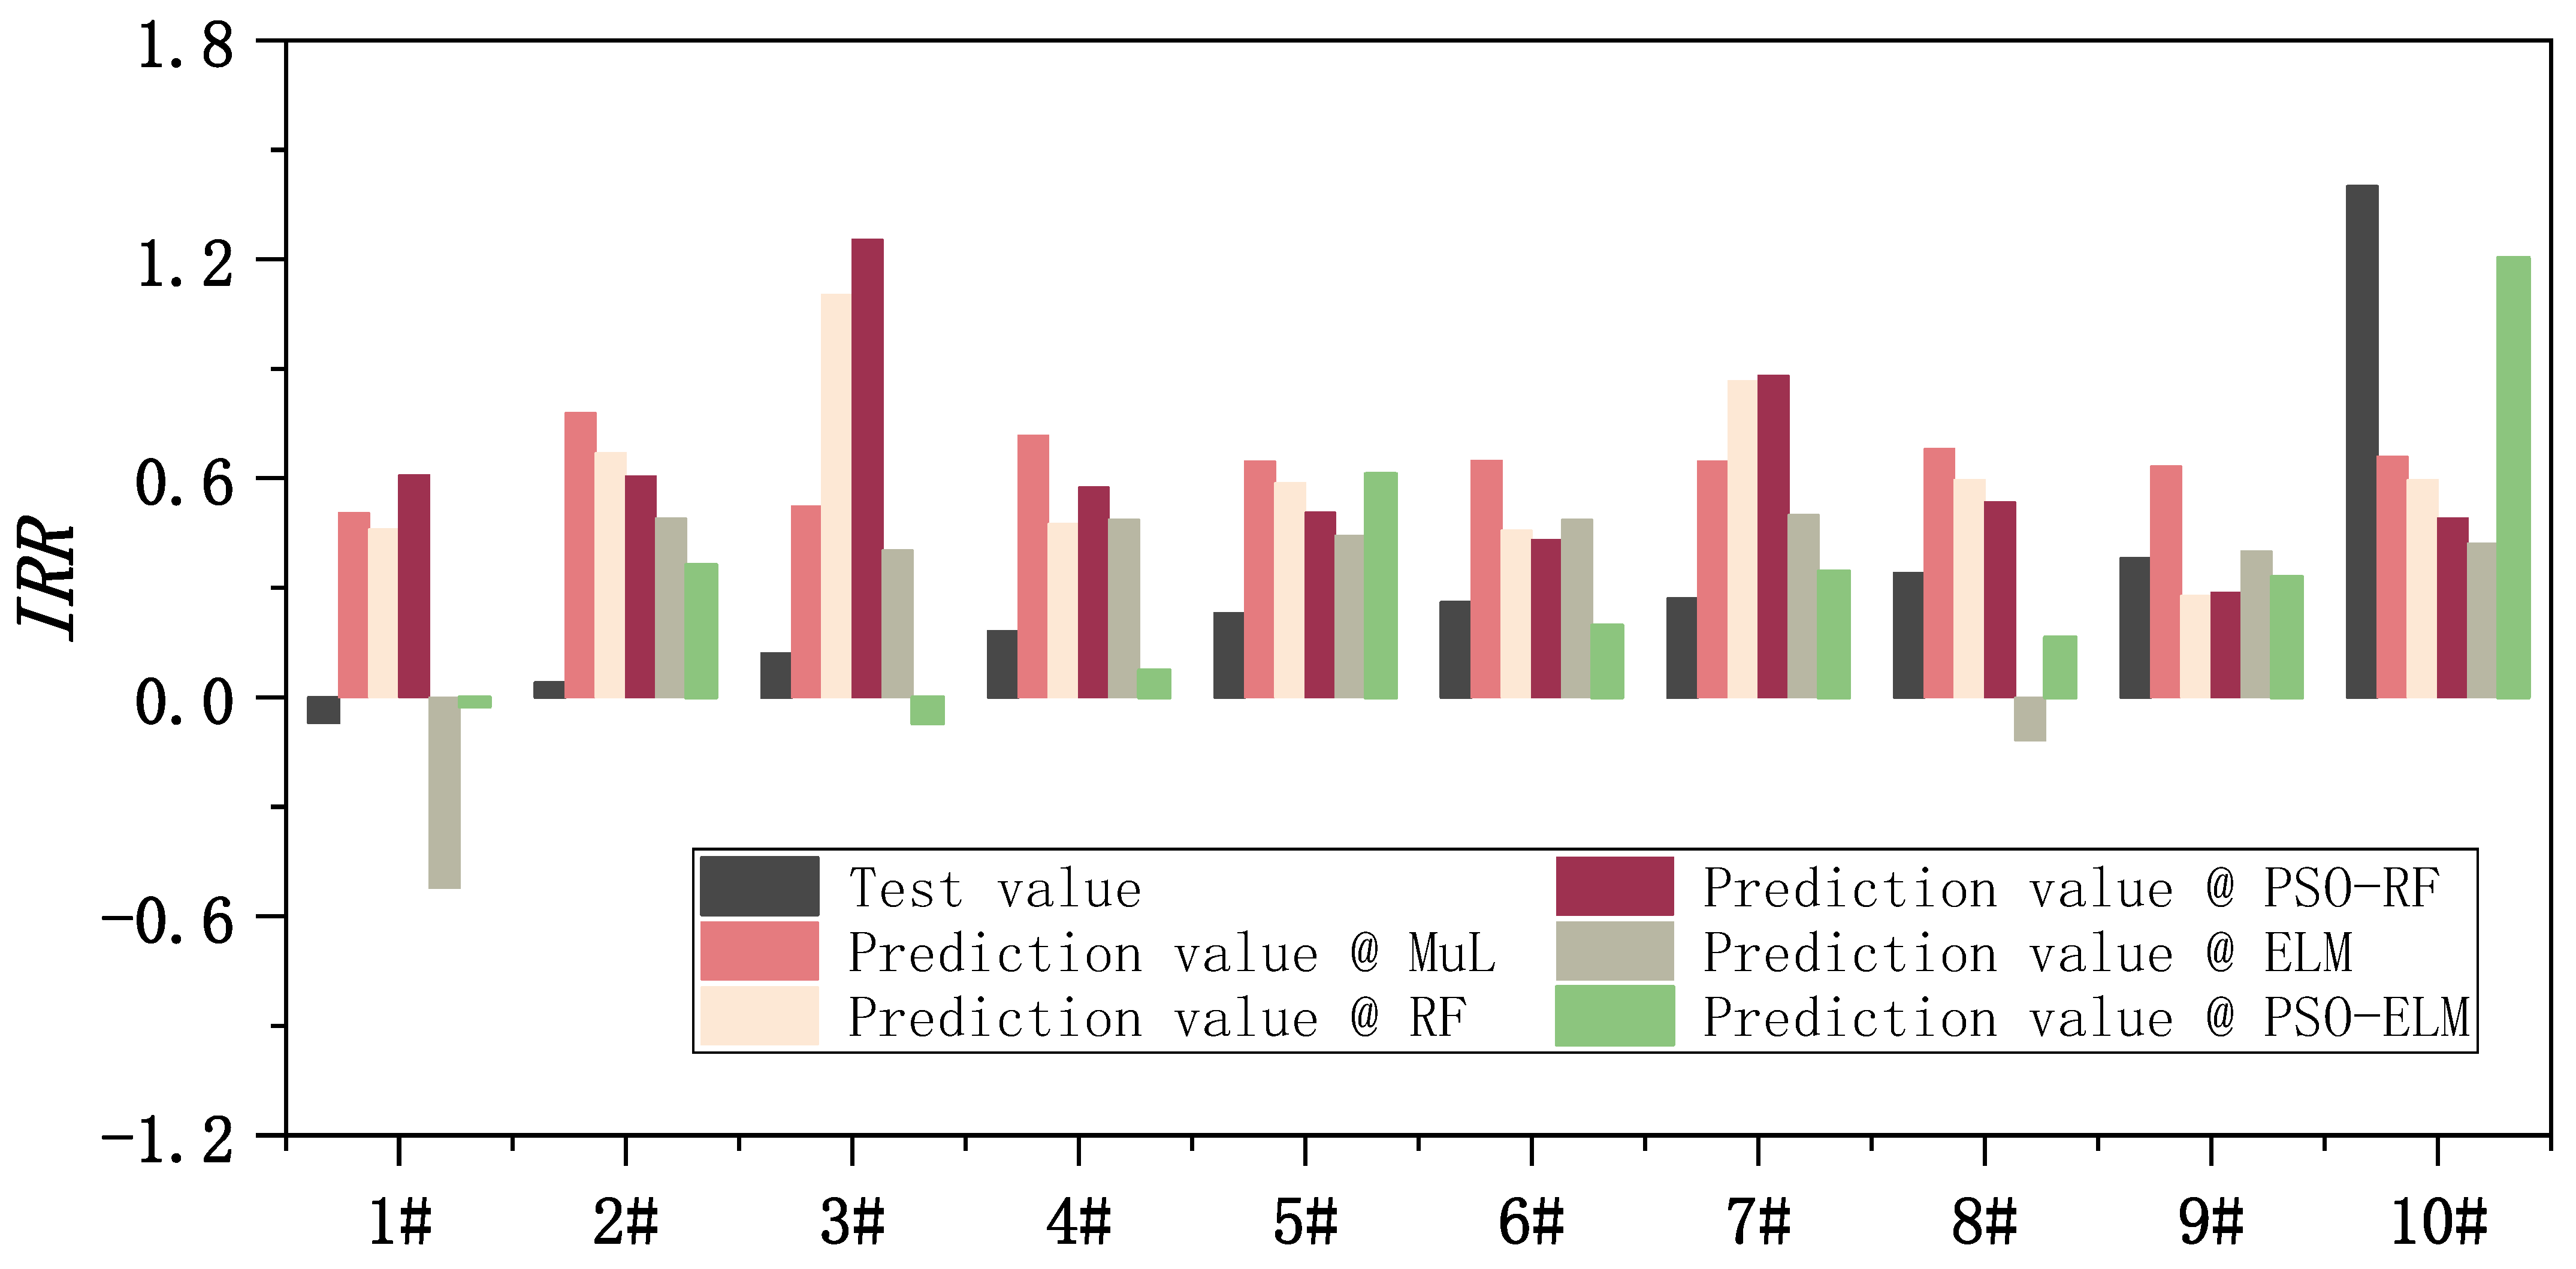
2 above 0.82. The above results indicate that the nonlinear regression is strong in explaining the performance of VC funds in the training model. After the model is established, the data from the previously divided test set were used to perform regression predictions for each of the five regression models established, and the test data and investment performance prediction results for different regression models are shown in
Figure 14.
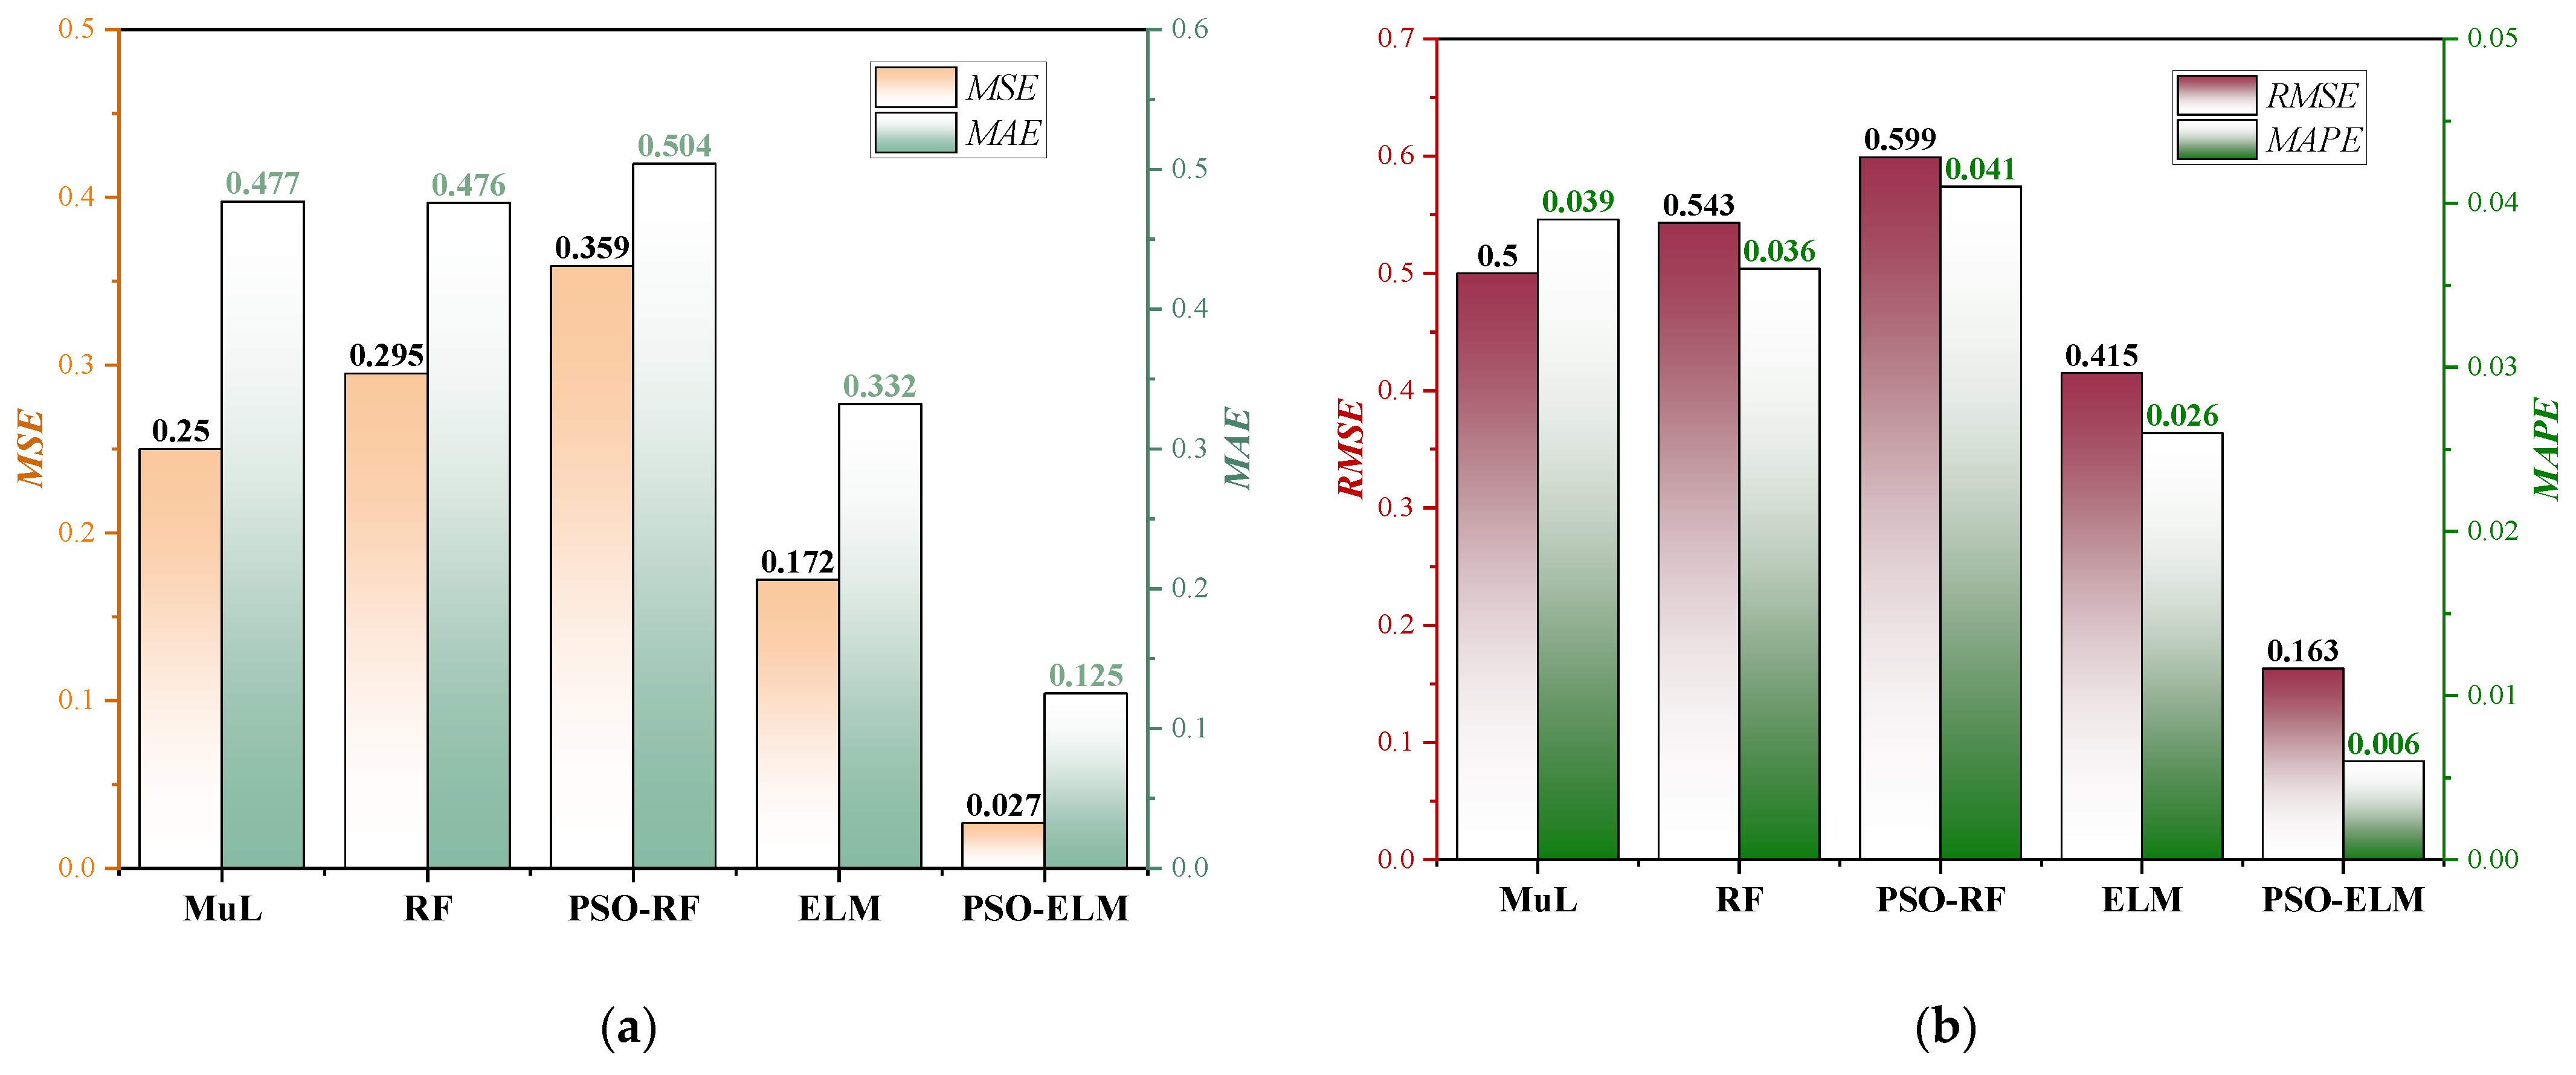
Comparing the test data and the prediction results of different ML models, only the prediction results of the PSO-ELM model are closer to the test data, which illustrates the excellent prediction performance of the model. Four quantitative evaluation indicators such as MSE, RMSE, MAE, and MAPE were used to further compare and characterize the accuracy and reliability of the five models. The results are shown in
Figure 15.
Among the five regression models, the LR model has the worst prediction effect, indicating that the impact factor of VC funds on its performance is nonlinear. Additionally, the prediction effect of the PSO-RF model is inferior to that of the unoptimized model and appears to be overoptimized, which explains the more discrete importance of the features after optimization. The error performance metrics of the RF model and PSO-RRF model exhibit some regression prediction capability, but the accuracy is worse than that of the ELM model and PSO-ELM model. In contrast, all the de-checking performance indicators of the proposed PSO-ELM model are close to 0. These four quantitative evaluation indicators indicate that the PSO-ELM model is accurate and reliable in predicting investment performance, but there is still room for improvement.
6. Discussion
On the whole, the investment performance of VC funds in China is much higher than the public market returns. However, in recent years, with the openness and transparency of information, the investment performance of VC funds exhibits a trend of fluctuation and decline, and the dispersion coefficient of investment performance is greater in high technology and high added-value industries with higher investment propensity. This indicates that the advantages of China’s VC market compared to the public investment market are shrinking, and the investment risks are increasing, so investors need to invest with caution.
The research in this paper shows that evaluation factors of venture enterprises to VC institutions play an important role in VC decisions and is empirically investigated with data from VC funds in China. The stage of venture enterprise has a significant impact on investment performance, which is consistent with the general view of VCs that investment in startups is riskier [
30]. This paper uses a variety of methods such as one-way ANOVA and ML prediction model to determine which industries are more favorable and which characteristics have a greater impact on investment performance. By analyzing 11 unique types of startups and 9 unique types of characteristics, it can help us more comprehensively understand the impact of industries and characteristics on investment performance, rather than a deeper study of the single characteristic of enterprises [
31,
32]. For example, VC prefers high technology and high added-value industries and has always invested more in economically active regions [
33,
34]. It is worth noting that the investment performance of VC funds changes continuously with the changing VC environment and corporate investment philosophy, and therefore the investment performance of VC funds needs to be evaluated periodically. The performance of VC funds varies with the development of the industry, and a strong focus on certain qualitative or quantitative characteristics may lead to a shift in preferred investments when these characteristics are more prevalent in certain industries. For example, the choice of investment region is critical for VC, and the importance of investment region is changing with the rapid growth of China in recent years [
35]. If the LP has many years of relevant professional experience in the investment industry, and this experience brings more added value to the investment, then this favorable factor will provide a greater tilt to the VC investment [
36].
To further investigate the relationship between influencing factors and investment performance, a MuL regression algorithm, and different ML algorithms were chosen to be explored. There may be better models in terms of investment performance prediction and characterization of feature importance. Although a small sample size was used in the model, under the premise of considering multiple characteristics at the same time, the results of the model are sufficient to satisfy the hypotheses, i.e., the evaluation factors of venture enterprises to VC institutions have a significant impact on VC decisions.
7. Conclusions
There are many methods to evaluate the performance of VC funds, and each VC institution may have a distinct approach. Based on the bilateral matching principle between VC institutions and venture enterprises, this paper discusses the factors influencing the investment performance of VC institutions from the perspective of venture enterprises and makes an empirical study on this basis. The research results show that the ML model has suitable robustness in solving the performance of VC funds and thus can be used to support the investment decisions of VC institutions. A total of 130 VC fund investment projects exited between 2008 and 2020 in China were used as research objects, and the factors influencing the investment performance of VC funds in China were explored in depth from linear and nonlinear perspectives, and various ML algorithms were further applied to establish a regression prediction model of VC fund performance to provide investment advice to investors. The main research findings are as follows.
There is a negative relationship between the investment scale of investment projects and the performance of venture capital funds. The number of funds under management, the investment stage, and the exit method have significant effects on the performance of venture capital funds. There is a positive relationship between the investment region and the investment performance of venture capital funds. Additionally, there is a significant difference between the investment performance of investment projects in different industries, and venture capital funds tend to choose high technology or high value-added industries. In contrast, there is no significant relationship between the investment experience of venture capital institutions and investment performance. Moreover, the number of limited partners and the investment performance show a convex relationship.
This paper proposes a method for establishing a performance prediction model for VC funds using ML algorithms. A hybrid algorithm using RF algorithm, ELM algorithm, and optimization of both with PSO is proposed to construct the prediction model and train the model, and then predict the performance of VC funds using the standardized processed impact factor data. A total of 130 sets of sample data were used to establish the model training and prediction data sets, 120 of which were randomly selected using the stratification principle to build the training model, and the remaining 10 random samples were used as test samples, and the reliability and accuracy of the above 4 ML models and MuL regression models were validated and compared. The evaluation and comparison results show that the nonlinear model is closer to the actual situation of VC. The proposed hybrid PSO-ELM model shows excellent performance in predicting the performance of VC funds because of its low error value (close to 0) and high R2 value (close to 1). In contrast, the traditional linear regression model is inaccurate and unstable. Therefore, it is important to combine ML algorithms to improve VC fund performance.
The education level of VC fund managers also has an important impact on investment performance [
37]. Considering the small sample size that includes factors of education and relationship networks of venture capital fund managers and characteristics of different time periods, it would make the results of the study not generalizable. Therefore, these characteristics were not included in the explanatory variables in this study, which is one of the focuses of the subsequent research work. In addition, the effects of the explanatory variables will be further explored in the subsequent research work.


