
Supply Chain Recovery Strategies for High Demand Products Based on the Impact of Capacity and Transportation Disruptions


1
Department of Modern Business Research Center, Zhejiang Gongshang University, Hangzhou 310018, China
2
School of Management Engineering and E-Business, Zhejiang Gongshang University, Hangzhou 310018, China
3
School of Statistics and Mathematics, Zhejiang Gongshang University, Hangzhou 310018, China
4
Academy of Zhejiang Culture Industry Innovation & Development, Zhejiang Gongshang University, Hangzhou 310018, China
5
School of Business Administration, Zhejiang Gongshang University, Hangzhou 310018, China
*
Author to whom correspondence should be addressed.
Systems 2022, 10(4), 88; https://doi.org/10.3390/systems10040088
Submission received: 6 June 2022
/
Revised: 12 June 2022
/
Accepted: 25 June 2022
/
Published: 28 June 2022
(This article belongs to the Section Supply Chain Management)
Abstract
:The outbreak of the COVID-19 has had a huge impact on the manufacturing supply chain, especially the supply chain of high-demand products, and is mainly reflected in the double interruption of production capacity and transportation. The research aims to use system dynamics to explore how government subsidies can play a role in supply chain recovery when government subsidies are limited, which provides a new idea for improving supply chain management. In order to explore the impact of government subsidy strategies on supply chain recovery in the context of supply chain disruptions, this paper takes high-demand products during the epidemic as the research object, and takes the government’s subsidy choices under the impact of production capacity and transportation disruptions as the entry point for recovery strategies. The cumulative total profit of chain members is used as a judgment indicator, and systems dynamics is used to conduct modeling and simulation to build a secondary supply chain for manufacturers and distribution centers and simulate eight scenarios of different levels of production capacity and transportation interruptions, clarifying the impact of government subsidies on supply the impact of chain recovery. The research results show that, for secondary supply chains, whether in the scenario of partial or complete transportation interruption, government subsidies to manufacturers make supply chain recovery more effective, government subsidies do not have an immediate recovery effect during production capacity and transportation interruptions, and that under the complete interruption of production capacity, the cumulative total value of the supply chain after increasing government subsidies has rebounded in a spiral.
1. Introduction
Supply chain disruptions are unexpected events that have received much attention over the past decade, as they can severely affect supply chain performance [1]. Supply chain risk can be divided into operational risk and disruption risk [2,3,4]. Operational risk is related to day-to-day disruptions in supply chain operations, such as delivery cycles and demand fluctuations, while disruption risk concerns low-frequency, high-impact events, such as natural disasters such as earthquakes and tsunamis. In 2011, the tsunami in Japan had a huge impact on global supply chains. The COVID-19 that broke out in December 2019 is a particular case of supply chain risk. It has three distinct characteristics: high uncertainty and long-term disruption; chain reactions after supply chain disruptions; and supply, demand, and infrastructure were affected at the same time [5]. In addition, due to the implementation of strict epidemic prevention and control policies in some countries, a considerable number of workers have been forcibly isolated, roads have been blocked, and the production efficiency and transportation efficiency of enterprises have declined, which has further aggravated the degree of capacity interruption and transportation interruption. Almost all industries have been affected by the COVID-19 outbreak, but the extent of the impact depends on the nature of the product, such as high-demand products [6,7,8]. For example, demand for some products such as toilet paper, hand sanitizer and sanitizer, food and medicine rose significantly, while demand for other products such as clothing and sporting goods fell sharply. The impact of the pandemic has been more pronounced on high-demand products, which are essential to everyday life. The global spread of the coronavirus pandemic has caused multi-faceted disruption risks to the global supply chain, which further reflects the vulnerability of the global supply chain when the disruption risk occurs. Therefore, the supply chain recovery strategy is of great significance to global economic recovery and corporate profitability. Xiang Li et al. [9] established a two-layer Stackelberg game model to analyze the intervention effect of government subsidies in the supply chain; Yong Liu et al. [10] established a two-layer supply chain model to analyze the coordination mechanism between government subsidies and enterprises; David Bonilla et al. [11] studied the role of government subsidies in the construction of green supply chains. At present, the impact of government subsidies on supply chain interruption recovery is rarely considered in the current research literature, and the main issue studied in this paper is the impact of adding government subsidy factors on supply chain recovery in the case of simultaneous capacity interruption and transportation interruption.
The purpose of this study is to develop a systems dynamics framework to study the impact of government subsidy strategies on supply chain recovery under the epidemic situation in the context of supply chain disruption. The paper is organized as follows. Section 2 reviews the literature on supply chain recovery strategies. Section 3 describes the proposed simulation framework. Section 4 describes the results of the simulation experiment, and Section 5 of the paper summarizes the findings.
2. Literature Review
With the economic globalization and manufacturing concentration, one or several entities in the supply chain can cause the entire supply chain to crash. Therefore, in the past few decades, many enterprise managers and researchers have conducted a lot of research on the supply chain. Xu Ying [12] used the game theory to establish a STACKELBERG game model and a centralized decision-making game model of different members. Berger et al. [13] launched the problem of suppliers’ number required for interrupts, using interrupt occurrence probability to quantify the possibility of interruption, and giving the best supply of different interruption risks by means of the decision tree. He also stressed that a single manufacturer should not have too many suppliers, otherwise this will lead to unnecessary ordering costs. Sawik [14] studied the supply portfolio optimization problem in the ordering environment of the supply chain interrupted risk, which cleverly converts supplier choices into hybrid integer planning issues; the purpose is to select the best supplier through customers’ orders. Combination to minimize costs to alleviate the impact of interrupt risk. In the actual supply chain, the number of manufacturers’ suppliers is limited. Once the interruption occurs, the supplier can’t even meet the most basic needs of the manufacturer, and there is no choice for the manufacturer. Sawik [15] further developed an elastic supply chain strategy. He first implemented the protection strategy of critical suppliers to prevent interruption, then decided which vendor delivered parts and how to assign orders between selected suppliers, and finally protected emergency stocks are allocated between suppliers. Hosseini et al. [16] considered the supplier’s risk-absorbing ability, adapting capacity and recovery capabilities, formulating the selection criteria for elastic vendors, establishing the Bayesian network model, and selecting its elastic supplier. Yan Yang [17] and other research networks and emergency scheduled issues in the supply chain in the event of a single node failure and established a minimum cost-optimization mathematical model for limited resource constraints to achieve the total cost of supply chain operation.
Today, to deal with the supply chain recovery problem, Li Ning et al. [18], constructed a new type of coronary virus pneumonia epidemic emergency supply chain to a synergistic management framework, using a collaborative management means to eliminate the possible uncoordinated phenomenon of emergency supplies. Fan Xuemei et al. [19] built the supply chain toughness evaluation index system, which has predictive, adaptability, reaction, recovery, and learning ability, and evaluated the supply chain toughness of automotive enterprises during the coronavirus pandemic through the entropy-TOPSIS method and made recommendations on its recovery. Govindan K et al. [20] developed practical decision support systems based on doctors’ knowledge and fuzzy reasoning systems to classify community members, and improved the accuracy of decision support systems by increasing the number of membership functions to help medical supply chains’ demand management. Ivanov D et al. [21] claims that from the perspective of restoration, the supply chain system is provided to the society to ensure long-term survival. Combined with COVID-19 outbreaks, they indicated that the survival of the supply chain system requires large-scale consideration of a single supply chain system recovery capability. Yan Yang et al. [22] pointed out that the influencing factors on enterprise supply chain recovery mainly involved three aspects, these being government, enterprises, and consumers, and used root theory to indicate that the supply chain recovery can be distributed in a certain way. Paul S K et al. [23] constructed production recovery models for high demand products using the epidemic modeling method. Its recovery model can adjust the production plan in the case of supply chain interruption to improve the manufacturer’s profits, but fails to consider the epidemic Low demand product supply chain recovery. Ivanov D et al. [24] considered the speed of the epidemic transmission, the duration of the supply chain member interrupts and the decline in demand, demonstrating that the performance of the supply chain by simulation depends on the outbreak of the epidemic, the interruption of the supply chain, and the sequence of the restoration.
Cheng et al. [25] analyzed the impact of the three-level supply chain interrupt and determined that the industry is susceptible to capacity planning. They indicated that information needs to be immediately, completely, and correctly shared to reduce excessive risks. Campuzano et al. [26] used a fuzzy estimate of demand in a two-stage system dynamics analog model, showing amplification of the bullwhip effect and inventory variance. Langroodi and Amiri [27] used system kinetics in the five-level supply chain to analyze bullwhip effects caused by demand fluctuations, prices, and cost changes, and used the system dynamics framework to evaluate different supply chain interrupts and risks. Wilson et al. [28] evaluated the impact of the transport interruption between the five-level supply chain. This study shows that interruptions from consumers has a more significant impact on supply chain performance. Huang et al. [29] used a two-level supply chain to analyze the utilization of alternate suppliers facing interruptions. They observed the inventory of the disturbance amplification and concluded that the longer the supply interruption time, the greater the inventory fluctuation. Pimenta et al. [30] concluded that sudden and frequent supply chain disruptions will have a certain impact on supply chain flexibility, affecting the recovery capability of the entire supply chain.
The above studies are all based on the actual situations that occurred during the epidemic. They help to advance the recovery of the supply chain, but the impact of government subsidies on supply chain capacity recovery is not taken into consideration. When an interruption occurs in a supply chain system, maintaining the stability of the system is an important goal of supply chain management [31]. Kefan Xie et al. [32] found that under the background of the coronavirus pandemic, government subsidies can greatly improve the enthusiasm of emergency supplies supply chain members to assume social responsibility. Dong Xue Guo et al. [33] set different subsidy strategies from three dimensions of subsidy amount, subsidy effect, and subsidy elasticity, which proved that government subsidies can effectively influence the social welfare and profit of supply chain members. Haixiang Wu et al. [34] set different government subsidy rates in the supply chain model, which effectively proves the promoting effect of government subsidies on the technological progress of the green supply chain. They also considered the recovery of the supply chain of the two-tier manufacturer in the case of simultaneous interruptions in capacity and transportation. Therefore, this article draws on the model of Olivares-Aguila J et al. [35], and the model provides an overall analysis of supply chain performance to assess the impact of capacity interrupt on different key performance indicators. This article is different from the original model. First, the original model does not take into account the role of government subsidies in supply chain recovery; secondly, the original model only considers production capacity interruption, ignoring the situation of transport interruption, but this article considers production capacity interruption and transportation interruption; finally, the original model uses the four-stage supply chain, which is used in the secondary supply chain. This article applies system kinetic methods to build a “manufacturer-distribution center” secondary supply chain model, set up eight production capacities and different interruptions, and refers to Ivanov D et al.’s [5] parameter setting and simulation of supply chain interruption in the epidemic. The data is simulated, and the total profit recovery of the supply chain members in different scenarios is analyzed to obtain a scientific government subsidy strategy, providing a reference for the recovery strategy of the high demand product supply chain in the epidemic.
3. System Dynamics Framework
3.1. System Dynamics Model Boundaries
Considering government subsidies and demand interrupt situations, and the high demand for products during the epidemic, this article constructs a secondary supply chain of the manufacturer and distribution center as an object and allows off-stock to appear as an extension of delivery. The characteristics of the coronavirus pandemic have been known that [36], the interrupt situation is interrupted by the manufacturer’s capacity interruption and the transportation interruption of the distribution center. The distribution center links companies with their customers and suppliers, which provide supplies to demand locations or consumers. The government’s subsidy for the manufacturer is to increase the recovery of the supply chain by increasing production, and the government’s subsidy for the distribution center is to drive supply chain recovery. Due to the limited government resources, the Government can only subsidize one of the objects, and the effectiveness of government subsidies can be used to assess the effectiveness of government subsidies before and after subsidies and to minimize the effectiveness or loss of supply chain recovery.
3.2. System Dynamics Model Hypothesis
The supply chain interrupt scene is divided into two cases of complete and partial interrupts, which are mainly divided according to the degree of severity of the interrupt. However, the concept of “severity” is multifaceted and is considered by a variety of specific companies. Therefore, objective standards are impossible when discussing severe severity [37]. Therefore, this paper indicates the degree of severe and partial interrupt in the rate size. When capital and labor restrictions are considered, the remaining capacity can be estimated using a particular formula [38]. In the case where capacity is available or not available, the representation of the capacity interruption rate is usually performed as [0–1] function [39]. Therefore, the capacity interruption rate of 1 means that productivity is completely interrupted. If capacity data cannot be acquired, the capital loss can be converted into capacity loss by setting a fixed ratio. For example, since employees do not work due to illness or death or isolation, the production capacity that survived under epidemic impact is defined as the product of labor ratio and standard production capacity [40]. The supply chain considers the predetermined order and the process of complement. The complexity is expensive by selecting a faster transportation method or production adjustment (e.g., overtime, additional shift, part-time help, alternate route, and outsourcing) to reduce production or transportation so that some extension is delivered. Subsequent stages caught up, and its performance will be affected by the degree of order, but the complexity may increase the cost of transportation and production [41]. Since the enclosed isolation measures of the epidemic have led to normal work, manufacturers are difficult to adopt the employment of extra labor during the interruption period to speed up the production progress. This provides a hypothesis for the manufacturer to make a hybrid after the interruption. The transport interruption is based on the interruption of the interruption. When the transport interruption is continued until the complex end is considered completely interrupted, the length of the transport interruption continues to the end of the capacity interrupt consideration part interrupt.
Government subsidies play an important role in supply chain recovery. Government subsidies can both increase capacity and promote consumer demand. Starting from the time of subsidies, the marginal effect line of government subsidies is tilted above. Over time, the amplitude of the marginal effect line is inclined to the upper right, indicating that government subsidies have a subsidy on corporate capacity. The promotion of utilization increases over time [42]. This provides a hypothesis for the relationship between production capacity and government subsidies. Since production subsidies are more concerned about enterprises’ production and industry scale, then companies will be more likely to purchase technology to improve the production level of enterprises [43]. The problem of lack of labor in the epidemic is outlined. To avoid the impact of labor shortages, companies are more inclined to use fully automated, intelligent production equipment to reduce labor demand. This has always provided a hypothesis based on new production capacity after subsidies. Due to the investment on steel, aluminum, shipbuilding, and other industries need long production cycles to form production capacity; they can only consider the following new production capacities when studying overcapacity and cannot calculate production capacity in construction [44]. Therefore, when building government subsidies and capacity relationships, it is necessary to consider subsidizing production capacity to take effect. In order to facilitate the simulation analysis, the cost and load of the transport trucks of the manufacturer and the distribution center are the same, and the manufacturer’s demand comes from the order of the distribution center. Through the above analysis, the following assumptions are made about the model in this paper:
- (1)
- Only after the production capacity is interrupted can the manufacturer proceed.
- (2)
- The size of the expediting rate represents the extent of production. The higher the pilot rate, the higher the complexity cost.
- (3)
- The advanced stage of the support chain is known and fixed.
- (4)
- The capacity interruption rate being 1 represents complete interrupt, and the capacity interruption rate being 0.5 represents partial interrupt.
- (5)
- Transport interrupts are expressed through the interruption of the transport interrupt; the transport interruption time of 30 generations means a partial interrupt, and the transport interruption time of 50 represents complete interrupt.
- (6)
- Due to the severity of the capacity interruption, the manufacturer operates in a specific capacity and costs when the production capacity is interrupted.
- (7)
- The transport truck cost and load weight of the manufacturer and distribution center are the same.
- (8)
- The production capacity interruption and transportation interruption start at the same time.
- (9)
- Government subsidies start from the supply chain interruption time.
- (10)
- The order implements the “advanced first-out” principle.
- (11)
- The manufacturer’s demand is derived from orders in the distribution center.
- (12)
- Government subsidies and capacity are positive linear relationships, and there is a government subsidy to the capacity of capacity and the increased production capacity after subsidies.
- (13)
- The government needs a certain amount of time to develop new production capacity, and there is a subsidy of production capacity to take effect.
- (14)
- The production capacity interruption only occurs for the manufacturer, and the transport interruption only occurs at the distribution center.
- (15)
- The demand is subject to a uniform distribution.
- (16)
- Limitations on the warehouse capacity of manufacturers and distribution centers are not taken into account.
- (17)
- Government subsidies can only subsidize one of the objects and distribution centers of the manufacturer and distribution center, representing the choice of subsidy strategy. The government subsidy is set to 0 or 1.
3.3. System Structure Analysis
The model level of this paper can be expressed in a policy structure diagram. As shown in Figure 1, the system dynamics model of the supply chain interrupt includes the quantity subsystem of the raw material order, the production capacity interrupt subsystem, the transport interrupt subsystem, and the order fulfillment subsystem, government subsidy subsystem, demand subsystem, backlog order subsystem, order fulfillment subsystem, projection subsystem, cost and profit subsystem.
3.4. System Stock Traffic Diagram
To simplify the model, let P represent the manufacturer and DC represent the distribution center. The ratio of government subsidies to P and DC can only be 1 or 0. 1 means that there is a government subsidy, and 0 means that there is no government subsidy. Moreover, the sum of the P government subsidy ratio and the DC government subsidy ratio is 1, which means that the government subsidy is only subsidized to one of the manufacturers and the distribution center, and the time unit is “day”. According to the supply chain policy structure diagram in Figure 1, the system dynamics special software Vensim PLE is used to establish the stock-flow diagram of the supply chain system under government subsidies. Figure 2 shows the manufacturer’s system stock-flow diagram, and Figure 3 shows the stock-flow diagram in the distribution center system.
3.5. Model Equations and Parameters
The equations of the model are shown in Appendix A. The main variables and parameters of the system dynamics model constructed in this paper are shown in Appendix B, Table A1, which mainly include the government subsidy subsystem, demand and order fulfillment subsystem, backlog order subsystem, capacity interruption subsystem, expediting subsystem, order quantity Subsystem, raw material order quantity subsystem, transportation interruption subsystem, cost, price, and profit subsystem. P represents the manufacturer and DC represents the distribution center.
4. Numerical Study and Results
4.1. Parameter Setting
The data in the simulation experiment comes from experts’ parameter settings and simulation data. The models established by Tao Liyan et al. [45] have certain representativeness in the parameter settings of capacity interruption. On the basis of their original parameter settings, this paper modified the transportation model using simulation data. Simulation data is mainly used when transportation is interrupted. We referred to the parameter setting of Ivanov D [21] to set the interruption time to 30 days. P and DC constant settings are shown in Appendix B, Table A1. Eight disruption scenarios are designed to analyze the recovery of the supply chain’s cumulative total profit at the DC and P in the face of partial and complete disruption, as shown in Table 1.
The simulation time is set to the initial value of 830 days and the end time to 920 days. Assuming an outbreak on day 830, capacity disruption and demand disruption begin simultaneously, during which the government can only subsidize one of the manufacturers and the distribution center. The production capacity interruption starts on the 860th day, the expediting begins at the same time, and on the 880th day, the production capacity interruption and the urging ends at the same time.
4.2. System Dynamics Model Checking
Reality Check
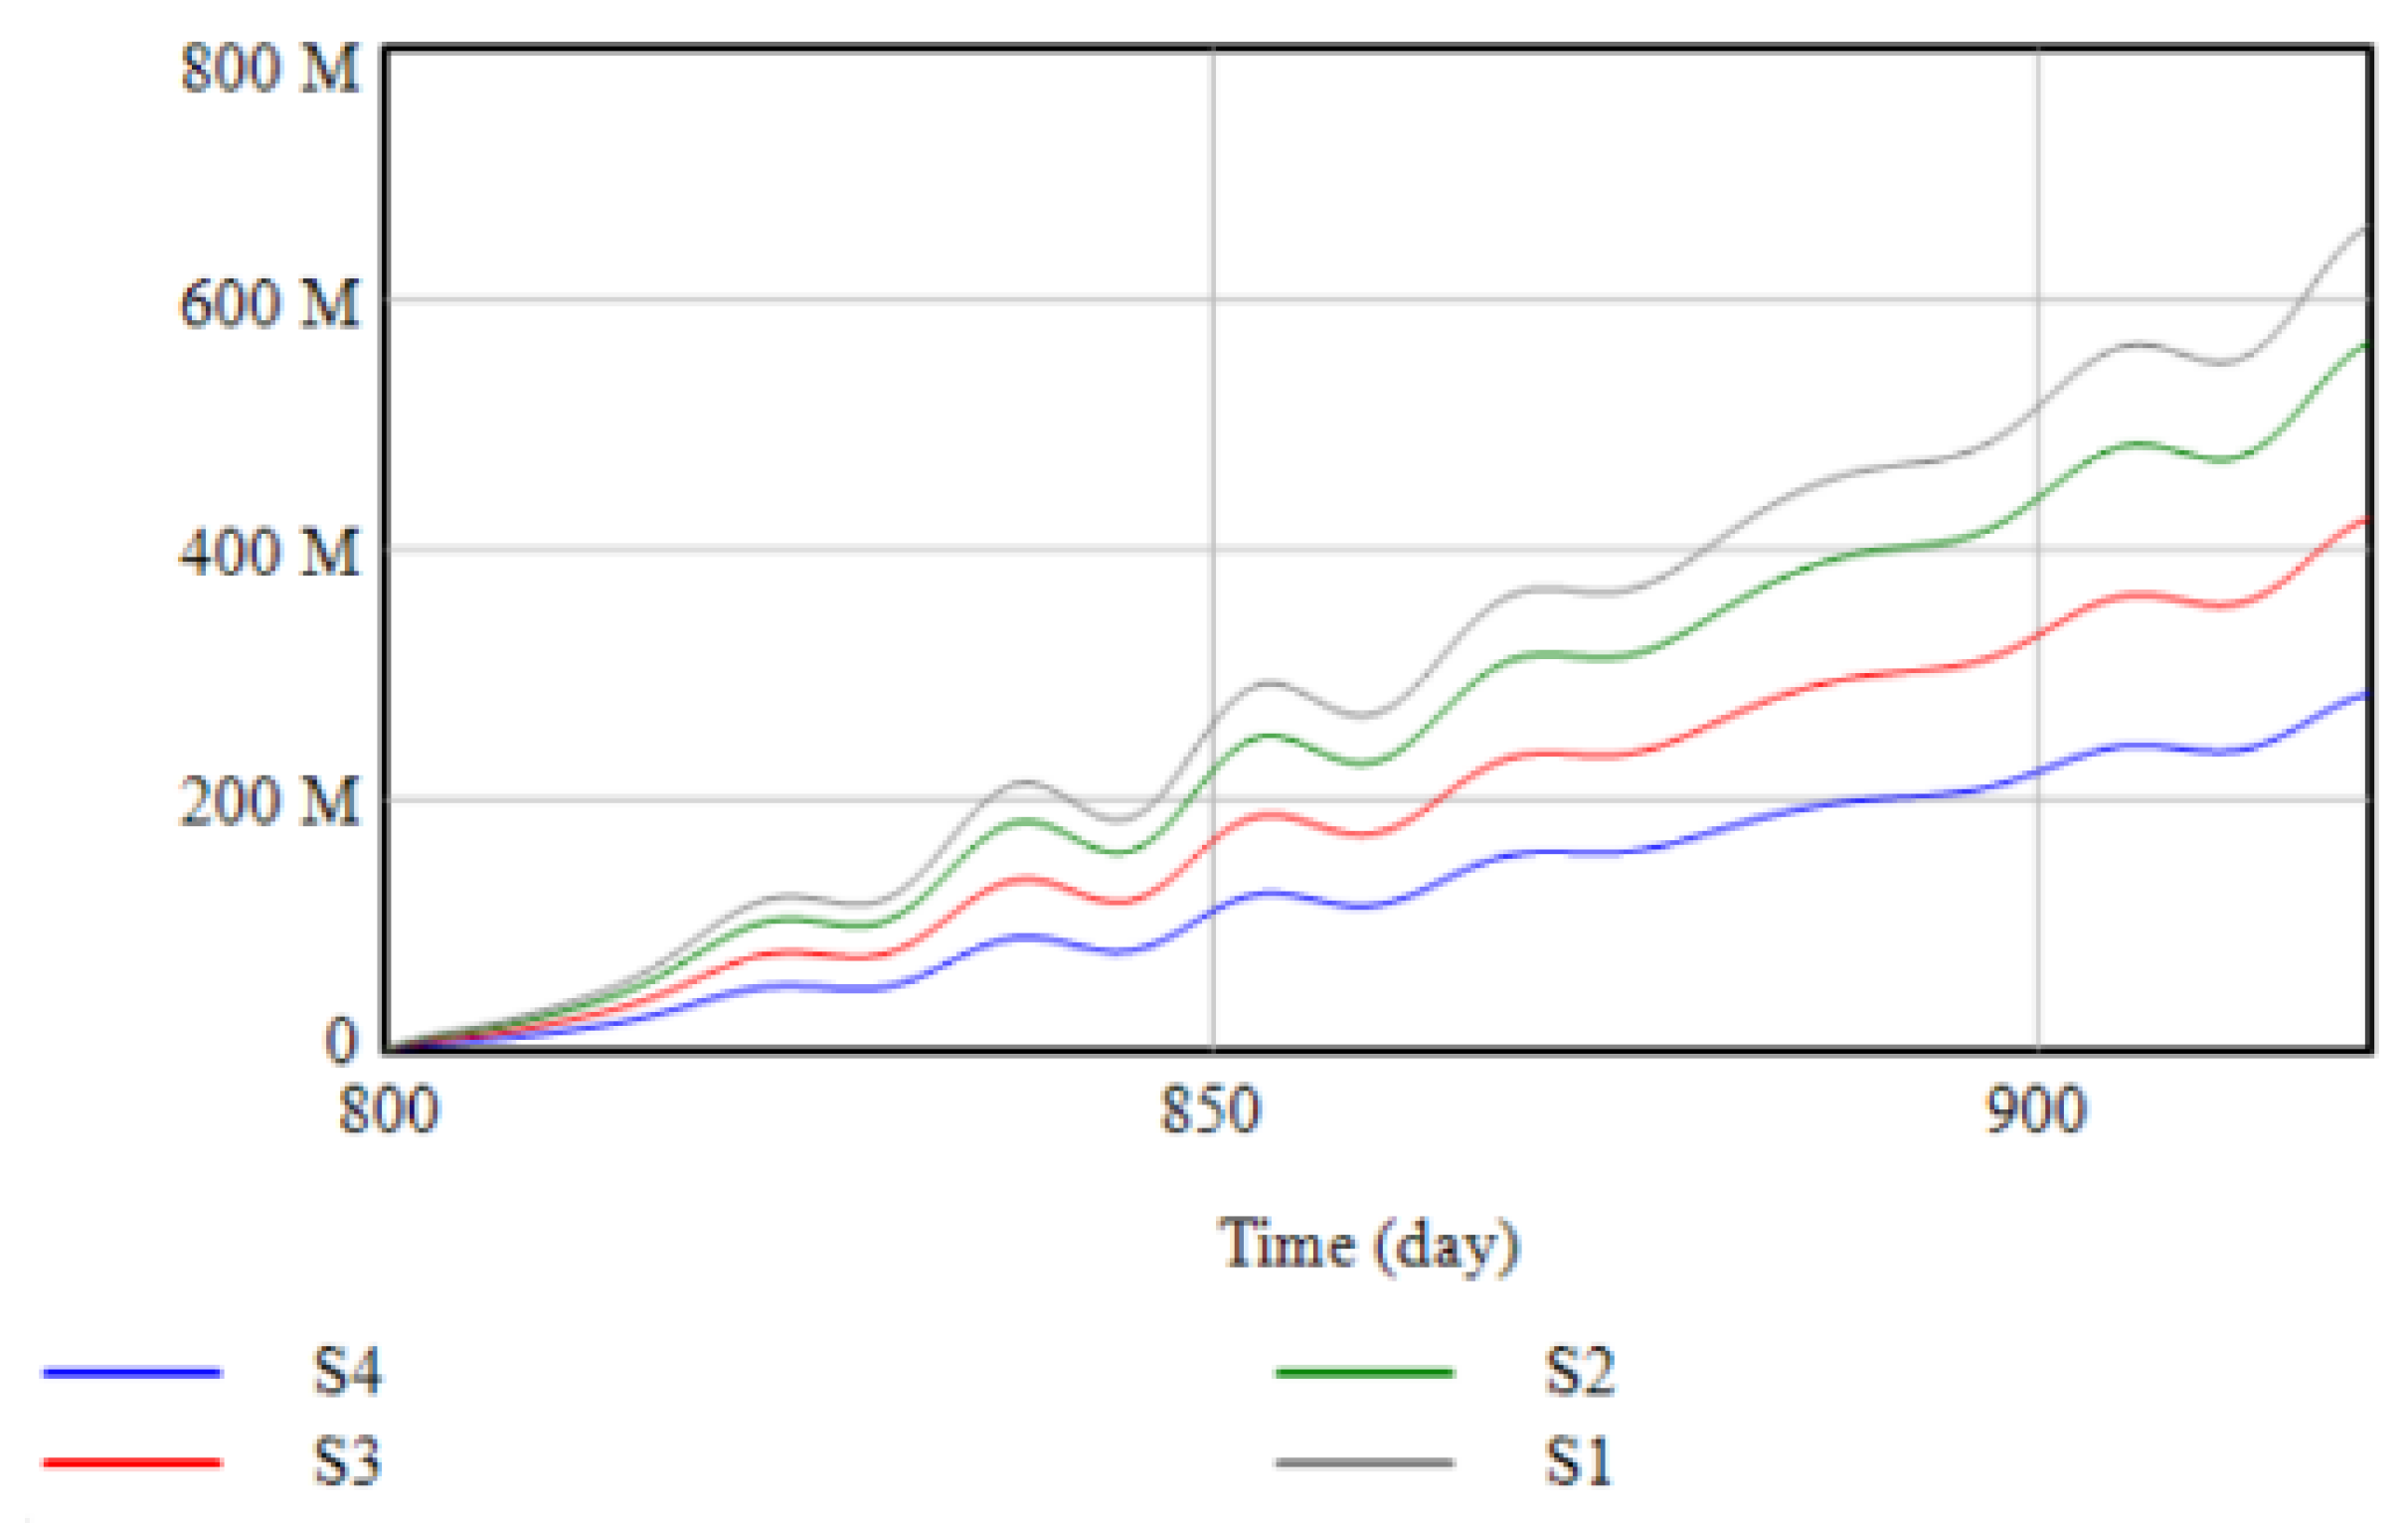
In order to judge whether the built model conforms to the reality, the model is tested for reality, and the purchasing cost growth rate dc is set as: 0, 0.2, 0.5, 0.8, which means that the purchasing cost has no growth rate, low growth rate, medium growth rate, and high growth rate. The corresponding cumulative total profit DC under different procurement growth rates is expressed in s1, s2, s3, and s4, respectively. It was run under different procurement cost growth rate settings and the change in cumulative total profit was observed, as shown in Figure 4. It can be seen that the higher the purchase cost growth rate dc, the less the cumulative total profit dc corresponds. That is to say, the increase in purchasing costs will lead to a decrease in the profit of supply chain members. Therefore, the model passes the reality check and conforms to reality.
4.3. Analysis of Simulation Results
4.3.1. Analysis of Simulation Results of Transportation Partial Interruption and Capacity Interruption
In the case of partial interruption of transportation and capacity interruption, the manufacturer’s production capacity is reduced, the distribution center transportation is paralyzed, and normal production and transportation activities cannot be carried out during the interruption. A1 and A2 indicate the choice of different subsidy strategies under partial interruption of transportation and partial capacity interruption scenarios. In contrast, A3 and A4 indicate the choice of different subsidy strategies under partial interruption of transportation and complete interruption of production capacity. As shown in Figure 5, the manufacturer’s and distribution center’s cumulative total profit is consistent before the transportation interruption and production capacity interruption. Profits of A2 all have an upward trend. After the 860th transportation and capacity interruption, the upward trend of A1 is more significant than that of A2, and the cumulative profit gap between the two gradually increases. It shows that in the scenario of partial interruption of transportation and partial interruption of production capacity for manufacturers, the government’s choice to subsidize manufacturers is more effective than subsidizing the cumulative total profit of distribution centers.
There is no significant difference in the cumulative total profit of A3 and A4 during the interruption. However, after the partial interruption of transportation and the complete interruption of production capacity, the cumulative total profit of A3 has an apparent upward trend compared with that of A4, and the gap gradually widens, indicating that during the period of the partial interruption of transportation and the complete interruption of production capacity, the government subsidized manufacturers had a better recovery effect on the cumulative total profit for manufacturers, but during the interruption, neither the government subsidized the manufacturers, nor the distribution center had a significant recovery effect.
As shown in Figure 6, the cumulative total profit dc of A1 and A2 is not significantly different. Therefore, in the scenario of partial interruption of transportation and partial interruption of production capacity for the distribution center, the government subsidizes the manufacturer more than the subsidy.
The profit recovery effect of the distribution center is better. There is no noticeable difference in profit between A3 and A4 during the interruption. After the interruption, both A3 and A4 show an upward spiral trend, but A3 has a more apparent upward trend than A4. Therefore, in the scenario of partial interruption of transportation and complete interruption of production capacity, for the distribution center, in other words, the government subsidized manufacturers better than subsidized distribution centers.
To sum up, in the scenario of partial transportation interruption and production capacity interruption, government subsidies to manufacturers are more conducive to the profit recovery of the entire supply chain members.
4.3.2. Analysis of Simulation Results of Complete Transportation Interruption and Capacity Interruption
In the case of complete interruption of transportation, the direct impact is that the cumulative total profit recovery time of the distribution center becomes longer. A5 and A6 indicate the choice of different subsidy strategies under the scenarios of complete interruption of transportation and partial capacity interruption. In contrast, A7 and A8 indicate the choice of different subsidy strategies under the scenarios of complete interruption of transportation and complete interruption of production capacity. As shown in Figure 7, before the transportation interruption and production capacity interruption, the manufacturer and distribution center’s cumulative total profit is consistent. The cumulative total profit p of A5 and A6 is not obvious during the partial transportation and the production capacity interruptions. There is a difference, but with the growth over time, the cumulative profit p of A5 has a larger upward trend than that of A6. Therefore, in the scenario of complete interruption of transportation and partial interruption of production capacity, for manufacturers, the government should choose to subsidize manufacturers rather than subsidize the cumulative total profit of distribution centers.
There is no significant difference in the cumulative total profit of A7 and A8 during the interruption. However, after the complete interruption of transportation and the complete interruption of production capacity, the cumulative total profit of A7 has an apparent upward trend compared with that of A8, and the gap gradually widens, indicating that during the period of the total interruption of transportation and the complete interruption of production capacity, the government subsidized manufacturers had a better recovery effect on the cumulative total profit for manufacturers, but during the interruption, neither the government subsidized the manufacturers nor did the distribution center have a significant recovery effect.
As shown in Figure 8, the cumulative total profit dc of A5 and A6 is not significantly different, and the difference between the cumulative total profit dc of the two is also minimal as time increases. Therefore, in the case of complete interruption of transportation and partial interruption of production capacity, for distribution centers, government subsidies to manufacturers are more effective than subsidized distribution centers to recover profits. There was no significant difference in profit between A7 and A8 during the interruption; both A7 and A8 showed a upward spiral trend after the interruption, but A3 had a more apparent upward trend than A4, and the cumulative total profit dc recovery time of A7 and A8 during the complete interruption of transportation. It took longer than the partial interruption of transportation, and there was a clear recovery trend on the 880th day, and government subsidies did not play a significant role in recovery. Therefore, in the scenario of the complete interruption of transportation and complete interruption of production capacity, for distribution centers, government subsidies to manufacturers are more effective than subsidized distribution centers for recovery.
To sum up, in the scenario of complete transportation interruption and production capacity interruption, government subsidies to manufacturers are more conducive to the recovery of profits for the entire supply chain members.
5. Conclusions
In view of the fact that few previous studies have considered the impact of government subsidies in supply chain recovery strategies, and in the context of the simultaneous interruption of supply chain capacity and transportation in the context of the current epidemic, this paper aims to establish suppliers and distribution through systems dynamics for products with high demand during the epidemic. The center two-level model studies the choice of government subsidy strategies from the perspective of production capacity and transportation interruption. By setting up simulation experiments in eight different scenarios, the following conclusions can be drawn:
- (1)
- In the case of transportation interruption and capacity interruption, whether the transportation is partially or completely interrupted, the government subsidizes the manufacturer and the recovery effect is better than subsidizing the distribution center. Most of the labor used by manufacturers is near the factory. During the epidemic, the transmission speed can be controlled in a small area. Most of the labor in the distribution center passes through multiple locations during the distribution process. During the epidemic, the risk level of various places may change at any time. Delivery workers are more likely to be out of work, so government subsidies to manufacturers can restore productivity faster, boosting the recovery of cumulative profits for supply chain members.
- (2)
- The government subsidy strategy does not have an immediate recovery effect in the complete interruption of transportation and production capacity. When production capacity and transportation are completely interrupted, it means that the production and manufacturers’ and distribution centers’ transportation facilities have been completely paralyzed, and government subsidies need to re-integrate resources. In addition, there are material and information delays in the supply chain, so government subsidies cannot work right away.
- (3)
- When the government chooses the subsidy strategy, the different production capacity levels and transportation interruption will lead to different effects of government subsidies on supply chain recovery. The severity of capacity disruptions can cause companies to operate at different efficiencies and costs. The more severe the capacity disruption, the less productive the manufacturer will be and the corresponding increase in operating costs. In the partial interruption scenario, government subsidies can allow manufacturers and distribution centers to obtain capital and labor resources to quickly resume production. In the complete interruption scenario, due to the rapid spread of the epidemic and the different isolation measures in various parts of China, it is difficult to resume production in a short period quickly. Integrate resources and restore production capacity, so the recovery effect is not as good as the partially interrupted scene.
- (4)
- Under the complete interruption of production capacity, the cumulative total value of the supply chain after increasing government subsidies has rebounded in a spiral. Due to the delay in the arrival of materials in the production process of the manufacturer’s work in progress, the cumulative total profit of the supply chain after the government subsidy will decline, and the overall recovery trend will spiral upward.
This paper uses the system dynamics method as a model, considers the choice of government subsidy strategy under production capacity interruption and transportation interruption, and provides a supply chain recovery strategy under the epidemic. The findings can be applied to many fields, such as e-business, marketing science, and recommendation services [46,47,48]. In the future, in the face of frequent local outbreaks of the coronavirus pandemic, the government-subsidized supply chain recovery strategy should consider the simultaneous occurrence of multiple interruption types, and this article only considers the recovery effect of the secondary supply chain under two types of interruptions, which is inevitable [49,50]. This study does have a shortcoming. The data in the simulation in this paper are realized by referring to previous scholars’ parameter settings and simulation data. Future research can use the real data of a specific supply chain to conduct simulation experiments, which is more conducive for the government and enterprises to formulate reasonable recovery strategies.
Author Contributions
J.Z., F.B. and C.J. designed the study and conceived the manuscript. J.Z. and K.L. carried out the simulation experiments. J.Z. and J.R. drafted the manuscript. J.Z., C.X. and F.B. were involved in revising the manuscript. All authors have read and agreed to the published version of the manuscript.
Funding
This research was funded by Zhejiang Provincial Key Project of Philosophy and Social Sciences (Grant No. 20NDJC10Z), This research was supported by the Natural Science Foundation of Zhejiang Province (No. LQ20G010002), Soft Science Research Program of Zhejiang Province (No. 2021C25010), and the Contemporary Business and Trade Research Center of Zhejiang Gongshang University (Nos. XT202103 and XT202105).
Institutional Review Board Statement
Not applicable.
Informed Consent Statement
Not applicable.
Data Availability Statement
Not applicable.
Conflicts of Interest
The authors declare that they have no conflict of interest.
Appendix A
Government subsidy subsystem: P GovernmentSubsidies = P GovernmentSubsidy Ceiling*P ProportionOfGovernment Subsidy, DC ProportionOfGovernmentSubsidy = 1-P ProportionOfGovernmentSubsidy.
Demand subsystem: DC Demand = RANDOM UNIFORM (10,000, 12,000, 10,000), P Demand = DC OrderQuantity.
Order fulfillment subsystem: P Inventory = INTEG(P ProductedProducts-P DeliveredProducts), P DeliveredProducts = IF THEN ELSE(Time >= 830:AND:Time <= 860:AND:P CapacityDisruptionRate = 1, 0, IF THEN ELSE(P Inventory < 1, 0, MIN(P FirmOrder, P Inventory/P MinTimeToDeliver))), P FirmOrder = P Demand + P BackloggedOrders/P BacklogAdjustTime, DC Inventory = INTEG(DC ProductsReadyToShip-DC DeliveredProducts), DC DeliveredProducts = MIN(DC FirmOrder, DC Inventory/DC MinTimeToDeliver), DC FirmOrder = DC Demand + DC BackloggedOrders/DC BacklogAdjustTime.
Backlog order subsystem: P BackloggedInFlow = IF THEN ELSE(P DeliveredProducts < P Demand, P Demand-P DeliveredProducts, 0), P BackloggedOrdersDelivered = IF THEN ELSE(P DeliveredProducts = P FirmOrder, P BackloggedOrders/P BacklogAdjustTime, IF THEN ELSE(P DeliveredProducts > P Demand, P DeliveredProducts-P Demand, 0)), P BackloggedOrders = INTEG(P BackloggedInFlow-P BackloggedOrdersDelivered), DC BackloggedOrdersDelivered = IF THEN ELSE(DC DeliveredProducts = DC Firm Order, DC BackloggedOrders/DC BacklogAdjustTime, IF THEN ELSE(DC DeliveredProducts > DC Demand, DC DeliveredProducts-DC Demand, 0)), FlowOfProductsToDistribution = MAX(P DeliveredProducts*DC TransportInterruptionMode, 0).
Capacity interruption subsystem: P Capacity = IF THEN ELSE(Time >= 830, IF THEN ELSE(Time <= 830 + P EffectiveTimeOfSubsidizedProducts, P TotalCapacity*(1-P CapacityDisruptionRate), IF THEN ELSE(Time <= 860, P TotalCapacity*(1-P CapacityDisruptionRate) + P NewCapacity, P TotalCapacity + P NewCapacity)), P TotalCapacity), P feasibleProductionRate = IF THEN ELSE(MIN(P Capacity, P OrderQuantity) < P InventoryRawMaterial, MIN(P Capacity, P OrderQuantity), P InventoryRawMaterial), P NewCapacity = IF THEN ELSE(Time >= 830, P GovernmentSubsidies*P GovernmentSubsidiesAreSensitiveToCapacity, 0).
Transport interruption subsystem: DC TransportInterruptionMode = 1-PULSE(DC TransitInterruptionTime, DC DurationOfTransportInterruption), DC NumOfTrucks = IF THEN ELSE(DC DeliveredProducts/DC TruckCapacity < 1, IF THEN ELSE(DC DeliveredProducts/DC TruckCapacity > 0, 1, IF THEN ELSE(DC DeliveredProducts/DC TruckCapacity = 0, 0, 1)), INTEGER(DC DeliveredProducts/DC TruckCapacity)), DC TransportationCost = DC NumOfTrucks*DC CostPerTruck.
Expediting subsystem: P ProductionTime = IF THEN ELSE(Time >= 830, IF THEN ELSE(Time <= 850, P NormalProductionTime*(1-P ExpeditingRate), P NormalProductionTime), P NormalProductionTime), P ProductedProducts = IF THEN ELSE(P CapacityDisruptionRate = 1:AND:Time >= 830:AND:Time <= 860, 0, DELAY1(P InProcessProducts, P ProductionTime)),
Order quantity subsystem: P MaxInventory = P Demand*(P TimeToDeliverd + P SafeyStockDayOrderQuanity + P TimeToOrder), P OrderQuantity = IF THEN ELSE(Time >= 830:AND:Time <= 860:AND:P CapacityDisruptionRate = 1, 0, MAX(P MaxInventory-P InventoryPosition, 0)/P OrdersAdjustTime).
Raw material order quantity subsystem: P ReceivedRawMaterial = DELAY1(P ReceivedRawMaterials, P TransportationTime), P OrderRawMaterial = MAX(0, P MaximumRawMaterialInventory-P OnOrder-P InventoryRawMaterial)/P OrderAdjstTimeRM,
Price, cost and profit subsystem: P TotalUnitCost = IF THEN ELSE(Time >= 830, IF THEN ELSE(Time > 860, IF THEN ELSE(Time > 880, P BaseUnitProductCost + P UnitInventoryCost, P BaseUnitProductCost + P ExpeditingCost + P UnitInventoryCost), P BaseUnitProductCost + P IncreasedCostsAfterCapacityOutages + P UnitInventoryCost), P BaseUnitProductCost + P UnitInventoryCost), P BackloggedCost = DC BaseUnitProductCost*P BackloggedInFlow*P BackloggedPenaltyRate, P RawMaterialInventoryCost = P RawmaterialUnitCost*P HoldingRate*P InventoryRawMaterial/P RawMaterialInventoryAdjustTime, P TotalCost = (P TotalUnitCost*P DeliveredProducts) + P TotalUnitCost + P BackloggedCost + P InventoryCost + P TransportationCost + P RawMaterialInventoryCost, P Revenue = IF THEN ELSE(Time >= 830:AND:P GovernmentSubsidies > 0, P ProductPrice*P DeliveredProducts + P GovernmentSubsidies, P ProductPrice*P DeliveredProducts), rP Profit = P Revenue − P TotalCost.
Appendix B

Table A1.
Parameters.
| Serial Number | Constant | Numerical Value |
|---|---|---|
| 1 | P government subsidy ceiling (yuan) | 200,000 |
| 2 | Blackout start time (days) | Day 830 |
| 3 | P effective Time of Subsidized products capacity to take effect (days) | 10 days |
| 4 | Blackout end time (days) | Day 860 |
| 5 | P initial product inventory (set) | 800 |
| 6 | DC initial product inventory (set) | 1200 |
| 7 | P capacity disruption rate | Simulation settings |
| 8 | DC duration of transport interruption | Simulation settings |
| 9 | P minimum delivery time (days) | 3 |
| 10 | Dc minimum delivery time (days) | 4 |
| 11 | P backlog adjustment time (days) | 2 |
| 12 | DC backlog adjustment time (days) | 1 |
| 13 | P initial backlogged order (sets) | 0 |
| 14 | DC initial backlogged order (set) | 0 |
| 15 | P initial work in process (set) | 0 |
| 16 | DC initially received product (set) | 0 |
| 17 | P product shipping time (days) | 4 |
| 18 | P total capacity (units/day) | 1200 |
| 19 | P normal production time (days) | 6 |
| 20 | DC normal production time (days) | 6 |
| 21 | P expediting rate | 0.5 |
| 22 | P product delivery time (days) | 6 |
| 23 | DC product delivery time (days) | 6 |
| 24 | P product safety stock time | 2 |
| 25 | DC product safety stock time (days) | 2 |
| 26 | P order time (days) | 1 |
| 27 | P product price (yuan/unit) | 10,000 |
| 28 | DC product price (yuan/set) | 30,000 |
| 29 | DC order time (days) | 1 |
| 30 | P order adjustment time (days) | 5 |
| 31 | DC order adjustment time (days) | 10 |
| 32 | P initial raw material inventory (set) | 200 |
| 33 | P raw material transportation time (days) | 2 |
| 34 | P raw material adjustment time (days) | 1 |
| 35 | P time to order raw materials (days) | 5 |
| 36 | P raw material delivery time (days) | 6 |
| 37 | P raw material safety stock time (days) | 4 |
| 38 | P initial order product (set) | 0 |
| 39 | DC initial order product (set) | 0 |
| 40 | P truck capacity (unit/car) | 80 |
| 41 | DC truck capacity (unit/car) | 80 |
| 42 | P Transport truck unit cost (yuan/car) | 100 |
| 43 | DC transport truck unit cost (yuan/car) | 100 |
| 44 | P raw material price (yuan/set) | 2000 |
| 45 | P currency rate | 1.5 |
| 46 | DC currency exchange rate | 1.5 |
| 47 | P procurement cost growth rate | 0.8 |
| 48 | DC procurement cost growth rate | 0.2 |
| 49 | P holding rate | 0.12 |
| 50 | DC holding rate | 0.15 |
| 51 | P backlog penalty rate | 0.1 |
| 52 | DC backlog Penalty Rate | 0.1 |
| 53 | P raw material holding ratio | 0.1 |
| 54 | P raw material inventory adjustment time (days) | 10 |
| 55 | P inventory adjustment time (days) | 10 |
| 56 | DC inventory adjustment time (days) | 7 |
| 57 | Expediting time (days) | 20 |
| 58 | P received raw material (units/day) | 300 |
Notes: 1. Capacity disruptions: In the model, it is manifested as the manufacturer’s capacity equal to 0; 2. Transportation disruptions: In the model, the time for distribution centers to receive products is extended; 3. Government Subsidy: The government provides funding support.
References
- Dolgui, A.; Ivanov, D.; Sokolov, B. Ripple effect in the supply chain: An analysis and recent literature. Int. J. Prod. Res. 2018, 56, 414–430. [Google Scholar] [CrossRef] [Green Version]
- Ju, C.; Li, G.; Bao, F.; Gao, T.; Zhu, Y. Social Relationship Prediction Integrating Personality Traits and Asymmetric Interactions. Front. Psychol. 2022, 13, 778722. [Google Scholar] [CrossRef] [PubMed]
- Ju, C.; Bao, F.; Xu, C.; Fu, X. A Novel Method of Interestingness Measures for Association Rules Mining Based on Profit. Discret. Dyn. Nat. Soc. 2015, 2015, 868634. [Google Scholar] [CrossRef] [Green Version]
- Bao, F.; Xu, W.; Feng, Y.; Xu, C. A Topic-Rank Recommendation Model Based on Microblog Topic Relevance & User Preference Analysis. Hum. Cent. Comput. Inf. Sci. 2022, 12, 10. [Google Scholar] [CrossRef]
- Ivanov, D. Predicting the impacts of epidemic outbreaks on global supply chains: A simulation-based analysis on the coronavirus outbreak (COVID-19/SARS-CoV-2) case. Transp. Res. Part E Logist. Transp. Rev. 2020, 136, 101922. [Google Scholar] [CrossRef] [PubMed]
- Bao, F.; Mao, L.; Zhu, Y.; Xiao, C.; Xu, C. An Improved Evaluation Methodology for Mining Association Rules. Axioms 2022, 11, 17. [Google Scholar] [CrossRef]
- Ju, C.; Jiang, Y.; Bao, F.; Zou, B.; Xu, C. Online Rumor Diffusion Model Based on Variation and Silence Phenomenon in the Context of COVID-19. Front. Public Health 2022, 9, 788475. [Google Scholar] [CrossRef]
- Ju, C.; Wang, C.; Jiang, Y.; Bao, F.; Zhou, H.; Xu, C. Exploring a Multi-layer Coupled Network Propagation Model Based on Information Diffusion and Bounded Trust. Int. J. Public Health, 2022; in press. [Google Scholar]
- Li, X.; Li, Y. On green market segmentation under subsidy regulation. Supply Chain. Manag. Int. J. 2017, 22, 284–294. [Google Scholar] [CrossRef]
- Liu, Y.; Ren, W.; Xu, Q.; Liu, Z. A coordination mechanism through cost sharing of corporate social responsibility and government subsidy in a two-echelon supply chain. J. Bus. Ind. Mark. 2021, 37, 29–46. [Google Scholar] [CrossRef]
- Bonilla, D.; Keller, H.; Schmiele, J. Climate policy and solutions for green supply chains: Europe’s predicament. Supply Chain. Manag. Int. J. 2015, 20, 249–263. [Google Scholar] [CrossRef] [Green Version]
- Xu, Y.; Liu, Q.; Zhou, L. Research on closed-loop dual-channel recycling supply chain decision-making based on game theory. J. Syst. Simul. 2022, 34, 396–408. [Google Scholar]
- Berger, P.D.; Gerstenfeld, A.; Zeng, A.Z. How many suppliers are best? A decision-analysis approach. Omega 2004, 32, 9–15. [Google Scholar] [CrossRef]
- Sawik, T. Selection of supply portfolio under disruption risks. Omega 2011, 39, 194–208. [Google Scholar] [CrossRef]
- Sawik, T. Selection of resilient supply portfolio under disruption risks. Omega 2013, 41, 259–269. [Google Scholar] [CrossRef]
- Hosseini, S.; Barker, K. A Bayesian network model for resilience-based supplier selection. Int. J. Prod. Econ. 2016, 180, 68–87. [Google Scholar] [CrossRef]
- Yan, Y.; Liu, X.; Zhuang, X. Emergency Management Strategy of Elastic Supply Chain Based on Node Failure. Control Decis. 2010, 25, 25–30. [Google Scholar]
- Li, N. Research on collaborative management of emergency supply chain for novel coronavirus pneumonia. Health Econ. Res. 2020, 37, 7–9. [Google Scholar]
- Fan, X.; Lu, M. Influencing factors and evaluation of supply chain resilience of auto companies under the new crown epidemiccoronavirus pandemic. Ind. Technol. Econ. 2020, 39, 21–28. [Google Scholar]
- Govindan, K.; Mina, H.; Alavi, B. A decision support system for demand management in healthcare supply chains considering the epidemic outbreaks: A case study of coronavirus disease 2019 (COVID-19). Transp. Res. Part E Logist. Transp. Rev. 2020, 138, 101967. [Google Scholar] [CrossRef]
- Ivanov, D.; Dolgui, A. Viability of intertwined supply networks: Extending the supply chain resilience angles towards survivability. A position paper motivated by COVID-19 outbreak. Int. J. Prod. Res. 2020, 58, 2904–2915. [Google Scholar] [CrossRef] [Green Version]
- Yang, Y.; Zou, M.; Xie, G.; Li, Z.; Ni, W. Supply chain recovery mechanism under major public health emergencies. J. Manag. 2020, 17, 1433–1442. [Google Scholar]
- Paul, S.K.; Chowdhury, P. A production recovery plan in manufacturing supply chains for a high-demand item during COVID-19. Int. J. Phys. Distrib. Logist. Manag. 2020, 51, 104–125. [Google Scholar] [CrossRef]
- Ivanov, D.; Das, A. Coronavirus (COVID-19/SARS-CoV-2) and supply chain resilience: A research note. Int. J. Integr. Supply Manag. 2020, 13, 90–102. [Google Scholar] [CrossRef]
- Cheng, Y.S.; Chiou, C.C.; Tai, C.C. A system dynamics modeling approach for the strategic management of TFT-LCD supply chains. In Proceedings of the PICMET’08—2008 Portland International Conference on Management of Engineering & Technology, Cape Town, South Africa, 27–31 July 2008; pp. 1689–1697. [Google Scholar]
- Campuzano, F.; Mula, J.; Peidro, D. Fuzzy estimations and system dynamics for improving supply chains. Fuzzy Sets Syst. 2010, 161, 1530–1542. [Google Scholar] [CrossRef]
- Langroodi, R.R.P.; Amiri, M. A system dynamics modeling approach for a multi-level, multi-product, multi-region supply chain under demand uncertainty. Expert Syst. Appl. 2016, 51, 231–244. [Google Scholar] [CrossRef]
- Wilson, M.C. The impact of transportation disruptions on supply chain performance. Transp. Res. Part E Logist. Transp. Rev. 2007, 43, 295–320. [Google Scholar] [CrossRef]
- Huang, M.; Yang, M.; Zhang, Y.; Liu, B. System dynamics modeling-based study of contingent sourcing under supply disruptions. Syst. Eng. Procedia 2012, 4, 290–297. [Google Scholar] [CrossRef] [Green Version]
- Pimenta, M.L.; Cezarino, L.O.; Piato, E.L.; da Silva, C.H.P.; Oliveira, B.G.; Liboni, L.B. Supply chain resilience in a Covid-19 scenario: Mapping capabilities in a systemic framework. Sustain. Prod. Consum. 2022, 29, 649–656. [Google Scholar] [CrossRef]
- Misra, B.; Prigogine, I.; Courbage, M. From deterministic dynamics to probabilistic descriptions. Phys. A Stat. Mech. Its Appl. 1979, 98, 1–26. [Google Scholar] [CrossRef]
- Xie, K.; Zhu, S.; Gui, P. A Game-Theoretic Approach for CSR Emergency Medical Supply Chain during COVID-19 Crisis. Sustainability 2022, 14, 1315. [Google Scholar] [CrossRef]
- Guo, D.; He, Y.; Wu, Y.; Xu, Q. Analysis of supply chain under different subsidy policies of the government. Sustainability 2016, 8, 1290. [Google Scholar] [CrossRef] [Green Version]
- Wang, W.; Zhang, P.; Ding, J.; Li, J.; Sun, H.; He, L. Closed-loop supply chain network equilibrium model with retailer-collection under legislation. J. Ind. Manag. Optim. 2019, 15, 199. [Google Scholar] [CrossRef] [Green Version]
- Olivares-Aguila, J.; ElMaraghy, W. System dynamics modelling for supply chain disruptions. Int. J. Prod. Res. 2020, 59, 1757–1775. [Google Scholar] [CrossRef]
- Macdonald, J.R.; Corsi, T.M. Supply chain disruption management: Severe events, recovery, and performance. J. Bus. Logist. 2013, 34, 270–288. [Google Scholar] [CrossRef]
- Zeng, Z.; Guan, D. Methodology and application of flood footprint accounting in a hypothetical multiple two-flood event. Philos. Trans. R. Soc. A 2020, 378, 20190209. [Google Scholar] [CrossRef] [Green Version]
- Ivanov, D.; Rozhkov, M. Coordination of production and ordering policies under capacity disruption and product write-off risk: An analytical study with real-data based simulations of a fast moving consumer goods company. Ann. Oper. Res. 2017, 291, 387–407. [Google Scholar] [CrossRef]
- Guan, D.; Wang, D.; Hallegatte, S.; Davis, S.J.; Huo, J.; Li, S.; Bai, Y.; Lei, T.; Xue, Q.; Coffman, D.M.; et al. Global supply-chain effects of COVID-19 control measures. Nat. Hum. Behav. 2020, 4, 577–587. [Google Scholar] [CrossRef]
- Schmitt, T.G.; Kumar, S.; Stecke, K.E.; Glover, F.W.; Ehlen, M.A. Mitigating disruptions in a multi-echelon supply chain using adaptive ordering. Omega 2017, 68, 185–198. [Google Scholar] [CrossRef]
- Cao, Y.; Mao, Q. How do government subsidies affect the capacity utilization rate of Chinese enterprises? Ind. Econ. Res. 2020, 2, 58–72. [Google Scholar]
- Shao, W.; Yang, K.; Bai, X. Impact of financial subsidies on the R&D intensity of new energy vehicles: A case study of 88 listed enterprises in China. Energy Strategy Rev. 2021, 33, 100580. [Google Scholar]
- Jia, S.; Xu, D. The Paradox of Overcapacity and the Mystery of China’s Investment Expansion: A New Explanation. Economist 2016, 11, 71–82. [Google Scholar]
- Xu, C.; Ding, A.S.; Zhao, K. A novel POI recommendation method based on trust relationship and spatial-temporal factors. Electron. Commer. Res. Appl. 2021, 48, 101060. [Google Scholar] [CrossRef]
- Tao, L.; Sun, H.; Cao, Y.; Wen, X.; Liu, C.; Yuan, J. Recovery strategies considering government subsidies in the circumstances of supply chain interruption. Comput. Integr. Manuf. Syst. 2022, 28, 242–257. [Google Scholar]
- Xu, C.; Liu, D.; Mei, X. Exploring an Efficient POI Recommendation Model Based on User Characteristics and Spatial-Temporal Factors. Mathematics 2021, 9, 2673. [Google Scholar] [CrossRef]
- Xu, C. A novel recommendation method based on social network using matrix factorization technique. Inf. Process. Manag. 2018, 54, 463–474. [Google Scholar] [CrossRef]
- Wang, J.; Xu, C.; Liu, W. Understanding the adoption of mobile social payment: From the cognitive behavioral perspective. Int. J. Mob. Commun. 2022, 20, 483–506. [Google Scholar]
- Han, X.; Ju, C.; Bao, F.; Xu, C.; Zhu, Y.; Chen, Y. Sharing Reward Program Based on Face Consciousness in Social Media. Psychol. Res. Behav. Manag. 2022, 15, 1147–1166. [Google Scholar] [CrossRef]
- Xiang, K.; Xu, C.; Wang, J. Understanding the Relationship Between Tourists’ Consumption Behavior and Their Consumption Substitution Willingness Under Unusual Environment. Psychol. Res. Behav. Manag. 2021, 14, 483–500. [Google Scholar] [CrossRef]
Figure 1.
Supply chain policy structure for high-demand products.

Figure 2.
Manufacturer’s system stock flow chart.
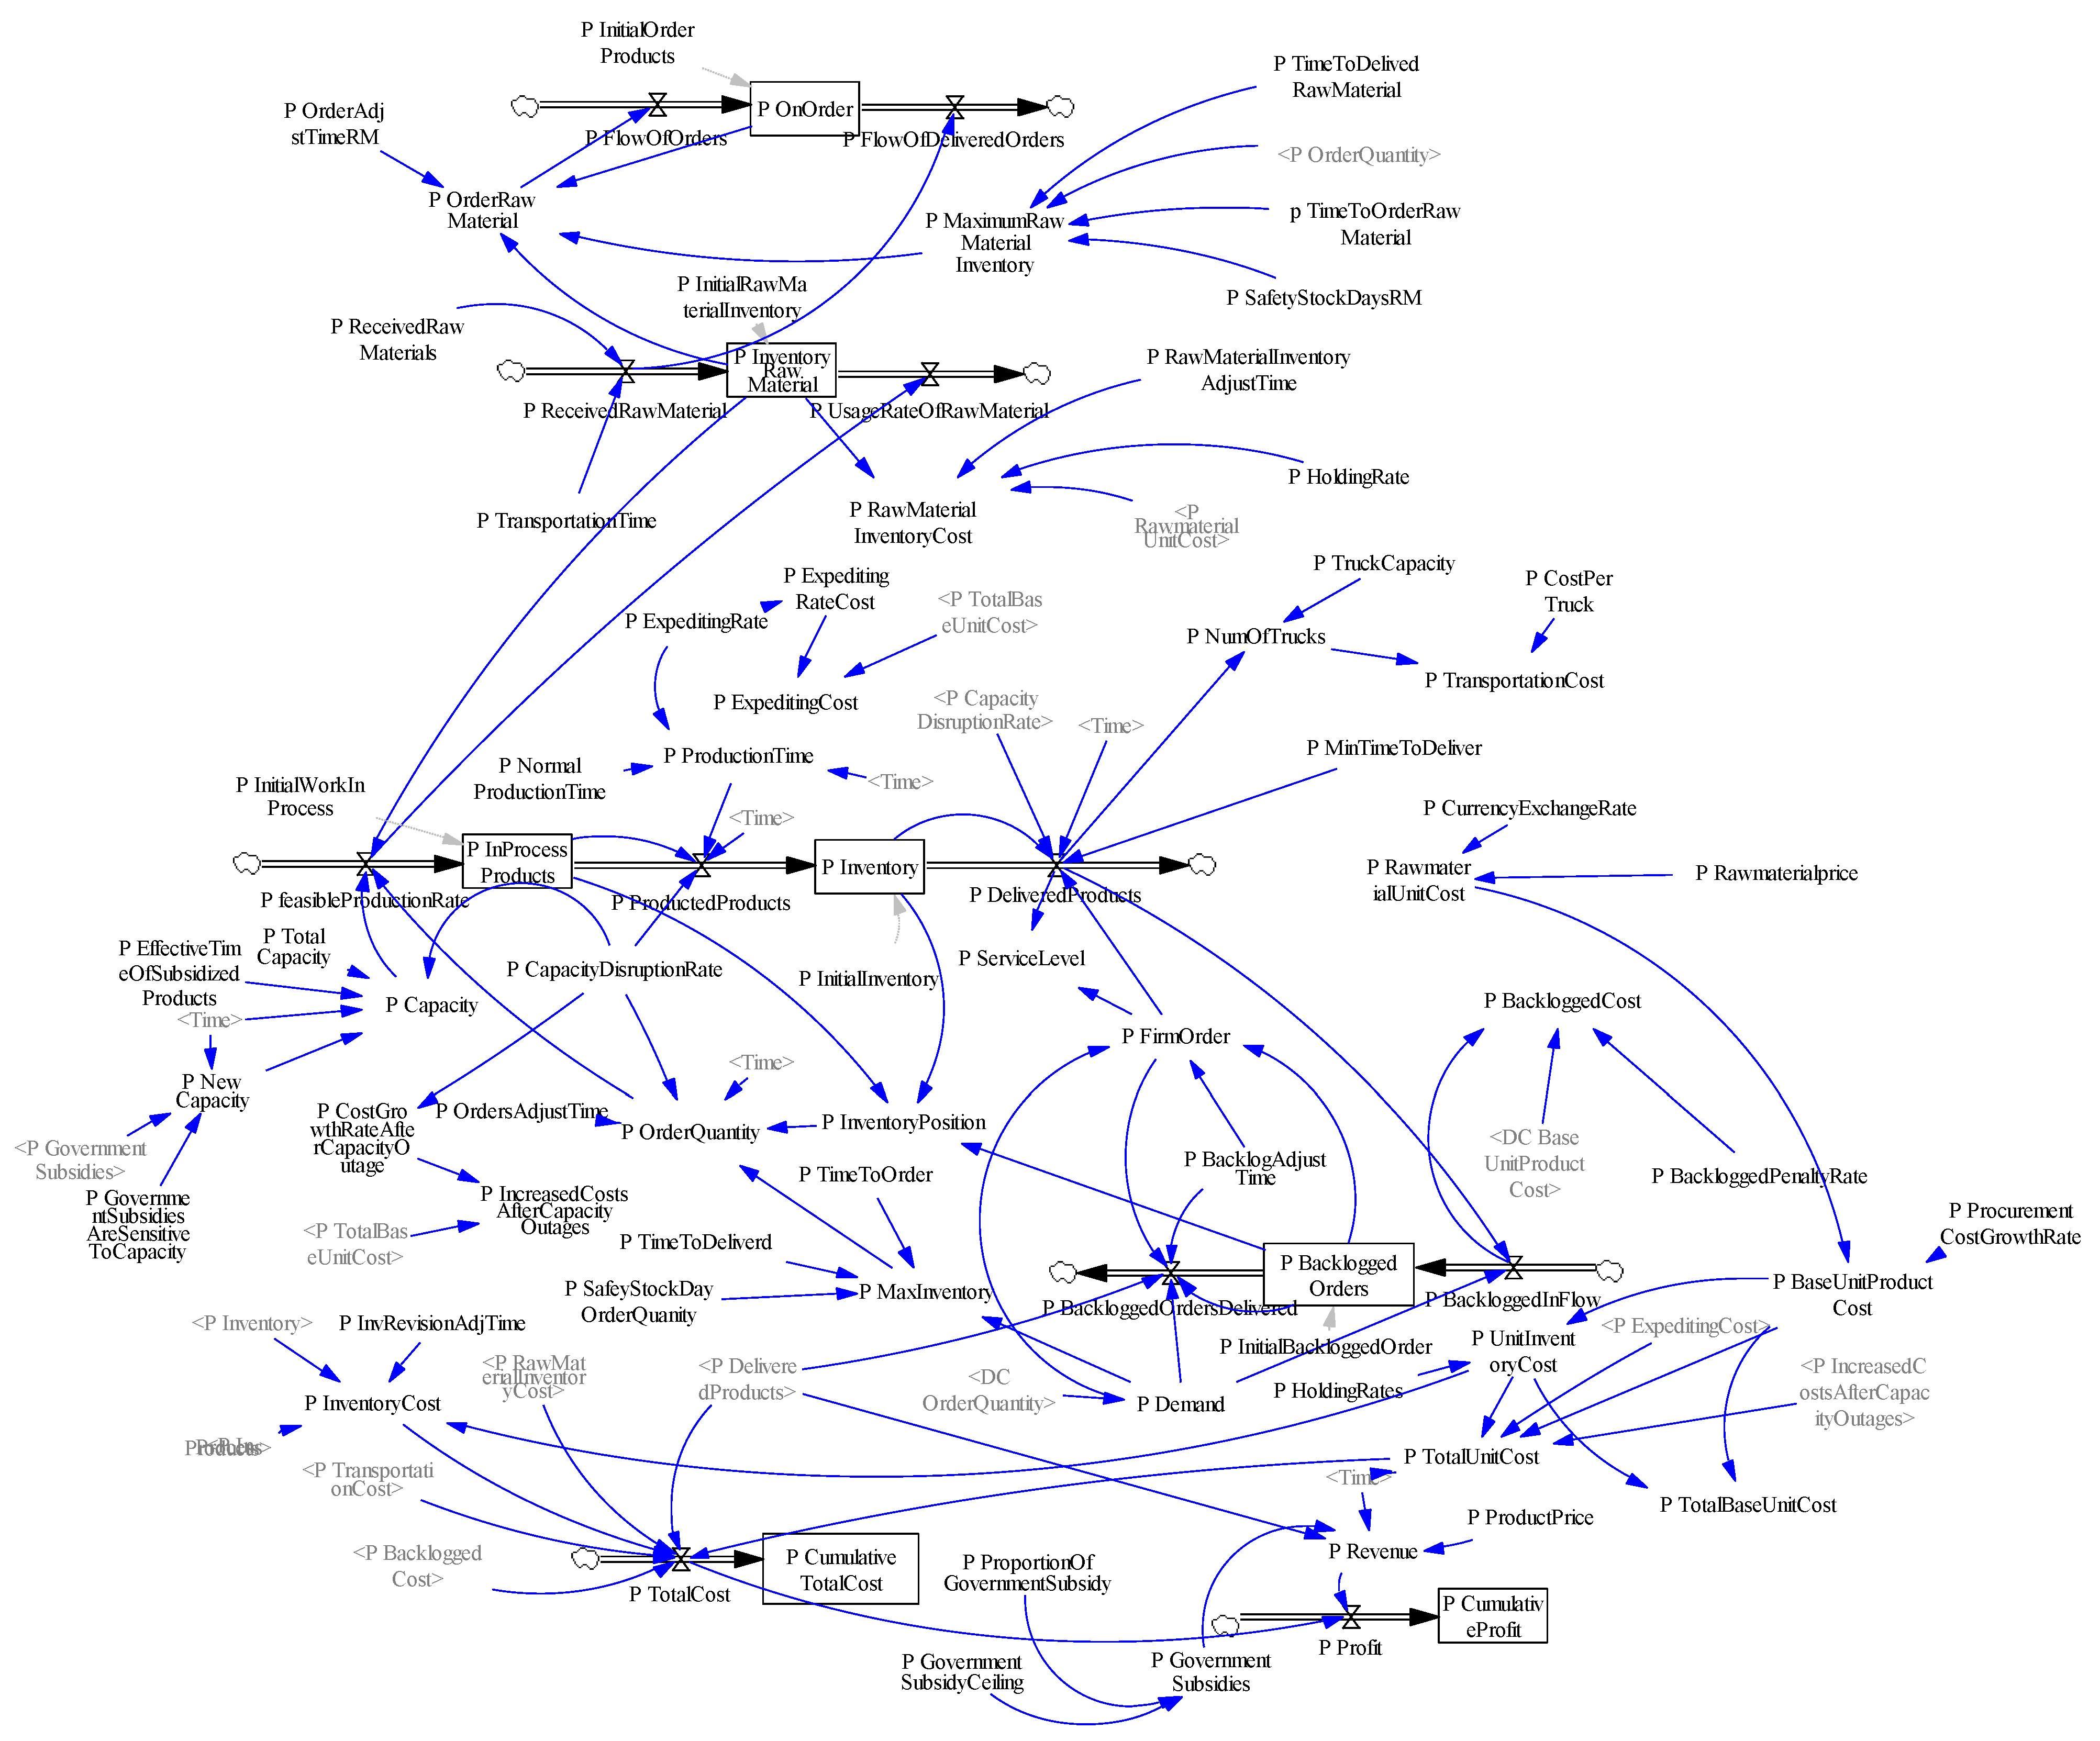
Figure 3.
System stock-flow diagram of distribution center.
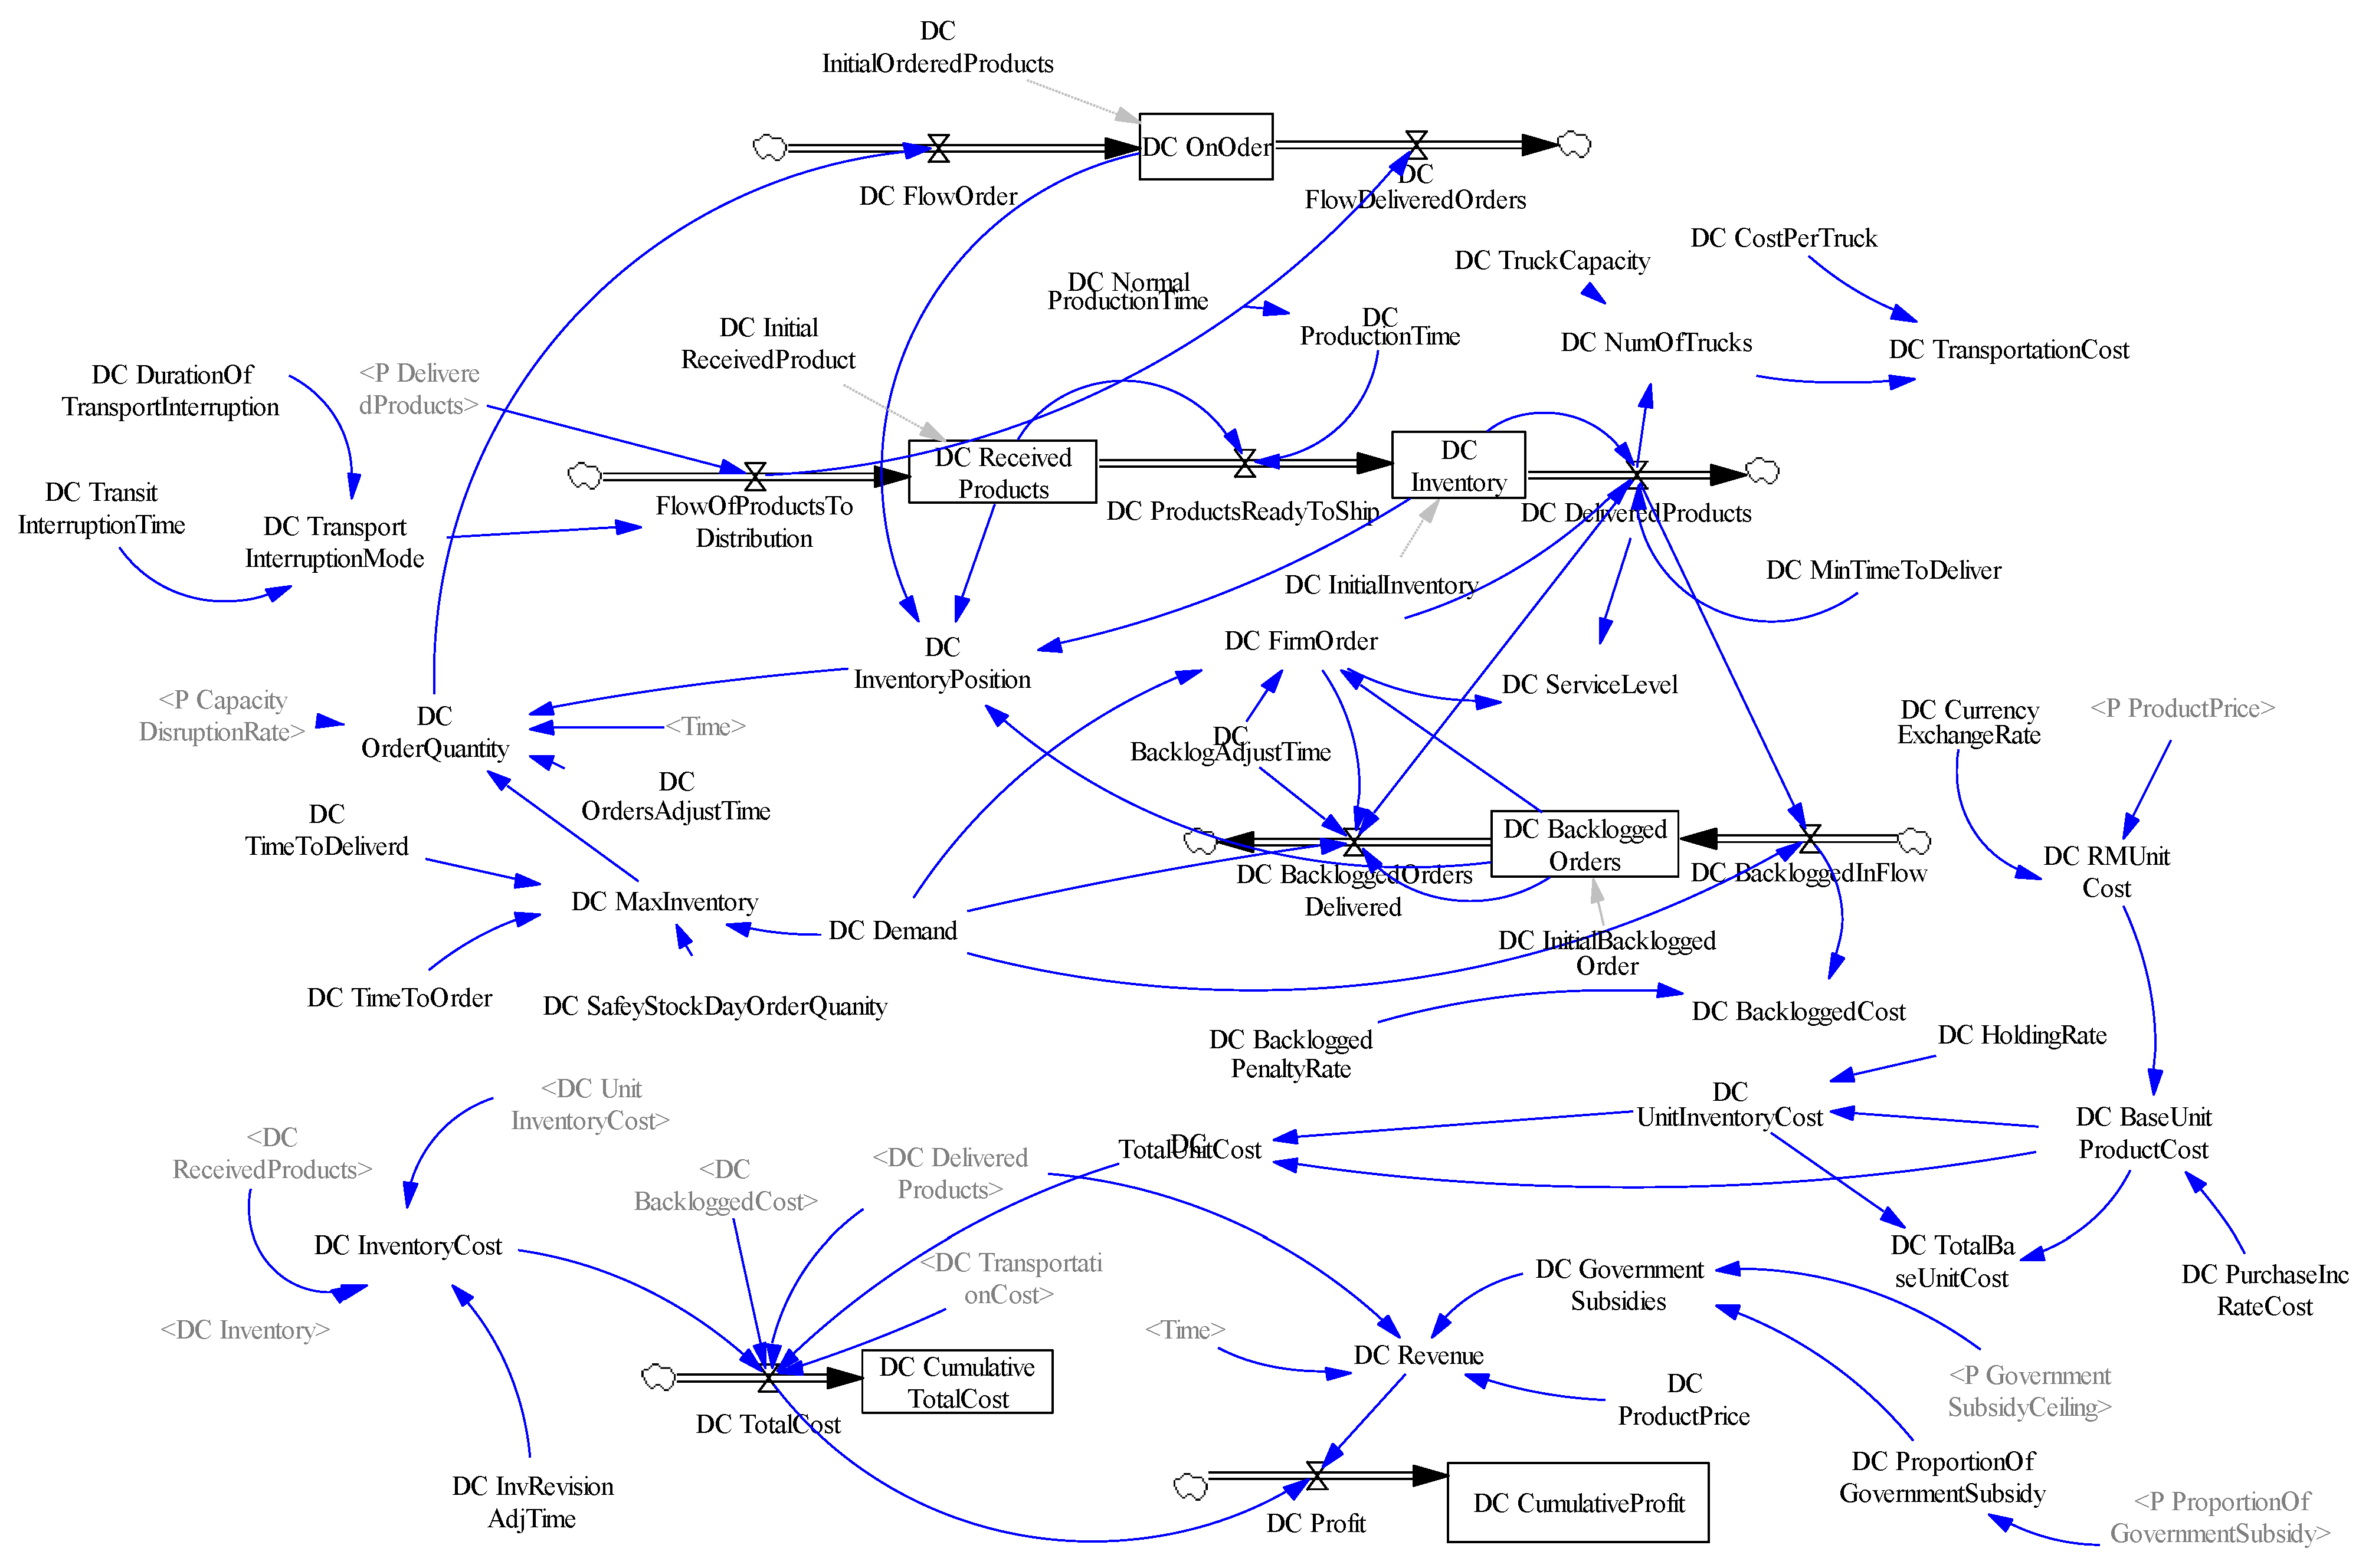
Figure 4.
Cumulative total profit dc for different purchasing growth rates.

Figure 5.
Cumulative total profit p under partial interruption of transportation and interruption of production capacity.
Figure 5.
Cumulative total profit p under partial interruption of transportation and interruption of production capacity.
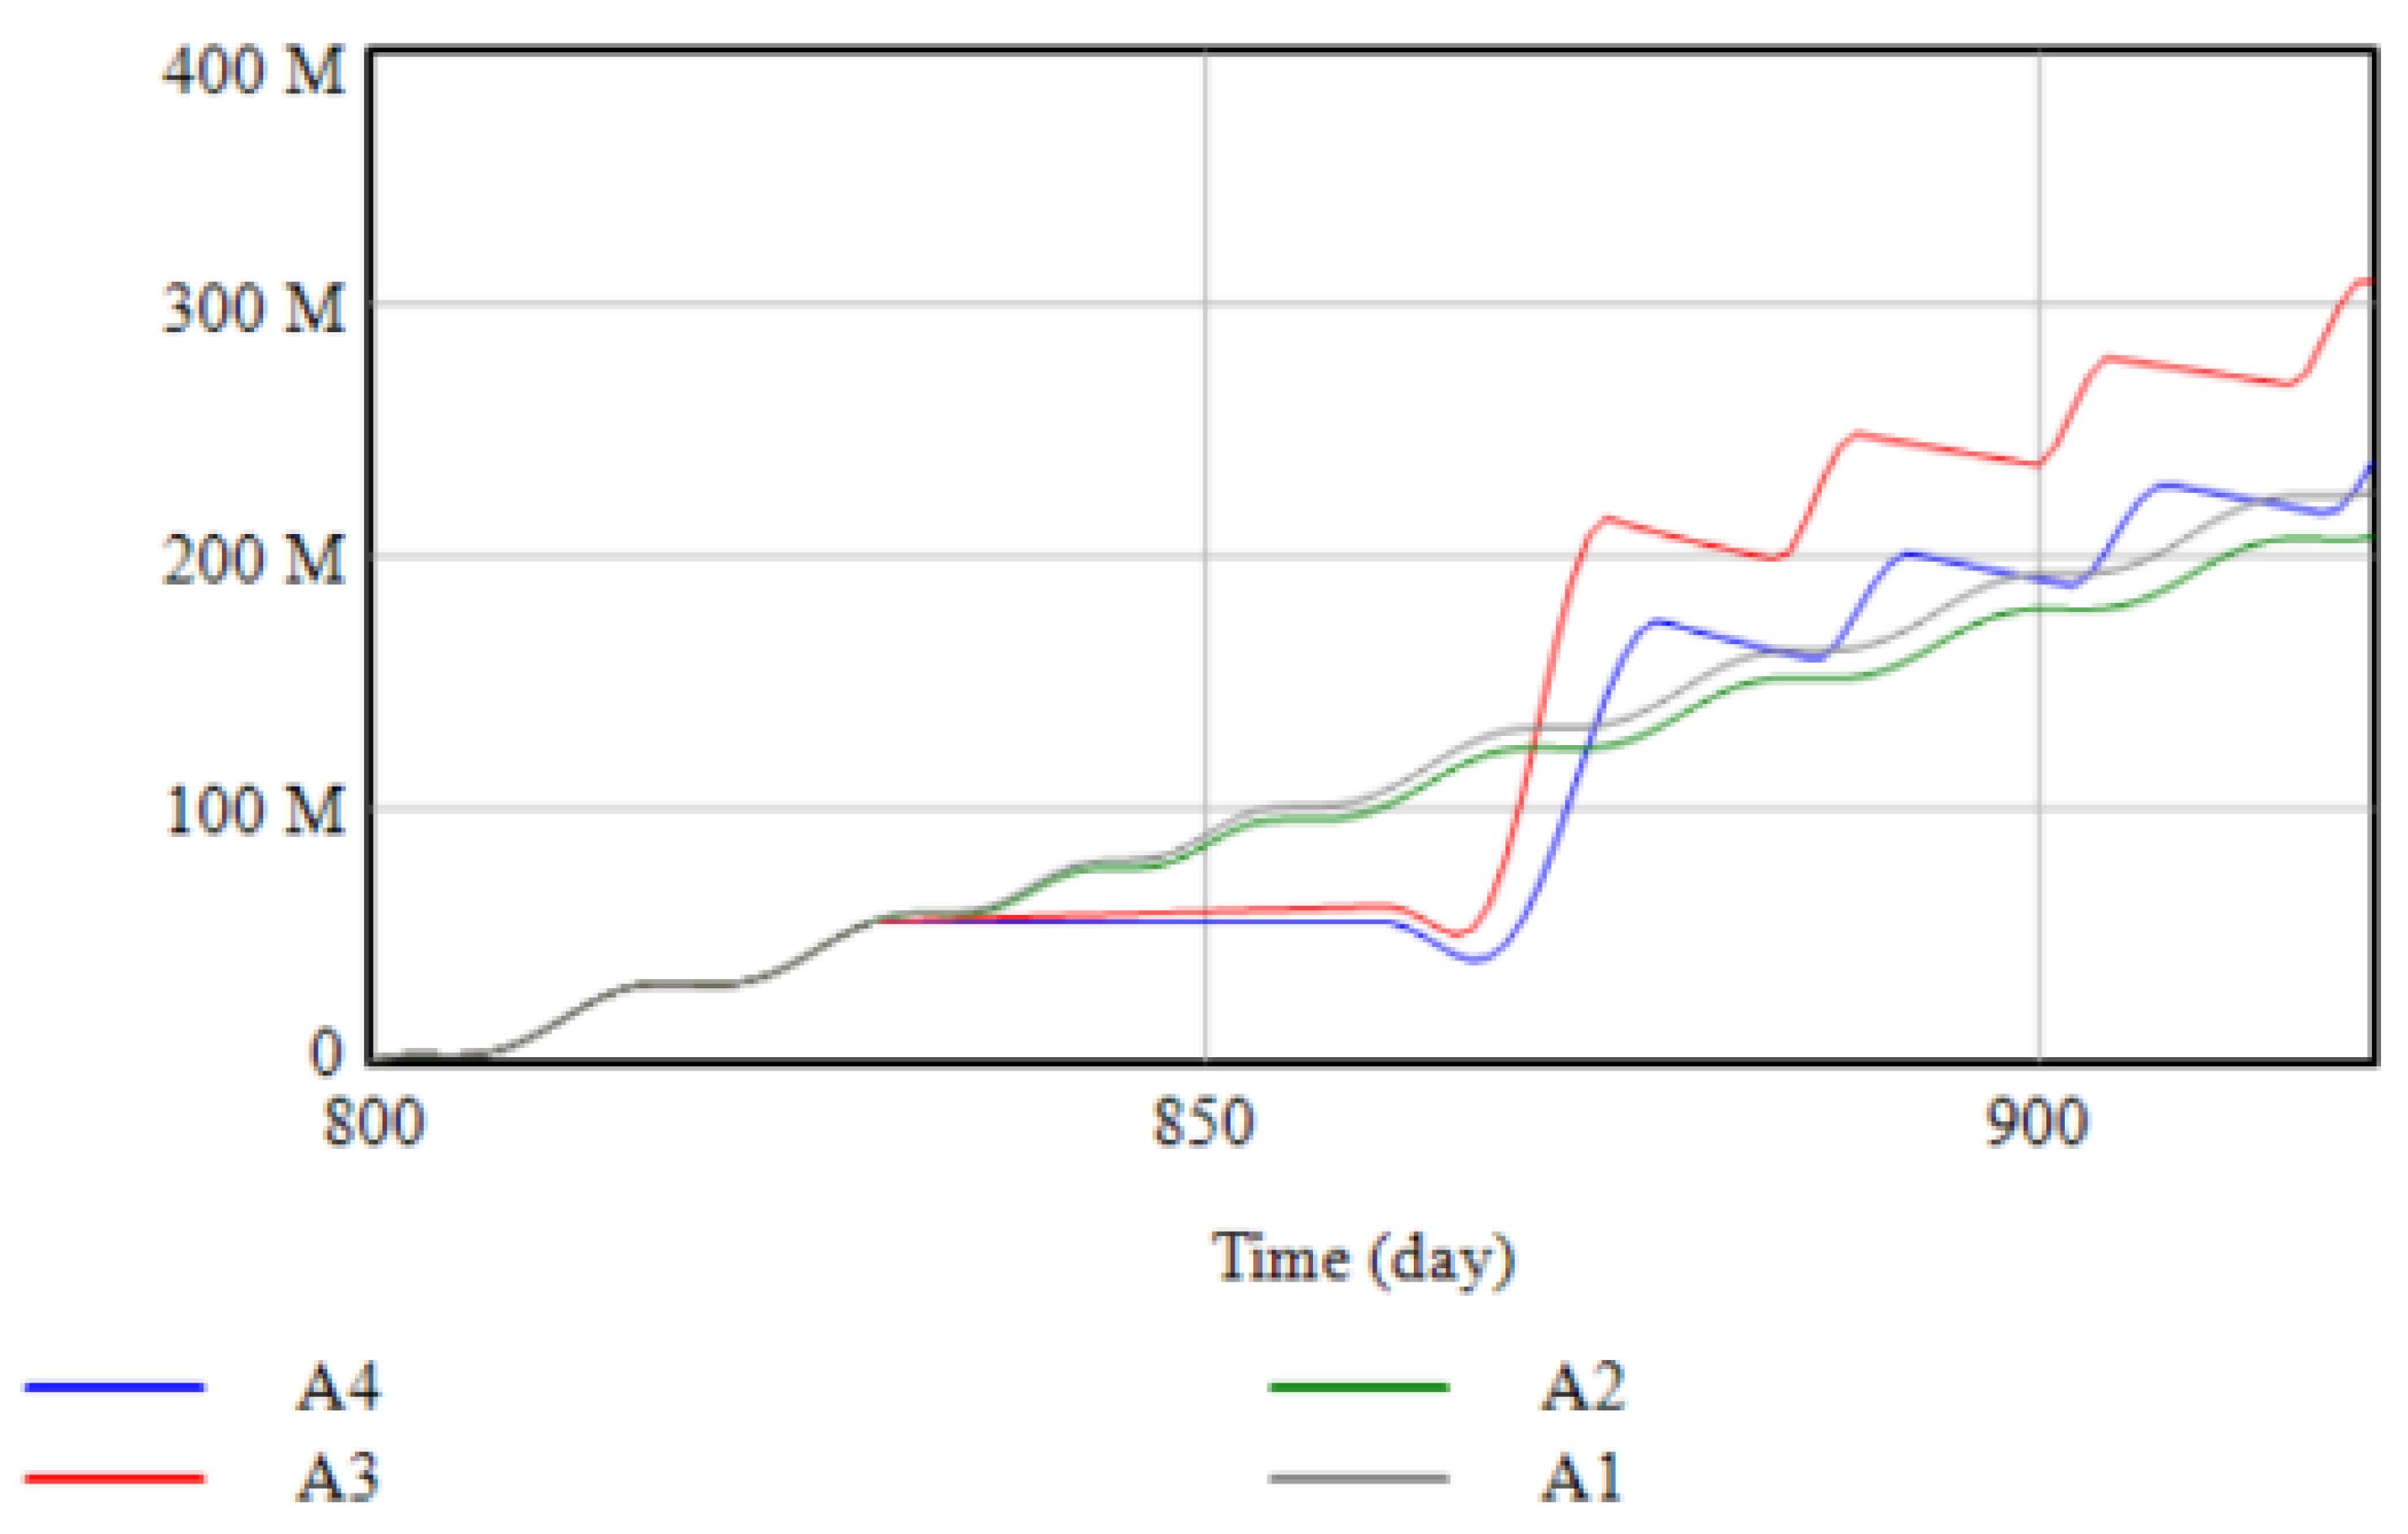
Figure 6.
Cumulative total profit dc under partial interruption of transportation and capacity interruption.
Figure 6.
Cumulative total profit dc under partial interruption of transportation and capacity interruption.

Figure 7.
Cumulative total profit p under complete transport interruption and capacity interruption.
Figure 7.
Cumulative total profit p under complete transport interruption and capacity interruption.

Figure 8.
Cumulative total profit dc under full transport disruption and capacity disruption.
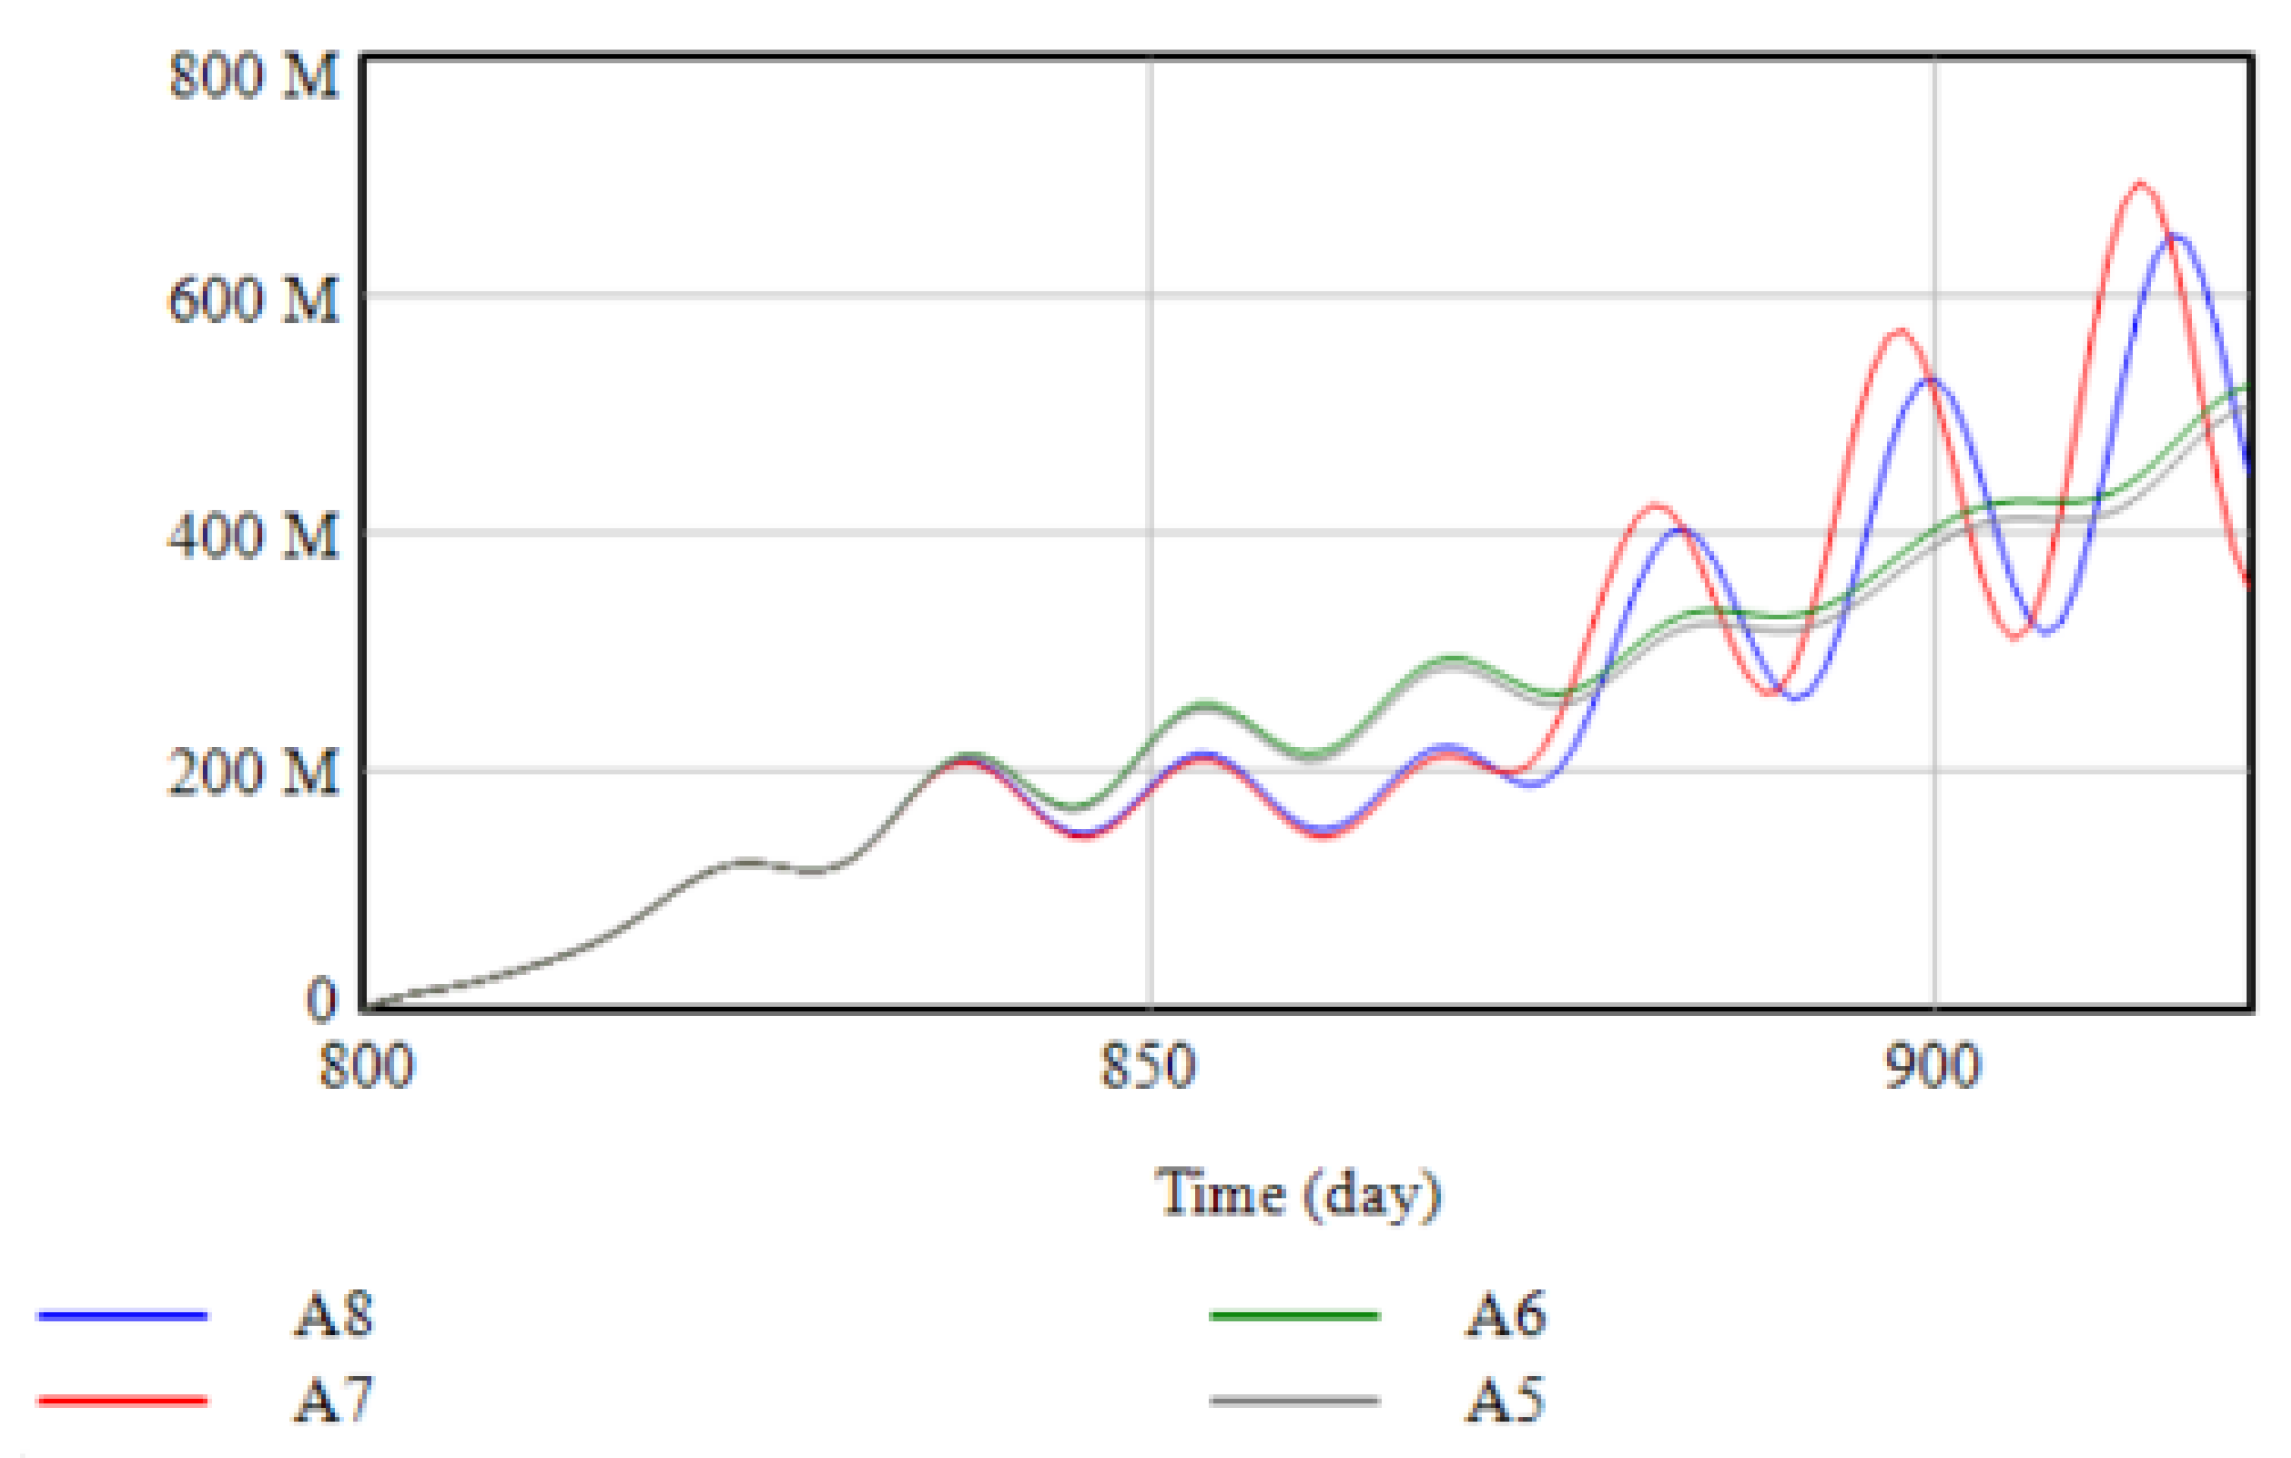
Table 1.
Interruption and Government Subsidy Scenario Settings.
| Situation | P Capacity Interruption Rate | Length of Transport Interruption | P Government Subsidy Ratio | DC Government Subsidy Ratio |
|---|---|---|---|---|
| A1 | 0.5 | 30 | 1 | 0 |
| A2 | 0.5 | 30 | 0 | 1 |
| A3 | 1 | 30 | 1 | 0 |
| A4 | 1 | 30 | 0 | 1 |
| A5 | 0.5 | 50 | 1 | 0 |
| A6 | 0.5 | 50 | 0 | 1 |
| A7 | 1 | 50 | 1 | 0 |
| A8 | 1 | 50 | 0 | 1 |
Publisher’s Note: MDPI stays neutral with regard to jurisdictional claims in published maps and institutional affiliations. |
© 2022 by the authors. Licensee MDPI, Basel, Switzerland. This article is an open access article distributed under the terms and conditions of the Creative Commons Attribution (CC BY) license (https://creativecommons.org/licenses/by/4.0/).
Share and Cite
MDPI and ACS Style
Ju, C.; Zhao, J.; Li, K.; Bao, F.; Xu, C.; Ran, J. Supply Chain Recovery Strategies for High Demand Products Based on the Impact of Capacity and Transportation Disruptions. Systems 2022, 10, 88. https://doi.org/10.3390/systems10040088
AMA Style
Ju C, Zhao J, Li K, Bao F, Xu C, Ran J. Supply Chain Recovery Strategies for High Demand Products Based on the Impact of Capacity and Transportation Disruptions. Systems. 2022; 10(4):88. https://doi.org/10.3390/systems10040088
Chicago/Turabian StyleJu, Chunhua, Jiehao Zhao, Ke Li, Fuguang Bao, Chonghuan Xu, and Jiarui Ran. 2022. "Supply Chain Recovery Strategies for High Demand Products Based on the Impact of Capacity and Transportation Disruptions" Systems 10, no. 4: 88. https://doi.org/10.3390/systems10040088
Note that from the first issue of 2016, this journal uses article numbers instead of page numbers. See further details here.