Article

Stability Analysis of Low-Carbon Technology Innovation Cooperation under a Reward and Punishment Mechanism

1
School of Management, Jiangsu University, Zhenjiang 212013, China
2
Baidu USA LLC, 1195 Bordeaux Drive, Sunnyvale, CA 94089, USA
3
School of Finance & Economics, Jiangsu University, Zhenjiang 212013, China
*
Author to whom correspondence should be addressed.
Systems 2022, 10(4), 118; https://doi.org/10.3390/systems10040118
Submission received: 30 June 2022 / Revised: 28 July 2022 / Accepted: 9 August 2022 / Published: 10 August 2022

Abstract

:
In this study, we constructed a tripartite evolutionary game model for a large-scale enterprise (A), a small-scale enterprise (B), and a government, based on finite rationality and information asymmetry. First, we investigated and analyzed the stakeholders of low-carbon technology innovation (LCTI) and constructed a tripartite evolutionary game model. Then, we analyzed the conditions for the stability of different equilibrium points. Finally, we carried out numerical simulations using MATLAB 2020b to analyze the evolutionary processes and patterns of the different parameters. We found that the government’s strategic choice is always to participate in LCTI, which is conducive to a healthy LCTI environment. Governments can participate in LCTI consortiums through policy-driven reward and punishment mechanisms. Our simulation demonstrated that the size of enterprises influences their choice of LCTI strategy, and government reward and punishment mechanisms influence both large and small firms. Large firms are more prepared to accept the risks of LCTI and maintain a reciprocal LCTI strategy even in a high-cost scenario, while small firms are more sensitive to the costs and benefits. Thus, government reward and punishment mechanisms should take full account of small-scale enterprises. We propose a sound reward and punishment mechanism for LCTI that limits the opportunistic behavior of enterprises. Therefore, this paper is a complement to theories such as innovation systems and provides new thinking for low-carbon technology innovation cooperation of enterprises. Meanwhile, the reward and punishment mechanism proposed in this paper has important practical value for the government.

1. Introduction

The overexploitation of fossil fuels has led to rapid global economic growth, resource depletion, and the greenhouse effect. According to the Global Carbon Project (GCP) “Global Carbon Budget 2020” report, global carbon dioxide emissions from fossil energy combustion have been rising over the past decade, averaging 9.6 GtC per year [1]. In November 2021, the Glasgow Climate Convention was signed at the 26th United Nations Climate Change Conference (COP26). The Convention indicated that human activities have contributed to a global average warming of about 1.1 °C above pre-industrial levels, and that this trend is set to continue [2]. As the average global temperature rises, the risk of extreme weather events increases. According to the World Meteorological Organization’s “Global Climate Report 2021” [3], the United States experienced severe cold weather in February, a heatwave struck North America in June, and July saw flooding in Western Europe and extreme rainfall in China.
Low-carbon technology innovation (LCTI) is an effective way to reduce corporate carbon emissions [4]. In addition to increasing investment in low-carbon technology research, governments have implemented policies such as carbon trading, carbon taxes, and regulations to promote LCTI [5]. An increase in carbon taxes results in a stable but less profitable equilibrium for both low- and non-low-carbon firms. In contrast, when the government provides subsidies to only low-carbon firms, all firms earn higher profits, meaning that non-low-carbon firms receive a portion of the subsidy, thus weakening its incentive effect [6]. However, promoting LCTI requires not only incentives, such as carbon tax incentives, but also corresponding penalties. All administrative penalties can encourage firms to engage in technological innovation [7]. Chen and Hu argue that a bilateral dynamic punishment mechanism is more effective and can provide more incentives for firms [8]. This indicates that the government needs to play an important role in the LCTI system.
Firms that choose to collaborate on LCTI are likely to act opportunistically to maximize their benefits. Information and resource asymmetries have a significant and positive impact on opportunism [9]. Contract theory argues that opportunism causes economic harm and violates ethical norms [10]. Opportunistic behavior is the devious pursuit of self-interest [11]; for example, when one party to a collaboration acquires the other party’s knowledge and terminates the collaboration before disclosing their own. Opportunism and technological uncertainty alone may not be sufficient to moderate the interdependence–cooperation relationship [12]. In addition, opportunism is a major threat to the survival and success of technology innovation alliances [13], which indicates that we must address the opportunistic nature of business collaboration in LCTI through a combination of factors.
In this study, we analyzed the relationship between a large-scale enterprise (A), a small-scale enterprise (B), and a government in the LCTI system. The LCTI activities of enterprises involve several agents, including other enterprises, research institutions, investment institutions, and local governments, which form an innovation network. Companies can collaborate with businesses and with research institutions. Benefits are important for maintaining cooperation in technological innovation. The high costs and risks have made many enterprises reluctant to take the initiative in LCTI. As a result, the drive for profit has encouraged opportunistic behavior by some enterprises in the process of collaboration.
Therefore, the motivation of this paper is summarized as: How to understand the LCTI behavior of firms of different sizes under bilateral reward and punishment mechanisms? How to clearly describe the role played by the government in LCTI? To address these questions, this paper introduces evolutionary game theory to model the behavior of the interaction between the government and enterprises of different scales, and analyzes the evolutionary process and equilibrium point of their game behavior. Our main research contributions are as follows: First, we introduce government bilateral incentives and penalties into the evolutionary game model constructed to analyze the impact of LCTI on firms of different sizes. Second, we consider the different reciprocal and opportunistic cooperative behaviors of differently sized firms. Third, we propose a well-developed government-led award and punishment mechanism that offers different penalties and incentives for enterprises of different sizes to achieve a stable LCTI system.
The remainder of this paper is constructed as follows: In Section 2, we review the literature related to this study, and in Section 3, we describe the research framework, evolutionary game model, payoff matrix, replicator dynamics functions, and stability analysis of the equilibrium points. In Section 4, we analyze the sensitivity of the main parameters of the three participants using numerical simulations, and in Section 5, we put forward a promotion mechanism based on our findings. In Section 6, we summarize the conclusions and limitations of our research.

2. Review of the Literature

2.1. A Study of the Evolution of LCTI

The research into the evolution of LCTI has focused on three dimensions. The first is the impact level of low-carbon technology innovation. The cooperation of LCTI is influenced by a variety of factors. For enterprises, there is a large gap between different sizes of enterprises in their ability to innovate technology. Small- and medium-sized enterprises are often unable to successfully carry out technological innovation due to insufficient funds [14]. The government occupies an important position in the technological innovation system. Policy uncertainty dynamically adjusts firms’ technological innovation [15]. Moreover, the government can provide a strong server, gas pedal, and other functional support for corporate technological innovation in the financial market through normal intervention in the financial market [16,17]. Besides, LCTI is influenced by a variety of other factors, including green credit policies [18], demand-side policies [19], environmental regulation [20,21], emission trading schemes [22], economic scale and R&D efficiency [23], carbon emission trading [24], low-carbon city pilot policies [25], and social low-carbon awareness and culture [26].
The second is the managerial dimension of corporate LCTI. Corporate executives’ perceptions of LCTI influence corporate low-carbon management and financial performance, and managerial discretion actively moderates the relationship between executives’ low-carbon perceptions and behavior [27]. This determines the type of decisions made by companies in the process of technological innovation cooperation. Deng et al. argued that firms can improve their LCTI through the incentives of cost-sharing contracts, which are conducive to increased profits [28]. This belongs to reciprocal technological innovation cooperation, which is the key to technological innovation cooperation. In addition, opportunism as a moral decision plays an important role in the perspective of management ethics of technological innovation [29].
The third dimension is the study of LCTI systems. Building an LCTI system requires theoretical support for long-term development and different development needs [30]. Yang et al. constructed a composite system dynamics, synergistic evolution model, to form an LCTI system for new energy enterprises [31]. Yuan et al. constructed an innovation system of industry-academia-research knowledge sharing, a system that includes elements such as innovation benefit distribution, innovation cost sharing, and opportunistic benefits [32].

2.2. Research Methodology of LCTI

Researchers have used a variety of approaches and models to study LCTI, including the analytic hierarchy process (AHP), grey theory and fuzzy clustering analysis [33], the interpretative structural modeling method (ISM) [26], structural equation models [34], the logarithmic mean division index (LMDI) model [35], system dynamics, and questionnaire surveys [36]. Evolutionary games are also a common research method. As LCTI involves the cooperation of multiple actors, researchers study the LCTI behavior of multiple subjects participating in these evolutionary games, hoping to achieve an equilibrium within the LCTI system to promote a low-carbon economy. Zhao et al. constructed a new public–private partnership for personal carbon accounts (PPP-PCAs), building a three-party evolutionary game involving the government, the private sector, and consumers [37]. Yuan and Zheng selected the government, businesses, and consumers to construct their three-party LCTI evolutionary game model [38], while Zhou and Ren developed a model based on a spatial public goods game to solve the free-riding problem [39].
The literature review revealed that few studies have focused on LCTI collaboration by analyzing the relationship between governments and firms of different sizes. The same is true of studies based on the assumption of limited rationality. Moreover, no studies have analyzed the problem of corporate opportunism in the cooperation process, which clearly impacts LCTI outcomes. In this study, we constructed an asymmetric evolutionary game model for large-scale firms, small-scale firms, and governments. We introduced a government reward and punishment mechanism, and a numerical simulation to analyze the stability of the cooperation in different scenarios. Figure 1 depicts a relationship diagram for LCTI under a government reward and punishment mechanism.

3. Model Construction

3.1. Basic Assumptions

In this study, we conceptualized innovation cooperation between firms and governments as a dynamic game process, and proposed the following basic assumptions to maintain the objectivity and scientific nature of our research:
Assumption 1.
External forces do not guide the decisions of the subjects in the LCTI game system that influence the system evolution outcomes. The evolutionary game model includes three stakeholders: a large-scale enterprise (A), a small-scale enterprise (B), and the government.
Assumption 2.
Enterprises have two strategic options: reciprocity and opportunism. Enterprise A occupies a dominant position in the market. A firm’s market share influences the cost of its innovation collaboration. Companies A and B have equal LCTI requirements and both expect to achieve greater market returns from their input costs. They have limited rationality, can make independent decisions, and are committed to maximizing their benefits.
Assumption 3.
The government has two strategic options: participation and non-participation. Government involvement in LCTI can both positively and negatively affect businesses. The government can provide carbon tax incentives while also playing the role of supervisor, imposing penalties on opportunistic firms. Government involvement and corporate reciprocity can be environmentally and economically beneficial, but the opportunistic behavior of enterprises can be detrimental to the government.
Assumption 4.
The probability of enterprise A (or B) choosing reciprocity is  x   o r   y 0 , 1 , and their probability of choosing opportunism is 1 x o r   1 y ; the probabilities of the government choosing participation or non-participation are z ϵ 0 , 1 and 1 z , respectively. The matching of randomly selected individuals from the three groups becomes a simple 2 × 2 × 2 game subsystem. The game subsystem can be simplified into two strategies: firms can seek to cooperate with other firms, universities, and research institutions by choosing either reciprocity ( A x ,   B y ) or opportunism ( A 1 x ,   B 1 y ) . Governments can participate in corporate LCTI G Z , or adopt a wait-and-see attitude and not participate G 1 Z .
Based on the abovementioned assumptions, Table 1 lists the parameter symbols and definitions used throughout this paper.
We obtained the game matrix and payoff matrix of the three parties according to the strategies available to each, as shown in Table 2 and Table 3.

3.2. Model Establishment

The expected benefit of the reciprocity strategy for enterprise A is R 11 , the expected benefit of the opportunism strategy is R 12 , and the average expected return is R x .
R 11 = y z 1 + β α P 1 W α I + y 1 z α P 1 W α I + 1 y z 1 + β α P 1 W α I Δ W Δ I + 1 y 1 z α P 1 W α I Δ W Δ I
R 12   = y z 1 + β α P 2 W α I + Δ W L 1 + y 1 z α P 2 W α I + Δ W + 1 y z 1 + β α P 2 W α I L 1 + 1 y 1 z α P 2 W α I
R x = x R 11 + 1 x R 12
Based on Equations (1)–(3), we constructed the replicator dynamics function for enterprise A as follows:
F x = x R 11 R x = x R 11 + 1 x R 12
The expected benefit of the reciprocity strategy for enterprise B is R 21 , the expected benefit of the opportunism strategy is R 22 , and the average expected return is R y .
R 21 = x z α 1 [ 1 + β ( 1 α ) P 1 W 1 α I + x 1 z 1 α ) P 1 W 1 α I + ( 1 x ) z α 1 [ 1 + β ( 1 α ) P 2 W 1 α I + Δ W L 2 + 1 x 1 z [ 1 α ) P 2 W 1 α I + Δ W ]
R 22   = x z α 2 1 + β 1 α ) P 1 W 1 α I Δ W Δ I + x 1 z   ( 1 α ) P 1 W 1 α I Δ W Δ I + 1 x z 1 + β ( 1 α ) P 2 W 1 α I L 2 + 1 x 1 z ( 1 α ) P 2 W 1 α I ]
R y = y R 21 + 1 y R 22
Based on Equations (5)–(7), we constructed the replicator dynamics function for enterprise B as follows:
F y = y R 21 R y = y R 21 + 1 y R 22
The expected benefit of the participation strategy for the government is R 31 , the expected benefit of the non-participation strategy is R 32 , and the average expected return is R z .
R 31 = x y E + E 11 + x 1 y E 11 + 1 x y E + E 10 + L 2 S 1 + 1 x 1 y E 10 S 1  
R 32 = x y E + E 10 + L 1 S 1 + x 1 y E 10 S 1 + 1 x y E + L 1 + L 2 S 2 + 1 x 1 y S 2
R z = x R 31 + 1 x R 32
Based on Equations (9)–(11), we constructed the replicator dynamics function for the government as follows:
F z = z U 31 U z = z U 31 + 1 z U 32

3.3. Replicator Dynamic Analysis

Based on Equations (4), (8) and (12), we constructed the replicator dynamics function and first-order derivative for the three parties as follows:
F x = d x d t = x 1 x y 1 Δ I + z L 1 + α β W P 1 P 2 + α W P 1 P 2 Δ W F y = d y d t = y 1 y x 1 Δ I + z L 2 + β W P 1 P 2 1 α Δ W W P 1 P 2 α 1 F z = d z d t = z 1 z 1 x L 1 + 1 y L 2 + S 1 y 1 x + E
d F x d x = 2 x 1 1 y Δ I z L 1 + α β W P 1 P 2 α W P 1 P 2 + Δ W d F y d y = 2 y 1 1 x Δ I z L 2 + β W P 1 P 2 1 α + Δ W + W P 1 P 2 α 1 d F z d z = 2 z 1 y L 2 + S 1 x 1 + x 1 L 1 L 2 E

3.3.1. Stability Analysis of Enterprise A

We analyzed of the enterprise A’s evolutionarily stable strategies such that F x = 0 .
(1) We set G y = 1 y Δ I z L 1 + α β W P 1 P 2 α W P 1 P 2 + Δ W , and when G y = 0 , we obtained y = Δ W z L 1 + α β W P 1 P 2 α W P 1 P 2 + Δ I Δ I and F x 0 . The game is in a steady state regardless of the value of x .
(2) If G y 0 and F x = 0 , then x 1 = 0 , x 2 = 1 is the evolutionary strategy. By the nature of stable strategies in evolutionary games, enterprise A reaches a stable state when F x = 0   and d F x d x < 0 . Then, we analyzed the different scenarios for G y .
When G y < 0 and Δ W z L 1 + α β W P 1 P 2 α W P 1 P 2 + Δ I Δ I < y < 1 , we determined that d F x d x x = 1 < 0 and d F x d x x = 0 > 0 . At this point, x = 1 is the steady state and enterprise A prefers reciprocity, as shown in Figure 2a.
When G y > 0 and 0 < y < Δ W z L 1 + α β W P 1 P 2 α W P 1 P 2 + Δ I Δ I , we determined that d F x d x x = 1 > 0 and d F x d x x = 0 < 0 . At this point, x = 0 is the steady state, and enterprise A prefers opportunism, as shown in Figure 2b.

3.3.2. Stability Analysis of Enterprise B

We analyzed enterprise B’s evolutionarily stable strategies such that F y = 0 .
(1) We set H z = 1 x Δ I z L 2 + β W P 1 P 2 1 α + Δ W + W P 1 P 2 α 1 , and when H z = 0 , we obtained z = 1 x Δ I + Δ W + W P 1 P 2 α 1 L 2 + β W P 1 P 2 1 α and F y 0 . The game is in a steady state regardless of the value of y .
(2) If H z 0 and F y = 0 , then y 1 = 0 , y 2 = 1 is an evolutionary strategy. By the nature of stable strategies in evolutionary games, enterprise B reaches a stable state when F y = 0   and d F y d y < 0 . Then, we analyzed the different scenarios for H z .
When H z > 0 and 0 < z < 1 x Δ I + Δ W + W P 1 P 2 α 1 L 2 + β W P 1 P 2 1 α , we determined that d F y d y y = 1 > 0 and d F y d y y = 0 < 0 . At this point, y = 0 is the steady state, and enterprise B prefers opportunism, as shown in Figure 3a.
When H z < 0 and 1 x Δ I + Δ W + W P 1 P 2 α 1 L 2 + β W P 1 P 2 1 α < z < 1 , we determined that d F y d y y = 1 < 0 and d F y d y y = 0 > 0 . At this point, y = 1 is the steady state, and enterprise A prefers reciprocity, as shown in Figure 3b.

3.3.3. Stability Analysis of Government

We analyzed the government’s evolutionarily stable strategies such that F z = 0 .
(1) We set U y = y L 2 + S 1 x 1 + x 1 L 1 L 2 E , and when U y = 0 , we obtained y = E + L 2 x 1 L 1 L 2 + S 1 x 1 and F y 0 . The game is in a steady state regardless of the value of y .
(2) If U y 0 and F y = 0 , then z 1 = 0 , z 2 = 1 is the evolutionary strategy. By the nature of stable strategies in evolutionary games, the government reaches a stable state when F z = 0   and d F z d z < 0 . Then, we analyzed the different scenarios for H y .
If U y > 0 , then E + L 2 x 1 L 1 L 2 + S 1 x 1 < y < 1 , and we determined that d F z d z z = 1 > 0 and d F z d z z = 0 < 0 . At this point, z = 0 is the steady state, and the government prefers non-participation, as shown in Figure 4a.
If U y < 0 , then 0 < y < E + L 2 x 1 L 1 L 2 + S 1 x 1 , and we determined that d F z d z z = 1 < 0 and d F z d z z = 0 > 0 . At this point, z = 1 is the steady state, and the government prefers participation, as shown in Figure 4b.

3.4. Stability Analysis of Equilibrium Points

We set d x d t = 0 ,   d y d t = 0 ,   and   d z d t = 0 , and according to Equation (13), we obtained nine equilibrium points of this system: E 1 0 , 0 , 0 , E 2 0 , 0 , 1 , E 3 0 , 1 , 0 , E 4 0 , 1 , 1 , E 5 1 , 0 , 0 , E 6 1 , 0 , 1 , E 7 1 , 1 , 0 , E 8 1 , 1 , 1 , E 9 x * , y * , z * . If, and only if, x * 0 , 1 ,   y * 0 , 1 , and z * 0 , 1 , then E 9 x * , y * , z * , according to Equation (14), is an equilibrium point.
y 1 Δ I + z L 1 + α β W P 1 P 2 + α W P 1 P 2 Δ W = 0                                               x 1 Δ I + z L 2 + β W P 1 P 2 1 α Δ W W P 1 P 2 α 1 = 0   1 x L 1 + 1 y L 2 + S 1 y 1 x + E = 0                                                                                                                    
Based on the method proposed by Friedman, we calculated the evolutionarily stable strategy of the system by analyzing the local stability of the Jacobian matrix [40]. We obtained the Jacobian matrix ( J ) from Equation (15), as follows:
J = F x x F x y F x z F y x F y y F y z F z x F z y F z z = n 11 n 12 n 13 n 21 n 22 n 23 n 31 n 32 n 33
where
  • n 11 = 2 x 1 1 y Δ I z L 1 + α β W P 1 P 2 α W P 1 P 2 Δ W
  • n 12 = x 1 x Δ I
  • n 13 = x 1 x L 1 + α β W P 1 P 2
  • n 21 = y 1 y Δ I
  • n 22 = 2 y 1 1 x Δ I z L 2 + β W P 1 P 2 1 α + Δ W + W P 1 P 2 α 1
  • n 23 = y 1 y L 2 + β W P 1 P 2 1 α
  • n 31 = z 1 z L 1 + S 1 y
  • n 32 = z 1 z S 1 S 1 x L 2
  • n 33 = 2 z 1 y L 2 + S 1 x 1 + x 1 L 1 L 2 E
Based on the previous assumptions, we determined that P 1 > P 2 , E 11 > E 10   and   S 2 > S 1 , and analyzed the local stability of the equilibrium point. When the eigenvalues of the Jacobi matrix are all negative, the equilibrium point is the evolutionary stability strategy (ESS) [40]. Table 4 shows the eigenvalues of the Jacobi matrix corresponding to each equilibrium point; the possible stable points are E 2 0 , 0 , 1 ,   E 4 0 , 1 , 1 , E 6 1 , 0 , 1 , and   E 8 1 , 1 , 1 .

4. Numerical Simulation and Results

To verify the validity of the evolutionary stability analysis, numerical simulations are conducted using Matlab 2020b. In the LCTI system, the large-scale enterprise (A) is in the main position with frequent innovation activities, and its market share is higher than that of the small-scale enterprise (B). According to the theory of resource complementarity, the probability of successful technological innovation is higher for firms with reciprocal cooperation than that of opportunistic innovation. In the process of parameter setting, it is ensured that the parameters are meaningful and the assigned values are consistent with the research hypothesis. Therefore, the model was assigned numerical values [41,42,43,44].

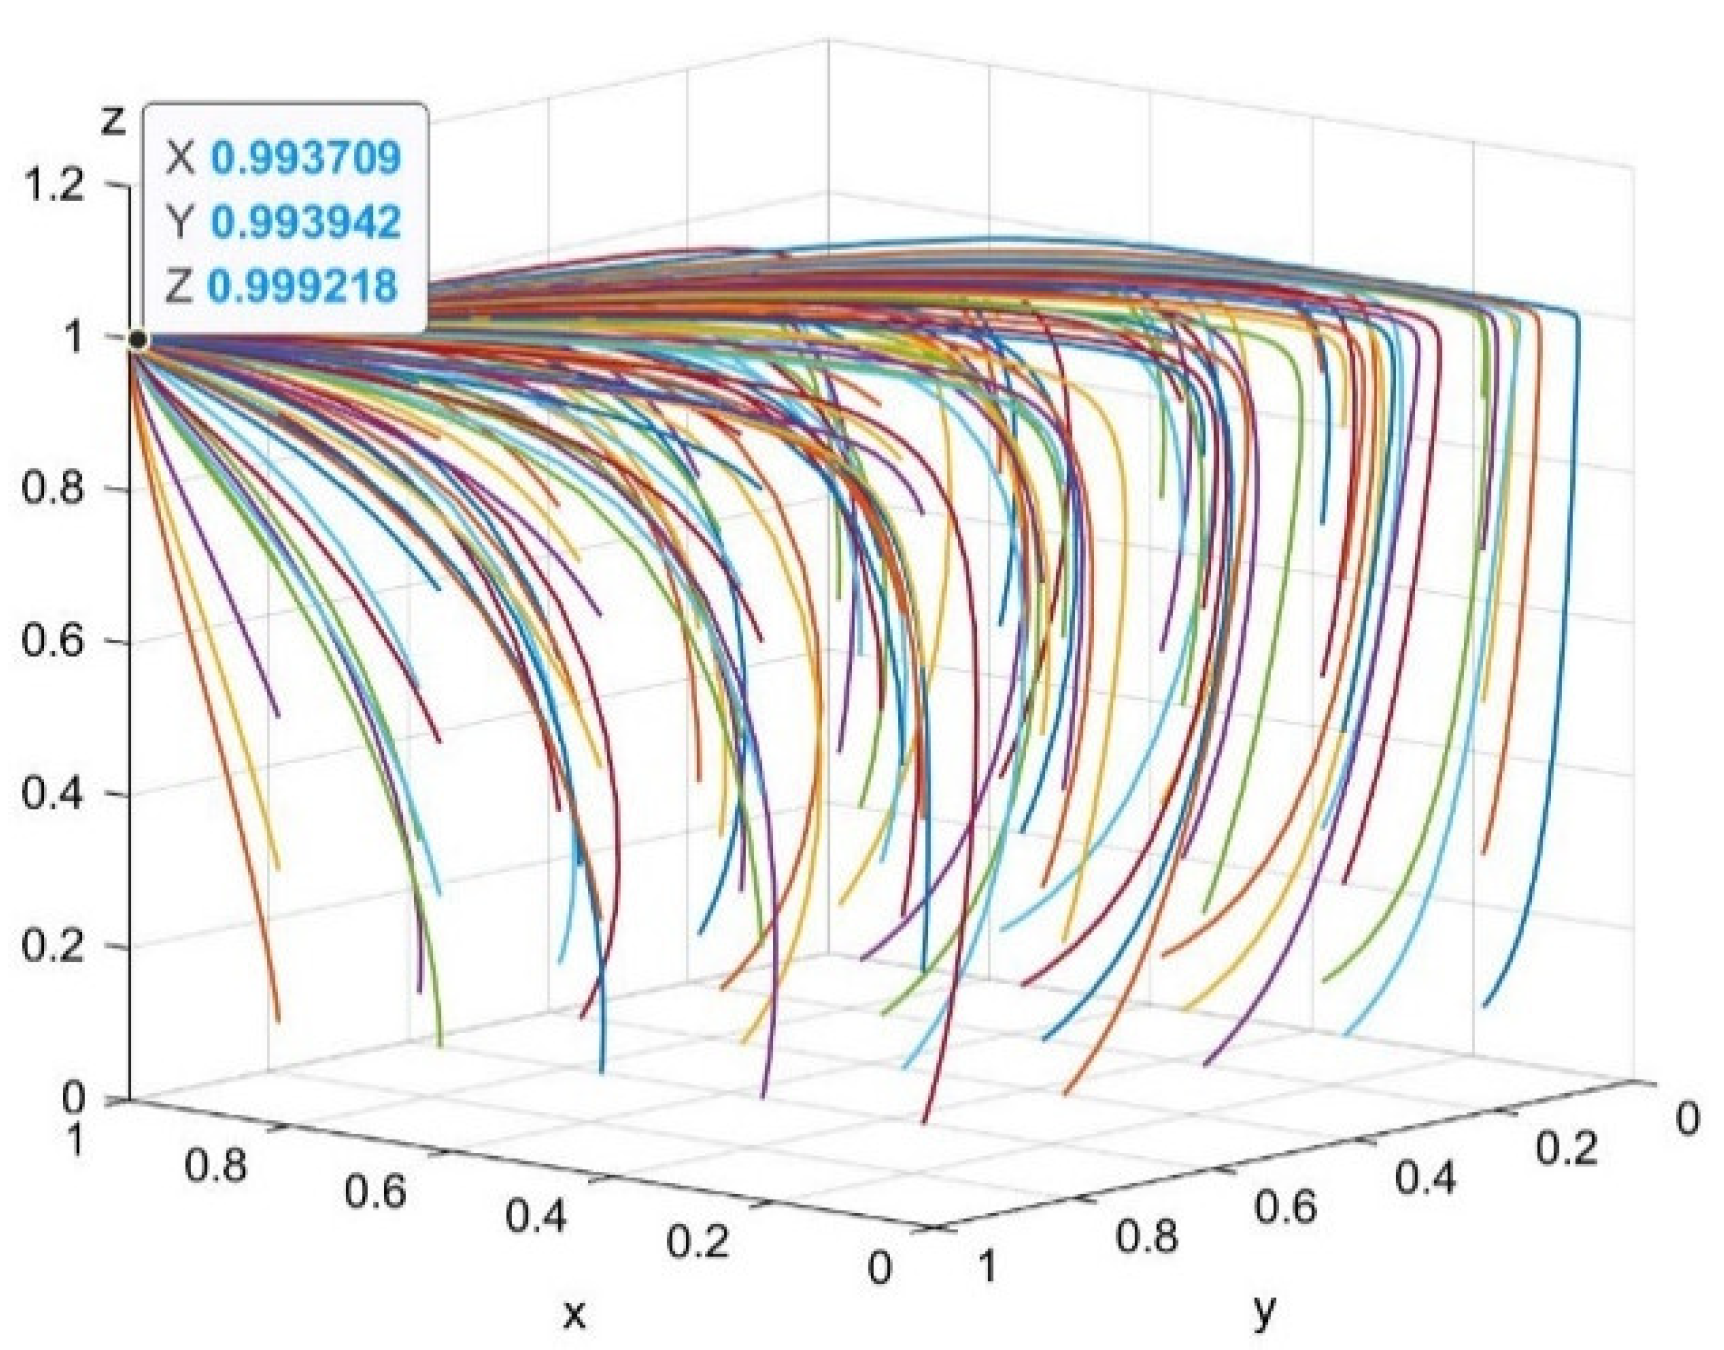
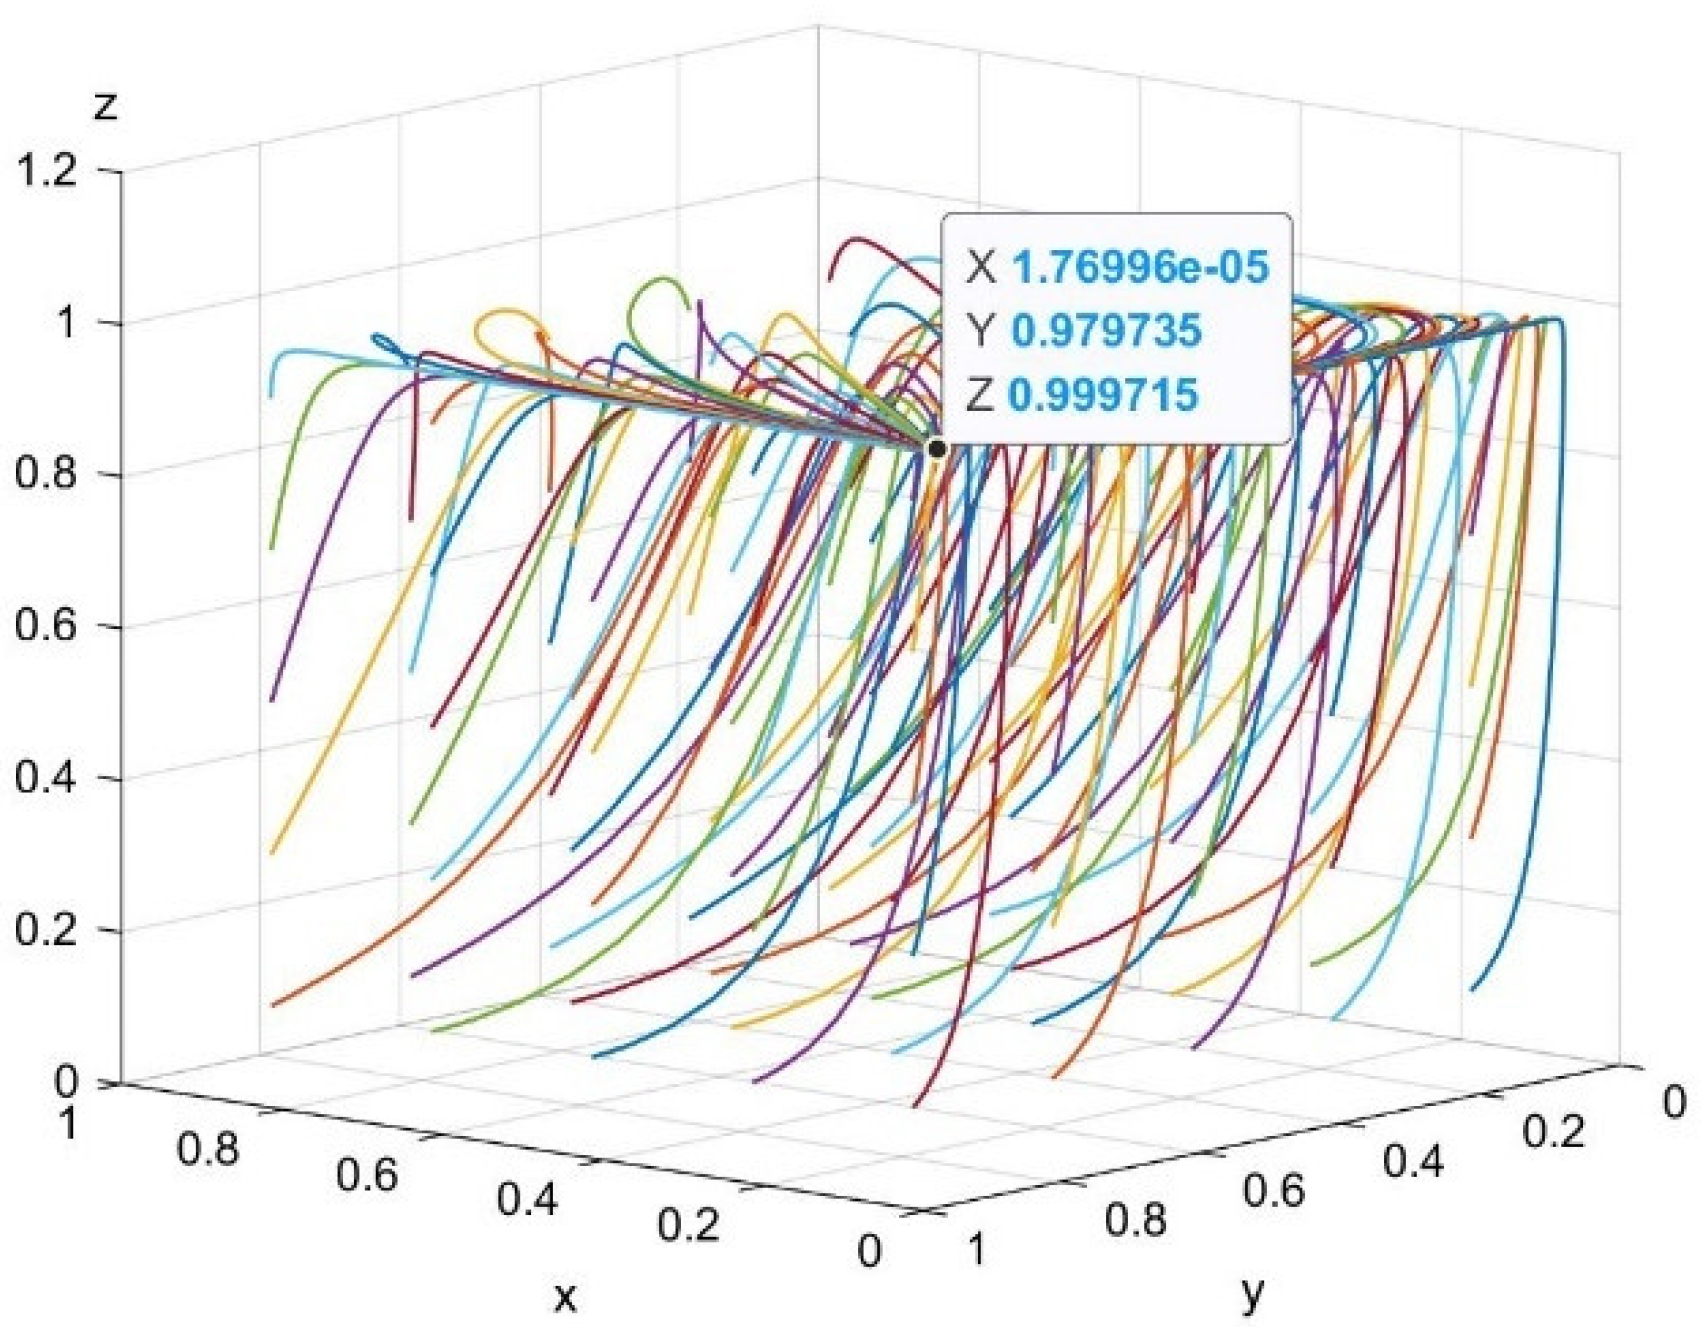
4.1. The Dynamic Evolution of ESS

According to Table 4, there are four possible equilibrium points for this system, E 2 0 , 0 , 1 ,   E 4 0 , 1 , 1 ,   E 6 1 , 0 , 1   and   E 8 1 , 1 , 1 , corresponding to Case 1, Case 2, Case 3, and Case 4. Every case corresponds to a set of parameter values, as shown in Table 5.
Case 1: When Δ I + Δ W > L 1 + α W P 1 P 2 β + 1 and Δ I + W P 1 P 2 1 α 1 β + Δ W > L 2 , the ESS is E 2 0 , 0 , 1 . Figure 5 shows the dynamic evolution after 50 simulations.
Case 2: When Δ W > L 1 + α W P 1 P 2 β + 1 and L 2 > W P 1 P 2 1 α 1 β + Δ I + Δ W , the ESS is E 4 0 , 1 , 1 . Figure 6 shows the dynamic evolution after 50 simulations.
Case 3: When L 1 + α W P 1 P 2 β + 1 > Δ I + Δ W and W P 1 P 2 1 α 1 β + Δ W > L 2 , the ESS is E 6 1 , 0 , 1 . Figure 7 shows the dynamic evolution after 50 simulations.
Case 4: When L 1 + α W P 1 P 2 β + 1 > Δ W and L 2 > Δ W + W P 1 P 2 1 α 1 β , the ESS is E 8 1 , 1 , 1 . Figure 8 shows the dynamic evolution after 50 simulations.
As shown in Figure 5, for the parameter values of Case 1, E 2 0 , 0 , 1 is the equilibrium point, at which the system has only one evolutionarily stable strategy combination (opportunistic, opportunistic, participation). This is not a healthy environment for LCTI. In all scenarios, the government chooses participation, which exemplifies the government’s incentivization role in LCTI alliances.
As shown in Figure 6, for the parameter values of Case 2, E 4 0 , 1 , 1 is the equilibrium point, at which the system has only one evolutionarily stable strategy combination (opportunism, reciprocity, participation). As shown in Figure 7, for the parameter values of Case 3, E 6 1 , 0 , 1 is the equilibrium point, at which the system has only one evolutionarily stable strategy combination (reciprocity, opportunism, participation). These are the two most frequent real-world scenarios, likely due to the disparities in the sizes of firms. Larger companies are more willing to assume the cost of technological innovation, while smaller companies cannot afford the risk of LCTI research and development, so most choose to free ride.
As shown in Figure 8, for the parameter values of Case 4, E 8 1 , 1 , 1 is the equilibrium point, at which the system has only one evolutionarily stable strategy combination (reciprocity, reciprocity, participation). This is the ideal LCTI environment. The government provides incentives for companies to participate in LCTI, which compensate for the time, financial investment, and R&D costs of small-scale companies, allowing continued operation during LCTI implementation. For example, in the field of new energy vehicles and photovoltaics, once governments reduce their subsidies, many enterprises will face closure. This will waste a lot of resources and lead to an imbalance in the development of local industries.

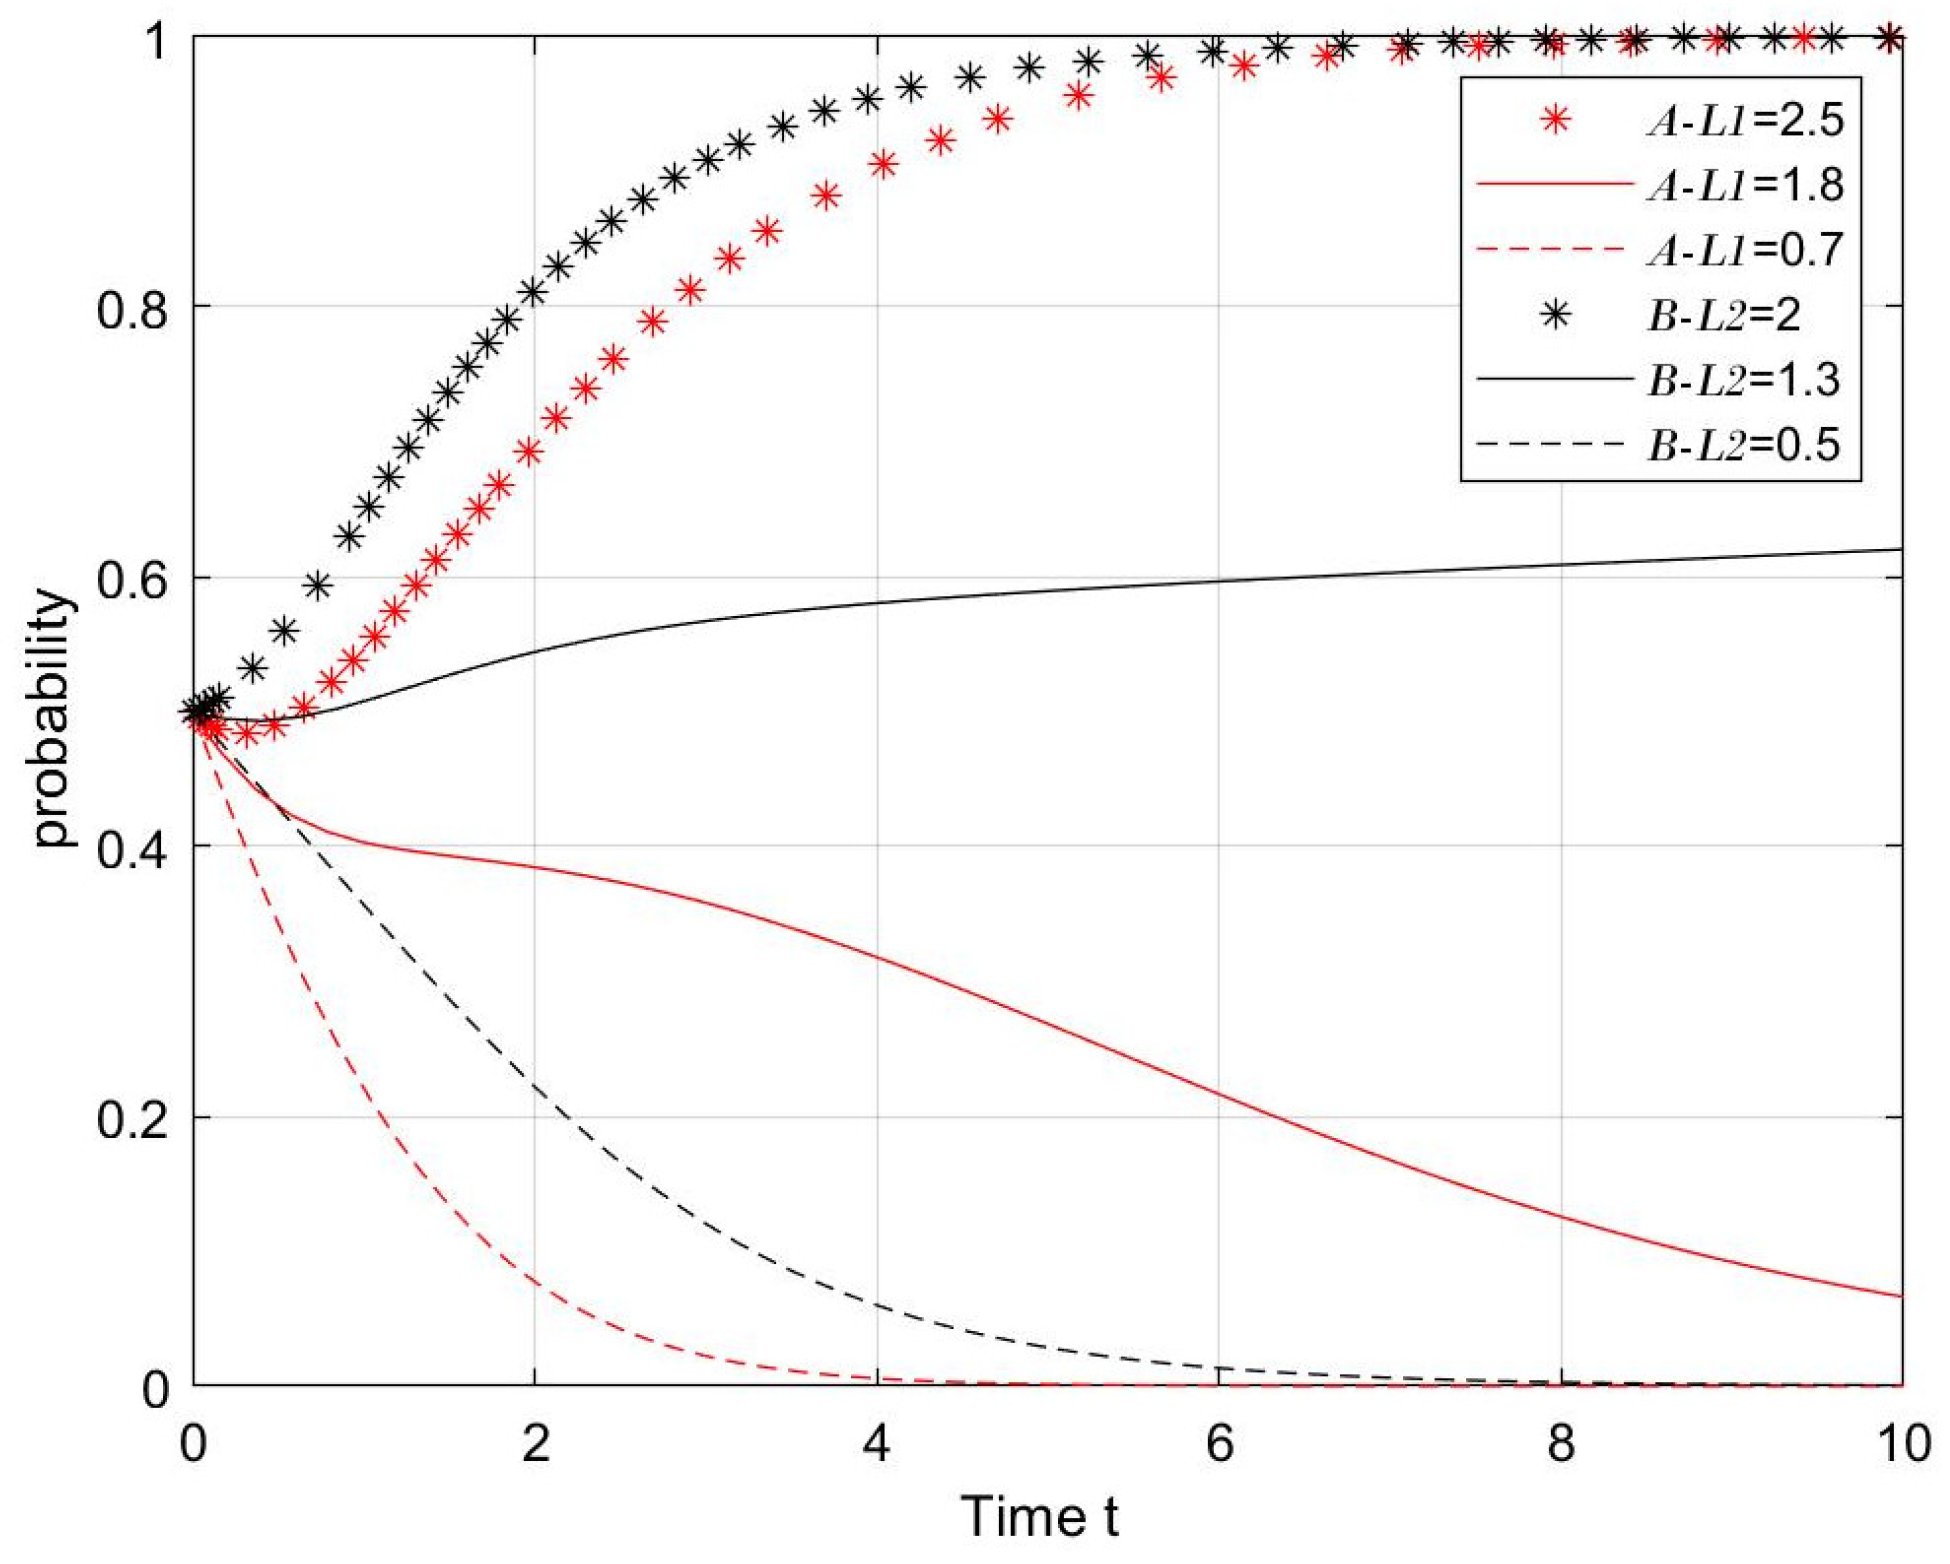
4.2. Punishment Analysis

Next, we analyzed the impact of changes in L 1 and L 2 on the process and outcome of the evolutionary game. According to the values of Case 1, we set L 1 = 0.7, 1.8, 2.5 and L 2 = 0.5, 1.3, 2. Figure 9 shows the simulation results for 50 replications of the dynamic equations.
According to Figure 9, increased government penalties for firm opportunism promote reciprocal behavior during the evolution of the system to a point of stability. As L 1 and L 2 increase, the probability of enterprises A and B choosing reciprocity rises. When L 1 = 0.7 2.5 and L 2 = 0.5 2 , the equilibrium point changes from E 2 0 , 0 , 1 E 8 1 , 1 , 1 . Therefore, to maintain the stability of the LCTI market, the government should increase the penalties for corporate opportunism according to the size of the firm.

4.3. Parametric Analysis of Coefficient Parameters

To analyze the effect of changes in P 1 and P 2 on the process and outcome of the evolutionary game, we set   P 1 = 0.6, 0.7, 0.8 according to the values of Case 4, and P 2 = 0.4, 0.3, 0.2 according to the values of Case 1. Figure 10 and Figure 11 present the simulation results for 50 replications of the dynamic equations.
According to Figure 10, the probability of successful reciprocal innovation is positively related to the probability that a firm chooses reciprocity. As the value of P 1 increases, more firms choose reciprocity. According to Figure 11, the probability of successful opportunistic innovation is inversely related to the probability of a firm choosing reciprocity. When P 2 = 0.2, firms have more to lose by choosing opportunism, and thus change from opportunism to reciprocity. In this scenario, the equilibrium point of the system changes from E 2 0 , 0 , 1 E 8 1 , 1 , 1 . In the process of LCTI, several factors, such as the strength of the collaborating institutions, the complexity of the low-carbon technology, and the allocation of innovation resources among the actors, influence the values of P 1 and P 2 . Companies that tend to reciprocity must spend time and money finding the right research institute or partner company to increase the probability of successful technology development.

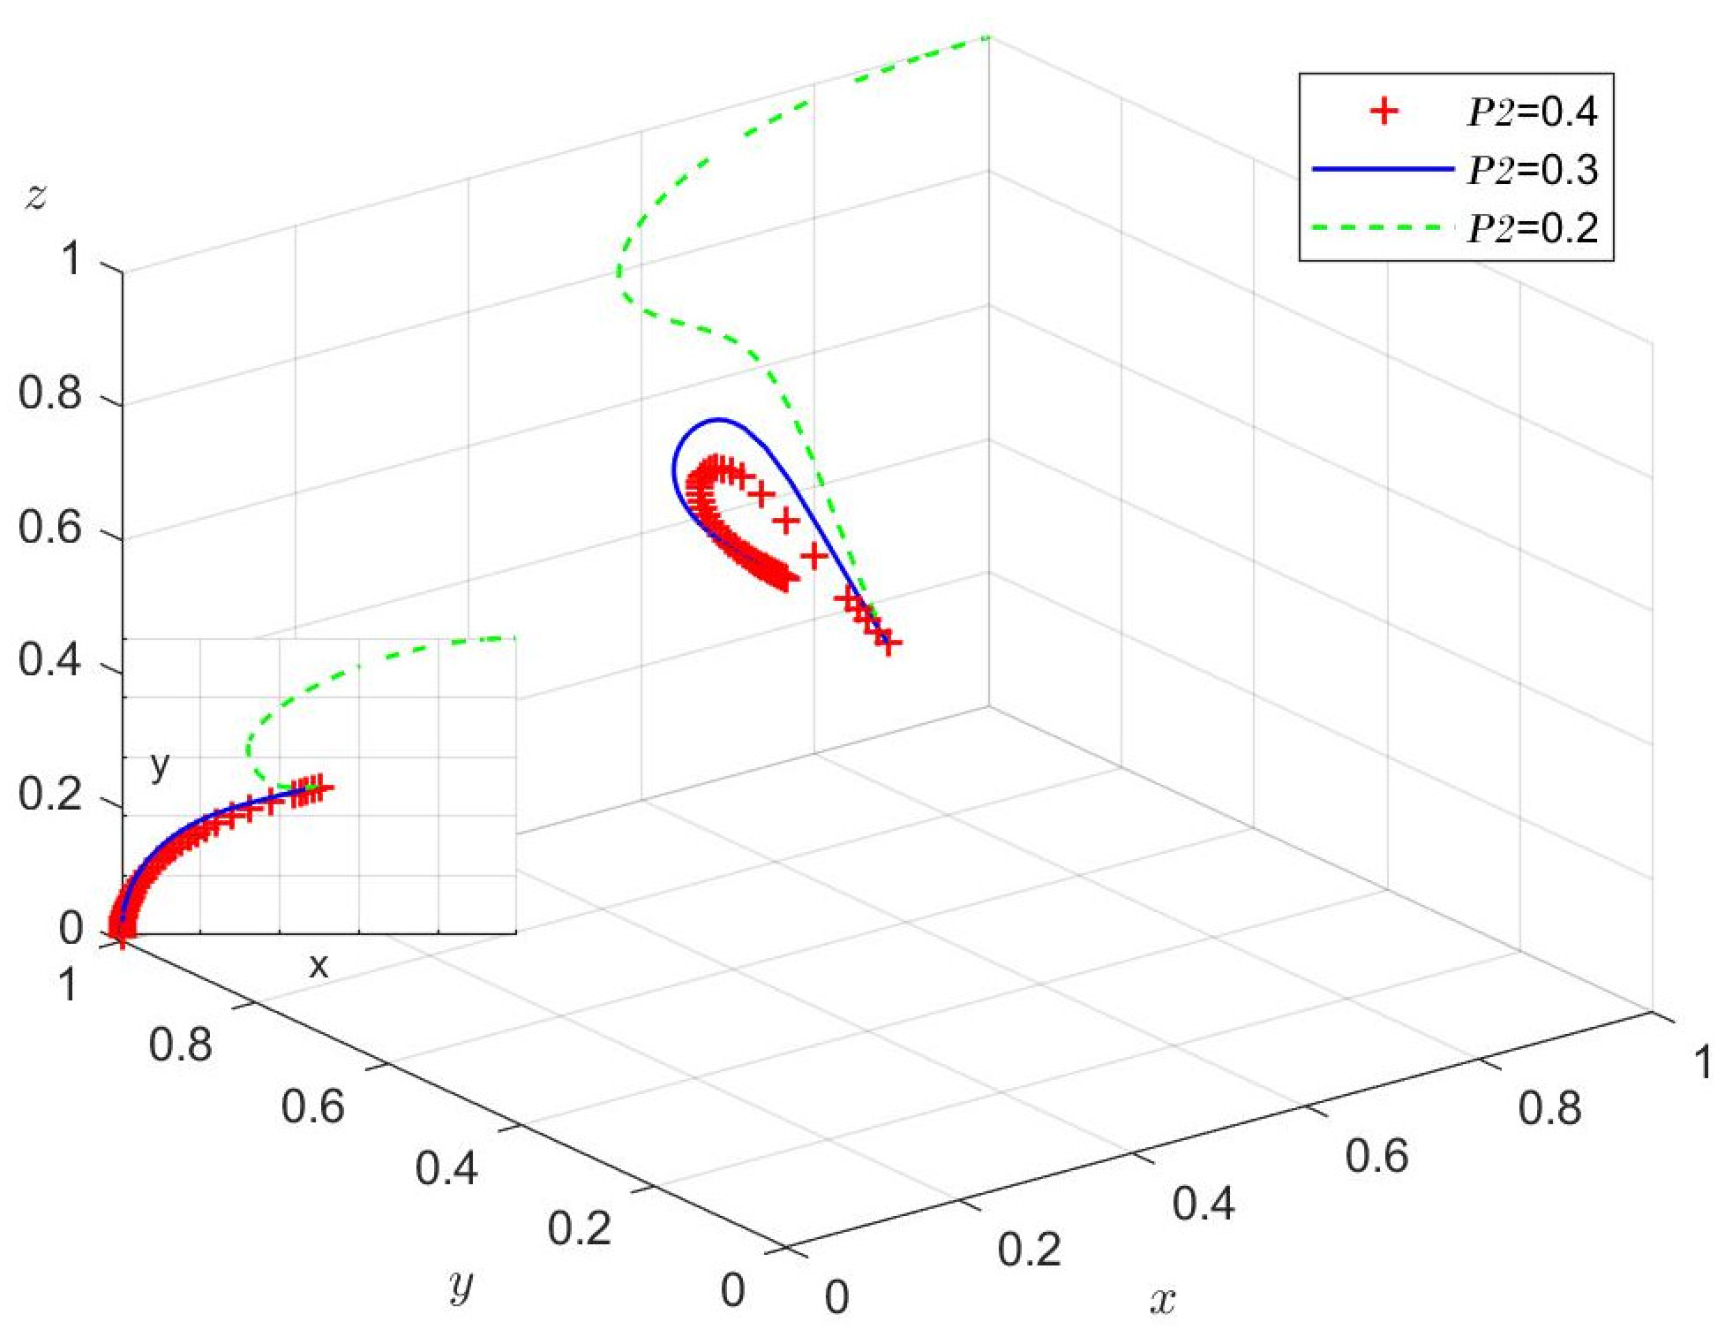
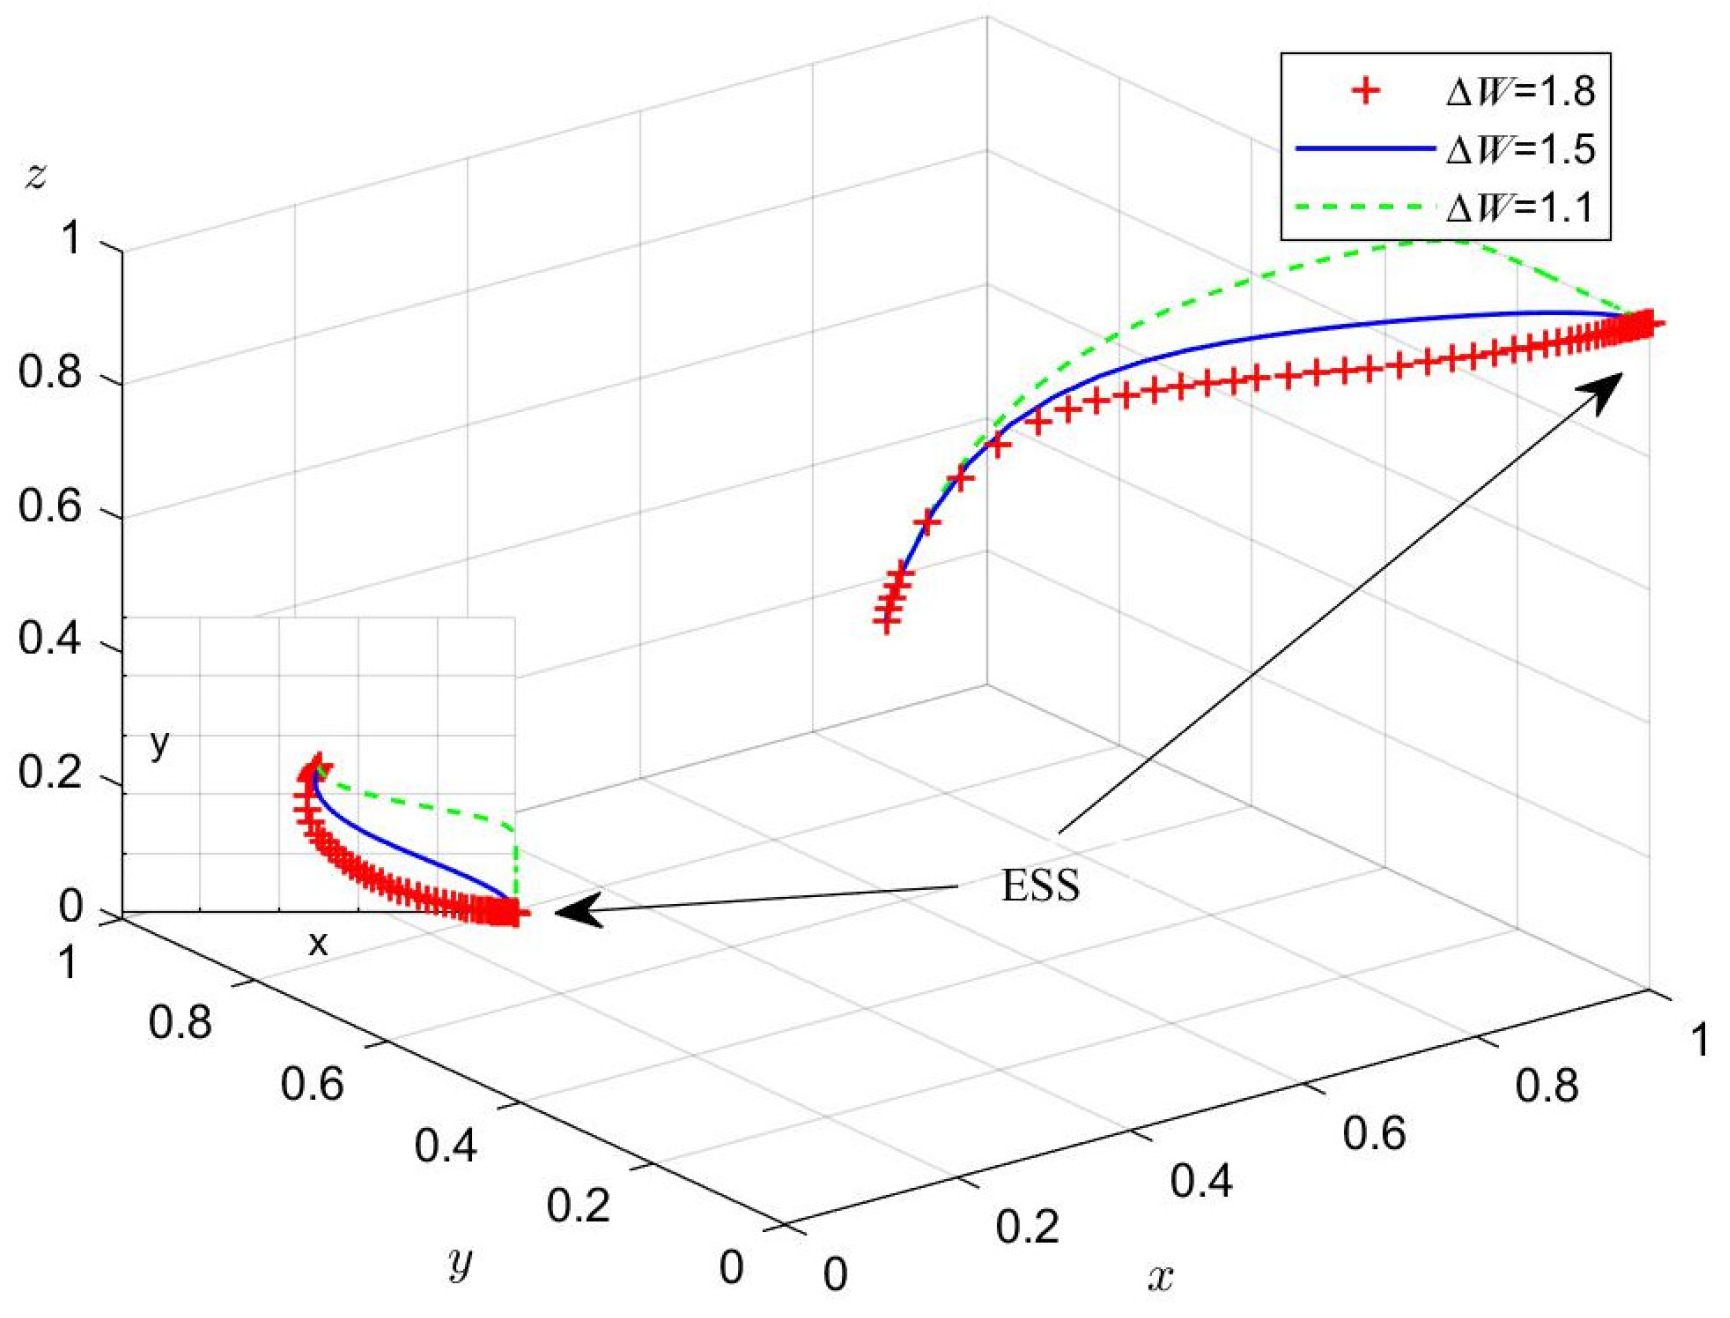
4.4. Reward Analysis
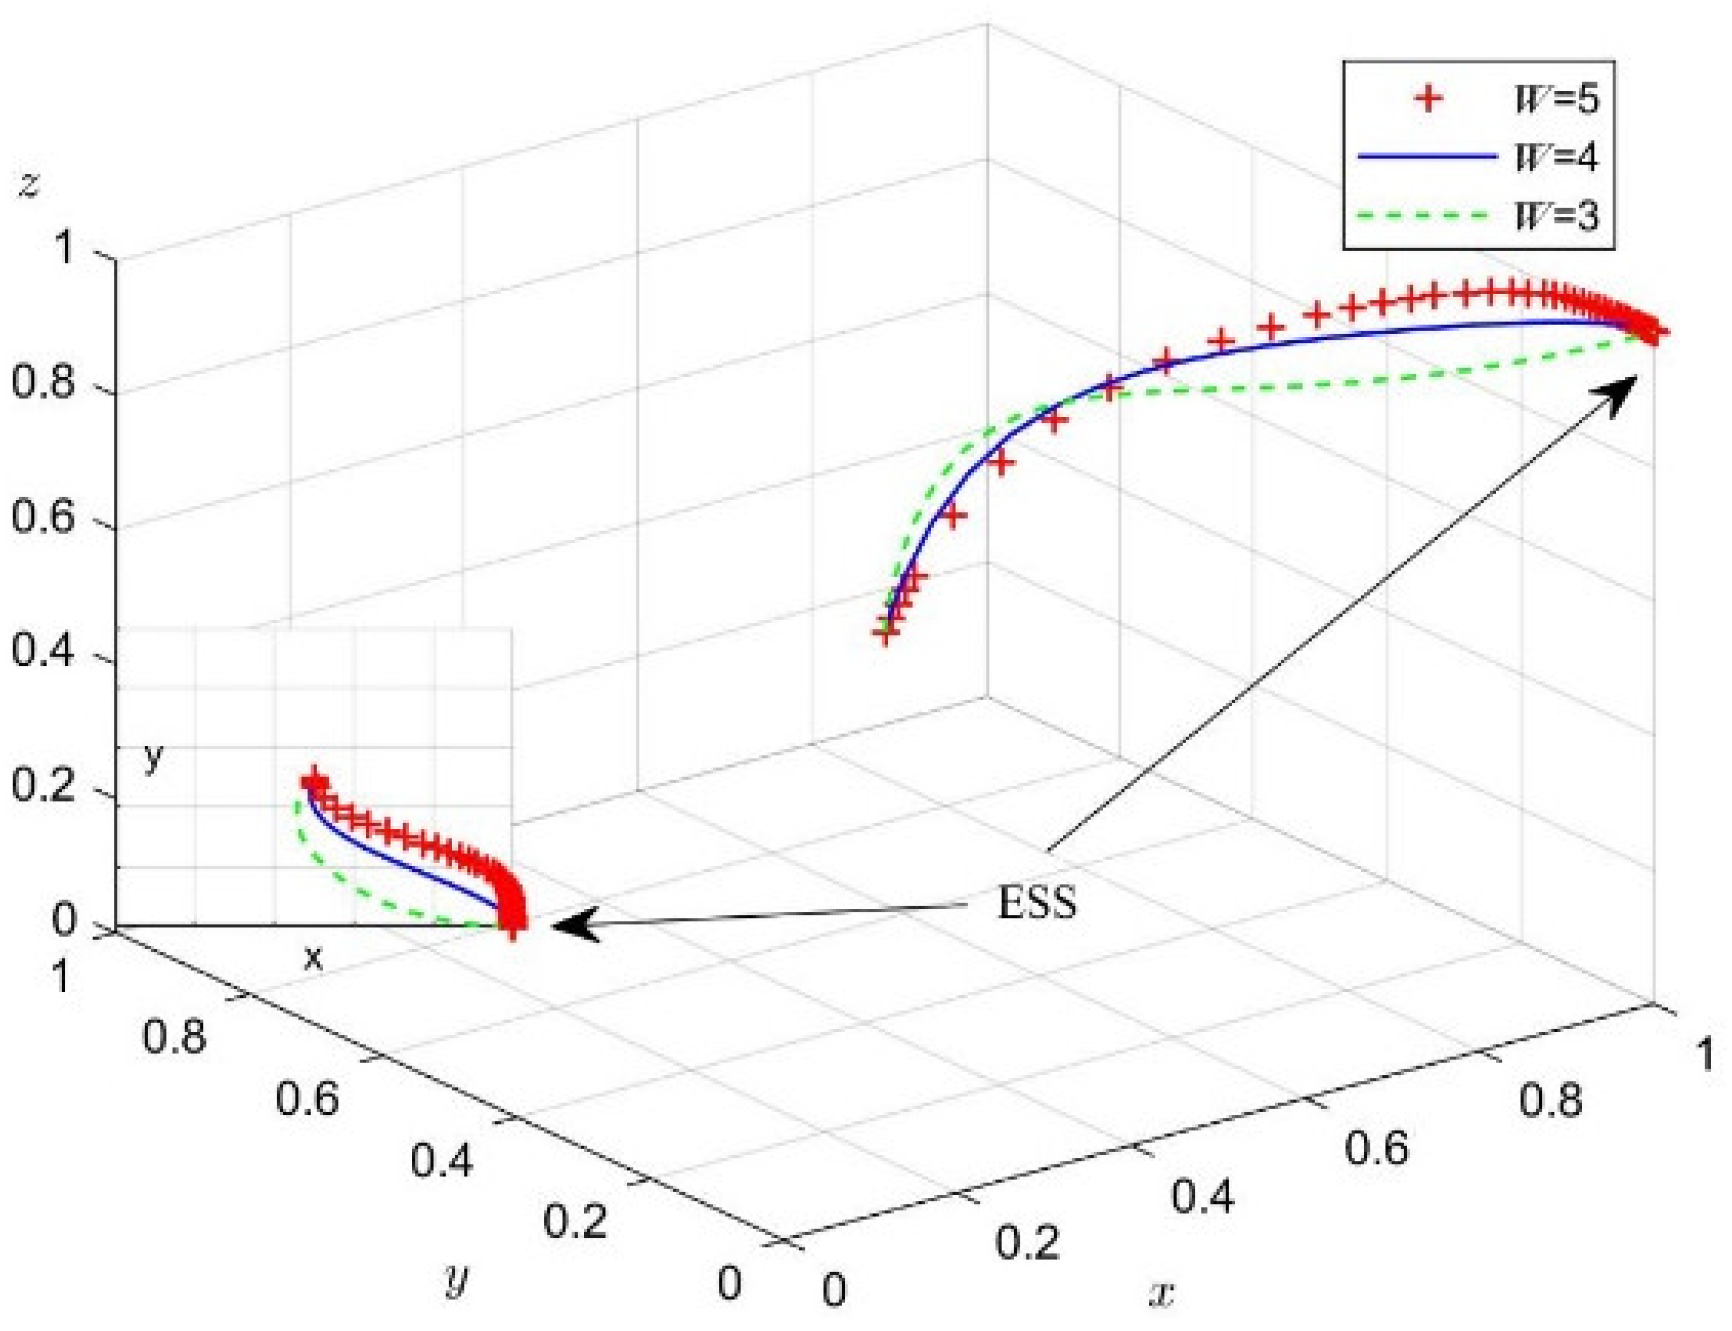
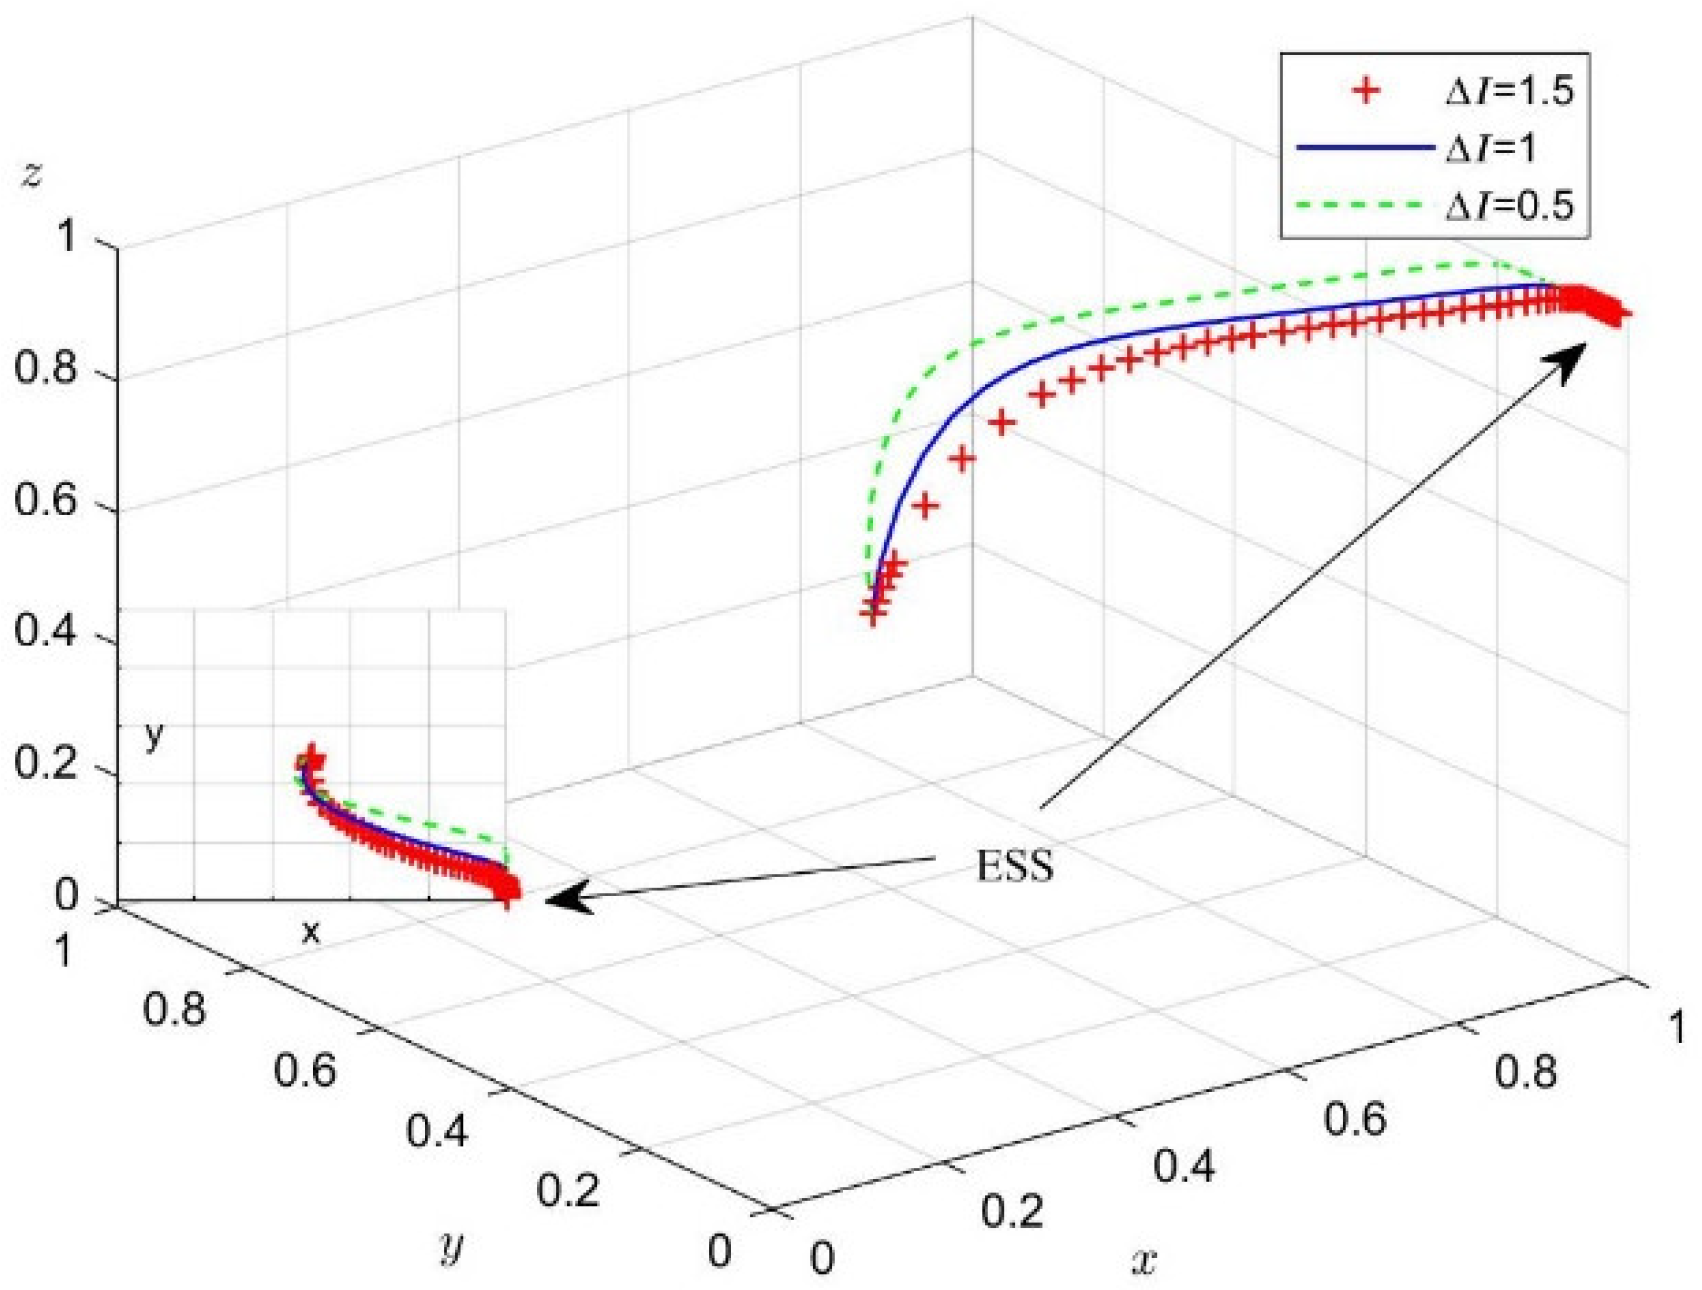
Next, we analyzed the effect of changes in W and Δ W on the process and outcome of the evolutionary game. According to the values in Case 3, we set W = 5, 4, 3 and Δ W = 1.8, 1.5, 1.1. Figure 12 and Figure 13 present the simulation results for 50 replications of the dynamic equations.
According to Figure 12, the higher the market value of the LCTI, the higher the probability that enterprises A and B will choose reciprocity. However, the large enterprise A ultimately chooses reciprocity, while the smaller enterprise B chooses opportunism. This may be because larger companies have larger assets and are more willing to continue to expand. As a result, large companies tend to increase their market share and undertake LCTI as the total value of the innovation market increases. While the total value of the innovation market does increase small enterprise B’s probability of choosing reciprocity, it is not sufficient to motivate the firm to choose reciprocity, because small enterprises cannot afford the costs and risks of LCTI.
According to Figure 13, the higher the additional gains earned by the firm due to opportunism, the higher the probability that large firm A chooses reciprocity and converges to 1 faster. In this scenario, the probability of small firm B choosing opportunism increases and eventually converges to 0. The likely reason for this is that large companies want to accelerate innovative research through reciprocity, and then quickly take over the market and reap the benefits. For small firm B, the higher the additional gains from opportunism, the more attractive speculation is. This analysis shows the differences in the strategic development goals of firms of different sizes.

4.5. Cost Analysis

To analyze the effect of changes in I   and   Δ I on the process and outcome of the evolutionary game, we set I = 3, 2, 1 according to Case 3, and Δ I = 1.8, 1, 0.8, according to Case 4. Figure 14 and Figure 15 present the simulation results for 50 replications of the dynamic equations.
According to Figure 14, the higher the cost of LCTI, the higher the probability that a firm chooses opportunism. However, large enterprise A converges to reciprocity at I = 2, while small enterprise B still chooses opportunism at this point, similar to the effect of P 2 . According to Figure 15, the higher the additional cost of reciprocal innovation, the lower the probability that a firm will choose reciprocity. However, large enterprise A still chooses reciprocity, likely due to the difference in firm size. Large firms have the assets to bear the cost of LCTI, but small firms do not. This suggests that government incentives are necessary.

5. Discussion and Implications

Based on the above analysis and simulation, in this section we propose a reward and punishment mechanism for LCTI under different steady states. Based on our findings, we then suggest several policy implications.

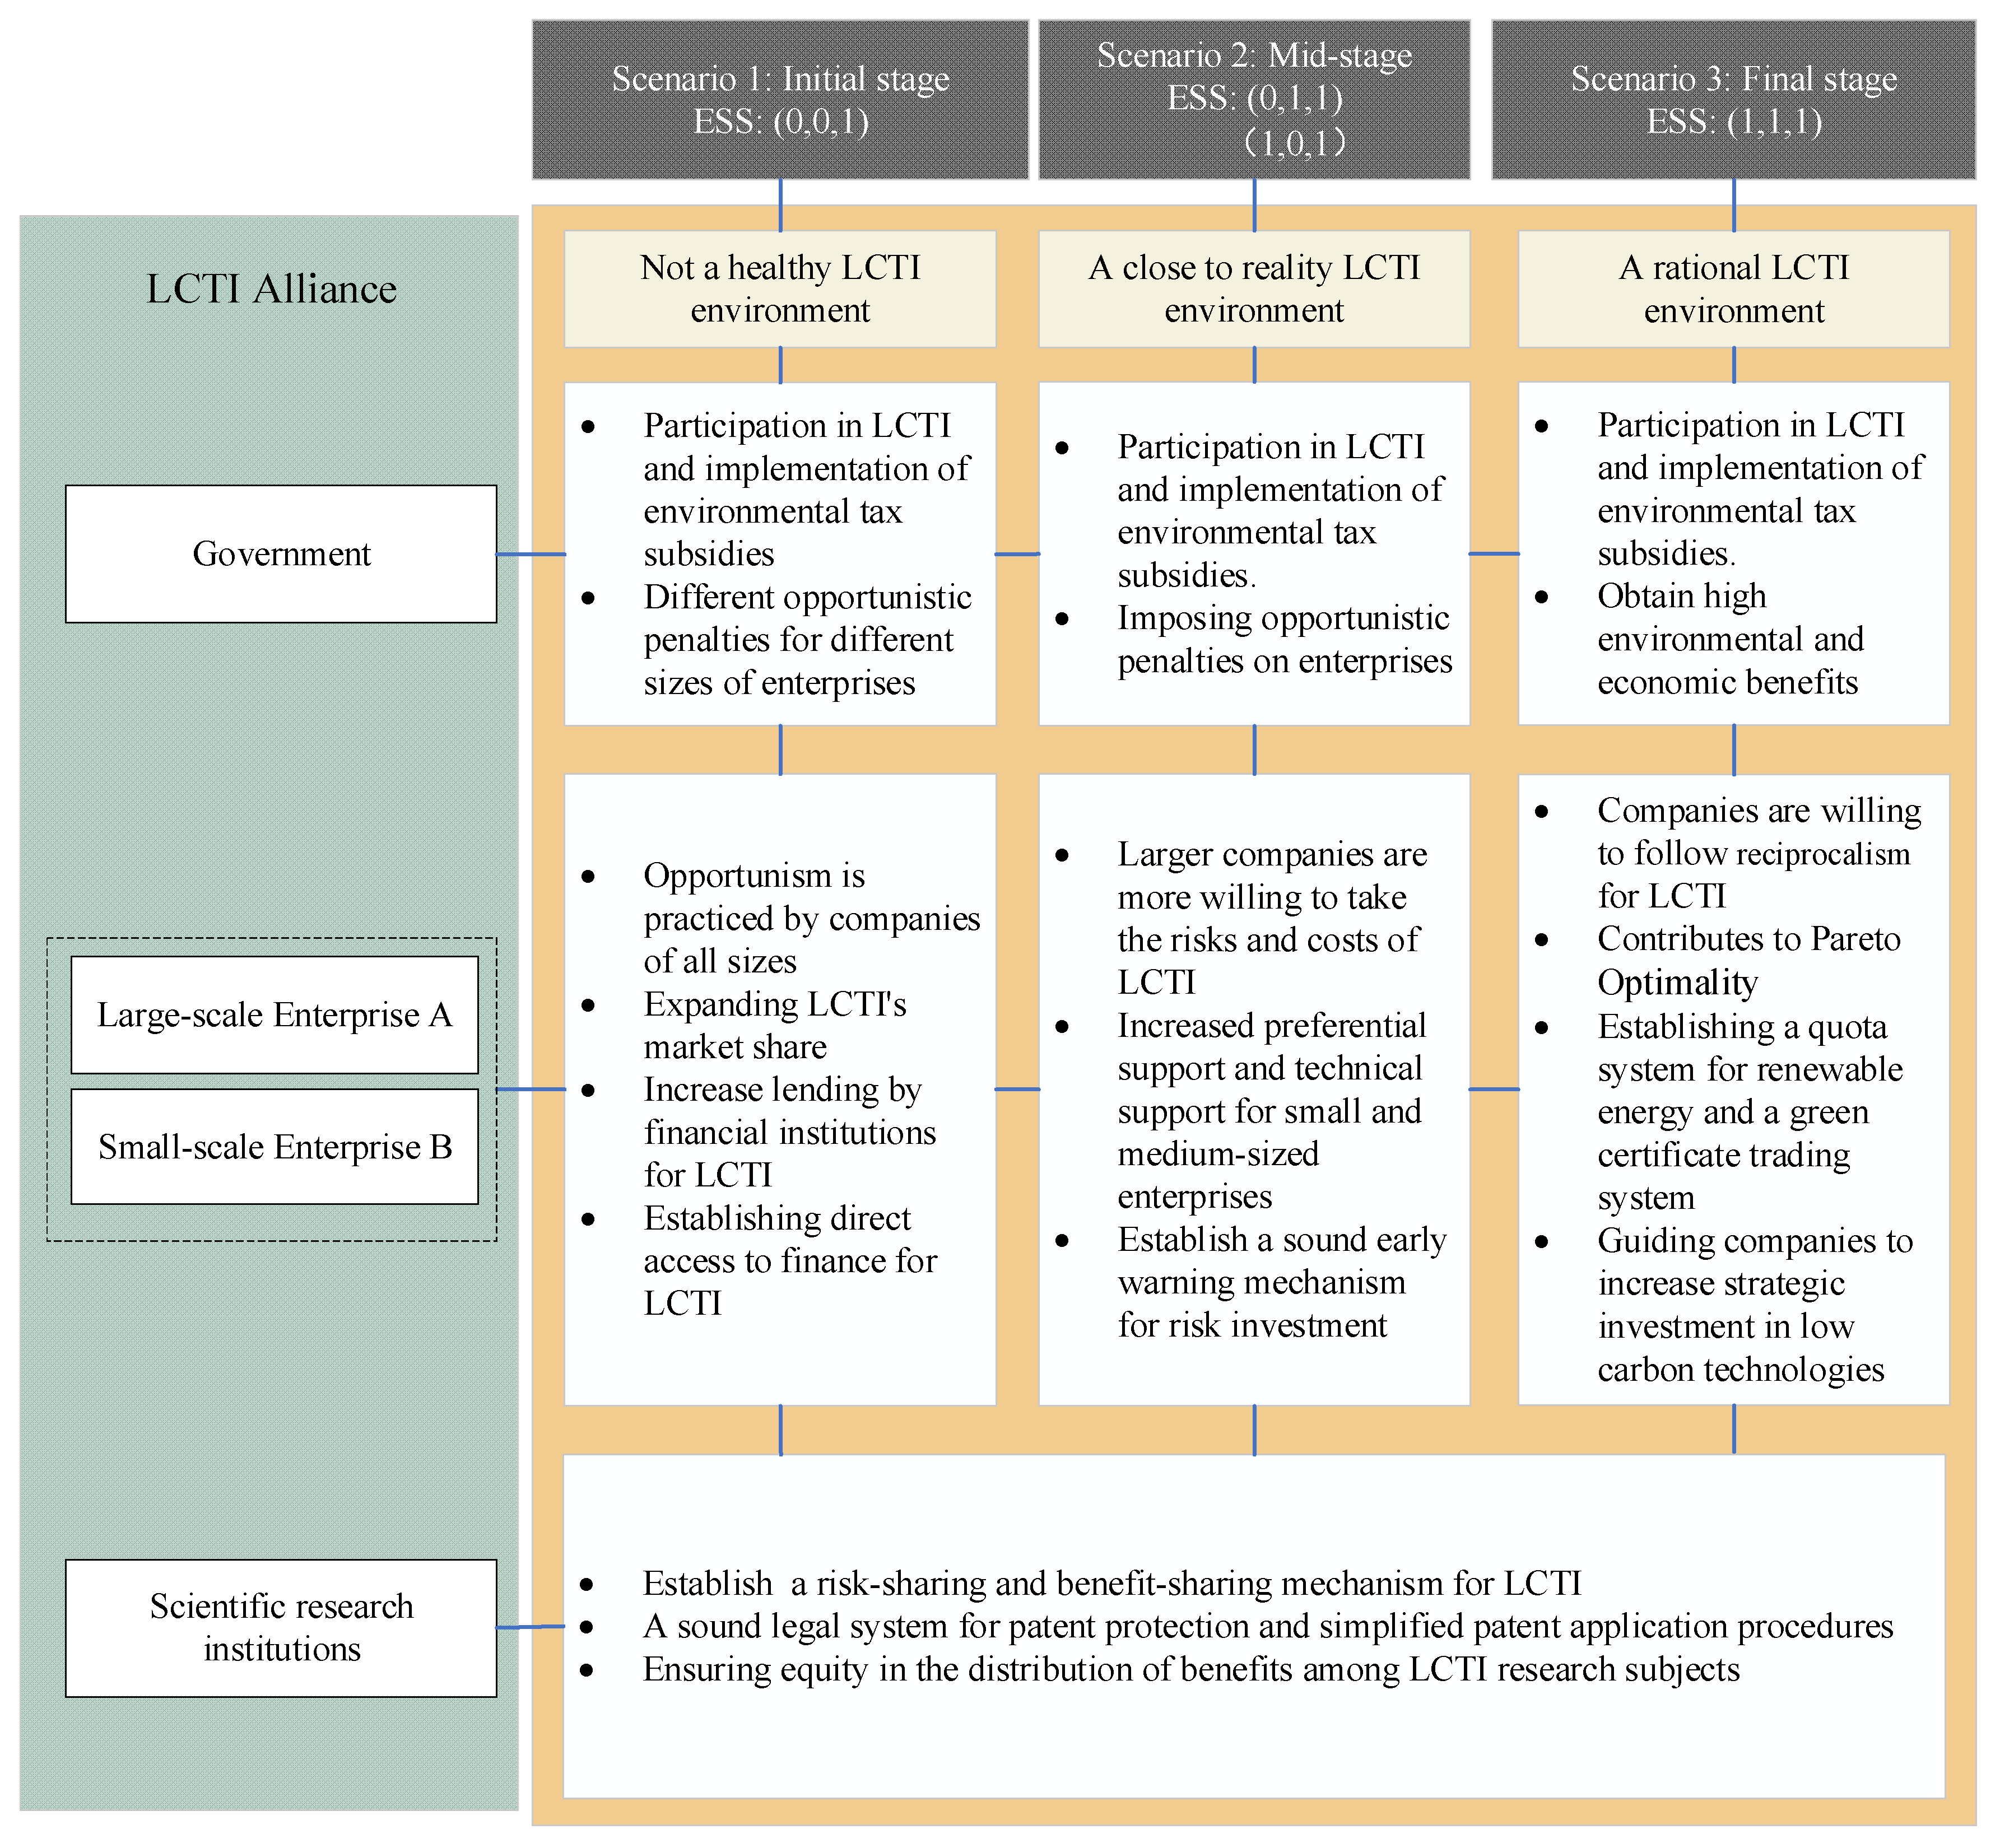
5.1. Reward and Punishment Mechanism of LCTI

In our previous study, we found that the government’s strategic choice was always to participate in LCTI, whereas firms of different sizes had different strategic choices. This may be related to factors such as a firm’s risk-taking capacity, ability to pay for costs, and resource reserves, as well as the market value of LCTI. Based on this, we propose a government reward and punishment mechanism for different enterprise strategy choices, as shown in Figure 16.
In scenario 1, the steady state of the system is E 2 0 , 0 , 1 , and the strategy combination is opportunism, opportunism, participation. This is not a healthy or conducive LCTI environment. In environments where reciprocity is absent, synergistic processes are often interrupted or broken [45]. There is a need to impose penalties on opportunistic firms and to document their behavior that is detrimental to benefits. This can take the form of information disclosure, eligibility access, etc. The penalties received by firms of different sizes are supposed to vary [7]. Otherwise, it would not be conducive to the stable development of enterprises. Secondly, subsidies such as environmental taxes are essential, as they help companies reduce the risks and costs of LCTI. Moreover, the subsidy coefficient should be different for enterprises of different sizes. At the same time, governments should set up special funds, encourage financial institutions to lend more, open up direct financing channels, and establish a green capital monitoring system to support LCTI.
In Scenario 2, the steady state of the system is E 4 0 , 1 , 1 , E 6 1 , 0 , 1 , and only one firm chooses reciprocity. Large-scale firms have a clear advantage, with more resources at their disposal, so governments should develop differentiated policies. While providing the relevant financial support to all firms, governments should increase tax incentives and technical support for small-scale enterprises.
In Scenario 3, the steady state of the system is E 8 1 , 1 , 1 , and the strategy combination is reciprocity, reciprocity, participation. Reciprocal enterprises are a natural outcome of social choice and contribute to a healthy LCTI environment [46]. This facilitates access to more low-carbon technologies for firms of different sizes. This is also the result of numerous scholarly studies on technological innovation [47,48]. It remains important to scientifically define a reciprocal climate [49]. This reciprocity climate requires incentive policies. The government should establish a statutory renewable energy quota system to reasonably distribute resources among enterprises, and improve the application process and protection policy for low-carbon technology patents to increase the conversion rate of scientific research.
Scientific research institutions are another important factor in our reward and punishment mechanism, as companies can cooperate with these institutions as well as other enterprises, increasing the rate of research implementation. In this regard, the government should establish a risk-and benefit-sharing mechanism for LCTI to ensure fairness in the distribution of benefits between research institutions and enterprises, and to safeguard the rights and interests of research institutions.

5.2. Policy Implications

Reciprocity sustains LCTI. The government plays a very important role in LCTI alliances, as its incentivization and punishment policies influence all corporate LCTI strategy choices. With this in mind, we propose the following policy implications.
Forming LCTI consortiums with appropriate partner organizations, either research institutions or relevant companies, is important, as it avoids collaboration with opportunistic institutions. However, due to information asymmetry, companies must usually spend a lot of time and money searching for appropriate partners. Therefore, the government should help vet partner companies to reduce corporate search costs and place opportunistic institutions on a blacklist, prohibiting them from working with other enterprises again.
The government should take responsibility for oversight by imposing penalties on opportunistic enterprises and constructing a strict punishment mechanism [50]. The government should urge enterprises to consciously fulfill their social responsibilities and play an active monitoring role to prevent opportunistic and free-riding behavior in LCTI. When implementing tax incentives, the government must ensure that the incentives are greater than the cost of LCTI to increase the probability of firms choosing reciprocity [51].
The construction of an LCTI information-sharing platform is crucial. This platform will reduce the search costs incurred by enterprises, governments, and research institutions; improve the quality of matches; and facilitate resource sharing and complementary advantages for all parties, realizing a reciprocal LCTI system.
Improve the carbon emission rights trading system. Based on the carbon emissions trading system, the results of low-carbon technology innovation have increased year by year [24]. In Europe and the United States, carbon markets generally focus on climate emission reduction as the main expenditure direction, and the management model is a more independent carbon fund [52]. The regulation of carbon revenue fluctuations is also valued. In addition, the EU carbon market has constructed a sound system for dividing the share of funds. This has important implications for many developing countries.

6. Conclusions and Limitation

6.1. Conclusions

We constructed a tripartite evolutionary game model for a large-scale enterprise (A), a small-scale enterprise (B), and a government based on finite rationality and information asymmetry. Then, we carried out numerical simulations using MATLAB 2020b to analyze the impact of different parameters. We found that the government’s strategic choice is always to participate in LCTI by implementing reward and punishment mechanisms, including penalties for opportunism and low-carbon tax incentives for businesses. Such mechanisms affect both large-scale and small-scale businesses. Large firms are better able to assume the risks of LCTI and maintain reciprocal LCTI, even in a high-cost scenario.

6.2. Limitation

However, we did not divide our evolutionary game model into multiple stages. Cooperation strategies between firms, governments, and research institutions can be dynamic; for example, a firm might choose opportunism at the beginning of a partnership but reciprocity at the end. Moreover, numerous actors can be involved in LCTI, so the construction of a multi-subject, dynamic evolution game model is the next research direction.

Author Contributions

Conceptualization, M.W. and Y.H.; Investigation, M.W., R.H. and K.R.; Methodology, K.R; Visualization, K.R. and J.Z.; Writing—original draft, M.W. and K.R.; Writing—review & editing, R.H. All authors have read and agreed to the published version of the manuscript.

Funding

The research was funded by the National Social Science Foundation of China (No. 21YJCZH139).

Institutional Review Board Statement

Not applicable.

Informed Consent Statement

Not applicable.

Data Availability Statement

Not applicable.

Conflicts of Interest

The authors declare no conflict of interest.

References

  1. Lai, X.D.; Zhan, W.L. Probing green technology innovation incentive mechanism: Gaming based on double information asymmetry. Shanghai Manag. Sci. 2022, 44, 43–48. [Google Scholar] [CrossRef]
  2. UNFCCC. Glasgow Climate Pact. Available online: https://unfccc.int/sites/default/files/resource/cma2021_L16_adv.pdf (accessed on 13 November 2021).
  3. World Meteorological Organization. State of the Global Climate 2021: WMO Provisional Report. 2021. Available online: https://library.wmo.int/doc_num.php?explnum_id=10859 (accessed on 18 May 2021).
  4. Shi, R.; Cui, Y.; Zhao, M. Role of low-carbon technology innovation in environmental performance of manufacturing: Evidence from OECD countries. Environ. Sci. Pollut. Res. 2021, 28, 68572–68584. [Google Scholar] [CrossRef] [PubMed]
  5. Liu, R.H.; Ding, M.L.; Wang, S.H. Thinking on the scientific and technological guidance of China’s carbon dioxide peak and carbon neutrality by European and American countries. Reform. Strategy 2022, 38, 1–14. [Google Scholar] [CrossRef]
  6. Shi, Y.; Han, B.; Zeng, Y. Simulating policy interventions in the interfirm diffusion of low-carbon technologies: An agent-based evolutionary game model. J. Clean. Prod. 2020, 250, 119449. [Google Scholar] [CrossRef]
  7. Gong, C.; Liu, J.; Chang, J. Evolutionary Game Analysis of the Innovation Behavior of High-Tech Enterprises with Government Participation. Math. Prob. Eng. 2021, 2021, 5528042. [Google Scholar] [CrossRef]
  8. Chen, W.; Hu, Z.H. Using evolutionary game theory to study governments and manufacturers’ behavioral strategies under various carbon taxes and subsidies. J. Clean. Prod. 2018, 201, 123–141. [Google Scholar] [CrossRef]
  9. Yang, N.; Song, Y.; Zhang, Y.; Wang, J. Dark side of joint R&D collaborations: Dependence asymmetry and opportunism. J. Bus. Ind. Mark. 2020, 35, 741–755. [Google Scholar] [CrossRef]
  10. Arıkan, A.T. Opportunism is in the eye of the beholder: Antecedents of subjective opportunism judgments. J. Bus. Ethics 2020, 161, 573–589. [Google Scholar] [CrossRef]
  11. Conner, K.R.; Prahalad, C.K. A resource-based theory of the firm: Knowledge versus opportunism. Organ. Sci. 1996, 7, 477–501. [Google Scholar] [CrossRef]
  12. Chai, L.; Li, J.; Clauss, T.; Tangpong, C. The influences of interdependence, opportunism and technology uncertainty on interfirm coopetition. J. Bus. Ind. Mark. 2019, 34, 948–964. [Google Scholar] [CrossRef]
  13. Das, T.K.; Rahman, N. Determinants of Partner Opportunism in Strategic Alliances: A Conceptual Framework. J. Bus. Psychol. 2010, 25, 55–74. [Google Scholar] [CrossRef]
  14. Indrawati, H.; Caska; Suarman. Barriers to technological innovations of SMEs: How to solve them? Int. J. Innov. Sci. 2020, 12, 545–564. [Google Scholar] [CrossRef]
  15. Wang, M.X.; Feng, X.L.; He, W.J. Economic policy of uncertainty and enterprise technological innovation: Mechanism analysis and empirical evidence. J. Southwest Univ. 2022, 48, 94–108. [Google Scholar] [CrossRef]
  16. Qian, H.X.; An, T.L. The Influence Mechanism of Financial Deepening on Technology Innovation in China. Nanjing J. Soc. Sci. 2022, 7, 50–60. [Google Scholar] [CrossRef]
  17. Guo, N.; Quan, Y. Practical exploration and thinking of local governments intervention in financial market construction in relatively poor counties—By taking inner mongolia autonomous region as an example. Inner Mongolia Soc. Sci. 2022, 43, 207–212. [Google Scholar] [CrossRef]
  18. Chen, Z.; Zhang, Y.; Wang, H.; Ouyang, X.; Xie, Y. Can green credit policy promote low-carbon technology innovation? J. Clean. Prod. 2022, 359, 132061. [Google Scholar] [CrossRef]
  19. Fan, R.; Chen, R.; Wang, Y.; Wang, D.; Chen, F. Simulating the impact of demand-side policies on low-carbon technology diffusion: A demand-supply coevolutionary model. J. Clean. Prod. 2022, 351, 131561. [Google Scholar] [CrossRef]
  20. Wang, D.; Huang, L.; Sun, Z.; Zhou, W.; Wang, W. The impact of environmental regulation on the innovation and diffusion of low-carbon technology in energy sector. IOP Conf. Ser. Earth Environ. Sci. 2021, 687, 012188. [Google Scholar] [CrossRef]
  21. Wang, W.; Lu, N.; Zhang, C. Low-carbon technology innovation responding to climate change from the perspective of spatial spillover effects. Chin. J. Popul. Resour. Environ. 2018, 16, 120–130. [Google Scholar] [CrossRef]
  22. Gao, S.; Wang, C. How to design emission trading scheme to promote corporate low-carbon technological innovation: Evidence from China. J. Clean. Prod. 2021, 298, 126712. [Google Scholar] [CrossRef]
  23. Zhang, X.; Geng, Y.; Tong, Y.W.; Kua, H.W.; Tian, X.; Wu, R.; Zhao, X.; Chiu, A.S. Spatial characteristics and its driving factors of low-carbon energy technology innovation in China: A gravity movement and exploratory spatial data analysis. J. Clean. Prod. 2021, 295, 126481. [Google Scholar] [CrossRef]
  24. Lyu, X.; Shi, A.; Wang, X. Research on the impact of carbon emission trading system on low-carbon technology innovation. Carbon Manag. 2020, 11, 183–193. [Google Scholar] [CrossRef]
  25. Ma, J.; Hu, Q.; Shen, W.; Wei, X. Does the low-carbon city pilot policy promote green technology innovation? based on green patent data of Chinese a-share listed companies. Int. J. Environ. Res. Public Health 2021, 18, 3695. [Google Scholar] [CrossRef]
  26. Cui, H.; Zhu, X.; Wang, H. Collaborative innovation of low-carbon technology from the triple helix perspective: Exploring critical success factors based on DEMATEL-ISM. Pol. J. Environ. Stud. 2020, 29, 1579–1592. [Google Scholar] [CrossRef]
  27. Jiang, Y.; Hu, Y.; Asante, D.; Ampaw, E.M.; Asante, B. The effects of executives’ low-carbon cognition on corporate low-carbon performance: A study of managerial discretion in China. J. Clean. Prod. 2022, 357, 132015. [Google Scholar] [CrossRef]
  28. Deng, Y.; You, D.; Zhang, Y. Research on improvement strategies for low-carbon technology innovation based on a differential game: The perspective of tax competition. Sustain. Prod. Consum. 2021, 26, 1046–1061. [Google Scholar] [CrossRef]
  29. Tang, F.C.; Ji, X.M.; Wang, H.Y. Governance Logic of Opportunism in Open Innovation—From the Perspective of Moral Decision. Forum Sci. Tech. Chin. 2021, 11, 69–77. [Google Scholar] [CrossRef]
  30. Liu, R.H.; Yang, Y.; Ding, M.L.; Wang, S.H. On construction of China’s green and low-carbon technology system and innovation path under the carbon peaking and carbon neutrality goals. Soc. Sci. Guangxi 2022, 4, 8–15. [Google Scholar] [CrossRef]
  31. Yang, X.; Guo, Y.; Liu, Q.; Zhang, D. Dynamic co-evolution analysis of low-carbon technology innovation compound system of new energy enterprise based on the perspective of sustainable development. J. Clean. Prod. 2022, 349, 131330. [Google Scholar] [CrossRef]
  32. Yuan, X.M.; Song, M.X.; Wei, F.L. Study on the evolution of innovation system based on industry-university-research knoeledge sharing. J. Yanshan Univ. 2022, 23, 87–96. [Google Scholar] [CrossRef]
  33. Dong, C.; Bi, K. On innovation performance of low-carbon technology breakthrough innovation network in manufacturing industry under the global value chain: A case study based on Chinese manufacturing industries. IEEE Access 2020, 8, 174080–174093. [Google Scholar] [CrossRef]
  34. Jiang, Y.; Chun, W.; Yang, Y. The effects of external relations network on low-carbon technology innovation: Based on the study of knowledge absorptive capacity. Sustainability 2018, 10, 155. [Google Scholar] [CrossRef]
  35. Zhang, X.; Geng, Y.; Tong, Y.W.; Kua, H.W.; Dong, H.; Pan, H. Trends and driving forces of low-carbon energy technology innovation in China’s industrial sectors from 1998 to 2017: From a regional perspective. Front. Energy 2021, 15, 473–486. [Google Scholar] [CrossRef]
  36. Lai, X.; Liu, J.; Shi, Q.; Georgiev, G.; Wu, G. Driving forces for low carbon technology innovation in the building industry: A critical review. Renew. Sustain. Energy Rev. 2017, 74, 299–315. [Google Scholar] [CrossRef]
  37. Zhao, X.; Bai, Y.; Ding, L. Incentives for personal carbon account: An evolutionary game analysis on public-private-partnership reconstruction. J. Clean. Prod. 2021, 282, 125358. [Google Scholar] [CrossRef]
  38. Yuan, X.; Zheng, C. Evolutionary game and simulation analysis of low-carbon technology innovation with multi-agent participation. IEEE Access 2022, 10, 11284–11295. [Google Scholar] [CrossRef]
  39. Zhou, K.; Ren, T. Low-carbon technology collaborative innovation in industrial cluster with social exclusion: An evolutionary game theory perspective. Chaos 2021, 31, 033124. [Google Scholar] [CrossRef]
  40. Friedman, D. Evolutionary games in economics. Econometrica 1991, 59, 637–666. [Google Scholar] [CrossRef]
  41. He, R.; Gonzalez, H. Numerical Synthesis of Pontryagin Optimal Control Minimizers Using Sampling-Based Methods. In Proceedings of the IEEE 56th Annual Conference on Decision and Control (CDC), Melbourne, Australia, 12–15 December 2017; IEEE: Piscataway, NJ, USA, 2017; pp. 733–738. [Google Scholar]
  42. Xiao, H.J.; Yu, F.W.; Tang, H.L.; Peng, D.H.; Zhou, J.H. A study on the evolutionary game of low carbon environmental friendly technology under the collaborative innovation of government industry school research finance. Oper. Res. Manag. Sci. 2021, 30, 39–46. [Google Scholar] [CrossRef]
  43. Yuan, X.M.; Zheng, C.C. Research on evolutionary game of low-carbon technology collaborative innovation based on tripartite game. Math. Pract. Theory 2022, 52, 31–43. [Google Scholar]
  44. He, R.; Gonzalez, H. Zoned HVAC Control via PDE-Constrained Optimization. In Proceedings of the American Control Conference (ACC), Boston, MA, USA, 6–8 July 2016; IEEE: Piscataway, NJ, USA, 2016; Volume 7, pp. 587–592. [Google Scholar]
  45. Lv, B.L.; Zhao, G.B.; Zhang, Y. On the Existence of Mutual Benefit Cooperative Innovation of Industry-University-Research in China. Value Eng. 2019, 38, 87–88. [Google Scholar] [CrossRef]
  46. Yuan, C.; Yu, H.L.; Yang, D.L. Research on the Evolution of Enterprise Cooperative Innovation Behavior with Strong Reciprocity Theory. Oper. Res. Manag. Sci. 2017, 26, 169–175. [Google Scholar] [CrossRef]
  47. Li, F.; Tu, R.N.; Jia, M.X. Research on the implicit knowledge transfer incentive mechanism within the scientific research innovation team of colleges and universities under reciprocal preference. J. Jiangsu Univ. Sci. Tech. 2019, 33, 74–81. [Google Scholar] [CrossRef]
  48. Ji, L.Y.; Liu, L.C.; Zhang, Y.; Zhang, J.T. Evolutionary Game Analysis of Collaborative Innovation of Industry—University Cooperation under the Preference of Reciprocity. Sci. Tech. Manag. Res. 2018, 38, 74–78. [Google Scholar] [CrossRef]
  49. Yin, S. The Digital Green Innovation of Manufacturing Enterprise Cooperation Based on Reciprocity Theory: Research Status, Analytical Framework and Methodologies. J. Hebei Agric. Univ. 2022, 24, 21–31. [Google Scholar] [CrossRef]
  50. Zhang, S.; Zhu, L. Coregulation Supervision Strategy of Drug Enterprises under the Government Reward and Punishment Mechanism. Complexity 2021, 5865299. [Google Scholar] [CrossRef]
  51. Zhou, K.; Wang, Q.; Tang, J. Tripartite evolutionary game and simulation analysis of coal mining safe production supervision under the Chinese central government’s reward and punishment mechanism. Math. Probl. Eng. 2021, 2021, 5298890. [Google Scholar] [CrossRef]
  52. Xue, H.T. Utilization and management of carbon market revenue: European and American practice and its reference to China. J. Chin. Univ. Geosci. 2022, 22, 77–89. [Google Scholar] [CrossRef]
Figure 1. LCTI under government reward and punishment mechanism.
Systems 10 00118 g001
Figure 2. Replicator dynamic phase diagram of enterprise A.
Systems 10 00118 g002
Figure 3. Replicator dynamic phase diagram of enterprise B.
Systems 10 00118 g003
Figure 4. Replicator dynamic phase diagram of government.
Systems 10 00118 g004
Figure 5. Evolution of E2(0,0,1).
Systems 10 00118 g005
Figure 6. Evolution of E4(0,1,1).
Systems 10 00118 g006
Figure 7. Evolution of E6(1,0,1).
Systems 10 00118 g007
Figure 8. Evolution of E8(1,1,1).
Systems 10 00118 g008
Figure 9. The impact of government penalties on the opportunism of firms A and B.
Systems 10 00118 g009
Figure 10. The impact of reciprocity on firms’ probability of success in innovation.
Systems 10 00118 g010
Figure 11. The impact of opportunism on firms’ probability of success in innovation.
Systems 10 00118 g011
Figure 12. The impact of LCTI’s market value.
Systems 10 00118 g012
Figure 13. The impact of additional innovation gains.
Systems 10 00118 g013
Figure 14. The impact of the cost of low-carbon technology innovation.
Systems 10 00118 g014
Figure 15. The impact of additional innovation costs.
Systems 10 00118 g015
Figure 16. Government reward and punishment mechanisms for different steady states.
Systems 10 00118 g016
Table 1. Major notations.
ParametersMeanings
W Market value of LCTI.
Δ W Extra gains earned by firms from total market returns when they choose opportunism (hence also the losses incurred by reciprocal firms).
I Total cost of investment required for corporate LCTI.
Δ I Additional cost to companies when they choose reciprocity for LCTI.
α Proportion of the share of enterprise A in the market.
β Government’s carbon tax subsidy for LCTI.
P 1 Probability of LCTI success under reciprocity.
P 2 Probability of LCTI success under opportunism.
E Environmental and economic gains for the government when participating in LCTI.
E 11 Additional benefits to the government when both enterprises A and B practice reciprocity.
E 10 Additional benefits to the government when only one enterprise chooses reciprocity.
L 1 Government penalties for enterprise A when it chooses opportunism.
L 2 Government penalties for enterprise B when it chooses opportunism.
S 1 Environmental and economic losses incurred by the government when one business chooses opportunism and the other reciprocity.
S 2 Environmental and economic gains for the government when both enterprises choose opportunism.
Table 2. The game matrix of the three parties.
Enterprise AEnterprise BGovernment
ParticipationNon-Participation
ReciprocityReciprocity A x , B y , G z A x , B y , G 1 z
Opportunism A x , B 1 y , G z A x , B 1 y , G 1 z
OpportunismReciprocity A 1 x , B y , G z A 1 x , B y , G 1 z
Opportunism A x 1 , B 1 y , G z A 1 x , B 1 y , G 1 z
Table 3. The payoff matrix of the three parties.
Strategy CombinationEnterprise AEnterprise BGovernment
A x , B y , G z 1 + β α P 1 W α I 1 + β ( 1 α ) P 1 W 1 α I E + E 11
A x , B y , G 1 z α P 1 W α I ( 1 α ) P 1 W 1 α I E 11
A x , B 1 y , G z 1 + β α P 1 W α I Δ W Δ I 1 + β ( 1 α ) P 2 W 1 α I + Δ W L 2 E + E 10 + L 2 S 1
A x , B 1 y , G 1 z α P 1 W α I Δ W Δ I ( 1 α ) P 2 W 1 α I + Δ W E 10 S 1
A 1 x , B y , G z 1 + β α P 2 W α I + Δ W L 1 1 + β ( 1 α ) P 1 W 1 α I Δ W Δ I E + E 10 + L 1 S 1
A 1 x , B y , G 1 z α P 2 W α I + Δ W ( 1 α ) P 1 W 1 α I Δ W Δ I E 10 S 1
A x 1 , B 1 y , G z 1 + β α P 2 W α I L 1 1 + β ( 1 α ) P 2 W 1 α I L 2 E + L 1 + L 2 S 2
A 1 x , B 1 y , G 1 z α P 2 W α I ( 1 α ) P 2 W 1 α I S 2
Table 4. Stability analyses for enterprise A, enterprise B, and the government.
Equilibrium PointsEigenvaluesEigenvalue SymbolStateStability Condition
E 1 0 , 0 , 0 α W P 1 P 2 Δ I Δ W uncertainUnstable point
W P 1 P 2 1 α Δ I Δ W uncertain
L 1 + L 2 + E +
E 2 0 , 0 , 1 L 1 + α W P 1 P 2 β + 1 Δ I Δ W uncertainESS
L 2 Δ I W P 1 P 2 1 α 1 β Δ W uncertain
L 1 E
E 3 0 , 1 , 0 α W P 1 P 2 Δ W uncertainUnstable point
Δ I + Δ W W P 1 P 2 1 α uncertain
S 1 + E +
E 4 0 , 1 , 1 L 1 + α W P 1 P 2 β + 1 Δ W uncertainESS
Δ I L 2 + W P 1 P 2 1 α 1 β + Δ W uncertain
L 1 S 1 E
E 5 1 , 0 , 0 Δ I α W P 1 P 2 + Δ W uncertainUnstable point
W P 1 P 2 1 α Δ W uncertain
L 2 + E +
E 6 1 , 0 , 1 Δ I L 1 α W P 1 P 2 β + 1 + Δ W uncertainESS
L 2 W P 1 P 2 1 α 1 β Δ W uncertain
L 2 E
E 7 1 , 1 , 0 Δ W α W P 1 P 2 uncertainUnstable point
Δ W W P 1 P 2 1 α uncertain
E +
E 8 1 , 1 , 1 Δ W L 1 α W P 1 P 2 β + 1 uncertainESS
Δ W L 2 + W P 1 P 2 1 α 1 β uncertain
E
E 9 eigenvalues with different valenceSaddle point
Note: ①: Δ I + Δ W > L 1 + α W P 1 P 2 β + 1 , Δ I + W P 1 P 2 1 α 1 β + Δ W > L 2 . ②: Δ W > L 1 + α W P 1 P 2 β + 1 , L 2 > W P 1 P 2 1 α 1 β + Δ I + Δ W . ③: L 1 + α W P 1 P 2 β + 1 > Δ I + Δ W , W P 1 P 2 1 α 1 β + Δ W > L 2 . ④: L 1 + α W P 1 P 2 β + 1 > Δ W , L 2 > Δ W + W P 1 P 2 1 α 1 β .
Table 5. The parameter values for each case in the evolutionary game model.
W Δ W I Δ I α β P 1 P 2 L 1 L 2 E S 1 S 2
Case 140.5210.60.40.550.450.70.5112
Case 23.50.720.50.60.60.60.41.21112
Case 341.520.50.60.50.60.22.50.5112
Case 440.421.80.60.50.60.31.51112
Publisher’s Note: MDPI stays neutral with regard to jurisdictional claims in published maps and institutional affiliations.

