A Federated Mixed Logit Model for Personal Mobility Service in Autonomous Transportation Systems


1
School of Intelligent Systems Engineering, Sun Yat-sen University, Shenzhen 518107, China
2
College of Resource Environment and Tourism, Capital Normal University, Beijing 100048, China
*
Author to whom correspondence should be addressed.
Systems 2022, 10(4), 117; https://doi.org/10.3390/systems10040117
Submission received: 19 July 2022
/
Revised: 5 August 2022
/
Accepted: 8 August 2022
/
Published: 10 August 2022
Abstract
:Looking ahead to the future-stage autonomous transportation system (ATS), personal mobility service (PMS) aims to provide the recommended travel options based on both microscopic individual travel demand and the macroscopic supply system objectives. Such a goal relies on massive heterogeneous data to interpret and predict user travel intentions, facing the challenges caused by prevalent centralized approaches, such as an unbalanced utilization rate between cloud and edge, and data privacy. To fill the gap, we propose a federated logit model (FMXL), for estimating user preferences, which integrates a discrete choice model—the mixed logit model (MXL), with a novel decentralized learning paradigm—federated learning (FL). FMXL supports PMS by (1) respectively performing local and global estimation at the client and server to optimize the load, (2) collaboratively approximating the posterior of the standard mixed logit model through a continuous interaction mechanism, and (3) flexibly configuring two specific global estimation methods (sampling and aggregation) to accommodate different estimation scenarios. Moreover, the predicted rates of FMXL are about 10% higher compared to a flat logit model in both static and dynamic estimation. Meanwhile, the estimation time has been reduced by about 40% compared to a centralized MXL model. Our model can not only protect user privacy and improve the utilization of edge resources but also significantly improve the accuracy and timeliness of recommendations, thus enhancing the performance of PMS in ATS.
1. Introduction
In recent years, along with the rapid development of advanced technologies, e.g., the internet of things (IoT), big data (BD), and artificial intelligence (AI), [1], various emerging services and devices applied in the field of transportation, e.g., autonomous vehicles for vehicle to everything [2,3,4], e-scooter with ride-sharing [5], to support the upgrade of transportation systems (TS) by elevating their level of automation and intelligence [6]. Accordingly, a novel form of modern TS, named autonomous TS (ATS) [7], is being enlightened. Compared to past conventional TS (CTS) and present intelligent TS (ITS) [8], ATS can manage diversified demands and automatized supplies through a self-actuating cycle consisting of sensing, learning, rearranging, and reacting steps, further improving the safety, reliability, convenience, efficiency, and sustainability of TS [7].
Moreover, as the foundation to impel the evolution of TS towards ATS, mobility services (MSs), the most immediate interface to interact with individual travelers, are also being renovated to facilitate the daily life of the public and explore the advancement of ATS. Specifically, in the past stage, MSs intend to assist mobility-on-plan, i.e., the user needs are pre-scheduled based on available means, public transits (e.g., buses, railways) [9]. Even though such MSs have been utilized widely, their primitivity prevents them from supporting personalized mobility timely. As experienced in the current stage ITS, MSs are designed to assist mobility on demand [10], i.e., shared mobility [5,11]. However, such MSs still have non-negligible limitations in achieving an equilibrium between diverse mobility demands and supplies. To foster mobility on integration and explore the advancement of the future-stage ATS, a novel service to bridge individual demands with system supplies comprehensively, called personal mobility service (PMS), is being studied [7,12,13].
In general, PMS measures both the preference of each individual and the overall running status of the system to provide the recommended travel options that are beneficial for both sides (i.e., the system and the user). Specifically, from the traveler’s point of view, before a trip is started, users can access the personal trip menu timely via various channels (e.g., smartphone app, tablet, and computer), to view and select the personalized options, e.g., route, mode, time, and cost. Furthermore, in the back-end system, these personalized demands are simultaneously consolidated and optimized to achieve systematic objectives, e.g., to be eco-friendly, less congested, and cost-efficient. Therefore, through bilateral interactions between individuals and the system, PMS can continuously improve the quality and efficiency of ATS for mobility as a service [11].
To achieve such a goal, an intelligent core becomes essential for PMS to interpret and predict user travel preferences and system stages for optimized travel plans. Conventionally, PMS employs centralized approaches to harness multi-source heterogeneous data, such as open data (e.g., road networks, timetable of public transits), proprietary data (e.g., mobile signal data, smart card data), and personal data (e.g., user profiles, choice histories, travel trajectories), in a central server [14,15]. Therefore, it requires massive and diverse data of macroscopic system situations and microscopic user behaviors to be sensed and transmitted into the server center. With the vast application of PMS to serve heterogeneous users with more diverse mobility demands in recent years, several trends occur. First, the workload of the central server may increase exponentially, requiring high computation capability and communication bandwidth [16]; second, plentiful resources associated with interconnected devices at the edge are underutilized most of the time [17]; lastly, from the data point of view, users become more isolated due to the regulation about data security and user privacy, prohibiting the sharing of private data for user behavior analysis [18].
In this context, PMS in ATS encounters three critical challenges, including:
- How to preserve user data privacy while creating a shareable and customized intelligent core to support and optimize the operation of the service [19];
- How to coordinate the idle resources allocated at the edge to ease the burden of the central server and improve the robustness of the service in the meantime [20];
- How to serve mass heterogeneous users by addressing their diversified mobility demands with user-oriented solutions for a high quality of service (QoS) [21].
As a novel solution to address the above challenges, federated learning (FL) [22,23,24] is now in the spotlight to learn AI models in a collaborative and privacy-preserving manner. Instead of being transmitted directly to the server, raw data are processed locally at each client for the learning parameters (i.e., gradients), which will be uploaded and aggregated at the server to generate a global model [25]. If such a process can be implemented in PMS, data islands and idle resources can be bridged and utilized to assist the learning of the intelligent core. However, since FL is generally designed for deep neural networks, it lacks support to train behavioral models such as the discrete choice model (DCM). Then, how to create a customized model with high interpretability by fusing FL with DCM becomes essential for PMS to better protect user privacy and assist personalized mobility.
To fill the gap, in this paper, we aim to incorporate the emerging FL with mixed logit model (MXL) (an advanced method for performing individual-level recommendations) [26,27,28]. Specifically, through FL, distributed devices can be collaborated to train a global model locally without exchanging user-sensitive data, thus effectively reducing the risk of privacy leakage and improving the utilization of idle resources at the edge. By training MXL, key factors representing user travel behaviors can be identified and utilized to better address the choice heterogeneity among individuals. Hence, by inheriting the advantages of FL and MXL, a federated mixed logit model (FMXL) is proposed with a redefined local and global collaborative estimation process. In general, the major contributions of this article are summarized as follows.
- An MXL-oriented federated learning problem with local and global learning steps is first defined to harness the travel choice heterogeneity of individuals by building their local models synergistically and privately.
- FMXL is designed with two species, i.e., FMXL-SPL (FMXL based on sampling) and FMXL-AGG (FMXL based on aggregation). In particular, in global learning, FMXL-SPL can estimate a distribution equivalent to the posterior distribution of conventional MXL, and FMXL-AGG can simplify the distribution estimation by the average aggregation operation for better performance.
- FMXL is evaluated based on a public dataset (Swissmetro) with static and dynamic recommendation scenarios. As a result, it can improve model predicted rates by about 10% compared to a flat logit model and reduce estimation time by about compared to a centralized MXL model.
The remainder of this paper is structured as follows. In Section 2, a literature review is presented to summarize the current challenges and solutions in PMS. Then, Section 3 and Section 4 introduce and evaluate the FMXL, respectively. Finally, Section 5 concludes the work and discusses future research directions.
2. Literature Review
This section summarizes the challenges encountered in implementing a more private and efficient PMS, as well as related work to address them.
2.1. Emerging Challenges
To cover more travel modes and serve more diverse users, three major challenges occur in implementing a more private and efficient PMS, namely:
- Data security and privacy: It is defined as preventing direct access to users’ private data, which has become a widespread concern. For instance, cooperative ITS (C-ITS) in the EU must acquire an explicit consent agreement before processing the user data [29]. Therefore, data silos as represented by smart objects associated with individuals tend to be more restricted to prevent the actual application of PMS.
- Service scalability and latency: It represents the ability to serve a large number of users while guaranteeing quick responses. With the continuous growth of user volumes, the central cloud may become the performance bottleneck for an immediate response, as it undertakes the majority of functionalities to support PMS [17,20]. In such a case, the reliability and availability of PMS may be downgraded when maintaining high QoS (e.g., less latent and intrusive in providing service responses).
- User heterogeneity and personalization: It reflects the behavioral diversity among users, which can be similar or discrepant with a dynamic nature related to time, space, and people. Accordingly, to better support user demands in various manners, PMS needs to handle user heterogeneity and provide personalized recommendations efficiently and effectively [30].
Facing the challenges summarized above, several solutions are proposed to update PMS for the development of ATS in supporting individual mobility.
2.2. Related Solutions
To assist personal mobility by addressing the emerging challenges, the model and also its training approaches need to be upgraded. Specifically, for the applied models, there are two distinct categories: one is machine learning (ML) algorithms, i.e., heuristic search or deep neural networks [31], and the other is mathematical methods, such as the widely applied discrete choice model (DCM). As the core function of PMS is to recommend travel options according to both user preferences and system running statuses, various ML algorithms have been studied, e.g., a graph embedding-based method, called Trans2vec (transport modes embedding model) [32], is designed to make recommendations by combining the historical travel behaviors and user/OD (origin to destination) relevance, a gradient boosting decision tree (GBDT) based model, called Hydra-L (the light-weight version of Hydra) [33], is proposed to alleviate the variance of individual preference correlated with situational context (e.g., nearby point of interest and weather) for plans integrating various uni-modal and multi-modal transportation routes.
Since ML-based models have intrinsic flaws in interpreting user behaviors, the alternative DCM starts to be discussed and utilized in personalized recommendations [34]. As defined by the utility function, DCM has higher reasoning capability to diagnose and analyze the key factors influencing user choices. Accordingly, more rational decisions can be suggested, e.g., how much incentive is adequate in encouraging individuals to choose more energy-efficient modes [35]. Even though DCM shows its merits in supporting PMS to harness the heterogeneity among individuals, only a minority of DCM-based solutions are proposed, e.g., LCM-T (a logistic collaborative model with time-varying parameters) [36] and online-mixed logit (MXL) [27], which still suffers performance issues.
To provide immediate responses to user requests, specific model training procedures are discussed to support online recommendations of PMS. It should handle real-time changes in users and the overall system, and accordingly, provide optimized travel options with high user experience and low system cost. For instance, based on distributed computing, an extension of Hydra-L named Hydra-H (the heavy-weight version of Hydra) [37] is implemented by creating separated data pipelines to accelerate the feature engineering and data integration processes. However, these distributed methods can not meet the requirements of user privacy protection, as they still need raw data to be collected and processed at a central server. Accordingly, FL [22] becomes a flexible and efficient approach to building ML models less dependent on the central cloud under the premise that sensitive data will only be processed locally at the edge. Since FL is still in its infancy and waiting for a vast application in the field of transportation, currently, only a few FL-based ML models are proposed, such as FedRec (federated recommendation) [38] and FedDeepFM (federated factorization machine) [39].
To sum it up, as listed in Table 1, first, despite the predictive capacity to tackle the aforementioned challenges, existing ML-based methods have weak straightforward explanatory power, which is critical for PMS to make rational optimizations on transportation systems. Moreover, even though mathematical methods can better support user heterogeneity and personalization with high interpretability, their ability in supporting service scalability and latency is still limited to providing rapid online responses. Lastly, by adopting FL, the issues caused by data security and privacy can be addressed with the additional benefit of relaxing the burden of central servers and accelerating the model training process by managing the dispersed and isolated computing resources as a joint cluster. However, a mutual guarantee of data privacy and model interpretability is still missing. Hence, by combining the advantages of FL with that of MXL, this paper proposes a federated mixed logit model (FMXL) to fully address the existing challenges in PMS.
3. Methodology
This paper proposes a collaborative and privacy-preserving mixed logit model (MXL) for PMS, named federated mixed logit model (FMXL), to improve model training performance and explanatory ability. Since conventional MXL is created through centralized approaches, first, we define the learning problem for MXL under the context of FL. Next, the standard MXL is presented as the foundation to discuss FMXL.
3.1. Problem Definition
Figure 1 shows two simplified collaboration flows of PMS, in which the term “client” is used to denote computing and communication nodes at the edge that correspond to individual devices, and the term “server” is used to describe the central server at the cloud. Let denote the client set, and each client has its local dataset .
To create MXL, the estimation problem can be distinguishable between centralized and federated approaches, namely:
(1) Conventional centralized estimation (CE): As shown in Figure 1A, the server receives raw data uploaded by each client, and fuse them into an integrated data set . The centralized learning problem is to estimate the target MXL , where the model for each client is denoted as .
(2) Defined federated estimation (FE): As the research objective of our work, shown in Figure 1B, the server coordinates each client to estimate their respective local logit model , where the estimation process must satisfy the following three restrictions simultaneously:
- Privacy: As an essential precondition, each client does not share data , but only communicates with the server to exchange learning parameters, such as local model .
- Synergetic: The estimation process operates simultaneously and collaboratively both at server and clients, which can improve the utilization of resources at the edge and reduce the workload of the server in the cloud.
- Heterogeneous: The estimated model can be heterogeneous across clients to represent individual-level preferences.
By following the three principles above, the objective of FE is to learn a federated model with a similar ability to the one learned from centralized estimation, which can be expressed by Equation (1).
To evaluate the feasibility of FE in improving PMS, a SWOT (strengths, weaknesses, opportunities, and threats) analysis is given as shown in Figure 2. Compared to CE, FE can protect data privacy and coordinate the idle resources allocated to clients while maintaining the heterogeneity of the MXL model, thus solving the challenges faced by PMS effectively and efficiently. Even though a slight deviation between FE and CE can be observed in training the same model, it can be eliminated or remitted by the proposed FMXL (in Section 3.3). Furthermore, FE is more cost-efficient and scalable, as it can be implemented directly to support gradually growing users without acquiring the additional deployment of high-cost cloud centers to maintain a stable QoS. Finally, since FL started to be discussed only in recent years, applications and regulations about how to utilize it in the field of transportation, especially for PMS, are still missing. In conclusion, as a pioneer in learning MXL based on FL, FE can be a non-intrusive, timely responsive, cost-efficient, and user-satisfying solution for PMS.
3.2. Mixed Logit Model (MXL)
First, let us consider a standard discrete choice model (DCM). According to the random utility maximization theory [26], DCM assumes that each individual n makes rational decisions to maximize the utility on a set of choices . Hence, an essential step in DCM is to specify a function that can capture the utility of each alternative j for each n.
In general, the utility function consists of two components, , where is an observed utility and is an i.i.d. (independent and identically distributed) error term that captures the uncertainty.
In addition, as defined in Equation (2), the observed component is typically assumed to be a linear function, in which represents a vector of an individual’s socio-demographic characteristics and other personal attributes, and represents a vector of preference parameters, which also defined as individual-level parameters.
Under the standard multinomial logit assumption that , the probability of individual n selecting alternative j, marked as , is given in Equation (3), where denotes the number of alternatives in the choice set of individual n.
As stated before, MXL describes population heterogeneity by the distribution of individual-level preferences rather than the average preferences. Hence, we assume that individual-level parameters are multivariate normally distributed as defined in Equation (4).
where is Gaussian distribution, and are population-level parameters. Specifically, represents the mean, and represents the covariance matrix. Nevertheless, the distribution can be set to other forms according to the actual application requirements, which can refer to [40].
When given the observed choices situations and the corresponding results of individual n, the probability conditioned on and can be expressed in Equation (5).
where is equal to one if individual n chooses alternative j in choice, and otherwise zero; is the total number of choices.
In general, the objective is to determine the parameters and , which are typically estimated by maximizing the log-likelihood for a population of size N as defined in Equation (6).
Since Equation (6) is with an integral without a closed form, it cannot be solved directly. Moreover, it also requires a complicated simulation procedure to obtain the , which retards our original idea of using MXL to capture individual preferences.
To resolve it, in this paper, we follow a Bayesian approach as shown in Figure 3, which combines the prior with sample data to obtain the posterior distribution of all unknown parameters.
Accordingly, the process begins by placing an uninformative prior distribution for the hyper-parameter and as defined in Equations (7) and (8), respectively.
where represents the vector of prior means; A is a diagonal covariance matrix (note that the value of ); represents the inverse Wishart distribution, in which M denotes the number of unknown parameters in the local model and is a M-dimensional identity matrix.
Then, based on Bayes’ theorem, the posterior distribution over the unknown parameters can be defined in Equation (9).
To make exact inference of this posterior distribution is impossible because Equation (9) is not tractable. Therefore, sampling simulation procedures are generally required to obtain the mean of the simulated posterior distribution as the estimated value of model parameters.
Finally, in centralized estimation methods, the server needs to collect raw data from clients to implement the entire simulation process. Due to the challenge of data security and user privacy, these approaches may become infeasible, and hence, how to create a model according to FL shall be defined.
3.3. The Proposed Federated Mixed Logit Model (FMXL)
To estimate the posterior distribution (Equation (9)) under the premise of protecting individual data, the main focus of this paper is to combine FL with the three-layered Gibbs sampler [41], and proposes a federated mixed logit model (FMXL), which can deploy the model parameters and their estimation processes on the server and clients separately.
As shown in Figure 4, the proposed model FMXL consists of:
- Local Estimation, in which each client estimates its individual-level parameters based on local data;
- Global Estimation, in which the server updates the population-level parameters based on non-intrusive and sensitive information (including but not limited to individual-level parameters) from the clients;
- Interaction Mechanism, which specifies how the server and clients interact with each other to achieve a valid estimation required by the model.
3.3.1. Local Estimation in the Client
As shown in Figure 4A, in current iteration i, the conditional posterior of the individual-level parameters (), as defined in Equation (10), is sampled in each client based on the latest population-level parameters ( and ) (which are estimated and broadcasted by the server in iteration ).
Apparently, there is no simple way to estimate Equation (10), and so the Metropolis–Hasting (MH) sampling [42] is used, which executes according to the following three steps:
- Step I: For client n, a trial value of is created according to Equation (11).where is the Cholesky factor of , v are M independent variables from , and is a parameter of the jumping distribution specified by the server in every iteration;
- Step II: Accordingly, a standard uniform variable u is drawn, according to Equation (12).where represents standard uniform distribution;
- Step III: An acceptance ratio is calculated according to Equation (13):
- Step IV: If , is accepted, and then, let ; otherwise, let .
3.3.2. Global Estimation in the Server
As shown in Figure 4B, instead of collecting and processing raw data, the server estimates the population-level parameters and based on the individual-level parameters uploaded by the clients.
Since the estimation process is different from the centralized approach, in FMXL, two estimation methods are proposed, namely:
- Sampling-based method (FMXL-SPL): It follows the standard Gibbs approach to sample the conditional posterior of global parameters;
- Aggregation-based method (FMXL-AGG): It adopts the widely-used federated average algorithm FedAvg [22] to calculate the global parameters.
Sampling (SPL)-Based Method—FMXL-SPL
The conditional posteriors of global parameters given by Equation (9) can be rewritten into Equations (14) and (15), respectively.
Then, based on the fact that the prior is diffuse, the conditional posteriors of and can be simplified as defined in Equations (16) and (17), respectively:
where,
According to Equations (16) and (17), the population-level parameters can be estimated by FMXL-SPL according to the following steps:
- Step I: First, by drawing M-dimensional multivariate standard normal , and then calculating the Choleski factor of , can be estimated according to Equation (19):
- Step II: Based on the M-dimensional standard normal distribution for , noted as , the Choleski factor of can be calculated, and finally, can be obtained according to Equation (20) directly:
Aggregation (AGG) Method—FMXL-AGG
In FedAvg, the client uploads model parameters after local training, and the server updates the global model by weighted averaging on the received local model parameters. Inspired by FedAvg, we proposed an aggregation method for global estimation, called FMXL-AGG.
Analogously, the server calculates the mean and covariance of the latest local parameters instead of doing conditional sampling. Even though such a method cannot make an exact inference on the posterior, it can significantly simplify the process to search for an optimal global configuration.
Therefore, the population-level parameters can be calculated according to the following two steps:
In general, by using FMXL-SPL, FMXL can achieve the same performance as standard MXL, while using FMXL-AGG, FMXL can dramatically reduce the computation burden as the global parameters (i.e., population-level parameters) can be calculated directly according to the average operation. Even though the complexity of FMXL-AGG is lower than FMXL-SPL, surprisingly, it can improve the model performance in recommendation accuracy and learning time compared to FMXL-SPL as shown by the evaluation results in Section 4.
3.3.3. Synchronous Client–Server Interaction
As shown in Figure 4C and Algorithm 1, the server and clients interact with each other based on a synchronous mechanism. Specifically, first, the server broadcasts learning parameters, i.e., population-level parameters and jumping steps, to the clients. Second, the client conducts local estimation in parallel, and then uploads sampled parameters or rejected signals to the server. Third, once the server receives the updates from all clients (after an intolerable waiting time, the updates of unsuccessful clients will be abandoned), it adopts FMXL-SPL or -AGG for population-level estimation, and updates the jumping steps. Finally, after one iteration is completed, the server will check the stop condition, i.e., maximum iterations. If the stop condition is not matched, the updated population-level parameters and the newest jumping steps are distributed to the clients for a new round of local parameters sampling and uploading; otherwise, the learning stops by only spreading the population-level parameters to the clients. Note that a proper number of iterations shall be configured to achieve a stable estimation and the mean value in the stable phase is chosen as the final estimate of FMXL parameters.
In summary, FMXL eliminates the collection of raw data compared to the traditional centralized methods. Hence, it can enable the sampling without the data leaving the personal devices by communicating and interacting with the server by only exchanging learning parameters. Such a federated process can ensure user privacy, improve the utilization of resources on the user side, and also ease the server workload. Moreover, the performance of MXL can be maintained and improved as well by using both FMXL-SPL and -AGG methods for the global parameter estimation. To better reveal the merit of FMXL, an evaluation is conducted and related results are discussed in the following section.
| Algorithm 1 Pseudocode for FMXL model. |
|
4. Performance Evaluation
This section will evaluate the proposed model together with standard DCMs based on the same evaluation dataset, scenarios, and metrics. Moreover, the results will be analyzed to demonstrate the supremacy achieved by FMXL.
4.1. Evaluation Preparation
To conduct a fair comparison, this section introduces the common setting of the experiments, including the evaluation dataset, scenarios, metrics, and baselines.
4.1.1. Data and Model Structure
This paper uses the publicly available dataset Swiss Metro (https://biogeme.epfl.ch/data.html, accessed on 9 August 2022), which surveys each respondent in sufficient quantity to demonstrate the methodology for estimating individual-level preferences. Specifically, the data were collected in Switzerland on the trains between St. Gallen and Geneva in 1998. Moreover, respondents were presented with nine hypothetical choice tasks, each of which contained three alternatives, i.e., private car, Swissmetro (SM), and train. The attributes of these modes include travel cost, travel time, etc. More data details can be found in [43].
For convenience, we discard the following categories of respondents, namely (1) those who have missing values in representing their choices on the three alternatives, (2) those who have annual tickets resulting in significant travel choice biases, and (3) those who have wrong-collected features detected through a data consistency checking, e.g., the time and cost of travel are not proportional to each other. After the data preprocessing, the cleansed dataset contains 840 respondents. Then, for each respondent, a virtual client is created and associated with the first 8 menus as the training dataset and the 9th menu as the test dataset.
Furthermore, the willingness-to-pay [44] utility equations are used to define the common estimation task as presented in Equations (23)–(25).
where represents the alternative specific constant with “train” being the comparison term. Therefore, of “train” is zero. represents travel cost with a fixed coefficient of −1. “Time” represents travel time, and and stand for the coefficient of travel time and the scale parameter, respectively, and finally, is the error term subjected to extremal distribution.
4.1.2. Simulation Settings and Scenarios
We virtualized a communication and computation environment with one central server and 840 clients. The total network bandwidth is 10 MHz, and the server’s CPU-cycle frequency is 2.5 GHz. For clients, the transmission power is distributed between 0.2 and 1 w, and the CPU-cycle frequency is 1.5∼2 GHz.
Moreover, we design two kinds of experiments for static and dynamic estimations to represent two typical application scenarios of FMXL in PMS, namely:
- Static estimation: We assume that all data have already been generated. The model is estimated under 30,000 iterations, 15,000 of which are used as burn-in draws, while the remaining are used to update posterior distributions.
- Dynamic estimation: We assume that the number of clients and their local data will increase gradually and dynamically in each estimation round (which consists of 2000 iterations). Specifically, the initial number of clients to activate the estimation is 300, which will increase at a random rate between 8% to 10% of the total clients until the total number of 840 is reached. Moreover, the local dataset of the client contains 1∼2 initial menus and grows with 1∼2 menus per estimation round.
4.1.3. Evaluation Metrics and Baselines
Three common evaluation metrics are chosen, namely:
- Log-Likelihood (LL): It is calculated according to Equation (26), where Y represents the number of samples in the test set and represents the logit probability of sample y;
- Predicted Rate (PR): According to Equation (27), is a binary variable, which is one if the model predicts the mode correctly, and otherwise zero;
- Estimation Time (ET): In each iteration, ET can be split into two parts, i.e., computation time and communication time. Accordingly, of centralized and federated approaches are defined by Equations (28) and (29), respectively, in which, represents the number of participated clients; and represent computation time of client n and the server at the iteration, respectively; represents communication time of client n at the iteration. Note that the communication time in the downlink, as well as the computation time in each local client, is ignored, since the time consumed in the uplink is negligible compared to the one of downlink [45], and in this study, clients are utilized to measure how the workload can be reduced for the central server by using the idle resources at the edge.
To the best of our knowledge, the proposed FMXL is the first in its kind by adopting FL. Hence, to reveal its performance, two basic models based on centralized learning are used as the baselines, namely:
- Flat logit model (FAL): It represents the willingness-to-pay form (explained in Section 4.1.1), which assumes that the preference parameters do not vary across individuals. Moreover, it is estimated by centralized MH sampling.
- Mixed logit model (MXL): It is the foundation model of our proposed FMXL. In addition, it is estimated by the centralized three-layered Gibbs sampling process.
4.2. Evaluation Results
According to the above preparation, the proposed model is evaluated together with the baselines in the two defined scenarios, i.e., static and dynamic estimation, and related results are grouped and discussed separately.
4.2.1. Evaluation Results of Static Estimation
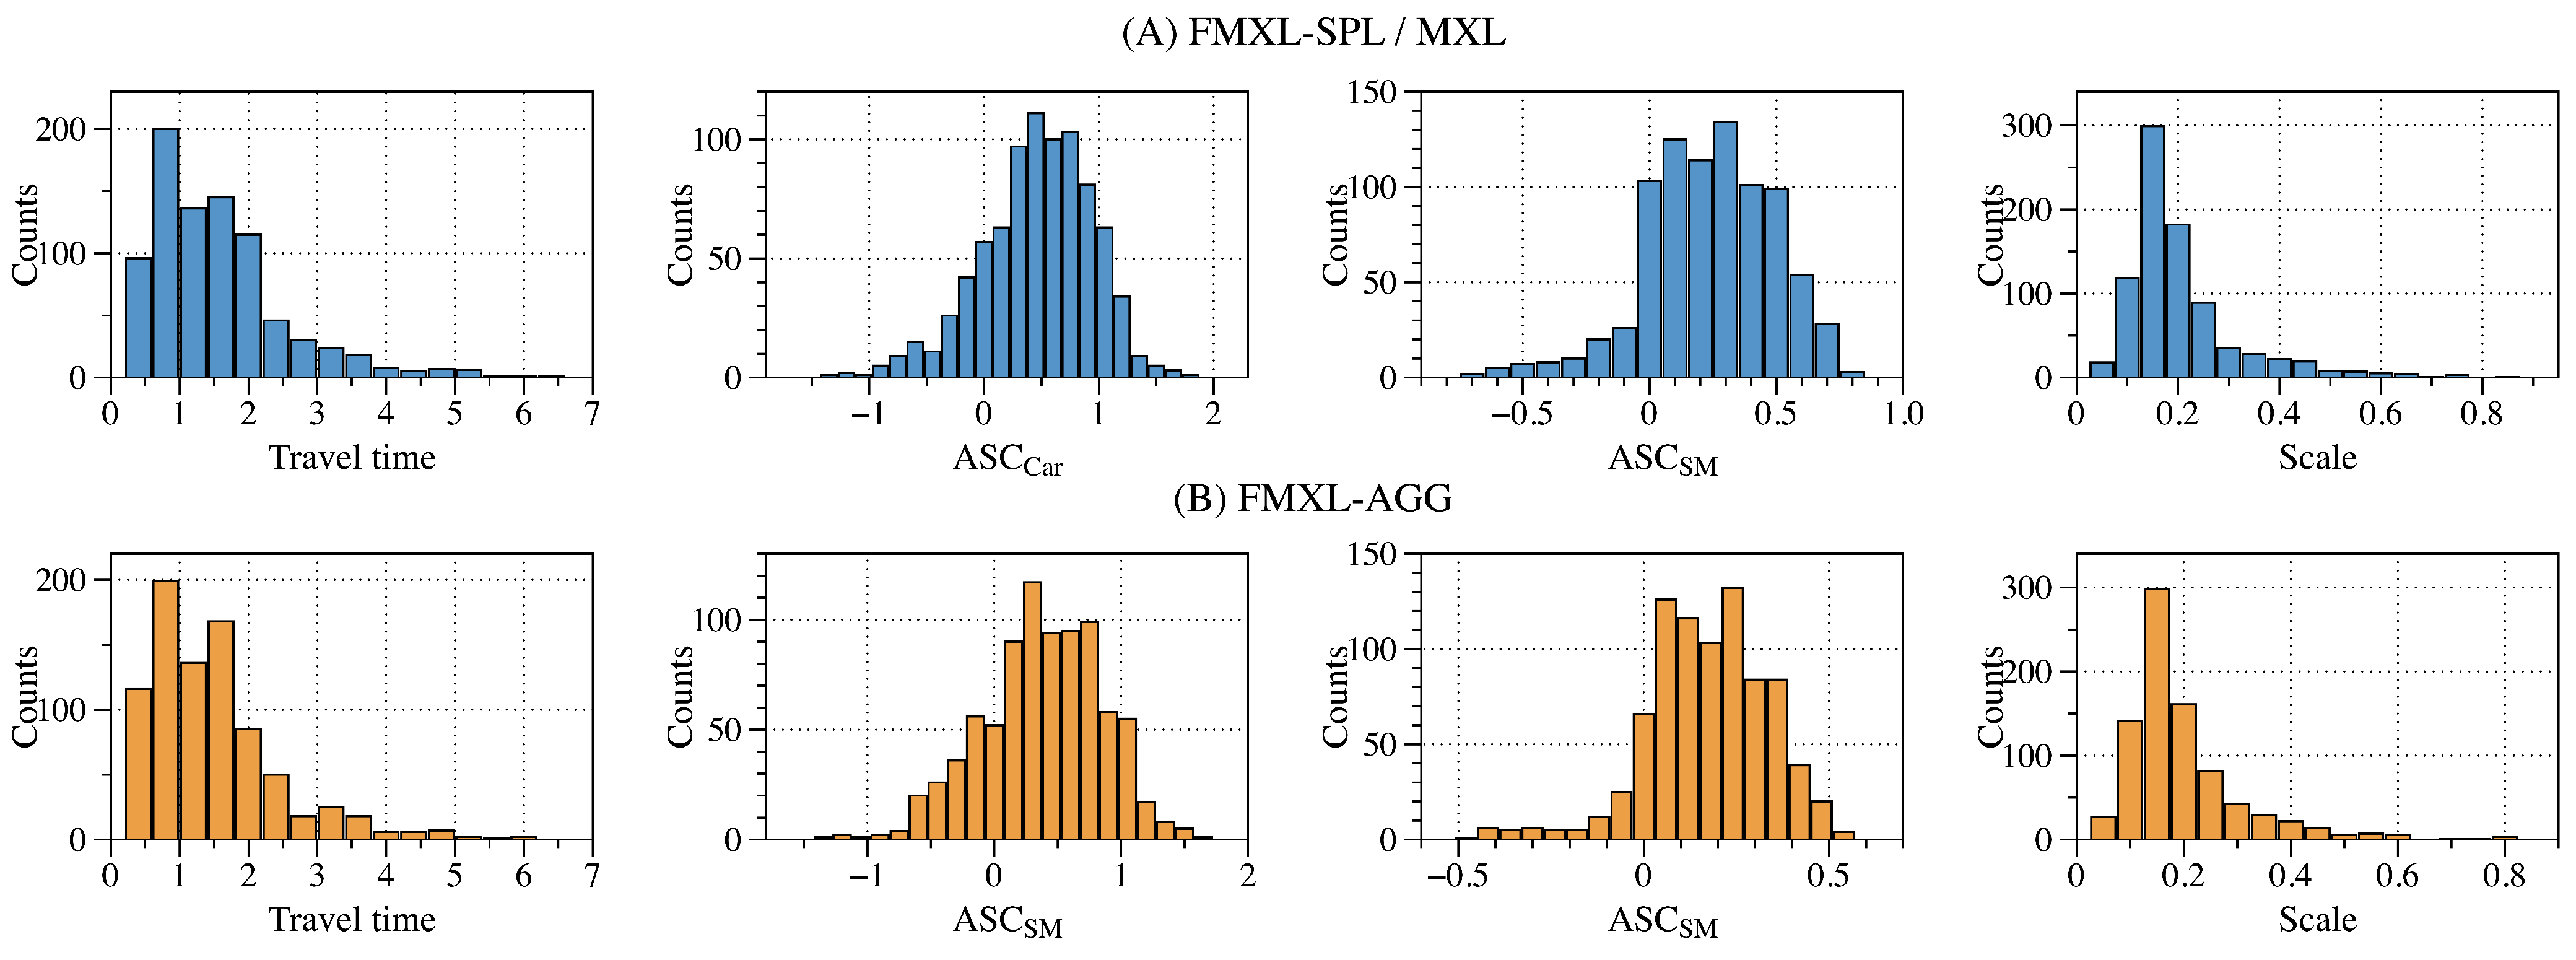
First, by comparing the results in Table 2 and Table 3 and Figure 5, we can see that FMXL-SPL (MXL can be treated as its centralized version without applying FL), and FMXL-AGG can capture the individual-level heterogeneity for all coefficients, resulting in a remarkable improvement in model accuracy. Notably, compared with FAL, they can (1) improve by 9.912% and 9.758%, respectively; (2) upgrade by about 96.317 and 90.69, respectively.
Second, since FMXL-SPL and -AGG can execute paralleled computation at each client, compared to centralized MXL, their computation time can be reduced by 34.522 and 47.801 s, respectively. In addition, even though FMXL-SPL and -AGG require 30,000 client–server interactions through the network, their communication time is just slightly longer than centralized MXL and FAL, as the size of parameters (16 bytes for the individual-level parameters and only 1 byte for rejected signal) is relatively smaller than the raw data. Nevertheless, while comparing , FMXL-SPL and -AGG are superior to the baselines, as the communication time is much shorter than the computation time.
Finally, instead of using the value generated through random sampling in FMXL-SPL, FMXL-AGG uses the average values as the global parameters (i.e., and ) in each iteration. Therefore, as shown in Figure 5, the individual-level parameters will be slightly apt to the population-level parameters. To be specific, as shown in Table 3, the standard deviations of , , , and in FMXL-AGG are decreased by 0.053, 0.048, 0.128, and 0.082, respectively, compared to FMXL-SPL. In general, such decreases do not significantly impact the overall model performance in terms of PR and LL. Nevertheless, as a tradeoff, FMXL-AGG can dramatically improve ET by about 32.02% compared to FMXL-SPL. It shows that the simplified estimation procedure based on average function can achieve more balanced performance in LL, PR, and ET.
4.2.2. Evaluation Results of Dynamic Estimation
According to the simulation setting, the dynamic estimation can be divided into two phases, namely (1) participation phase for the first eight estimation rounds (i.e., the first 16000 iterations), when clients gradually join until they are entirely involved in the estimation; (2) choice phases for the later seven estimation rounds (i.e., later 14000 iterations), when clients are still continuously making their choices.
First, as shown in Figure 6, both FMXL-SPL and -AGG can significantly outperform FAL, as they can not only infer population-level preferences but also cover individual-level ones to better address the heterogeneity among clients. Notably, FMXL-SPL may underperform FMXL-AGG strikingly during the participation phase, as FMXL-SPL (and MXL) require more parameters that cannot be well estimated when data is insufficient, leading to its accuracy being even inferior to the FAL model in the first three rounds. However, FMXL-AGG, precisely thanks to its simplified average function, can adopt the preference in the population level as the one in the individual level when fewer data are available to achieve stable growth in PR and LL.
Moreover, as shown in Figure 7, the communication time of FMXL-SPL and -AGG is less than that of the two centralized models, as they need to upload the gradually accumulated data to the server in batches. Besides that, since both the server and the clients perform calculations on the matrix, the computation time is relatively stable throughout the learning iterations. While comparing the two FMXL variants, FMXL-AGG is more time-efficient than FMXL-SPL owing to the optimization made by the average function implemented at the server.
In summary, as shown by the evaluation results in the two scenarios, adopting FL in MXL can not only protect user privacy and improve the utilization of edge resources but also can significantly improve the model estimation performance in terms of PR, LL, and ET. Specifically, the proposed FMXL stands out in the following aspects:
- It inherits the advantages of both FL and MXL that can better harness the heterogeneity among users in a collaborative and privacy-preserving manner.
- It can reduce ET by about 40% compared to the centralized baselines, and can better support the dynamic scenarios with a stable performance growth and also the highest PR and LL, improved by about 13% and 19%, respectively.
4.3. Discussions
We discuss the pros and cons of applying FMXL in PMS from the views of three kinds of stakeholders, namely individual travelers, system modelers, and service managers.
4.3.1. Application for Individual Travelers
In the real-world application, where users can leave and join the service freely (similar to the dynamic estimation scenario), FMXL-AGG can be more cost-efficient than FMXL-SPL. Because, on the one hand, it is more scalable to accommodate gradually growing users as well as choice histories. On the other hand, for the initial stage of new users, it can apply the population-level parameters directly to ensure an acceptable performance even though no data is available, thus alleviating the “cold start” issue [46] (as demonstrated by the first three estimation rounds in the dynamic estimation).
However, since a simplified aggregation method is implemented in FMXL-AGG, the issue of “shrinkage” can be observed that the individual-level preferences may move towards the population-level mean. Therefore, in the future, a weighted function to aggregate local parameters at the server can be investigated to remit such a side-effect and make the estimation of FMXL more stable and accurate.
4.3.2. Application for System Modelers
Conventional travel behavior modeling methods can be costly, time-consuming, and outdated over time, as they mainly rely on data collected from surveys via telephone, internet, face-to-face interview, or mail [47]. However, through the application of FMXL, it is possible to implement a fully automated process, through which, required data can be continuously collected, and then utilized on-demand to build analytical models without violating the regulation of data security and user privacy. Therefore, in the setting to assist modelers, FMXL-SPL can overcome FXML-AGG for more accurate analysis results.
Noteworthy, the transmission of parameters over the public network is prone to be monitored, leading to the leakage of key parameters that are vulnerable in FMXL, and can be used to deduce sensitive information of users. Hence, parameter protection/encryption mechanisms shall be studied as a future research direction to mitigate related risks [48,49].
4.3.3. Application for Service Managers
As the interest representative of PMS, the managers can benefit from the application of FMXL to optimize the service on the fly. For instance, managers can predict the short-term travel demand based on user preferences, thereby encouraging users to choose solutions that meet system goals, e.g., to be eco-friendly, more economical, or less congested [35].
Since the optimization objectives can be diverse, a customized FMXL shall be studied in the future with the ability, e.g., to segment users and select required groups or implement scheduled updates based on the running status of the service.
5. Conclusions
PMS demonstrates the advancement of ATS by intelligently supporting diversified mobility demands for each individual. To overcome its emerging challenges in data security and privacy, service scalability and latency, and user heterogeneity and personalization, this paper proposes FMXL. It decouples the centralized estimation process into local estimation in the client and global estimation in the server, and then implements a synchronized client–server interaction to make a joint estimation of the model. Moreover, to implement such a joint estimation, two global estimation methods, i.e., FMXL-SPL and -AGG, are also proposed to implement a classical Gibbs sampling process and an average function (similar to the widely-used FedAvg [22]).
By integrating the clients and the server, FMXL can not only ensure user privacy by exchanging non-sensitive learning parameters but also improve the model performance in terms of log-likelihood, predicted rate, and estimation time. According to the evaluation results, FMXL-SPL and FMXL-AGG can maintain the interpretability of mathematical models to analyze individual behaviors accurately, and also reduce the estimation time by about 40% compared to the centralized baselines. Moreover, while comparing the two proposed global estimation methods, FMXL-AGG is superior in supporting dynamic scenarios, such as user-oriented travel recommendations, with more stable accuracy growth and less computation burden. On the other hand, FMXL-SPL is more suitable for supporting static scenarios, such as modeler-oriented behavior analysis, with classical theoretical guarantees for more accurate posterior distributions.
Since this paper attempts to integrate FL with statistical models for the first time, several limitations can be observed while applying our proposed methodology, i.e., (1) although FMXL-AGG is comparable to FMXL-SPL with an equivalent accuracy and less computational consumption, the estimated posterior is still slightly away from the actual value. It is necessary to further explore the aggregation mechanisms to fit MXL more accurately; (2) a synchronous training mechanism used in the paper, i.e., the server has to wait for all local models to be successfully uploaded, may suffer issues caused by stragglers; future research could integrate the asynchronous training mechanisms to enable the robustness of FMXL in supporting PMS; (3) even though the individual-level parameters are measured in FMXL, the intra-consumer heterogeneity is still not addressed. Both the intra- and inter-consumer heterogeneity will be studied to better support the interpretation of user behaviors in future work.
Author Contributions
Conceptualization, L.Y. and J.H.; methodology, L.Y. and J.H.; software, J.H.; validation, L.Y. and J.Z.; formal analysis, L.Y.; investigation, J.X.; resources, J.Z.; data curation, L.Y.; writing—original draft preparation, J.H.; writing—review and editing, L.Y., J.Z., and J.X.; visualization, J.H.; supervision, J.Z. and J.X.; project administration, J.Z.; funding acquisition, L.Y. and J.Z. All authors have read and agreed to the published version of the manuscript.
Funding
The research is supported by the National Key R&D Program of China (2020YFB1600400), the National Natural Science Foundation of China (62002398 and 41901188), and the Collaborative Innovation Center for Transportation of Guangzhou (202206010056).
Institutional Review Board Statement
Not applicable.
Informed Consent Statement
Not applicable.
Data Availability Statement
The data presented in this study are openly available in Biogeme at https://biogeme.epfl.ch/data.html (accessed on 7 August 2022).
Conflicts of Interest
The authors declare no conflict of interest.
Abbreviations
The following abbreviations are used in this manuscript:
| TS | Transportation Systems |
| ITS | Intelligent Transportation Systems |
| ATS | Autonomous Transportation Systems |
| MS | Mobility Service |
| PMS | Personal Mobility Service |
| QoS | Quality of Service |
| AI | Artificial Intelligence |
| FL | Federated Learning |
| DCM | Discrete Choice Model |
| MXL | Mixed Logit Model |
| FMXL | Federated Mixed Logit model |
| FMXL-SPL | FMXL based on Sampling |
| FMXL-AGG | FMXL based on Aggregation |
| LL | Log-Likelihood |
| PR | Predicted Rate |
| ET | Estimation Time |
| FAL | Flat Logit |
References
- You, L.; Tunçer, B.; Zhu, R.; Xing, H.; Yuen, C. A Synergetic Orchestration of Objects, Data, and Services to Enable Smart Cities. IEEE Internet Things J. 2019, 6, 10496–10507. [Google Scholar] [CrossRef]
- Czech, P. Autonomous Vehicles: Basic Issues. Sci. J. Silesian Univ. Technol. Ser. Transp. 2018, 100, 15–22. [Google Scholar] [CrossRef]
- Hamadneh, J.; Esztergár-Kiss, D. The Influence of Introducing Autonomous Vehicles on Conventional Transport Modes and Travel Time. Energies 2021, 14, 4163. [Google Scholar] [CrossRef]
- Singh, S.; Saini, B.S. Autonomous Cars: Recent Developments, Challenges, and Possible Solutions. IOP Conf. Ser. Mater. Sci. Eng. 2021, 1022, 012028. [Google Scholar] [CrossRef]
- Turoń, K.; Czech, P. The Concept of Rules and Recommendations for Riding Shared and Private E-Scooters in the Road Network in the Light of Global Problems. In Modern Traffic Engineering in the System Approach to the Development of Traffic Networks; Macioszek, E., Sierpiński, G., Eds.; Springer International Publishing: Cham, Switzerland, 2020; Volume 1083, pp. 275–284. [Google Scholar]
- You, L.; Zhao, F.; Cheah, L.; Jeong, K.; Zegras, P.C.; Ben-Akiva, M. A Generic Future Mobility Sensing System for Travel Data Collection, Management, Fusion, and Visualization. IEEE Trans. Intell. Transp. Syst. 2020, 21, 4149–4160. [Google Scholar] [CrossRef]
- You, L.; He, J.; Wang, W.; Cai, M. Autonomous Transportation Systems and Services Enabled by the Next-Generation Netw. IEEE Netw. 2022, 36, 66–72. [Google Scholar] [CrossRef]
- Lewicki, W.; Stankiewicz, B.; Olejarz-Wahba, A.A. The Role of Intelligent Transport Systems in the Development of the Idea of Smart City. In Smart and Green Solutions for Transport Systems; Sierpiński, G., Ed.; Springer International Publishing: Cham, Switzerland, 2020; Volume 1091, pp. 26–36. [Google Scholar]
- Schéele, S. A Supply Model for Public Transit Services. Transp. Res. Part B Methodol. 1980, 14, 133–146. [Google Scholar] [CrossRef]
- Spieser, K.; Treleaven, K.; Zhang, R.; Frazzoli, E.; Morton, D.; Pavone, M. Toward a Systematic Approach to the Design and Evaluation of Automated Mobility-on-Demand Systems: A Case Study in Singapore. In Road Vehicle Automation; Meyer, G., Beiker, S., Eds.; Springer International Publishing: Cham, Switzerland, 2014; pp. 229–245. [Google Scholar]
- Nikitas, A.; Kougias, I.; Alyavina, E.; Njoya Tchouamou, E. How Can Autonomous and Connected Vehicles, Electromobility, BRT, Hyperloop, Shared Use Mobility and Mobility-As-A-Service Shape Transport Futures for the Context of Smart Cities? Urban Sci. 2017, 1, 36. [Google Scholar] [CrossRef] [Green Version]
- You, L.; Motta, G.; Liu, K.; Ma, T. CITY FEED: A Pilot System of Citizen-Sourcing for City Issue Management. ACM Trans. Intell. Syst. Technol. 2016, 7, 1–25. [Google Scholar] [CrossRef]
- Sarasini, S.; Linder, M. Integrating a Business Model Perspective into Transition Theory: The Example of New Mobility Services. Environ. Innov. Soc. Transit. 2018, 27, 16–31. [Google Scholar] [CrossRef]
- Hsu, C.Y.; Yang, C.S.; Yu, L.C.; Lin, C.F.; Yao, H.H.; Chen, D.Y.; Lai, K.R.; Chang, P.C. Development of a Cloud-Based Service Framework for Energy Conservation in a Sustainable Intelligent Transportation System. Int. J. Prod. Econ. 2015, 164, 454–461. [Google Scholar] [CrossRef]
- Bitam, S.; Mellouk, A. Its-Cloud: Cloud Computing for Intelligent Transportation System. In Proceedings of the 2012 IEEE Global Communications Conference (GLOBECOM), Anaheim, CA, USA, 3–7 December 2012; pp. 2054–2059. [Google Scholar]
- Din, S.; Paul, A.; Rehman, A. 5G-enabled Hierarchical Architecture for Software-Defined Intelligent Transportation System. Comput. Netw. 2019, 150, 81–89. [Google Scholar] [CrossRef]
- Manogaran, G.; Alazab, M. Ant-Inspired Recurrent Deep Learning Model for Improving the Service Flow of Intelligent Transportation Systems. IEEE Trans. Intell. Transp. Syst. 2020, 22, 3654–3663. [Google Scholar] [CrossRef]
- Liu, Y.; Yu, J.J.Q.; Kang, J.; Niyato, D.; Zhang, S. Privacy-Preserving Traffic Flow Prediction: A Federated Learning Approach. IEEE Internet Things J. 2020, 7, 7751–7763. [Google Scholar] [CrossRef]
- Hahn, D.; Munir, A.; Behzadan, V. Security and Privacy Issues in Intelligent Transportation Systems: Classification and Challenges. IEEE Intell. Transp. Syst. Mag. 2019, 13, 181–196. [Google Scholar] [CrossRef] [Green Version]
- Yu, R.; Huang, X.; Kang, J.; Ding, J.; Maharjan, S.; Gjessing, S.; Zhang, Y. Cooperative Resource Management in Cloud-Enabled Vehicular Networks. IEEE Trans. Ind. Electron. 2015, 62, 7938–7951. [Google Scholar] [CrossRef]
- Sodhro, A.H.; Obaidat, M.S.; Abbasi, Q.H.; Pace, P.; Pirbhulal, S.; Yasar, A.; Fortino, G.; Imran, M.A.; Qaraqe, M. Quality of Service Optimization in an IoT-driven Intelligent Transportation System. IEEE Wirel. Commun. 2019, 26, 10–17. [Google Scholar] [CrossRef] [Green Version]
- McMahan, B.; Moore, E.; Ramage, D.; Hampson, S.; y Arcas, B.A. Communication-Efficient Learning of Deep Networks from Decentralized Data. In Artificial Intelligence and Statistics; PMLR: Fort Lauderdale, FL, USA, 2017; pp. 1273–1282. [Google Scholar]
- Yang, Q.; Liu, Y.; Chen, T.; Tong, Y. Federated Machine Learning: Concept and Applications. ACM Trans. Intell. Syst. Technol. 2019, 10, 1–19. [Google Scholar] [CrossRef]
- Kairouz, P.; McMahan, H.B.; Avent, B.; Bellet, A.; Bennis, M.; Bhagoji, A.N.; Bonawitz, K.; Charles, Z.; Cormode, G.; Cummings, R.; et al. Advances and Open Problems in Federated Learning. Found. Trends® Mach. Learn. 2021, 14, 1–210. [Google Scholar] [CrossRef]
- You, L.; Liu, S.; Chang, Y.; Yuen, C. A Triple-Step Asynchronous Federated Learning Mechanism for Client Activation, Interaction Optimization, and Aggregation Enhancement. IEEE Internet Things J. 2022. [Google Scholar] [CrossRef]
- McFadden, D.; Train, K. Mixed MNL Models for Discrete Response. J. Appl. Econom. 2000, 15, 447–470. [Google Scholar] [CrossRef]
- Danaf, M.; Becker, F.; Song, X.; Atasoy, B.; Ben-Akiva, M. Online Discrete Choice Models: Applications in Personalized Recommendations. Decis. Support Syst. 2019, 119, 35–45. [Google Scholar] [CrossRef]
- Song, X.; Danaf, M.; Atasoy, B.; Ben-Akiva, M. Personalized Menu Optimization with Preference Updater: A Boston Case Study. Transp. Res. Rec. J. Transp. Res. Board 2018, 2672, 599–607. [Google Scholar] [CrossRef] [Green Version]
- Vinel, A.; Lyamin, N.; Isachenkov, P. Modeling of V2V Communications for C-ITS Safety Applications: A CPS Perspective. IEEE Commun. Lett. 2018, 22, 1600–1603. [Google Scholar] [CrossRef]
- Nabizadeh, A.H.; Leal, J.P.; Rafsanjani, H.N.; Shah, R.R. Learning Path Personalization and Recommendation Methods: A Survey of the State-of-the-Art. Expert Syst. Appl. 2020, 159, 113596. [Google Scholar] [CrossRef]
- Crivellari, A.; Beinat, E. LSTM-Based Deep Learning Model for Predicting Individual Mobility Traces of Short-Term Foreign Tourists. Sustainability 2020, 12, 349. [Google Scholar] [CrossRef] [Green Version]
- Liu, H.; Li, T.; Hu, R.; Fu, Y.; Gu, J.; Xiong, H. Joint Representation Learning for Multi-Modal Transportation Recommendation. Proc. AAAI Conf. Artif. Intell. 2019, 33, 1036–1043. [Google Scholar] [CrossRef]
- Liu, H.; Tong, Y.; Zhang, P.; Lu, X.; Duan, J.; Xiong, H. Hydra: A Personalized and Context-Aware Multi-Modal Transportation Recommendation System. In Proceedings of the 25th ACM SIGKDD International Conference on Knowledge Discovery & Data Mining, Anchorage, AK, USA, 4–8 August 2019; Association for Computing Machinery: New York, NY, USA; pp. 2314–2324. [Google Scholar]
- Zhu, X.; Wang, F.; Chen, C.; Reed, D.D. Personalized Incentives for Promoting Sustainable Travel Behaviors. Transp. Res. Part C Emerg. Technol. 2020, 113, 314–331. [Google Scholar] [CrossRef]
- Azevedo, C.L.; Seshadri, R.; Gao, S.; Atasoy, B.; Akkinepally, A.P.; Christofa, E.; Zhao, F.; Trancik, J.; Ben-Akiva, M. Tripod: Sustainable Travel Incentives with Prediction, Optimization, and Personalization. In Proceedings of the Transportation Research Record 97th Annual Meeting, Washington, DC, USA, 7–11 January 2018. [Google Scholar]
- Zhu, X.; Feng, J.; Huang, S.; Chen, C. An Online Updating Method for Time-Varying Preference Learning. Transp. Res. Part C Emerg. Technol. 2020, 121, 102849. [Google Scholar] [CrossRef]
- Liu, H.; Tong, Y.; Han, J.; Zhang, P.; Lu, X.; Xiong, H. Incorporating Multi-Source Urban Data for Personalized and Context-Aware Multi-Modal Transportation Recommendation. IEEE Trans. Knowl. Data Eng. 2022, 34, 723–735. [Google Scholar] [CrossRef]
- Lin, G.; Liang, F.; Pan, W.; Ming, Z. Fedrec: Federated Recommendation with Explicit Feedback. IEEE Intell. Syst. 2020, 36, 21–30. [Google Scholar] [CrossRef]
- Yu, C.; Qi, S.; Liu, Y. FedDeepFM: Ad CTR Prediction Based on Federated Factorization Machine. In Proceedings of the 2021 IEEE Sixth International Conference on Data Science in Cyberspace (DSC), Shenzhen, China, 9–11 October 2021; pp. 195–202. [Google Scholar]
- Scarpa, R.; Alberini, A.; Bateman, I.J. (Eds.) Applications of Simulation Methods in Environmental and Resource Economics; The Economics of Non-Market Goods and Resources; Springer: Dordrecht, The Netherlands, 2005; Volume 6. [Google Scholar]
- Train, K.E. Discrete Choice Methods with Simulation; Cambridge University Press: Cambridge, UK, 2009. [Google Scholar]
- Chib, S.; Greenberg, E. Understanding the Metropolis-Hastings Algorithm. Am. Stat. 1995, 49, 327–335. [Google Scholar]
- Bierlaire, M.; Axhausen, K.; Abay, G. The Acceptance of Modal Innovation: The Case of Swissmetro. In Proceedings of the Swiss Transport Research Conference, Ascona, Switzerland, 1–3 March 2001. [Google Scholar]
- Ben-Akiva, M.; McFadden, D.; Train, K. Foundations of Stated Preference Elicitation: Consumer Behavior and Choice-Based Conjoint Analysis. Found. Trends® Econom. 2019, 10, 1–144. [Google Scholar] [CrossRef] [Green Version]
- Dinh, C.T.; Tran, N.H.; Nguyen, M.N.; Hong, C.S.; Bao, W.; Zomaya, A.Y.; Gramoli, V. Federated Learning over Wireless Networks: Convergence Analysis and Resource Allocation. IEEE/ACM Trans. Netw. 2020, 29, 398–409. [Google Scholar] [CrossRef]
- Schein, A.I.; Popescul, A.; Ungar, L.H.; Pennock, D.M. Methods and Metrics for Cold-Start Recommendations. In Proceedings of the 25th Annual International ACM SIGIR Conference on Research and Development in Information Retrieval, Tampere, Finland, 11–15 August 2002; pp. 253–260. [Google Scholar]
- Cottrill, C.D.; Pereira, F.C.; Zhao, F.; Dias, I.F.; Lim, H.B.; Ben-Akiva, M.E.; Zegras, P.C. Future Mobility Survey: Experience in Developing a Smartphone-Based Travel Survey in Singapore. Transp. Res. Rec. J. Transp. Res. Board 2013, 2354, 59–67. [Google Scholar] [CrossRef] [Green Version]
- Geyer, R.C.; Klein, T.; Nabi, M. Differentially Private Federated Learning: A Client Level Perspective. arXiv 2017, arXiv:1712.07557. [Google Scholar]
- Phong, L.T.; Aono, Y.; Hayashi, T.; Wang, L.; Moriai, S. Privacy-Preserving Deep Learning via Additively Homomorphic Encryption. IEEE Trans. Inf. Forensics Secur. 2017, 13, 1333–1345. [Google Scholar] [CrossRef]
Figure 1.
Centralized (A) and federated (B) collaboration flows between PMS clients and the server.
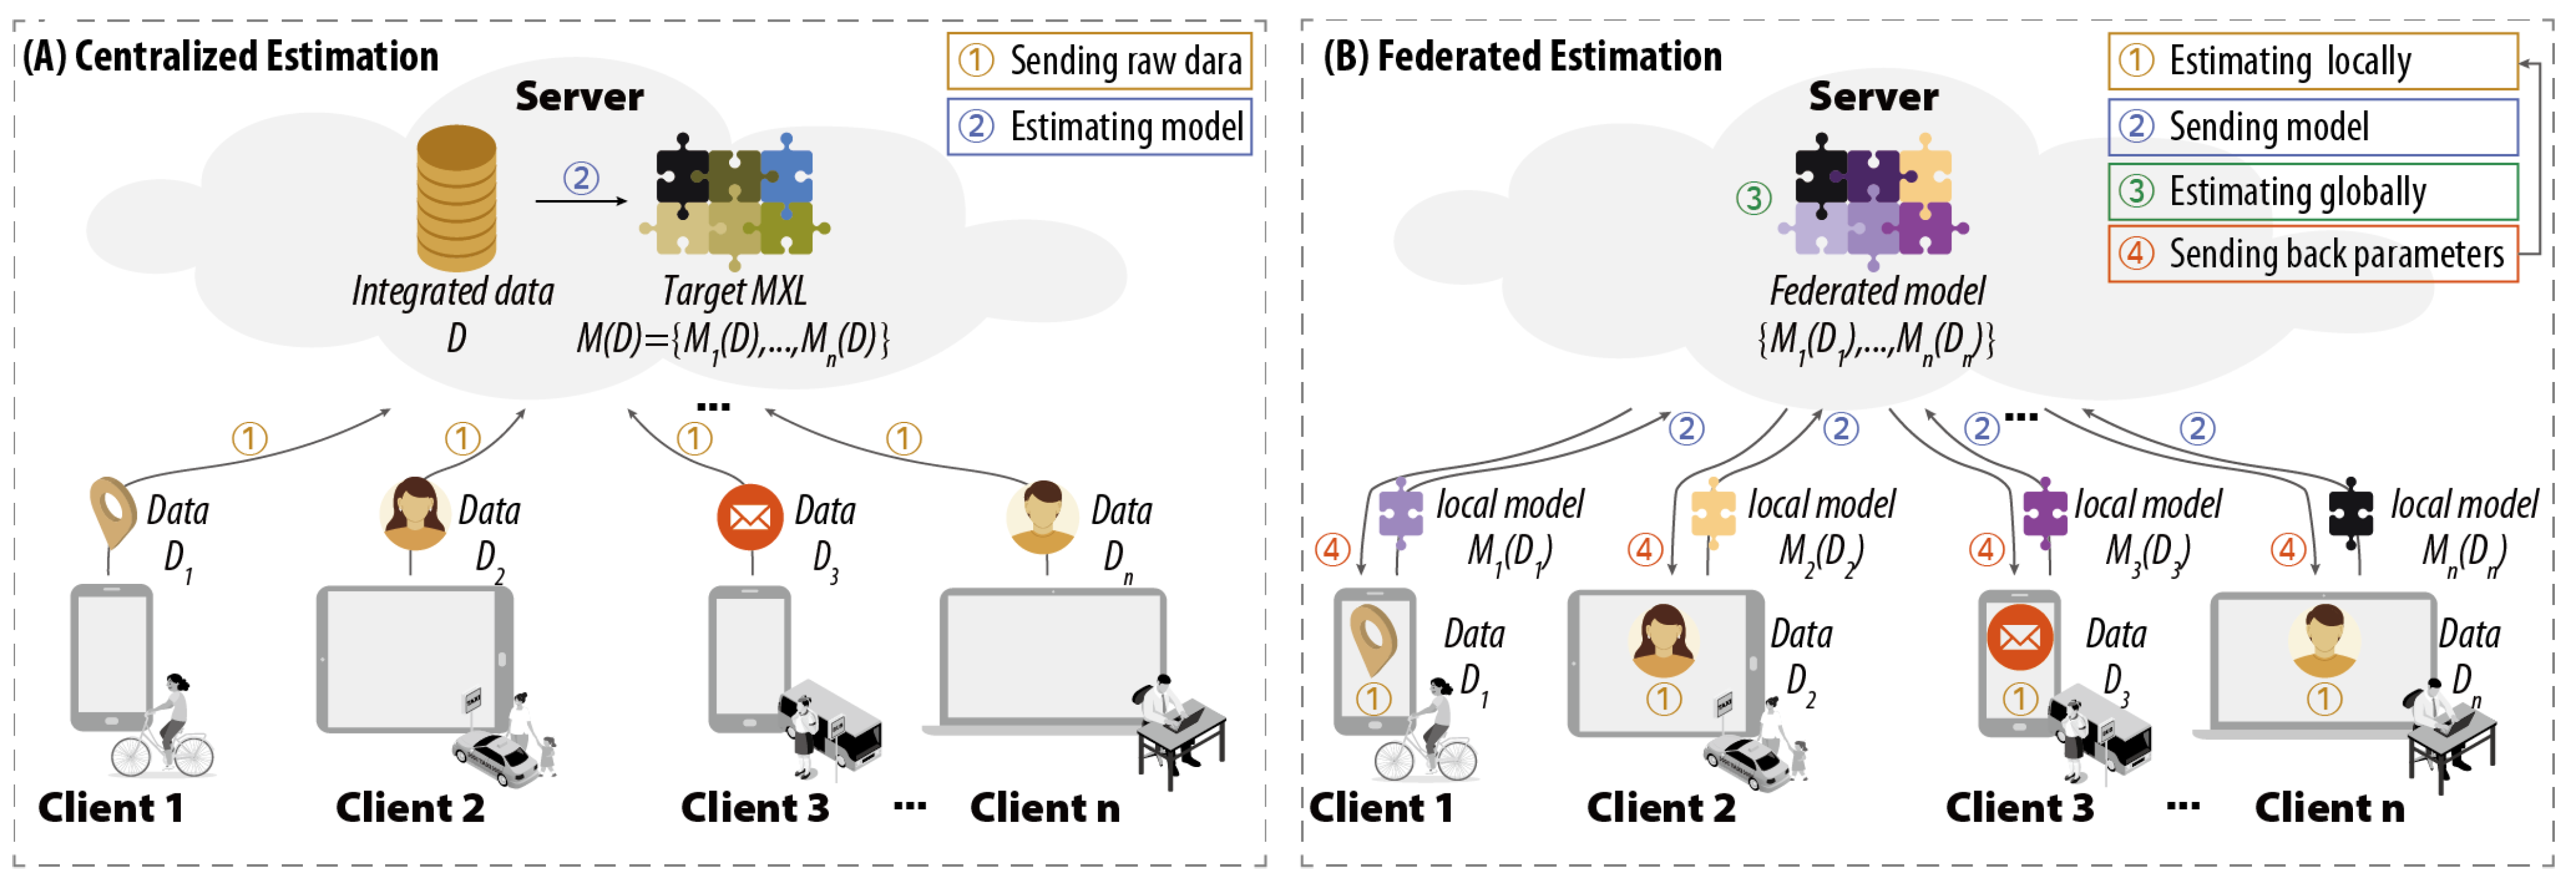
Figure 2.
SWOT analysis of the federated estimation problem.
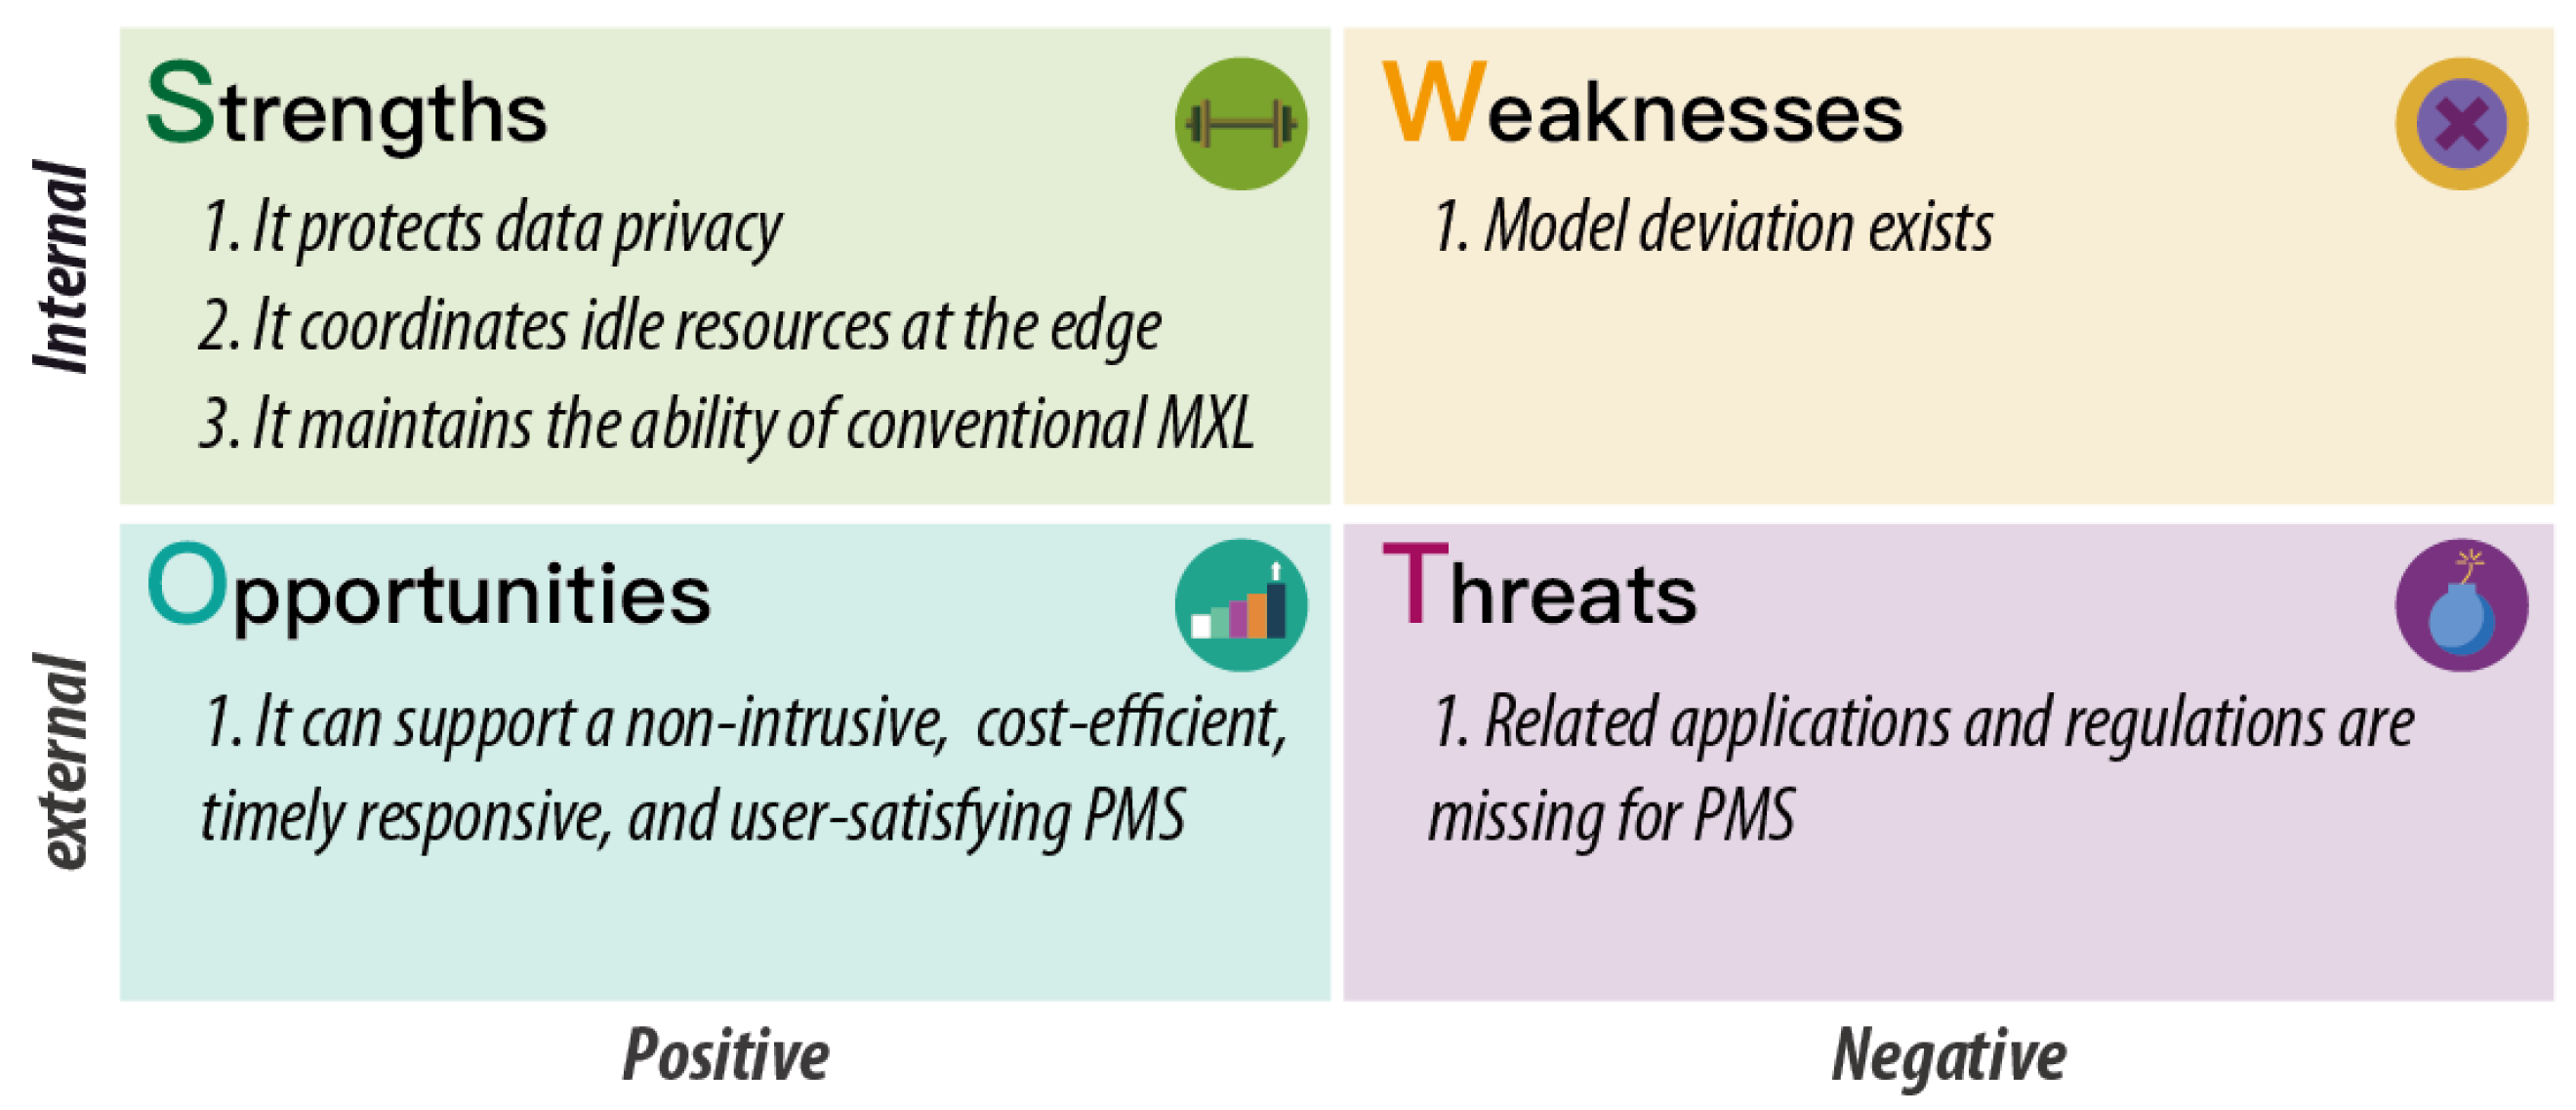
Figure 3.
Graphical representation of the bayesian approach for MXL.
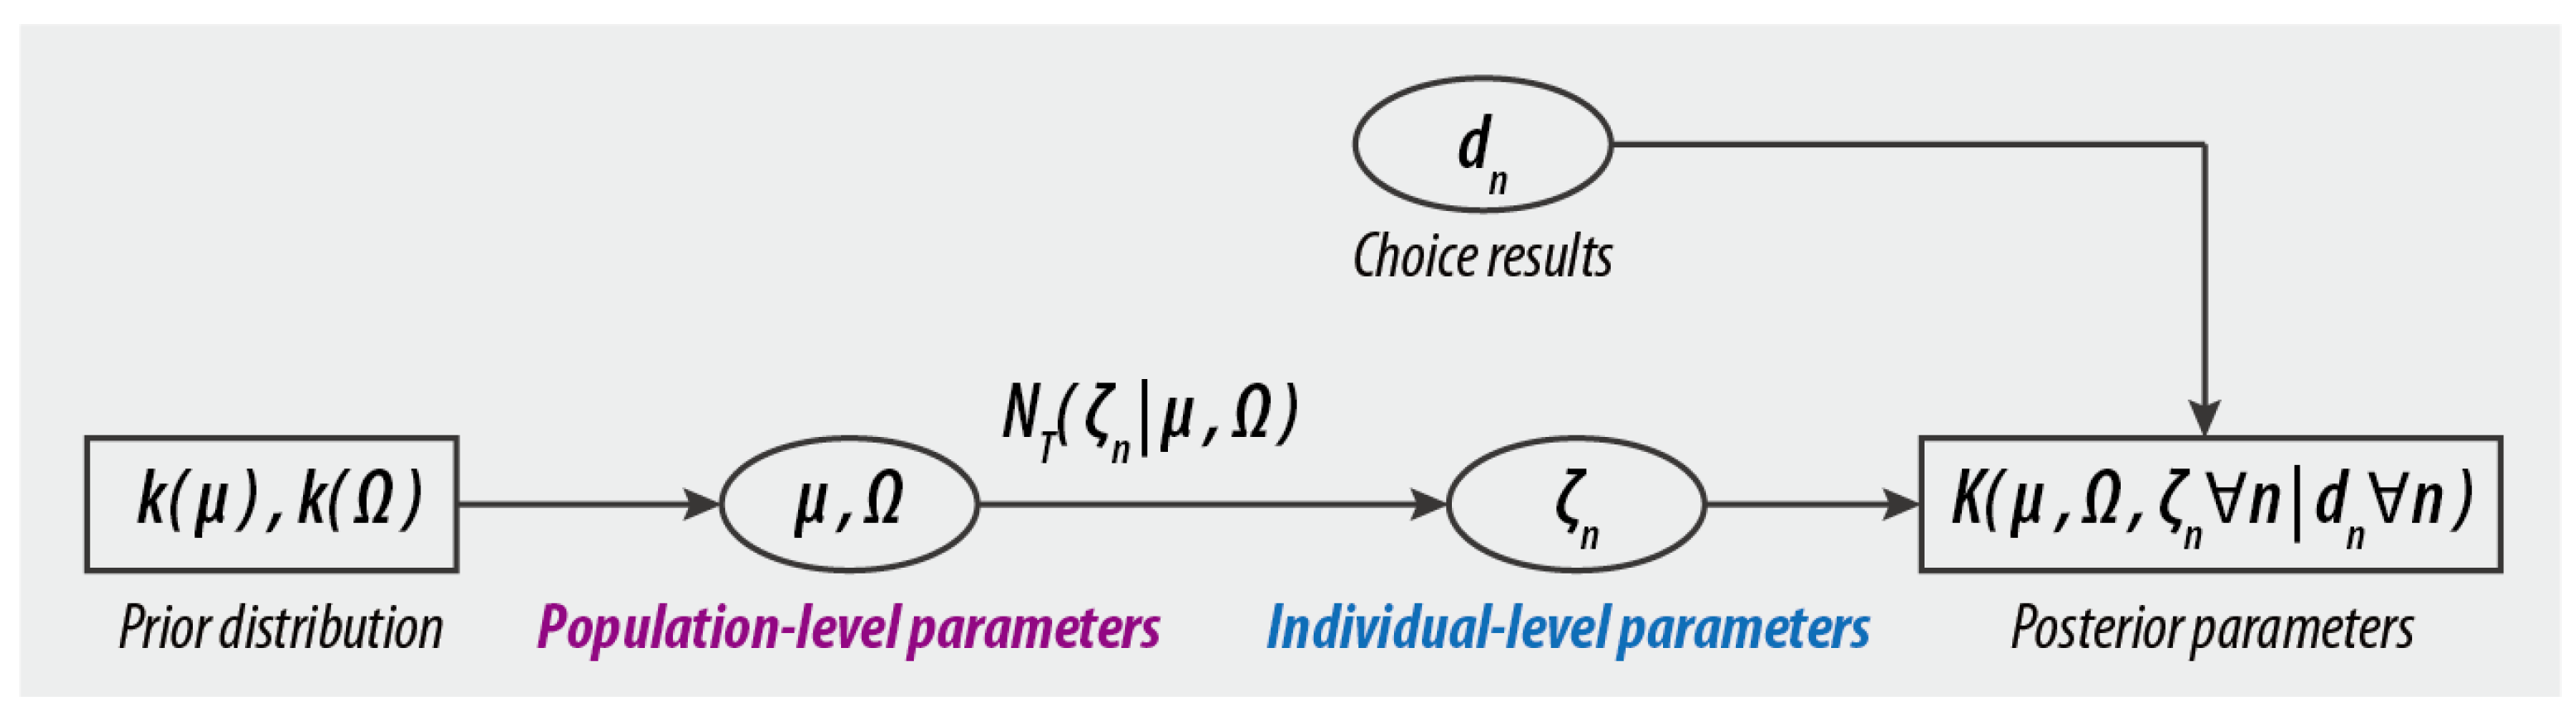
Figure 4.
The overall architecture of FMXL: (A) local estimation in each client; (B) global estimation in the server; (C) interaction mechanism between the clients and the server.
Figure 4.
The overall architecture of FMXL: (A) local estimation in each client; (B) global estimation in the server; (C) interaction mechanism between the clients and the server.
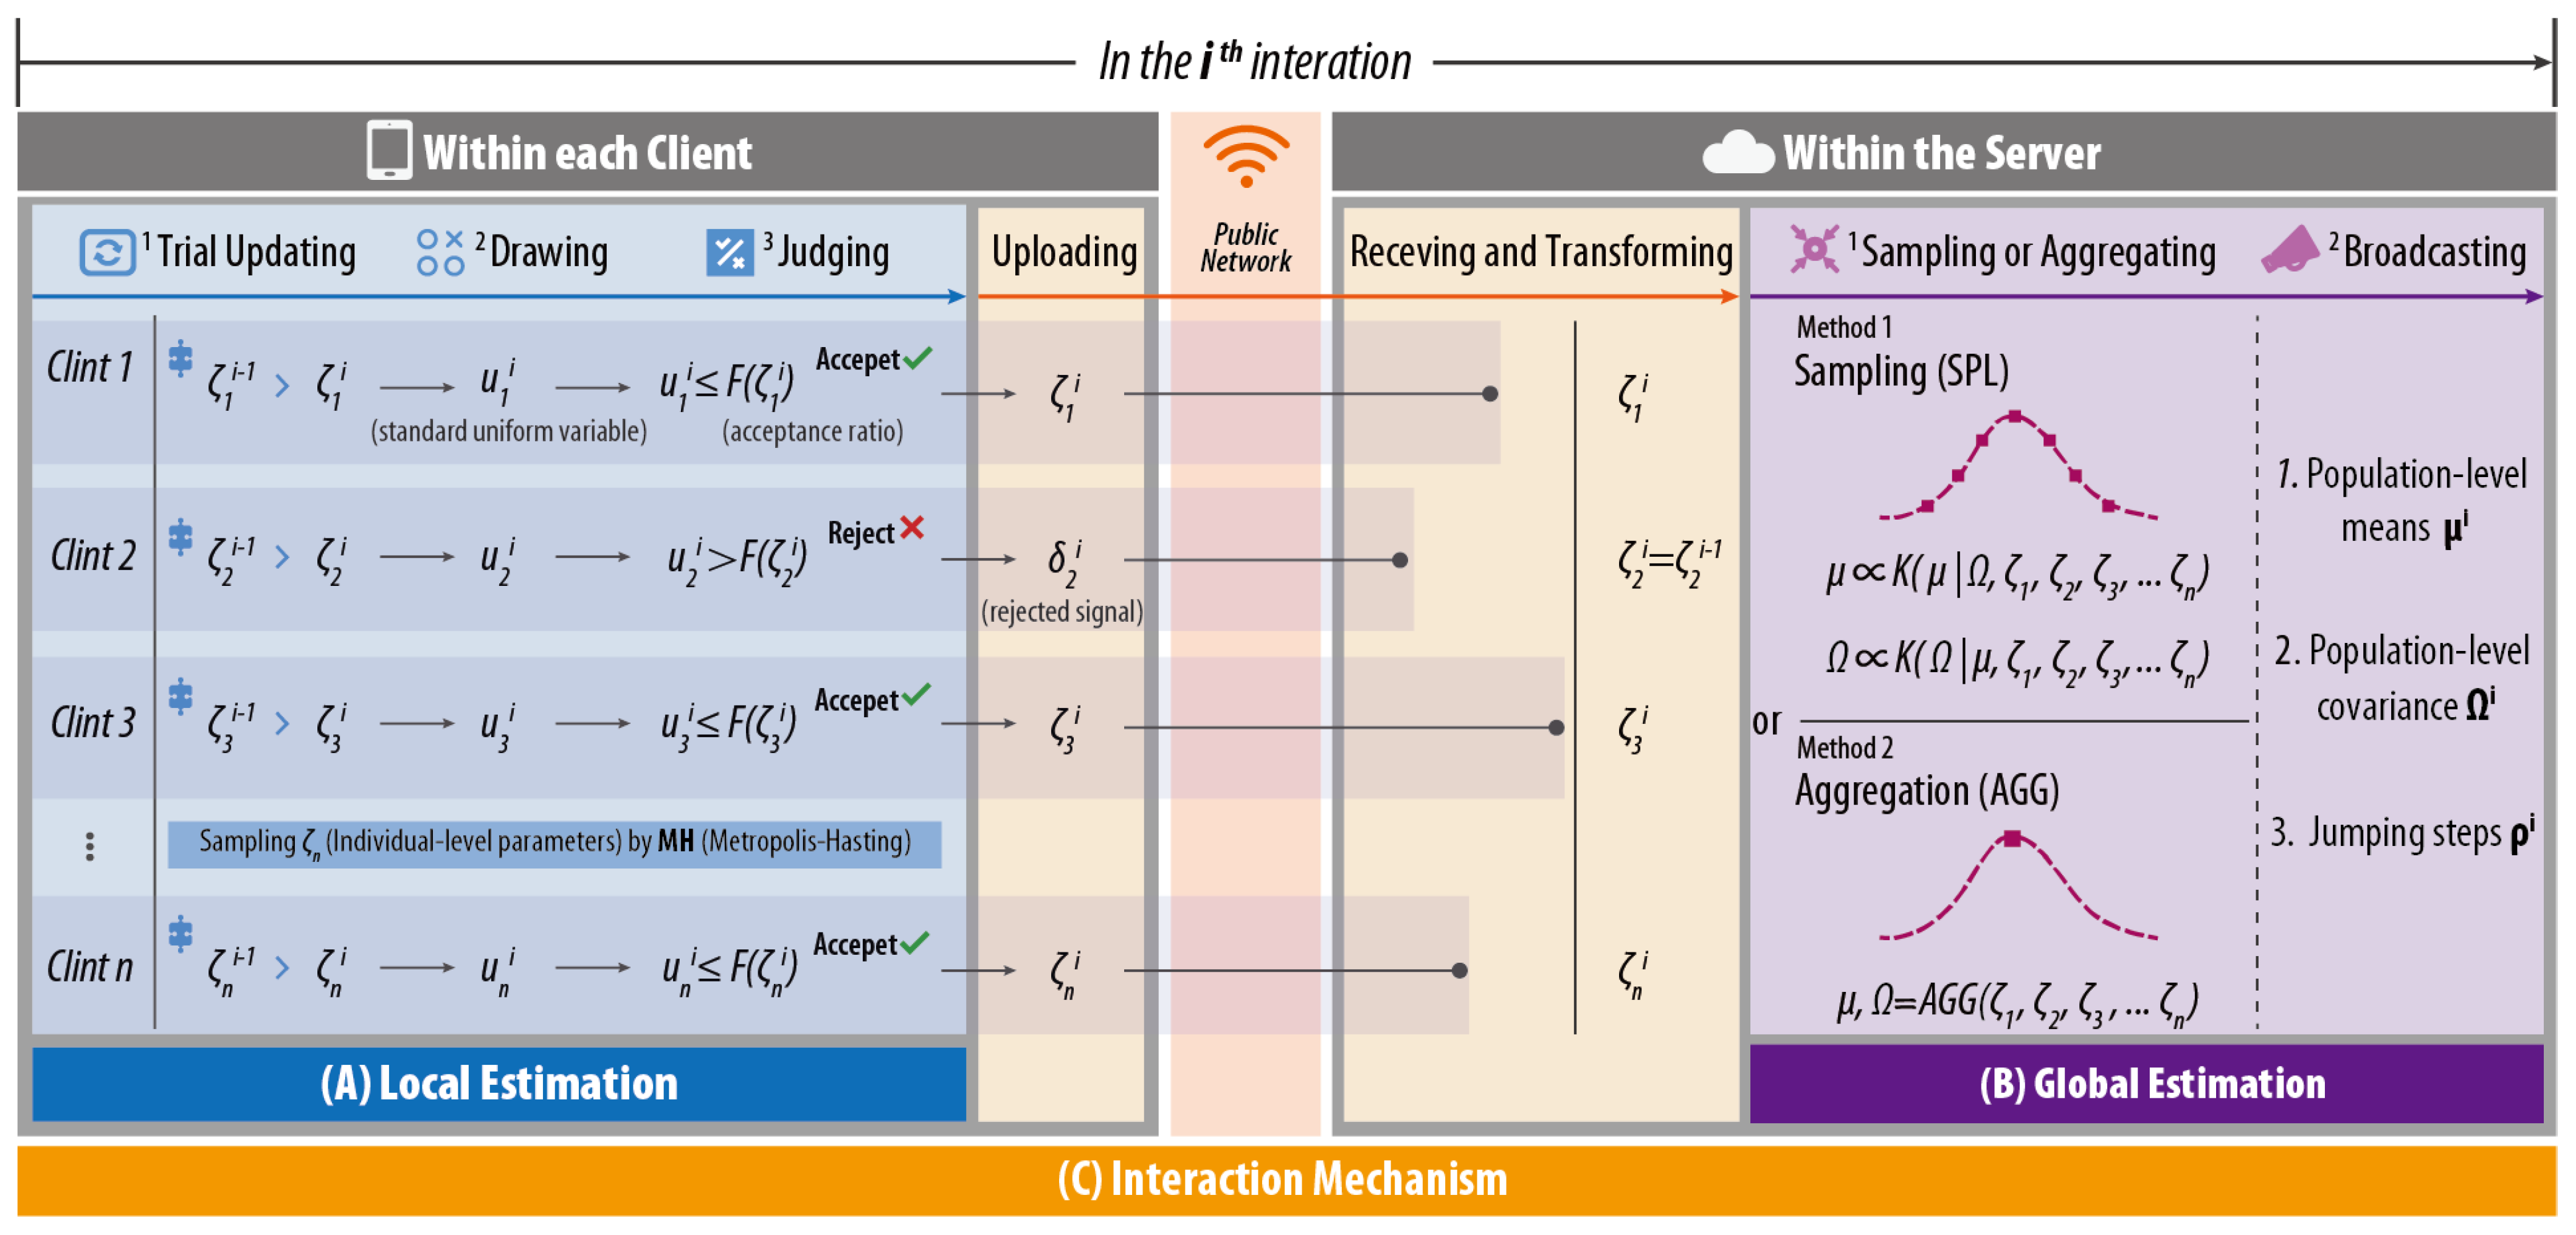
Figure 5.
The distribution of individual-level parameters in the estimated models: (A) FMXL-SPL, and in the case MXL and (B) FMXL-AGG.
Figure 5.
The distribution of individual-level parameters in the estimated models: (A) FMXL-SPL, and in the case MXL and (B) FMXL-AGG.

Figure 6.
Comparison of model accuracy among tested models in the dynamic estimation: (A) predicted rate (PR) and (B) log-likelihood (LL).
Figure 6.
Comparison of model accuracy among tested models in the dynamic estimation: (A) predicted rate (PR) and (B) log-likelihood (LL).
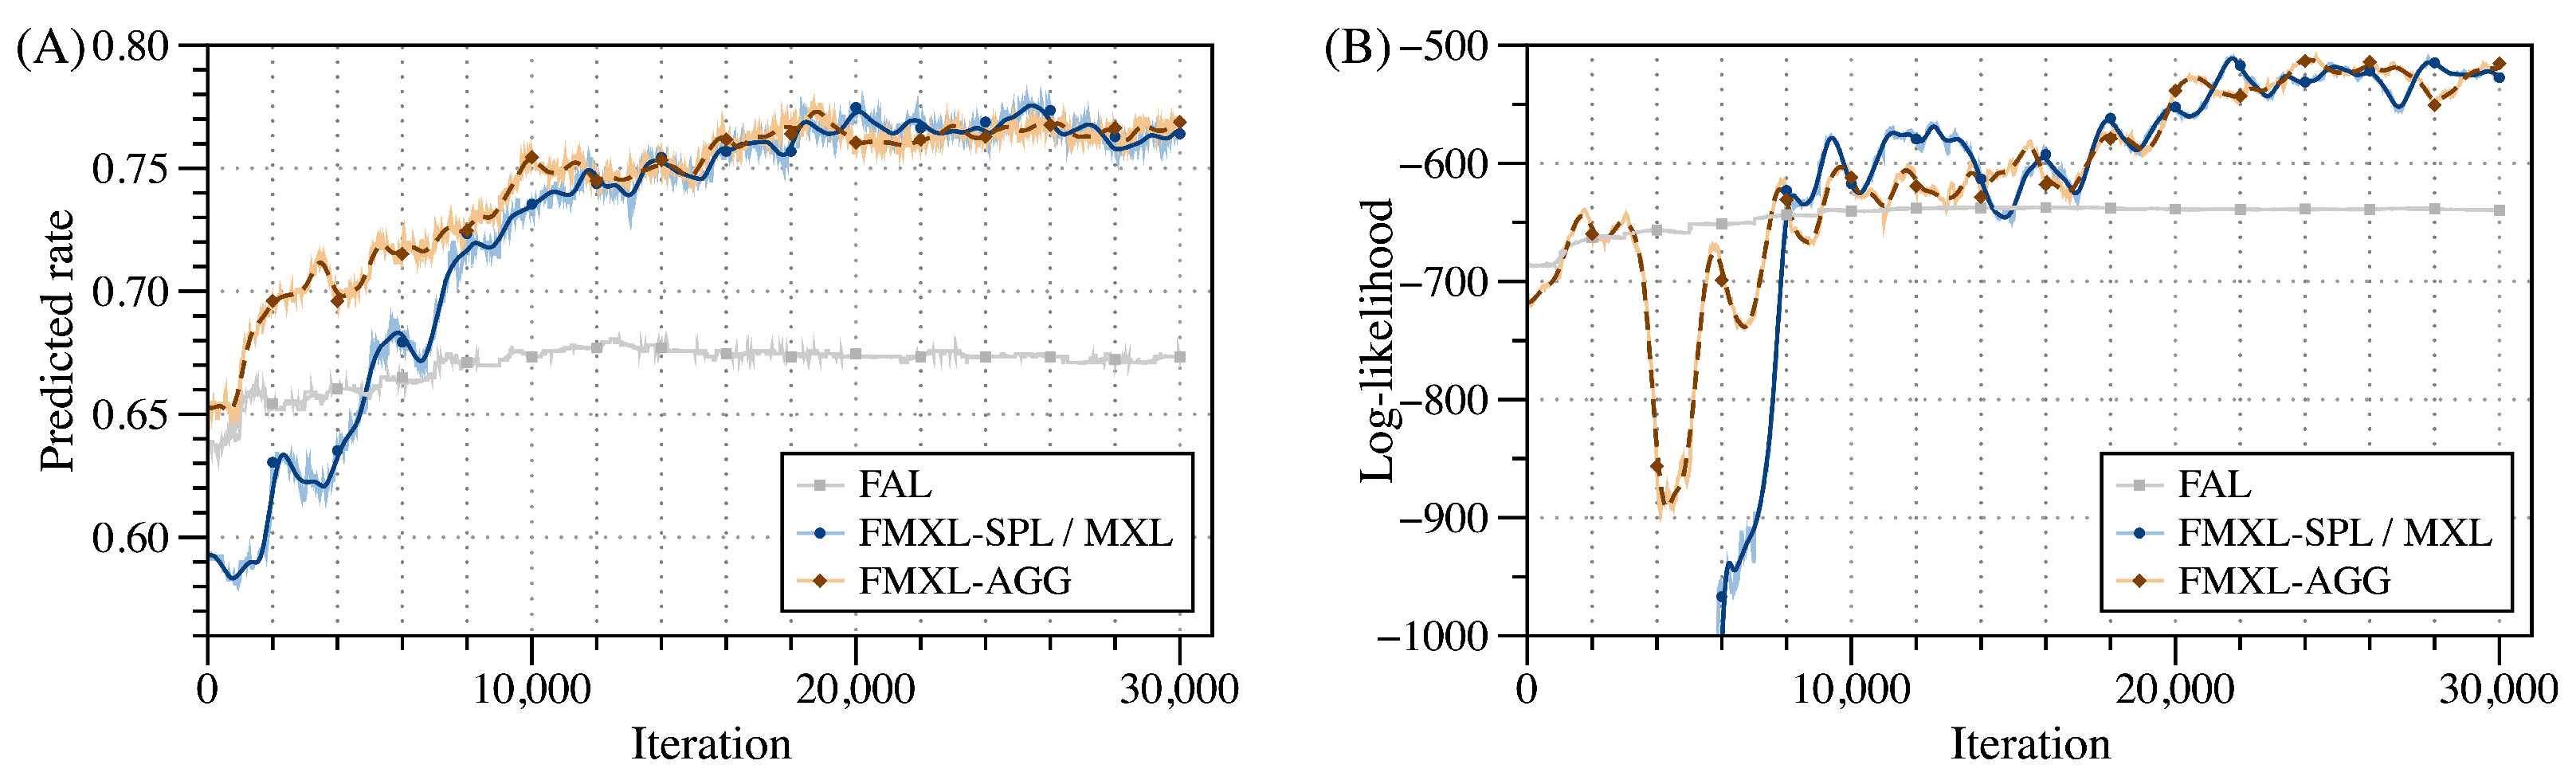
Figure 7.
Comparison of ET among tested models in the dynamic estimation: (A) communication time; (B) computation time; (C) total time.
Figure 7.
Comparison of ET among tested models in the dynamic estimation: (A) communication time; (B) computation time; (C) total time.


Table 1.
Challenges and representative solutions in PMS (●: solved; ◐: partially; ○: not-solved).
| Related Solutions | Data Security and Privacy | Service Scalability and Latency | User Heterogeneity and Personalization | |
|---|---|---|---|---|
| ML-based model | Trans2vec [32] | ○ | ○ | ◐ |
| Hydra-L [33] | ○ | ○ | ◐ | |
| Hydra-H [37] | ○ | ● | ◐ | |
| FedDeepFM [39] | ● | ● | ○ | |
| FedRec [38] | ● | ● | ○ | |
| DCM-based model | LCM-T [36] | ○ | ◐ | ◐ |
| MXL [26] | ○ | ○ | ● | |
| Online-MXL [27] | ○ | ◐ | ● | |
| FL+DCM | FMXL (Proposed) | ● | ● | ● |
Table 2.
The summary of evaluation metrics in static estimation.
| Predicted Rate | Log-Likelihood | Estimation Time (s) | |||
|---|---|---|---|---|---|
| Communication | Computation | Total | |||
| FAL | 67.342% | −638.859 | 3.790 | 58.622 | 62.412 |
| MXL | 77.254% | −542.542 | 3.790 | 75.987 | 79.777 |
| FMXL-SPL | 77.254% | −542.542 | 5.427 | 41.465 | 46.892 |
| FMXL-AGG | 77.100% | −548.169 | 5.427 | 28.186 | 33.613 |
Table 3.
The parameter estimation results of tested models.
| FAL | FMXL-SPL / MXL | FMXL-AGG | ||||||||
|---|---|---|---|---|---|---|---|---|---|---|
| Coefficient | Fixed | |||||||||
| Posterior Mean | Std. Dev. | Posterior Mean | Std. Dev. | Posterior Mean | Std. Dev. | Posterior Mean | Std. Dev. | Posterior Mean | Std. Dev. | |
| 0.071 | 0.037 | −0.014 | 0.059 | 0.892 | 0.131 | −0.033 | 0.036 | 0.839 | 0.073 | |
| 0.627 | 0.047 | 0.479 | 0.064 | 0.546 | 0.086 | 0.429 | 0.042 | 0.498 | 0.058 | |
| 0.606 | 0.048 | 0.248 | 0.058 | 0.263 | 0.055 | 0.246 | 0.030 | 0.135 | 0.020 | |
| −0.625 | 0.039 | −2.020 | 0.096 | 0.939 | 0.127 | −1.915 | 0.072 | 0.857 | 0.060 | |
Publisher’s Note: MDPI stays neutral with regard to jurisdictional claims in published maps and institutional affiliations. |
© 2022 by the authors. Licensee MDPI, Basel, Switzerland. This article is an open access article distributed under the terms and conditions of the Creative Commons Attribution (CC BY) license (https://creativecommons.org/licenses/by/4.0/).
Share and Cite
MDPI and ACS Style
You, L.; He, J.; Zhao, J.; Xie, J. A Federated Mixed Logit Model for Personal Mobility Service in Autonomous Transportation Systems. Systems 2022, 10, 117. https://doi.org/10.3390/systems10040117
AMA Style
You L, He J, Zhao J, Xie J. A Federated Mixed Logit Model for Personal Mobility Service in Autonomous Transportation Systems. Systems. 2022; 10(4):117. https://doi.org/10.3390/systems10040117
Chicago/Turabian StyleYou, Linlin, Junshu He, Juanjuan Zhao, and Jiemin Xie. 2022. "A Federated Mixed Logit Model for Personal Mobility Service in Autonomous Transportation Systems" Systems 10, no. 4: 117. https://doi.org/10.3390/systems10040117
Note that from the first issue of 2016, this journal uses article numbers instead of page numbers. See further details here.