
Exploring Uber Taxi Application Using the Technology Acceptance Model


1
Department of Tourism Administration, Kangwon National University, Chuncheon 24341, Korea
2
Department of Tourism and Recreation, Kyonggi University, Seoul 03746, Korea
*
Author to whom correspondence should be addressed.
Systems 2022, 10(4), 103; https://doi.org/10.3390/systems10040103
Submission received: 24 June 2022
/
Revised: 18 July 2022
/
Accepted: 21 July 2022
/
Published: 24 July 2022
(This article belongs to the Section Systems Practice in Social Science)
Abstract
:The goal of this study was to investigate the accountability of the technology acceptance model (TAM) for Uber taxi applications. As antecedents of usefulness, this study selected three elements: time information, price information, and driver information. Data was collected using a survey on Amazon Mechanical Turk. The survey participants were users of the Uber taxi application. The number of valid observations for the data analysis was 412. For data analysis, frequency analysis, confirmatory factor analysis, correlation matrix, and structural equation modeling were utilized. The results show that the usefulness is significantly influenced by time and driver information. They further indicate that ease of use positively affects both usefulness and attitude. In addition, usefulness significantly determines attitude, and attitude toward the Uber taxi application exerts a substantial effect on intention to use. This study contributes to the literature by demonstrating the explanatory power of TAM using the Uber taxi application as a research subject.
1. Introduction
The Uber taxi app is a representative business model in the sharing economy. The system is attractive in the market because it allows users to move more conveniently. As such, both tourists and local residents have widely used the transportation system. According to Insider [1], the market share of Uber taxis was approximately 80 percent in the second quarter in 2018. Statista [2] also reported that the market share of Uber taxis in July 2021 was approximately 75 percent in the US. Both statistics indicate that Uber could become a representative ride-hailing company; the follower Lyft showed rapid growth in the market because its market share grew by about 25 percent within 3 years [2]. This implies that competition for the taxi mobile application system has intensified. Under market conditions, it is worthwhile to first determine user characteristics to outperform in the market.
The technology acceptance model (TAM) is the main theoretical framework of this research. TAM notes the association between usefulness, ease of use, attitude, and intention to use [3,4,5]. Numerous scholars have chosen TAM as a theoretical underpinning to test the utility of various technologies and scrutinize the link between ease of use, usefulness, attitude, and intention to use a certain technology [3,4,5,6,7,8,9,10]. Nevertheless, few studies have been conducted to ensure the explanatory power of TAM by selecting Uber taxi applications as research subjects. Although Min et al. [11] demonstrated the accountability of TAM in the area of the Uber taxi business, a single empirical study might be insufficient to understand user characteristics. Moreover, TAM could be varied depending on antecedents, and it helps to understand Uber taxi service users more deeply. However, it has been insufficiently explored in the area of Uber taxi application research. To fill these voids, this study adopts TAM as a theoretical foundation to inspect the psychological mechanism of Uber taxi application users.
A primary function of a taxi application is to inform users about their service because of its intangible features [12,13], which is likely to motivate potential clients to attain more information to minimize uncertainty. In fact, scholars claimed that Uber taxi provides various pieces of information, which include the time, price, and driver [14,15,16,17,18]; the information could become a clue for users to evaluate whether the application system is useful or not. Although Min et al. [11] investigated the explanatory attributes for TAM’s main attributes: perceived ease of use and perceived usefulness, the focus for information provision of an application system has not been well explored. To fill such a research gap, this research aims to scrutinize information-related elements to understand Uber taxi application users. Given these aspects, this research posits three attributes as determinants of the usefulness of Uber taxi applications. The contribution of this research is its scrutiny of the user behaviors of Uber taxi applications. Ultimately, this research aims to inform taxi application service providers to upgrade their service level, which might make service providers more competitive and provide customers with better services.
2. Theoretical Foundation and Research Hypotheses
2.1. Taxi Application and Information
The information asymmetric condition is a theoretical underpinning of this work. Scholars contends that information asymmetry increases the likelihood of adverse selection [19,20]. Therefore, offering information to consumers is an essential element to minimize the risk in consumption [21,22]. The main function of the taxi application system is to provide information to potential customers. Service products are intangible; the customers’ main concern is ambiguity because they cannot assess the product without experience [12,13,23]. To minimize such a concern, information could become a solution because it assists customers in imagining and anticipating the service features [13,24,25]. Indeed, prior works argued that the main function of taxi service applications is to offer information: time, price, and service provider [15,18,26]. Previous studies have documented the details of information from the Uber application system. First, scholars have found that taxi application systems offer time information, including duration and waiting [14,27]. Time information allows customers to save resources because time is a resource [14,28]. Second, the extant literature states that price information is the second piece in the taxi application system because price information makes taxi service customers decrease the likelihood of over-payment [16,17,29]. Finally, prior research has noted that driver information contributes to the utility of customers using a review system that provides information about drivers [15,30]. Specifically, customers can minimize service failure risk using review information, and drivers can become kinder by the evaluation rating system [16,27,30]. In sum, the information reduces the risk to prospective service customers and saves their resources (e.g., time and money), which results in the creation of more utility. Based on the literature review, this study proposes the following research hypotheses:
H1.
Time information positively affects perceived usefulness.
H2.
Price information positively affects perceived usefulness.
H3.
Driver information positively affects perceived usefulness.
2.2. Technology Acceptance Model (TAM)
The theoretical underpinning of this study is the technology acceptance model (TAM), which evaluates a technology’s utility using various attributes: perceived usefulness, perceived ease of use, attitude, and intention to use [3,31]. The central components of TAM are perceived ease of use and perceived usefulness. Scholars define usefulness as how technology users perceive improved efficiency in their task, and ease of use as how users control a technology without struggling [32,33,34,35]. Numerous studies have documented the explanatory power of TAM in diverse domains. For instance, Chen et al. [36] inspected sustainable energy technology users using the TAM; Kamal et al. [37] researched telemedicine service users using TAM; Manis and Choi [38] explored the behavioral characteristics of virtual reality technology users using TAM. Furthermore, Zhong et al. [10] tested TAM’s accountability in the context of facial recognition payment technology. Wong et al. [5] investigated personal protective equipment technology by employing TAM. Min et al. [11] demonstrated the accountability of TAM in the domain of Uber mobile applications.
Primarily, TAM rationalizes the association among variables, which are ease of use, usefulness, attitude, and intention to use. Specifically, ease of use is the antecedent of usefulness and attitude because it is positively related to both working efficiency and the impression of technology [4,7,8,9]. Additionally, the extant literature claims that usefulness positively determines both attitude and intention to use because technology users assess the utility of technology depending on enhanced task efficiency, which in turn impacts attitudes and intentions [33,39,40]. TAM posits that attitude influences intention to use because positive impressions lead users to choose the system [9,34,35,40]. Considering TAM, this research proposes the following research hypotheses:
H4.
Perceived ease of use positively affects perceived usefulness.
H5.
Perceived usefulness positively affects attitude.
H6.
Perceived usefulness positively affects intention to use.
H7.
Perceived ease of use positively affects attitude.
H8.
Attitude positively affects intention to use.
3. Method
3.1. Research Model and Data Collection
Figure 1 illustrates our research model. Seven attributes (time, price, driver, ease of use, usefulness, attitude, and intention to use) appeared in the research model. The determinants of usefulness are time, price, driver, and ease of use. The antecedents of attitudes include usefulness and ease of use, and the intention to use is influenced by usefulness and attitude. All the directions were positive.
Amazon Mechanical Turk (https://www.mturk.com (accessed on 17 January 2022)) is the main instrument for data collection. Amazon Mechanical Turk is an Internet crowdsourcing system that allows task creators to collect data from paid task completers. Numerous works have used Amazon Mechanical Turk for data collection, and reported substantial statistical inference, which expresses the quality of data from Amazon Mechanical Turk [41,42,43]. This study collected data between 20 January 2022 and 21 January 2022. This research selected participants who are experienced with the Uber taxi application by asking, “Have you ever used the Uber taxi app?” This study used the samples that responded “yes” to this question. At first, 450 observations were selected, after which 38 were eliminated because they responded “no” to the screening question. The effect size of our sample appeared as 118.37 by following the instruction of Boomsma [44]. It is approximately 119; the sample size of this work is 412. It indicates that the number of observations for SEM is sufficient.
3.2. Survey Description
This study employed a five-point Likert scale (1 = strongly disagree to 5 = strongly agree) to measure all constructs other than attitude. Attitude was measured on a five-point scale (1 = negative, 5 = positive). For the derivation of information-related measurements, three tourism and service area researchers were consulted. The measurements of variables within the TAM adopted prior research items with modifications for the purpose of the current research. Perceived usefulness is defined as how the working efficiency of application users is enhanced by adopting the system [32,33,34,35]. The specification for perceived ease of use is how users feel they can control the system without difficulty [4,8,11,34]. This research defined attitude as users’ predisposition to the application system based on their experience [8,33,35] and intention to use as how users select the application for commercial transactions [7,39,40]. Table 1 lists the measurement items used in this study. Time information and perceived usefulness were measured with three items; other constructs (e.g., price information, driver information, perceived ease of use, attitude, and intention to use) contained four items.
3.3. Data Analysis
First, frequency analysis was implemented to analyze demographic information, followed by confirmatory factor analysis, a correlation matrix, and structural equation modeling (SEM) analysis. This study used covariance-based (CB) SEM using the maximum likelihood because the extant literature found that CB-SEM is adequate for theory-based hypotheses testing among variables [45,46,47]. Additionally, CB SEM of this work is appropriate for the data analysis because this research had sufficient observations for normality based on the central limit theorem [45,46]. To ensure convergent validity, we examined both factor loadings using 0.5, and construct reliability using 0.7 as the criteria, following Hoyle [48] and Hair et al. [45]. We then followed the rule that the square root of the average variance extracted should be greater than the correlation coefficient to ensure discriminant validity [45,49]. Next, as Hoyle [48] and Hair et al. [45] stated, the goodness of fit of the structural equation model was evaluated using multiple indices: Q (CMIN/degree of freedom) < 3, goodness of fit index (GFI), normed fit index (NFI), relative fit index (RFI), incremental fit index (IFI), Tucker–Lewis index (TLI), comparative fit index (CFI) > 0.8, and root mean square error of approximation (RMSEA) < 0.05.
4. Results of Data Analysis
4.1. Demographic Information
Table 2 presents the respondents’ demographic information. There were 243 males and 169 females. Those in their 20s and 30s accounted for approximately 70 percent of the participants. Table 2 also describes the information of the living area (rural: 73, suburban: 160, and urban: 179), monthly household income (less than $2000: 85, $2000–3999: 119, $4000–5999: 88; $6000–7999: 73, and more than $8000: 47), and weekly usage frequency (less than 1 time: 145, 1–2 times: 150, 3–5 times: 74, and more than 5 times: 43).
4.2. Convergent Validity and Discriminant Validity
Table 3 illustrates the results of the confirmatory factor analysis. Regarding the goodness of the indices (Q (χ2/df) < 3, GFI, NFI, RFI, IFI, TLI, CFI > 0.8, and RMSEA < 0.05), the results were statistically acceptable (Q (χ2/df) = 1.800, GFI = 0.909, NFI = 0.923, RFI = 0.910, IFI = 0.964, TLI = 0.958, CFI = 0.964, and RMSEA = 0.044) [45,49]. All indices satisfy the criteria to appraise the goodness of fit. In addition, all factor loading, construct reliability, and average value values indicate convergent validity because they meet the criteria proposed in the existing literature. Table 3 presents the mean values of these variables. Next, the square root of the average value values in Table 4 is greater than the correlation coefficients, which suggests that discriminant validity was confirmed. All things considered, this research derived seven constructs: time information, price information, driver information, usefulness, ease of use, attitude, and intention to use.
4.3. Results of Hypotheses Testing
Figure 2 shows the results of the SEM. Most goodness-of-fit indices of the model were statistically significant (Q(χ2/df) = 2.858, GFI = 0.875, NFI = 0.873, RFI = 0.857, IFI = 0.914, TLI = 0.902, CFI = 0.913, and RMSEA = 0.069) as compared to criteria (Q(χ2/df) < 3, GFI, NFI, RFI, IFI, TLI, CFI > 0.8, and RMSEA < 0.05) [45,49]. Other than RMSEA, the overall indices meet the criteria for goodness of fit. Considering the relationship between the attributes, time information (β = 0.408, p < 0.05), driver information (β = 0.417, p < 0.05), and perceived ease of use (β = 0.517, p < 0.05) appeared to influence perceived usefulness. Attitude was positively affected by perceived ease of use (β = 0.473, p < 0.05) and perceived usefulness (β = 0.401, p < 0.05). The intention to use was also positively impacted by attitude (β = 0.752, p < 0.05). In summary, H1, H3, H4, H5, H7, and H8 were supported. The goodness-of-fit indices denote the significance of the hypothesis testing results.
5. Discussion and Conclusions
This study evaluated whether TAM is applicable for explaining the behavior of Uber mobile application users. Using usefulness as an endogenous variable, it could be inferred that time information, driver information, and ease of use allowed Uber taxi application users to attain more utility, which could be related to the individual’s working efficiency. Regarding the browsing magnitude, Uber taxi application users viewed ease of use as the most important element for their usefulness, and driver information appeared as the second most important attribute. However, price information was identified as a non-significant element to account for its usefulness. It could be assumed that application users might take price information for granted in the taxi service application system. This means that offering price information may be insufficient to create merits from the perspective of users. The results also imply that usefulness and ease of use are significant in building a positive attitude among Uber taxi application users. The magnitude of ease of use is greater than usefulness, indicating that users value simple control of technology in the area of taxi service applications to build positive attitudes. In addition, the results imply that positive attitudes encourage users to build a higher level of intention to use. However, the results showed that usefulness was not a critical attribute for intention to use, even though it influenced positive attitudes. This suggests that the impact of usefulness could be limited to Uber taxi application services. Indeed, the range of mean values for usefulness (3.96–4.11) is lower than that of ease of use (4.24–4.33) and attitude (4.11–4.26). This means that users perceive relatively less usefulness in the Uber taxi application service as compared to other attributes, which might result in a constrained effect on intention to use. Moreover, the profile of the survey participants reported that male participants are more than female participants (41.0%). It might be possible that if there were more female participants, the mean values of the driver information might be higher because females might value the risk related to the profile of drivers more. Moreover, the mean value of ease of use appeared to be relatively high, which might be explained by the age of the survey participants: approximately 80% were less than 40 years old.
5.1. Theoretical Implications
The foremost academic contribution of this research is to search for antecedents of usefulness in the context of Uber taxi applications, a representative sharing economy system in the area of ground transportation. This study anticipated three influential attributes: time, price, and driver information. Two attributes, including time information and driver information, were identified as substantial elements for usefulness. These results shed light on the literature by clarifying noteworthy elements for the usefulness of Uber taxi application users, indicating that information provision is an imperative element of the application system. Additionally, this study contributes to the literature by revealing the accountability of TAM for user behavior in Uber taxi applications. Therefore, this research expanded TAM into the Uber taxi application area. In addition, the outcome of this research could be aligned with Min et al. [11] in that TAM is the imperative theoretical underpinning for exploring the user behavior of Uber taxi application systems. Although previous empirical work has verified the accountability of TAM [11], additional research would be worthwhile to understand the user behavior of Uber taxi applications. Given this point, this research used TAM and demonstrated its explanatory power in the context of the Uber taxi application. This finding supports the results of the extant TAM literature [3,4,5,10,35,36,37].
5.2. Practical Implications
The results of the current study might inform the management of Uber taxi application systems. The results implied that time and driver information were imperative to making customers perceive more utility in the use of Uber taxi applications. Hence, Uber taxi application managers might be able to invest more in developing time information and driver information; that is, managers could not only provide more real-time and precise time information for Uber taxi application users but also develop a more useful framework for driver review information. Next, Uber taxi application managers might need to contemplate how to control the system more easily from the perspective of users, because it would enhance both usefulness and attitude. Based on the magnitude, the priority for resource allocation can be suggested. Specifically, ease of use should become the most important domain, and driver and time information provision could become the second most crucial area for budgeting. In addition, Uber taxi application managers are likely to ponder how technology upgrades a user’s working efficiency, which in turn gives rise to a better attitude among users. Finally, Uber taxi application management could dedicate their budget to their reputation management, such as corporate social responsibility, because attitude toward the Uber taxi application and its brand was influential for users to build intention to use, which ultimately results in a greater market share.
5.3. Limitations
This study has some limitations. First, it only inspected the antecedents of the usefulness of Uber mobile application systems. To overcome this limitation, future research could examine the influential attributes of ease of use. Moreover, the subjects of this study were limited to American consumers. Future research could choose users in another country considering that business conditions vary depending on the geographical situation. This might enable this study to confirm the generalizability of the results. Moreover, this research was limited to the consequences of TAM. Future research might be able to consider more diverse dependent variables (e.g., continuance intention and intention to reuse) in TAM to further understand consumer behavior.
Author Contributions
Formal analysis, J.S.; Writing—original draft, J.M.; Writing—review & editing, W.S.L. All authors have read and agreed to the published version of the manuscript.
Funding
This research received no external funding.
Institutional Review Board Statement
Not applicable.
Informed Consent Statement
Not applicable.
Data Availability Statement
Not applicable.
Conflicts of Interest
The authors declare no conflict of interest.
References
- Insider. Uber and Lyft Are Gaining Even More Market Share over Taxis and Rentals. 2018. Available online: https://www.businessinsider.com/uber-lyft-are-gaining-even-more-market-share-over-taxis-and-rentals-2018-7 (accessed on 10 January 2022).
- Statista. Market Share of the Leading Ride-Hailing Companies in the United States from September 2017 to July 2021. 2021. Available online: https://www.statista.com/statistics/910704/market-share-of-rideshare-companies-united-states/ (accessed on 10 January 2022).
- King, W.; He, J. A meta-analysis of the technology acceptance model. Inf. Manag. 2006, 43, 740–755. [Google Scholar] [CrossRef]
- Surendran, P. Technology acceptance model: A survey of literature. Int. J. Bus. Soc. Res. 2012, 2, 175–178. [Google Scholar]
- Wong, T.; Man, S.; Chan, A. Exploring the acceptance of PPE by construction workers: An extension of the technology acceptance model with safety management practices and safety consciousness. Saf. Sci. 2021, 139, 105239. [Google Scholar] [CrossRef]
- Legris, P.; Ingham, J.; Collerette, P. Why do people use information technology? A critical review of the technology acceptance model. Inf. Manag. 2003, 40, 191–204. [Google Scholar] [CrossRef]
- Yang, H.; Yoo, Y. It’s all about attitude: Revisiting the technology acceptance model. Decis. Support Syst. 2004, 38, 19–31. [Google Scholar] [CrossRef]
- Ha, S.; Stoel, L. Consumer e-shopping acceptance: Antecedents in a technology acceptance model. J. Bus. Res. 2009, 62, 565–571. [Google Scholar] [CrossRef]
- Mortenson, M.; Vidgen, R. A computational literature review of the technology acceptance model. Int. J. Inf. Manag. 2016, 36, 1248–1259. [Google Scholar] [CrossRef] [Green Version]
- Zhong, Y.; Oh, S.; Moon, H. Service transformation under industry 4.0: Investigating acceptance of facial recognition payment through an extended technology acceptance model. Technol. Soc. 2021, 64, 101515. [Google Scholar] [CrossRef]
- Min, S.; So, K.; Jeong, M. Consumer adoption of the Uber mobile application: Insights from diffusion of innovation theory and technology acceptance model. J. Travel Tour. Mark. 2019, 36, 770–783. [Google Scholar] [CrossRef]
- Grove, S.; Carlson, L.; Dorsch, M. Addressing services’ intangibility through integrated marketing communication: An exploratory study. J. Serv. Mark. 2002, 16, 393–411. [Google Scholar] [CrossRef]
- Shi, K.; Cheng, L.; De Vos, J.; Yang, Y.; Cao, W.; Witlox, F. How does purchasing intangible services online influence the travel to consume these services? A focus on a Chinese context. Travelnsportation 2021, 48, 2605–2625. [Google Scholar]
- Lam, C.; Liu, M. Demand and consumer surplus in the on-demand economy: The case of ride sharing. Soc. Sci. Electr. Pub. 2017, 17, 376–388. [Google Scholar] [CrossRef]
- Skok, W.; Baker, S. Evaluating the impact of Uber on London’s taxi service: A strategic review. Knowl. Process Manag. 2018, 25, 232–246. [Google Scholar] [CrossRef]
- Su, R.; Fang, Z. A review of studies in taxi mobility and e-hailing taxi service. J. Smart Cities 2019, 4, 2–6. [Google Scholar]
- Santos, F.; Mayer, V.; Marques, O. Dynamic pricing and price fairness perceptions: A study of the use of the Uber app in travels. Turismo Visão e Ação 2020, 21, 239–264. [Google Scholar] [CrossRef]
- UT. 2022. Our Taxi, UT. Available online: https://www.ut.taxi/kr/en/ (accessed on 10 January 2022).
- Han, J.; Jang, W. Information Asymmetry and the financial consumer protection policy. Asia J. Political Sci. 2013, 21, 213–223. [Google Scholar] [CrossRef]
- Palma, M.A.; Collart, A.; Chammoun, C. Information Asymmetry in Consumer Perceptions of Quality-Differentiated Food Products. J. Consum. Aff. 2015, 49, 596–612. [Google Scholar] [CrossRef]
- Hobbs, J.; Plunkett, M. Genetically modified foods: Consumer issues and the role of information asymmetry. Can. J. Agric. Econ. 1999, 47, 445–455. [Google Scholar] [CrossRef]
- Mocan, N. Can consumers detect lemons? An empirical analysis of information asymmetry in the market for child care. J. Popul. Econ. 2007, 20, 743–780. [Google Scholar] [CrossRef]
- Bebko, C. Service intangibility and its impact on consumer expectations of service quality. J. Serv. Mark. 2000, 14, 9–26. [Google Scholar] [CrossRef]
- Brady, M.; Bourdeau, B.; Heskel, J. The importance of brand cues in intangible service industries: An application to investment services. J. Serv. Mark. 2005, 19, 401–410. [Google Scholar] [CrossRef]
- Kleis, L.; Chwelos, P.; Ramirez, R.; Cockburn, I. Information technology and intangible output: The impact of IT investment on innovation productivity. Inf. Syst. Res. 2012, 23, 42–59. [Google Scholar] [CrossRef] [Green Version]
- Calo, R.; Rosenblat, A. The taking economy: Uber, information, and power. Columbia Law Rev. 2017, 117, 1623. [Google Scholar] [CrossRef] [Green Version]
- Cramer, J.; Krueger, A. Disruptive change in the taxi business: The case of Uber. Am. Econ. Rev. 2016, 106, 177–182. [Google Scholar] [CrossRef] [Green Version]
- Shokoohyar, S.; Sobhani, A.; Sobhani, A. Impacts of trip characteristics and weather condition on ride-sourcing network: Evidence from Uber and Lyft. Res. Transp. Econ. 2020, 80, 100820. [Google Scholar] [CrossRef]
- Henama, U.; Sifolo, P. Uber: The south Africa experience. Afr. J. Hosp. Tour. Leis. 2017, 6, 1–10. [Google Scholar]
- Norlander, P.; Jukic, N.; Varma, A.; Nestorov, S. The effects of technological supervision on gig workers: Organizational control and motivation of Uber, taxi, and limousine drivers. Int. J. Hum. Res. Manag. 2021, 32, 4053–4077. [Google Scholar] [CrossRef]
- Szajna, B. Empirical evaluation of the revised technology acceptance model. Manag. Sci. 1996, 42, 85–92. [Google Scholar] [CrossRef]
- Venkatesh, V.; Davis, F. A theoretical extension of the technology acceptance model: Four longitudinal field studies. Manag. Sci. 2000, 46, 186–204. [Google Scholar] [CrossRef] [Green Version]
- Ma, Q.; Liu, L. The technology acceptance model: A meta-analysis of empirical Findings. J. Org. End User Comp. 2004, 16, 59–72. [Google Scholar] [CrossRef] [Green Version]
- Masrom, M. Technology acceptance model and e-learning. Technolnology 2007, 21, 81. [Google Scholar]
- Muk, A.; Chung, C. Applying the technology acceptance model in a two-country study of SMS advertising. J. Bus. Res. 2015, 68, 1–6. [Google Scholar] [CrossRef]
- Chen, C.F.; Xu, X.; Arpan, L. Between the technology acceptance model and sustainable energy technology acceptance model: Investigating smart meter acceptance in the United States. Energy Res. Soc. Sci. 2017, 25, 93–104. [Google Scholar] [CrossRef]
- Kamal, S.; Shafiq, M.; Kakria, P. Investigating acceptance of telemedicine services through an extended technology acceptance model (TAM). Technol. Soc. 2020, 60, 101212. [Google Scholar] [CrossRef]
- Manis, K.T.; Choi, D. The virtual reality hardware acceptance model (VR-HAM): Extending and individuating the technology acceptance model (TAM) for virtual reality hardware. J. Bus. Res. 2019, 100, 503–513. [Google Scholar] [CrossRef]
- Yeou, M. An investigation of students’ acceptance of Moodle in a blended learning setting using technology acceptance model. J. Educ. Technol. Syst. 2016, 44, 300–318. [Google Scholar] [CrossRef]
- Al-Emran, M.; Mezhuyev, V.; Kamaludin, A. Technology Acceptance Model in M-learning context: A systematic review. Comput. Educ. 2018, 125, 389–412. [Google Scholar] [CrossRef]
- Bahja, F.; Hancer, M. Eco-guilt in tourism: Do tourists intend to behave environmentally friendly and still revisit? J. Destin. Mark. Manag. 2021, 20, 100602. [Google Scholar] [CrossRef]
- de Lima Pereira, M.; dos Anjos, F.; da Silva Añaña, E.; Weismayer, C. Modelling the overall image of coastal tourism destinations through personal values of tourists: A robust regression approach. J. Outdoor Recreat. Tour. 2021, 35, 100412. [Google Scholar] [CrossRef]
- Wan, Z.; Huang, S.; Choi, H. Modification and validation of the travel safety attitude scale (TSAS) in international tourism: A reflective-formative approach. J. Hosp. Tour. Insights 2021. [Google Scholar] [CrossRef]
- Boomsma, A. The robustness of LISREL against sample size in factor analysis model. In Systems under Indirect and Direct Observation: Causality, Structure, and Prediction; Joreskog, K.G., Wold, H., Eds.; North Holland: Amsterdam, The Netherlands, 1982. [Google Scholar]
- Hair, J.; Anderson, R.; Babin, B.; Black, W. Multivariate Data Analysis: A Global Perspective; Pearson: Upper Saddle River, NJ, USA, 2010; Volume 7. [Google Scholar]
- Dash, G.; Paul, J. CB-SEM vs PLS-SEM methods for research in social sciences and technology forecasting. Technol. Forecast Soc. Chang. 2021, 173, 121092. [Google Scholar] [CrossRef]
- Hair, J.; Hult, G.; Ringle, C.; Sarstedt, M. A Primer on Partial Least Squares Structural Equation Modeling (PLS-SEM), 2nd ed.; Sage Publications: Thousand Oaks, CA, USA, 2017. [Google Scholar]
- Hoyle, R. Structural Equation Modeling: Concepts, Issues, and Applications; Sage: Thousand Oaks, CA, USA, 1995. [Google Scholar]
- Fornell, C.; Larcker, D. Evaluating structural equation models with unobservable variables and measurement error. J. Mark. Res. 1981, 18, 39–50. [Google Scholar] [CrossRef]
Figure 1.
Research model.
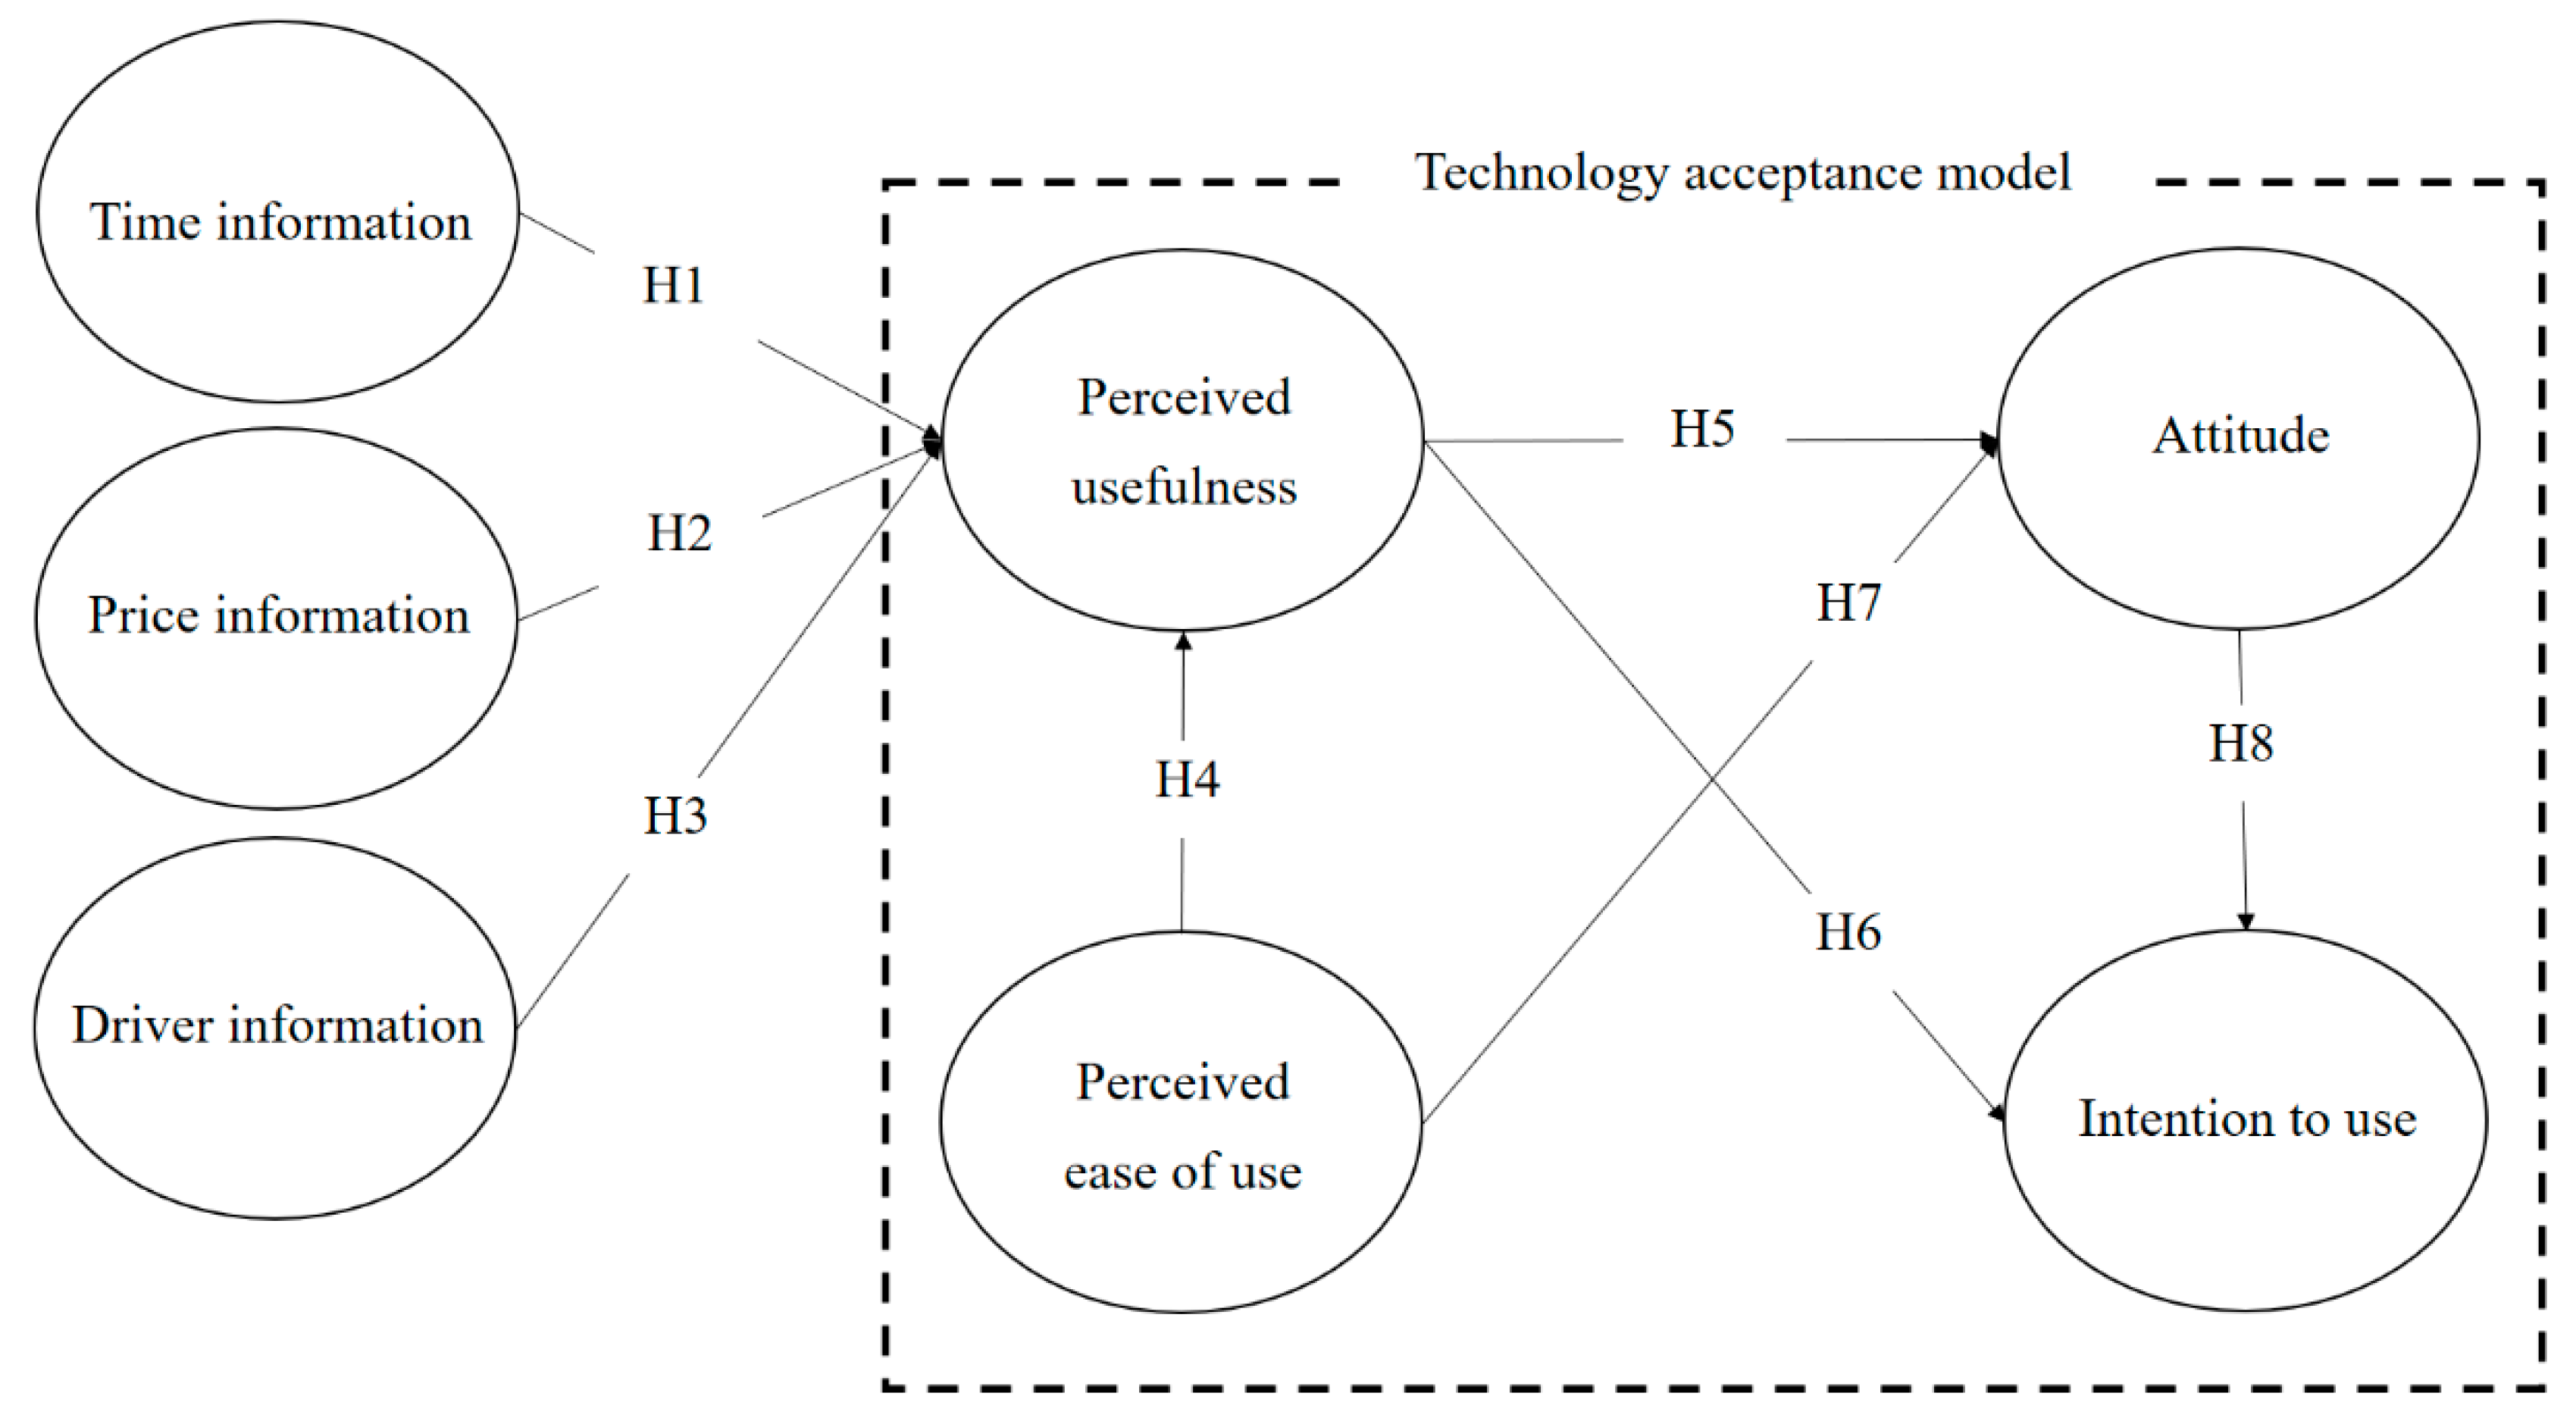
Figure 2.
Results of the hypotheses testing.


Table 1.
Description of measurement.
| Construct | Code | Item |
|---|---|---|
| Time information | TI1 | Uber taxi app offered time information. |
| TI2 | I could attain arrival time information by Uber taxi app. | |
| TI3 | Uber taxi app presented the duration of moving. | |
| Price information | PI1 | Uber taxi app provided me with price information |
| PI2 | Uber taxi app offered price information. | |
| PI3 | I could reach price information using Uber taxi app. | |
| PI4 | Uber taxi app presented price details. | |
| Driver information | DI1 | I could subscribe driver information using Uber taxi app. |
| DI2 | Uber taxi app provided driver information. | |
| DI3 | Uber taxi app offered details of driver. | |
| DI4 | Using Uber taxi app enabled me to acquire driver information. | |
| Perceived usefulness | UF1 | Using Uber taxi app enabled me to arrive destination more quickly. |
| UF2 | Using Uber taxi app improved my service experience. | |
| UF3 | Using Uber taxi app enhanced the effectiveness of transportation service. | |
| Perceived ease of use | EU1 | Uber taxi app was easy to use. |
| EU2 | It was simple to use Uber taxi app. | |
| EU3 | Uber taxi app provided easy system to use. | |
| EU4 | It was straightforward to use Uber taxi app. | |
| Attitude | AT1 | Using Uber taxi app is bad-good. |
| AT2 | Using Uber taxi app is negative-positive. | |
| AT3 | Using Uber taxi app is unfavorable-favorable. | |
| AT4 | Using Uber taxi app is stupid-wise. | |
| Intention to use | IU1 | I intend to use Uber taxi app. |
| IU2 | I am going to use Uber taxi app. | |
| IU3 | Uber taxi app will be selected for me. | |
| IU4 | I will use Uber taxi app. |
Table 2.
Demographic information (N = 412).
| Item | Frequency | Percentage |
|---|---|---|
| Male | 243 | 59.0 |
| Female | 169 | 41.0 |
| Younger than 20 years old | 5 | 1.2 |
| 20–29 years old | 123 | 29.9 |
| 30–39 years old | 167 | 40.5 |
| 40–49 years old | 66 | 16.0 |
| 50–59 years old | 33 | 8.0 |
| Older than 60 years old | 18 | 4.4 |
| Living are | ||
| Rural | 73 | 17.7 |
| Suburban | 160 | 38.8 |
| Urban | 179 | 43.4 |
| Monthly household income | ||
| Less than $2000 | 85 | 20.6 |
| Between $2000 and $3999 | 119 | 28.9 |
| Between $4000 and $5999 | 88 | 21.4 |
| Between $6000 and $7999 | 73 | 17.7 |
| More than $8000 | 47 | 11.4 |
| Weekly using frequency | ||
| Less than 1 time | 145 | 35.2 |
| 1~2 times | 150 | 36.4 |
| 3~5 times | 74 | 18.0 |
| More than 5 times | 43 | 10.4 |
Table 3.
Confirmatory factor analysis.
| Construct | Code | Loading | Mean | CR | AVE |
|---|---|---|---|---|---|
| Time information | TI1 | 0.707 | 4.23 | 0.751 | 0.501 |
| TI2 | 0.703 | 4.37 | |||
| TI3 | 0.715 | 4.21 | |||
| Price information | PI1 | 0.800 | 4.34 | 0.864 | 0.615 |
| PI2 | 0.825 | 4.30 | |||
| PI3 | 0.808 | 4.27 | |||
| PI4 | 0.700 | 4.22 | |||
| Driver information | DI1 | 0.573 | 3.74 | 0.809 | 0.518 |
| DI2 | 0.748 | 4.07 | |||
| DI3 | 0.790 | 3.82 | |||
| DI4 | 0.751 | 3.79 | |||
| Perceived usefulness | UF1 | 0.654 | 3.96 | 0.765 | 0.522 |
| UF2 | 0.780 | 4.00 | |||
| UF3 | 0.729 | 4.11 | |||
| Perceived ease of use | EU1 | 0.822 | 4.33 | 0.889 | 0.669 |
| EU2 | 0.852 | 4.32 | |||
| EU3 | 0.820 | 4.29 | |||
| EU4 | 0.776 | 4.24 | |||
| Attitude | AT1 | 0.817 | 4.26 | 0.893 | 0.677 |
| AT2 | 0.814 | 4.21 | |||
| AT3 | 0.870 | 4.28 | |||
| AT4 | 0.789 | 4.11 | |||
| Intention to use | IU1 | 0.815 | 4.17 | 0.868 | 0.627 |
| IU2 | 0.879 | 4.15 | |||
| IU3 | 0.602 | 3.79 | |||
| IU4 | 0.842 | 4.17 |
Note: Goodness-of-fit indices: χ2 = 500.401, df = 278, χ2/df = 1.800, GFI = 0.909; NFI = 0.923; RFI = 0.910; IFI = 0.964; TLI = 0.958; CFI = 0.964; RMSEA = 0.044, CR stands for construct reliability, CR stands for construct reliability, AVE is average variance extracted.
Table 4.
Correlation matrix.
| 1 | 2 | 3 | 4 | 5 | 6 | 7 | |
|---|---|---|---|---|---|---|---|
| 1. Time information | 0.707 | ||||||
| 2. Price information | 0.682 * | 0.784 | |||||
| 3. Driver information | 0.493 * | 0.492 * | 0.719 | ||||
| 4. Perceived usefulness | 0.506 * | 0.477 * | 0.503 * | 0.722 | |||
| 5. Perceived ease of use | 0.633 * | 0.674 * | 0.444 * | 0.605 * | 0.817 | ||
| 6. Attitude | 0.543 * | 0.543 * | 0.426 * | 0.610 * | 0.681 * | 0.822 | |
| 7. Intention to use | 0.457 * | 0.441 * | 0.410 * | 0.570 * | 0.550 * | 0.746 * | 0.791 |
Note: * p < 0.05, Diagonal is the square root of the average variance extracted, SD stands for the standard deviation.
Publisher’s Note: MDPI stays neutral with regard to jurisdictional claims in published maps and institutional affiliations. |
© 2022 by the authors. Licensee MDPI, Basel, Switzerland. This article is an open access article distributed under the terms and conditions of the Creative Commons Attribution (CC BY) license (https://creativecommons.org/licenses/by/4.0/).
Share and Cite
MDPI and ACS Style
Moon, J.; Shim, J.; Lee, W.S. Exploring Uber Taxi Application Using the Technology Acceptance Model. Systems 2022, 10, 103. https://doi.org/10.3390/systems10040103
AMA Style
Moon J, Shim J, Lee WS. Exploring Uber Taxi Application Using the Technology Acceptance Model. Systems. 2022; 10(4):103. https://doi.org/10.3390/systems10040103
Chicago/Turabian StyleMoon, Joonho, Jimin Shim, and Won Seok Lee. 2022. "Exploring Uber Taxi Application Using the Technology Acceptance Model" Systems 10, no. 4: 103. https://doi.org/10.3390/systems10040103
Note that from the first issue of 2016, this journal uses article numbers instead of page numbers. See further details here.