
The Integration of Reliability, Availability, and Maintainability into Model-Based Systems Engineering


Department of Systems Engineering, Naval Postgraduate School, Monterey, CA 93943, USA
*
Author to whom correspondence should be addressed.
Systems 2022, 10(4), 101; https://doi.org/10.3390/systems10040101
Submission received: 19 May 2022
/
Revised: 12 July 2022
/
Accepted: 13 July 2022
/
Published: 15 July 2022
(This article belongs to the Section Systems Engineering)
Abstract
:Model-Based Systems Engineering (MBSE) methods have developed a strong foothold in the design space in industry. These methods have proven fruitful when the right method is applied to the right problem. Reliability, Availability, and Maintainability (RAM) is an equally important area. Currently, there is a gap in applying a methodology to integrate the two in the design process, particularly when the design is complex. This work attempts to provide a methodology that results in the successful integration of RAM and MBSE that can be used during the early phases of design. The methodology was developed after an extensive literature review, followed by the illustration of the methodology through an example of a steam turbine fuel system. Each step of the method is applied and explained in the illustrative example, to include figures, tables, and calculations demonstrating the effectiveness of the method, concluding with evidence for validation.
1. Introduction
Systems are becoming increasingly complex and so too must the design processes and methodologies to be successfully executed. Old paper-based processes of performing system design are no longer capable of taking full advantage of modern design processes and methodologies. As a result, Model-Based System Engineering (MBSE) methodologies are being increasingly relied on to develop and execute models that underlie many system design processes to better facilitate complex system design. The research conducted in MBSE has largely been successful in the execution of thorough design processes and robust analysis capabilities. Additionally, historical data can be effectively leveraged to aid with requirement development and conceptual designs.
An important step in assessing a system design occurs when executing a Reliability, Availability, and Maintainability (RAM) analysis. These analyses are usually assessed after the design of a system has largely been finalized, and even if the assessment shows that a change should be made, changes are not often implemented; usually, the analysis is treated as a paper after-the-fact activity. A potential way to improve the situation is to better integrate RAM analysis into MBSE so that RAM is performed earlier in the system design process, when RAM can influence the design. Currently, RAM analysis is not effectively influencing the design of a system.
There are several issues that arise when attempts to integrate RAM and MBSE are made in the conceptual design phase of a system. The first issue is that RAM is not a focal point of the design process, being relegated to an activity to obtain a “check in the box” and continue with the design process. The second issue arises when it is conducted, because there is not unanimous agreement among the design team as to when it should be conducted. The inability to identify when RAM analysis should be conducted often has disastrous results. Reliability calculations may be conducted to provide a needed numerical value, but if it is not conducted early in the design process, the effort and resources needed to realistically attain the needed value may cause significant delays or overruns in cost, with the worst-case scenario causing the dissolution of a project and its team [1]. This scenario highlights the gap in RAM and MBSE integration.
To gain clarity on this issue, an examination of RAM and MBSE methodologies will be conducted, with an emphasis on the primary factors that must be considered when modeling RAM relationships during a RAM analysis and how it affects the sharing of data, information, and knowledge both internal and external to an organization. The development of a methodology will help to demonstrate how RAM can have a positive effect, particularly during the conceptual design phase, and elevate RAM analysis techniques from a paper activity to being conducted earlier and more frequently. This work aims to address the problems that arise during RAM/MBSE integration by presenting a simple methodology that can be followed when conducting work on a system design effort. The methodology is intended to effectively demonstrate how to integrate the RAM/MBSE domains using the proposed methodology, which will have a positive effect on the systems being designed.
The scope of this work and subsequent organization begins with an investigation into the background of RAM/MBSE integration through an extensive literature review of the relevant material. Following the literature review, a methodology is developed with the intention of addressing the problems that arise in RAM/MBSE integration. The steps of the methodology are correlated to the steps that one may take in the design of an automobile braking system. A limitation in the scope of the methodology is that it was developed using a specific modeling language and tool. The methodology was not tested using other modeling languages or tools. The methodology is then more rigorously applied to a turbine fuel system system to demonstrate its effectiveness. Following the methodology’s application, a discussion of the results is followed by a section on future work. Lastly, a conclusion section discusses the salient points of the paper and final thoughts.
Two major challenges for this work include developing a methodology that, while designed using a specific modeling language and tool, can also be applied across several different languages and tools. It must also be simple enough to be easily implemented and used, but not so simple that its effectiveness for use with complex systems is compromised to the point where it becomes useless. Balancing the decisions that directly impact these concerns will determine the applicability and effectiveness of the methodology.
Major Contributions
The major contributions of this work intend to demonstrate:
- A RAM and MBSE methodology that can be used for design efforts;
- A method intended for defense systems but with broader applicability to any complex system;
- A method that can be used regardless of modeling languages or tools to be used effectively.
The broad applicability is the driving factor for its use not merely for DOD, but other organizations that can benefit from it as well. This methodology does not require specific modeling languages or tools to be used effectively. A user can effectively implement their organizations’ processes and frameworks with this methodology to display the presented information in a format that is best suited to the user’s needs.
2. Background and Literature Review
MBSE techniques have been used for several decades, with the pioneering work being published in 1993 [2]. Since then, several modeling languages, tools, and frameworks have been designed and implemented in various industries to facilitate design efforts. Modeling languages, such as Systems Modeling Language (SysML), can be used depending on the level of detail needed for design or system boundary requirements [3]. Object Process Methodology (OPM) serves as a modeling language and methodology for the creation of conceptual models for the creation of a system and has the ability to capture knowledge and design systems based on a minimal universal ontology [4,5]. The Vitech MBSE methodology in use today is “based on four primary concurrent SE activities that are linked and maintained through a common System Design Repository”. These activities are then linked to four primary SE domains that form the backbone of the methodology [6]. The Harmony-SE process closely resembles the Vee lifecycle model and uses a service request-driven modeling approach. There is also an assumption that the model and requirement artifacts are maintained in a central repository [7,8]. State Analysis, developed by Jet Propulsion Laboratory, uses a model and state-based control architecture. This approach intends to capture system and software requirements to facilitate system and software requirement implementation [9].
Frameworks such as Digital Thread and the Department of Defense Architectural Framework (DODAF) are some of the MBSE frameworks in use today by the Department of Defense (DOD) [10,11]. Digital Thread is “a data-driven architecture that links together information generated from across the product lifecycle” [12]. Digital Thread is used in model-based manufacturing, additive manufacturing, and with hierarchical object-oriented models [13,14,15]. Digital Thread can also applied with Digital Twin, as the United States Air Force is currently utilizing [16]. In 2018, the DOD also implemented a Digital Engineering Initiative to “streamline the way defense programs collect, retain, and share data” [17]. With the recent Digital Engineering Initiative and related efforts spanning the past few decades, the DOD expanded to allow for additional modeling and simulation and became the basis for some system of systems modeling and simulation efforts [18,19,20]. Another important component of the Digital Engineering Initiative developed by the U.S. Army is the use of the Architecture Centric Virtual Integration Process (ACVIP). This process serves as a “compositional, quantitative, architecture-centric, model-based approach enabling virtual integration analysis in the early phases and throughout the lifecycle to detect and remove defects that currently are not found until software, hardware, and systems integration and acceptance testing” [21]. The focus of this process is on cybersecurity aviation systems with minimal cyber analysis conducted in the early design phase. The emphasis on early design analysis further demonstrates the need to provide processes that establish early design analysis considerations.
With the advent of many MBSE methodologies, there are also frameworks with a set of criteria to evaluate which methodology is most practical based on anticipated uses [22]. The methodologies and frameworks listed have taken into consideration, though not a focal point, the effect that RAM has on system design. Work conducted in the realm of RAMS analysis generation using model-based functional descriptions by means of UML state machines demonstrates an “integrated model-based approach of systems engineering and dependability analyses” [23].
There are several reliability prediction approaches in use today. Some of these are physics of failure prediction, historical failure data prediction, hybrid physics and data approaches, and functional failure mitigation modeling [24,25,26]. Failure research in the stated areas consists of stored system of systems, systems with spurious emissions, off-the-shelf software components, power electronics, turbine blades, and oil pipelines [27,28,29,30,31,32,33]. Maintainability prediction methods using hybrid neural networks, fuzzy logic, extreme learning machines, and mixture frailty models have also been used to predict the maintainability of evolving software systems, object-oriented systems, and mechanical components [34,35,36,37,38].
Reliability, Availability, and Maintainability are important attributes that affect system design, life-cycle costs, and system utility. The origins of reliability engineering can be followed back to World War II, with an emphasis on electronic and mechanical components [39]. Since then, a significant amount of effort has been put into improving the body of work. The use of failure mode effects and criticality analyses (FMECA) has become the primary quantitative method for determining RAM characteristics [40]. Quantitative analyses to assess system reliability and availability have also been used, based on reliability block diagrams, fault trees, and Markov models, used independently or combined to perform various analyses [41,42,43].
For fault trees specifically, a new standard was recently proposed by the Object Management Group, known as Risk Analysis and Assessment Modeling Language (RAAML). This standard can be used alongside the SysML modeling language, in addition to defining a Universal Modeling Language (UML) library and profile for fault tree modeling [44]. Its intent is to provide SysML compatible modeling language elements for a variety of analysis types, to include FTA and FMECA. Works such as these lay the groundwork for the development of a joint standard adopted by the DOD defining four processes to be used throughout the development life-cycle [45].
Integrating other technologies and concepts with MBSE is an idea that has been around for some time. Technologies such as Digital Twin, originally introduced in 2002, are used to provide an accurate, digital representation of a physical system [46]. Recent work has demonstrated the effectiveness of leveraging Digital Twin technology in MBSE, specifically by making it a part of MBSE methodology and experimentation efforts [47]. Digital Twin has also been used prominently in industry, both in concept development and through simulations [48,49]. Practically, a Digital Twin, used in conjunction with MBSE efforts, can provide an effective integrated modeling environment of the physical system. Digital Twin technology sees the most benefit in design efforts through predictive maintenance modeling and analytics to inform decisions made about the physical system in question [50]. The Object-Oriented Systems Engineering Method (OOSEM) has been used to “support the specification, analysis, design, and verification of systems” [51]. This method was applied to Joint Force Protection to study the application of force in major combat operations.
Most of the relevant work utilizing RAM/MBSE integration provides very specific information using one aspect of RAM or MBSE. This includes quantitative reliability [52] and availability studies using SysML [53], fault trees through SysML diagrams [54], an MBSE-assisted FMEA approach [55], a model-based architecture for RAM software in automotive applications [56], an MBSE approach to develop a reliability model for the NASA Sounding Rocket Program [57], and high-level modeling in an MBSE environment [58]. Banner-Bacin et al. applied an MBSE technique for Combat System Architectures that may be used to determine the RAM values of a system [59]. The work described can be helpful but only under certain conditions, such as needing to conduct FMECA using SysML as the modeling language. Vaneman details five important considerations for achieving maximum MBSE effectiveness. The considerations, or pillars, are the modeling language, structure, modeling process, presentation framework, and MBSE tool. Vaneman proposes these pillars within two processes that use MBSE diagrams and its use in RAM applications [60].
An article published in the 26th Annual INCOSE Symposium details a framework that provides a way to integrate reliability and systems engineering. This framework is broken down into three phases, detailing requirement specification, design and development, and the detailed design of the system [61]. This work goes on to reinforce that reliability practices adopted at the earliest stages of design have the highest positive impacts.
The methodologies discussed in this section can, or already have, provided users with the ability to further enable the integration of RAM/MBSE in some manner for a design effort. While their use has been proven, these methodologies are best used under certain conditions. The driving motivation for this work was to find, or develop, a methodology that can be used effectively and appropriately for RAM/MBSE integration but is still accessible to users to be able to conduct analyses on complex systems. The table below details the associated weighting of four criteria. It is difficult to statistically compare existing methodologies with the proposed methodology as there is not a large enough sample size for the proposed methodology to conduct an accurate assessment. To remedy this, the criteria and associated weights are selected based on reviews of information on the methodology and its use. The criteria act as a means of identifying which methodologies are more or less effective under certain criteria when compared to the proposed methodology.
A selection of methodologies were exclusively chosen to be included in this work. The methodologies selected were based on their prevalence in the field and applicability to the proposed methodology. A methodology not selected for criteria evaluation was the Rational Unified Process (RUP). This approach is “based on a set of building blocks, or content elements, describing what is to be produced, the necessary skills required, and the step-by-step explanation describing how specific development goals are achieved” [7]. RUP has been very successful in the SE domain, specifically in managing software development projects [62]. The downside to this process, however, lies in its complexity. The intricacies of this methodology are identified in the requirement for expert developers. Additionally, for large projects, the integration of multiple avenues of development results in a disorganized development process, culminating in a problematic testing phase [63].
The selection criteria eliminated several methodologies, and this was done to keep the comparison concise and relevant to the proposed methodology. RAAML was selected due to its SysML compatibility and RAM modeling. OPM was selected due to its MBSE domain prevalence, specifically its creation of specialized models for systems. OOSEM was selected for its prevalence in the MBSE domain and its analysis, design, and verification of systems. Lastly, ACVIP was selected for its integration capabilities in the early design phase of a system.
In this work, we define four criteria for evaluation with the proposed methodology. We identify these criteria in a similar manner of design principles acting as “an abstraction of experience that can be used to effectively guide engineering design” [64]. While not referred to in the same way, the intention is the same. After reviewing the literature, the authors did not find any standard criteria with which to compare methodologies. The methodology criteria evaluated include Accessibility, Ease of Use, Complex System Applicability, and Database Integration. Accessibility determines whether the methodology can be applied across multiple MBSE tools. Ease of Use evaluates user-friendliness. Complex System Applicability is a useful tool to determine if the methodology can be utilized within complex systems. Finally, Database Integration is used to aggregate data from various sources and determine value. These four criteria were selected based on their relevance and applicability to the MBSE domain. The methodologies researched were RAAML, ACVIP, OPM, OOSEM, DODAF, RUP, Vitech MBSE, Harmony-SE, and State Analysis. This work considers how the four criteria previously defined can influence methodology selection, specifically during the early design phase. Adjustments throughout the early design phase can prove beneficial through lowering costs, shortening schedule time, and through design decisions that substantially improve the end product [65,66,67].
The Pugh matrix shown in Table 1 identifies how the selected MBSE methodologies compare to the proposed methodology based on the four criteria. All of the methodologies are effective in the domain, particularly in application to complex systems, but require various levels of effort, training, familiarity, or resources to be used consistently and efficiently. Given these resource considerations, the results of this research intend to culminate in a methodology that fills a gap in RAM and MBSE integration—namely, a methodology that can be easily followed to successfully incorporate MBSE and RAM techniques early in the design effort.
3. Methodology
This section introduces the proposed RAM/MBSE integration methodology developed by the authors. The methodology intends to provide a simple approach to effectively integrate RAM/MBSE techniques while still maintaining effectiveness during the early stage of system design. A figure showing the overall methodology and discussion of each step will be given. At the end of each step will be an example as to how the step can be applied to an automobile brake system.
To navigate design efforts, a seven-step methodology is proposed to facilitate the integration of RAM and MBSE processes. Figure 1 shows a visual depiction of the methodology and its intended flow. It is intended to provide a high-level view of how the steps of the methodology are connected.
The diagram shows the flow path for each step in the methodology. The user will follow each step in order until the final step, Step 8, is reached. The comparison of requirements to actual values will be conducted to determine if values are acceptable for the design effort. If they are unacceptable, then the user will return to Step 3 and review the work done at that step and every step after. The intention of returning to Step 3 is to review the work and processes done and ensure that there are no mistakes in areas that are most likely to impact the final results. Descriptions of each step are presented throughout this section. Once all steps have been completed, the user can continue to the next phase of design.
Associated with each step is an example showing a possible application of the methodology. In this case, a reliability engineer is attempting to design and evaluate the RAM attributes of a brake system for an automobile. To effectively design this system, the engineer will follow the steps of the methodology. The last paragraph of each section for Step 1 to Step 7 will describe the steps taken by the reliability engineer.
3.1. Step 1: Define for the Design Effort the Modeling Language, Structure, Modeling Process, and Presentation Framework
The first step for the successful integration of RAM and MBSE is to first define the modeling language, structure, modeling process, and presentation framework. There are several modeling languages to choose from, such as SysML, OPM, or UML [68]. The structure defines the elements’ attributes and relationships within the model and their connections and interactions to establish model concordance [60]. The modeling process provides the analytical framework required to run and evaluate the models. There is a plethora of models that can be used, so proper selection of the model early to inform the rest of the design effort is critical. Lastly, the presentation framework is intended to provide standard views, descriptions, and representations of the model to be presented to stakeholders in a logical manner.
This step should not be rushed, and adequate time should be spent to fully define what is needed for the design effort [60]. The implementation of an architectural framework, such as DODAF, can provide guidance on the four characteristics to be selected. This is done through explicitly stating how and what should be used, but also allowing room for change as needed to accomplish the goal of the design effort. An example in practice would be to definitively select or narrow down the viable options based on the intended design. An awareness of the differences between two options in the same category, such as the modeling language, SysML, which provides more advantages in terms of system and system-of-system specification than UML. Understanding the trade-offs of these choices is paramount to the effective selection and implementation of the next step.
Automobile Braking System Example: Based on previous use and subsequent familiarity, the engineer will choose SysML as the modeling language; the structure used will be able to demonstrate the elements and relationships of an automobile braking system clearly and effectively. The engineer has determined that the modeling process will have an emphasis in the domain of RAM analysis through Monte Carlo simulations. The presentation framework will provide the standard view for showing the model and its results. This can be based on what the engineer is used to using, or how the stakeholders want the information presented.
3.2. Step 2: Select MBSE Tool That Can Completely Represent the System
The selection of the MBSE tool comes after Step 1 because the MBSE tool is how the user interacts with the MBSE environment. There are several MBSE tools available, with different capabilities and limitations. Because not every MBSE tool has the same capability and feature set, proper selection based on design considerations is crucial to the success or failure of the design effort. Table 2 below shows examples of some options shown in Step 1 and 2 as a reference for what falls into each category. There are some instances where the tool used is mandated rather than selected. An example is that tool selection for military projects generally use Cameo as their designated MBSE tool. It is important to understand that while mandating an MBSE eases the burden of needing to select a tool, the limitations must also be considered to adequately determine if success can be achieved.
There may be times when the MBSE tool chosen does not possess certain modeling or simulation capabilities or a better option may be available for this portion of the design effort. If more detailed modeling and simulation techniques are needed, other tools, such as ModelCenter, which can provide an analysis from multiple perspectives due to the various options provided, can be used to provide the robust capabilities that may be required [69]. The selection of an additional tool may not happen until later in the design process. If this is the case, the additional tool should provide a capability that the current selection does not. Capabilities such as different diagrams or an add-in that allows the calculation of the values of certain requirements would be appropriate tools to consider adding to the design effort. The table below shows some examples of modeling languages, processes, frameworks, and MBSE tools that are available for use. MBSE tools generally rely one one modeling language but can be used with different processes and frameworks depending on design needs. It is up to the user to select the best option or options and make the determination that will best suit the goals of the effort.
Automobile Braking System Example: With an understanding of how the necessary aspects of the design effort will be implemented, the engineer has several tool options to choose from. Cameo Enterprise Architecture (CEA), CORE, and Innoslate are the tools that the engineer can select from. Each of the MBSE tool options provides similar capabilities; however, after careful consideration of tool capabilities and user familiarity, the reliability engineer chooses the CEA MBSE tool.
3.3. Step 3: State System Relationships/Requirements
The system requirements of the design effort are determined during the initial phase of the design process. Some activities that are conducted to effectively determine and document requirements are elicitation, analysis, validation, negotiation, documentation, and management [70]. These activities are conducted with the consideration of certain factors, such as stakeholder needs and system application. Requirements that can be determined through the previously listed activities are usability, functional, performance, operational, and interface requirements. The functional, performance, and usability requirements are ideal for this methodology as these requirements deal with defining system functions and associated measures of performance, such as reliability and availability.
System relationships consider how each system or subsystem for the design effort is connected. Understanding the interactions between the systems provides clarity as to how certain interactions can provide what is needed to meet the system requirements. The system relationships are considered in Step 1, but become more detailed in this step. There is a high likelihood that every relationship for the system may not be stated in this step based on the available information and understanding of the system. As the design effort progresses to the following steps, the user may need to return to this step and update the relationships as appropriate to ensure continuity for the rest of the methodology.
Automobile Braking System Example: With the MBSE Tool selected, the engineer can now interact within the MBSE environment. The system relationships and requirements will be stated for the brake system in the tool design space. These requirements were identified prior to tool selection and any new or altered requirements are updated as needed.
3.4. Step 4: Make Block Definition Diagram(s) (BDD) and Additional Diagrams as Needed
The purpose of a Block Definition Diagram (BDD) is to show “system components, their contents (properties, behaviors, constraints), interfaces, and relationships”, with the intention of providing the building blocks to create a robust model of the system [71]. BDDs are scalable and can provide a high-level overview or specifics of a subsystem. In some cases, however, additional diagrams may be needed. Diagrams such as fault tree diagrams and equipment failure diagrams can all be useful diagrams to include. These additional diagrams will vary based on the MBSE tool, but may be used to provide a more robust structure and analysis of the system.
The addition of diagrams may not occur until later in the process, especially if embarking on new design efforts. Designs that draw upon familiar concepts previously used may have additional diagrams and tools considered, or even used, earlier in the process. It is important to consider if the diagrams used are effective at accomplishing the design intent and to make adjustments sooner rather than later to save valuable time.
Automobile Braking System Example: The next step is to develop the BDDs to provide a visual representation of the components and elements, along with the interfaces and relationships shared with each other. The BDDs provide the logical hierarchical representation for the components of the brake system. The BDDs can be adjusted as necessary to provide the fidelity required for the design. Additionally, as the BDDs are more defined, additional diagrams may be needed that may require an additional tool to accomplish. The extent to which extra diagrams and tools are used is situational but should not be ignored if incorporation will be beneficial to the effort.
It is important to note that the making of the BDD is specific to SysML. Other languages, such as UML, have their own specific set of diagrams that may share certain qualities. For example, a BDD in SysML is based on a class diagram for UML but has additional restrictions and extensions based on the modeling language [72]. The diagram output will rely on the modeling language used for the design effort.
3.5. Step 5: Define Data Requirements and Gather Data
With the necessary diagrams made, the next step is determining the type of data needed. Data requirements can be defined based on the system, operating environment, and/or mission set. The type of data determined to be needed may be failure rates, failure modes, operating temperatures, length of operation, etc. The data gathered must be adequate enough to accomplish the needs of the design effort. Gathering data is accomplished in a variety of ways. Historical data, field data separate simulations, data estimates, or case study data are several ways that this step in the process can be completed.
Based on the design effort, the designers will determine the best data to use. Field data or historical data are likely the best choice for an already existing design. It is important to note the characteristics of good data: accurate, complete, consistent, timely, valid, and unique. Factors that would make the data less useful or nullify their use altogether would be if the system operation and/or environment is not consistent when collecting data, ot the system is operated at different intervals during collection. The data gathered will be used for the next step.
Automobile Braking System Example: The data requirements now must be determined. In this example, the realm of RAM analysis is the priority so the required data will consist of such data as failure and repair rates, availability, maintainability, and supportability. The engineer will gather the required data from a historical database that is readily accessible.
3.6. Step 6: Make Parametric Diagram(s)
The parametric diagrams provide the basis for the necessary simulation and modeling for the design. This enables the integration between the design and analysis models through enforcing mathematical rules across block value properties, which specify the quantitative property of the block. The diagrams will be the basis for RAM value determination based on the data and constraints entered. A single or multiple parametric diagrams may be enough based on the modeling and analysis required. If a more robust analysis is required, the next step can be used.
Automobile Braking System Example: Once the data are gathered, the parametric diagrams will be made to provide the basis for the modeling and simulation required. The data will be included in the parametric diagrams with the required constraints and mathematical rules needed to obtain the desired results. Because RAM was the domain of choice using Monte Carlo simulations, the simulations will use the values from the BDDs, parametric diagrams, and Cameo Simulation Toolkit to achieve the desired results. The output of the results can be shown in various forms, such as a histogram, mean values, component pass/fail, etc.
Similar to Step 4, the making of the parametric diagram(s) is specific to SysML. Other diagrams using other modeling languages and tools may be presented similarly, but are distinct to the modeling language.
3.7. Step 7: Determine RAM Values from Parametric Diagram(s) and Compare to Requirements
The RAM values can now be determined from the equations stated in the parametric diagrams and compared to previously defined requirements. The comparison of the values to the requirements is crucial to the design effort. The comparison may not be completed automatically, depending on the tool being used. If this is the case, the engineer will need to check the results against requirements through an in-depth look at the results and the desired values. It is important to note that if additional components are added, the user must identify the relationships and include them in the appropriate equations as necessary. Otherwise, the additional components will appear in the diagram but not be included in the equations to calculate the results. If the values are not consistent with what is expected or are determined to not provide the intended value for the design effort, then reconsideration of previous steps is required. The ideal place to start the reset is based on the results of the comparison analysis, but the engineer should return to Step 3 and continue through the steps again and make changes based on the analysis.
This process is intended to provide a framework to move from the design concept to descriptive and logical system and subsystem states. The emphasis on proper tool selection through an analysis of the modeling language, structure, modeling process, and presentation framework will make it easier for the designer to create the BDD and parametric diagrams while also showing the appropriate relationships and requirements. As stated in Step 4, the designer can use additional, better equipped tools as needed to provide more detailed models and simulation results for analysis.
Automobile Braking System Example: The calculated values will be compared to the requirements. If these values do not match expectations, the engineer will determine where the gaps are and start again at a previous step and proceed through the methodology again. For example, if the final values are missing the analysis of a metric, the engineer can go back to Step 3 and adjust or add data requirements, and then resume from that step.
The presentation of the determined RAM values and comparison of requirements will differ based on the modeling language used. In this work, the determination and analysis is conducted and presented with SysML as the modeling language. The fault tree was created using Innoslate.
4. Illustrative Example of Methodology
This section will apply the methodology in more detail than the automobile brake example in the previous section. The methodology will be applied to a steam turbine fuel system and show the necessary tables, figures, and data needed. This section will conclude with a discussion of the results. The MBSE tool used for this example was Cameo Systems Architecture 19.0 SP4 supporting v1.6 of SysML, released by Dassault Systems [73].
To effectively demonstrate the methodology, an illustrative example will be presented. The system that this will be applied to is a steam turbine fuel system. The turbines are driven by high-pressure steam, produced when the flame in a boiler heats the high-pressure water pumped into the system. The fuel system connected to this boiler uses natural gas to create the flame that heats the water to steam. Figure 2 below illustrates an example fuel system.
The illustrative example presented is intended to show a likely scenario where this methodology will be implemented. The perspective will be from a reliability engineer tasked with satisfying the need shown in Table 3. In addition to the need to be satisfied, the basic flow, providing the background information and process for satisfying the need, subject area, and trigger, is shown.
Using the information from the figure, the engineer will be able to effectively conduct the necessary steps in order to successfully represent the system and implement the data in the model to obtain the desired results.
4.1. Step 1: Define for the Design Effort the Modeling Language, Structure, Modeling Process, and Presentation Framework
The reliability engineer must determine the modeling language, structure, modeling process, and presentation framework. Based on the resources available, the modeling language selected is SysML, with the structure and presentation framework selected determined by the organization to facilitate understanding of the content. The modeling process selected to run and evaluate the model is intended to create a series of hierarchical diagrams accurately representing the system, using these diagrams to inform the models being developed. Additional simulations can be run as necessary based on model needs. Simulations are ideal if experimenting on an in-use system is impractical or unable to be accomplished. Some primary drivers of choosing to incorporate a simulation are based on cost, time, and system configuration. A step-by-step process for simulation model selection and implementation exists, but will not be discussed in detail in this work.
4.2. Step 2: Select MBSE Tool That Can Completely Represent the System
Now that Step 1 is complete, Step 2’s MBSE tool selection can be determined. The tool that can best represent the system and is available to the engineer is Cameo Enterprise Architecture (CEA). This tool uses SysML 2.0 as the modeling language and provides several diagram options to describe the system. Additionally, a simulation toolkit add-on is available to the engineer to further improve the modeling and simulation capabilities, should this be required.
4.3. Step 3: State System Relationships/Requirements
The RAM measures for the turbine fuel system are pivotal to the effectiveness of subsequent steps. There are many relationships that can be explored for the turbine fuel system; however, due to the complexity of turbine fuel systems, only a limited set are explored in this illustrative example. The requirements are listed in Table 4.
These three requirements will lay the foundation for ensuring that the successful completion of subsequent steps falls in line with the desired product to be produced. It is important to note that while system relationships may evolve over the course of the design effort, the requirements for the design effort, in practice, are determined before this step. Requirements are included in this step to check that subsequent steps are in line with delivering the desired methodology output.
4.4. Step 4: Make Block Definition Diagram(s) (BDD) and Additional Diagrams as Needed
The BDD in Figure 3 shows the connections between the elements, components, systems, and subsystems within the fuel turbine system.
Figure 3 shows that the turbine fuel system is connected to the natural gas system. The natural gas system is then composed of five elements, including the storage tank, fuel pump, fuel filter, fuel nozzle, and combustion chamber. The BDD shows the smaller systems that ultimately make up the turbine fuel system. Additional fault tree and equipment failure diagrams were included to provide additional information on equipment failures for the system.
In the fault tree, at the bottom level, the light red boxes indicate the possible failures for the orange parent failure, connected by a greenish-gray AND gate. The light blue box indicates other possible failures for the fuel system denoted by the gray box, connected by the purple OR gate.
Using external tools to fill gaps due to a lack of capabilities of the primary tool is expected. Should this issue occur, the use of additional tools to supplement work should be considered as needed. Figure 4 shows a fault tree that was created using an external web-based tool to provide another visualization of the information and data provided. Table 5 shows the types of equipment failure for the fuel system. These figures provide amplifying information to those who may need it to understand system interactions and considerations.
4.5. Step 5: Define Data Requirements and Gather Data
The requirements for the data collection must provide sufficient information to determine the RAM values for the system. Based on the equations used, the data information must contain the failure rates and repair rates for each turbine. The data are also verified as meeting the six characteristics of good data. Determining the requirements allows the engineer to move onto the next step.
With the logical hierarchical diagram complete, the data for the system can then be gathered. For this illustrative example, the data were originally collected from an industrial turbine system [75]. Table 6 and Table 7 illustrate these data.
The data presented are the necessary data for determining the reliability and availability of the turbine fuel system, using the equations presented in Step 3.
4.6. Step 6: Make Parametric Diagrams
With the data now available, the parametric diagrams can be made that hold the equations and constraints to be used by the data. Figure 5 and Figure 6 shown below illustrate the parametric diagram and its equations and constraints to determine the 3-out-of-4 reliability for the turbine.
With the data, equations, and constraints now reflected in the parametric diagram, the reliability and availability values can be determined.
4.7. Step 7: Determine RAM Values from Parametric Diagram(s) and Compare to Requirements
The final step calculates the results and compares them to the requirements. The results are shown in Table 8 and Table 9. Comparing the results to the requirements will determine how well the data selected and model chosen meet the requirements. Should the results not match the expected values, then the engineer will re-evaluate decisions made at a previous step. The most likely place to begin an analysis of potential pitfalls in initial requirements will be at Step 3 or 4, and then resuming the process from that step. The comparison is a simple but pivotal step in the correct implementation.
5. Discussion
The results of the parametric equations in Table 8 indicate that there is a 3-out-of-4 reliability of 0.93 and an availability of 0.99. The reliability and availability results are appropriate for this particular system’s requirements. If results are not at or exceeding the accepted criteria, the user should go back through the process and check their inputs. If, following a check and re-run of the equations, the results are the same, the user should determine which of the parameters can be changed to provide the desired results. As this methodology is intended to be applied early in the design phase, the user can suggest changes to the design based on the adjusted inputs to achieve the desired results.
Table 9 provides a detailed breakdown of the number of failures and the probability of the system being in a particular state. The system should be in a zero-failure or single-failure state for most of the time that the system is in operation, at 93 percent of the time. With redundancy in the system due to the multiple turbines, from a practical standpoint, this is a reasonable system condition to be in. Combined with the availability result of 0.99 in Table 8, the system is reliable and shows high availability when it is needed. The combined probability of two or more failures in the system is at 7 percent and should be acknowledged, but of minimal concern. The presented results, combined with the practical analysis of the system setup and design, indicate that the methodology is successful in providing effective information through the application of an integrated MBSE/RAM approach.
A sensitivity analysis was also conducted to determine the change in results. The value at time t was changed by a factor of 10 from 100 to 1000 to observe the effects of this change. The results of the change are shown in Table 10, indicating that an increase in the value of t has a major effect on the 3-out-of-4 reliability for the system. To have a similar effect with t being original value of 100, the failure and repair rates would need to be significantly altered.
The primary benefit of using this methodology is that it provides an easy to follow, streamlined process for incorporating MBSE and RAM techniques. Traditional methodologies are effective but can become cumbersome if certain factors are missing or lacking. By providing a basic methodology with specific information on what should occur in each step, the user has a road map for achieving the desired end results. This methodology is ideally implemented early in the design process, with certain data assumptions being made. These assumptions can be made based on best estimates or if historical data for some or all components are available to be used. Having modeling resources available to conduct the required simulations is ideal. In practice, however, these values can be determined through other means as well, such as Excel or other available reliability software to verify results. If the results are different, the engineer will likely review the parametric diagram equations for possible errors in calculations. The final step in which the comparison is conducted is a simple but pivotal step in the correct implementation of the methodology.
The methodology presented is intended to provide a basic blueprint for developing RAM models that can be integrated into an MBSE environment. Following the steps in order provides the best chance for saving time and potential for rework, lowering costs, and scheduling overruns on the project. Beginning with Steps 1 and 2, the primary drivers in the MBSE realm are determined and selected based on the design needs. Stating the system relationships in Step 3 shows how the different parts of the system interact. Step 4 is informed by the relationships and the effective creation of BDDs and other diagrams as needed. The incorporation of additional tools as necessary to add additional data or information should not be ignored, despite the increase in time required to use the method effectively. If the initial MBSE tool selection is limited in certain aspects, the incorporation of other tools and time to gain proficiency, if not achieved already, should be accounted for to provide the best long-term chance for success.
Defining data requirements, gathering the data, and ensuring their quality provide the foundation for obtaining the desired results needed for analysis. Making and evaluating the parametric diagrams and comparing them to the requirements incorporates MBSE and RAM techniques, culminating in usable information for the engineer to make a decision on the design process. The comparison is critical for checking the process of the design effort and determining if a single step or multiple steps need to be readdressed to the desired degree.
The fault tree model shown in Figure 4 was small enough to be able to provide a simple fault tree model and data requirements that are simple to achieve. In more detailed examples, relying on more robust fault tree analyses, the use of a document with traceability capabilities may be required. Some tools have the capability to keep the SysML and fault tree model information co-located. In this case, the use of the same tool would be the best option for ensuring consistency of data. CEA, for example, has a Cameo Safety and Reliability Analyzer Plugin that maintains this information within the CEA MBSE tool, along with other useful capabilities that pertain to safety and reliability. This work did not have access to this plug-in, and thus had to use a separate means of displaying the fault tree model.
The OMG RAAML standard draws some comparisons to the methodology presented. The OMG standard’s intent is to provide SysML-compatible modeling language elements for a variety of analysis types, to include FTA and FMECA. The main draw of this standard is that it “defines a core set of concepts that are unified across these language elements and enable co-modeling with each other as well as with a system model”. Similar to the proposed methodology in this paper, the use of a BDD and parametric diagram is central to defining events. The BDD is used as a means of modeling an event, based on the inputs to the internal block diagram. The parametric diagram is used to provide gate specification for the event. This standard, through the use of the UML library, is then able to create a fault tree diagram and run a simulation.
Another important facet of this discussion is how to incorporate other models into a single simulation and analysis. The ability to incorporate other models into a particular analysis type is an incredibly useful feature for modeling tools to have. RAAML has the ability to incorporate multiple models into its overall analysis and simulation. Changes made to a model, when linked correctly, indicate missing information that needs to be updated or deleted from the final model. The integration of models is done through being in the same repository, and allows for different users to access and effectively integrate model information.
Furthermore, the inclusion of another standard, the Architecture Analysis and Design Language (AADL), used to address common problems in development, would have been beneficial during this work [76]. This work was not conducted using this standard but it is a good candidate for future work. The model displayed, however, demonstrates the intent of the work effectively to demonstrate the concepts proposed in this work. Addressing the traceability more generally, the user should be using, if applicable, traceability-enabled documents embedded in their MBSE tool. If this function is not available, then an appropriate methodology defined by the user’s organization should be the primary means of documenting traceability. Model automation is another important facet in model development. DEVSys, introduced in 2014, relies on “an integrated framework for utilizing existing SysML models and automatically producing executable discrete event simulation code, according to model driven architecture (MDA) concepts” [77]. Automated FMEA generation is possible through through the use of SysML plug-ins and applied to different realms, such as cyberattack vectors [78].
The implementation of this methodology is best used in the early stages of design and can provide an excellent starting point. While automation and integration is not discussed for the methodology, it has the potential to be an additional option. This option would be largely based on tools available to the user and a familiarity with automation and integration processes as it pertains to MBSE tool selection. In various portions of this section, the use of automation and integration of models has been demonstrated through the use of the SysML language. The BDD and parametric diagrams are excellent displays of information and can be updated with ease should changes be required. These two diagrams provide the necessary information to increase the flow of knowledge, both internal and external to an organization, which facilitates the advantage of early design RAM/MBSE integration.
This work is intended for DOD and other defense systems. While the work done is on a smaller scale, the results, however, have been shown to provide opportunities for success on a larger scale, as well as showing promise for being beneficial for industry application as well. The exposure to both DOD and complex systems in industry can provide more individuals with a useful methodology that they can use relatively quickly and effectively. This also provides more opportunities for constructive feedback to improve the methodology with future iterations.
Regarding the MBSE tool used, the software licensing was for academic purposes. Dassault Systems recently acquired the CEA tool and will be working on evolving the capabilities of the software with more thorough updates to current plug-ins, along with introducing new plug-ins. Using the academic license was effective in accomplishing what needed to be done, but access to certain plug-ins for added capabilities and analysis tools was limited. Despite the limitation, the MBSE tool was able to be used to effectively accomplish the intent of the work.
A drawback to this methodology is that, if a user has to make many detailed diagrams and switch between MBSE tools, the expectations for what should be accomplished in which tool may become fuzzy. If, for example, a user needs to switch between tools in order to generate various diagrams, they may find that the additional tool provides better capabilities than the original tool. This realization can happen due to a number of reasons, and may end up causing the user to second-guess the originally selected tool. To save time and effort, adequate time should be spent in Steps 1 and 2. If a permanent change should be made to the additional tool, the primary tool considerations, such as time needed to move information, such as data and diagrams, should be considered before making the change.
When comparing the process of applying the methodology to the two scenarios presented in this work, the braking system and fuel system, the use of the methodology is consistent. Steps 1 through 7 can be effectively followed in the same manner for both scenarios. The level of effort for each step, however, may vary based on the system being designed. The most likely areas where differences may arise are in Steps 2 and 6. The selection of MBSE tools and creation of parametric diagrams can vary based on numerous factors. The complexity of the design and required level of fidelity are some of the factors that can influence the other steps. MBSE tool selection not using SysML, as done in this work, will need to consider that tool’s version of the appropriate process for each step. The methodology can still be followed, but the user must consider the nuances of the selected tool as they pertain to the execution of the methodology.
This methodology can also be applied in additional scenarios—specifically, vehicle design to support DoD missions in desert terrain, ship design to support open ocean or littoral engagements, or the design of a high-powered rifle. Each step of the methodology can be followed in the same way, but there may be minor differences in the steps depending on which system is being designed. System relationships may be more detailed based on the system, or gathering the data to fill the data requirements may be hard to achieve. Despite these potential challenges, the methodology will be able to be followed as it provides an effective blueprint that can be followed to provide the necessary design fidelity. While not conducted on a DOD-specific system, the use of this methodology can be applied to DOD-specific systems.
The validation of this engineering methodology will be accomplished through the use of the Validation Square. It is not feasible to apply this methodology in the design of multiple systems and look for statistical correlations, as this requires significant time and resources, which are not available. To address this problem and still provide validation of the methodology, the Validation Square will be used. The Validation Square is used to evaluate engineering design methods where “formal, rigorous and quantitative validation” of a method may otherwise be problematic [79]. Using this validation method, there are six criteria that need to be accepted:
- Accepting construct validity;
- Accepting method consistency;
- Accepting the example problems;
- Accepting usefulness of method for some example problems;
- Accepting that usefulness is linked to applying the method;
- Accepting usefulness of method beyond example problems.
Addressing each criterion individually, beginning with 1, the construct is valid as it has been appropriately researched to provide a baseline for where methodologies of this type are, and current capabilities. Ensuring an appropriate level of research on relevant topics, to include current MBSE methodologies, frameworks, and languages, is paramount to ensuring that the appropriate amount of research has been constructed for the development of this methodology. The method can be consistently followed, as initially shown in Figure 1 and demonstrated using the brake and fuel system examples. The application of the methodology to two distinct examples, while not a large sample size, demonstrates its consistency and effectiveness in two different, but significant areas. The usefulness of the method for the example problems is demonstrated in the methodology example of the brake system, showing how each step is applied to this example. It is further demonstrated in the fuel system example, where a more robust example is detailed, showing relationships, calculations, and results based on stated requirements. The overall application of this method is deemed useful by providing a result that can be effectively applied to design decisions and influence the outcome of system design. The usefulness is linked to applying the methodology as attempting the example without the methodology would not provide a structured means of progressing through the design. While a separate methodology could be applied, the familiarity, level of effort, and intricacies of the methodology applied may lead to a loss in valuable design results. This would have real-world implications of cost and schedule problems, likely culminating in a degradation in performance based on timelines for design. Lastly, the usefulness of this methodology can be seen beyond the two examples in this work. Both examples were different and demonstrated that, despite being different systems, the methodology is still useful in its execution and can be applied to additional complex system designs. The ease of application of the methodology lends itself to its usefulness in additional system design areas that require early results to effectively influence and implement proper solutions. Based on the accepted answers to the six criteria, this demonstrates that the methodology exhibits theoretical performance validity [79]. Again, it is important to note that while exhibiting theoretical performance validity, the methodology should still be applied to the early design of particular systems that can provide a statistical output for comparative analysis. The ability to provide a comparative analysis to another methodology, such as OOSEM, can demonstrate the strengths and weaknesses of the methodology and is an important benchmark for long-term application.
6. Future Work
Areas of interest for future work should be to determine the changes necessary to better suit this methodology to new design efforts for which minimal or no data are available. This would provide two different methodologies, each with its own set of characteristics and uses. The application of this methodology to a new design would be the best way to determine its feasibility. Following a methodology using a particular industry standard, such as AADL, would be beneficial to determine further feasibility across a broader range. Additionally, applying the methodology with RAMS analysis generation using model-based functional descriptions and observing subsequent results would further expand on the broader feasibility of the methodology.
Further areas of interest for future work would be determining a methodology for using multiple tools at once and seamlessly transitioning between those selected. As systems become increasingly complex, the ability to transition between multiple tools may be needed. Utilizing the advantages of these various tools simultaneously, while following the methodology presented in this work or an adaption of it, has the potential for being incredibly beneficial. Additionally, a standard criterion with which to compare methodologies, or how to best evaluate trade-offs based on criteria, would prove valuable.
The methodology presented in this work used a specific tool and modeling language. Determining the effectiveness of the methodology presented in this work using a different tool or modeling language would be beneficial in demonstrating the more universal application of the work. Additionally, determining the feasibility of this methodology when incorporating multiple system models across various languages and tools would be beneficial when applied to system designs that are significantly complex.
While not conducted in this work, an advantageous area of future work would be to thoroughly benchmark the methodology against others in industry. The benchmark process would demonstrate where this methodology is applicable and where, and how, it may need to be restructured. Establishing a benchmark for this process is key to the long-term feasibility of the presented methodology.
Lastly, research into what changes should be made to make the methodology presented better suited for wider application and distribution as a whole, regardless of tool or modeling language, is of great importance to the further refinement and efficacy of the methodology. Being able to apply different frameworks and modeling processes can have significant impacts on the steps of the methodology and in what design conditions it may be better suited. These areas for future research would expand upon the current work done in a meaningful way. This methodology would be tested in various conditions not touched on in the current work, which would provide further refinement to the methodology presented.
7. Conclusions
The intent of this research was to provide a methodology that could be applied to design efforts. A literature review was conducted to ascertain the amount of work that currently exists in the realm of model-based system engineering and Reliability, Availability, and Maintainability integration. The review also served as a means of gaining adequate background information to inform the development of the methodology. Following the development of the seven-step methodology, an example was provided. This example was provided in two ways: first, through a walk-through of each step for an automobile brake system, and then through its application as a part of an illustrative example for a steam turbine fuel system.
The automobile brake system was walked through with the methodology, illustrating on a basic level how this methodology can be used. A more detailed example was then presented for the fuel system. The results determined the 3-out-of-4 reliability of 0.93 and availability of 0.99 for the system.
The combination of the methodology walk-through and illustrative examples demonstrates the validity of the methodology and how it can be used for a design effort. A particular gap that exists for this method is in the realm of tool selection—namely, if multiple tools are to be used. Switching between tools constantly can cause issues in several areas, such as diagram generation. While a possible pitfall, an understanding of what should be done based on the tool used is the best way to ensure that the needs of the effort are met based on the tool. An important area of future work for this methodology is how it fares when applied to a new system. This methodology was applied to generally well-understood systems, and the verification of this methodology to a novel system would be greatly beneficial in determining the best conditions under which this methodology can, and should, be applied.
Author Contributions
Conceptualization, K.D., B.O. and D.L.V.B.; methodology, K.D.; software, K.D.; validation, K.D.; formal analysis, K.D.; investigation, K.D.; resources, B.O. and D.L.V.B.; data curation, K.D., B.O. and D.L.V.B.; writing—original draft preparation, K.D.; writing—review and editing, K.D., B.O. and D.L.V.B.; visualization, K.D.; supervision, B.O. and D.L.V.B.; project administration, B.O.; funding acquisition, B.O. and D.L.V.B. All authors have read and agreed to the published version of the manuscript.
Funding
This research was funded by the Naval Research Program, grant number NPS-21-N307-A.
Institutional Review Board Statement
Not applicable.
Informed Consent Statement
Not applicable.
Data Availability Statement
Please contact the authors for the data used in this work.
Acknowledgments
The views expressed in this document are those of the authors and do not reflect the official policy or position of the Department of Defense or the U.S. Government. Approved for Public Release; distribution is unlimited.
Conflicts of Interest
The authors declare no conflict of interest.
References
- Mettas, A. Design for Reliability: Overview of the Process and Applicable Techniques. Int. J. Perform. Eng. 2010, 6, 577. [Google Scholar] [CrossRef]
- Wymore, A.W. Model-Based Systems Engineering; CRC Press: Boca Raton, FL, USA, 1993; Volume 3. [Google Scholar]
- Grobshtein, Y.; Perelman, V.; Safra, E.; Dori, D. Systems modeling languages: OPM versus SysML. In Proceedings of the 2007 International Conference on Systems Engineering and Modeling, Nancy, France, 3–7 December 2007; pp. 102–109. [Google Scholar]
- Dori, D. Object-Process Methodology: A Holistic Systems Paradigm; with CD-ROM; Springer Science & Business Media: Berlin/Heidelberg, Germany, 2002. [Google Scholar]
- Hause, M.C.; Day, R.L. Frenemies: Opm and SysML together in an MBSE model. Incose Int. Symp. Wiley Online Libr. 2019, 29, 691–706. [Google Scholar] [CrossRef]
- Baker, L., Jr.; Long, J.E. Role of System Engineering across the System Life Cycle; Vitech White Paper; Vitech Corporation: Vienna, VA, USA, 2000. [Google Scholar]
- Estefan, J.A. Survey of model-based systems engineering (MBSE) methodologies. Incose Mbse Focus Group 2007, 25, 1–12. [Google Scholar]
- Douglass, B.P. The Harmony Process; I-Logix White Paper; I-Logix, Inc.: Burlington, MA, USA, 2005. [Google Scholar]
- Kordon, M.; Wall, S.; Stone, H.; Blume, W.; Skipper, J.; Ingham, M.; Neelon, J.; Chase, J.; Baalke, R.; Hanks, D.; et al. Model-based engineering design pilots at jpl. In Proceedings of the 2007 IEEE Aerospace Conference, Big Sky, MT, USA, 3–10 March 2007; pp. 1–20. [Google Scholar]
- Piaszczyk, C. Model based systems engineering with department of defense architectural framework. Syst. Eng. 2011, 14, 305–326. [Google Scholar] [CrossRef]
- West, T.D.; Pyster, A. Untangling the Digital Thread: The Challenge and Promise of Model-Based Engineering in Defense Acquisition. Insight 2015, 18, 45–55. [Google Scholar] [CrossRef]
- Singh, V.; Willcox, K.E. Engineering design with digital thread. AIAA J. 2018, 56, 4515–4528. [Google Scholar] [CrossRef]
- Hedberg, T.; Lubell, J.; Fischer, L.; Maggiano, L.; Barnard Feeney, A. Testing the digital thread in support of model-based manufacturing and inspection. J. Comput. Inf. Sci. Eng. 2016, 16, 021001. [Google Scholar] [CrossRef] [Green Version]
- Nassar, A.; Reutzel, E. A proposed digital thread for additive manufacturing. In Proceedings of the 2013 International Solid Freeform Fabrication Symposium, University of Texas at Austin, Austin, TX, USA, 12–14 August 2013. [Google Scholar]
- Bonnard, R.; Hascoët, J.Y.; Mognol, P.; Zancul, E.; Alvares, A.J. Hierarchical object-oriented model (HOOM) for additive manufacturing digital thread. J. Manuf. Syst. 2019, 50, 36–52. [Google Scholar] [CrossRef]
- Kraft, E.M. The air force digital thread/digital twin-life cycle integration and use of computational and experimental knowledge. In Proceedings of the 54th AIAA Aerospace Sciences Meeting, San Diego, CA, USA, 4–8 January 2016; p. 0897. [Google Scholar]
- Ciarcia, J. DoD Digital Engineering (DE) Initiatives. Available online: https://community.apan.org/wg/navair-set/navair-mbsecommunity-of-practice/w/resources/21397/dod-digital-engineering-de-initiatives/ (accessed on 10 January 2021).
- Mittal, S. Extending DoDAF to allow integrated DEVS-based modeling and simulation. J. Def. Model. Simul. 2006, 3, 95–123. [Google Scholar] [CrossRef]
- Pan, X.; Yin, B.; Hu, J. Modeling and simulation for SoS based on the DoDAF framework. In Proceedings of the 2011 9th International Conference on Reliability, Maintainability and Safety, Guiyang, China, 12–15 June 2011; pp. 1283–1287. [Google Scholar]
- Hause, M. The Unified Profile for DoDAF/MODAF (UPDM) enabling systems of systems on many levels. In Proceedings of the 2010 IEEE International Systems Conference, Cape Town, South Africa, 23–27 May 2010; pp. 426–431. [Google Scholar]
- Boydston, A.; Feiler, P.; Vestal, S.; Lewis, B. Architecture Centric Virtual Integration Process (ACVIP): A Key Component of the DoD Digital Engineering Strategy; Technical Report; Carnegie-Mellon University: Pittsburgh, PA, USA, 2019. [Google Scholar]
- Weilkiens, T.; Scheithauer, A.; Di Maio, M.; Klusmann, N. Evaluating and comparing MBSE methodologies for practitioners. In Proceedings of the 2016 IEEE International Symposium on Systems Engineering (ISSE), Edinburgh, UK, 3–5 October 2016; pp. 1–8. [Google Scholar]
- Kaukewitsch, C.; Papist, H.; Zeller, M.; Rothfelder, M. Automatic generation of RAMS analyses from model-based functional descriptions using UML state machines. In Proceedings of the 2020 Annual Reliability and Maintainability Symposium (RAMS), Palm Springs, CA, USA, 27–30 January 2020; pp. 1–6. [Google Scholar]
- Kosempel, J.; O’Halloran, B.; Van Bossuyt, D. Toward a reliability approach decision support tool for early system design: Physics of failure vs. historical failure data. In Proceedings of the 18th Annual Conference on Systems Engineering Research, Marseille, France, 19–21 March 2020. [Google Scholar]
- O’Halloran, B.M.; Papakonstantinou, N.; Van Bossuyt, D.L. Modeling of function failure propagation across uncoupled systems. In Proceedings of the 2015 Annual Reliability and Maintainability Symposium (RAMS), Palm Harbor, FL, USA, 26–29 January 2015; pp. 1–6. [Google Scholar] [CrossRef]
- Pillai, P.; Kaushik, A.; Bhavikatti, S.; Roy, A.; Kumar, V. A hybrid approach for fusing physics and data for failure prediction. Int. J. Progn. Health Manag. 2016, 7, 1–12. [Google Scholar] [CrossRef]
- Van Bossuyt, D.L.; O’Halloran, B.M.; Morningstar, M. Stored System Inherent Availability Optimization from a System of Systems Physics of Failure Perspective. In Proceedings of the 2019 14th Annual Conference System of Systems Engineering (SoSE), Anchorage, AK, USA, 19–22 May 2019; pp. 364–369. [Google Scholar] [CrossRef]
- O’Halloran, B.M.; Papakonstantinou, N.; Giammarco, K.; Van Bossuyt, D.L. A Graph Theory Approach to Functional Failure Propagation in Early Complex Cyber-Physical Systems (CCPSs). INCOSE Int. Symp. 2017, 27, 1734–1748. [Google Scholar] [CrossRef]
- Van Bossuyt, D.L.; Arlitt, R.M. A Functional Failure Analysis Method of Identifying and Mitigating Spurious System Emissions From a System of Interest in a System of Systems. J. Comput. Inf. Sci. Eng. 2020, 20, 054501. [Google Scholar] [CrossRef]
- Ye, F.; Kelly, T. Component failure mitigation according to failure type. In Proceedings of the 28th Annual International Computer Software and Applications Conference, 2004 COMPSAC, Hong Kong, China, 28–30 September 2004; Volume 1, pp. 258–264. [Google Scholar] [CrossRef] [Green Version]
- Ma, K.; Wang, H.; Blaabjerg, F. New Approaches to Reliability Assessment: Using physics-of-failure for prediction and design in power electronics systems. IEEE Power Electron. Mag. 2016, 3, 28–41. [Google Scholar] [CrossRef]
- Li, H.; Huang, H.Z.; Li, Y.F.; Zhou, J.; Mi, J. Physics of failure-based reliability prediction of turbine blades using multi-source information fusion. Appl. Soft Comput. 2018, 72, 624–635. [Google Scholar] [CrossRef]
- Senouci, A.; Elabbasy, M.; Elwakil, E.; Abdrabou, B.; Zayed, T. A model for predicting failure of oil pipelines. Struct. Infrastruct. Eng. 2014, 10, 375–387. [Google Scholar] [CrossRef]
- Hayes, J.; Zhao, L. Maintainability prediction: A regression analysis of measures of evolving systems. In Proceedings of the 21st IEEE International Conference on Software Maintenance (ICSM’05), Budapest, Hungary, 26–29 September 2005; pp. 601–604. [Google Scholar] [CrossRef]
- Kumar, L.; Rath, S.K. Software maintainability prediction using hybrid neural network and fuzzy logic approach with parallel computing concept. Int. J. Syst. Assur. Eng. Manag. 2017, 8, 1487–1502. [Google Scholar] [CrossRef]
- Van Koten, C.; Gray, A. An application of Bayesian network for predicting object-oriented software maintainability. Inf. Softw. Technol. 2006, 48, 59–67. [Google Scholar] [CrossRef] [Green Version]
- Olatunji, S.; Rasheed, Z.; Sattar, K.; Al-Mana, A.; Alshayeb, M.; El-Sebakhy, E. Extreme learning machine as maintainability prediction model for object-oriented software systems. J. Comput. 2010, 2, 49–56. [Google Scholar]
- Zaki, R.; Barabadi, A.; Qarahasanlou, A.N.; Garmabaki, A. A mixture frailty model for maintainability analysis of mechanical components: A case study. Int. J. Syst. Assur. Eng. Manag. 2019, 10, 1646–1653. [Google Scholar] [CrossRef] [Green Version]
- Ebeling, C.E. An Introduction to Reliability and Maintainability Engineering; Tata McGraw-Hill Education: New York, NY, USA, 2004. [Google Scholar]
- Kececioglu, D. Reliability Engineering Handbook; DEStech Publications, Inc.: Lancaster, PA, USA, 1991; Volume 2. [Google Scholar]
- O’Connor, P.; Kleyner, A. Practical Reliability Engineering; John Wiley & Sons: Hoboken, NJ, USA, 2012. [Google Scholar]
- Xing, L.; Amari, S.V. Fault tree analysis. In Handbook of Performability Engineering; Springer: Berlin/Heidelberg, Germany, 2008; pp. 595–620. [Google Scholar]
- Dugan, J.B.; Bavuso, S.J.; Boyd, M.A. Fault trees and Markov models for reliability analysis of fault-tolerant digital systems. Reliab. Eng. Syst. Saf. 1993, 39, 291–307. [Google Scholar] [CrossRef]
- Berres, A.; Post, K.; Armonas, A.; Hecht, M.; Juknevičius, T.; Banham, D. OMG RAAML standard for model-based Fault Tree Analysis. Incose Int. Symp. Wiley Online Libr. 2021, 31, 1349–1362. [Google Scholar] [CrossRef]
- Cushing, M.J.; Long, E.A.; Hockenberry, M. Development of reliability program standard GEIA-STD-0009. In Proceedings of the 2009 Annual Reliability and Maintainability Symposium, Fort Worth, TX, USA, 26–29 January 2009; pp. 298–303. [Google Scholar]
- Grieves, M. Digital twin: Manufacturing excellence through virtual factory replication. White Pap. 2014, 1, 1–7. [Google Scholar]
- Madni, A.M.; Madni, C.C.; Lucero, S.D. Leveraging digital twin technology in model-based systems engineering. Systems 2019, 7, 7. [Google Scholar] [CrossRef] [Green Version]
- Tao, F.; Zhang, H.; Liu, A.; Nee, A.Y.C. Digital Twin in Industry: State-of-the-Art. IEEE Trans. Ind. Inform. 2019, 15, 2405–2415. [Google Scholar] [CrossRef]
- Boschert, S.; Rosen, R. Digital twin—The simulation aspect. In Mechatronic Futures; Springer: Berlin/Heidelberg, Germany, 2016; pp. 59–74. [Google Scholar]
- Bickford, J.; Van Bossuyt, D.L.; Beery, P.; Pollman, A. Operationalizing digital twins through model-based systems engineering methods. Syst. Eng. 2020, 23, 724–750. [Google Scholar] [CrossRef]
- Friedenthal, S.; Izumi, L.; Meilich, A. 9.2. 2 Object-Oriented Systems Engineering Method (OOSEM) applied to Joint Force Projection (JFP), a Lockheed Martin Integrating Concept (LMIC). Incose Int. Symp. Wiley Online Libr. 2007, 17, 1471–1491. [Google Scholar] [CrossRef]
- David, P.; Idasiak, V.; Kratz, F. Improving reliability studies with SysML. In Proceedings of the 2009 Annual Reliability and Maintainability Symposium, Fort Worth, TX, USA, 26–29 January 2009; pp. 527–532. [Google Scholar]
- Madni, A.M.; Boehm, B.; Erwin, D.A.; Moghaddam, M.; Sievers, M.; Wheaton, M.J. (Eds.) Quantitative System Reliability and Availability Analysis Using SysML; The Aerospace Corporation: El Segundo, CA, USA, 2020. [Google Scholar]
- De Andrade Melani, A.H.; de Souza, G.F.M. Obtaining Fault Trees Through SysML Diagrams: A MBSE Approach for Reliability Analysis. In Proceedings of the 2020 Annual Reliability and Maintainability Symposium (RAMS), Palm Springs, CA, USA, 27–30 January 2020; pp. 1–5. [Google Scholar]
- Huang, Z.; Swalgen, S.; Davidz, H.; Murray, J. MBSE-assisted FMEA approach—Challenges and opportunities. In Proceedings of the 2017 Annual Reliability and Maintainability Symposium (RAMS), Orlando, FL, USA, 23–26 January 2017; pp. 1–8. [Google Scholar]
- Jurgen, R. 2002-01-0476 Model-Based Architecting for Reliability, Availability, and Maintainability Software in Automotive Applications. In Electronic Engine Control Technologies; Society of Automotive Engineers: Warrendale, PA, USA, 2004; pp. 506–511. [Google Scholar]
- Odita, T.; Louise-Caballes, M.; Chen, G. Implementation of MBSE Approach for Developing Reliability Model to Ensure Robustness of Sounding Rocket Program Using MADe Modeling Tool. In Proceedings of the 9th Annual World Conference of the Society for Industrial and Systems Engineering, Johor Bahru, Malaysia, 13–15 September 2020; pp. 1–8. [Google Scholar]
- Zhang, J.; Haskins, C.; Liu, Y.; Lundteigen, M.A. A systems engineering–based approach for framing reliability, availability, and maintainability: A case study for subsea design. Syst. Eng. 2018, 21, 576–592. [Google Scholar] [CrossRef] [Green Version]
- Banner-Bacin, L.; Carpenter, T.; Chacon, D.; Chandler, J.; Childs, J.; Hoang, T.; Howard, R.; Isaian, J.; Kang, S.; Kinberg, M.; et al. Application of model based systems engineering methods to development of combat system architectures. Master’s Thesis, Naval Postgraduate School, Monterey, CA, USA, 2009. [Google Scholar]
- Vaneman, W. Model Based Systems Engineering De-Mystified. Available online: https://www.youtube.com/watch?v=douEMf6LKA8 (accessed on 15 October 2020).
- Hosseini, H.N.; Welo, T. A framework for integrating reliability and systems engineering: Proof-of-concept experiences. Incose Int. Symp. Wiley Online Libr. 2016, 26, 1059–1073. [Google Scholar] [CrossRef]
- Cantor, M. Rational Unified Process® for Systems Engineering, RUP SE® Version 2.0; IBM Rational Software White Paper; IBM Corporation: Endicott, NY, USA, 2003. [Google Scholar]
- Gibbs, R.D. Project Management with the IBM Rational Unified Process: Lessons from the Trenches; Prentice Hall Professional: Hoboken, NJ, USA, 2006. [Google Scholar]
- Rechtin, E.; Maier, M.W. The Art of Systems Architecting; CRC Press: Boca Raton, FL, USA, 2010. [Google Scholar]
- O’Halloran, B.M.; Papakonstantinou, N.; Giammarco, K.; Van Bossuyt, D.L. A graph theory approach to predicting functional failure propagation during conceptual systems design. Syst. Eng. 2021, 24, 100–121. [Google Scholar] [CrossRef]
- Clausing, D.; Frey, D.D. Improving system reliability by failure-mode avoidance including four concept design strategies. Syst. Eng. 2005, 8, 245–261. [Google Scholar] [CrossRef]
- Yang, K.; El-Haik, B.S. Design for Six Sigma: A Roadmap for Product Development; McGraw-Hill Education: New York, NY, USA, 2009. [Google Scholar]
- Dori, D. Object-process methodology. In Encyclopedia of Knowledge Management, 2nd ed.; IGI Global: Pennsylvania, PA, USA, 2011; pp. 1208–1220. [Google Scholar]
- Min, B.I.; Kerzhner, A.A.; Paredis, C.J. Process integration and design optimization for model-based systems engineering with SysML. In Proceedings of the International Design Engineering Technical Conferences and Computers and Information in Engineering Conference, Washington, DC, USA, 28–31 August 2011; Volume 54792, pp. 1361–1369. [Google Scholar]
- Sommerville, I. Integrated requirements engineering: A tutorial. IEEE Softw. 2005, 22, 16–23. [Google Scholar] [CrossRef]
- SysML.org. SysML FAQ: What Is a Block Definition Diagram (BDD) and How Is It Used? Available online: https://sysml.org/sysml-faq/what-is-block-definition-diagram.html (accessed on 7 June 2021).
- No Magic. SysML Block Definition Diagram. Available online: https://docs.nomagic.com/display/SYSMLP190/SysML+Block+Definition+Diagram (accessed on 7 March 2022).
- Dassault Systems. Cameo Enterprise Architecture 19.0 SP4. Available online: https://www.3ds.com/products-services/catia/products/no-magic/cameo-enterprise-architecture/ (accessed on 14 January 2021).
- O’Connor, P. Introduction to Reliability Engineering; No. of Pages 400. Price: £52.75 (UK); EE Lewis, Wiley: New York, NY, USA, 1987. [Google Scholar]
- Aly, M.F.; Afefy, I.H.; Abdel-Magied, R.K.; Elhalim, E. A comprehensive model of reliability, availability, and maintainability (RAM) for industrial systems evaluations. JJMIE 2018, 12, 59–67. [Google Scholar]
- Feiler, P.H.; Lewis, B.A.; Vestal, S. The SAE Architecture Analysis & Design Language (AADL) a standard for engineering performance critical systems. In Proceedings of the 2006 IEEE Conference on Computer Aided Control System Design, 2006 IEEE International Conference on Control Applications, 2006 IEEE International Symposium on Intelligent Control, Munich, Germany, 4–6 October 2006; pp. 1206–1211. [Google Scholar]
- Kapos, G.D.; Dalakas, V.; Nikolaidou, M.; Anagnostopoulos, D. An integrated framework for automated simulation of SysML models using DEVS. Simulation 2014, 90, 717–744. [Google Scholar] [CrossRef]
- Hecht, M.; Chuidian, A.; Tanaka, T.; Raymond, R. Automated Generation of FMEAs using SysML for Reliability, Safety, and Cybersecurity. In Proceedings of the 2020 Annual Reliability and Maintainability Symposium (RAMS), Palm Springs, CA, USA, 27–30 January 2020; pp. 1–7. [Google Scholar]
- Pedersen, K.; Emblemsvag, J.; Bailey, R.; Allen, J.; Mistree, F. The ’Validation Square’—Validating Design Methods. In Proceedings of the ASME Design Theory and Methodology Conference Citeseer, Irvine, CA, USA, 18–22 August 2000. [Google Scholar]
Figure 1.
Seven-step methodology.

Figure 2.
Fuel system diagram.

Figure 3.
Block definition diagram of fuel turbine system.

Figure 4.
Fault tree of fuel system failures.
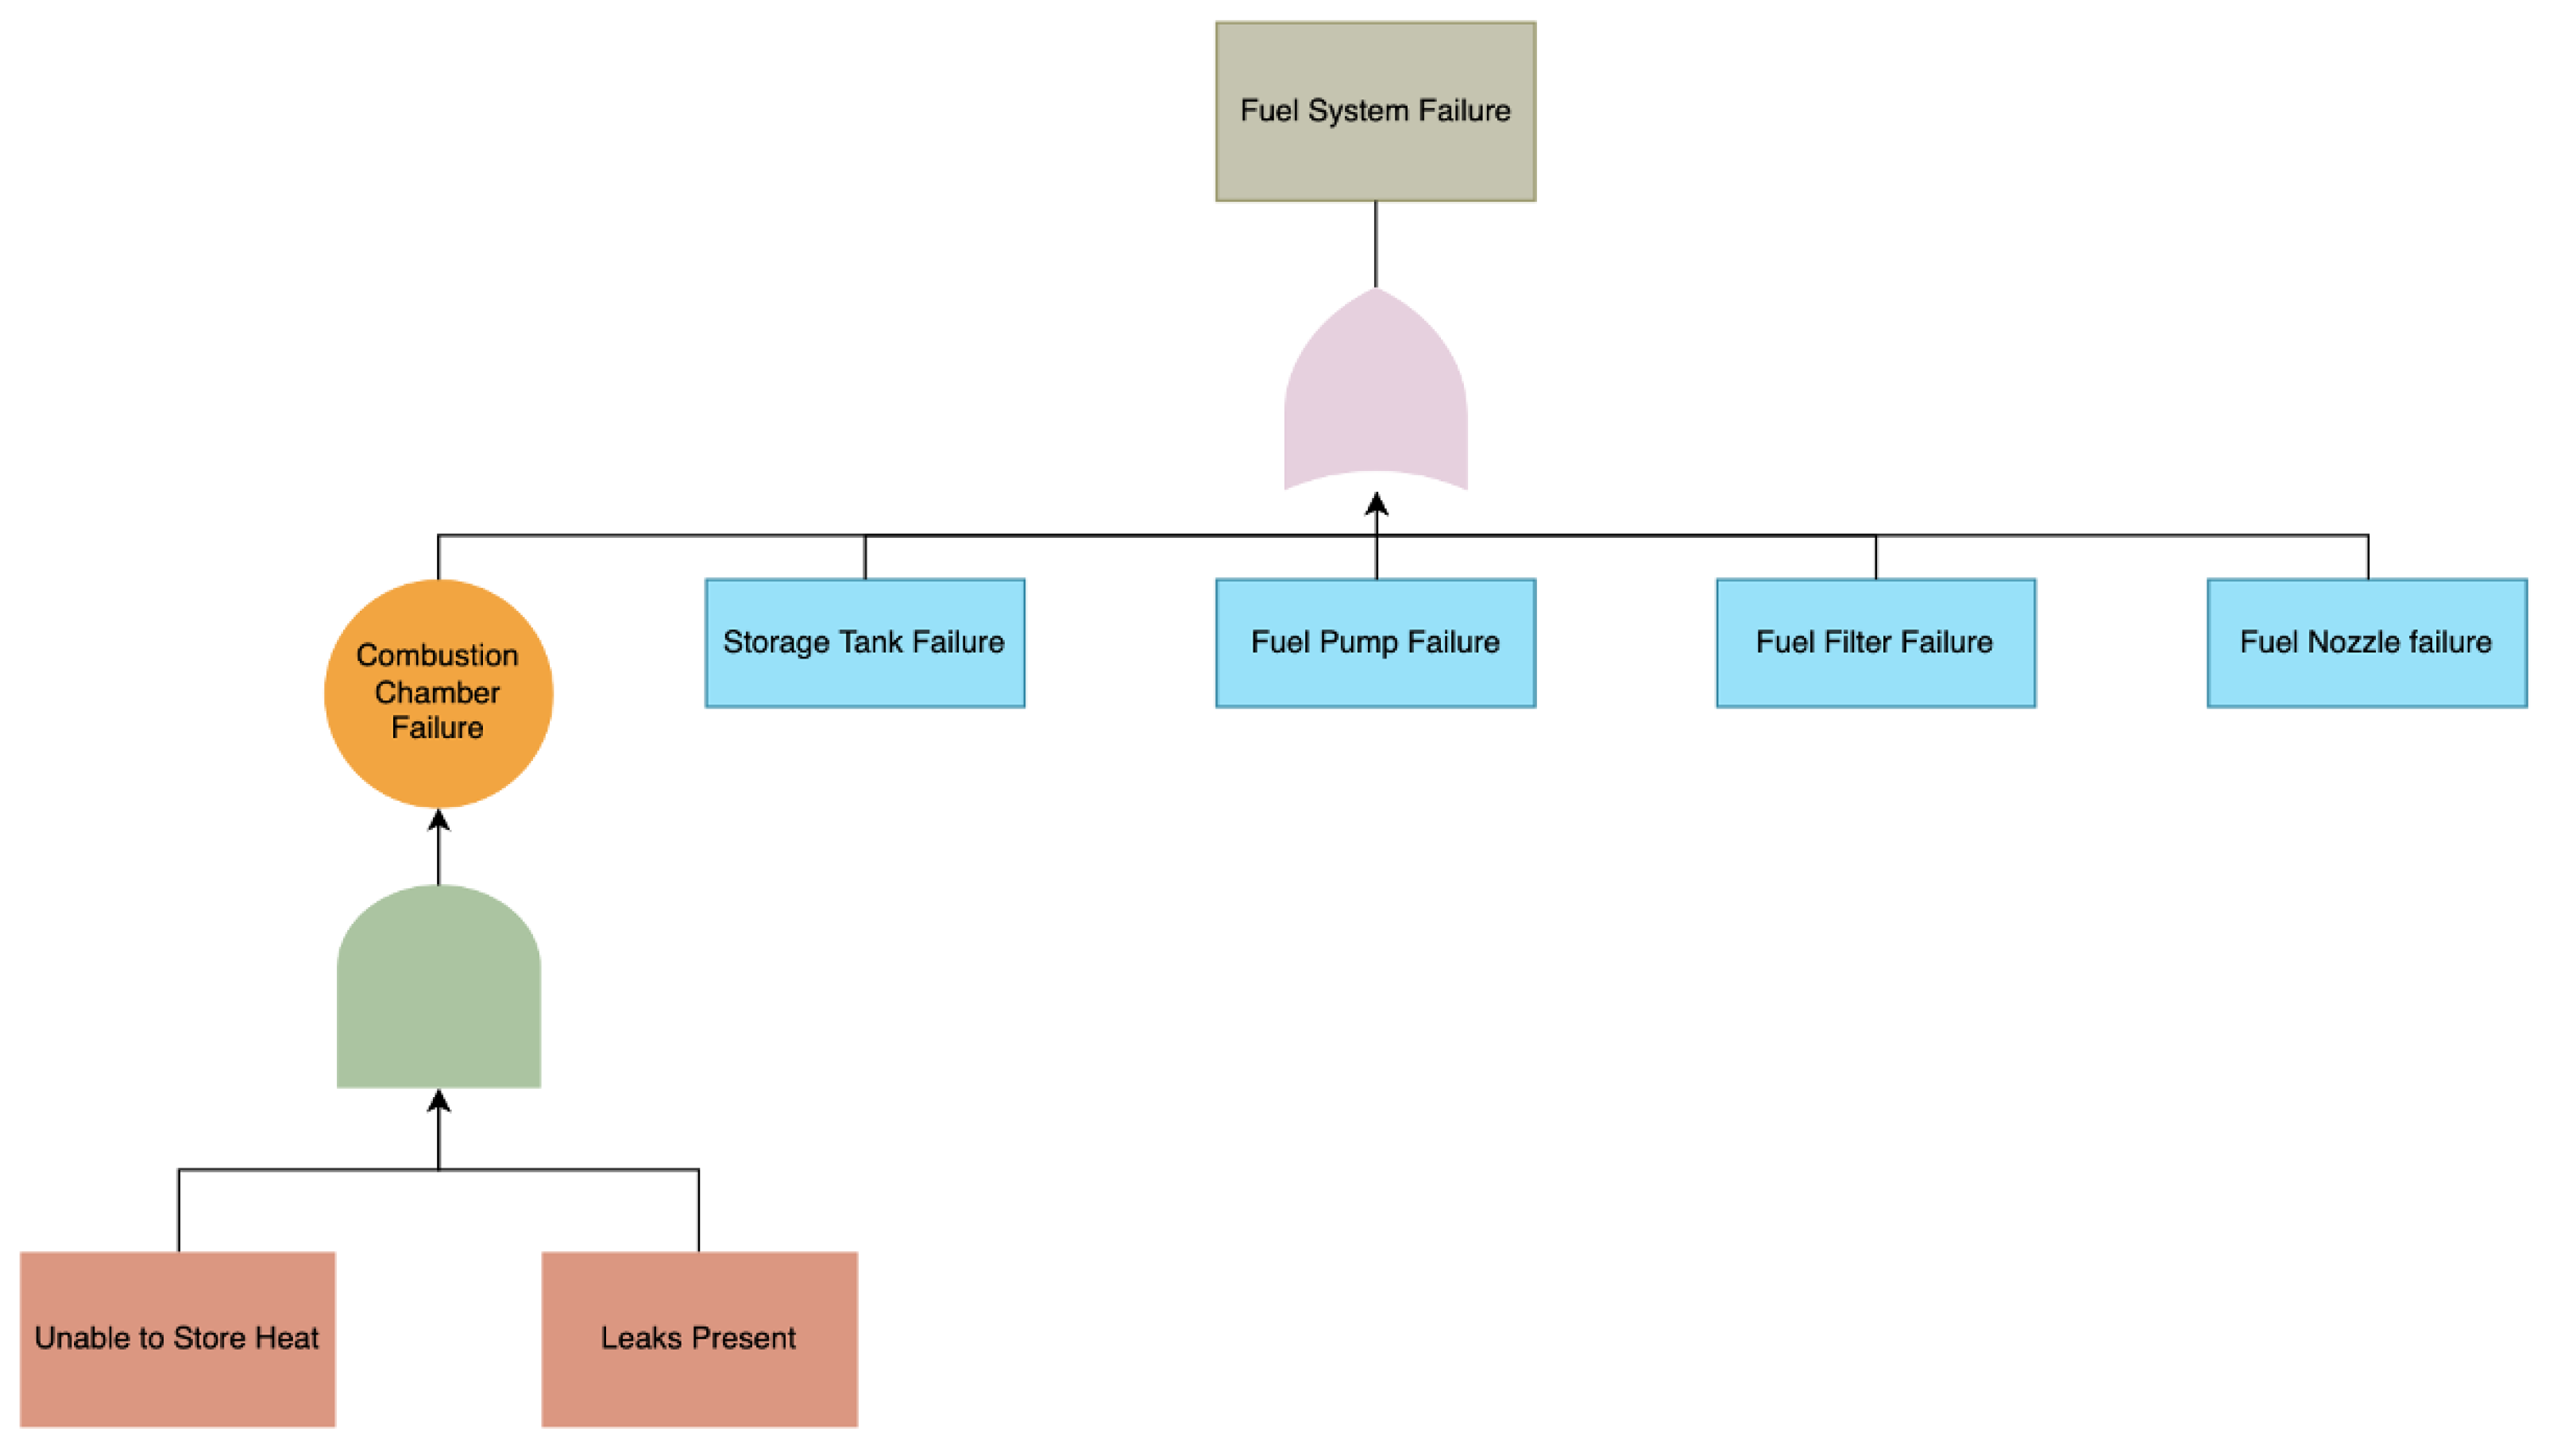
Figure 5.
Parametric diagram of fuel turbine system showing 3-of-4 system reliability.

Figure 6.
Parametric diagram of fuel turbine system showing system reliability with turbine inputs.
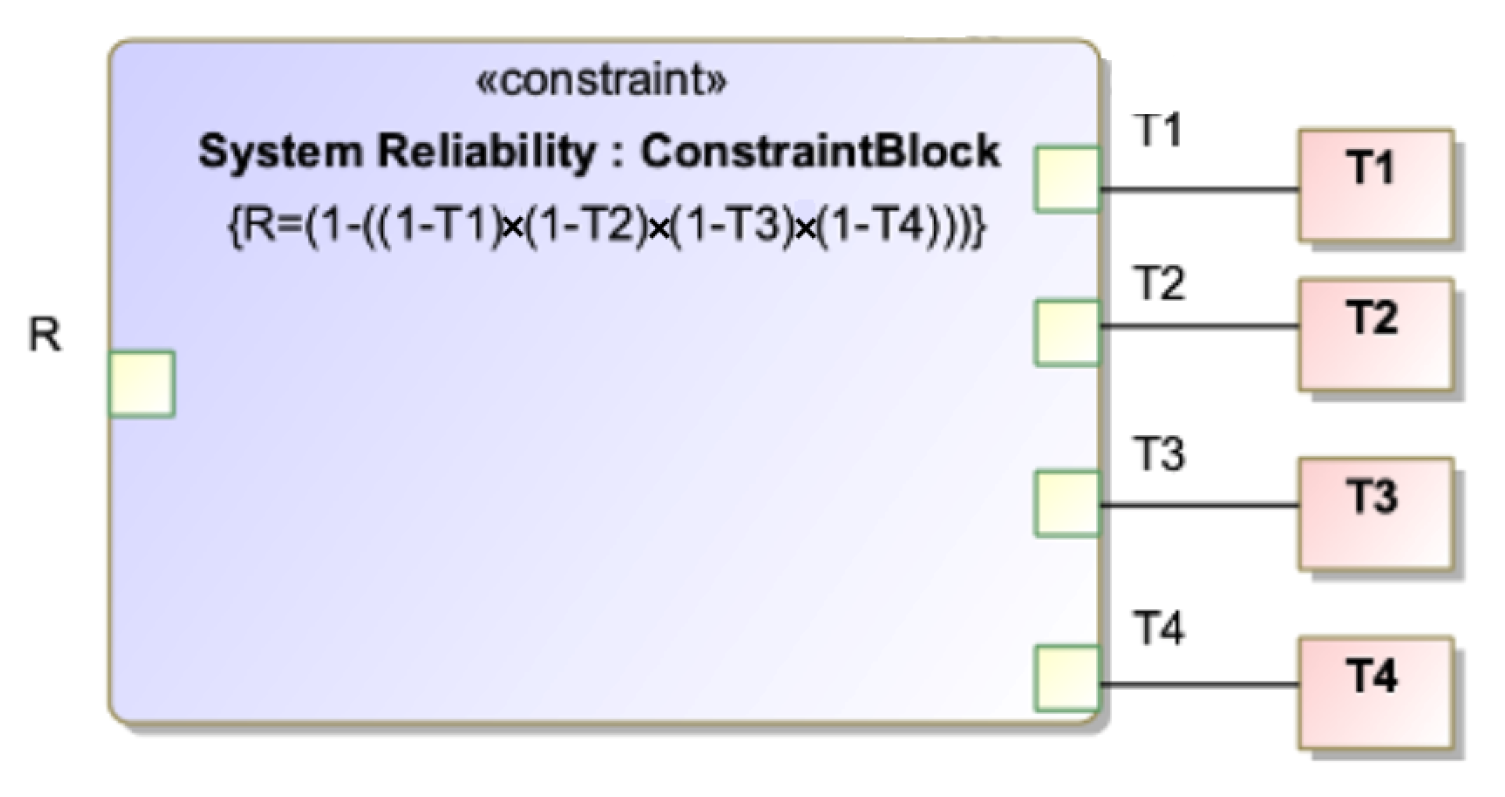

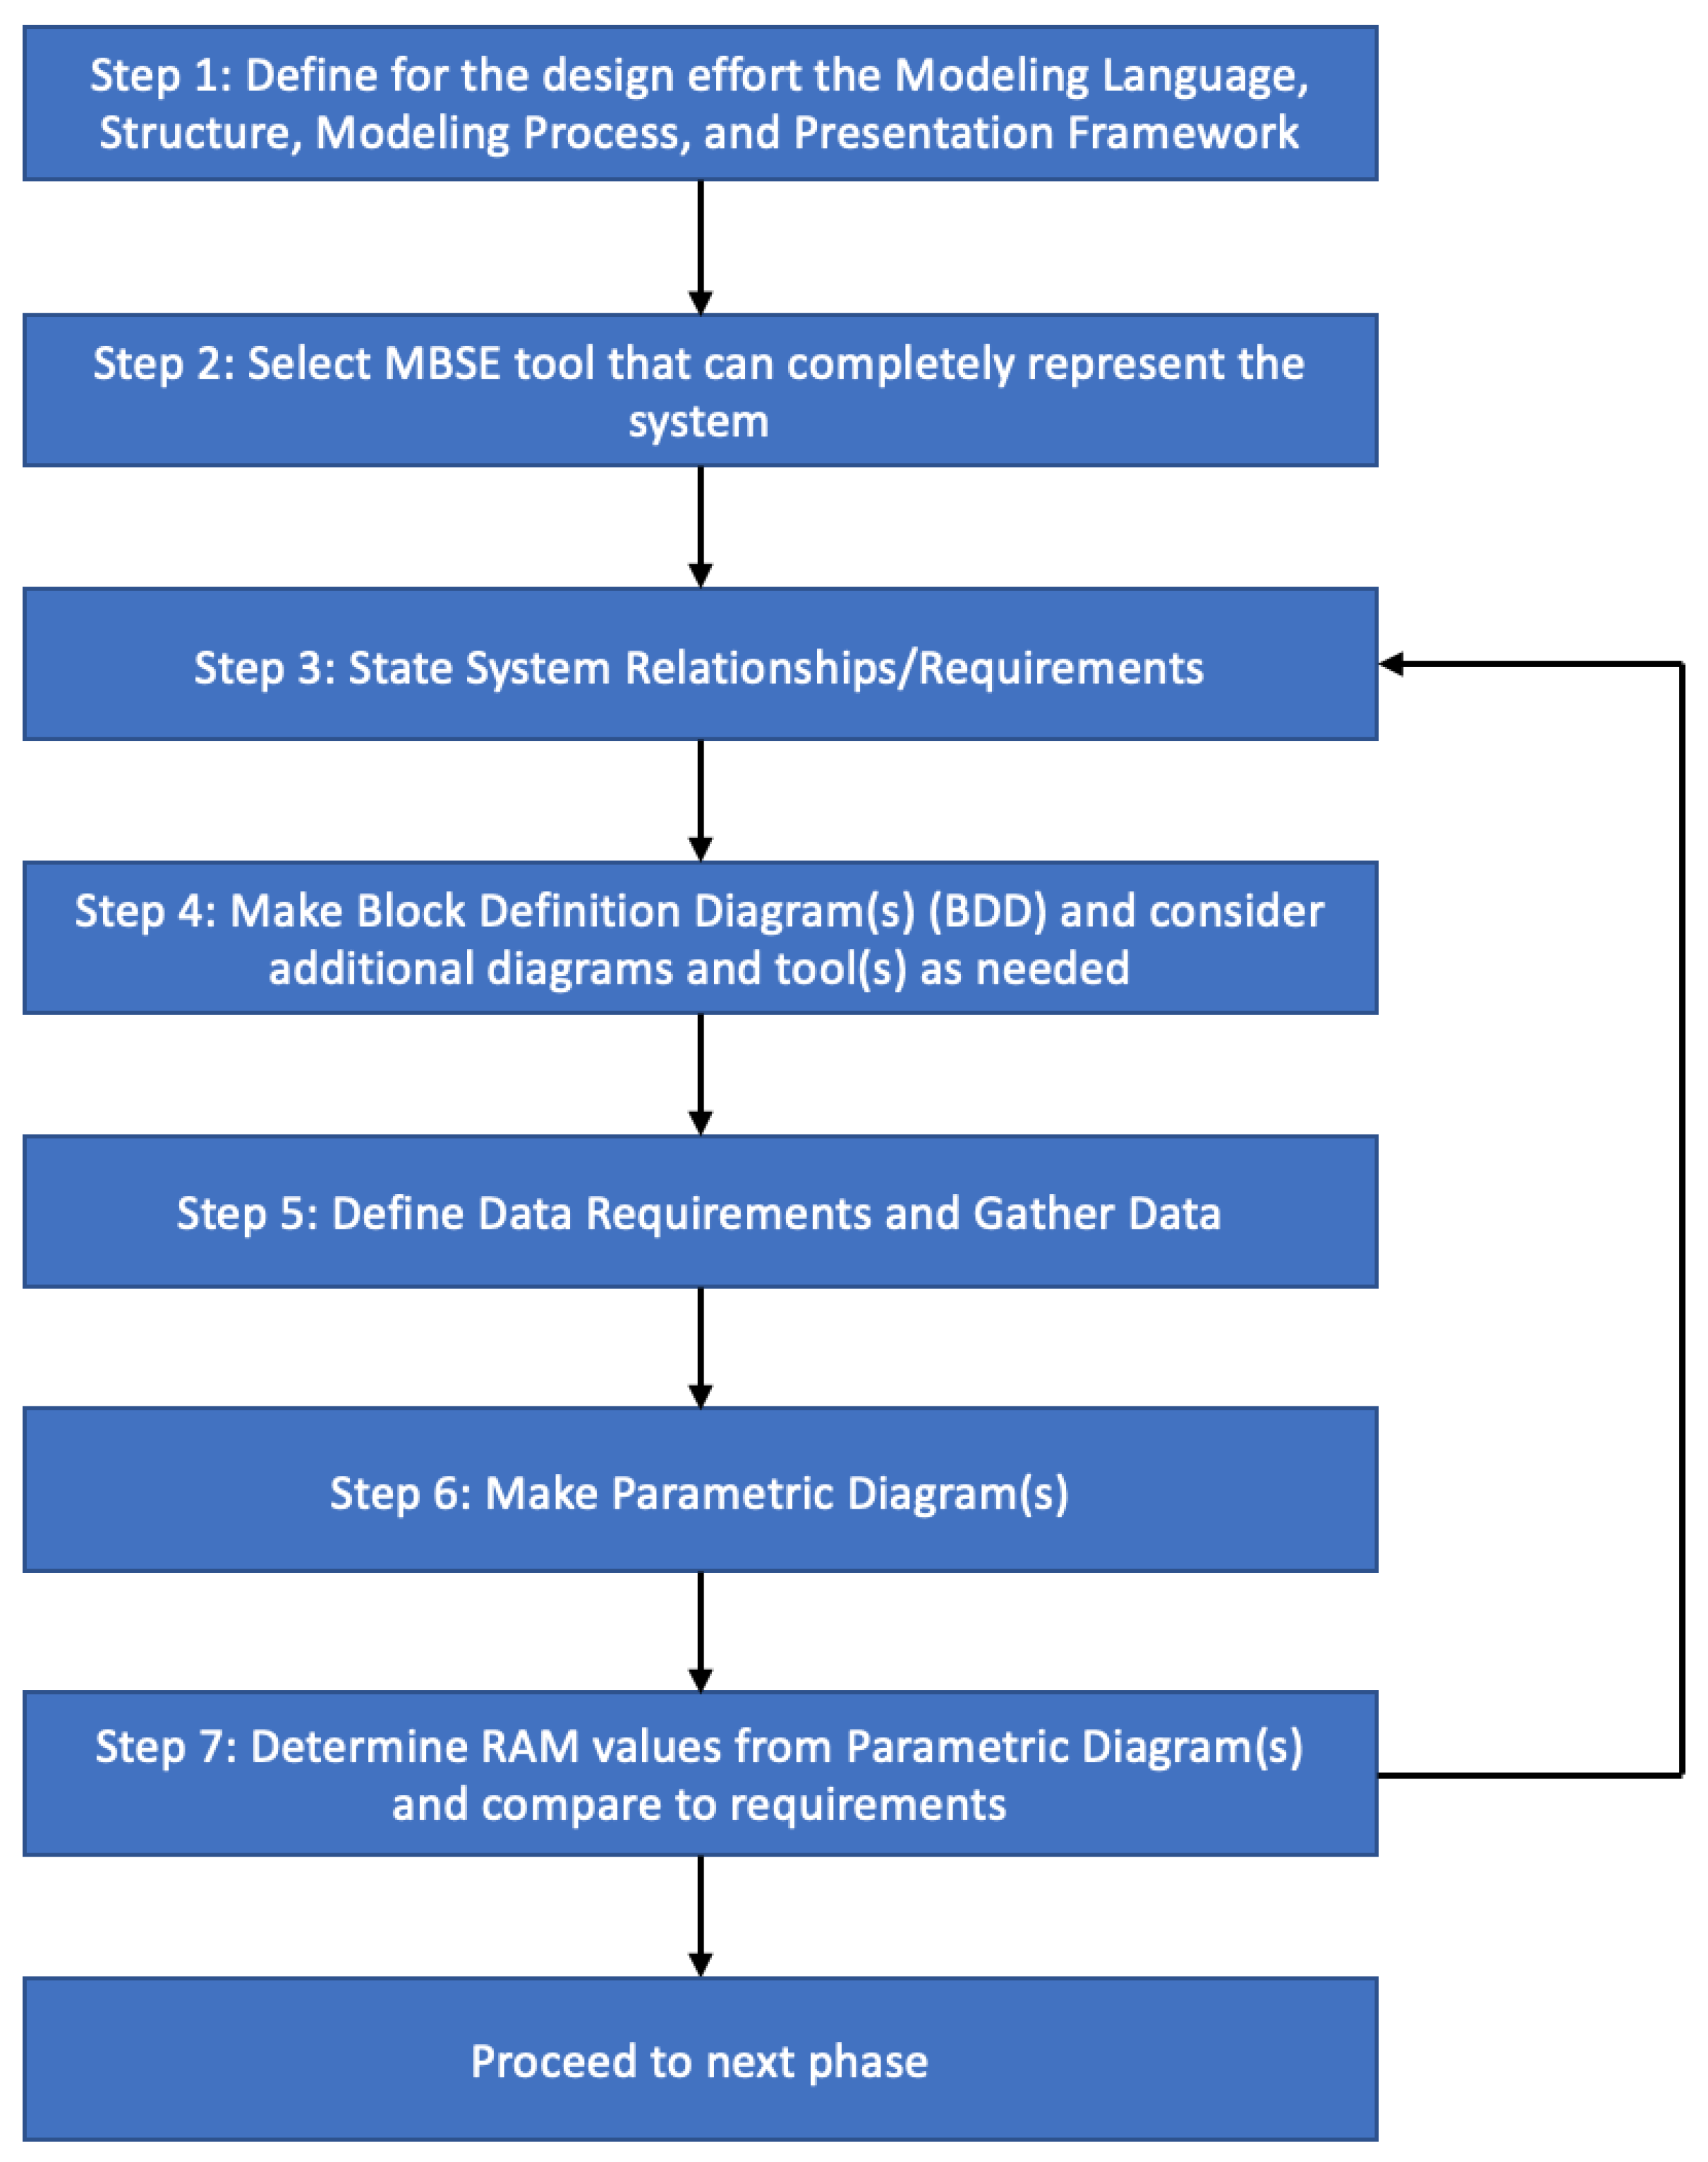
Table 1.
Pugh matrix of selected MBSE methodologies.
| Criteria | Proposed Methodology | RAAML | ACVIP | OPM | OOSEM |
|---|---|---|---|---|---|
| Accessibility | 2 | 1 | 1 | 2 | 1 |
| Ease of Use | 2 | 0 | 0 | 1 | 1 |
| Complex System | 2 | 2 | 2 | 2 | 2 |
| Database Integration | 1 | 1 | 0 | 0 | 1 |
| Total | 7 | 4 | 3 | 5 | 5 |
Table 2.
Examples of modeling languages, processes, frameworks, and MBSE tools.
| Languages | Processs | Frameworks | Tools |
|---|---|---|---|
| IDEF | AGILE | DODAF | Cameo Systems Modeller, CORE |
| OPM | Vee | FAS | Rational Rhapsody, Innoslate, OPM |
| SysML | Waterfall | DAF | SParx Enterprise Architect |
| UML | Spiral | UAF | Visual Paradigm |
Table 3.
Reliability engineer requirements.
| Need | Determine reliability of a turbine fuel system with fault tree and associated SysML diagrams. (3-out-of-4) |
| Basic Flow | A reliability engineer is tasked with determining the reliability for a turbine fuel system. The reliability engineer must also produce a fault tree and companion SysML diagrams that can describe component relationships with the overall system. The engineer will choose an MBSE tool (CEA) that will best describe the system. This tool will then be used to create the SysML diagrams to make the fault tree. A parametric diagram will be made in CEA to calculate the reliability of the system. |
| Subject Area | Reliability analysis. |
| Trigger | Determine design requirements of system. |
Table 4.
Illustrative example requirements.
| Requirement 1 | The reliability of the steam turbine fuel system (3-out-of-4) shall be greater than or equal to 90%. |
| Requirement 2 | The availability of the steam turbine fuel system shall be greater than 90%. |
| Requirement 3 | Fault tree diagram shows accurate relationships of system components. |
Table 5.
Equipment failures for fuel system.
| Storage Tank | Fuel Pump | Fuel Filter | Fuel Nozzle | Combustion Chamber |
|---|---|---|---|---|
| Corrosion | Contamination | Clogged | Contamination | Solenoid Valve Malfunction |
| Improper Construction | Overheating | Damaged | Improper Atomization Pattern | Clogged Main Burner Atomizer |
| Poor Maintenance | Wear | Incorrect Filter Type | Improper Nozzle Installed | Degraded Chamber Material |
| Excessive Pressure Due to Overfilling | Electrical Fault | Improper Alignment | Carbon Build-Up | Holes in Chamber |
Table 6.
Collected historical data for year of 2015.
| Turbine Number | Number of Failures | Repair Time (h) | Operating Time (h) |
|---|---|---|---|
| T1 | 11 | 88 | 6471 |
| T2 | 8 | 53 | 6509 |
| T3 | 6 | 38 | 6526 |
| T4 | 9 | 105 | 6456 |
Table 7.
Failure and repair rates for year of 2015.
| Turbine Number | Failure Rate | Repair Rate |
|---|---|---|
| T1 | 0.0017 | 0.125 |
| T2 | 0.0012 | 0.15 |
| T3 | 0.001 | 0.15 |
| T4 | 0.0014 | 0.08 |
Table 8.
Parametric equation results.
| @time t | 100 h |
|---|---|
| 3-out-of-4 Reliability | 0.93 |
| Availability | 0.99 |
Table 9.
Number of failures and associated states.
| No. of Failures | Probability of Each State |
|---|---|
| 0-item failures | 59% |
| 1-item failures | 34% |
| 2-item failures | 5% |
| 3-item failures | 1.8% |
| 4-item failures | 0.2% |
Table 10.
Parametric equation results for t @1000 h.
| @time t | 1000 h |
|---|---|
| 3-out-of-4 Reliability | 0.31 |
| Availability | 0.99 |
Publisher’s Note: MDPI stays neutral with regard to jurisdictional claims in published maps and institutional affiliations. |
© 2022 by the authors. Licensee MDPI, Basel, Switzerland. This article is an open access article distributed under the terms and conditions of the Creative Commons Attribution (CC BY) license (https://creativecommons.org/licenses/by/4.0/).
Share and Cite
MDPI and ACS Style
Diatte, K.; O’Halloran, B.; Van Bossuyt, D.L. The Integration of Reliability, Availability, and Maintainability into Model-Based Systems Engineering. Systems 2022, 10, 101. https://doi.org/10.3390/systems10040101
AMA Style
Diatte K, O’Halloran B, Van Bossuyt DL. The Integration of Reliability, Availability, and Maintainability into Model-Based Systems Engineering. Systems. 2022; 10(4):101. https://doi.org/10.3390/systems10040101
Chicago/Turabian StyleDiatte, Kyle, Bryan O’Halloran, and Douglas L. Van Bossuyt. 2022. "The Integration of Reliability, Availability, and Maintainability into Model-Based Systems Engineering" Systems 10, no. 4: 101. https://doi.org/10.3390/systems10040101
Note that from the first issue of 2016, this journal uses article numbers instead of page numbers. See further details here.