1. Introduction
As of the third quarter of 2021, institutional investors in China’s securities market accounted for 47.4%; as a comparison, institutional investors in the US securities market accounted for 63.6%, and institutional investors in the German securities market accounted for 87%. Due to factors such as a low degree of specialization, a small amount of funds, and lagging information, individual investors are greatly affected by investor sentiment, and the market systemic risks brought about by the polarization of investor sentiment cannot be ignored. Therefore, exploring the polarization of investor sentiment under the influence of sudden financial events is conducive to intervention in advance, which is of great practical significance for alleviating abnormal fluctuations in the financial market and constructing a long-term stable market mechanism.
The traditional theory of finance based on the efficient market hypothesis believes that investors in the market are rational and can make rational decisions based on public information; however, because investors in the real market are bounded by rationality, many of the visions brought about by it cannot be explained by traditional financial theory, so the theory of behavioral finance came into being. In the field of behavioral finance, investor sentiment is a major embodiment of its limited rationality, which has attracted the attention of researchers. In particular, the development of noise trading theory provides an important reference for the study of the investment behavior of finite rational investors. Nevertheless, most of the current research stays in the theoretical analysis and investment expectation analysis of noise trading behavior, and there is a lack of in-depth research on the transmission mechanism of investor sentiment implied by noise trading, which fails to explain the polarization of investors’ emotions well.
Aiming at the above problems, this paper takes the transmission mechanism and influencing factors of the polarization phenomenon of investor sentiment as the starting point, and selects the B–A scale-free network and the J–A model as the logical basis for simulating the interaction of investor sentiment. On this basis, to fit the special emotional transmission mechanism of the financial market, combined with the multi-agent system and the DSSW model as the research method, the investor sentiment polarization model is creatively constructed to study the evolution of investor sentiment under the impact of sudden financial events, and to provide a reference for the guidance and control of investor sentiment.
Based on this, the first section first summarizes the research status, then summarizes the current representative B–A scale-free network and J–A model research in the field of public opinion evolution, and finally summarizes the development of noise trading theory and its application in China’s financial market. The second section introduces the research methods used in this study, including the B–A scale-free network, the J–A model, the multi-agent system, and the DSSW model. The third section constructs the investor sentiment polarization model. The fourth section conducts a simulation test based on the investor sentiment polarization model and obtains the transmission mechanism and influencing factors of the investor sentiment polarization phenomenon. The fifth section deduces the evolution law of investor sentiment through simulation, and examines the influence of different parameters on the model. The sixth section further examines the validity of the model by applying it in an example. The seventh section summarizes the actual situation of the financial market and puts forward targeted policy recommendations.
2. Literature Review
This paper combines the field of public opinion evolution with behavioral finance. In the field of public opinion evolution, the J–A model and the B–A network are the basic theories of individual interaction, and have a high degree of adaptability for simulating real-world scenarios. In the field of behavioral finance, this paper focuses on the impact of capitalist sentiment on the securities market; it therefore adopts a representative noise trading theory. On this basis, this paper searches the relevant literature for the following review.
2.1. J–A Model
The classic J–A model refers to a new social attitude judgment model proposed by Jager and Amblard [
1], in which the authors introduced agent agents to study the dynamics of group attitude changes; the conclusion showed that the subject’s attitude changed depending on the location of the persuasive information it received, resulting in neutral, assimilation, or alienation effects, which in turn affected the consensus reached by different subjects, or caused two-level differentiation of attitudes. Del et al. [
2] explored the structural evolution of communities of interest by analyzing user reviews; the findings suggested that Facebook users tend to choose the information that fits their belief system and form polarized groups. Wang et al. [
3] established a dynamic mechanism of group polarization, and studies have shown that groups on the internet are gathered because of similar preferences, and the netizens within the network showed strong homogeneity with each other; the netizens of different websites showed heterogeneity, which was a major inducement for the phenomenon of group identity. Gabbay et al. [
4] presented a very novel explanation for the theory of the polarization effect of groups, that is, continuous discussion between like-minded individuals could lead to a change in individual attitudes to extremes, which challenged the existing polarization theory. Abeles et al. [
5] focused on the change of subject attitudes and found that when people’s views were consistent with the elites of the group, people could perceive the views of others in a way consistent with the hypothetical similarity within the group and the differences outside the group, and if there was a deviation in the opinion, people could face cognitive problems. Based on the idea of the J–A model, Chen et al. [
6] created a new public opinion polarization model, introduced dynamic herd and individual heterogeneity, and analyzed the influence of dynamic integration and heterogeneity on public opinion polarization.
2.2. B–A Scale-Free Network Model
The classic B–A scale-free network refers to the scale-free network model proposed by Barabasi and Albert [
7] that conforms to the power–law distribution. The authors pointed out that the B–A scale-free network has two major structural foundations; one was the growth mechanism, and the other was the optimal connection mechanism. Gallos et al. [
8] found that the reaction−diffusion process of the scale-free network was qualitatively different from the lattice model, which exhibited fast reaction rates and reflected the absence of kinetic effects in the process. Muneer et al. [
9] studied the finite scale effect when the number of neighbors was different, based on the B–A scale-free network. In addition to this, the authors showed and explained the gaps in the distribution of the number of neighbors of node
i. Benyoussef et al. [
10] conducted a numerical study on the degree distribution of two interdependent B–A subnets. It turned out that when two existing B–A subnets were connected, the degree distribution obeyed a Gaussian distribution; however, when the connection was gradually established while forming two B–A subnets, the degree distribution obeyed the power–law distribution observed in the actual network. Jiang and Tan [
11] studied the scale-free network characteristics of enterprise clusters, and improved the classic B–A scale-free network model, so that enterprise clusters had a reliable control basis in the process of developing towards the established goals. Gu and Fan [
12] improved the evolutionary mechanism of adding new edges and deleting old edges on top of the basic B–A scale-free network model, making it more in line with the real-life network.
From the existing research, because the B–A scale-free network is more in line with the power–law distribution and has a high fit with most real-world networks, it has been widely used by scholars in the fields of enterprise clusters and immunization strategies of infectious diseases. However, there is less research in the financial field, so this paper is based on the classic B–A scale-free network model and analyzes and studies financial hot events.
2.3. Noise Trading Theory
The current research is positive about the impact of investor sentiment on the trend of the securities market. Since late in the last century, Bauman et al. have proposed that investment modeling should consider investor behavior; then the academic community has increasingly studied the influence of investor sentiment on investment, and the “prospect theory” proposed by Kahneman and Tversky [
13] has laid a solid foundation for subsequent research on investor sentiment. Through empirical analysis, Wang and Sun [
14] found that changes in investor sentiment significantly affected the returns of Shanghai and Shenzhen, and significantly reversed the fluctuations in their income, which is of great reference significance for the study of the application of investor sentiment theory in China’s securities market.
Given the weak effectiveness of China’s securities market, scholars have conducted in-depth research on noise traders and noise trading theory. Noise trading theory believes that a trader who trades based on a false subjective belief or information that has nothing to do with the fundamentals of the company is a noise trader and a rational arbitrageur who holds information in the corresponding market. Yang [
15] pointed out that the current noise trading phenomenon in China’s securities market was very serious, and could easily lead to abnormal market fluctuations. Alnafea et al. [
16], based their findings on the data of the Saudi stock exchange and concluded that the rise of investor sentiment could increase the enthusiasm of managers to conceal unfavorable news, thereby increasing the risk of a stock price crash. Hudson et al. [
17] based their conclusions on the empirical research of British mutual funds believed that investor sentiment could affect the herding behavior of institutional investors. Muhammad A. Cheema et al. [
18] concluded that there was a strong positive correlation between investor sentiment and the subsequent market returns through empirical research on the Chinese securities market.
At present, the conclusion that investor sentiment is positively correlated with the volatility of the securities market is unified, and the research based on the Chinese market believes that the impact of investor sentiment on the Chinese securities market is particularly strong, of which the noise trading theory is widely adopted. And it is almost unanimously believed that noise trading will aggravate abnormal fluctuations in the market and bring systemic risks.
2.4. Summary and Innovation
According to the above research review, we find that the current research on investor sentiment focuses on the impact of asset pricing and market systemic risk, but there is still a gap in the research on the evolutionary mechanism of investor sentiment. At the same time, the analysis of public opinion tends to take sudden public events as the starting point, which has a relatively limited perspective and does not pay attention to the externality effect of emotions in the securities market. In the classical J–A model, it is assumed that the change of individual emotion is the sum of arithmetic weights influenced by other individuals, but this assumption is not feasible in reality.
Therefore, first of all, this paper takes the evolution mechanism of investor sentiment as the research object and the impact of sudden financial events as the breakthrough point. Secondly, based on the classical J–A model and BA network, this paper integrates factors such as investor junction coefficient, investment expectations quantification point, and weighted variance of environmental sentiment, so that the optimized model can better depict the externality effect of investor sentiment evolution compared with conventional public opinion. In addition, since previous studies mostly focused on the interaction between nodes and ignored the characteristics of the network itself, this paper will introduce behavioral finance theory according to the network characteristics of noise propagation in practical financial events to improve the adaptability of the model to financial events.
3. Research Methods
3.1. B–A Scale-Free Network
Barabasi and Albert proposed a scale-free network model that conforms to the power–law distribution in 1999, referred to as the B–A scale-free network. The model is based on two major mechanisms: the first is the growth mechanism, and the B–A scale-free network is in a state of growing scale. The second is optimal connections, where nodes in the network tend to connect with nodes with higher degrees. For example, on the social platform, head users such as some financial media, experts, and scholars have greater influence, and can be called the core node in the network, and other netizens pay more attention to similar topic leaders. Based on the classic B–A scale-free network, this paper studies the interaction of individuals and the polarization of attitudes, which preserves the diversity of real networks, and the specification simplifies the interaction between individuals; it is also in line with the simulation environment required for this study.
3.2. J–A Model
Jager and Amblard proposed a new social attitude judgment model in 2005, referred to as the J–A model, which is widely used in the field of public opinion research. The core idea of this model is derived from the theory of social judgment, that is, the individual judges the received information by absorbing or comparing methods, and forms an attitude of acceptance, neutrality, or rejection. The J–A model concludes that subjects’ attitudes change depending on the position of the persuasive information they receive, producing neutral, assimilating, or alienating effects, which in turn affect consensus between different subjects or cause two-tier differentiation [
19,
20]. For example, speakers of extreme rhetoric in financial forums will temper their radical attitudes in constant discussion, or they will take a sharper side. This study starts from financial hotspot events, explores the phenomenon of public opinion polarization, and the research method adds the characteristics of financial event networks on the basis of the classical J–A model, and integrates factors such as individual relationships and attitude thresholds, so that the improved model is more suitable for research in the financial field.
3.3. Multi-Agent System
A multi-agent system is a system composed of multiple
Agents, and each
Agent interacts and coordinates with each other to efficiently solve control and management problems in complex systems [
21,
22]. The multi-agent system has the following three characteristics: first, each
Agent is independent and autonomous, and they can solve the given sub-tasks of the system as well as affect the system in a unique way; second, the task distribution, a task of the system, can be divided into several sub-tasks, and assigned to a group of
Agents; third, the
Agents interact and coordinate with each other, and they efficiently complete the tasks of the system through mutual knowledge exchange, communication and consultation [
23]. One of the reasons why a multi-agent system was chosen for this study is that it is adapted to a complex distributed system, which is in line with the setting of the financial public opinion research in this paper.
3.4. DSSW Model
DeLong, Shleifer, Summers and Waldman [
24] proposed the noise trading model, or DSSW model for short, in 1990. In reality, financial markets are full of noisy trading; that is, the information of the market is not completely transparent, and noisy traders cannot dominate price discovery. However, the investment sentiment of noisy traders can affect the decisions of other investors to a certain extent, causing sharp fluctuations in prices in the short term. At the same time, the investment sentiment and investment decisions of noisy traders are also influenced by news on social networks [
25]. Therefore, this study takes into account the investment sentiment of noisy traders that is disturbed by information from social networks, which is closer to the realistic conditions in the analysis of financial public opinion.
4. Model Building
4.1. Modeling Ideas
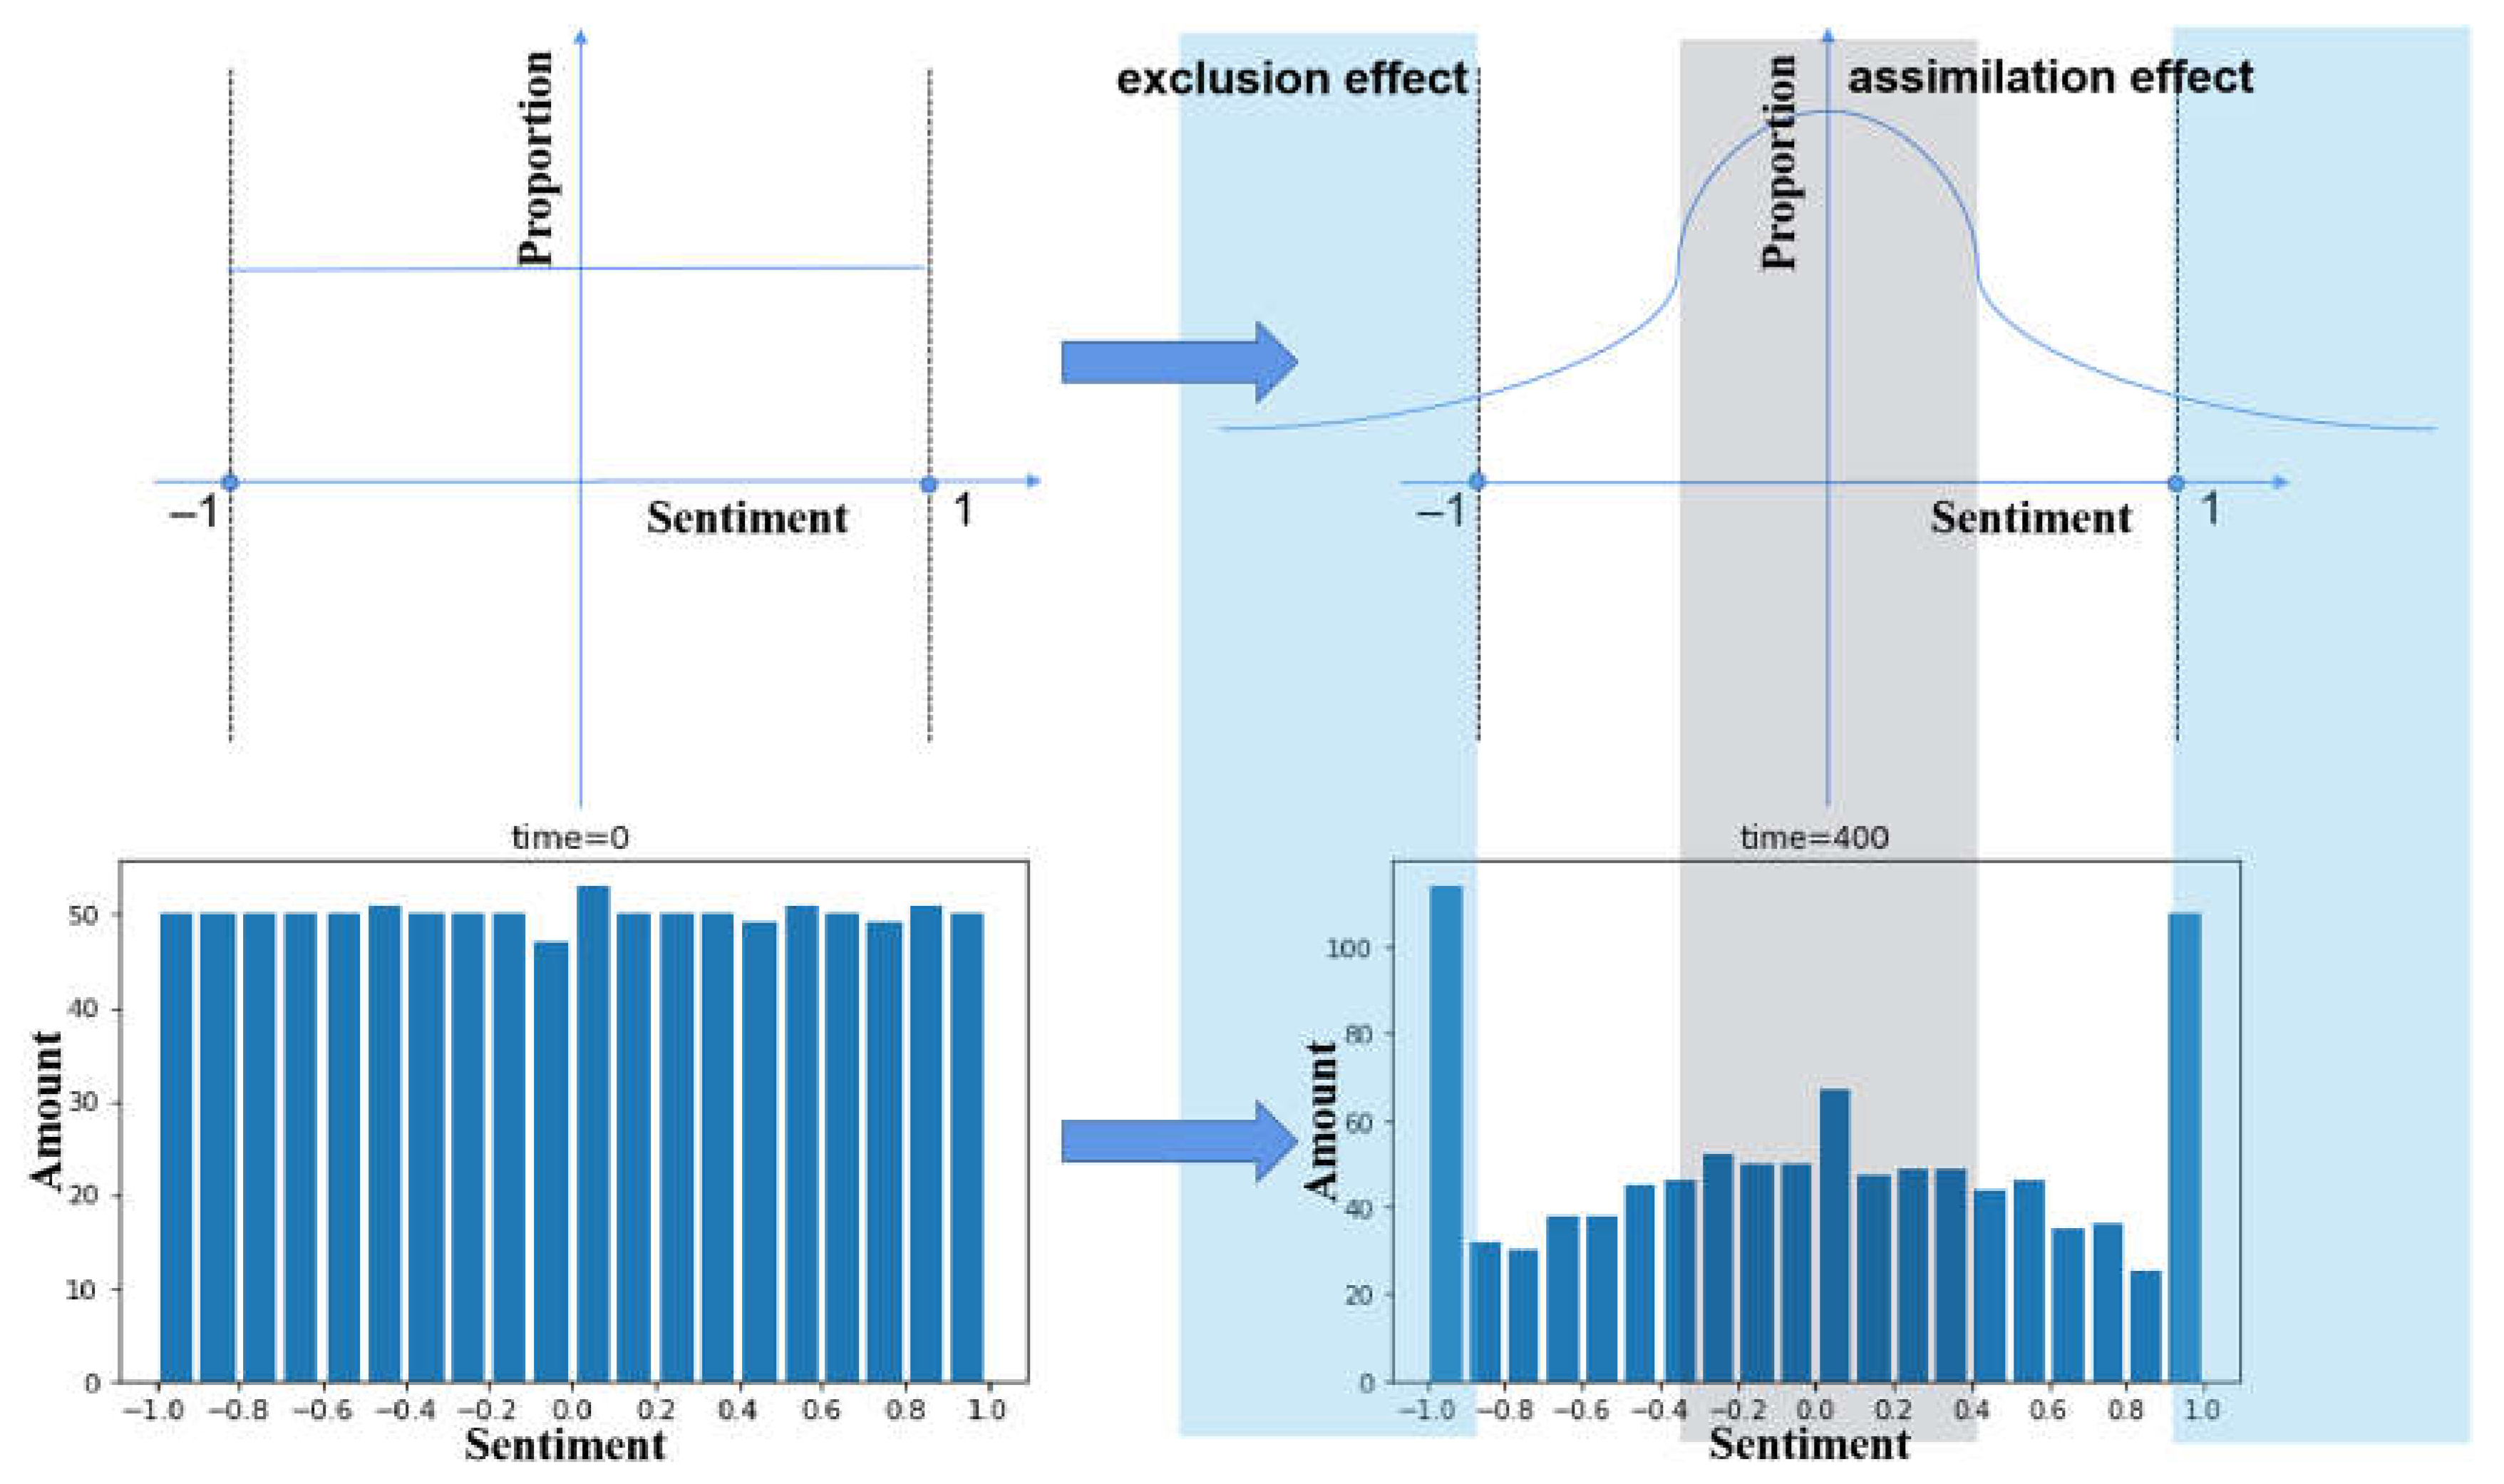
From the current research, it is found that when scholars discuss the phenomenon of attitude polarization of network groups, most of them choose to analyze the D–W model or the J–A model. The J–A model is superior to the D–W model in that it not only considers the assimilation effect, but also adds the exclusion effect and the neutral effect, which is more in line with the properties of the actual network. The similarity of the two models is that they are based on the theory of social judgment; that is, when the individual is faced with other views and positions, through absorption or comparison and other methods to make judgments on the received information, forming an attitude of acceptance, neutrality or rejection, if the position of the individual is close to the position of receiving the information, it is assumed that the information is within the acceptable range, which means that the individual is likely to change their attitude to the point of view and assimilate.
Using the J–A model to elaborate, it can be expressed as follows: in a group with
individuals, each individual has a sentiment value
, and information interaction between the two individuals; at the same time, there are two thresholds:
represents the threshold of acceptance while
represents the threshold of rejection, and the condition of
is satisfied [
1]. The model believes that individuals’ reflections on different attitudes are relatively simple, tending to have attitudes similar to their own, and rejecting attitudes that are different from their own. The application rules are as follows:
where
represents the intensity of the control effect.
This paper argues that in real-world financial markets, it is difficult to achieve interaction with sentiment values equal to the weight of each interaction node. Usually, investors change their sentiment values based on the difference between themselves and the group, and finance often values the mean and variance of investment expectations; so this paper, on the basis of the J–A model, added the investor connection coefficient, the investment expectation quantile, and the surrounding investor expectation variance and other indicators, so that it is more in line with the real financial market. Taking individual investors as an example, different investors have different levels of interaction; that is, the amount of information received by external investors is different, so the degree of impact is also different; in the same way, the strength of the herd will also determine whether they change their expected decisions. When the surrounding groups agree, that is, when the variance of investment expectations is small, the investment expectations of individual investors will move closer to the expectations of the group; when the surrounding groups of opinions are different, that is, the variance of investment expectations is large, the investment expectations of individual investors will deviate from the expectations of the group. This is based on the unique noise trading mechanism of the financial market, although an information investor believes that their investment expectations based on existing information are correct, and because the irrational expectations of the noise group will lead to distortion of the market trend, the information investor may have to turn closer to the group expectations.
Therefore, this paper improves on the J–A model and formulates its interaction rules as follows:
For the interaction of individuals in the network, it is necessary to assign the corresponding network structure at the initial stage to simulate the real environment. However, real-world networks are intricately intertwined under the influence of various factors. Based on existing research, the small-world network model proposed by Watts and Strogatz and the B–A scale-free network model proposed by Barabasi and Albert is often used to simulate real-world networks. Among them, the small-world network model uses probability
to break the edge of the N node in the regular network for random connection (excluding the self-connection and heavy edge connection of the node) [
26], and the degree distribution follows the normal distribution; the B–A scale-free network model follows the growth mechanism and the optimal connection mechanism, and the degree distribution follows the power–law distribution. Since real-world networks mostly obey the power–law distribution, this paper selects the B–A scale-free network model to preserve the authenticity of the network while simplifying individual interactions. In order to fit the network characteristics of noise propagation in financial events, this paper introduces the DSSW model theory of behavioral finance to make it more in line with the evolution of actual investor sentiment.
In summary, the investor sentiment polarization model in this paper is based on the J–A model, and at the same time, according to the attributes of the financial event public opinion network and the characteristics of individuals, it integrates parameters such as the strength of the relationship between individuals, the conformity of individuals and the atmosphere of the individual-surrounding environment in the model, so that the model is more suitable for real financial events. Since the real network mostly obeys the power–law distribution, for the interaction of individuals in the network, this paper uses the B–A scale-free network model as the Agents’ adjacency model, and introduces the behavioral finance DSSW model theory to improve the adaptability of the application of public opinion network in the financial field.
4.2. Construct a Polarization Model of Investor Sentiment
4.2.1. Definition of Parameters and Variables
The definitions of the feature parameters and variables involved in the model are shown in
Table 1 and
Table 2:
- (1)
Radiation range : the number of edges formed by node and adjacent nodes.
The size most intuitively reflects the number of neighboring nodes that the node connects, and the larger the , the greater the importance of the node in the network. In the financial market, nodes with a large range of influence, such as financial media and professional institutions, tend to have larger .
- (2)
Degree of interaction participation : the ratio of the actual number of edges of node to the most polygonal number that may exist.
The formula expression for the most polygonal number that the node
may have is:
The size of
intuitively reflects the degree of aggregation of nodes, and in general, individuals are more inclined to create groups with high concentrations. In financial markets,
measures the extent to which an investor participates in emotional interactions, and the higher the
, the greater the impact of the interaction on investors. The formula expression for Degree of interaction participation
is:
- (3)
Junction coefficient : the affinity relationship between node and node .
The size most intuitively reflects the degree to which two nodes interact with each other. The range is between 0 and 1, and as the value becomes larger, the relationship between nodes goes from sparse to intimate. In real-world financial markets, investors tend to be influenced by investors they trust and relatively less influenced by other investors.
- (4)
Investor sentiment : an indicator of the attitude of node at the t-moment.
represents the sentiment value of node i that holds a positive view; represents the sentiment value of node i that holds a negative view.
Combined Ambient sentiment value
: the average sentiment value of the node connected to the node
at
t-time. Its formula expression is:
- (5)
Investment expectations quantification point : the percentage quantile of the node ’s investment expectation in the investment expectations of the surrounding nodes.
The value measures the order of an investor’s investment expectations among the investors around it, and being at an excessively high or too low index means that the investor’s investment expectations deviate greatly from the surrounding nodes, and there is often a tendency to center. The formula for the investment expectations quantification point
is:
- (6)
Coefficient of destabilization : how easy it is for nodes to change their emotional values.
is a constant in the short term, measuring how easy it is for investors to change their original emotions in the face of the differences in the emotions around them and instead follow the emotions of the group. The larger the , the more conformist the investor, and it is easier to change their expectations when faced with the difference between the surrounding emotions and their own emotions.
- (7)
Comprehensive impact : an indicator to determine whether will undergo further changes.
is a comprehensive reflection of the environmental information in which the node
is located, and its numerical value determines whether the sentiment value of the node
has undergone further changes. This paper argues that an investor’s decision to change expectations depends on the individual’s interaction participation and the expected deviation from the surrounding nodes.
will undergo further changes when
;
does not change when
. The formula expression for
is:
- (8)
Weighted variance of environmental sentiment : the degree of difference in the sentiment values of surrounding investors.
The smaller the value, the more convergent the opinions of surrounding investors, and vice versa, the more divergent the opinions of the surrounding investors. Its formula expression is:
- (9)
Effect interval threshold : the threshold for the change of node sentiment value.
When the is less than , it means that the surrounding investors are unanimous and follow the rules of assimilation; when the is greater than , it means that the opinions of the surrounding investors are more diverse, and the exclusion rule is followed. Simultaneous requirements and meet: .
- (10)
Assimilation and rejection parameters : the degree of change of control.
represents the degree of change parameter when following the assimilation rule, and represents the degree of change parameter when the exclusion rule is followed. Both and range in value (0,1].
4.2.2. Construction of the Network
At present, there are more studies to prove that the distribution law of most real-world networks is in the form of a power–law distribution, that is, a small number of nodes have a large number of connections, while most of the other nodes have a small number of connections, scholars will have this characteristic of the network as a scale-free network. Barabasi and Albert proposed the B–A scale-free network model in 1999, which is also a form of power–law distribution, and is based on the following two mechanisms:
Growth mechanism: B–A scale-free networks are in a state of growing size. There are nodes in the initial network; with the increase of time step, new nodes are constantly generated in the network, and the node selects nodes in the existing nodes to connect.
Optimal connections: Nodes in the network tend to connect with nodes with a wider radiation range
, with the probability that:
After
t-time steps of growth, the initial network evolves from
nodes to a network with
nodes and
bars, and the degree distribution conforms to the power–law distribution
, where the power index
[
27].
Because the B–A scale-free network model conforms to the synchronization mechanism, emergence mechanism, and self-organization mechanism in the polarization dynamic mechanism of group attitudes, it retains the diversity of real networks, and the specification simplifies the interaction between individuals, which is in line with the simulation environment required for this study.
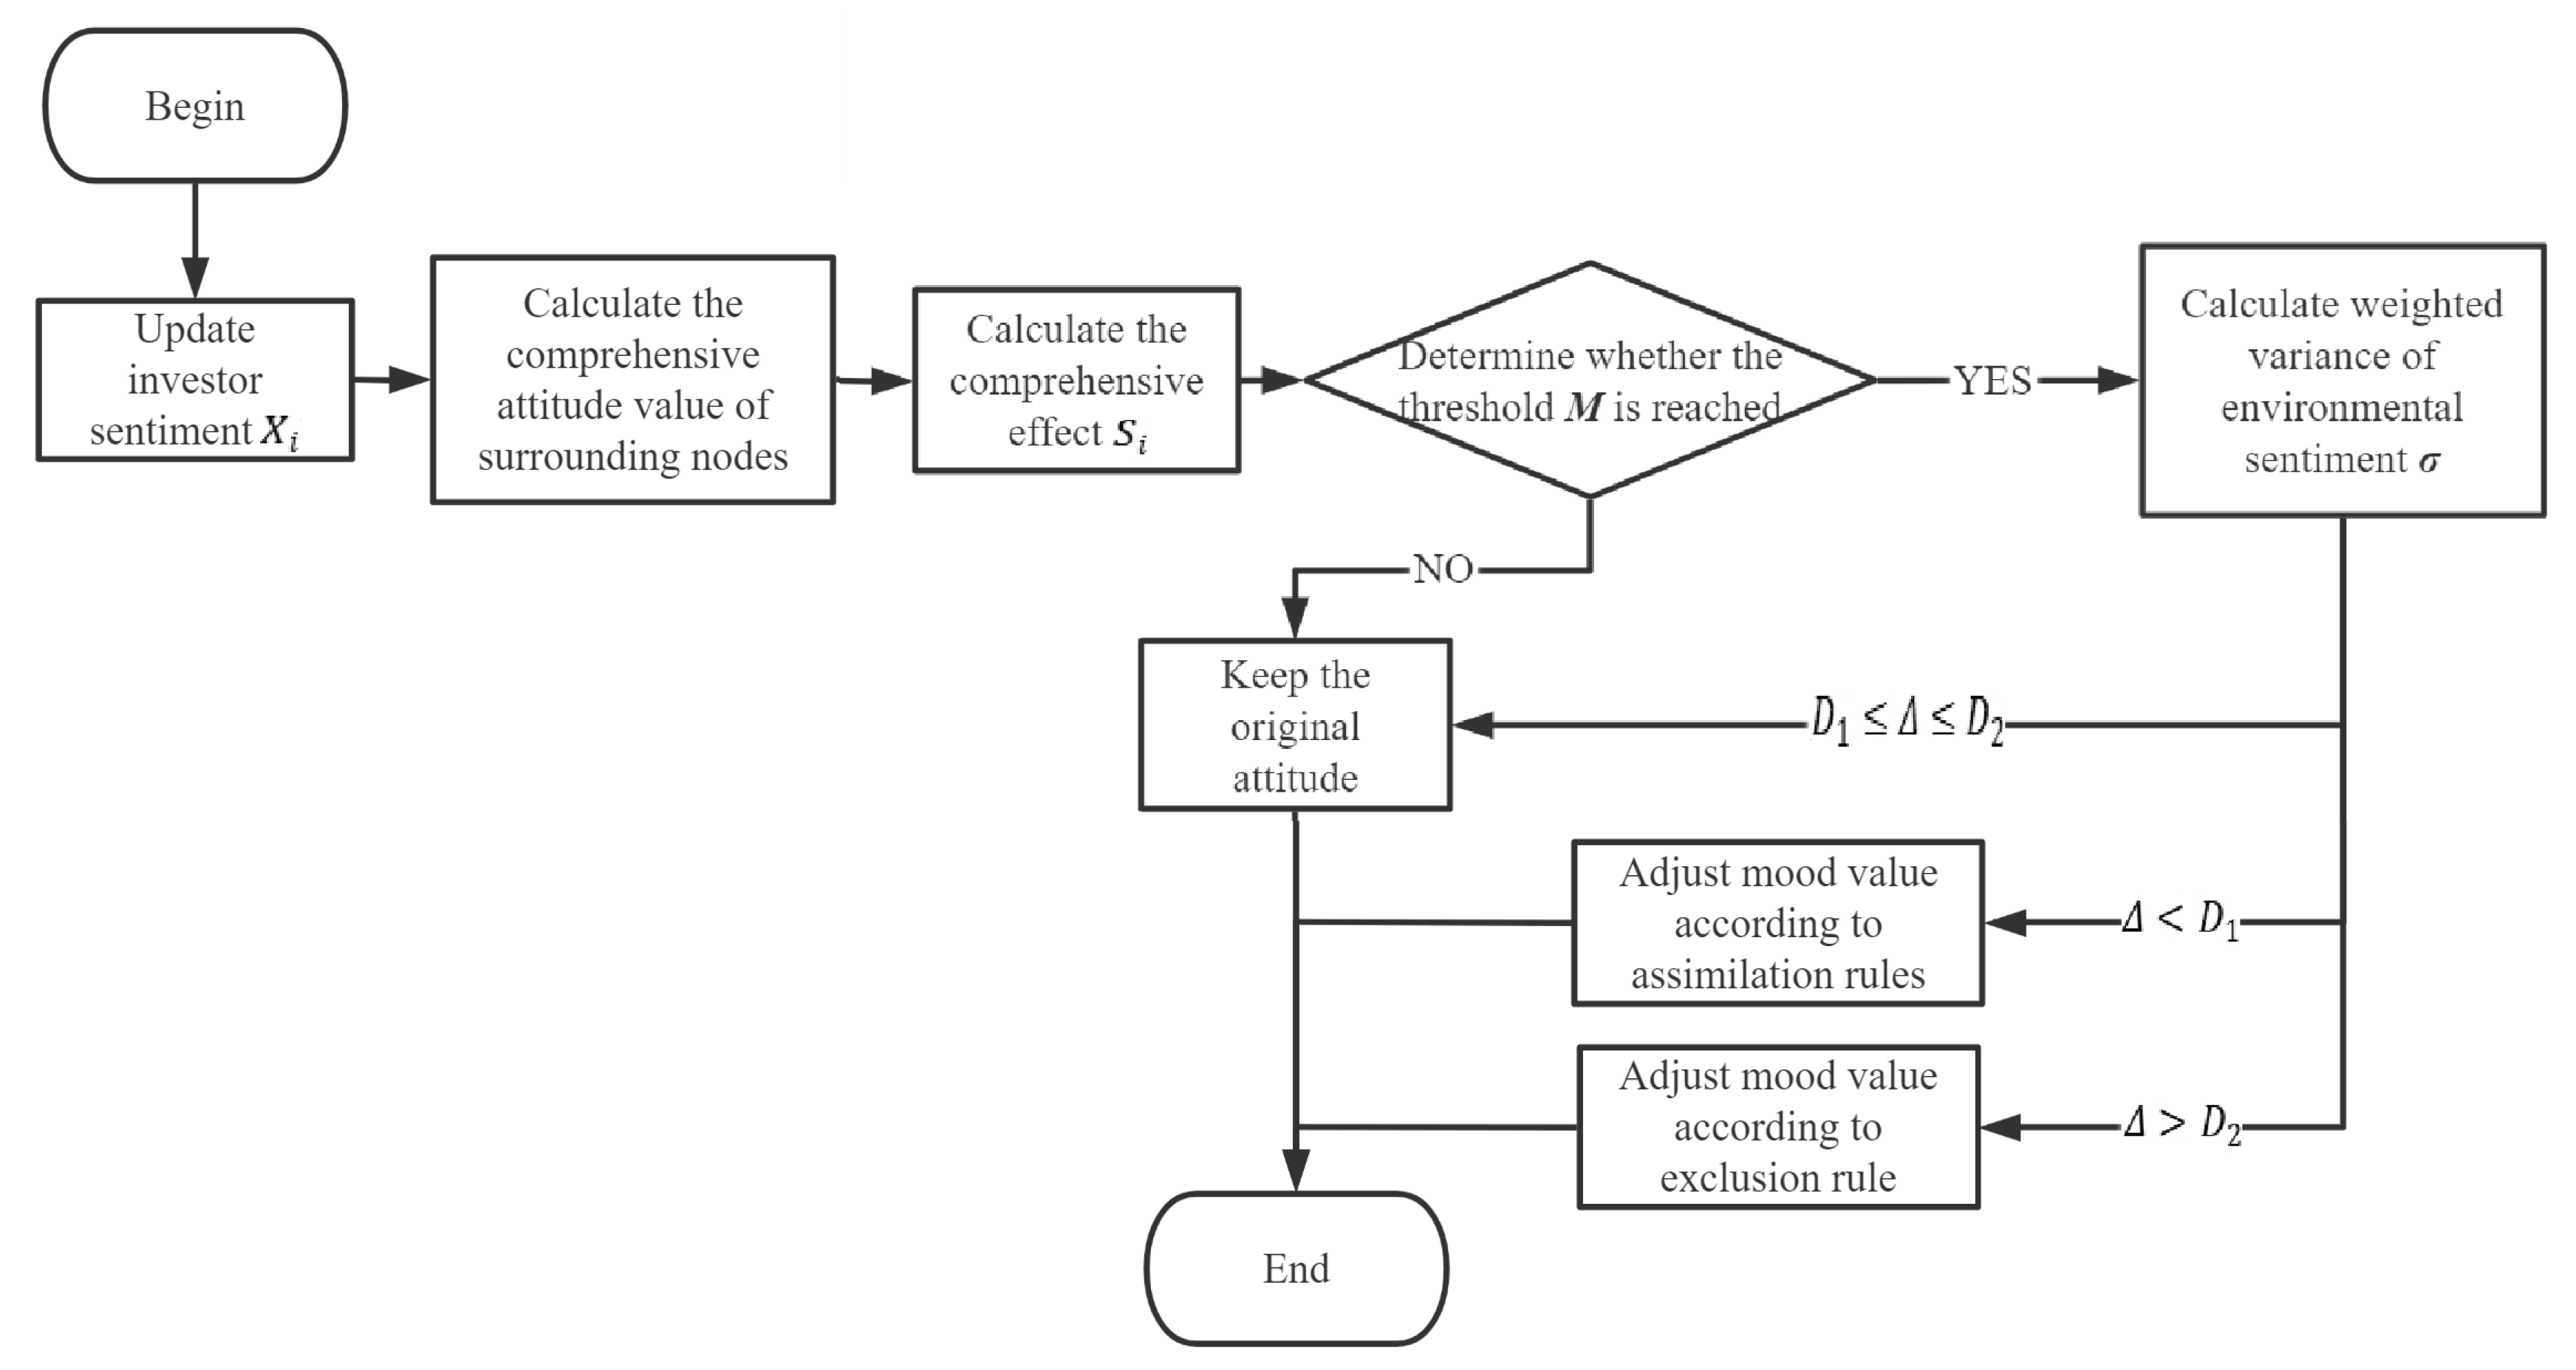
4.2.3. Setting of Interaction Rules
In the real network, different individuals express different views, and out of the social nature of the individual and the openness of the network, the individual will interact with other individuals. In the process of interaction, the views of oneself and other individuals will change to a certain extent or less. Based on the J–A model, this paper constructs an interactive model of investors’ views.
When nodes interact in the network, first of all the individual node cluster coefficient, node relationship strength, surrounding environment sentiment value, and other factors are synthesized to calculate the comprehensive influence , and determine whether it exceeds the threshold . In this paper, when the comprehensive attitude trend of the node connected to the node is positive, is related to the positive attitude and relationship intensity of the environment, and when the value is negative, is related to the negative attitude and relationship intensity of the environment. The discriminating conditions for the node influence threshold are: when ≥ 1, the next operation is performed to determine the sentiment value of the node, and when < 1, the sentiment value of the node is not changed.
The update of the rules in this paper is as follows: when the investment sentiment variance
of the node
connected to node
i is small, that is, the investment sentiment of the surrounding nodes is consistent, it is in the assimilation effect band, and it will move closer to the group sentiment because of the crowd effect drive; when the investment sentiment variance
of the node connected to the node
is larger, that is, the investment sentiment divergence of the surrounding nodes is in the exclusion effect band, it will deviate from the group sentiment because of the reversal effect; when the above two conditions are not met, the investor sentiment
of the node
does not change. This article discusses the
situation as follows:
where
is the assimilation parameter and
is the exclusion parameter.
This article summarizes the discriminate process of the polarization model in the form of a flowchart, as shown in
Figure 1.
5. Simulation Experiments
According to the B–A model of complex networks, the interaction of real social networks can be well simulated, so this paper is based on the BA model. Based on the variables selected earlier, a reasonable interaction model is constructed by formulating parameters. By repeatedly referencing and looking up historical data of China’s securities market, some of these important parameters are formulated as follows: First, this paper sets the size of the network node to 1000, , and conducts simulation experiments. For the above parameters can be understood in this way, assuming that there are a total of 1000 people in a group, when the individual’s expectation of the market deviates from the weighted expectation of the group interacting with it, first judge whether the deviation exceeds the threshold. If it exceeds, the individual changes his expectations. If it changes, then judge whether the group emotional variance is less than . If so, it is assimilated, and the group’s expectation is closer to the group’s expectation by 0.2%. If the group emotional variance is greater than , it is rejected. From my expectations to the expectations of the group, the deviation is 0.2%. If the group emotional variance is between and , my expectations do not change.
First, the sentiment values of 1000 groups are randomly assigned a uniform distribution between (−1,1), and the initial distribution map is the distribution map of the time = 0 period in
Figure 2. It means that in a certain period of time, each individual has their own expectations for the market, and the expected trend is evenly distributed from bullish to bearish.
When individuals in the network interact, individuals are affected by the group with which they interact, resulting in changes in individual expectations. With the increase in the number of interactions, we observed that the proportion of extreme emotions on both sides increased significantly, and there was an effect similar to the “absorption wall”. The proportion of intermediate emotions also increased by a certain proportion; the sentiment values of individuals who were originally in swing moved closer to the extreme emotions or intermediate emotions on both sides.
In order to verify the stability and accuracy of the model, to test whether the mean sentiment value based on the uniform distribution after interaction has changed significantly, because the distribution tends to be stable after 400 interactions, the hypothesis test is carried out on the individual sentiment value after 400 interactions, and the null hypothesis is established:
: the mean of the sentiment value ;
, the alternative hypothesis: the mean of the sentiment value .
Test the Z statistic: .
Therefore, rejecting the null hypothesis, it is believed that the mean value of the sentiment value , then the interaction itself does not change the attitude tendency, and does not change the overall attitude trend under the uniform distribution.
The distribution of emotional values after 400 interactions at different node scales simulated in this paper is shown in
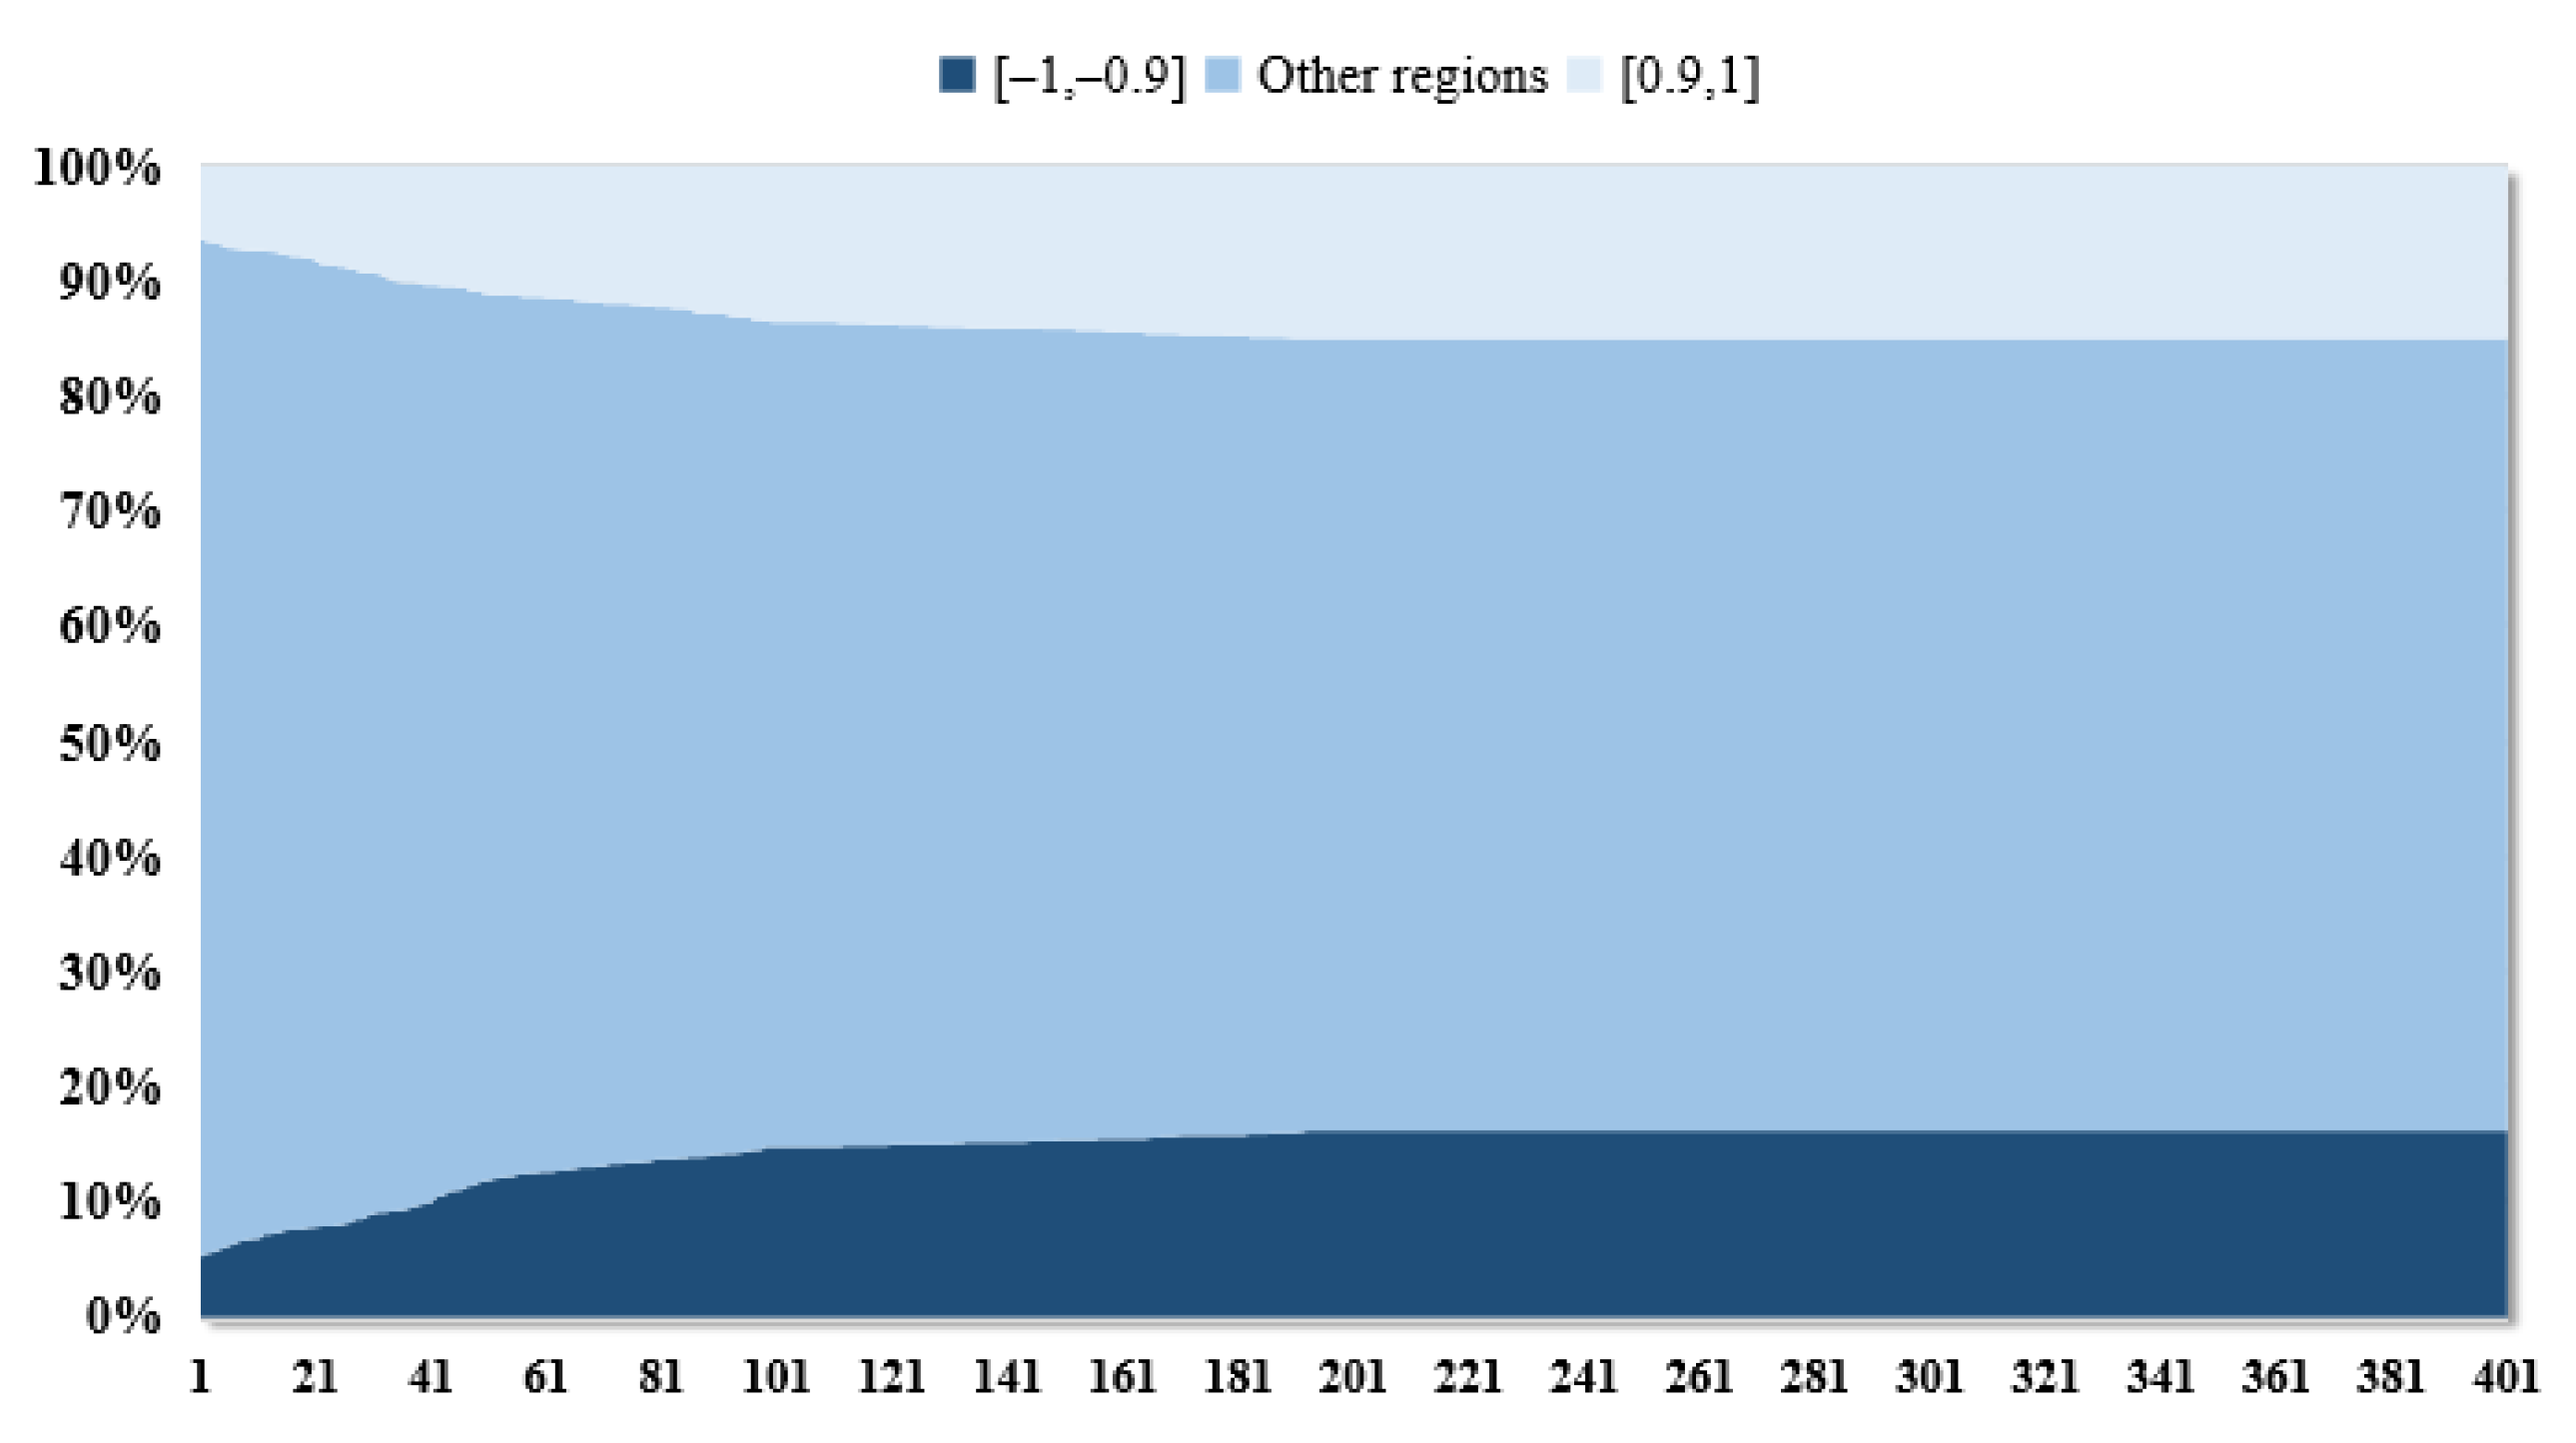
Figure 3. It can be seen that there is no significant difference in the degree of polarization after full interaction between different node scales; that is, the number of investors participating in interactions does not affect the equilibrium state of the distribution of emotional values. However, the increased level of interaction brought about by increasing the size of participants will make investor sentiment reach equilibrium more quickly.
Figure 4 shows the change in the proportion of extreme emotions on both sides with the change in the number of interactions, from a large increase in the degree of polarization at the beginning of interaction to a nearly stable one. This tells us that if at a certain point in time, the proportion of investors whose attitudes are swinging in the market is large, with the increase in the number of interactions, these people will move closer to the extreme emotions on both sides and produce emotional polarization; and if the extreme emotions in the market have reached a stable proportion at a certain point in time, the increase in interaction will not bring about a significant change in extreme emotions.
It follows that after a sufficient number of interactions, people who were originally wavering at a certain point of view tend to choose extreme emotions that they are more comfortable with, or remain neutral. In the securities market, if a slightly bullish investor is affected by the bullish sentiment of the surrounding group, they may be inclined to firmly bullish sentiment.
Many factors affect the polarization of investor sentiment, and the changes in different parameters have different effects on the polarization results; then the parameters in the model that can be changed and have practical significance will be adjusted to observe the changes in the simulation results.
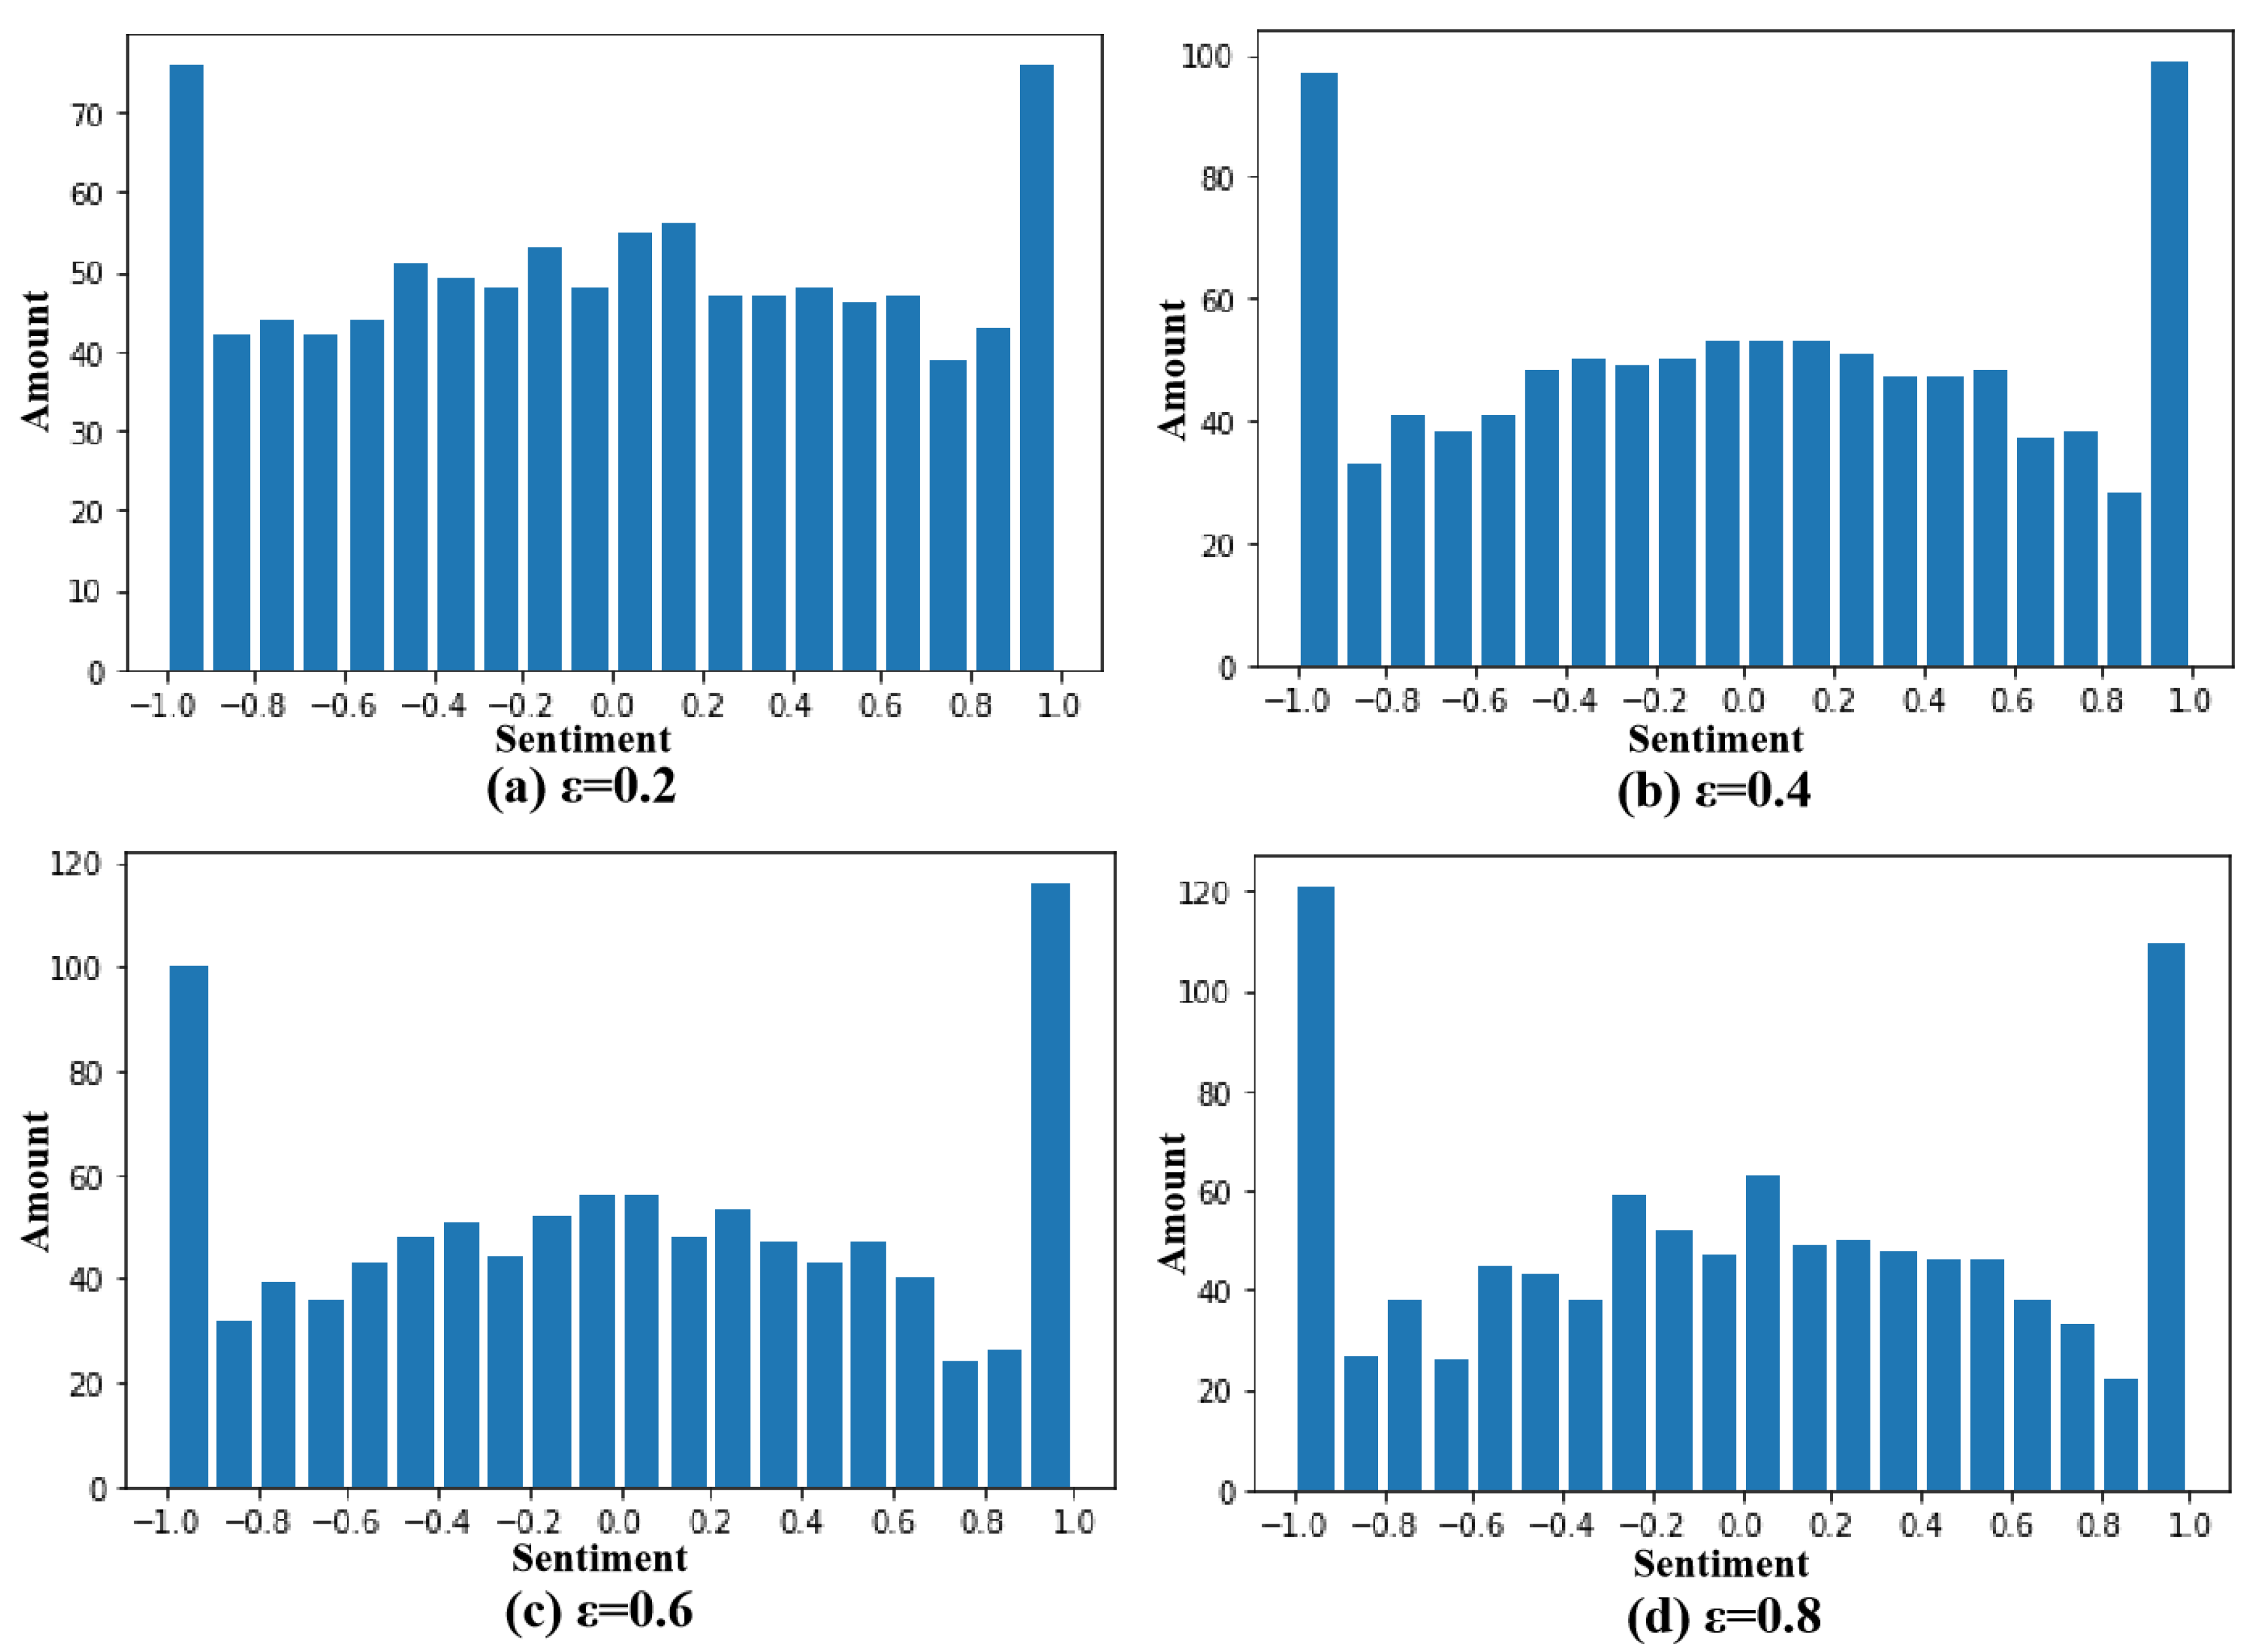
5.1. Effect of the Shaking Coefficient ε on the Polarization Result
Changing the coefficient of destabilization
means allowing investors to change their firmness in their original emotions, and when we keep other parameters unchanged, the simulated coefficient of destabilization
is equal to 0.2, 0.4, 0.6, 0.8 when the interaction is 400 times, respectively; the result is shown in
Figure 5.
We have observed that as the coefficient of destabilization increases, so does the polarization of investor sentiment. The reason for this is that when the coefficient of destabilization increases, the combined effect increases with it, resulting in it more easily reaching the threshold of changing mood. This reminds us that in the real world, if we want to reduce the polarization of investor sentiment, we can take measures such as strengthening information disclosure supervision to improve investment confidence.
5.2. Effect of Assimilation and Repulsion Interval Thresholds , on Polarization Results
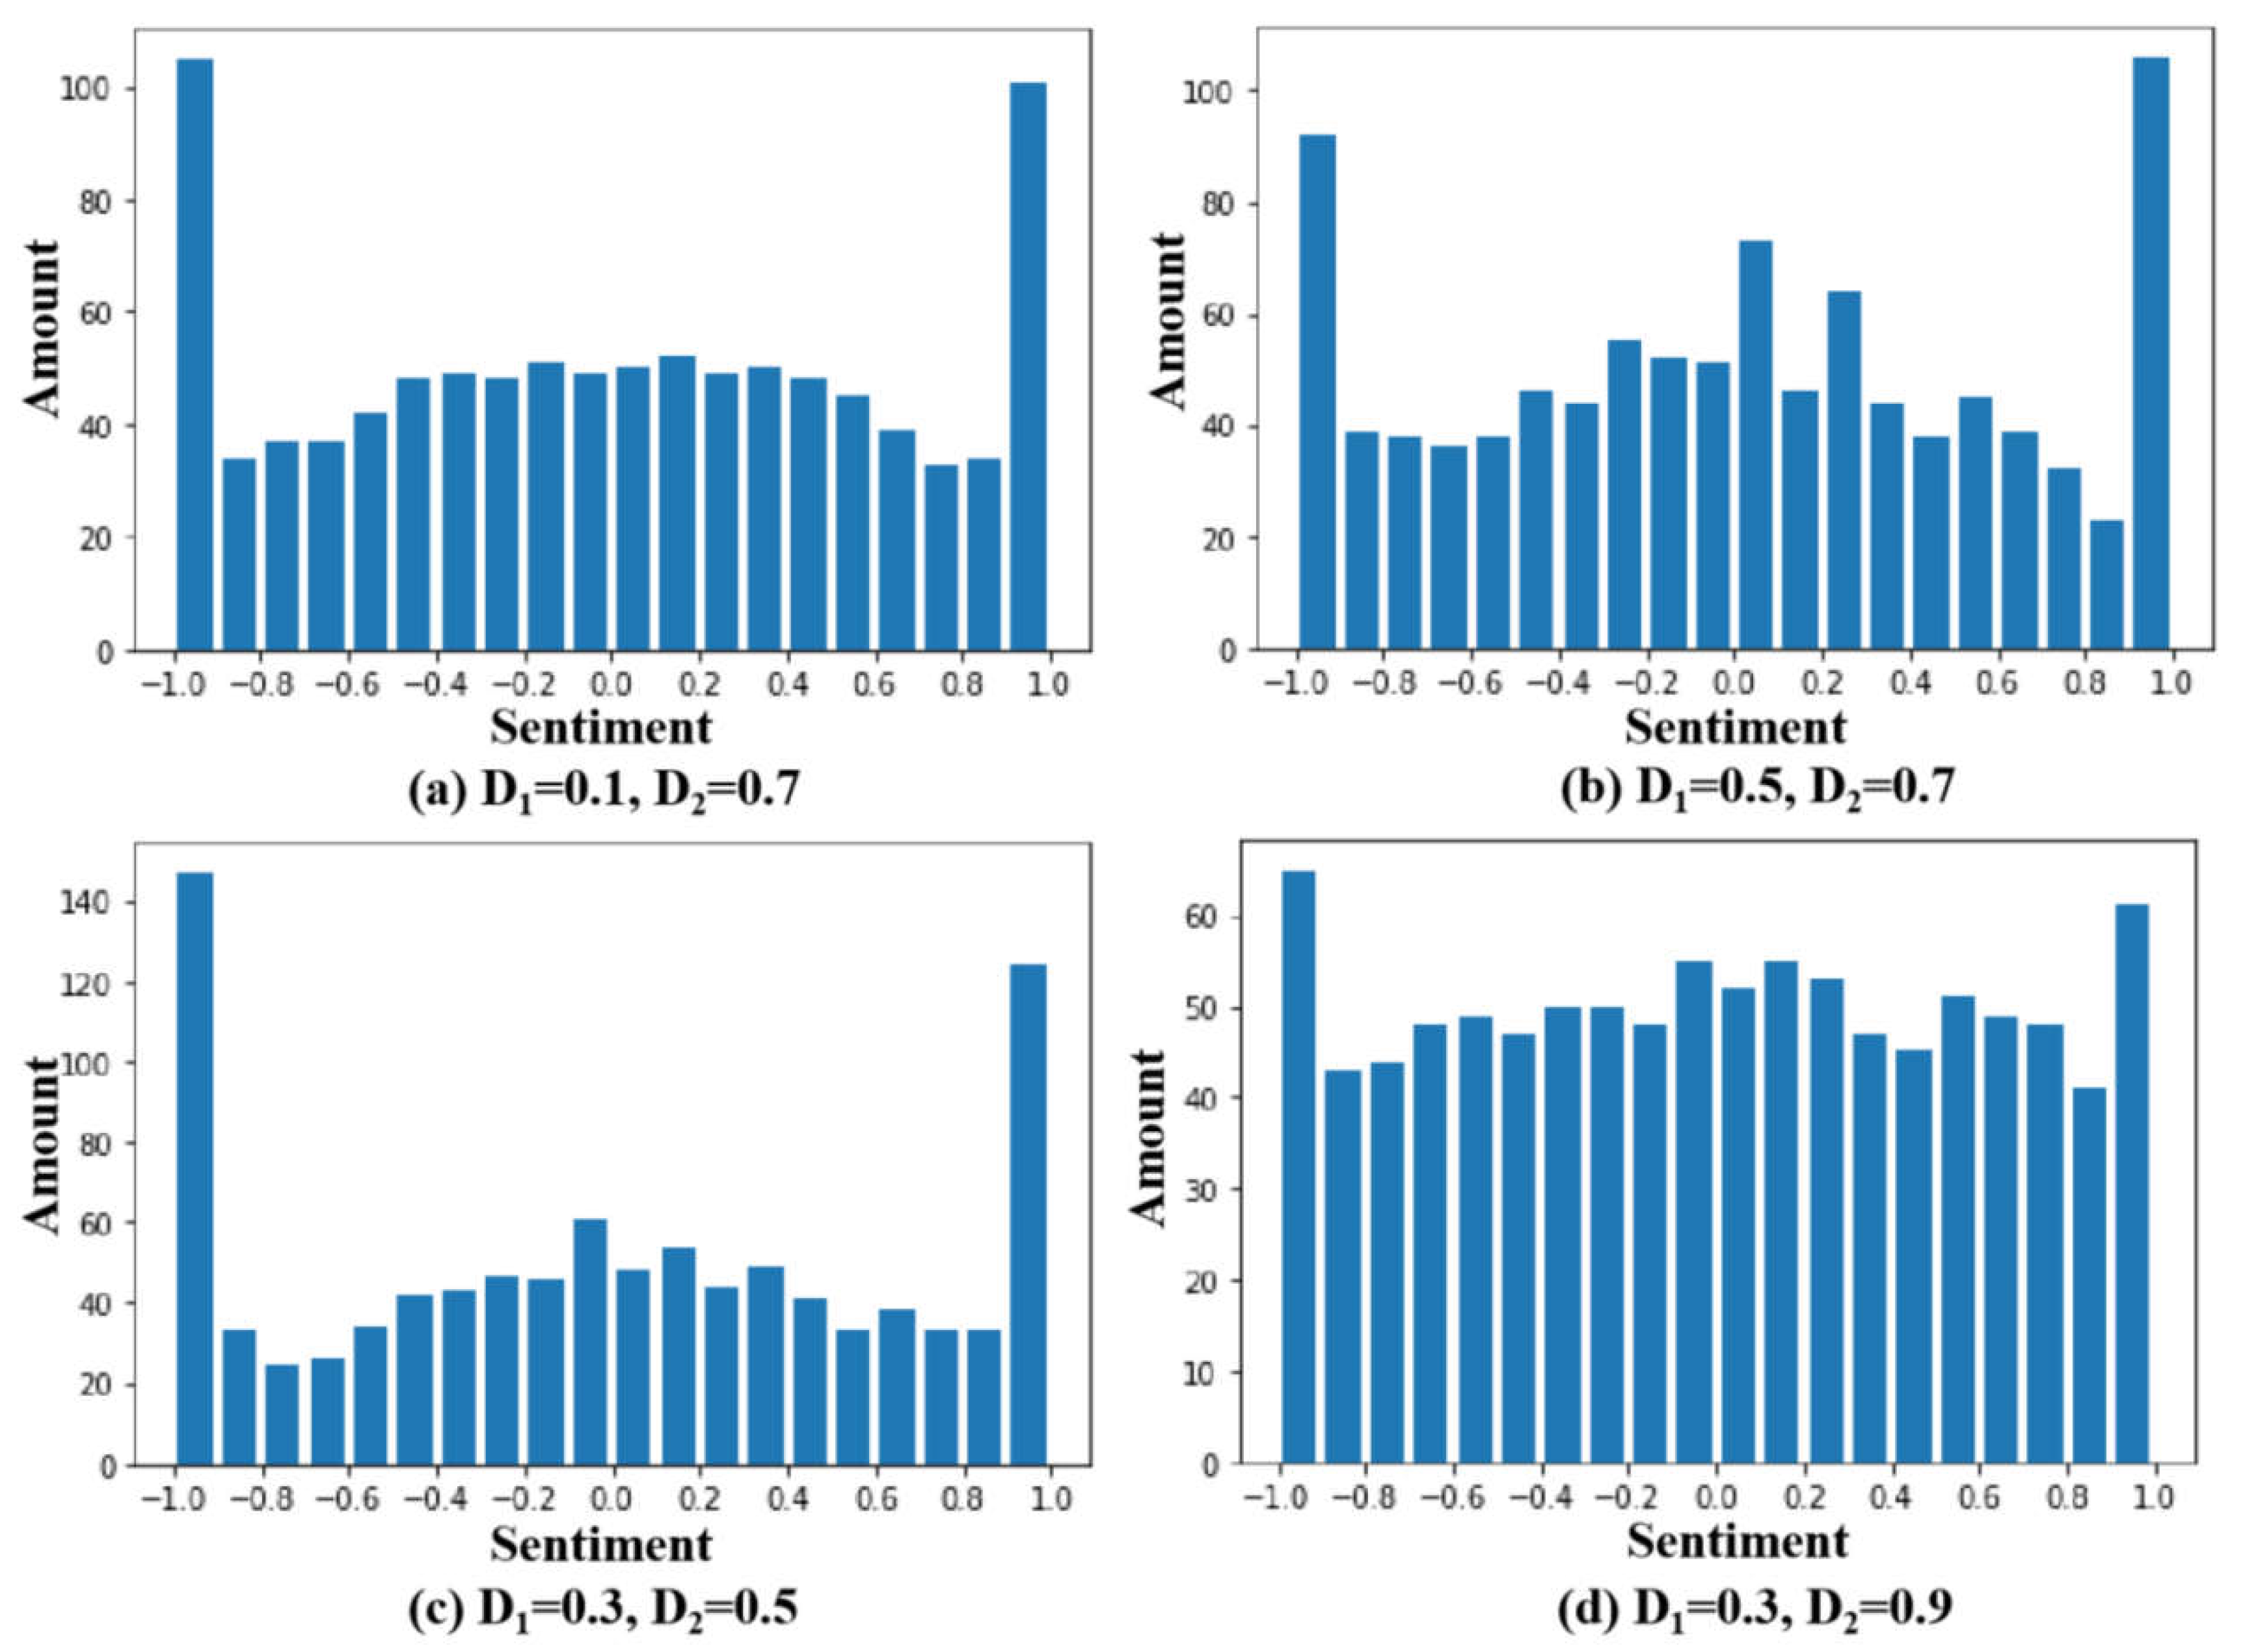
Changing the assimilation interval threshold
and exclusion interval threshold
means that investors change the degree of firmness of their original emotions, when we keep other parameters unchanged; simulating
and
are (0.1,0.7), (0.5,0.7), (0.3,0.5), (0.3,0.9) after 400 interactions, compared with the control group (0.3,0.7); the results are shown in
Figure 6.
We observe that an increase in the threshold of the assimilation interval leads to an exacerbation of the herd phenomenon, showing a tendency to move closer to the mean. The reason is that under a certain peripheral emotional variance, increasing causes some of the nodes that had previously remained neutral to be assimilated. It is not difficult to understand that assuming that all nodes in a network are highly conformist, then, after a certain number of interactions, the sentiment values of all nodes will be unified into the sentiment values of opinion leaders.
At the same time, the decrease of the exclusion interval threshold will lead to an intensification of polarization, and it will show a tendency to diverge between the two ends. The reason is that under a specific peripheral emotional variance, reducing causes some of the nodes that were originally neutral to deviate from the group mood.
5.3. Effects of Assimilation and Exclusion Parameters on Polarization Results
Changing the coefficient of a degree of assimilation and exclusion
means that investors are allowed to change their influence by the surrounding investors, simulating the scenario after 400 interactions when
and
are equal to (0.001, 0.001), (0.004, 0.004), (0.01, 0.01), respectively; the results are shown in
Figure 7.
It is not difficult to see that despite changes in the coefficient of a degree of assimilation and exclusion and , the distribution of investor sentiment after 400 interactions is nearly the same. The reason for this is that the assimilation and repulsion parameters determine how quickly the node moves closer to or diverges from the mean group sentiment at each change in sentiment value, and do not affect its position in the equilibrium state. The and affect the number of interactions required by the node to reach the equilibrium state; the following figure is the number of interactions required by the node to reach the equilibrium state X and the relationship between the and values. It is defined that if the sum of extreme emotions on both sides does not change in the 10 consecutive interactions after an interaction, it is regarded as reaching the equilibrium state, and this interaction is taken as the equilibrium point, assuming .
As can be seen from
Figure 8, changing the assimilation, repulsion coefficients
significantly affected the number of interactions required to reach equilibrium, and the greater the
and
, the fewer interactions were required to reach equilibrium. In the real financial market, if the
and
are too high, it means that if investors are hyper-sensitive to the surrounding emotions, which to a certain extent exacerbates the instability of investor sentiment, the addition of a small number of new views may lead to group sentiment in a short period of time to produce sharp fluctuations.
5.4. Analysis and Discussion
Through the simulation test, we can see that the assimilation effect of investor sentiment will lead to a trend of moving closer to the mean; while the exclusion effect of investor sentiment will lead to a trend of deviating from the mean, that is, the polarization of investor sentiment. The objective factors that lead to the polarization of investor sentiment include the coefficient of destabilization
, the thresholds of the assimilation and exclusion intervals
and
, and the parameters of the assimilation and exclusion effects
and
. Among them, the factors that will aggravate the polarization of investor sentiment include increasing the
of the shaking coefficient, reducing the threshold of the assimilation interval
, increasing the threshold of the exclusion interval
, reducing the coefficient of a degree of assimilation
, and increasing the coefficient of a degree of rejection
.
Figure 9 is a visual demonstration of the assimilation and exclusion effect of investor sentiment:
In the real securities market, in the face of an event impact, the initial investors will make expectations of market trends according to their own cognition, with the expansion of the amount of discussion, especially the addition of some influential nodes, such as financial program experts, star fund managers, etc., leading to changes in investors’ expectations, and will tend to polarize.
On the other hand, the sentiment of other investors is also one of the bases for individual investors to make expected judgments. For example, the original investor believes that event X will not lead to the downward trend of the market, but due to the bearish expectations of the surrounding investors, the investor believes that with the existence of many irrational expectations in the market, the short-term downturn of the market will be unavoidable, so it can only follow the market expectations for adjustment. This positive feedback adjustment caused by noisy trading will further exacerbate the polarization of investor sentiment and exacerbate market systemic risks.
6. A Real Case Study
Since the public opinion polarization model only predicts its future trend based on the current sentiment, and does not consider the influence of other exogenous variables, the market sentiment in the prediction range should be mainly driven by the same event, and the prediction range should not be too long.
In reality, there is no initial sentiment value that has not been interacted with, so it is assumed that the public opinion of each time period is an intermediate state after the interaction, and the number of interactions is approximately the same in the case of the same amount of discussion. For example, under the influence of the same event X, if the amount of discussion in the t = 1 period is expected to be the same as that in the t = 0 period, the number of interactions is also considered to be the same, and the degree of polarization does not change significantly.
Because it is assumed that each time period is an intermediate state of the interaction process, so the determination of the number of interactions should be additive. By consulting the literature and referring to the historical data of China’s securities market, this paper determines the relationship between the number of interactions T and the discussion volume expansion multiple X (expected discussion volume for the forecast period/current discussion volume) as . For example, if the current discussion volume is 5000 and the expected next day’s discussion volume is 8000, the number of interactions is approximately equal to , which is about 141 interactions.
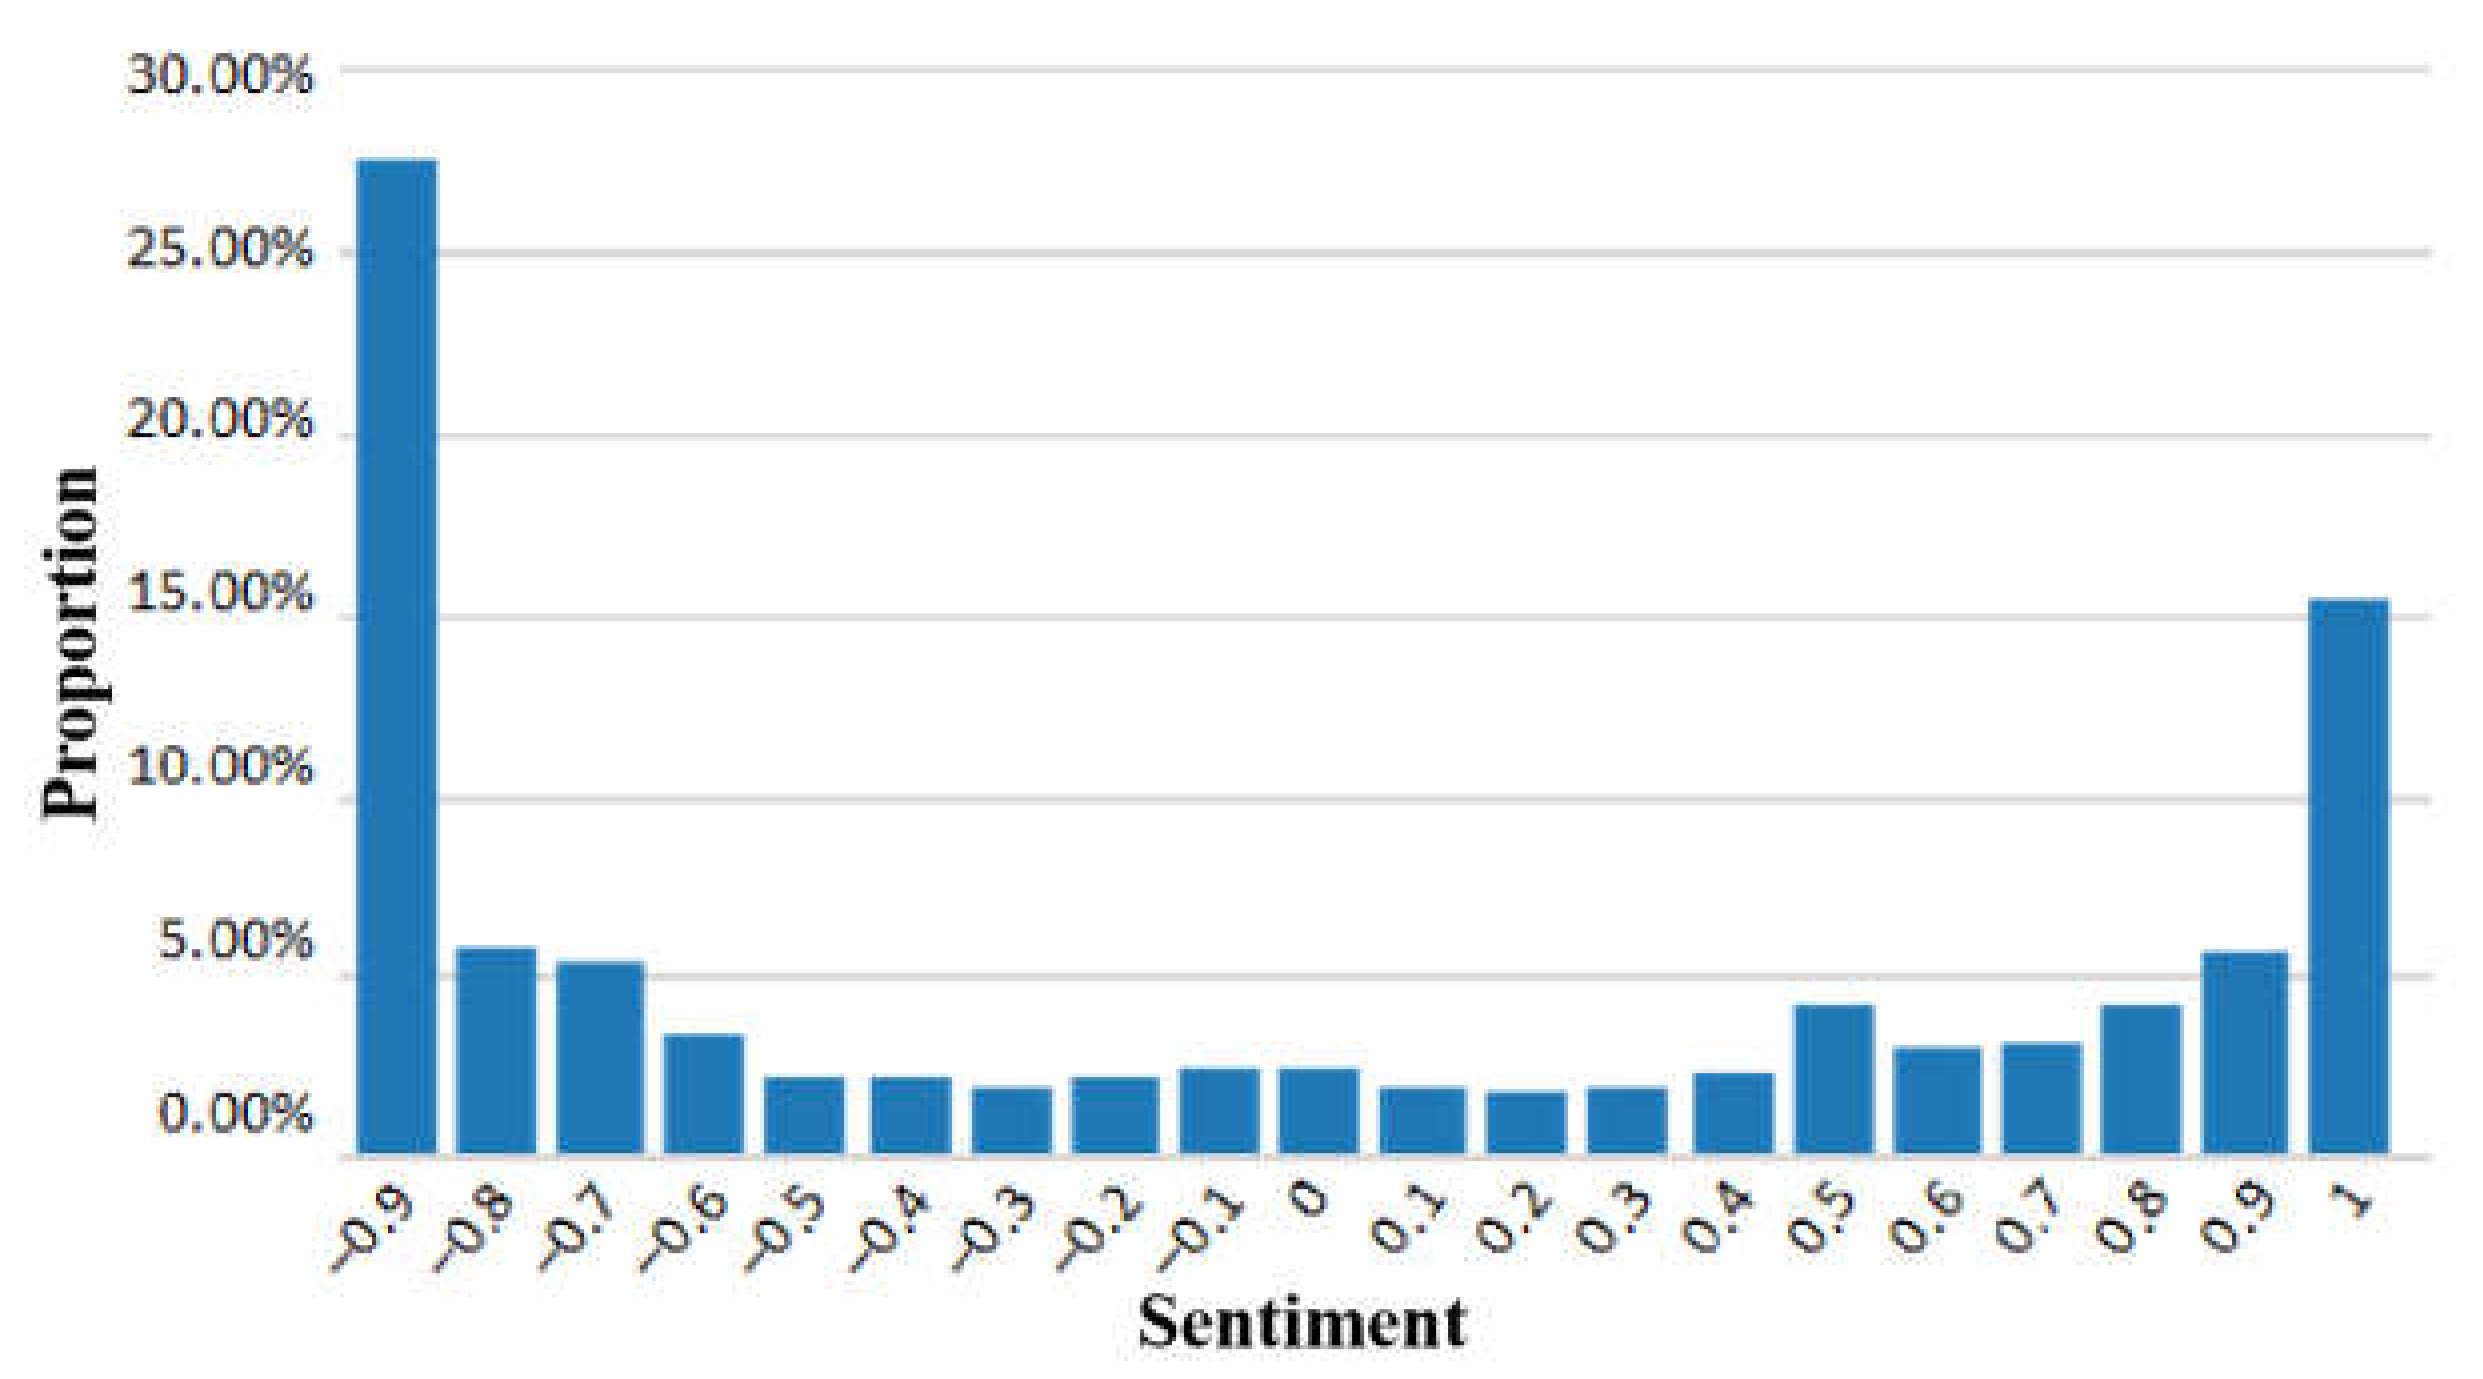
This paper takes the first outbreak of the COVID-19 pandemic in early 2020 as the background of the study. On 27 January 2020, the Shanghai Stock Exchange issued an announcement with a three-day delay in the opening of the market, which resulted in the first emotional flashpoint in the securities market after the outbreak of the COVID-19 pandemic. Investors on the same day engaged in heated discussions on hearing this news; the Oriental Wealth Network had the largest number of discussions. This article selects 27 January 2020 as the observation period, and takes the posts and stock reviews of the “Shanghai Composite Index Bar” and “Shenzhen Composite Index Bar” of the Oriental Fortune Network on that day as the research sample, collecting a total of 4395 research samples. In this study, Natural Language Processing (NLP) analysis technology was used to assign values to the research samples. The NLP analysis technology includes comment extraction and emotion analysis, etc., which can automatically judge the emotional tendency of the Chinese text with subjective descriptions in general scenarios and give the corresponding confidence. It is a good gauge of investor sentiment. Therefore, this paper uses NLP analysis technology to assign attitude values between posts and stock comments (−1, 1). Its initial probability distribution is shown in
Figure 10 (the abscissa is the upper limit of the interval, as 0.9 represents the sentiment value within the interval [0.8, 0.9)). Among them, extreme emotions (sentiment values within the range [−1, −0.9) and (0.9, 1]) accounted for 43.22%.
It is predicted that the next emotional flashpoint will be on the opening day of 3 February 2020; driven by this event, and based on the changes in the amount of discussion on the previous market opening day and before the start, it is expected that the discussion volume on 3 February will reach 2.5–3 times the discussion volume on 27 January; that is, the number of interactions should be 275–330.
Based on the above model, interactive simulation is performed through python programs. Since the probability distribution of sentiment values after 275 and 330 interactions is approximate, the average of the two distributions is taken as the simulation result, and the result is shown in
Figure 11.
It shows that the change had a similar direction to the previous random number simulation, and the original wavering mood was significantly reduced; the proportion of extreme emotions on both sides increased from the initial 43.2% to 53.11%, and the neutral mood also increased by a certain proportion. It can be considered that in the simulated scenario, driven by the outbreak of the COVID-19 pandemic, the discussion volume of the second emotional flashpoint relative to the first emotional flashpoint increased significantly, resulting in a significant increase in the number of investor attitude interactions and a more significant polarization of investor sentiment.
After comparing the predicted probability distribution of sentiment values with the actual probability distribution of investor sentiment values as of 3 February 2020, the results are shown in
Figure 12. A total of 11,962 posts and comments were observed on 3 February, in line with the expected number of discussions. Extreme emotions accounted for 56.4% of the actual sentiment values on 3 February, which was similar to the expected 53.11%, proving that the model has some reliability for predicting the polarization of emotions caused by the impact of sudden events. But at the same time, we also found that in the comparison between the forecast results and the actual results, the prediction of negative extreme emotions is low, possibly because in the process of actual public opinion evolution, there is inevitably some information between the two observation periods that leads to a one-way displacement of investor sentiment. In this case, for example, as the number of COVID-19 infections rose day by day over the course of 27 January to 3 February, investors’ expectations of the market further tended to negative sentiment, which eventually led to more extreme negative sentiments than predicted.
The same simulations are used in public opinion predictions for events such as the opening of the North Stock Exchange in November 2021 and the Russo–Ukrainian War in March 2022, and both perform well.
Through stochastic simulations and empirical tests, we have observed that investors may change their attitudes towards market movements in the process of participating in the interaction of opinions. Its trend is: driven by the same event, with the increase in the number of interactions, investor sentiment has polarized, the proportion of extreme emotions on both sides has increased significantly, the proportion of intermediate emotions has also increased by a certain extent, and the proportion of swing emotions has decreased significantly. This means that in the real market, investors who were originally wavering about the market trend will tend to take sides under the influence of surrounding investors or influential investment institutions, and finally make a certain judgment on the market trend.
7. Conclusions
7.1. Findings of the Study
Through simulation tests and empirical tests, we can see that the root cause of the polarization of investor sentiment is the herd effect and exclusion effect of investor behavior. This means that in the real financial market, if the group sentiment of interacting with an investor is consistent, the investor tends to accept the group sentiment and move closer to it; if the group opinion is more divergent, the investor is inclined to stick to their original emotions or accept the emotions that are similar to their own opinions, resulting in a phenomenon of deviation from the group sentiment. Therefore, in the market after full interaction, the proportion of extreme emotions and average emotions on both sides will be increased, while the proportion of swing emotions will be significantly reduced.
Through the examination of parameters, it can be seen that the controllable factors affecting the polarization of investor sentiment include the coefficient of destabilization , effect interval thresholds and , effect parameter and . Among them, increasing the coefficient of destabilization and reducing the effect interval threshold and will aggravate the polarization of investor sentiment in the equilibrium state, while increasing the and of the effect parameters will not affect the polarization of investor sentiment in the equilibrium state, but will accelerate the number of interactions required to reach the equilibrium state. Reflected in the real financial market, if the investor’s shaking coefficient is high, it means that it is more inclined to change its own mood when receiving external information shocks; the smaller effect interval thresholds and mean that the investor is less conformist and has a greater tendency to adhere to their own opinions; the and of the effect parameters means that the investor is more affected by external information.
7.2. Policy Recommendations
7.2.1. Guide the Emotional Expression of Opinion Leaders
In the era of big data, the cost of information dissemination is reduced, the emotional transmission effect is significant, and the “herd effect” of investors caused by the emotional expression of opinion leaders is becoming more and more intense [
28]. In addition to the authoritative views of financial media and professional institutions, the views of self-media, financial forum experts, etc. will also have a non-negligible impact on the sentiment of market investors. According to statistics, in 2021, the scale of financial interest users of China’s well-known short video platform “Douyin” reached 150 million, and the number of financial video plays exceeded 1.3 trillion, of which only the two accounts with the largest number of fans had a total of more than 24 million fans. Failure to guide such opinion leaders is likely to lead investors to follow suit and exacerbate systemic risks in the market. To this end, government and new media managers should supervise opinion leaders and deter them from making radical statements, guide them to express their views in moderation and standardization, not to over-interpret policy documents, and not to incite investor sentiment to induce them to make investment decisions.
7.2.2. Strengthen Information Disclosure Supervision
From the DSSW model and noise trading theory, we know that in order to reduce the adverse effects of irrational transactions of noise traders in the market, the proportion of information traders in the market should be increased, which requires reducing the cost of information acquisition, improving the effective information acquisition rate, and ensuring timely and accurate information disclosure. Due to the late start of the margin business in China’s securities market, the scale is small, and the participation of individual investors is low, resulting in the fact that the price of securities cannot quickly reach the equilibrium price when the news of major bearish news breaks out; the accumulation of panic often leads to the oversold phenomenon of securities prices. At the same time, the imperfection of the short-selling mechanism makes the price discovery ability of China’s securities market relatively weak, so it is necessary to strengthen the supervision of information disclosure, which can reduce the phenomenon of information asymmetry, improve investor confidence, and improve noise transactions caused by the lack of effective information.
7.2.3. Strengthen the Quality of Education of Investors
From the model results, we know that reducing assimilation, exclusion coefficient, etc. can reduce the polarization of investor emotions, which requires investors to have sufficient literacy to judge when responding to sudden financial events, reduce blind follow-the-trend behavior, and then reduce the inertia of the market.
Insufficient level of investor specialization is a major reason for the prevalence of noise trading, and to implement the market’s decisive position on the price of securities, market participants are required to have good risk identification ability and expected loss preparation, as well as to be able to effectively use public information for investment decisions. For the purpose of protecting investors, China has always implemented a strict market access system for listed companies, which not only protects investors, but also restricts investors’ initiative to improve their own investment level. Therefore, it is necessary to make full use of the advantages of reducing the marginal cost of education in the era of the knowledge economy to strengthen the quality of education of investors, which will play a vital role in improving the polarization of investor public opinion.
7.2.4. Deepen the Reform of the Registration System
For the market, the implementation of the registration system is an important measure to improve the market-oriented allocation of factor resources; for investors, it is a major challenge to investment decisions. In order to cope with the uneven quality of enterprises brought about by the relaxation of listing approval, the regulatory authorities should focus on exploring the implementation of the classification supervision of the investment banking business of securities companies, promote the improvement of investment banking business capabilities, and urge the leading securities companies in investment banking business to establish norms and form industry benchmarks. In addition, the regulatory authorities should be vigilant against the impulses of securities companies with weak business capabilities, supervise and strengthen internal control, improve business quality, cultivate a good market ecology, improve risk prevention and control measures, and optimize regulatory methods and means to refine the work deployment. An open, transparent and efficient market operation system is an important solution to the frequent polarization of investor sentiment.
7.3. Deficiencies and Outlook
Due to the availability and accuracy of the data, this paper only takes the Chinese A-share market as the research object; the prominent feature of the Chinese A-share market is that there are mostly noisy traders, and individual investors are active in trading, which is an ideal research object for this study. However, it has not been verified whether this theory is still applicable in the market with more information traders or less interaction between investor sentiment. In addition, the subject of this project is an individual investor in China’s securities market, and there is no mechanism for studying the influence of market sentiment on institutional investors.
In future research, we will take the securities markets of developed countries as the object of research to test whether differences in market effectiveness and individual investor participation will lead to differences in research conclusions. In addition, the mechanism for institutional investors to be affected by market sentiment will also be considered, which will provide a full range of references and suggestions for the government to reasonably guide market sentiment.


