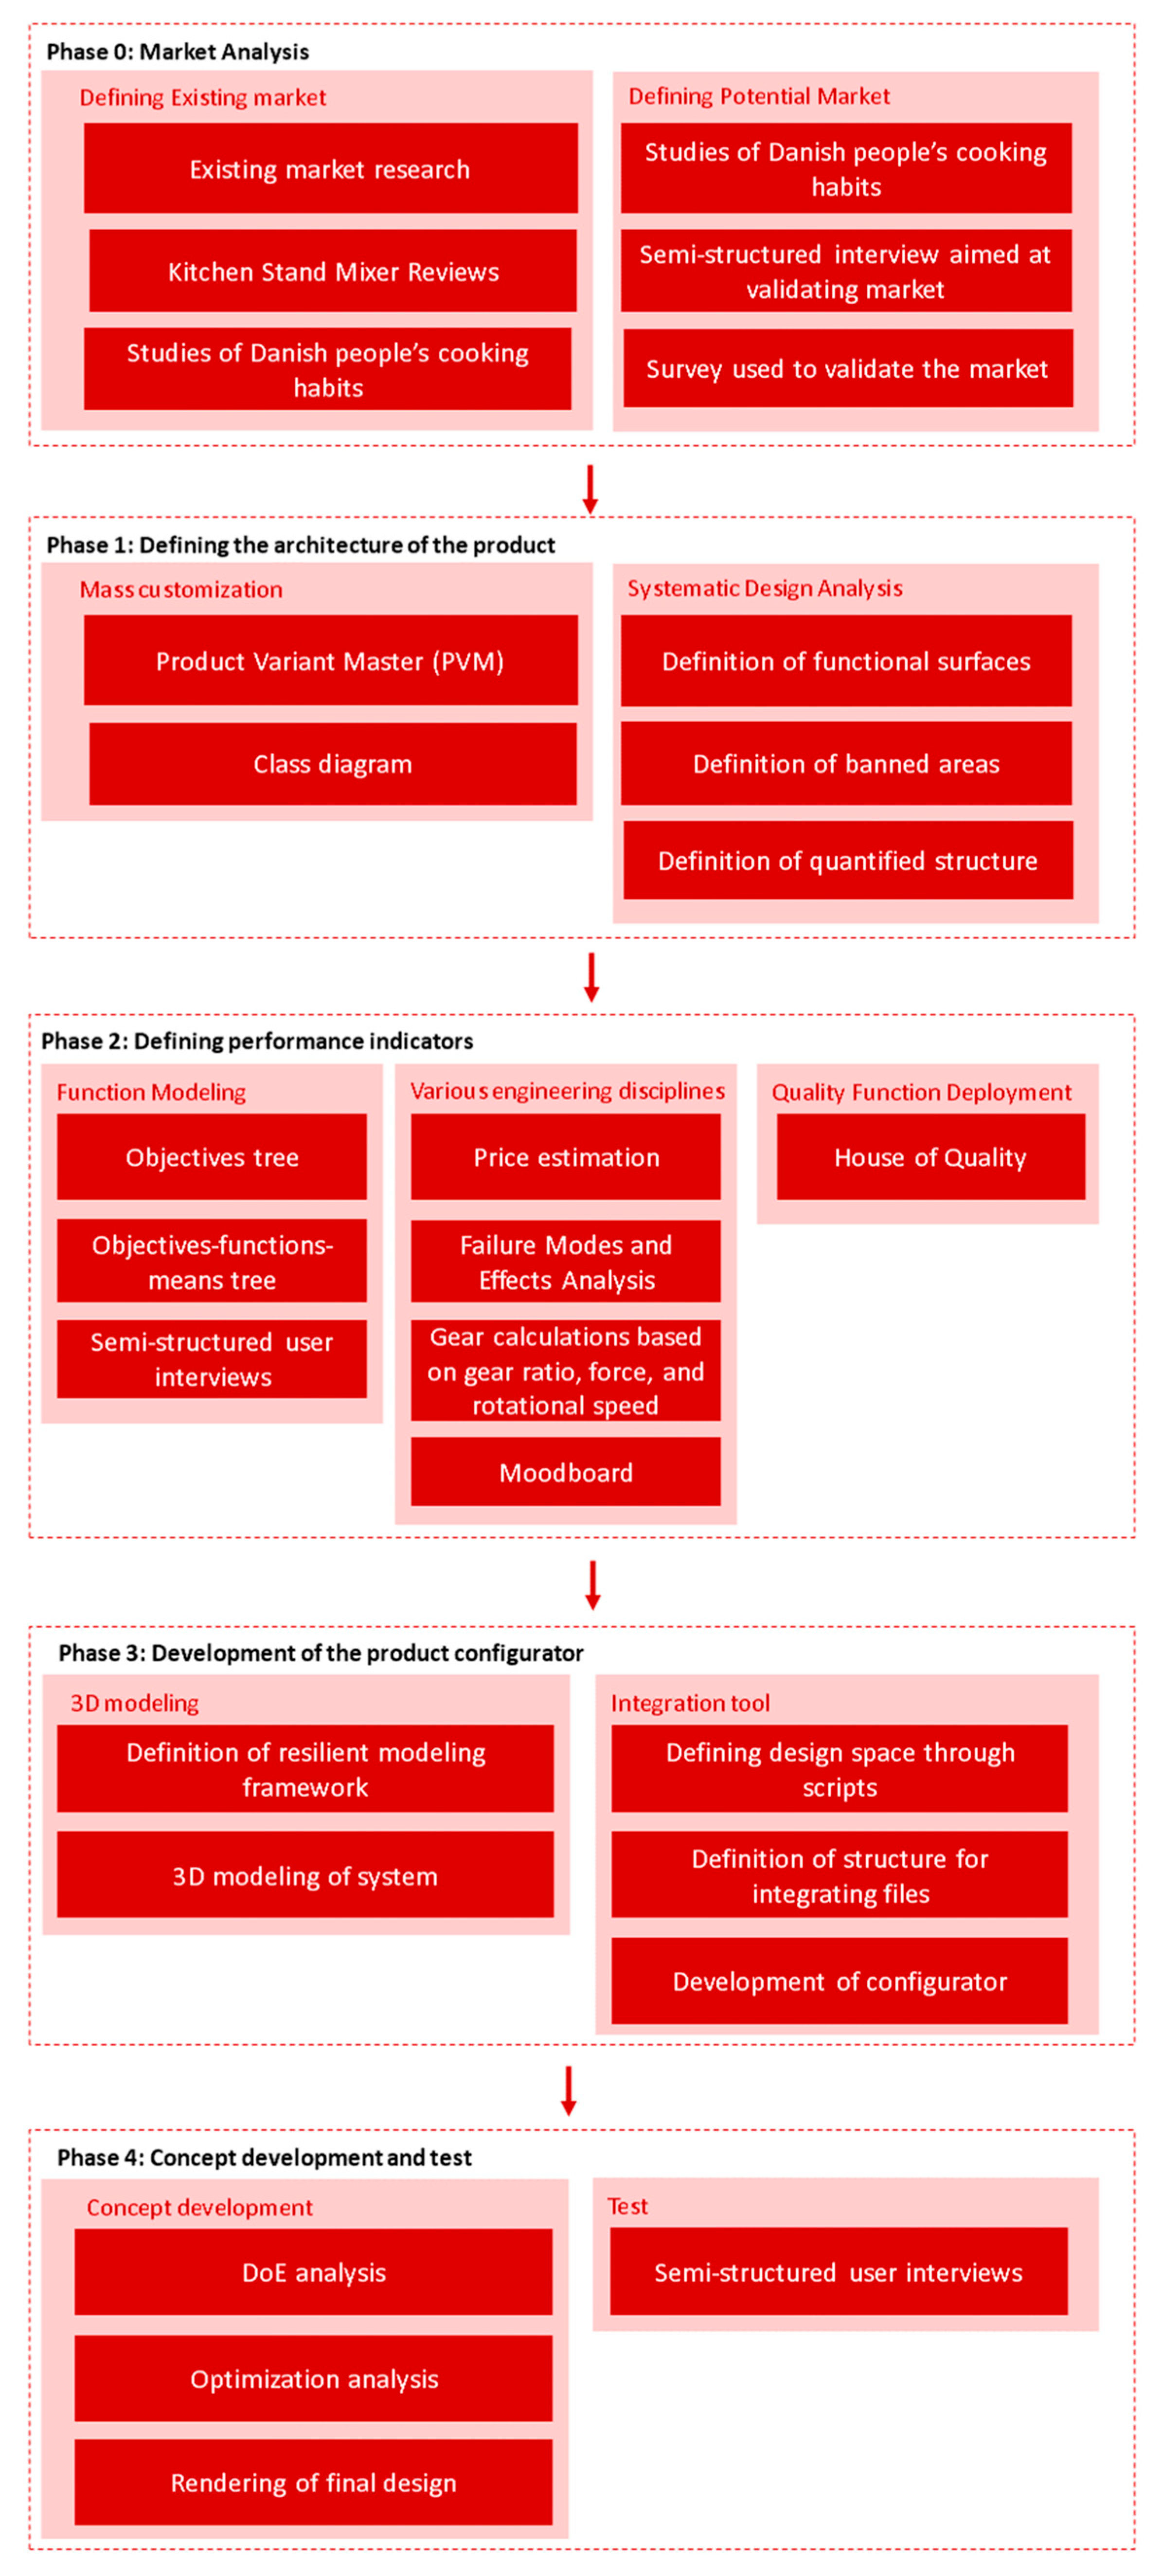
A pre-stage of the project included initial market research in order to specify the potential customer segment. The kitchen stand mixer (the chosen consumer product) was analyzed and decomposed into different systems in the first phase of the research. During the next phase, the customer needs were documented and translated into measurable performance indicators for the concept. In the third phase a flexible 3D model of the product was created along with an environment where changes to the 3D model would affect the value of the different performance indicators. Lastly, different concepts were created with this tool and feedback was provided by potential customers on the concepts. Each process step is briefly described in the next sub-sections focusing on the methods used.
During our research multiple interviews have been conducted based on an individual semi-structured interview format [
13], since it was important that the participants were able to elaborate on their answer and add anything we might not have thought important for each topic. An interview guide was created and applied based on the initial market research. However, our method differs from the method from Kallio et al.’s research [
13], since no pilot studies were conducted. Thus, our method has some limitations. First, the phrasing of the questions could lead the participant’s responses in a certain direction [
13]. Additionally, the prior research might be limited, which would have resulted in missing questions/topics in the guide. The responses were analyzed quantitatively, for example, while asking about what values the user found most important, and the average of all participants’ answers were used. The sample size was always based on the maximum number of participants which we were able to recruit (being within the definition of the customer segment). All interviews were done online as video calls due to the COVID-19 pandemic.
The surveys were all conducted as online surveys to obtain a general view from the customer segment on a very well-defined aspect. These were distributed through social media.
2.2. Phase One: Architecture of the Product
The basic structure of the product for which a new concept had to be developed (a kitchen stand mixer) was defined through methods of product range analysis based on methods from Hvam et al. [
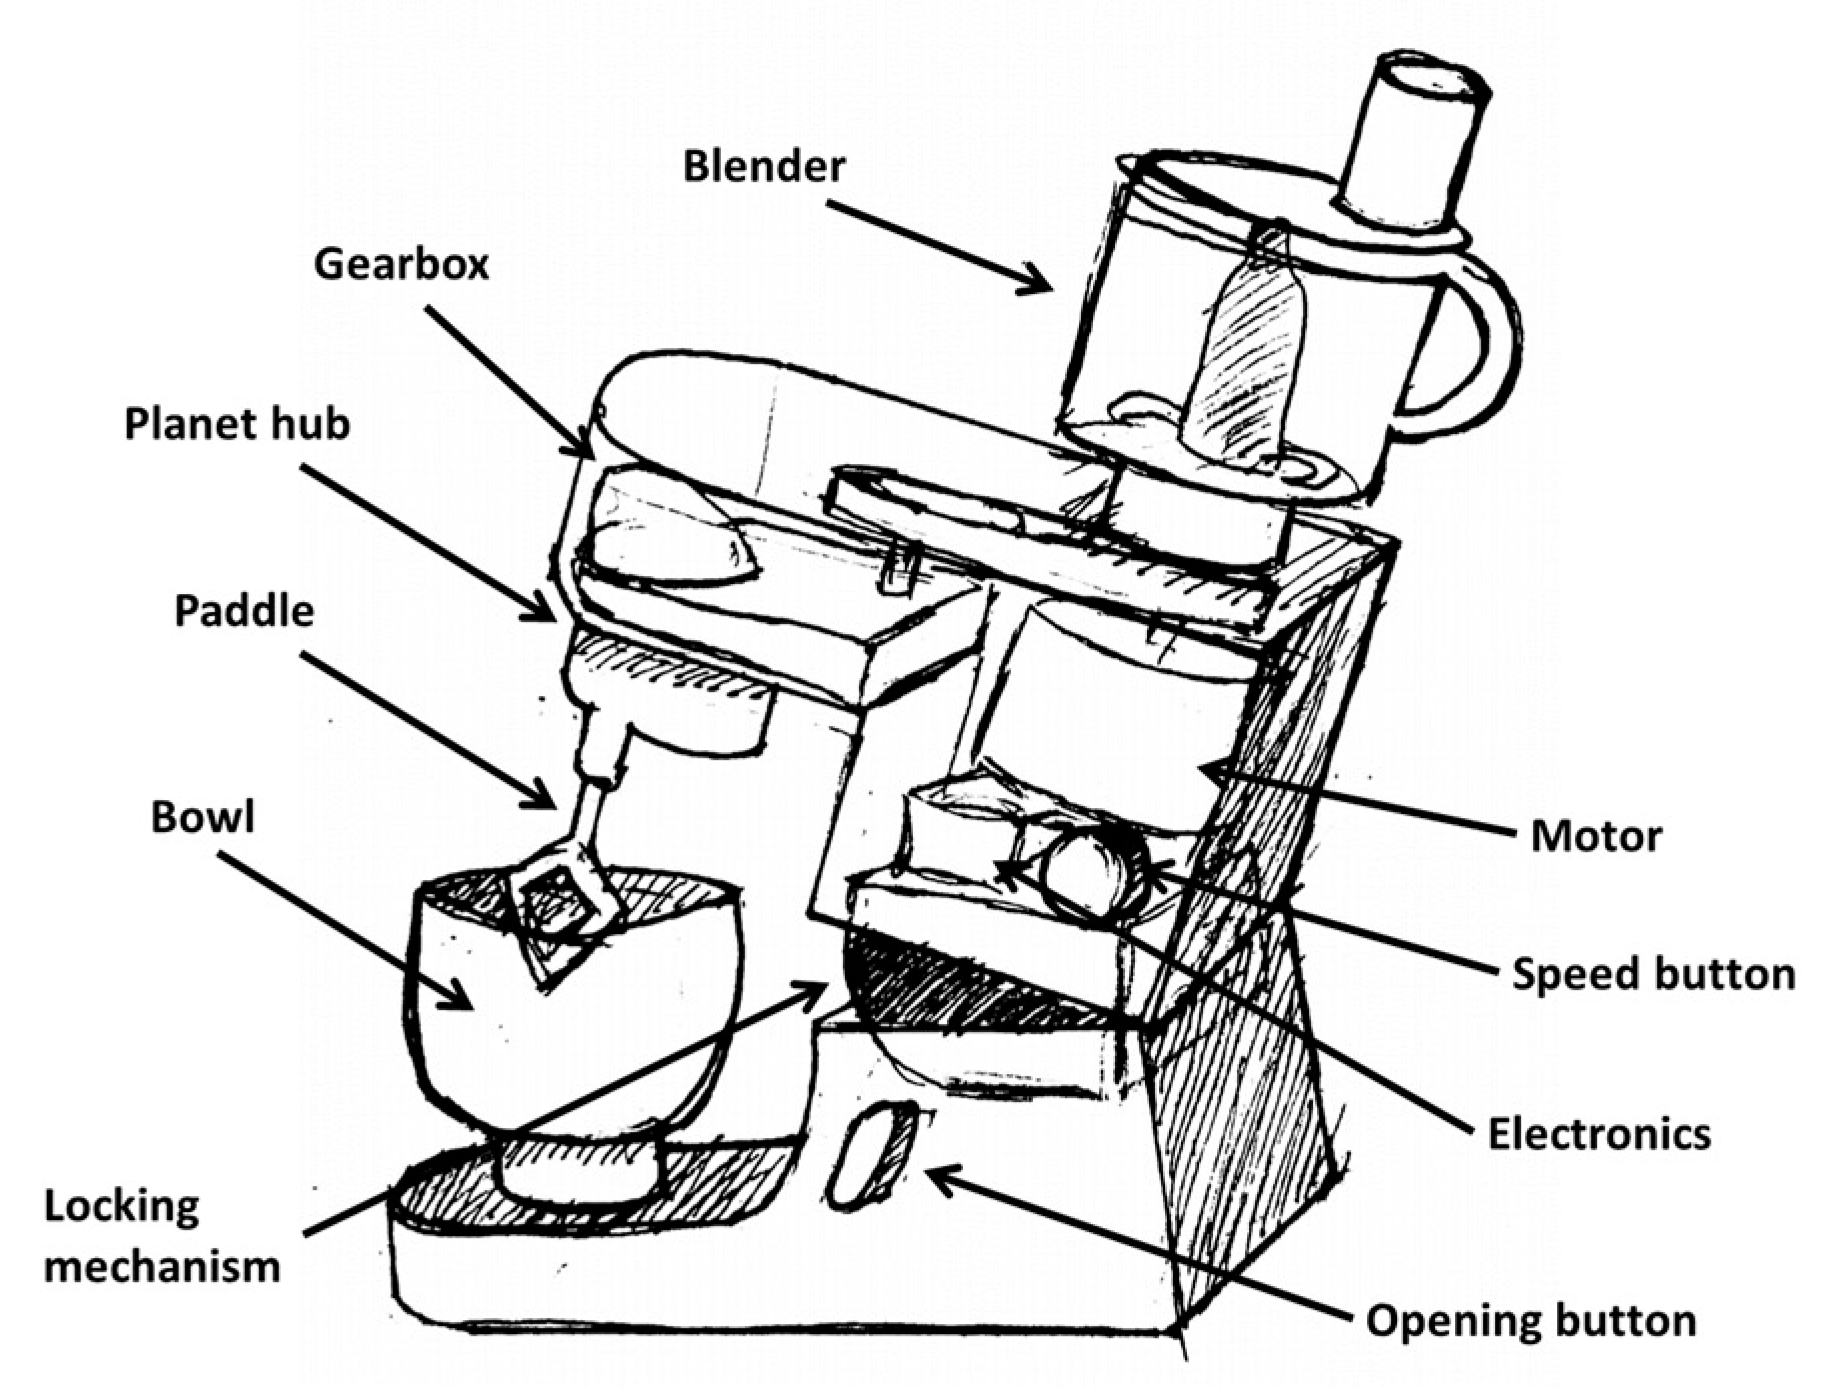
7]. This provided an understanding of the different parts of the product. Furthermore, systematic design of industrial products by Eskild Tjalve [
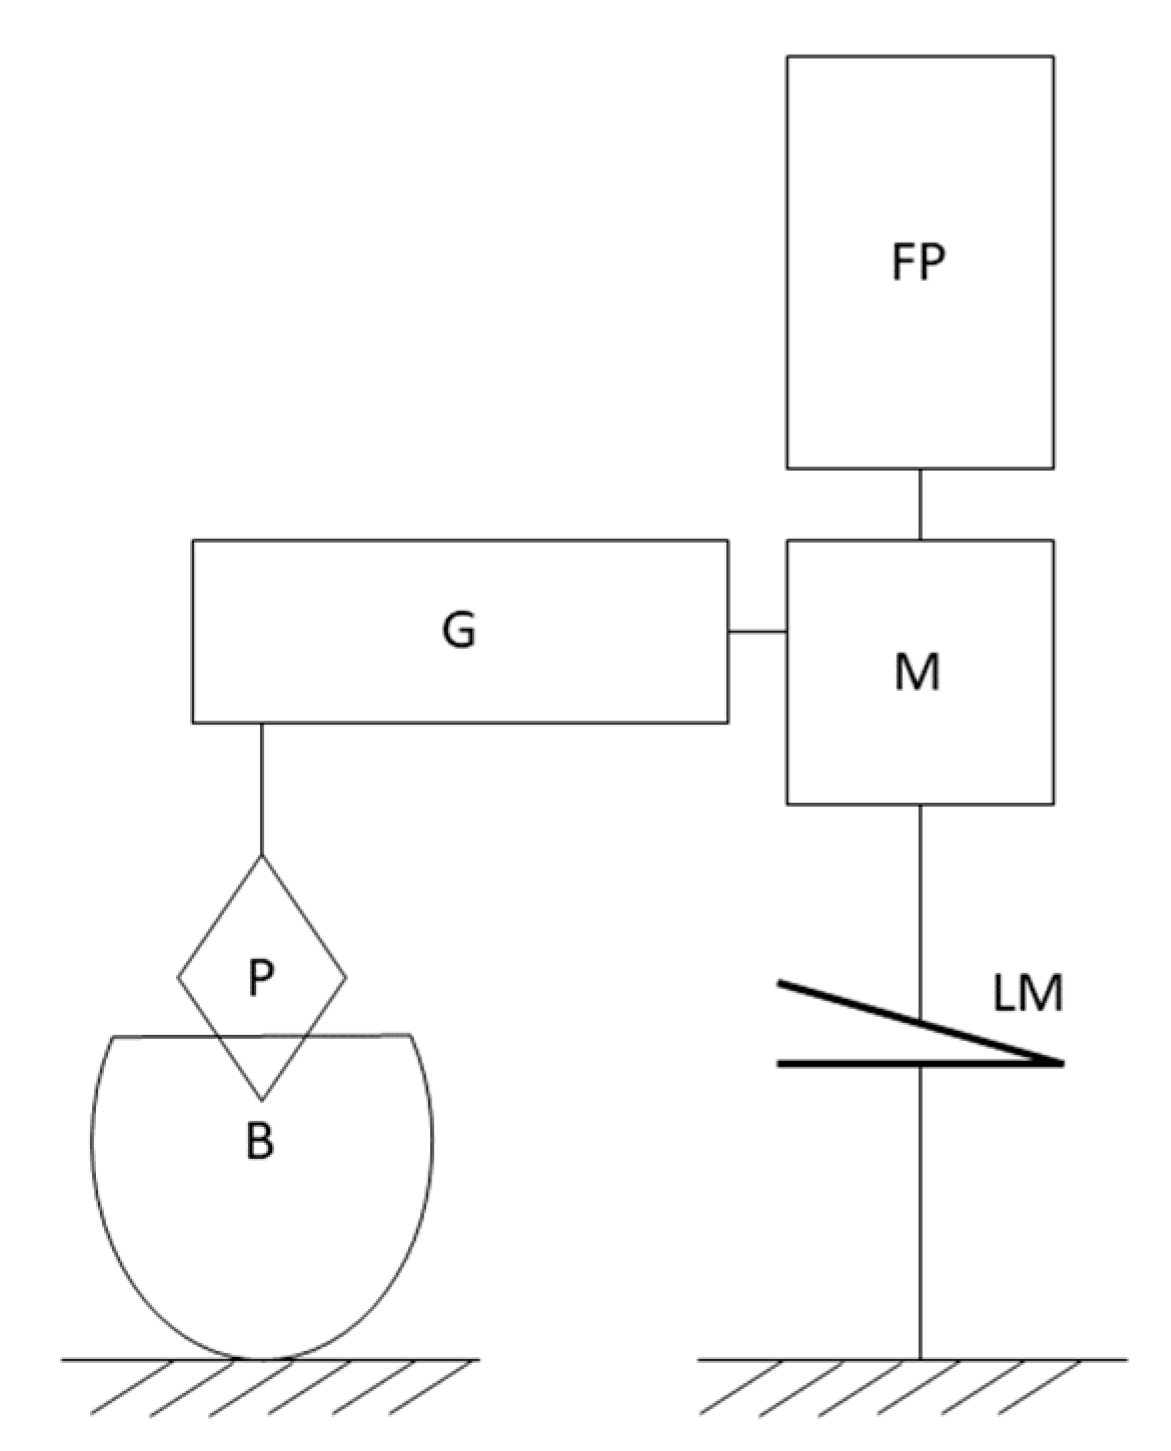
12] was used to provide an understanding of the physical structure of the product and how the parts were constrained in the three-dimensional space. The main parts of the product are illustrated in
Figure 3.
This was based on the limited information on Kenwood’s webpage [
16], research on the internet showing different kitchen stand mixers being assembled and disassembled [
17,
18,
19,
20], and the service manual of the old Kenwood Chef A701A from 1976 [
21].
The product parts and their differences were mapped in the part view of a product variant master (PVM) (see thesis for the PVM [
1]). The product variant master is a mass customization method used to divide the product into an aggregated structure providing an overview of all parts of the product and their different configurations/modules [
7]. However, due to the lack of information, the majority of the attributes of each part were based on material, overall size of the part, or different types of the same part.
Based on this analysis it seemed that some of the parts were customized to every new product series. This was the case for the housing, which varied greatly from series to series. However, other parts seemed to be modules, e.g., the motor, which existed in different sizes across series. These parts should be defined as modules of specific sizes in the configuration system, while customized parts should be flexible to change. The parts which seemed appropriate for modularization were the motor, speed button, paddles, bowl, and accessories.
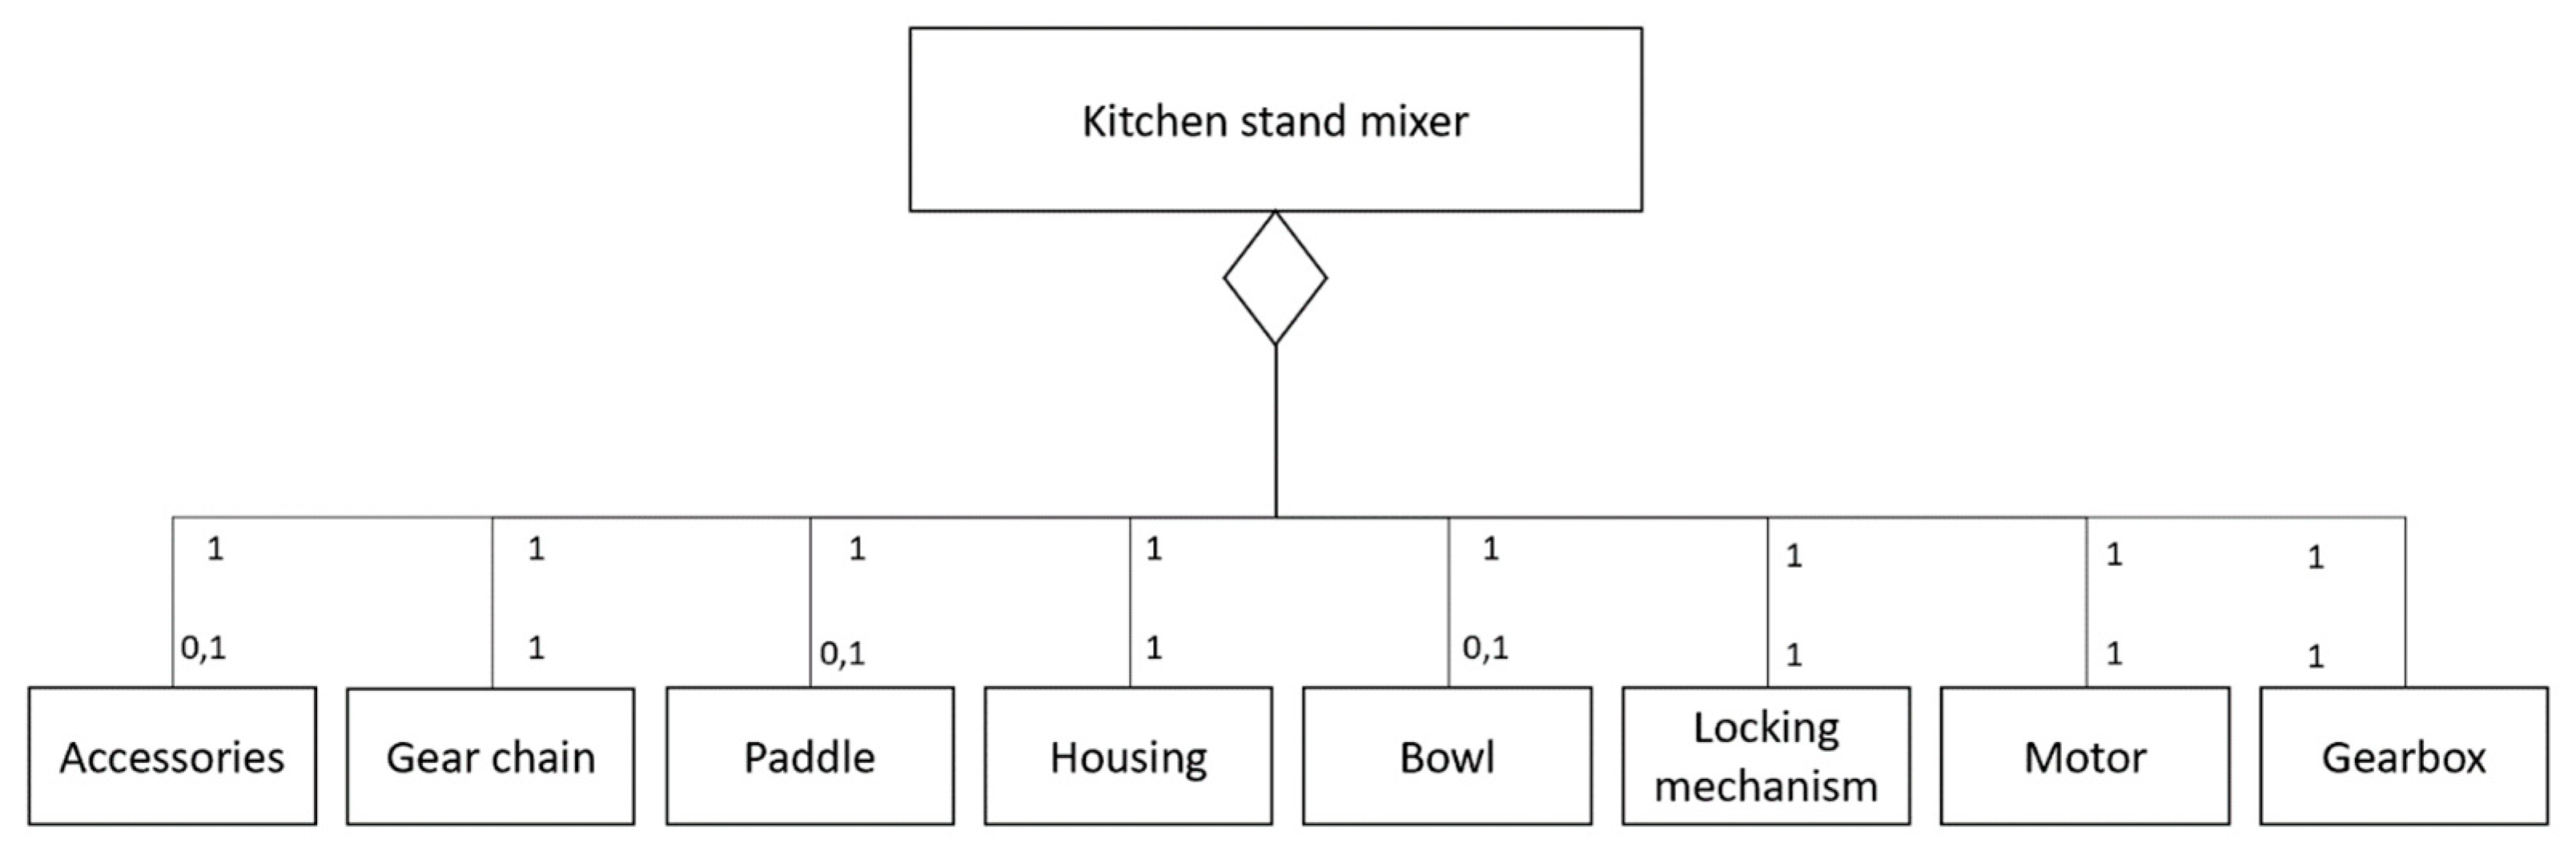
The main classes defined in the PVM were translated into a class diagram (see
Figure 4). The entity of the paddle and bowl was set to 0 and 1, since these were not needed during use of some of the accessories (e.g., the food processor).
The order in which the systematic design analysis was performed was the opposite of a regular design process because it was a reverse engineering process.
The functional parts of the machine and their corresponding restrictions in terms of geometry were analyzed based on functional surfaces (surfaces with an active function in relation to surroundings or other elements of the product) and banned areas (areas in space that must not be obstructed due to structural conditions, functional conditions, or operational conditions) [
12].
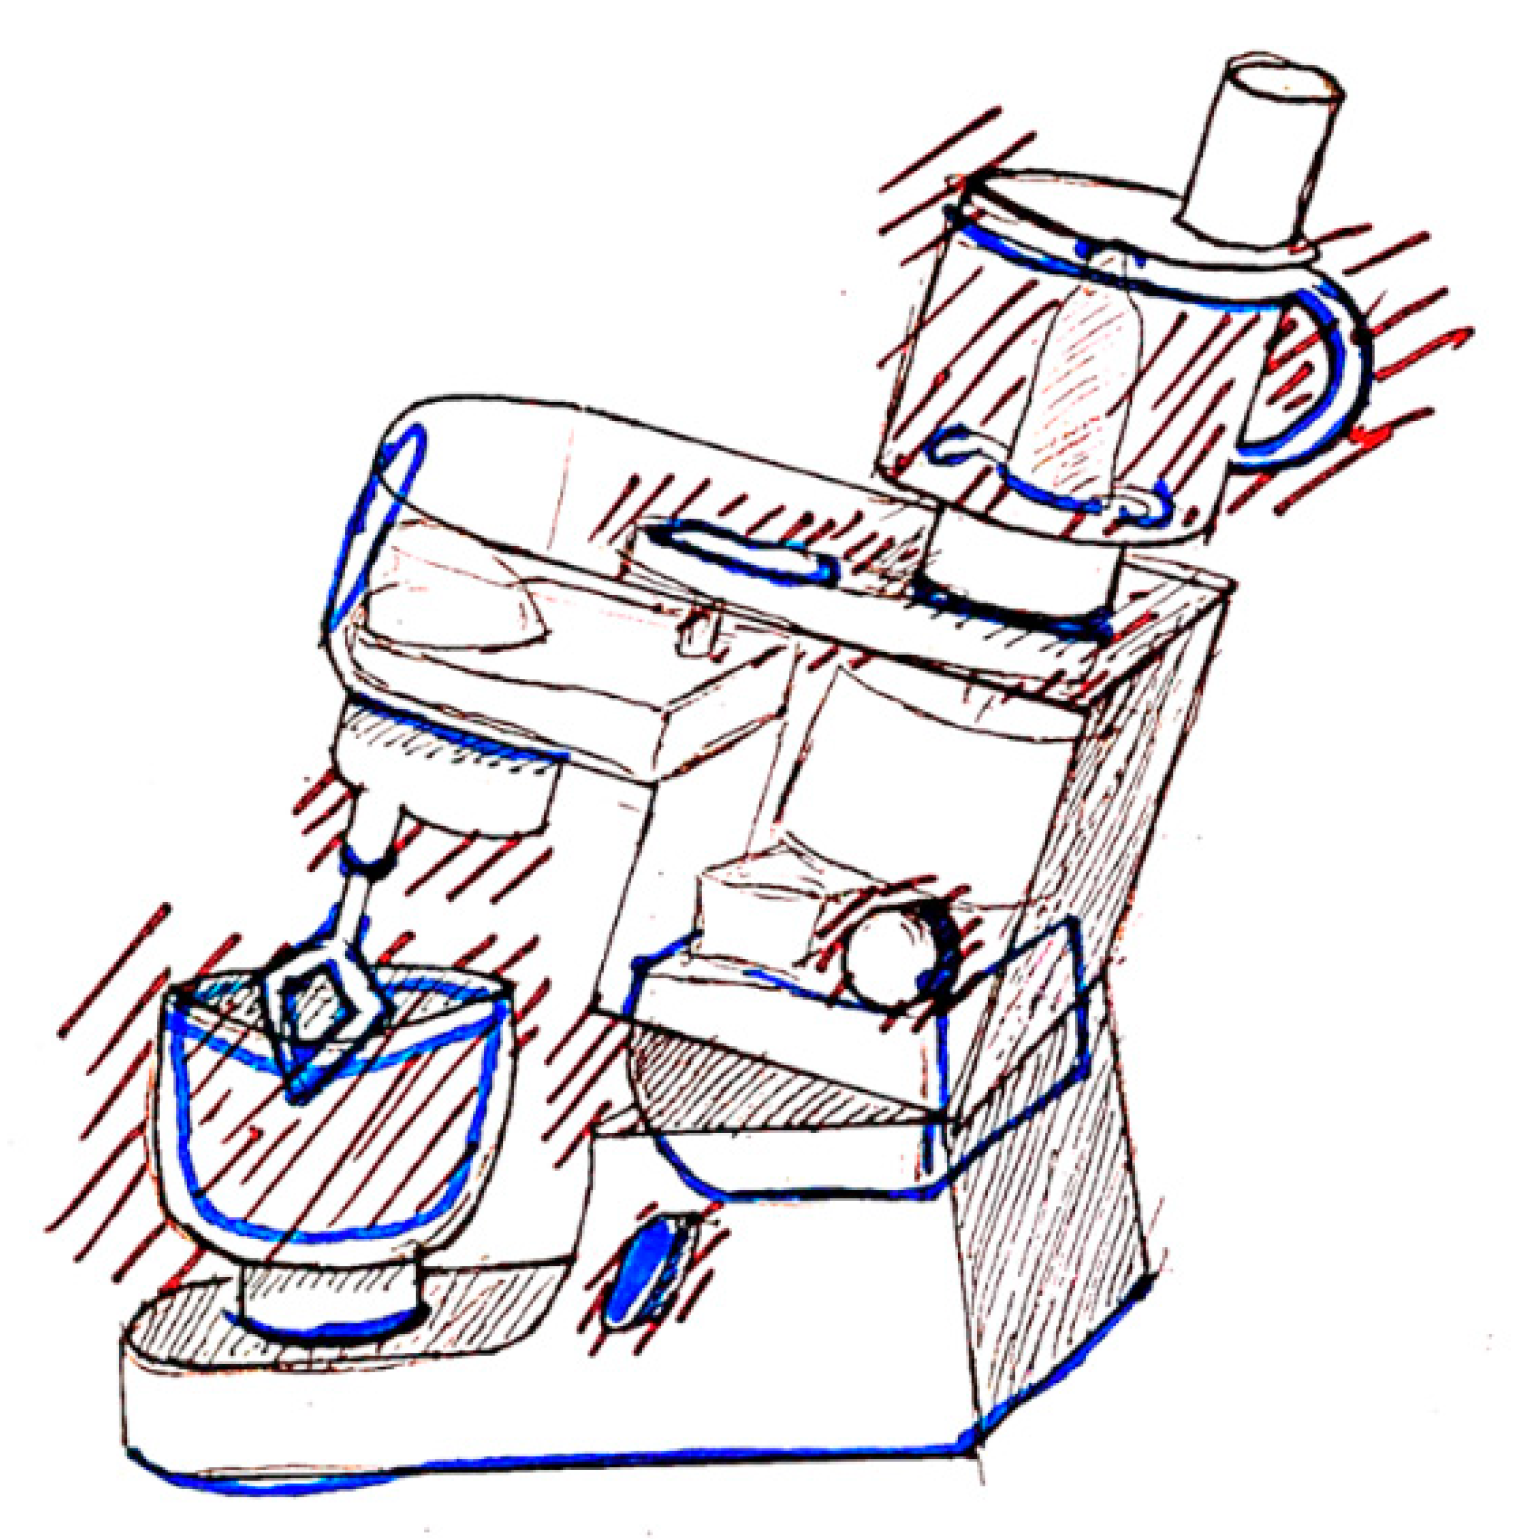
The banned surfaces and functional surfaces can be seen in
Figure 5. The figure confirms that there were a lot of functional surfaces and banned areas and that these sometimes overlap, especially in and around the bowl. It was therefore assumed that it would be necessary to have extensive restriction of the design space in this area.
Lastly, the quantified structure was defined which is the relative arrangement between elements of the product. The quantified structure seemed to be the same for all Kenwood machines and can be seen in
Figure 6. A fundamental/novel redesign of this product would include changes to the quantified structure. However, this was not part of this redesign, since only incremental changes would occur.
2.3. Phase Two: Defining Performance Indicators
The overall goals/objectives of the kitchen stand mixer were mapped in an objectives tree [
2] based on the semi-structured interview (with 8 people) and survey (with 19 people) from Phase 1 and reviews of kitchen stand mixers (from Pre-Project Start). The objectives were all made based on the user’s perspective and needs. Objectives in terms of production, etc., were therefore not considered. At this stage some objectives contained undefined or vaguely defined words/phrases (design, effectiveness, and maintenance). These were investigated through a semi-structured interview with 5 potential customers of the product to specify the objectives based on the user’s perspective. It was not deemed feasible to go into detail with all objectives and define them in the final model during this project. The objectives in the five most popular categories (according to the first online survey) were chosen for further investigation. These included “Durability”, “Effectiveness/productivity”, “Maintenance”, “Price”, and “Design”.
The objectives from these categories were translated into device-centric functions based on function modeling. The functions were then translated into different components (means of solving the function). This was mapped in a tree structure inspired by the functions–means tree [
2]. However, the different means (solutions) to the functions were not explored since this was already defined by the current design of the kitchen stand mixer. It became apparent during this analysis that function modeling was not suitable for the objective categories of pricing and maintenance (except for “Low force needed to disassemble parts”); these could not easily be translated into device-centric functions, since the functions were based on product actions, while the objectives were based on external passive goals. The user needs categories were therefore quantified based on appropriate engineering aspects, since they could not be defined based on function modeling. These definitions will be briefly explained. Due to time constraints, it was decided not to include the food processor (accessory), since it would take too much time to model this sub-system of parts.
Price: Some areas of price are not directly affected by the design (e.g., administrative costs), while others are (e.g., the manufacturing cost of the product). Only the directly affected parts are considered in the price model (also called primary cost [
22]), since it was not feasible to consider all factors of pricing. It was assumed that some parts were standard parts, while others were unique for each design, since some parts were modules, while others were custom made (according to final PVM). In modularization, the different parts (classes) have different attributes, e.g., price [
7]. In these scenarios, the price estimation is based on a list of prices for each module. However, it was not possible to find any such estimations of the Kenwood kitchen stand mixer parts. The parts assumed to be standard parts/modules were therefore based on lists of buying prices (which were largely based on assumptions due to a lack of data). The price estimation of custom-made parts was based on calculations of the estimated cost of production of the part (summation of the labor/tooling and material costs of the manufacturing price of each part). This was based on pictures and videos of the machines used for manufacturing as well as a physical examination of a Kenwood machine.
The majority of the in-house produced parts were assumed to be manufactured by injection molding/casting. The cost of this (
Kt) was therefore calculated based on tooling cost (
Kd), production cost/processing cost (
Ke), and material cost (
Km) (from chapter 4–7 of [
22]):
The price estimation would therefore not be usable as a direct estimation of the final price to the customer, but a tool to figure out how much different designs would affect the price.
Durability: The method of analyzing potential failure modes and their causes was estimated to be the best approach to better understand the wear and tear of the product. Information from the repair shop Kenwood Chef Service [
23], British Explorers’s webpage [
24], and reviews of the different Kenwood stand mixers on amazon.co.uk were used to determine the most common failures of the product. Only bad reviews relevant to the usage of the product were taken into consideration. The combination of knowledge from the repair shop (who often repairs the machines after they have been in use for some time) and buyers (who often review shortly after buying) was assumed to provide a good overview of the most common issues during the beginning and end of the machine’s lifetime. A fault tree was constructed based on this information and imagined potential failure modes to obtain an overview of the overall failure modes and how they were related to the different parts of the product. The fault tree was then translated into a simple failure mode and effects analysis (FMEA). Some of the faults from the tree had a risk level of “Unacceptable”. The most critical faults were translated into objectives. The list of requirements was too long for it to be feasible to include all requirements in the model. Some of these were therefore removed. The following three requirements were therefore chosen for further detailing:
The kitchen stand mixer must stay on the same spot on the kitchen table during use.
The overload protection should not cut out the motor during normal use due to density/viscosity of ingredients. Additionally, the motor should not become overworked due to the same issue.
The motor should have an appropriate torque.
Requirement 1 was quantified by ensuring that the machine was heavy enough to stay still during use. This was quantified based on the force at which the paddle moves, which should be lower than the gravitational force of the machine multiplied by the friction coefficient (based on the surface material of the machine and the surface it is standing on). If the machine is too lightweight, then suction cups should be added to the machine to keep it in place.
Requirement 2 and 3 could be ensured with a motor with a certain power which can withstand the torque of the paddle. This would ensure that the overload mechanism would not need to kick in. The known differentiator between the motors was the power. The minimum amount of power for the motor therefore needed to be quantified. This was calculated based on the force transfer between the different gears and transforming the power (watt) of the motor into force (N) (full derivation accessible in the thesis [
1]). The calculation was based on an assumed max force on the paddle needed to move the ingredients in the bowl (assumed to be no more than 50 N). This force was not transferred directly to the motor, but through the gears in the gearbox, planetary hub, and the gear on the motor. The max force/torque which the motor would experience from the paddle (
P, watt) would therefore be calculated based on the input force (on paddle) (
F_I, in N), the gear ratio (
t), loss of momentum (
M, set to 10%), the size of the gear on the motor (
dA, in mm), and the maximum speed of the paddle (
S_I, in rpm):
It was not possible to determine any values of the size of the gears in the gearbox. They were therefore based on optimization analysis in terms of what there would be space for in the gearbox in the model. However, the size of the gears in the model followed the basic EU standards of gear sizing [
25]. The size of the gears was based on the number of teeth and modular, where the modular was kept the same between two interacting gears.
Effectiveness: This was based on one objective from the objectives tree which could be quantified: (1) “Capable of holding an appropriate volume of food” which could be ensured by measuring the volume of the bowl. The other objectives were deemed infeasible to model without physical experimentation (e.g., (4) “Stir/blend food of different viscosities”).
Maintenance: Maintenance was defined as cleaning of the machine in the objectives tree, since this was the only thing customers had to do to maintain the product. This was made quantifiable in the model based on the cleaning time (
t). This was based on the surface area of the outside parts of the machine:
The cleaning time was calculated based on surface area of housing (s_h), surface area of buttons (s_b), surface area of planetary hub (s_ph), surface area of bowl (s_l), surface area of paddle (s_p), and cleaning time per surface area (t_a).
The other objectives in the objectives tree were deemed infeasible to model without physical experimentation, e.g., “Easy to clean”, which depends on the geometry of the parts.
Design: “Design” or “aesthetic” are very vague terms. The definition of “good design” or aesthetically pleasing design could be very individual. The goal was therefore to quantify which design the customer segment preferred and what dimensions/geometries contributed to a “pleasing design”. This was performed based on surveys. The current landscape of the design of the kitchen stand mixer was investigated through extensive search on Google Pictures and vendors such as EL-giganten, KitchenOne, and Skousen. Almost all of these share the same basic structure. The main difference between them was whether the housing is boxy or more organic.
This was used as inspiration for making 19 new different designs (see
Figure 7), where the geometry and dimensions were varied but the quantified structure was kept the same. The designs were used in an online survey. The participants were asked to rate the designs from 1 to 5 and choose what words they would use to describe the design (based on the most common words used to describe “design” in fiction [
26]). The purpose of the survey was to map whether certain features would have a significant influence on the likability of the design. This was inspired by Burnap et. al.’s article on predicting consumer evaluation of generated car designs based on a large number (7000) of aesthetic ratings by consumers for vehicles [
10]. However, the analysis was performed manually and not by training an AI. A substantial amount of data was needed to be able to predict the likability of new designs. However, it was not possible to reach enough people (only 12 in the target group participated).
Since only a few people could be reached, it was decided to do a semi-structured interview instead to obtain in-depth data from each participant. The participants were asked what design they would prefer based on some of the designs from the previous survey. The participants were also asked what words they would use to describe the designs based on the words from the previous survey. Six people were interviewed. The results of the interview were very divergent in terms of which design the participants preferred. Some participants liked boxy, since it looked reliable, while others liked the organic/round shape. Based on these data it did not seem possible to quantify the design. Instead, different designs similar to the existing Kenwood kitchen stand mixer were created in the 3D model, which could then be analyzed and optimized. The different designs and their performance could then be shown to potential customers, which would provide feedback regarding whether they value a specific design more or whether other factors are more important.
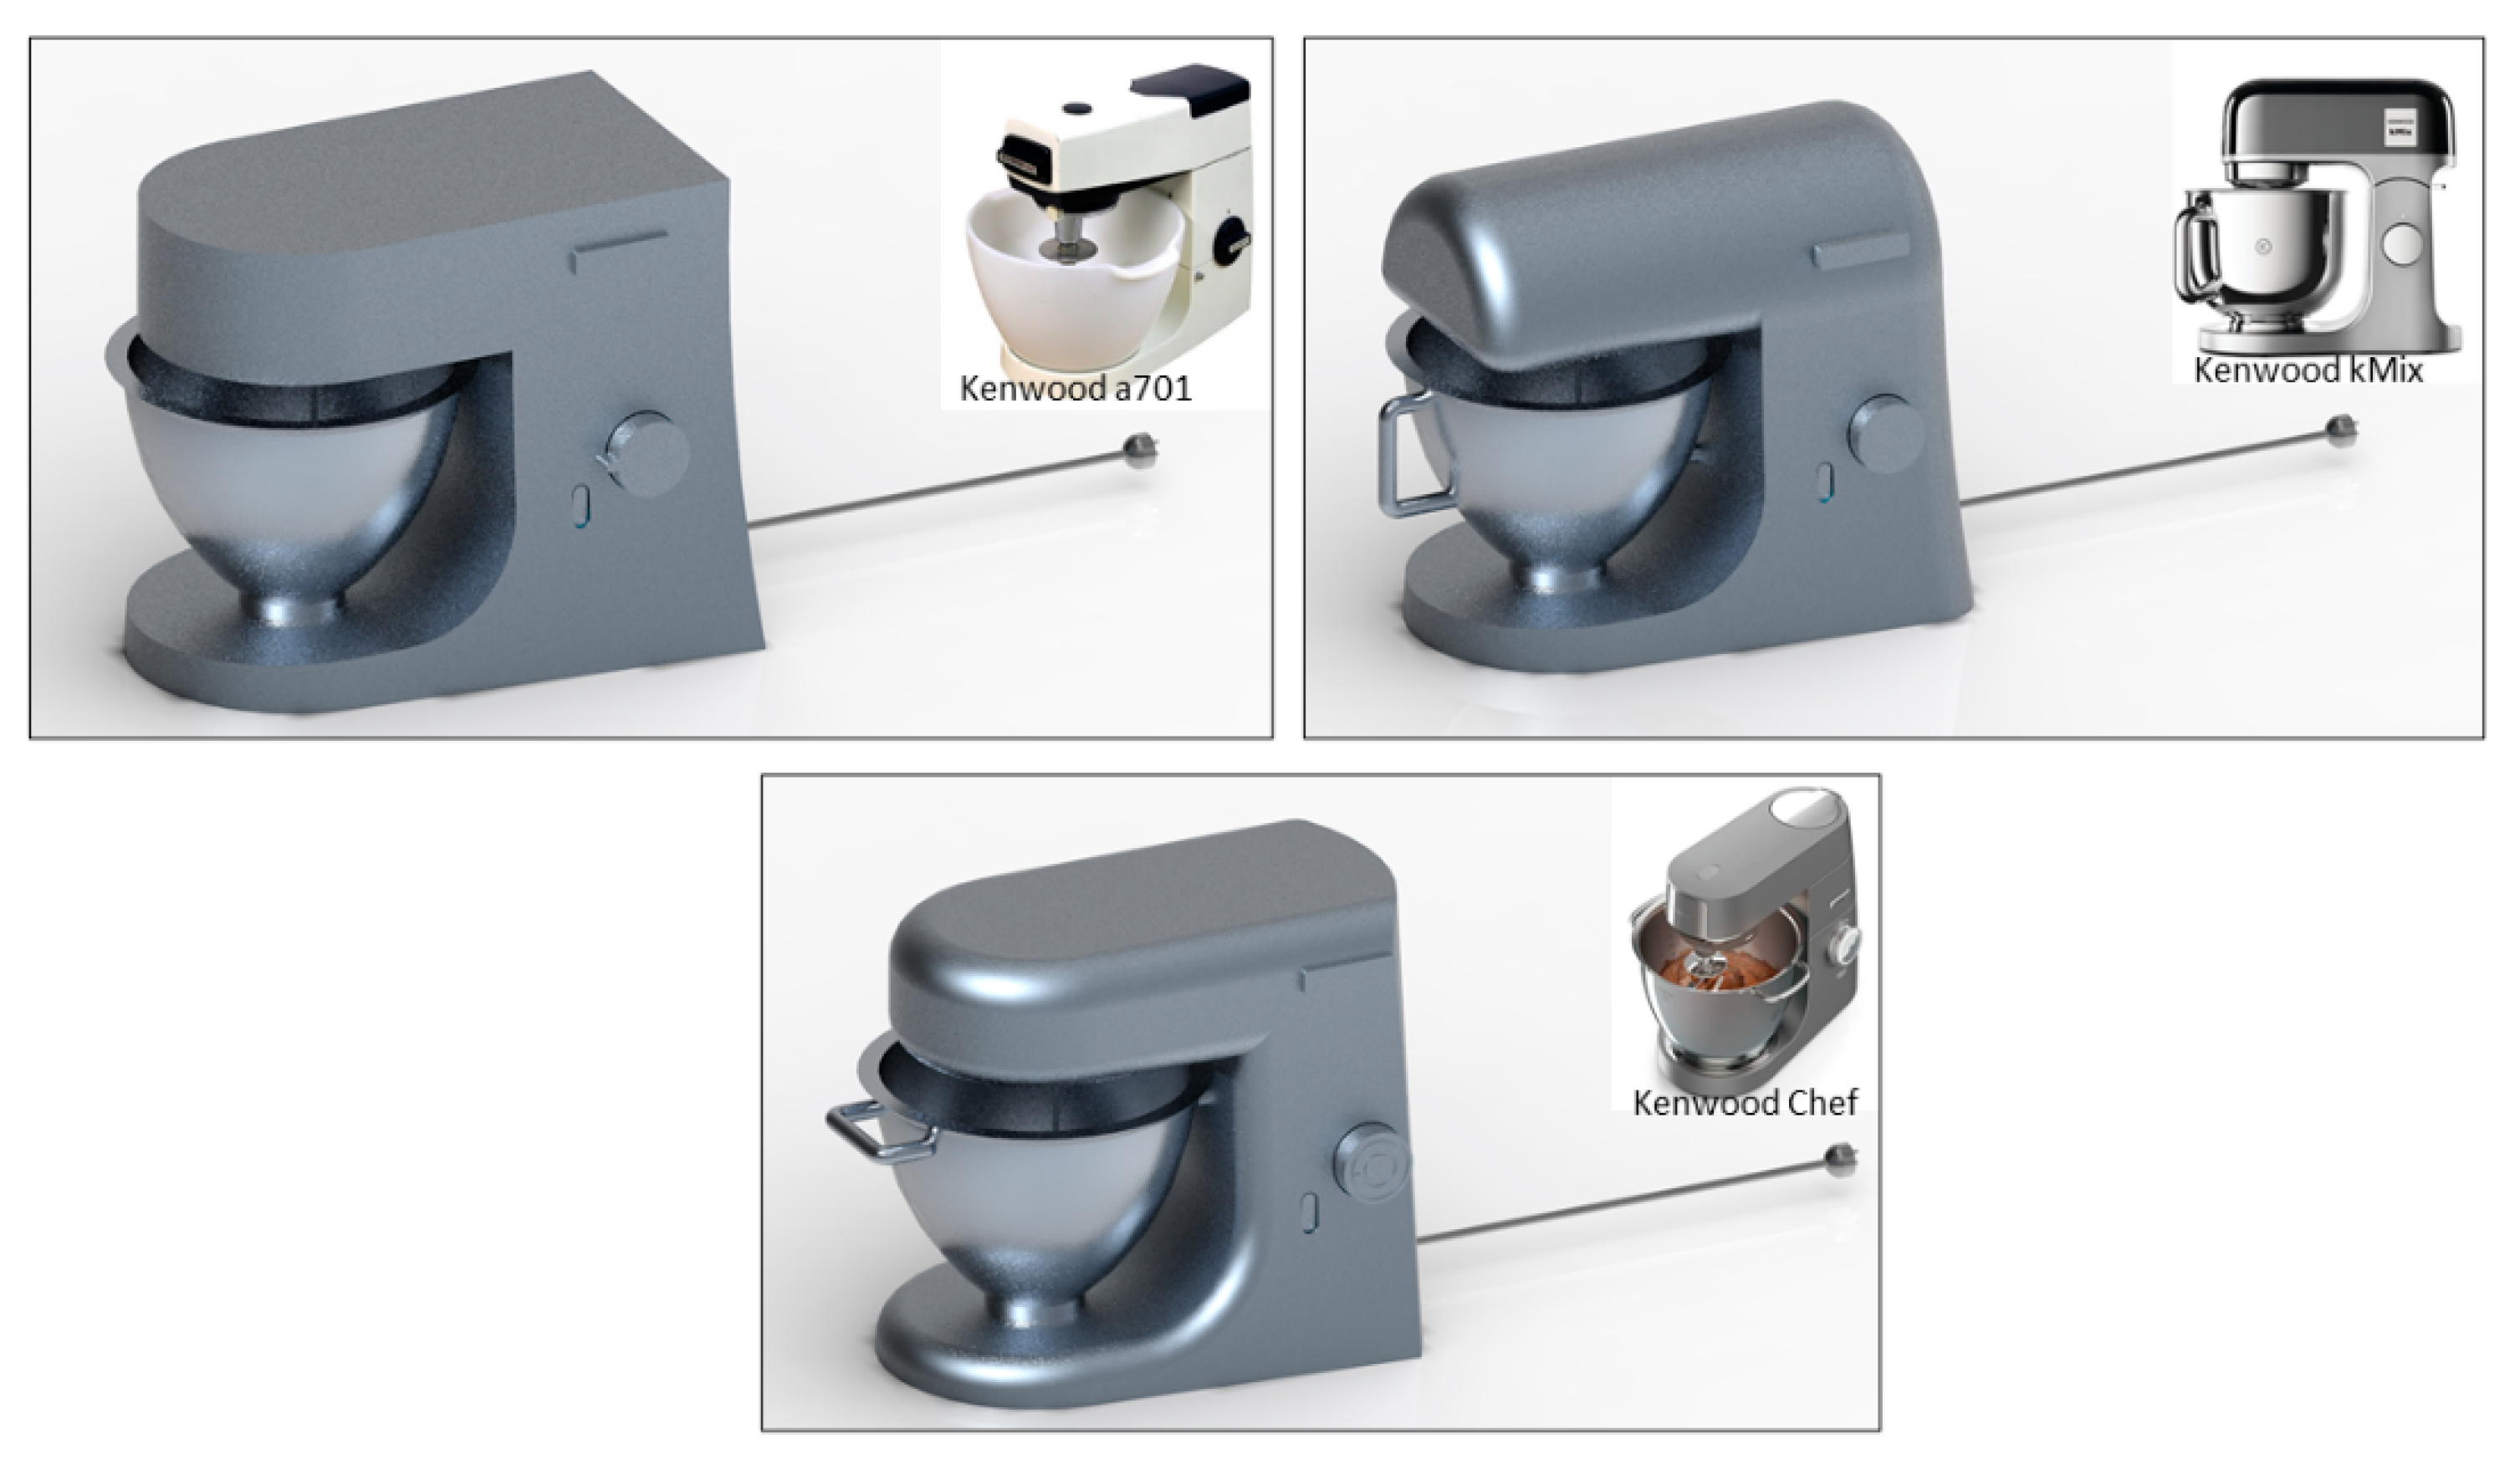
The major differences between designs of the Kenwood kitchen stand mixer (they are very similar) were the shape of the buttons and the overall shapes of the housing. Based on this, 3 different designs were constructed to capture the different Kenwood stand mixer designs (see
Figure 8). The kMix’er series could not be constructed as the original design, since this design has the motor at the top instead of in the “stomach” of the housing (different quantified structure).
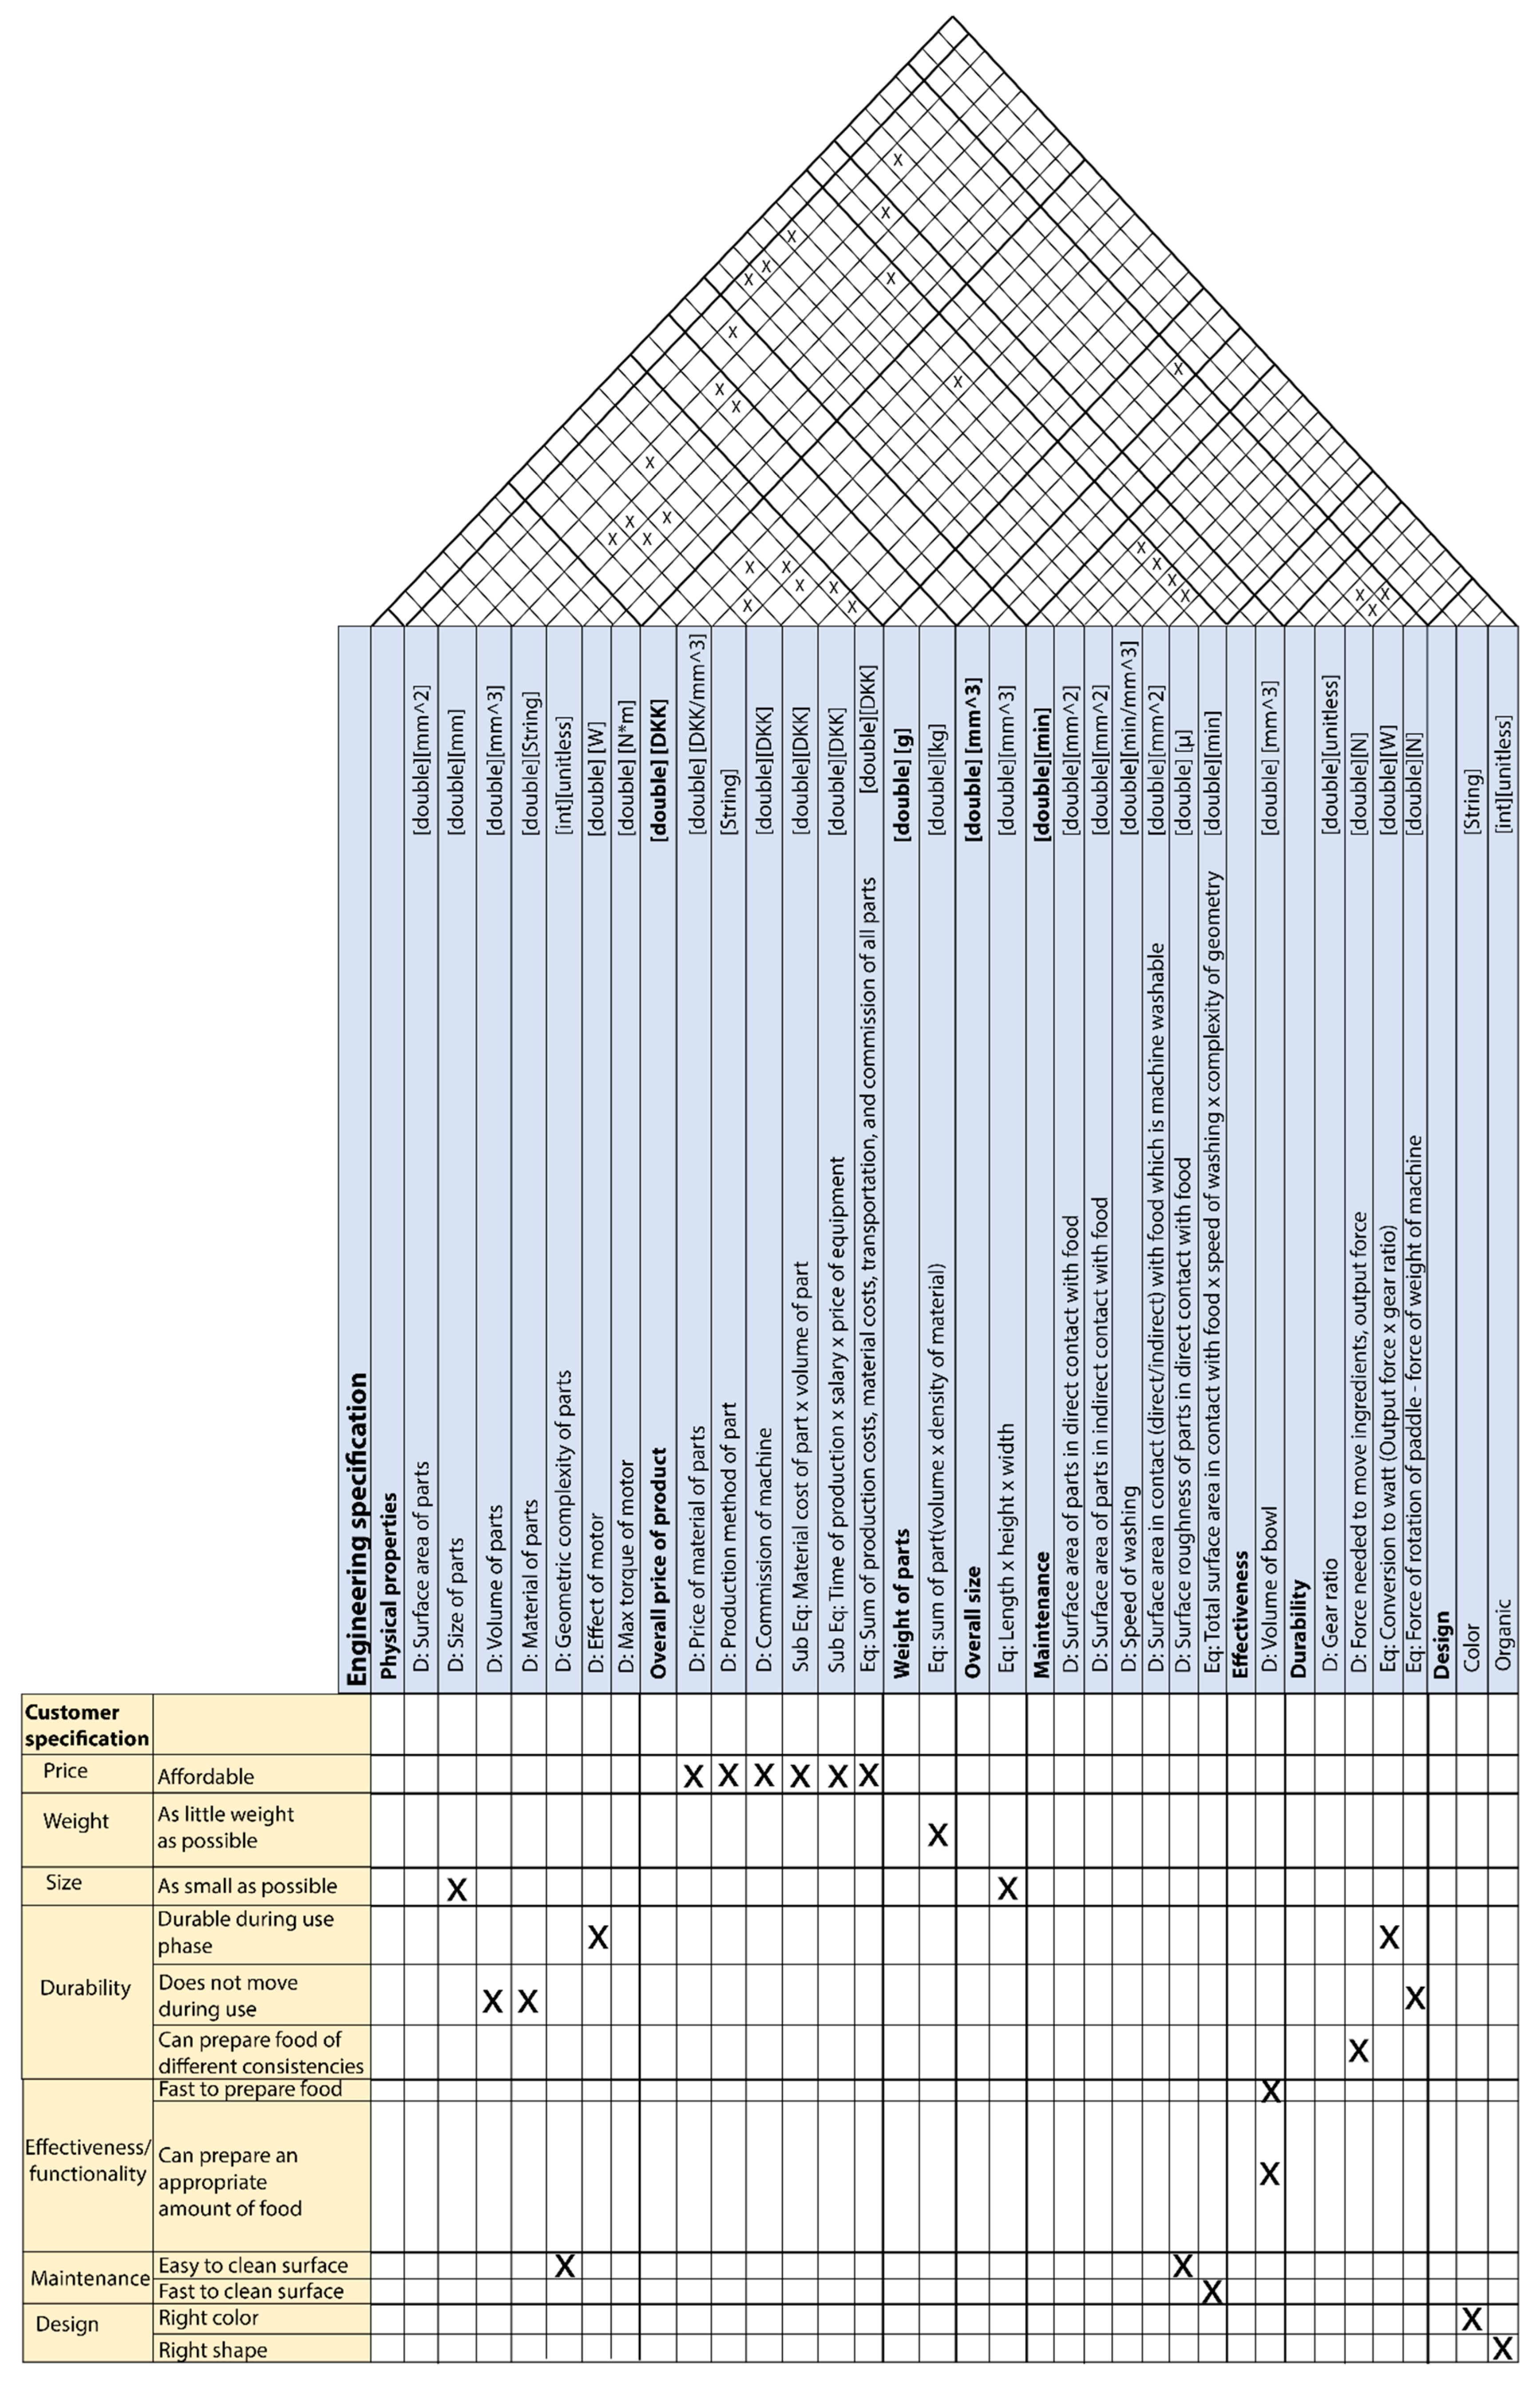
Extra parameters: The parameter of weight did not achieve a high score in the survey from the market research. However, this parameter was very simple to calculate by summarizing the volume of the parts (automatically calculated by the CAD software) and the density of the chosen material. This would therefore be calculated as well. From the quantitative interview from the market research, it also seemed that the overall size of the product was important, e.g., to make sure that it could fit into the cupboard. This was a simple multiplication of the width, length, and height of the smallest box which the kitchen stand mixer could be placed in. This would therefore also be a quantifiable aspect of the model.
A house of quality [
27] (
Figure 9) was constructed to create an overview of the connection between the engineering and customer view of the product.
2.4. Phase Three: Development of the Product Configurator
The configurator was created based on a 3D model constructed in PTC Creo Parametric, which was integrated into Phoenix Integration’s ModelCenter, an integration tool. Many of the features in the 3D model (e.g., reference dimensions and family tables) were not transferable into ModelCenter (at least not with the standard wrapper made by ModelCenter). Only input parameters of the top level and driving dimensions were transferable into ModelCenter. These were all based on common data types such as arrays (no matrices), Boolean, integers, double, string, etc. The 3D model was made based on top-down design [
28] as a “skeleton model”, which consists of a “master file” with the blueprint for the different parts/sub-systems of the product. This ensures that the sub-systems are feasible/appropriate for one another. The assemblies and sub-assemblies should therefore correspond to the class diagram. However, some sub-classes were modeled as separate parts due to their different placement in the three-dimensional space. The structure of the master file was based on resilient modeling [
29] (see
Table 1) where the goal was to construct a robust 3D model when subjected to change. This was achieved by minimizing unnecessary inter-dependencies between features through the use of reference features and a core feature. The core feature chosen was the housing/shell of the model. Consequently, all other parts were defined based on the chosen size of the housing.
It became apparent during introduction of the first modalized part, the motor, that modulization was troublesome to incorporate into the integration software: it was necessary to create a separate script, which assigned the right values of each dimension of the module. Furthermore, if the module contained features which had to be suppressed/unsuppressed then this had to be specified in the programming window of Creo by manually writing an if-statement associated with a Boolean variable, which would then control this. Lastly, the modules could not be part of the Design of Experiments (DoE) analysis (since it was controlled by integer values). It was therefore decided to discard the option to modulate anything but the motor, since this had to be differentiated based on the different assortment of power (watt). Configurators often consist of different rules (constraints) regarding what modules can and cannot be combined [
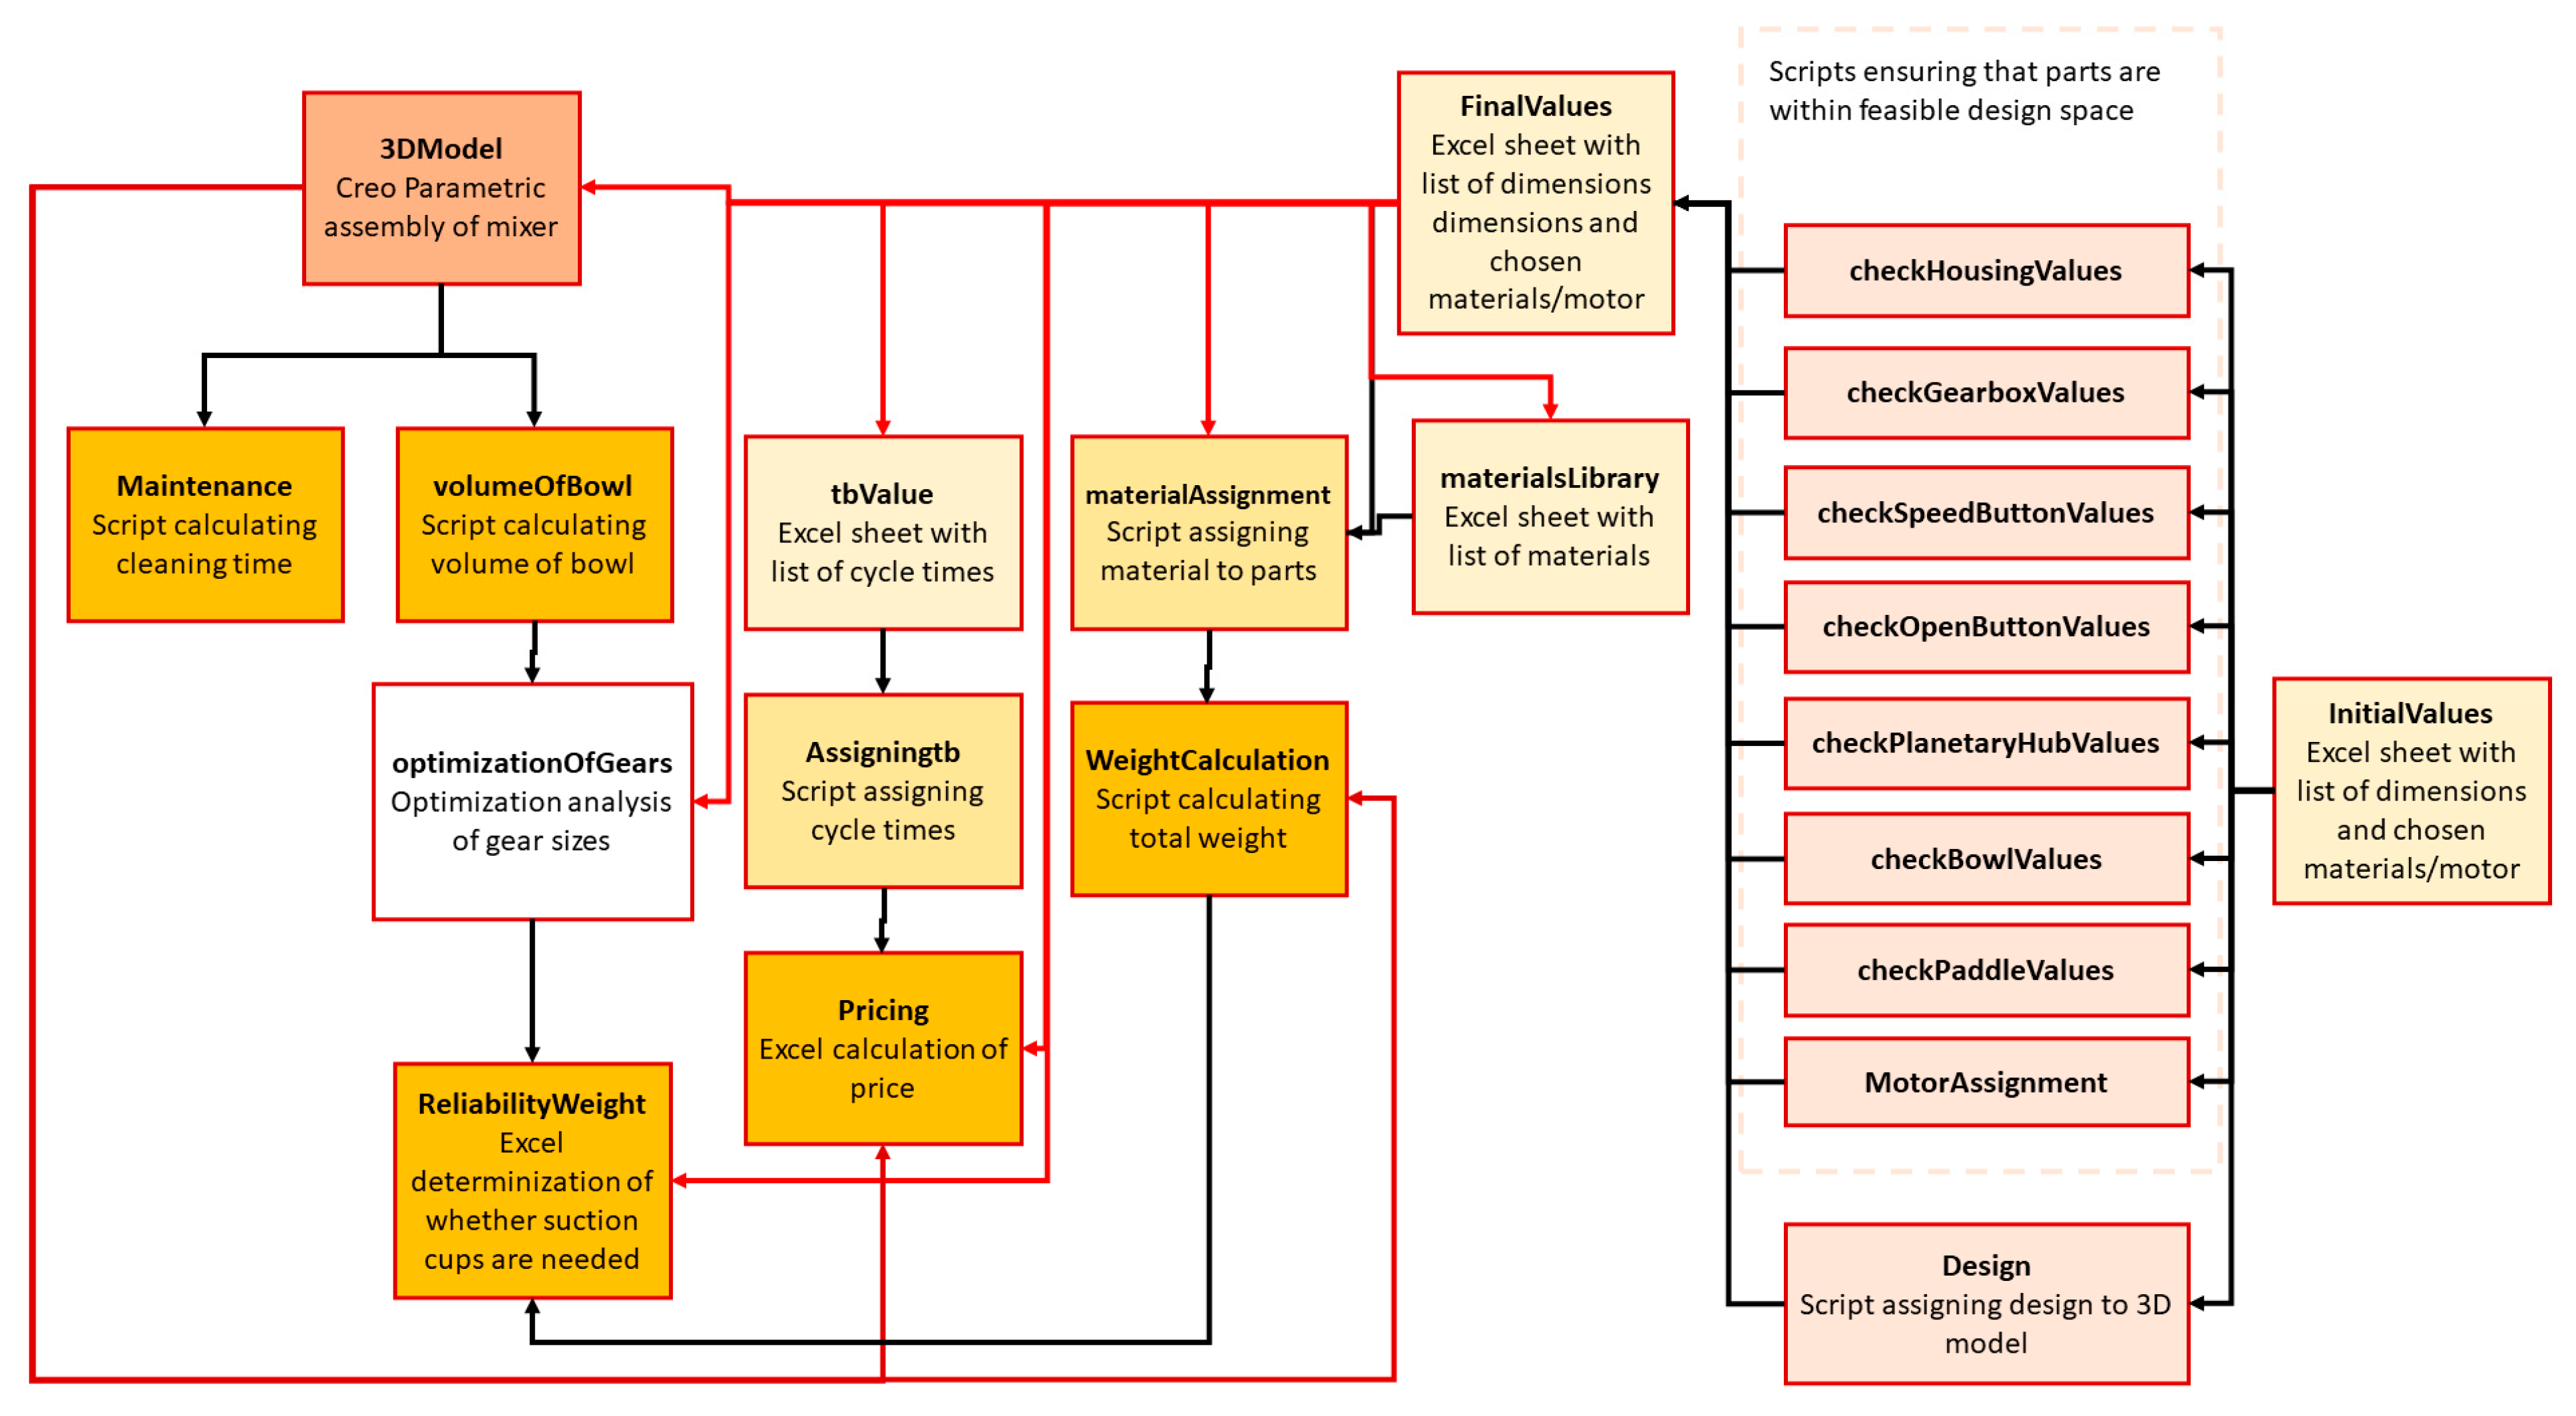
7]. This was assumed to be part of the model. However, due to the technical difficulties, only constraints in terms of changes in dimensions depending on the other dimensions were considered. The model (in the integration software) consisted of different files, which calculated different aspects of the design goal. Each file in the model consisted of data inputs, calculations/analysis based on these inputs, and data outputs. The inputs were either chosen during analysis or based on output variables of other parts, e.g., the weight calculation was based on the volume from the 3D model and the density of the material of the parts.
Figure 10 provides an overview of the different parts of the model. The figure shows (from right to left) how the model consisted of a list of initial values of dimensions and other variables, which were then adjusted through the scripts, ensuring that the concept was within a feasible design space (e.g., parts were not overlapping). The final values were then used to calculate the different performance indicators. The materials library contained information about each material (e.g., price and density). This was used to calculate the weight of the part based on the volume from the CAD model. The pricing was calculated based on the tb values (which depended on the size of the part and the material), the chosen material, and the size of the part. The maintenance and volume of the bowl were calculated based on the size of the parts. The gears were optimized based on an optimization analysis with a CAD model of the gears. This was used to calculate whether the product would need suction cups as feet to stay in place during use.
During the development, it became clear that there existed some limitations between the integration tool and the CAD software, which affected the final model:
The integration software only received the dimensions from parts which were active/unsuppressed in the model. This made it very important that all major dimensions were stored in the skeleton model, which were always active. Features with dimensions, which were suppressed in some cases, e.g., the different designs, were stored as parameters as well. However, using parameters should be limited, since these would have to be stored as both a parameter in the local part (e.g., skeleton) and the assembly in order for the integration software to access it as an input, which added unnecessary complexity to the model.
Another downside of using the 3D model of the kitchen stand mixer to both produce a visual representation of the parts and volumes was that a circular reference was created when the on/off of the suction cups was based on the final weight of the product, since the weight depended on what parts were turned on/off, while the suction cups were turned on/off dependent on the weight. The suction cups were therefore not physically turned on/off in the 3D model, but stored as a Boolean (it was assumed that the suction cups would not affect the weight enough to change the outcome of the reliability calculation). Even though multiple scripts had been created to make sure that the changes in the dimensions of the model did not result in other parts of the model failing (or correlating), errors could still occur in some scenarios. This was especially true for the roundings and shell thickness of the parts, since it seemed impossible to determine when these had to be restricted, since they depended on the overall geometry of the product. There was a trade off in terms of how well the dimensions of the different parts should be restricted, since it would be beneficial if the majority of the designs created through analysis were successful designs. However, this was ensured through restricting the design space based on simplified rules. Making too many rules might therefore result in very similar designs, where scaling would be the main difference.
2.5. Phase Four: Concept Development and Test
Through initial analysis it became clear that the optimization of the sizes of the gears in the gearbox could be optimized for almost all box sizes (since they could be scaled) and that the gears could be optimized in a way which would make the watt needed in the motor very small (less than 10 watt). This was assumed to be due to the extensive sequence of gears in the gearbox or a calculation error. It was therefore determined that the gear ratio would not be the defining factor of the size of the motor. The gearbox optimization was therefore not part of the concept development of new kitchen stand mixers since this also severely slowed the process. The durability/reliability performance indicators were therefore not part of the analysis. Each variable (dimension) would need to be defined in terms of its upper and lower bound. The shells’ values were based on trial-and-error modeling on the 3D model (what upper and lower limit of the shell would break the model?). The upper and lower bounds of the housing geometry were based on the outside values of the Kenwood Chef mixer and then a range of 10 cm to 20 cm. The values of the geometries of the remaining parts were based on reasonable changes based on the maximum and minimum of the housing dimensions.
A design of experiment (DoE) was performed to understand which dimensions (of the 3D model) and other variables (variables defined for each performance indicator) had the largest effect on the different performance indicators. Some variables which had to be used as inputs in the DoE were integers and not double (e.g., motor no. and design no.). The only algorithm available for this scenario was “Parameter Scan”, which was deemed unfit for this project since the amount of runs necessary for the analysis was so great that the program would not allow it to run. This posed a problem, since some of the most important variables were integers, such as the design, motor type, and materials. It was decided to do the same DoE of the different designs with the double variables. The algorithm used was “Latin hypercube sampling” in order to equally uncover all parts of the design space while still controlling the number of runs. Only about 80 runs could be performed per analysis due to a technical issue between the integration software and the 3D model software. Three DoEs were performed per design in order to minimize any false positives due to the low number of runs. The variables which consistently had a significantly (by eye) larger sensitivity compared to the other variables were chosen as variables worth using in the optimization analysis. After the DoE it became clear that the variables with the most influence on the different parameters were:
Housing: Height of void.
Housing: Length of platform.
Housing: Bottom diameter.
Housing: Housing bottom width.
Housing: Length of the bottom vertical part.
Housing: Shell.
Bowl: Distance from the bowl to the housing.
It is also worth noting that the shell of the housing had the most significant effect on the weight (and therefore also price). Part of the reason why this shell’s sensitivity was so great compared to the other parts’ shells was that this varied from 1 to 4 mm, while the others only vary from 1 to 2 mm. The other parts’ shells had a smaller range due to their geometry.
An initial optimization analysis was performed with the variables that significantly affected the outcome (result of DoEs), important values for the design (design no., handle no, button no., and roundings), and the integer variables which were not evaluated based on the DoEs (types of materials, handle type on bowl, motor no., and button designs). The “NSGA II” algorithm was used since this could handle both runs with errors and multi-objective analysis. Three optimization analyses were performed in order to create more results due to the error of the model failing after 80 runs. The population size was set to 10 and max circles were set to 8, with max 2 cycles without improvements. This number was very low compared to the default of 48 runs and max 1000 cycles. This was not a very robust method since it left almost no time for the algorithm to create concepts which performed well in the performance indicators. The concepts were therefore relatively random. The results showed that the following of the integer variables had a significant influence on the outcomes (price and weight): (1) part material of the top housing, (2) part material of the bowl, and (3) part material of the buttons. An assumed solution was found to the technical difficulty limiting the number of runs. A final optimization analysis with the standard option of 48 runs per cycle and max 1000 cycles was performed. The variables in the final optimization analysis included the variables which proved to have significant effect on the output (from the previous sub-section) along with all integer variables (which could not be evaluated in the DoEs), and important variables for the design (all roundings, design number, button number, handle number, motor number). The outputs and algorithm were the same as the previous 3 optimization analyses. It became clear during the analysis that the technical issue was not solved and only about 100 runs could be performed.
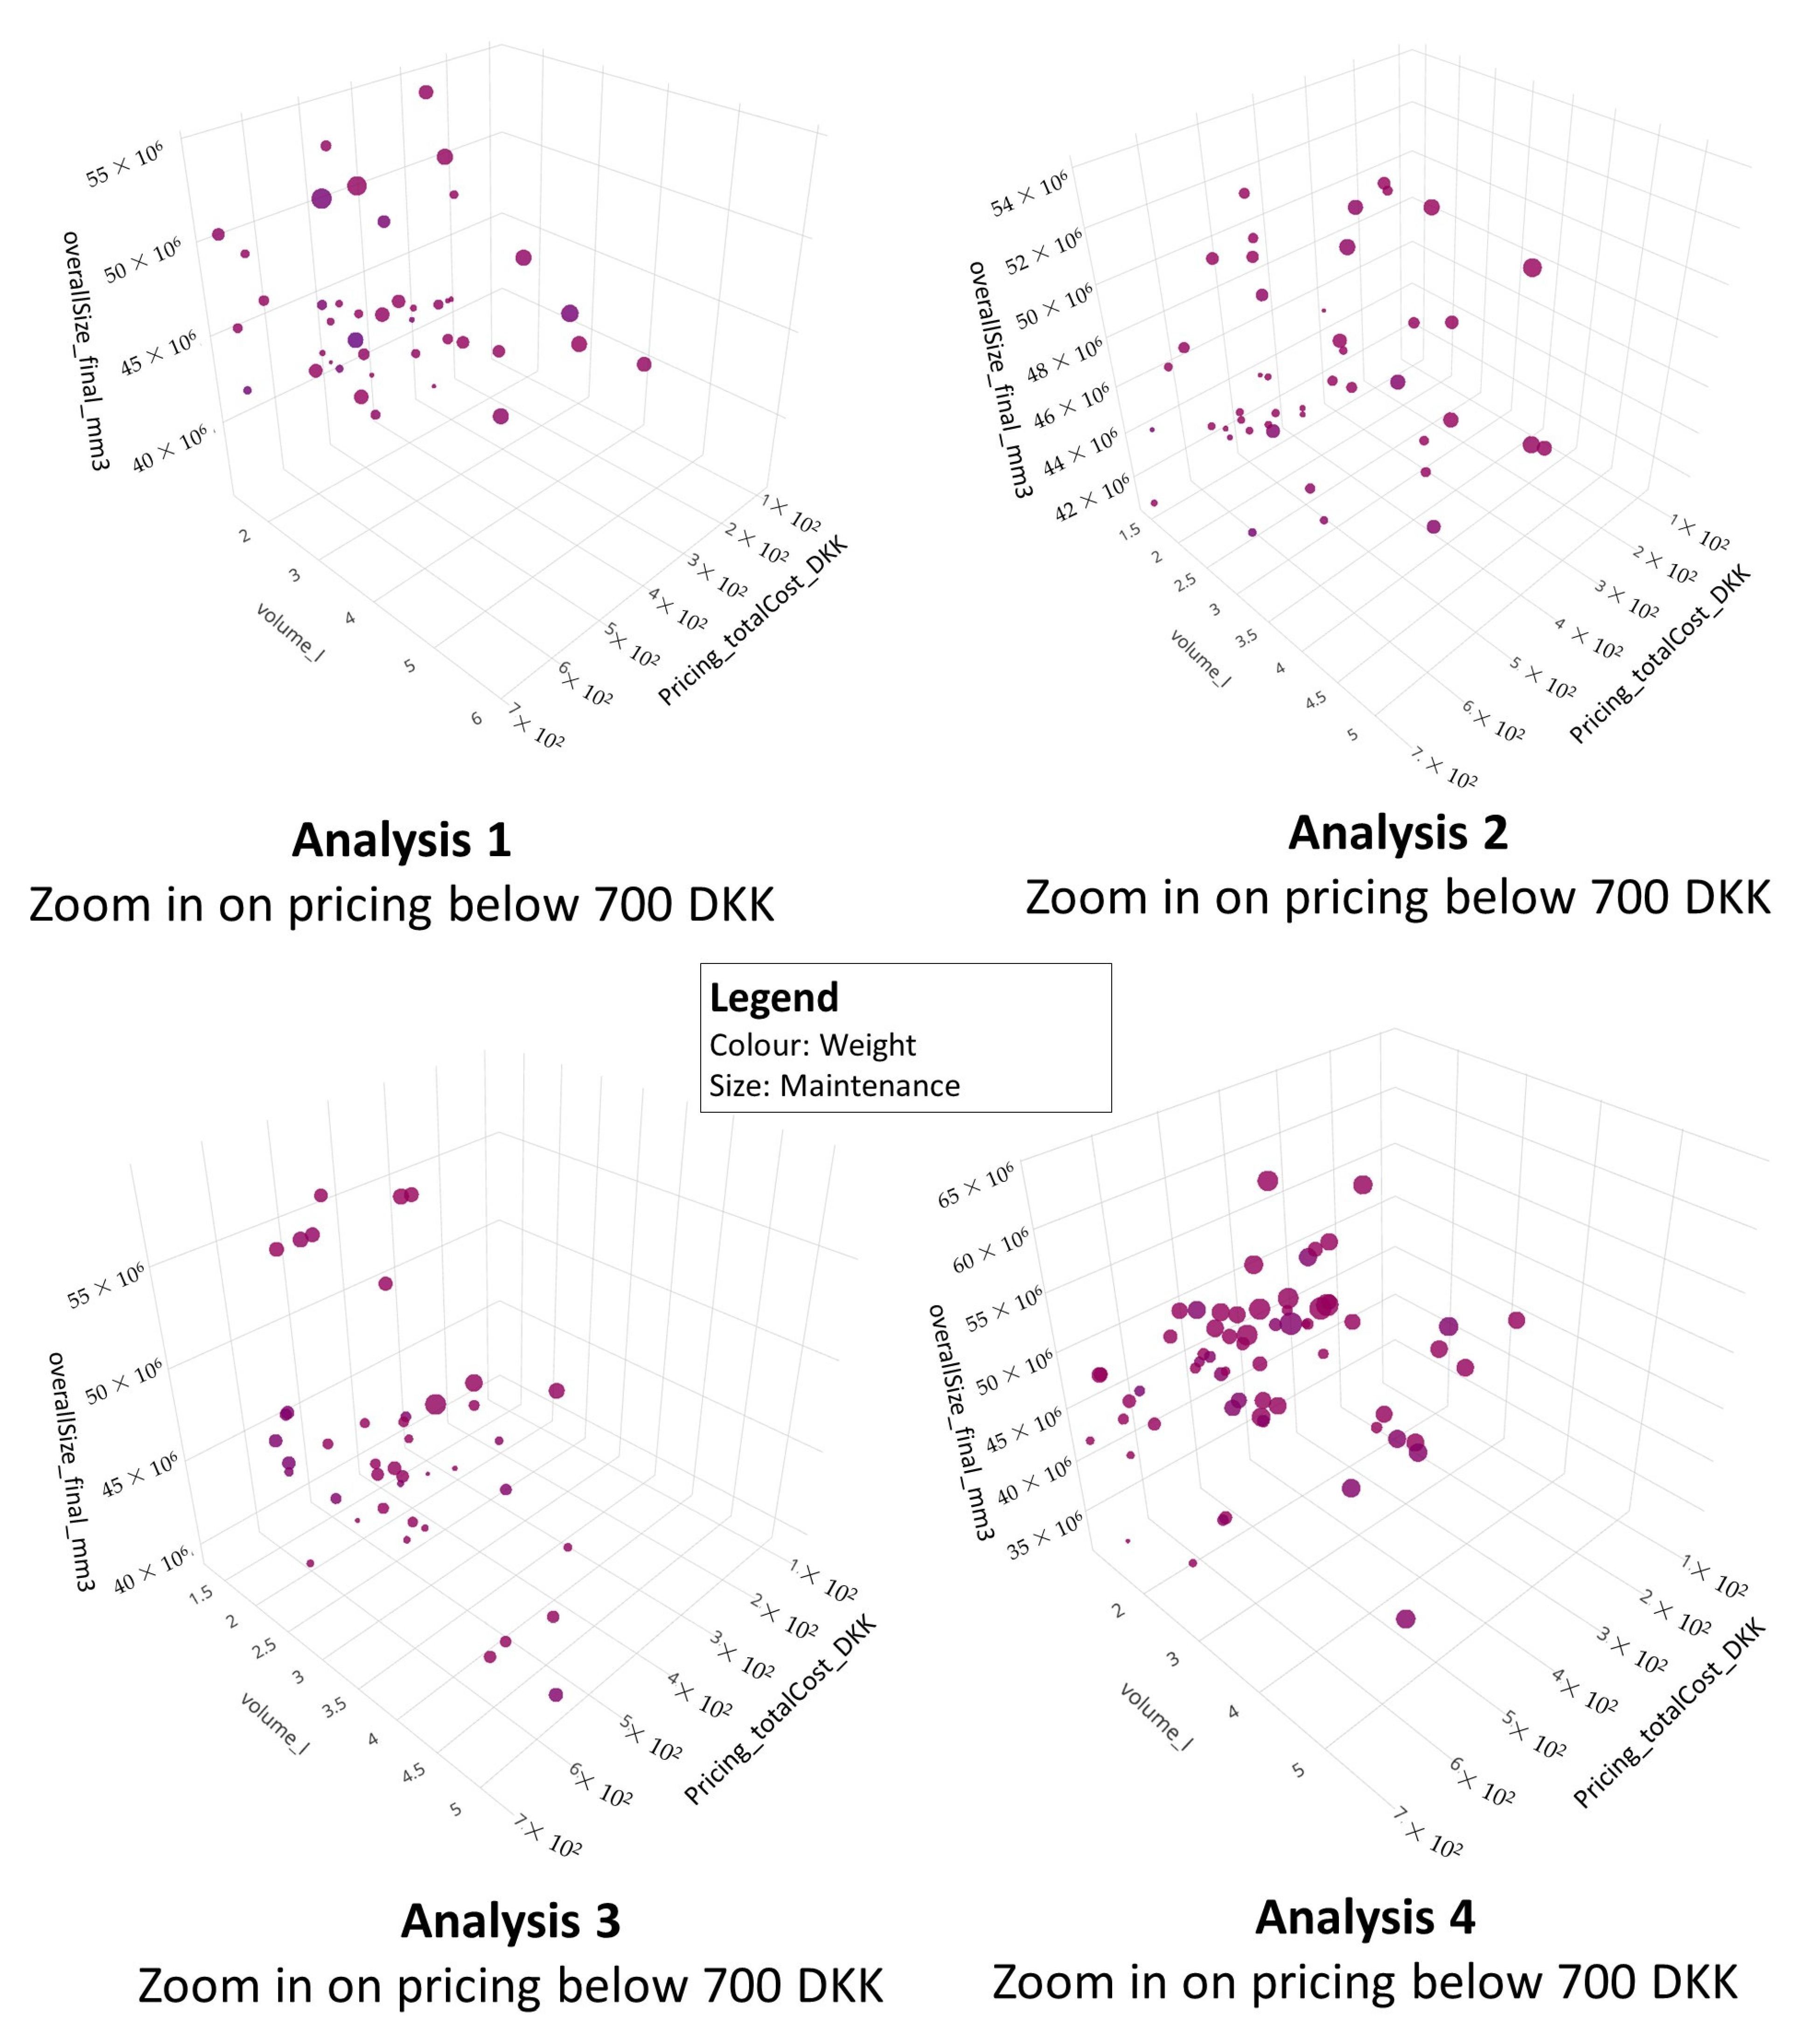
All four optimization analyses were used to decide on appropriate new designs of the mixer. A scatter plot showing all successful runs and their score in each of the outputs (performance indicators) was made for each analysis (see
Figure 11). Some materials had a significant influence on the price (e.g., doubling it), which meant that there were some outliers which would not be feasible and therefore were not considered further.
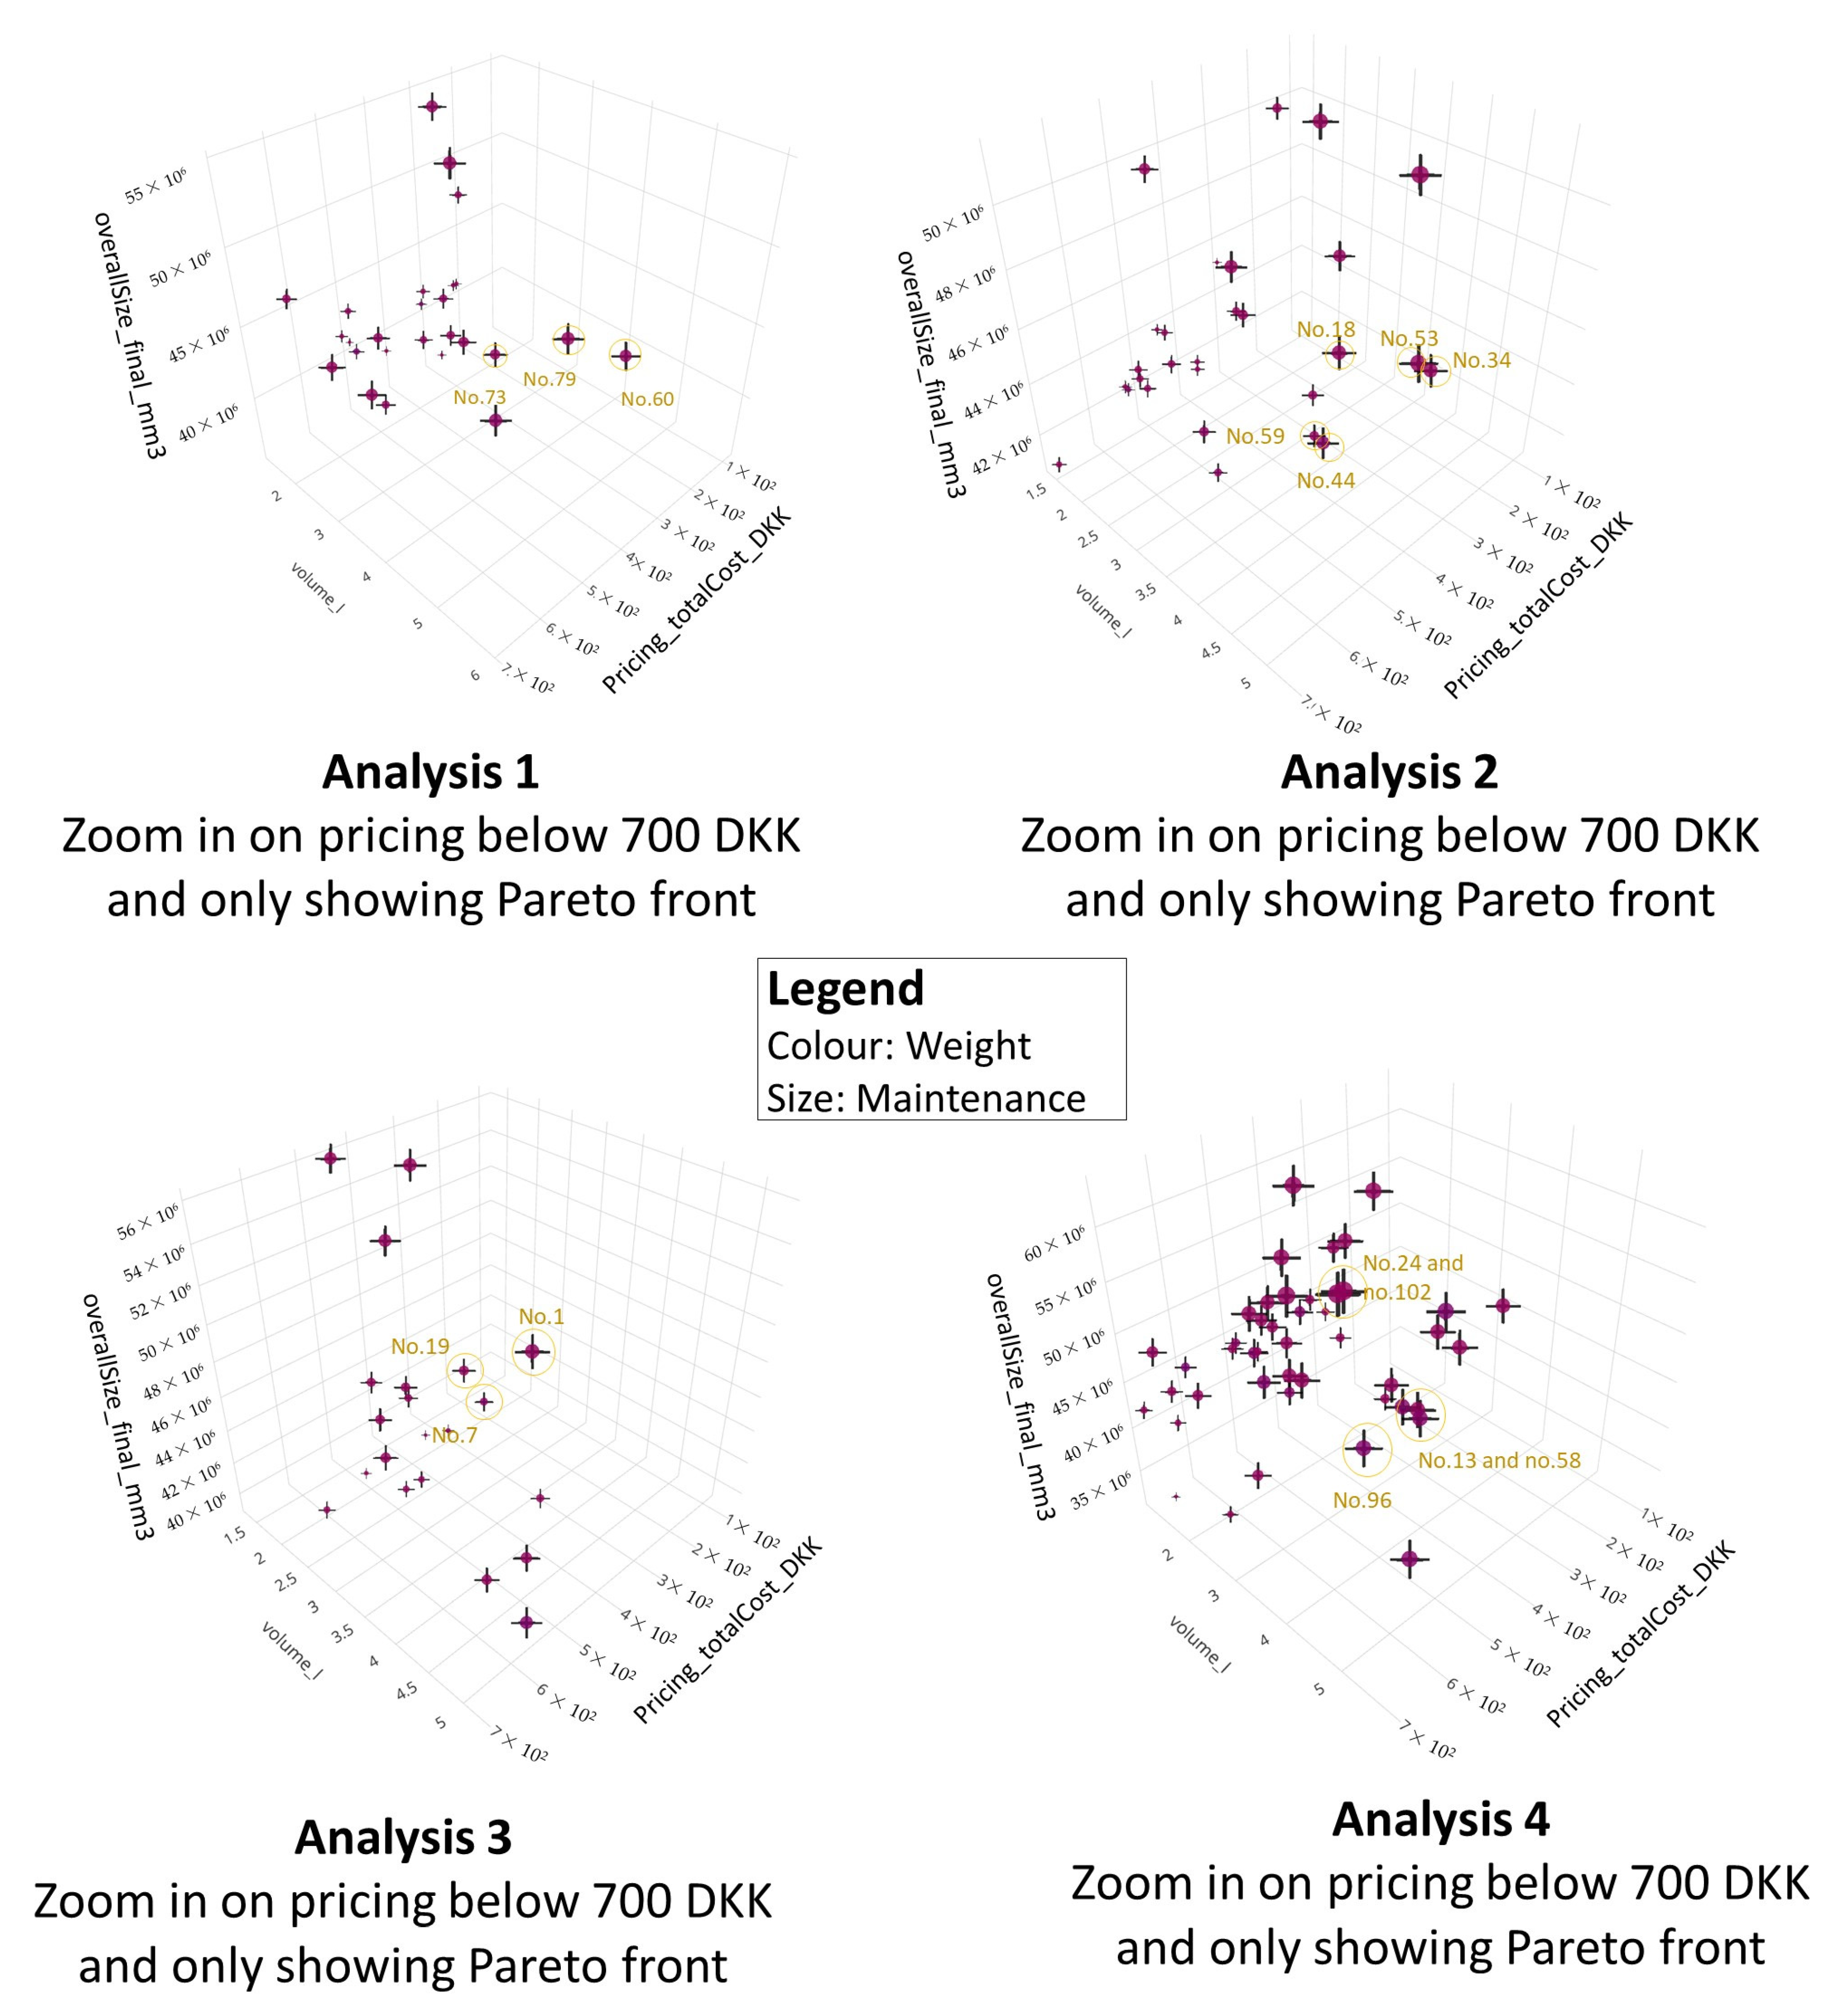
The Pareto front was used to indicate the most interesting concepts based on a tradeoff of the performance indicators (see
Figure 12). Some of these concepts were chosen mainly based on low price and variation in bowl size and design (since preferences for these would probably vary from customer to customer). A total of 16 designs were chosen (between 3 and 5 from each analysis), indicated with a circle in
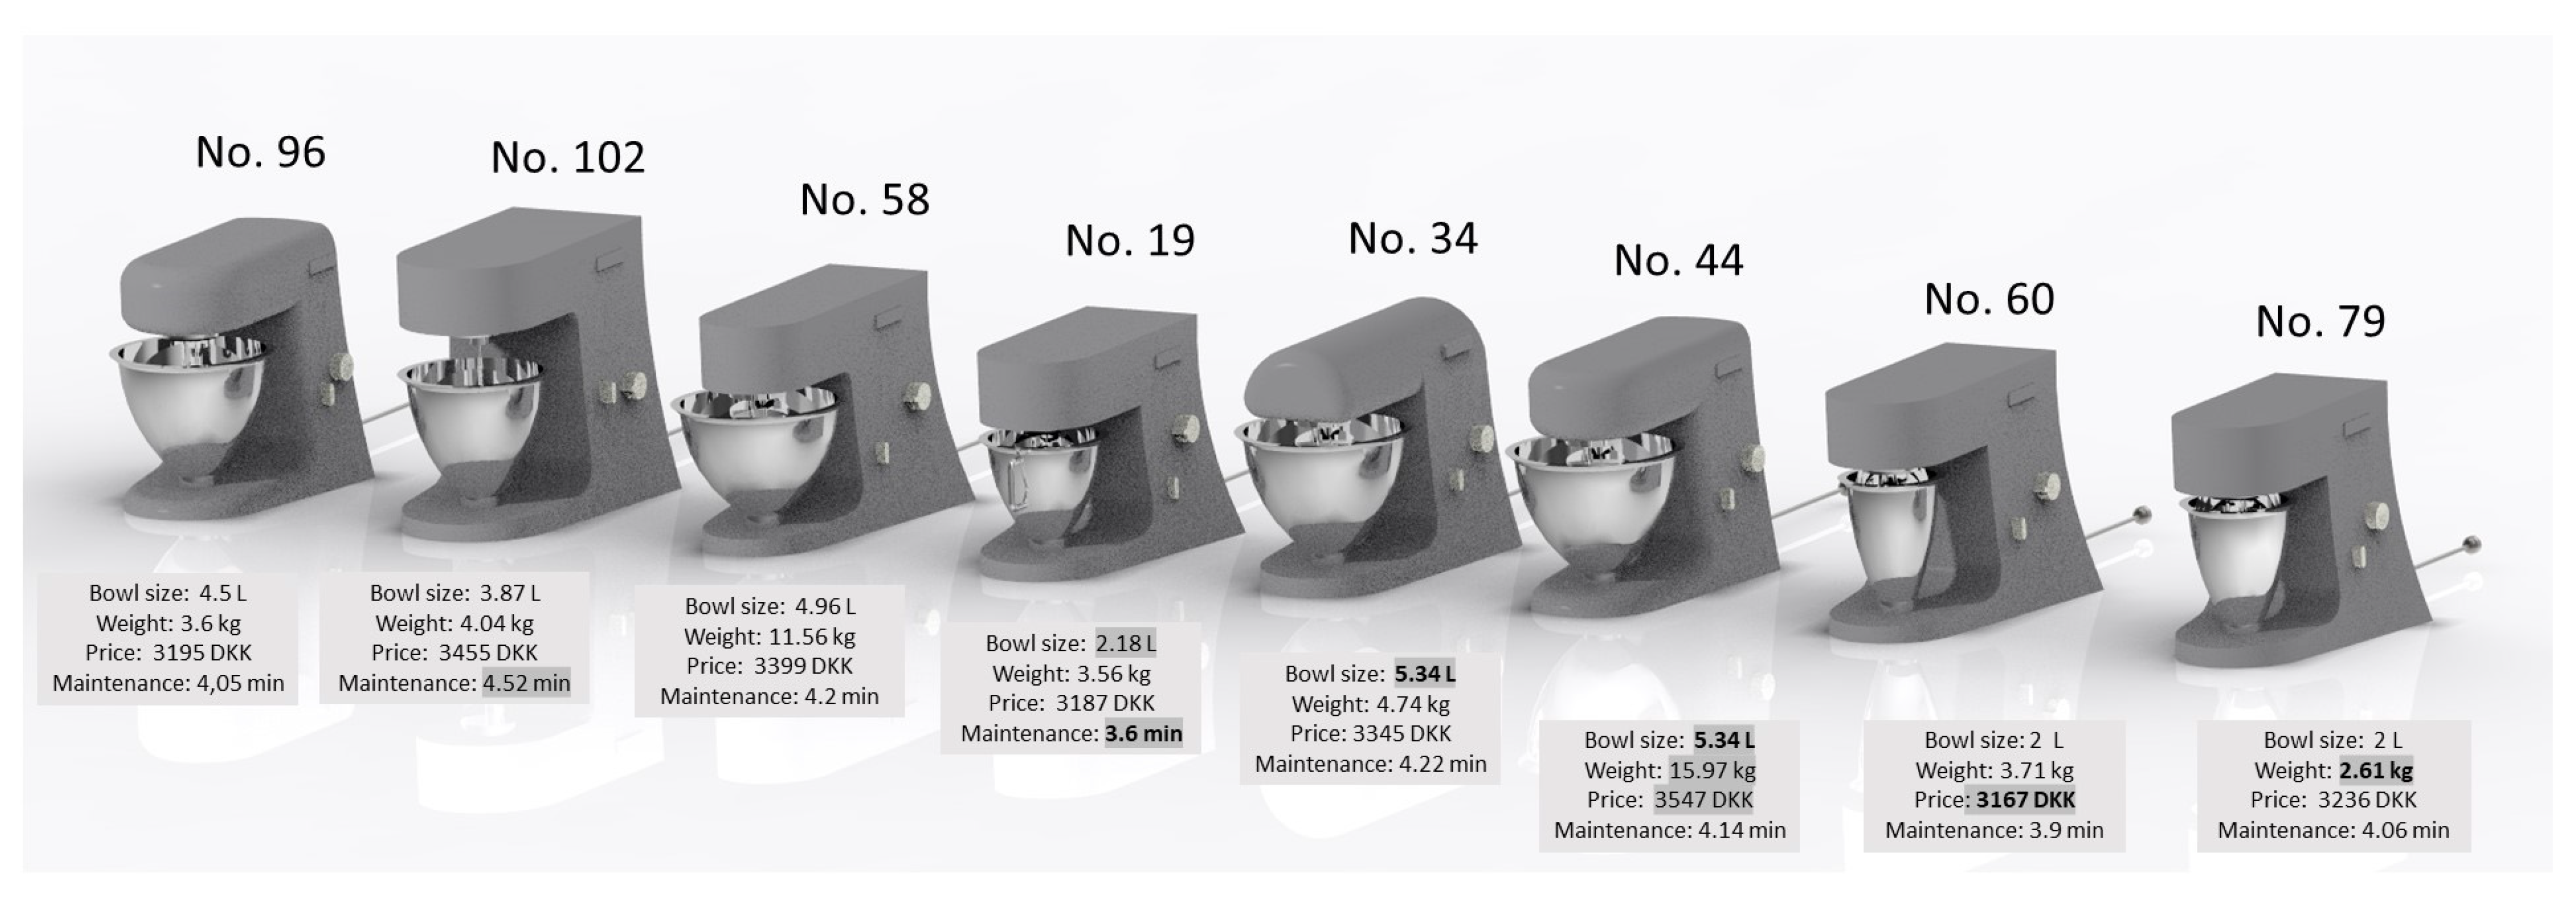
Figure 12. Eight of these were discarded based on being too similar to other designs either in their performance indicator or their visual aesthetic. The remaining 8 designs were chosen as the final designs (see
Figure 13).
The concepts were evaluated during semi-structured interviews (to gain in-depth understanding of their view on the concepts) with 6 potential customers (2 women and 4 men) through Zoom. During the beginning of the interview the participants were asked about age, occupation, and living situation along with six questions about what performance indicator values the participants preferred (e.g., max weight). The different designs/concepts of the kitchen stand mixer were shown to the participants along with information regarding their performance indicator values (e.g., size, weight, bowl size, price). The price shown to the participants was re-calculated, since the price estimated by the system/model did not correlate with the buying price: the Kenwood Chef, on which the initial dimensions in the 3D model (design 4) were based, costs in Danish currency DKK 3500 [
30] in real life. The price of a model with approximately the same values (based on pictures of the product) made in the configurator is DKK 593. It was therefore estimated that about DKK 2900 of the product was not production cost. This was added to all prices of the concepts to produce a price for the customer. This assumption might not be accurate, since some parts of the price, which had not been estimated in the original calculation of the price of the concepts, would likely also be influenced by the design (such as packaging and shipping).
The potential customers were also asked about their preferences in terms of handles on the bowl and type of speed button. The 8 designs had different buttons and handles, but it was assumed to be worthwhile to investigate whether these details were important. Furthermore, the importance of color was investigated by showing the same design with different colors and asking about preferences.


