Article

Systemizing and Automating the Concept Development Process Based on Product Configuration and User Feedback: Case Study on Automating the Design Process of Creating Concepts for a Kitchen Stand Mixer

Department of Mechanical Engineering, Technical University of Denmark, 2800 Kgs. Lyngby, Denmark
*
Author to whom correspondence should be addressed.
Systems 2022, 10(3), 60; https://doi.org/10.3390/systems10030060
Submission received: 1 March 2022 / Revised: 2 May 2022 / Accepted: 4 May 2022 / Published: 8 May 2022
(This article belongs to the Section Systems Design)

Abstract

:
Optimizing the development and evaluation of concepts during the design of consumer products through, e.g., topology optimization, often excludes areas associated with user needs (e.g., usability). This paper reports on an exploratory study of developing a system which can create new product concepts based on users’ preferences, requirements, and a clearly defined product structure. The 3D model of the product (structured using top-down design and resilient modeling) was integrated with calculations of the performance of the user needs (performance indicators). Different designs were developed based on design of experiment analyses and optimization analyses of the 3D model of the product (a kitchen stand mixer). The outcome of the analyses was a range of concepts which scored differently in the performance indicators. The best designs (based on Pareto front) were evaluated by six potential customers. Half of the participants preferred the same design, suggesting that this tool can be used to develop a design which a specific customer segment prefers. The process of creating the model and using it for customer interviews contributed a set of qualitative findings to the literature on combining parametric design, customization, and systematic design with user needs.

1. Introduction

This paper is based on the Master thesis of the main author, C. S. Nielsen, from the Technical University of Denmark [1].
This project seeks to answer the following statement: How might we do concept development based on user interaction with a configurator? This paper focuses on what would be required of the process for it to be successful. The project was scoped/narrowed to focus on developing a system which could be used to suggest incrementally new concepts to a current product portfolio based on preferences and requirements from the user’s perspective. The project was an exploratory study due to limited similar prior research and limited resources in terms of collecting relevant data (regarding the product specification, for example). The current research on the product design process will now be discussed. The “design process” of product development of consumer products from an engineering perspective has mainly been based on a structured and systematic approach [2]. Most of these are based on the basic design process structure of analyze–synthesize–evaluate [2]. The analyze phase constitutes the definition of requirements and performance indications of the product. The synthesis phase involves concept development, where a solution to each function is explored and a set of concepts made based on this. In the evaluate phase the different designs are evaluated in terms of how well they fulfill the requirements (e.g., concerning operation and manufacturing) before the final design is selected. Examples of definitions of more detailed design processes are the French design process model [3], the Double Diamond [4], and the V-model [5]. Recent literature has been investigating how these phases can be automated with the aim of streamlining the design process or easily creating and measuring the suitability of new designs. This paper focuses on the last two phases of the process. Research in terms of automatization of these phases has been explored to different degrees:
Synthesize: The second part of the design process has previously been automated to different degrees based on CAD tools and algorithms. Methodologies such as topology optimization and design configuration have been widely explored. Topology optimization is a wide area of research using mathematical formulation or algorithms of a design problem to support the selection of the optimal design among many alternatives. This can be integrated into the design process through CAD models [6]. Product configuration is based on a computer-aided system which can produce custom products based on rules in the system and requirements from users. Product configurators are often used in businesses utilizing mass customization [7]. These can also be used to automate the early design phase by choosing from and interactively working with automatically generated alternative solutions [8]. Other research in the area of optimizing the synthesis phase includes research by Komoto and Tomiyama [9] which aims at the development of a CAD system used to support conceptual design of multi-disciplinary complexity products through hierarchical system decomposition.
Evaluate: Many of the techniques specified above to automate the synthesis phase also involve some form of evaluation of requirements such as mass and force. Evaluation also often consists of evaluating subjective requirements such as design or usability. This can be tricky to automate since they are hard to quantify and evaluate based on an automated process. Ongoing research does try to quantify this, mainly through predicting what customers will prefer in terms of aesthetic based on big data, e.g., A. Burnap’s research on creating a model which can predict customers’ likeability of car designs [10]. Simplifying the process of customer evaluation (where it cannot be excluded) is also currently being researched, e.g., Kang et al.’s [11] focus on simplifying this process by providing potential customers with computer-generated designs, which eliminate the intermediate verbal protocol of the customer having to describe what style (for example) they prefer.
The methods used to automate the synthesis phase through, e.g., optimization analysis, focuses on objective engineering aspects such as force or weight and not subjective user needs involving, e.g., design or usability. This leaves a gap in the research in terms of how qualitative user requirements can be included in the optimization analysis.
To close this gap, a system will be constructed for automatic development of new designs of a product based on existing methodologies from both optimization analysis and design configuration. The translation of the user requirements into measurable parameters would be based on function modeling and relevant engineering methods. In the future, this type of system has the potential to improve concept development within an existing product series.
The methods chosen for the project were a combination of topology optimization (in order to explore more optimized versions of an existing design) and product configuration (to ensure that different modules of each part of the product could be reused for new designs) in the synthesis phase.
The development of the configuration tool should therefore be based on methodologies from mass customization [7]. Furthermore, some of the parts of the product would need to be optimized. Systematic design development [12] methods should therefore be used to map the architectural structure of the product as well. The connection between the user needs, different requirements of the product, possible solutions, and the fitness of these solutions should be quantified based on function modeling (FM). FM was chosen based on other literature using function decomposition to achieve a similar goal, e.g., Komoto and Tomiyama [9]. One of the limitations of FM is its focus on very concrete functions associated with mechanical engineering. Consequently, the framework does not provide a good approach to subjective goals of the system, such as design. FM also seemed to lack methods which create an overview of any inter-correlations between the different functions (which fulfill the needs). Quality function deployment (QFD) methods should be introduced to provide an overview of the connection between user goals (customer requirements) and engineering aspects of the product and the inter-correlations between these.
A kitchen stand mixer of the brand Kenwood from De’Longhi Appliances was chosen as the product, which the system should make new concepts based on. This research has not been in collaboration with De’Longhi Appliances or other businesses and information about the mixers was therefore not based on internal data from the company. Furthermore, the customer segment of young people sharing a living space (e.g., at a dorm) was chosen as a potential new customer segment, which the new concept should be optimized for.

Contribution and Implication

In spite of advances in systemic design methods, it remains a significant engineering challenge to balance user needs against engineering constraints during system optimization and analysis. Our research on automatic development of a concept fitting a specific user segment based on user interaction with a configurator aims at closing the gap in research between researched methods of automating the design process and methods used to include user needs in the design process.
A successful incorporation of user needs in the systematic product development would support the conceptualization phase of the design process, which would simplify any future concept development of the next generation of the same product.
This exploratory work is based on one set of experiences and takes place in the context of one specific product model, one specific software stack, and with a relatively narrow set of potential users. These experiences lead to a set of qualitative findings about the challenges that emerge at the intersection of parametric design, customization, and systematic design with user needs. Thus, the broad generalizability of these findings is limited. For practitioners the findings should be interpreted as one might interpret a case study: a variety of considerations whereby some portion will be relevant to a reader’s context. For researchers and developers of next generation design tools, these findings should be considered as design process challenges that may warrant further study and user needs that should be addressed.

2. Materials and Methods

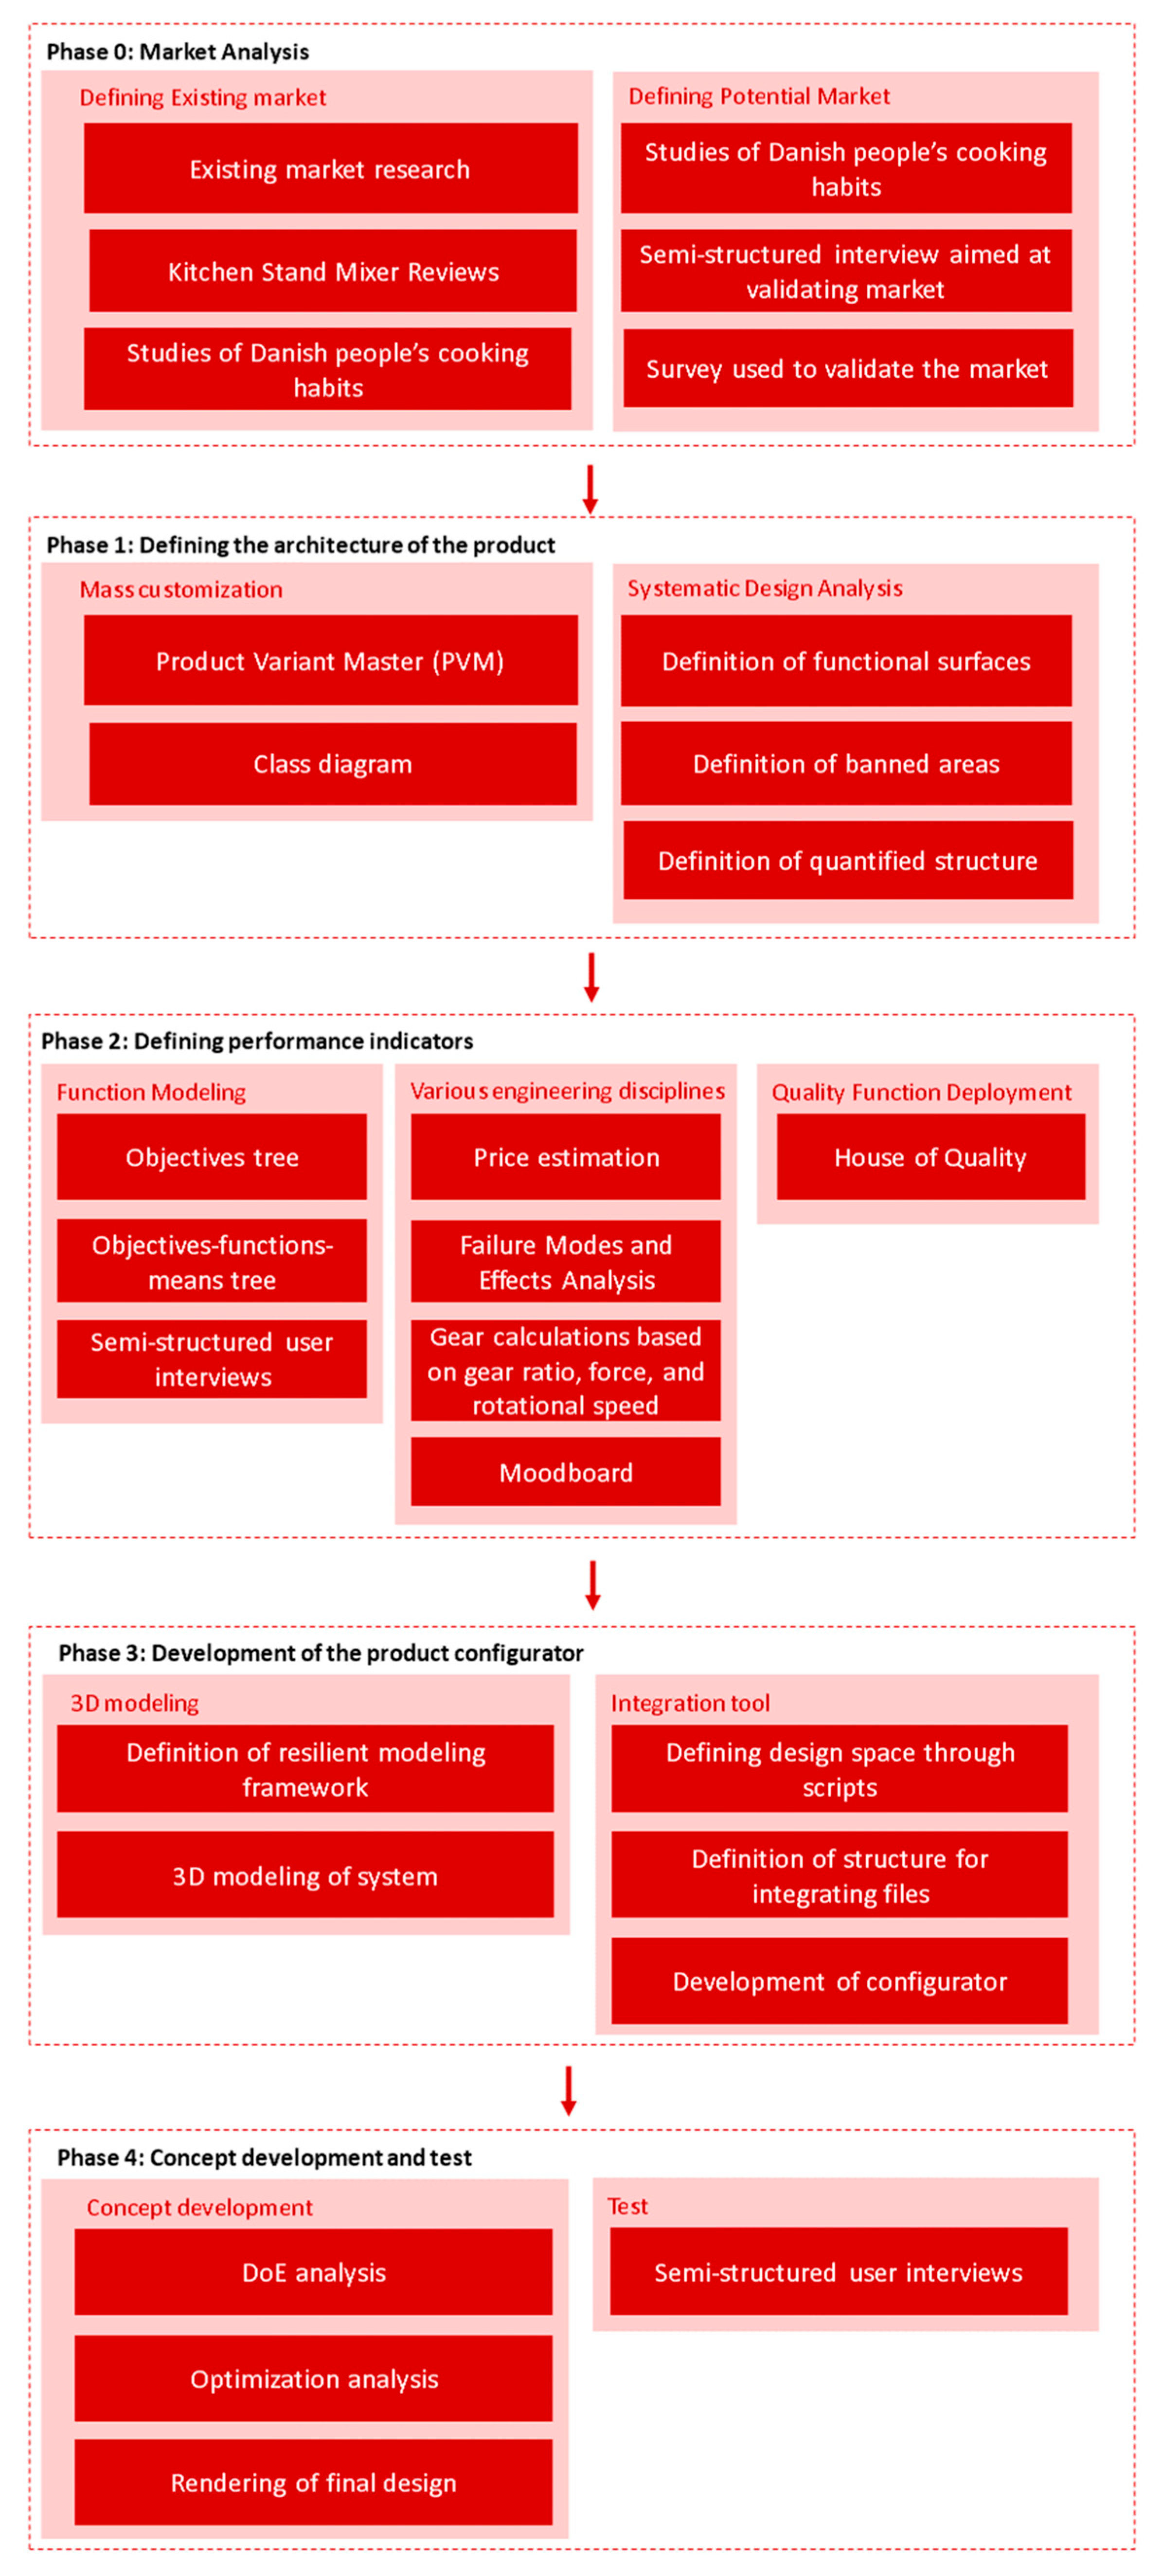
The general structure of the project is visualized in Figure 1.
A pre-stage of the project included initial market research in order to specify the potential customer segment. The kitchen stand mixer (the chosen consumer product) was analyzed and decomposed into different systems in the first phase of the research. During the next phase, the customer needs were documented and translated into measurable performance indicators for the concept. In the third phase a flexible 3D model of the product was created along with an environment where changes to the 3D model would affect the value of the different performance indicators. Lastly, different concepts were created with this tool and feedback was provided by potential customers on the concepts. Each process step is briefly described in the next sub-sections focusing on the methods used.
Furthermore, the process can be associated with the V-model [5] in order to associate our research with existing systematic design development methodology. However, the model has been used in an unconventional manner (see Figure 2): the first phase (defining the architecture of the product) should have been performed during the integration and verification sequence. However, this was performed during the beginning of the project since it involved reverse engineering of the kitchen stand mixer. The second phase (defining the performance indicators) is on the left side of the V in terms of understanding user needs and decomposing and relating them to the system and sub-systems. The third phase (development of product configurator) is at the bottom of the V, where the system (the configurator and 3D model) was composed. The last phase (concept development and test) is on the right side of the V and concerns the development of the concepts based on the product configurator system. These were then tested in terms of how well they fit the requirements (performance indicators) through user interviews. This last phase was therefore much different than the regular V-model, where the test is usually based on the defined requirements and not user tests.
During our research multiple interviews have been conducted based on an individual semi-structured interview format [13], since it was important that the participants were able to elaborate on their answer and add anything we might not have thought important for each topic. An interview guide was created and applied based on the initial market research. However, our method differs from the method from Kallio et al.’s research [13], since no pilot studies were conducted. Thus, our method has some limitations. First, the phrasing of the questions could lead the participant’s responses in a certain direction [13]. Additionally, the prior research might be limited, which would have resulted in missing questions/topics in the guide. The responses were analyzed quantitatively, for example, while asking about what values the user found most important, and the average of all participants’ answers were used. The sample size was always based on the maximum number of participants which we were able to recruit (being within the definition of the customer segment). All interviews were done online as video calls due to the COVID-19 pandemic.
The surveys were all conducted as online surveys to obtain a general view from the customer segment on a very well-defined aspect. These were distributed through social media.
The following sections will briefly describe the different phases and methods used. The research has been conducted in accordance with these methods unless stated otherwise. The thesis [1] contains a full description and all models created.

2.1. Pre-Project Start: Market Analysis

During the initial stage of the project a new potential customer segment was defined based on market research. This included definition of the existing market based on existing data on the kitchen stand mixer market. Seven different reviews found on Google Search of the best kitchen stand mixers (from 2019 and 2020) were compared. This provided an overview of which models consumers prefer and what aspects are important in their choice. The average consumer was defined based on food-making habits of Danish citizens (since our research was conducted in Denmark). Three new potential customer segments were found in this process. Young people living together (in dorms or collectives) were evaluated as the most promising group, since studies show that people spend more time on cooking if they are multiple people living together [14]. A kitchen stand mixer could therefore help assist this group, since this would make it faster and easier to cook. This was assumed to be valuable, since studies also show that young people do not feel well equipped to cook [15]. However, this is a niche group, since the custom of making homemade food is declining in Denmark (only 34% of the youngest generation of adults, 18–25 years old, make their dinner from scratch [14]). This group’s need for a kitchen stand mixer was validated through semi-structured interviews and a survey, including questions about the potential customer’s demography, relationship to food, relationship to kitchenware, and relationship to kitchen stand mixers. Five men and three women were interviewed for the semi-structured interview. Thirty people answered the survey. The majority (in both studies) agreed that a kitchen stand mixer would be helpful in their kitchen. Furthermore, it provided an overview of what functions new kitchen equipment would need to add value to the potential customer group.

2.2. Phase One: Architecture of the Product

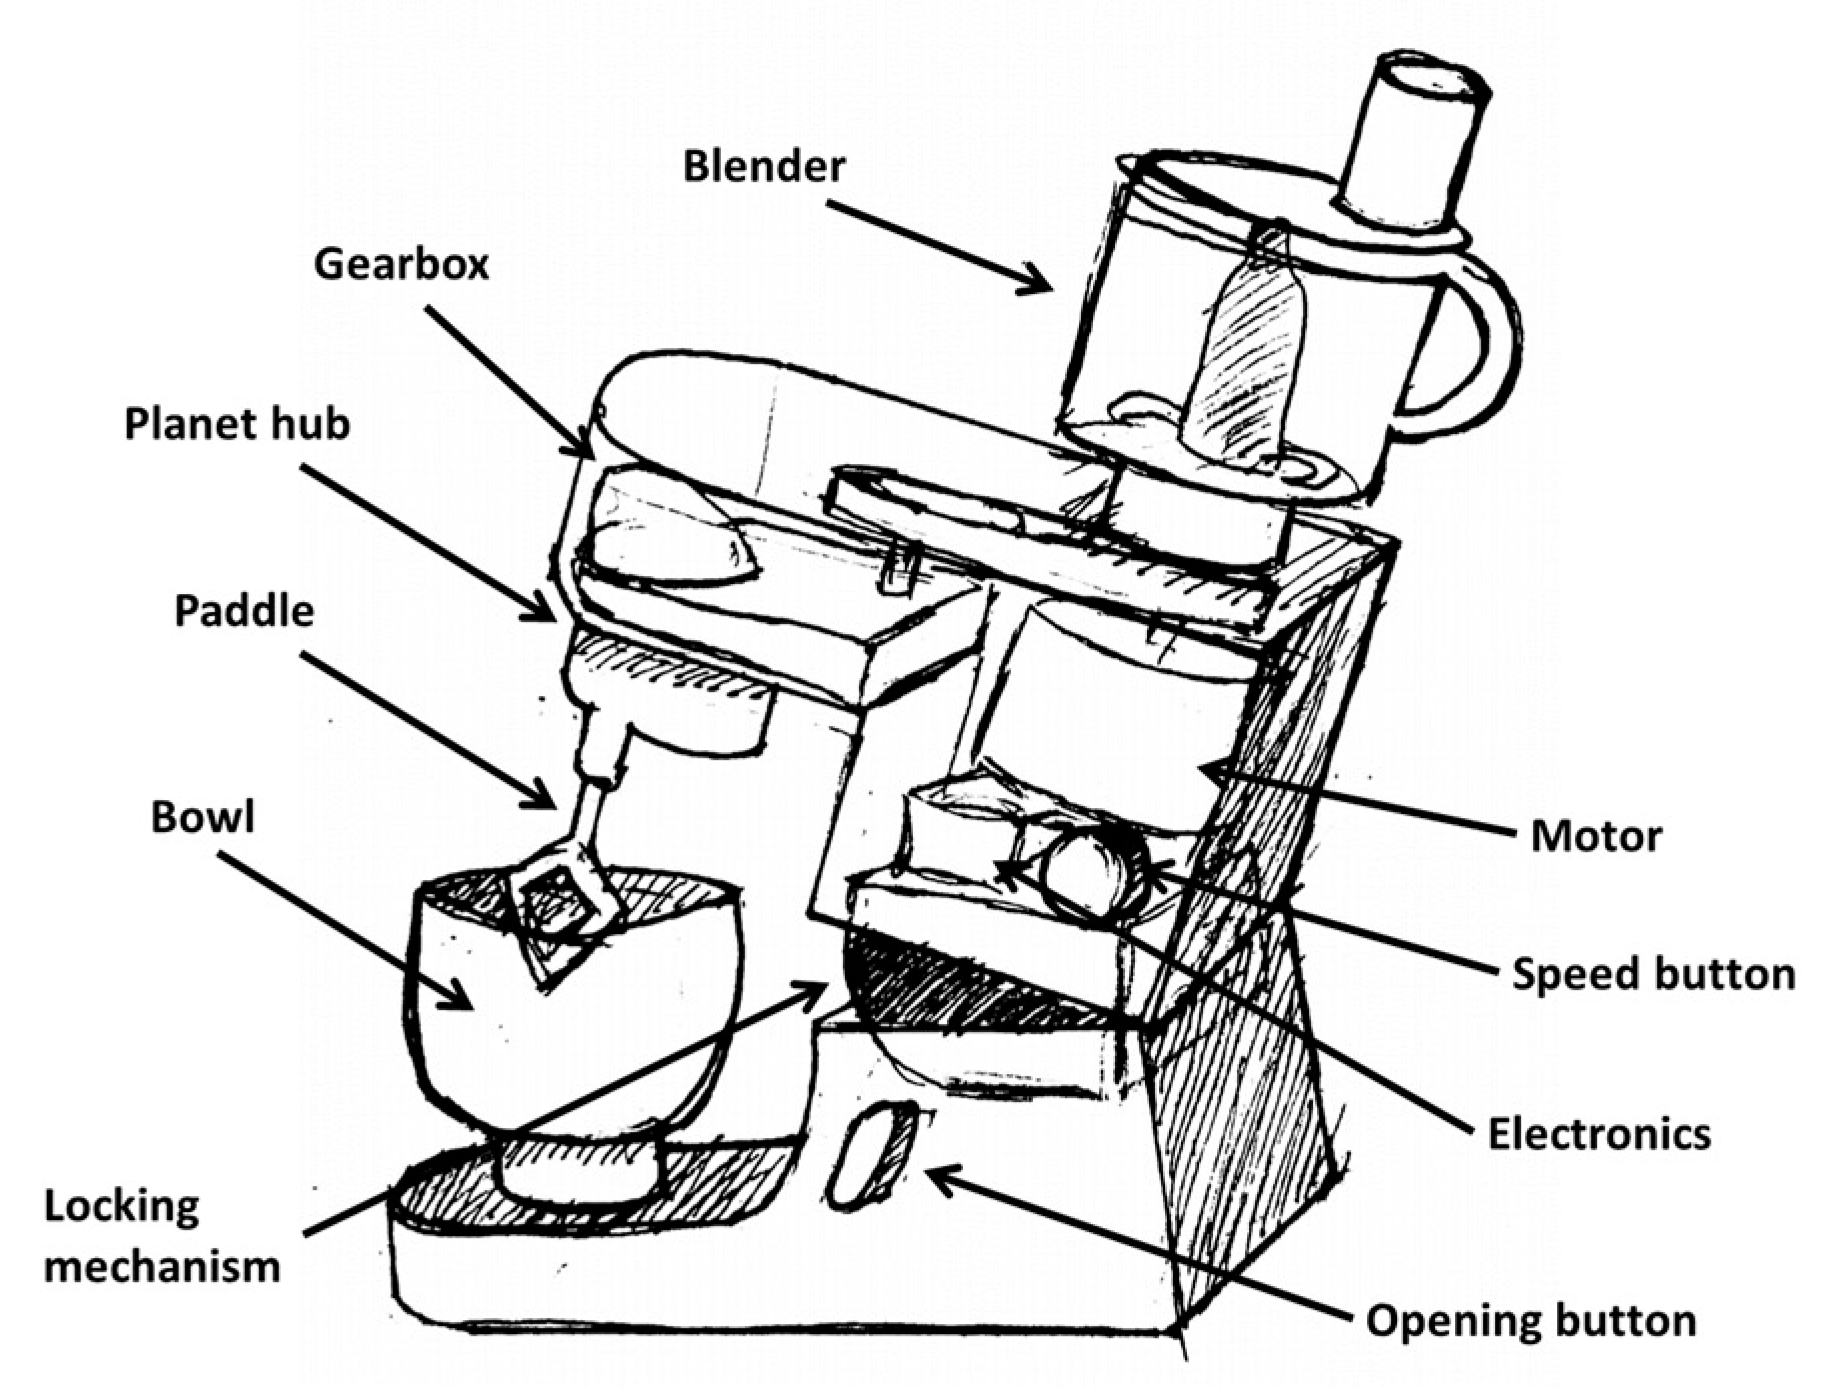
The basic structure of the product for which a new concept had to be developed (a kitchen stand mixer) was defined through methods of product range analysis based on methods from Hvam et al. [7]. This provided an understanding of the different parts of the product. Furthermore, systematic design of industrial products by Eskild Tjalve [12] was used to provide an understanding of the physical structure of the product and how the parts were constrained in the three-dimensional space. The main parts of the product are illustrated in Figure 3.
This was based on the limited information on Kenwood’s webpage [16], research on the internet showing different kitchen stand mixers being assembled and disassembled [17,18,19,20], and the service manual of the old Kenwood Chef A701A from 1976 [21].
The product parts and their differences were mapped in the part view of a product variant master (PVM) (see thesis for the PVM [1]). The product variant master is a mass customization method used to divide the product into an aggregated structure providing an overview of all parts of the product and their different configurations/modules [7]. However, due to the lack of information, the majority of the attributes of each part were based on material, overall size of the part, or different types of the same part.
Based on this analysis it seemed that some of the parts were customized to every new product series. This was the case for the housing, which varied greatly from series to series. However, other parts seemed to be modules, e.g., the motor, which existed in different sizes across series. These parts should be defined as modules of specific sizes in the configuration system, while customized parts should be flexible to change. The parts which seemed appropriate for modularization were the motor, speed button, paddles, bowl, and accessories.
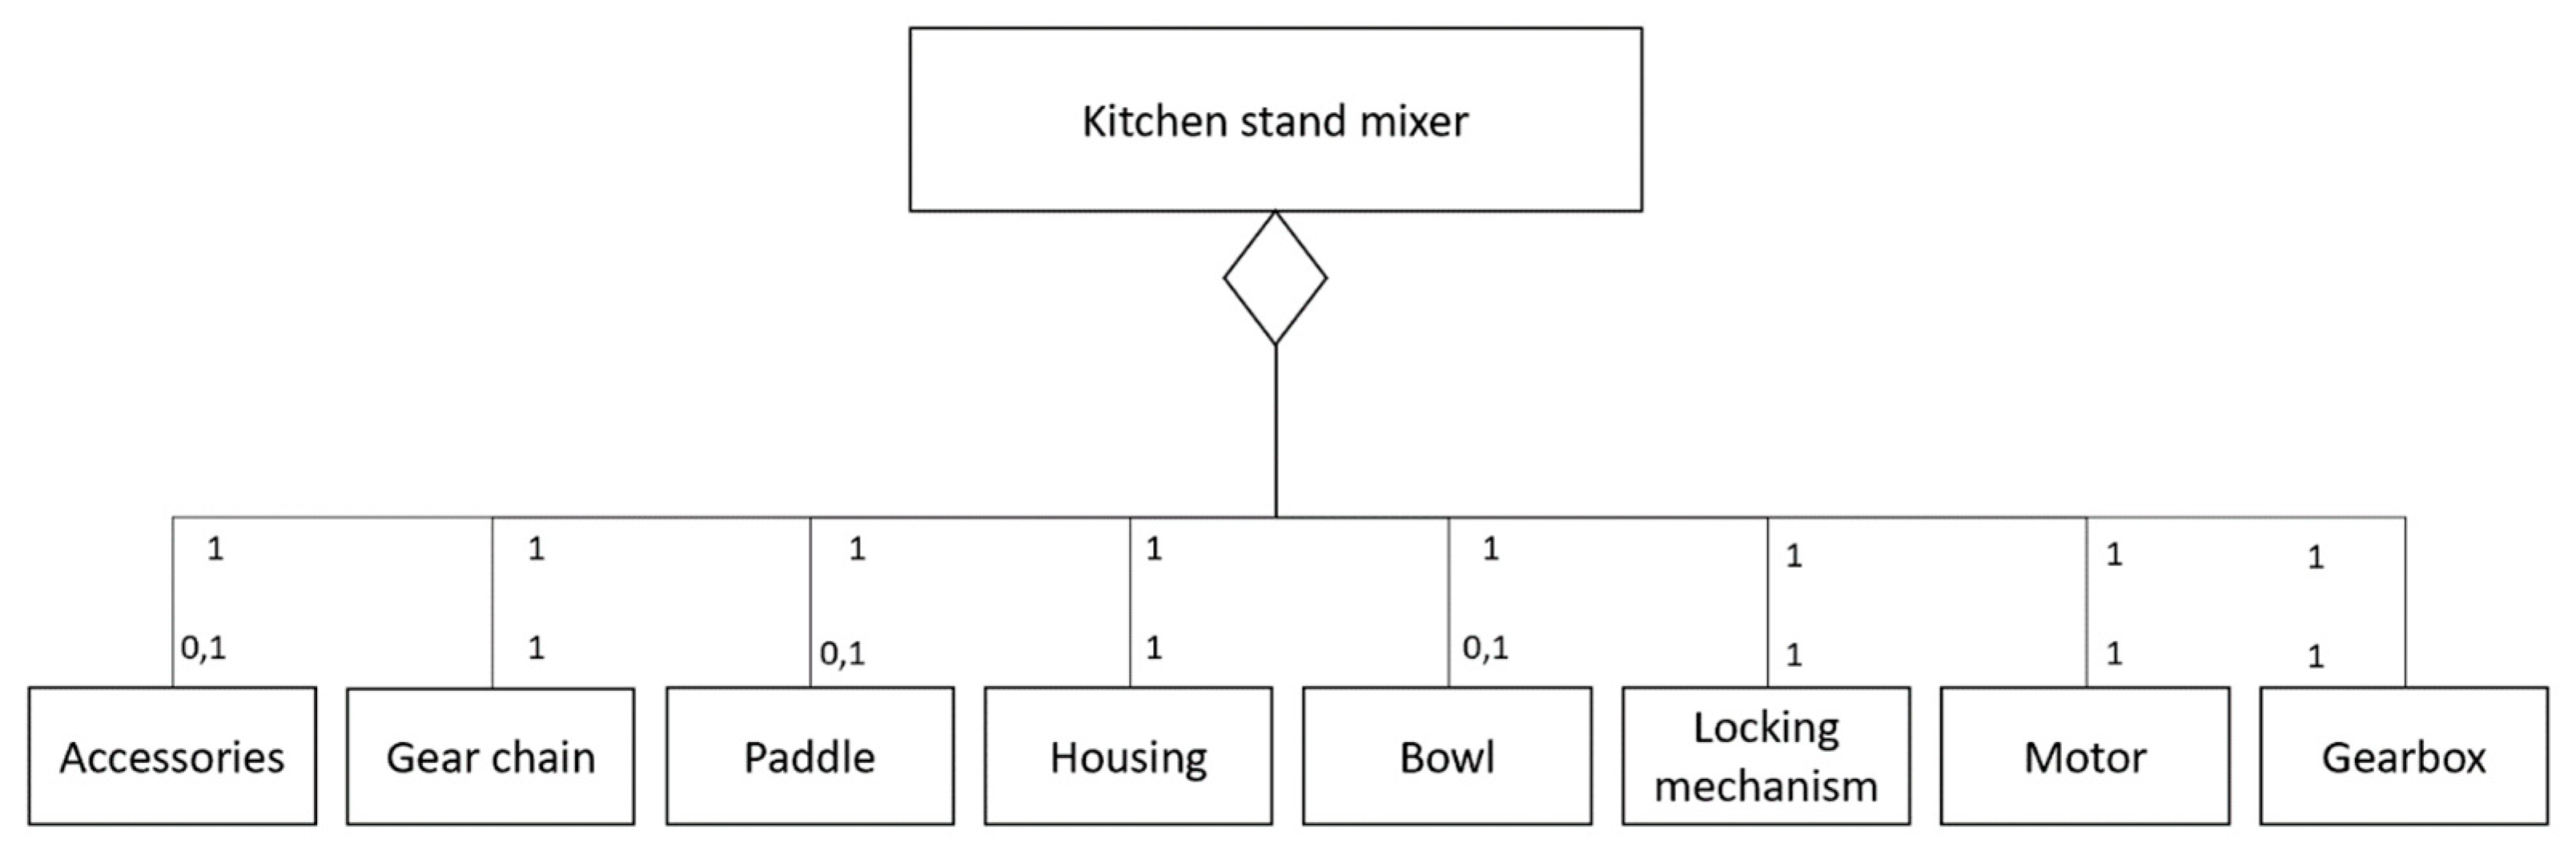
The main classes defined in the PVM were translated into a class diagram (see Figure 4). The entity of the paddle and bowl was set to 0 and 1, since these were not needed during use of some of the accessories (e.g., the food processor).
The order in which the systematic design analysis was performed was the opposite of a regular design process because it was a reverse engineering process.
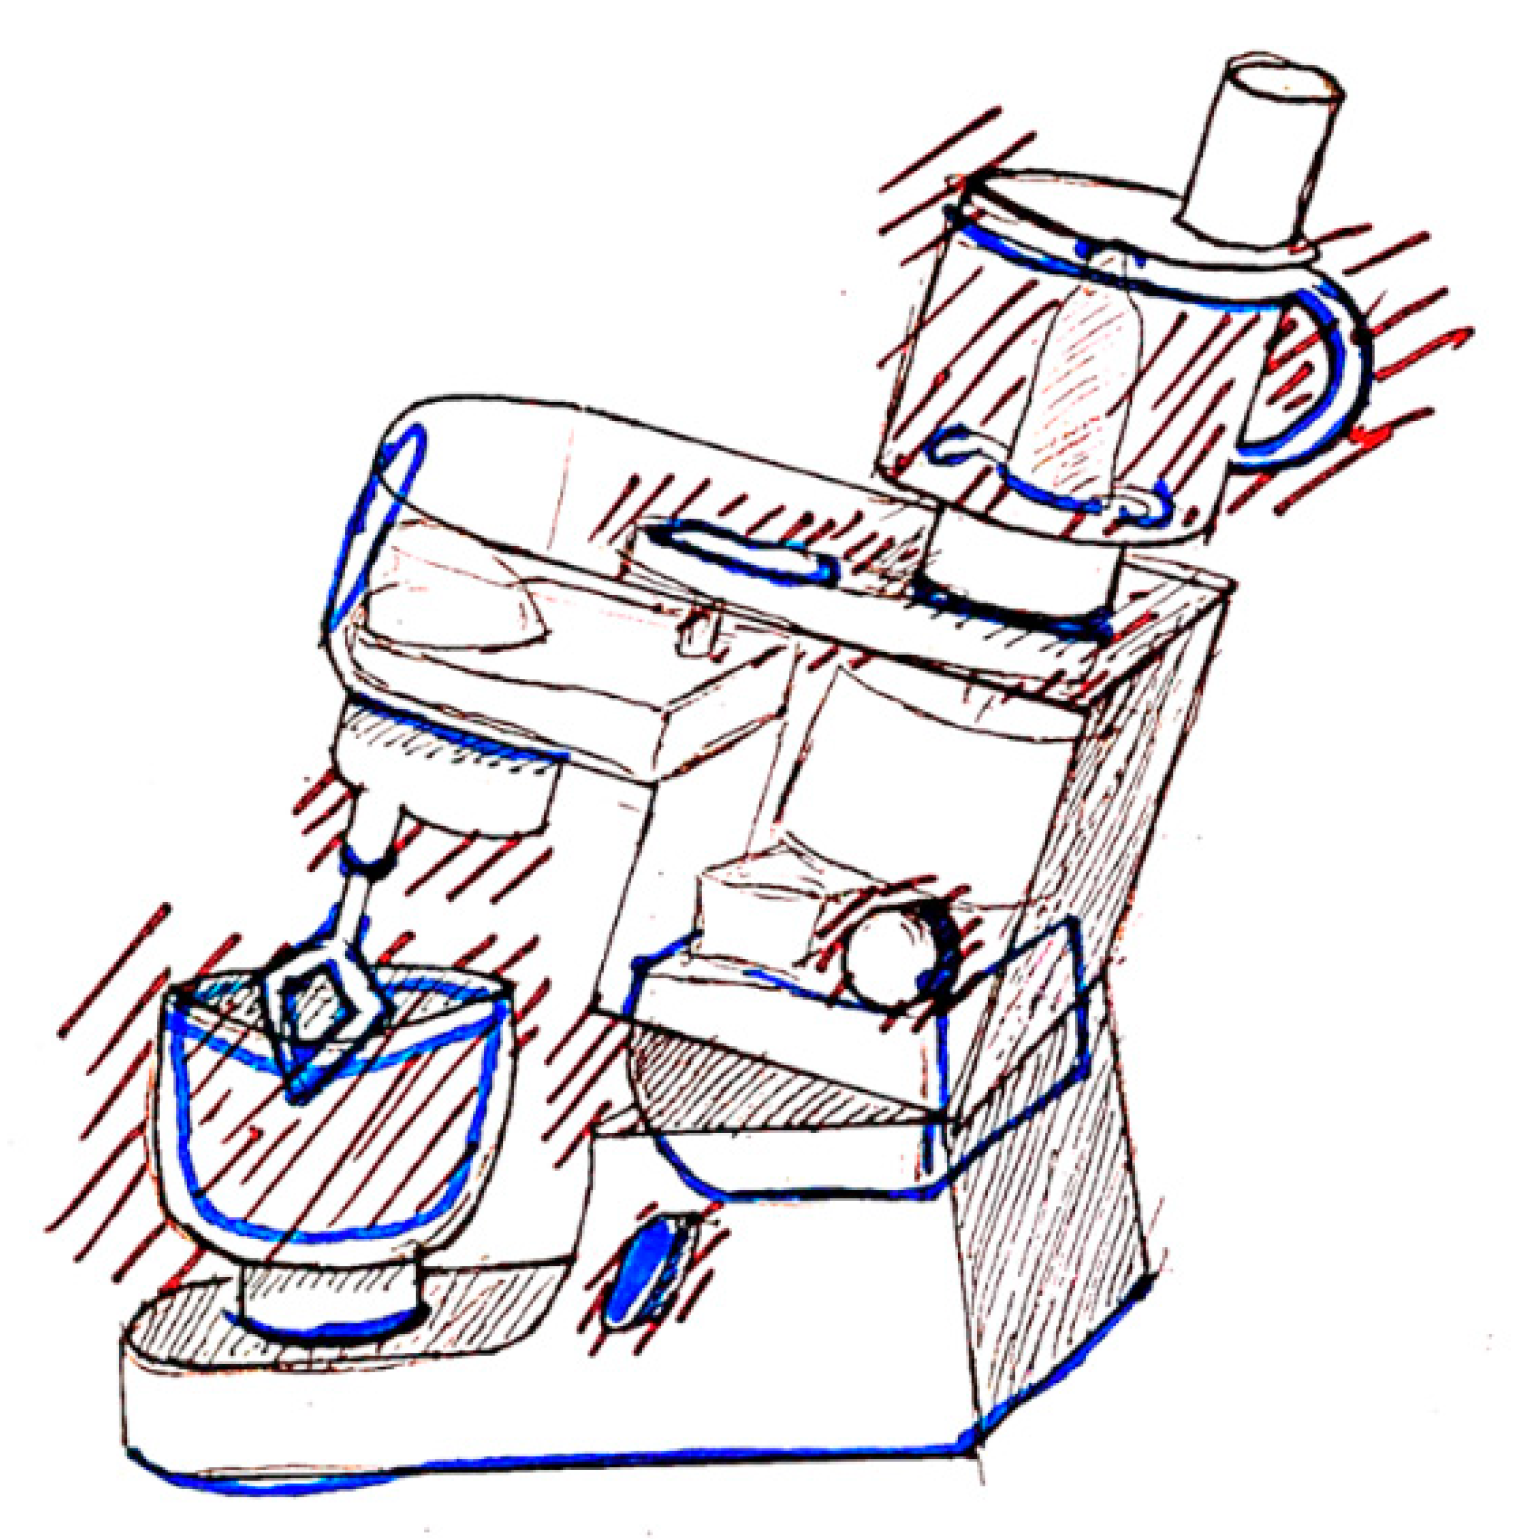
The functional parts of the machine and their corresponding restrictions in terms of geometry were analyzed based on functional surfaces (surfaces with an active function in relation to surroundings or other elements of the product) and banned areas (areas in space that must not be obstructed due to structural conditions, functional conditions, or operational conditions) [12].
The banned surfaces and functional surfaces can be seen in Figure 5. The figure confirms that there were a lot of functional surfaces and banned areas and that these sometimes overlap, especially in and around the bowl. It was therefore assumed that it would be necessary to have extensive restriction of the design space in this area.
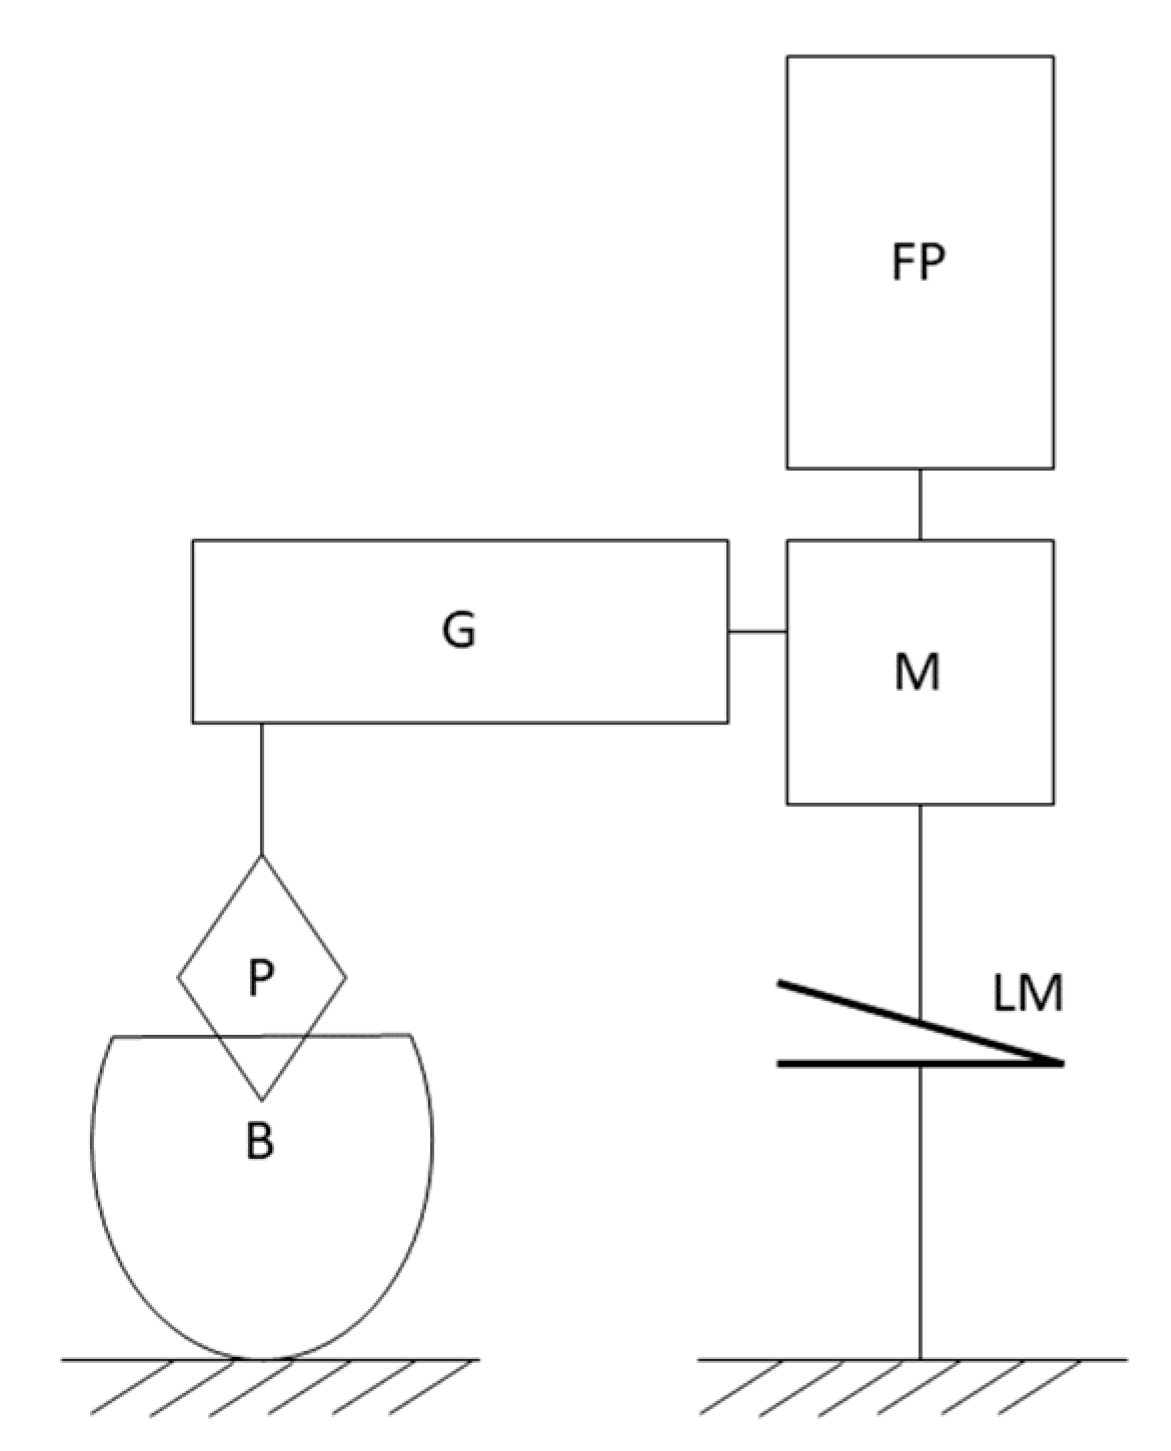
Lastly, the quantified structure was defined which is the relative arrangement between elements of the product. The quantified structure seemed to be the same for all Kenwood machines and can be seen in Figure 6. A fundamental/novel redesign of this product would include changes to the quantified structure. However, this was not part of this redesign, since only incremental changes would occur.

2.3. Phase Two: Defining Performance Indicators

The overall goals/objectives of the kitchen stand mixer were mapped in an objectives tree [2] based on the semi-structured interview (with 8 people) and survey (with 19 people) from Phase 1 and reviews of kitchen stand mixers (from Pre-Project Start). The objectives were all made based on the user’s perspective and needs. Objectives in terms of production, etc., were therefore not considered. At this stage some objectives contained undefined or vaguely defined words/phrases (design, effectiveness, and maintenance). These were investigated through a semi-structured interview with 5 potential customers of the product to specify the objectives based on the user’s perspective. It was not deemed feasible to go into detail with all objectives and define them in the final model during this project. The objectives in the five most popular categories (according to the first online survey) were chosen for further investigation. These included “Durability”, “Effectiveness/productivity”, “Maintenance”, “Price”, and “Design”.
The objectives from these categories were translated into device-centric functions based on function modeling. The functions were then translated into different components (means of solving the function). This was mapped in a tree structure inspired by the functions–means tree [2]. However, the different means (solutions) to the functions were not explored since this was already defined by the current design of the kitchen stand mixer. It became apparent during this analysis that function modeling was not suitable for the objective categories of pricing and maintenance (except for “Low force needed to disassemble parts”); these could not easily be translated into device-centric functions, since the functions were based on product actions, while the objectives were based on external passive goals. The user needs categories were therefore quantified based on appropriate engineering aspects, since they could not be defined based on function modeling. These definitions will be briefly explained. Due to time constraints, it was decided not to include the food processor (accessory), since it would take too much time to model this sub-system of parts.
Price: Some areas of price are not directly affected by the design (e.g., administrative costs), while others are (e.g., the manufacturing cost of the product). Only the directly affected parts are considered in the price model (also called primary cost [22]), since it was not feasible to consider all factors of pricing. It was assumed that some parts were standard parts, while others were unique for each design, since some parts were modules, while others were custom made (according to final PVM). In modularization, the different parts (classes) have different attributes, e.g., price [7]. In these scenarios, the price estimation is based on a list of prices for each module. However, it was not possible to find any such estimations of the Kenwood kitchen stand mixer parts. The parts assumed to be standard parts/modules were therefore based on lists of buying prices (which were largely based on assumptions due to a lack of data). The price estimation of custom-made parts was based on calculations of the estimated cost of production of the part (summation of the labor/tooling and material costs of the manufacturing price of each part). This was based on pictures and videos of the machines used for manufacturing as well as a physical examination of a Kenwood machine.
The majority of the in-house produced parts were assumed to be manufactured by injection molding/casting. The cost of this (Kt) was therefore calculated based on tooling cost (Kd), production cost/processing cost (Ke), and material cost (Km) (from chapter 4–7 of [22]):
K t =   K d + K e + K m .
The price estimation would therefore not be usable as a direct estimation of the final price to the customer, but a tool to figure out how much different designs would affect the price.
Durability: The method of analyzing potential failure modes and their causes was estimated to be the best approach to better understand the wear and tear of the product. Information from the repair shop Kenwood Chef Service [23], British Explorers’s webpage [24], and reviews of the different Kenwood stand mixers on amazon.co.uk were used to determine the most common failures of the product. Only bad reviews relevant to the usage of the product were taken into consideration. The combination of knowledge from the repair shop (who often repairs the machines after they have been in use for some time) and buyers (who often review shortly after buying) was assumed to provide a good overview of the most common issues during the beginning and end of the machine’s lifetime. A fault tree was constructed based on this information and imagined potential failure modes to obtain an overview of the overall failure modes and how they were related to the different parts of the product. The fault tree was then translated into a simple failure mode and effects analysis (FMEA). Some of the faults from the tree had a risk level of “Unacceptable”. The most critical faults were translated into objectives. The list of requirements was too long for it to be feasible to include all requirements in the model. Some of these were therefore removed. The following three requirements were therefore chosen for further detailing:
  • The kitchen stand mixer must stay on the same spot on the kitchen table during use.
  • The overload protection should not cut out the motor during normal use due to density/viscosity of ingredients. Additionally, the motor should not become overworked due to the same issue.
  • The motor should have an appropriate torque.
Requirement 1 was quantified by ensuring that the machine was heavy enough to stay still during use. This was quantified based on the force at which the paddle moves, which should be lower than the gravitational force of the machine multiplied by the friction coefficient (based on the surface material of the machine and the surface it is standing on). If the machine is too lightweight, then suction cups should be added to the machine to keep it in place.
Requirement 2 and 3 could be ensured with a motor with a certain power which can withstand the torque of the paddle. This would ensure that the overload mechanism would not need to kick in. The known differentiator between the motors was the power. The minimum amount of power for the motor therefore needed to be quantified. This was calculated based on the force transfer between the different gears and transforming the power (watt) of the motor into force (N) (full derivation accessible in the thesis [1]). The calculation was based on an assumed max force on the paddle needed to move the ingredients in the bowl (assumed to be no more than 50 N). This force was not transferred directly to the motor, but through the gears in the gearbox, planetary hub, and the gear on the motor. The max force/torque which the motor would experience from the paddle (P, watt) would therefore be calculated based on the input force (on paddle) (F_I, in N), the gear ratio (t), loss of momentum (M, set to 10%), the size of the gear on the motor (dA, in mm), and the maximum speed of the paddle (S_I, in rpm):
P = 2 π · F _ I t · M   ·   d A 1000   ·   2 π · S _ I t · M 60 .
It was not possible to determine any values of the size of the gears in the gearbox. They were therefore based on optimization analysis in terms of what there would be space for in the gearbox in the model. However, the size of the gears in the model followed the basic EU standards of gear sizing [25]. The size of the gears was based on the number of teeth and modular, where the modular was kept the same between two interacting gears.
Effectiveness: This was based on one objective from the objectives tree which could be quantified: (1) “Capable of holding an appropriate volume of food” which could be ensured by measuring the volume of the bowl. The other objectives were deemed infeasible to model without physical experimentation (e.g., (4) “Stir/blend food of different viscosities”).
Maintenance: Maintenance was defined as cleaning of the machine in the objectives tree, since this was the only thing customers had to do to maintain the product. This was made quantifiable in the model based on the cleaning time (t). This was based on the surface area of the outside parts of the machine:
t   =   ( s _ h   +   s _ b   +   s _ p h   +   s _ l   +   s _ p )   ·   t _ a .
The cleaning time was calculated based on surface area of housing (s_h), surface area of buttons (s_b), surface area of planetary hub (s_ph), surface area of bowl (s_l), surface area of paddle (s_p), and cleaning time per surface area (t_a).
The other objectives in the objectives tree were deemed infeasible to model without physical experimentation, e.g., “Easy to clean”, which depends on the geometry of the parts.
Design: “Design” or “aesthetic” are very vague terms. The definition of “good design” or aesthetically pleasing design could be very individual. The goal was therefore to quantify which design the customer segment preferred and what dimensions/geometries contributed to a “pleasing design”. This was performed based on surveys. The current landscape of the design of the kitchen stand mixer was investigated through extensive search on Google Pictures and vendors such as EL-giganten, KitchenOne, and Skousen. Almost all of these share the same basic structure. The main difference between them was whether the housing is boxy or more organic.
This was used as inspiration for making 19 new different designs (see Figure 7), where the geometry and dimensions were varied but the quantified structure was kept the same. The designs were used in an online survey. The participants were asked to rate the designs from 1 to 5 and choose what words they would use to describe the design (based on the most common words used to describe “design” in fiction [26]). The purpose of the survey was to map whether certain features would have a significant influence on the likability of the design. This was inspired by Burnap et. al.’s article on predicting consumer evaluation of generated car designs based on a large number (7000) of aesthetic ratings by consumers for vehicles [10]. However, the analysis was performed manually and not by training an AI. A substantial amount of data was needed to be able to predict the likability of new designs. However, it was not possible to reach enough people (only 12 in the target group participated).
Since only a few people could be reached, it was decided to do a semi-structured interview instead to obtain in-depth data from each participant. The participants were asked what design they would prefer based on some of the designs from the previous survey. The participants were also asked what words they would use to describe the designs based on the words from the previous survey. Six people were interviewed. The results of the interview were very divergent in terms of which design the participants preferred. Some participants liked boxy, since it looked reliable, while others liked the organic/round shape. Based on these data it did not seem possible to quantify the design. Instead, different designs similar to the existing Kenwood kitchen stand mixer were created in the 3D model, which could then be analyzed and optimized. The different designs and their performance could then be shown to potential customers, which would provide feedback regarding whether they value a specific design more or whether other factors are more important.
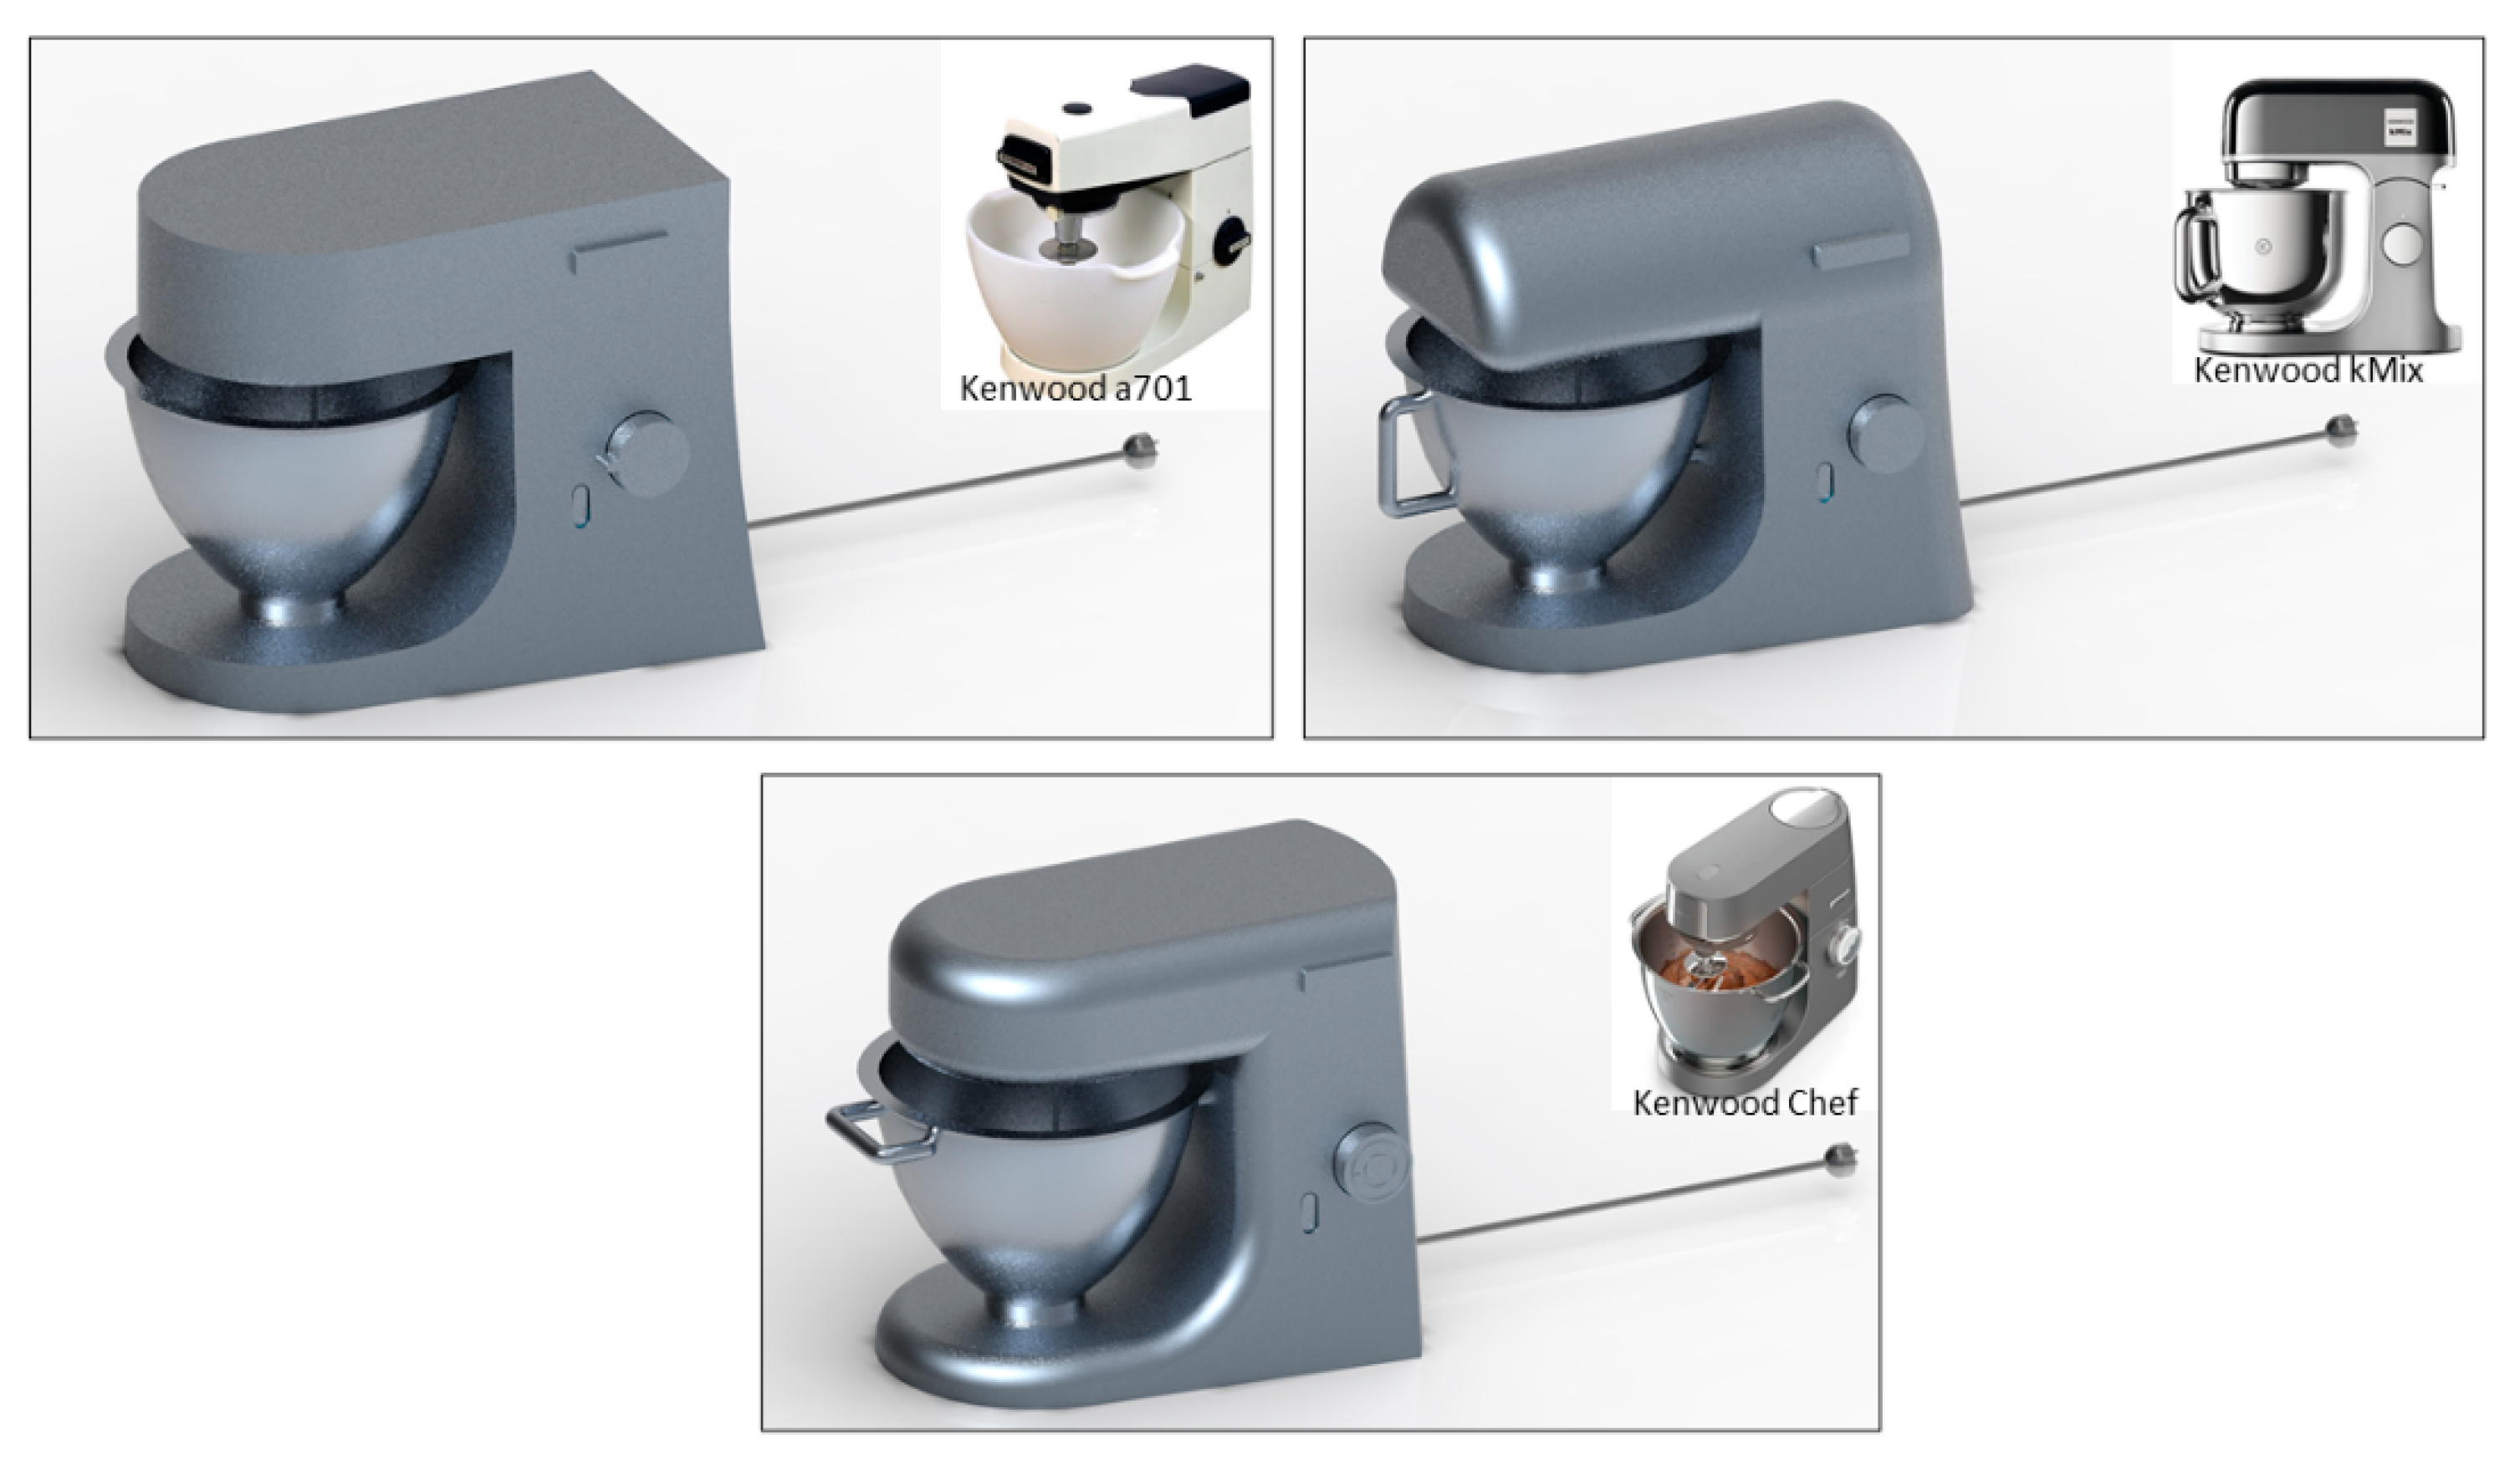
The major differences between designs of the Kenwood kitchen stand mixer (they are very similar) were the shape of the buttons and the overall shapes of the housing. Based on this, 3 different designs were constructed to capture the different Kenwood stand mixer designs (see Figure 8). The kMix’er series could not be constructed as the original design, since this design has the motor at the top instead of in the “stomach” of the housing (different quantified structure).
Extra parameters: The parameter of weight did not achieve a high score in the survey from the market research. However, this parameter was very simple to calculate by summarizing the volume of the parts (automatically calculated by the CAD software) and the density of the chosen material. This would therefore be calculated as well. From the quantitative interview from the market research, it also seemed that the overall size of the product was important, e.g., to make sure that it could fit into the cupboard. This was a simple multiplication of the width, length, and height of the smallest box which the kitchen stand mixer could be placed in. This would therefore also be a quantifiable aspect of the model.
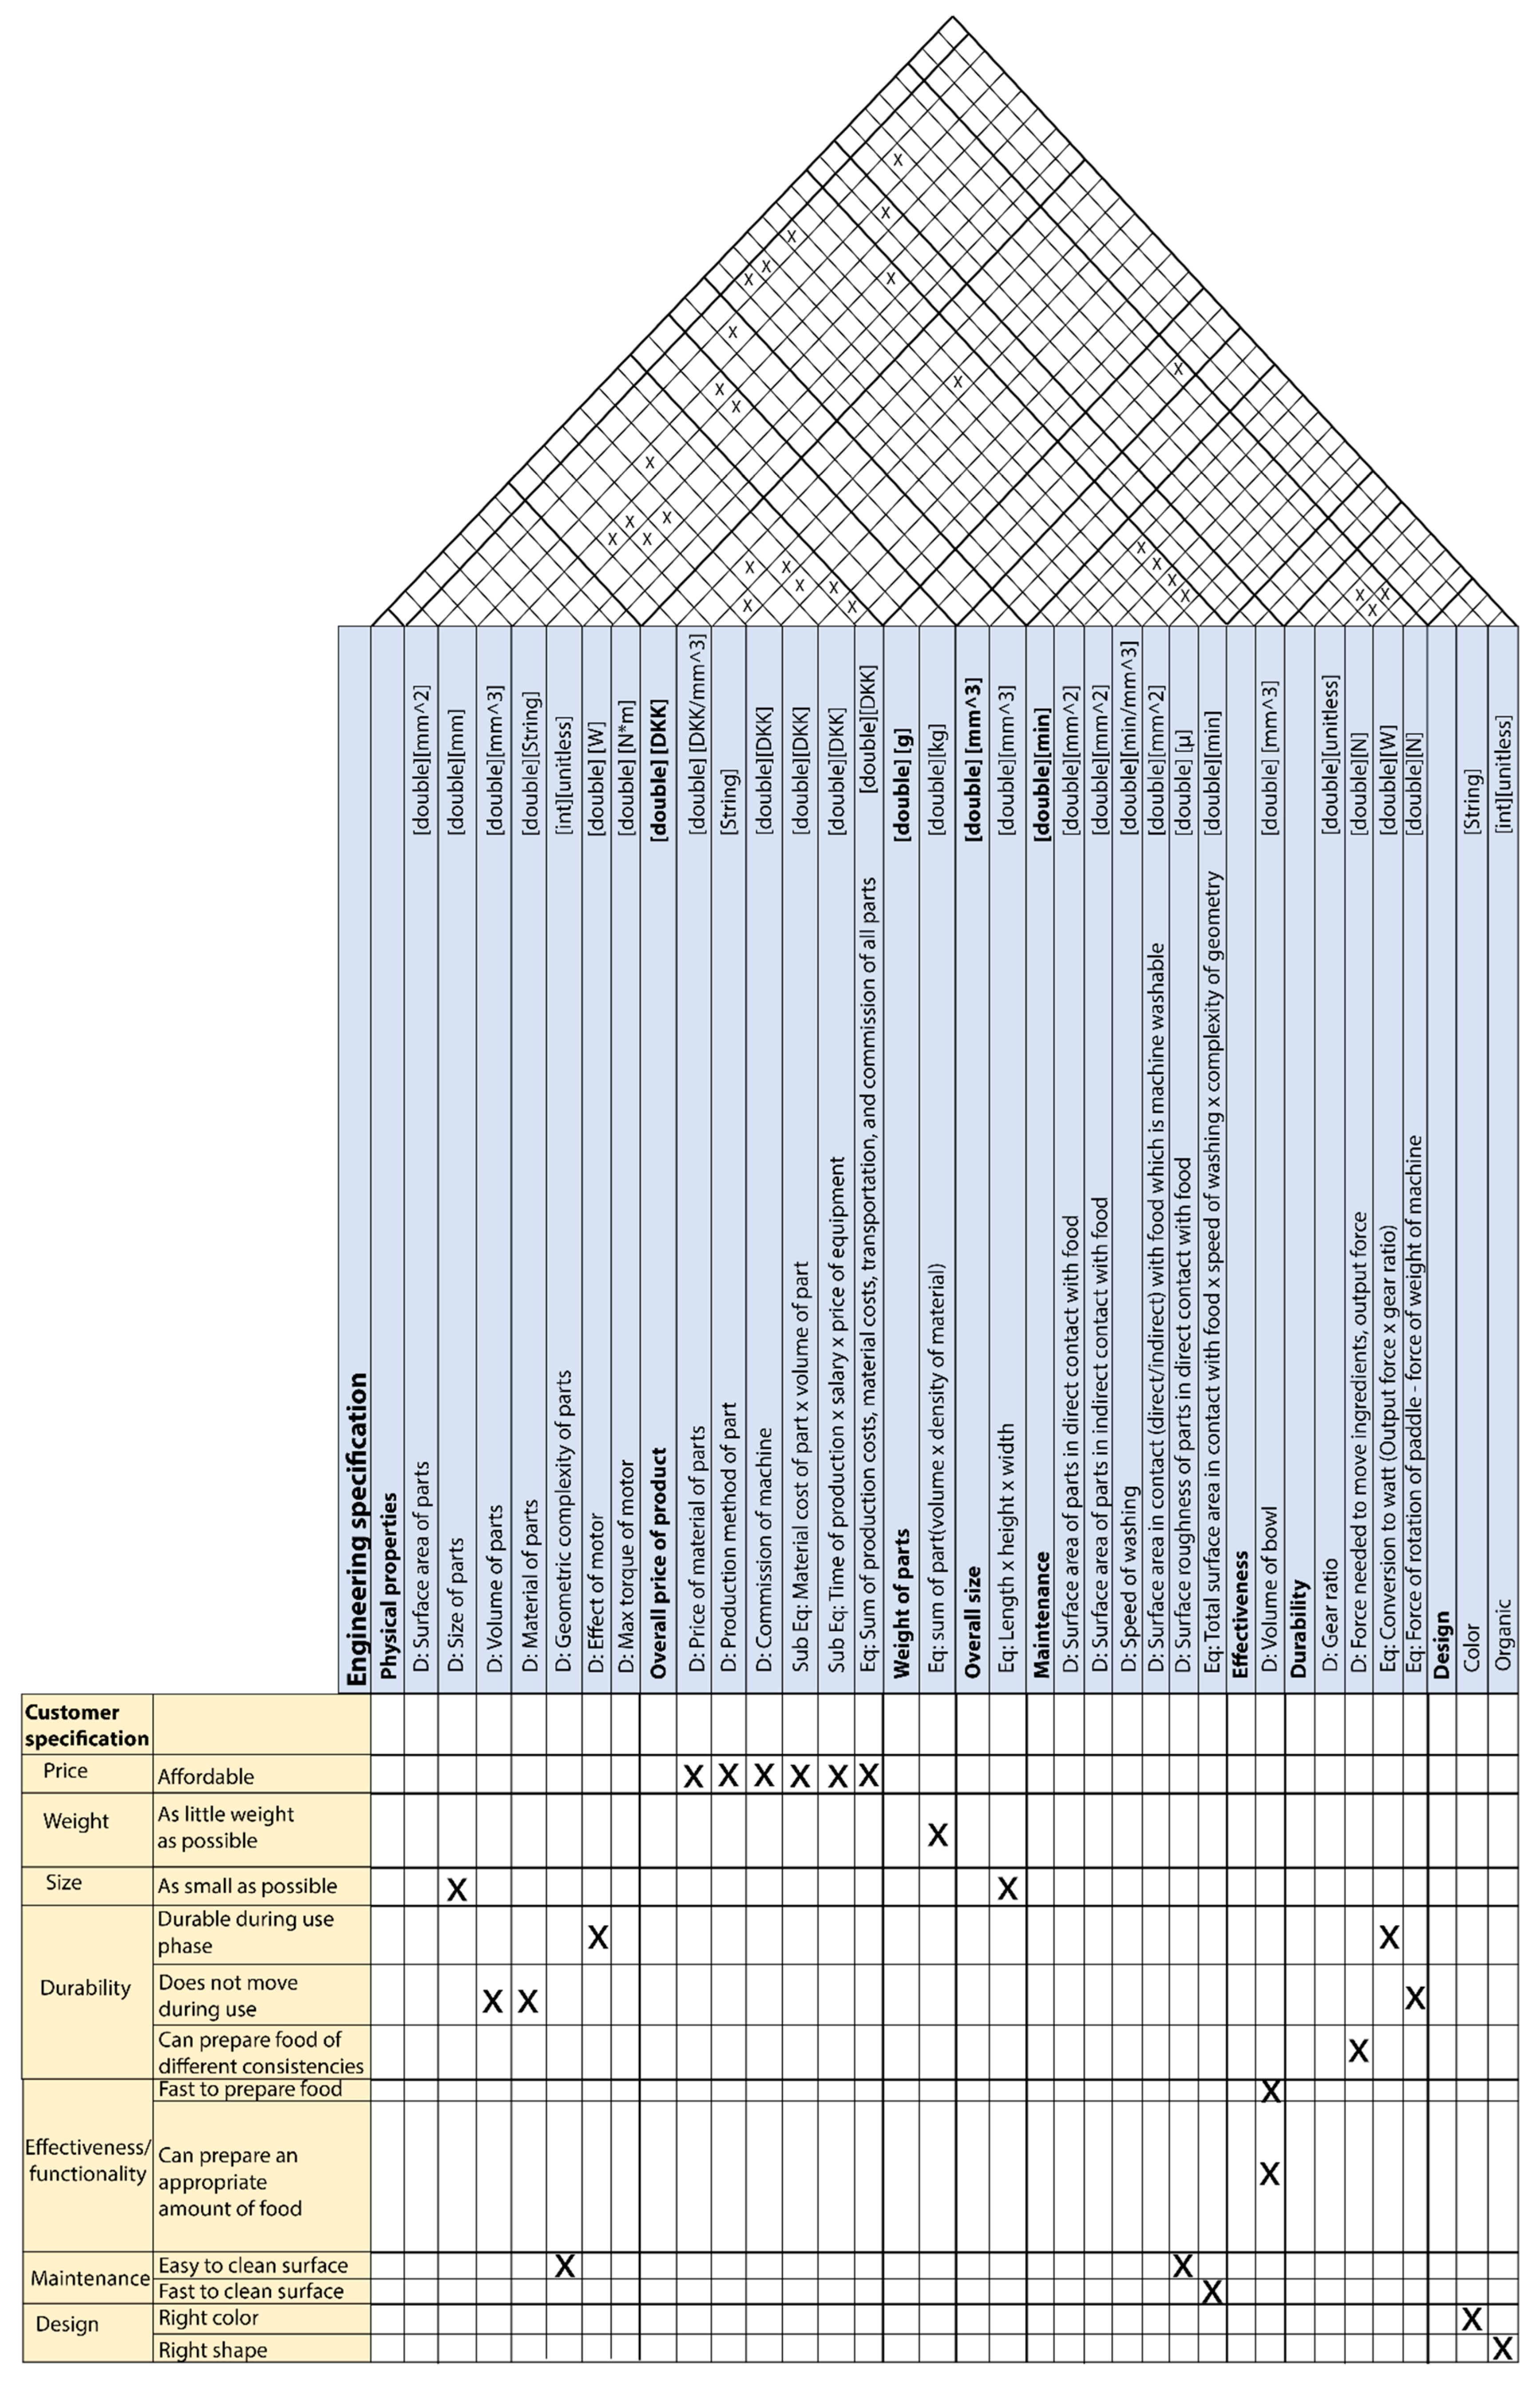
A house of quality [27] (Figure 9) was constructed to create an overview of the connection between the engineering and customer view of the product.

2.4. Phase Three: Development of the Product Configurator

The configurator was created based on a 3D model constructed in PTC Creo Parametric, which was integrated into Phoenix Integration’s ModelCenter, an integration tool. Many of the features in the 3D model (e.g., reference dimensions and family tables) were not transferable into ModelCenter (at least not with the standard wrapper made by ModelCenter). Only input parameters of the top level and driving dimensions were transferable into ModelCenter. These were all based on common data types such as arrays (no matrices), Boolean, integers, double, string, etc. The 3D model was made based on top-down design [28] as a “skeleton model”, which consists of a “master file” with the blueprint for the different parts/sub-systems of the product. This ensures that the sub-systems are feasible/appropriate for one another. The assemblies and sub-assemblies should therefore correspond to the class diagram. However, some sub-classes were modeled as separate parts due to their different placement in the three-dimensional space. The structure of the master file was based on resilient modeling [29] (see Table 1) where the goal was to construct a robust 3D model when subjected to change. This was achieved by minimizing unnecessary inter-dependencies between features through the use of reference features and a core feature. The core feature chosen was the housing/shell of the model. Consequently, all other parts were defined based on the chosen size of the housing.
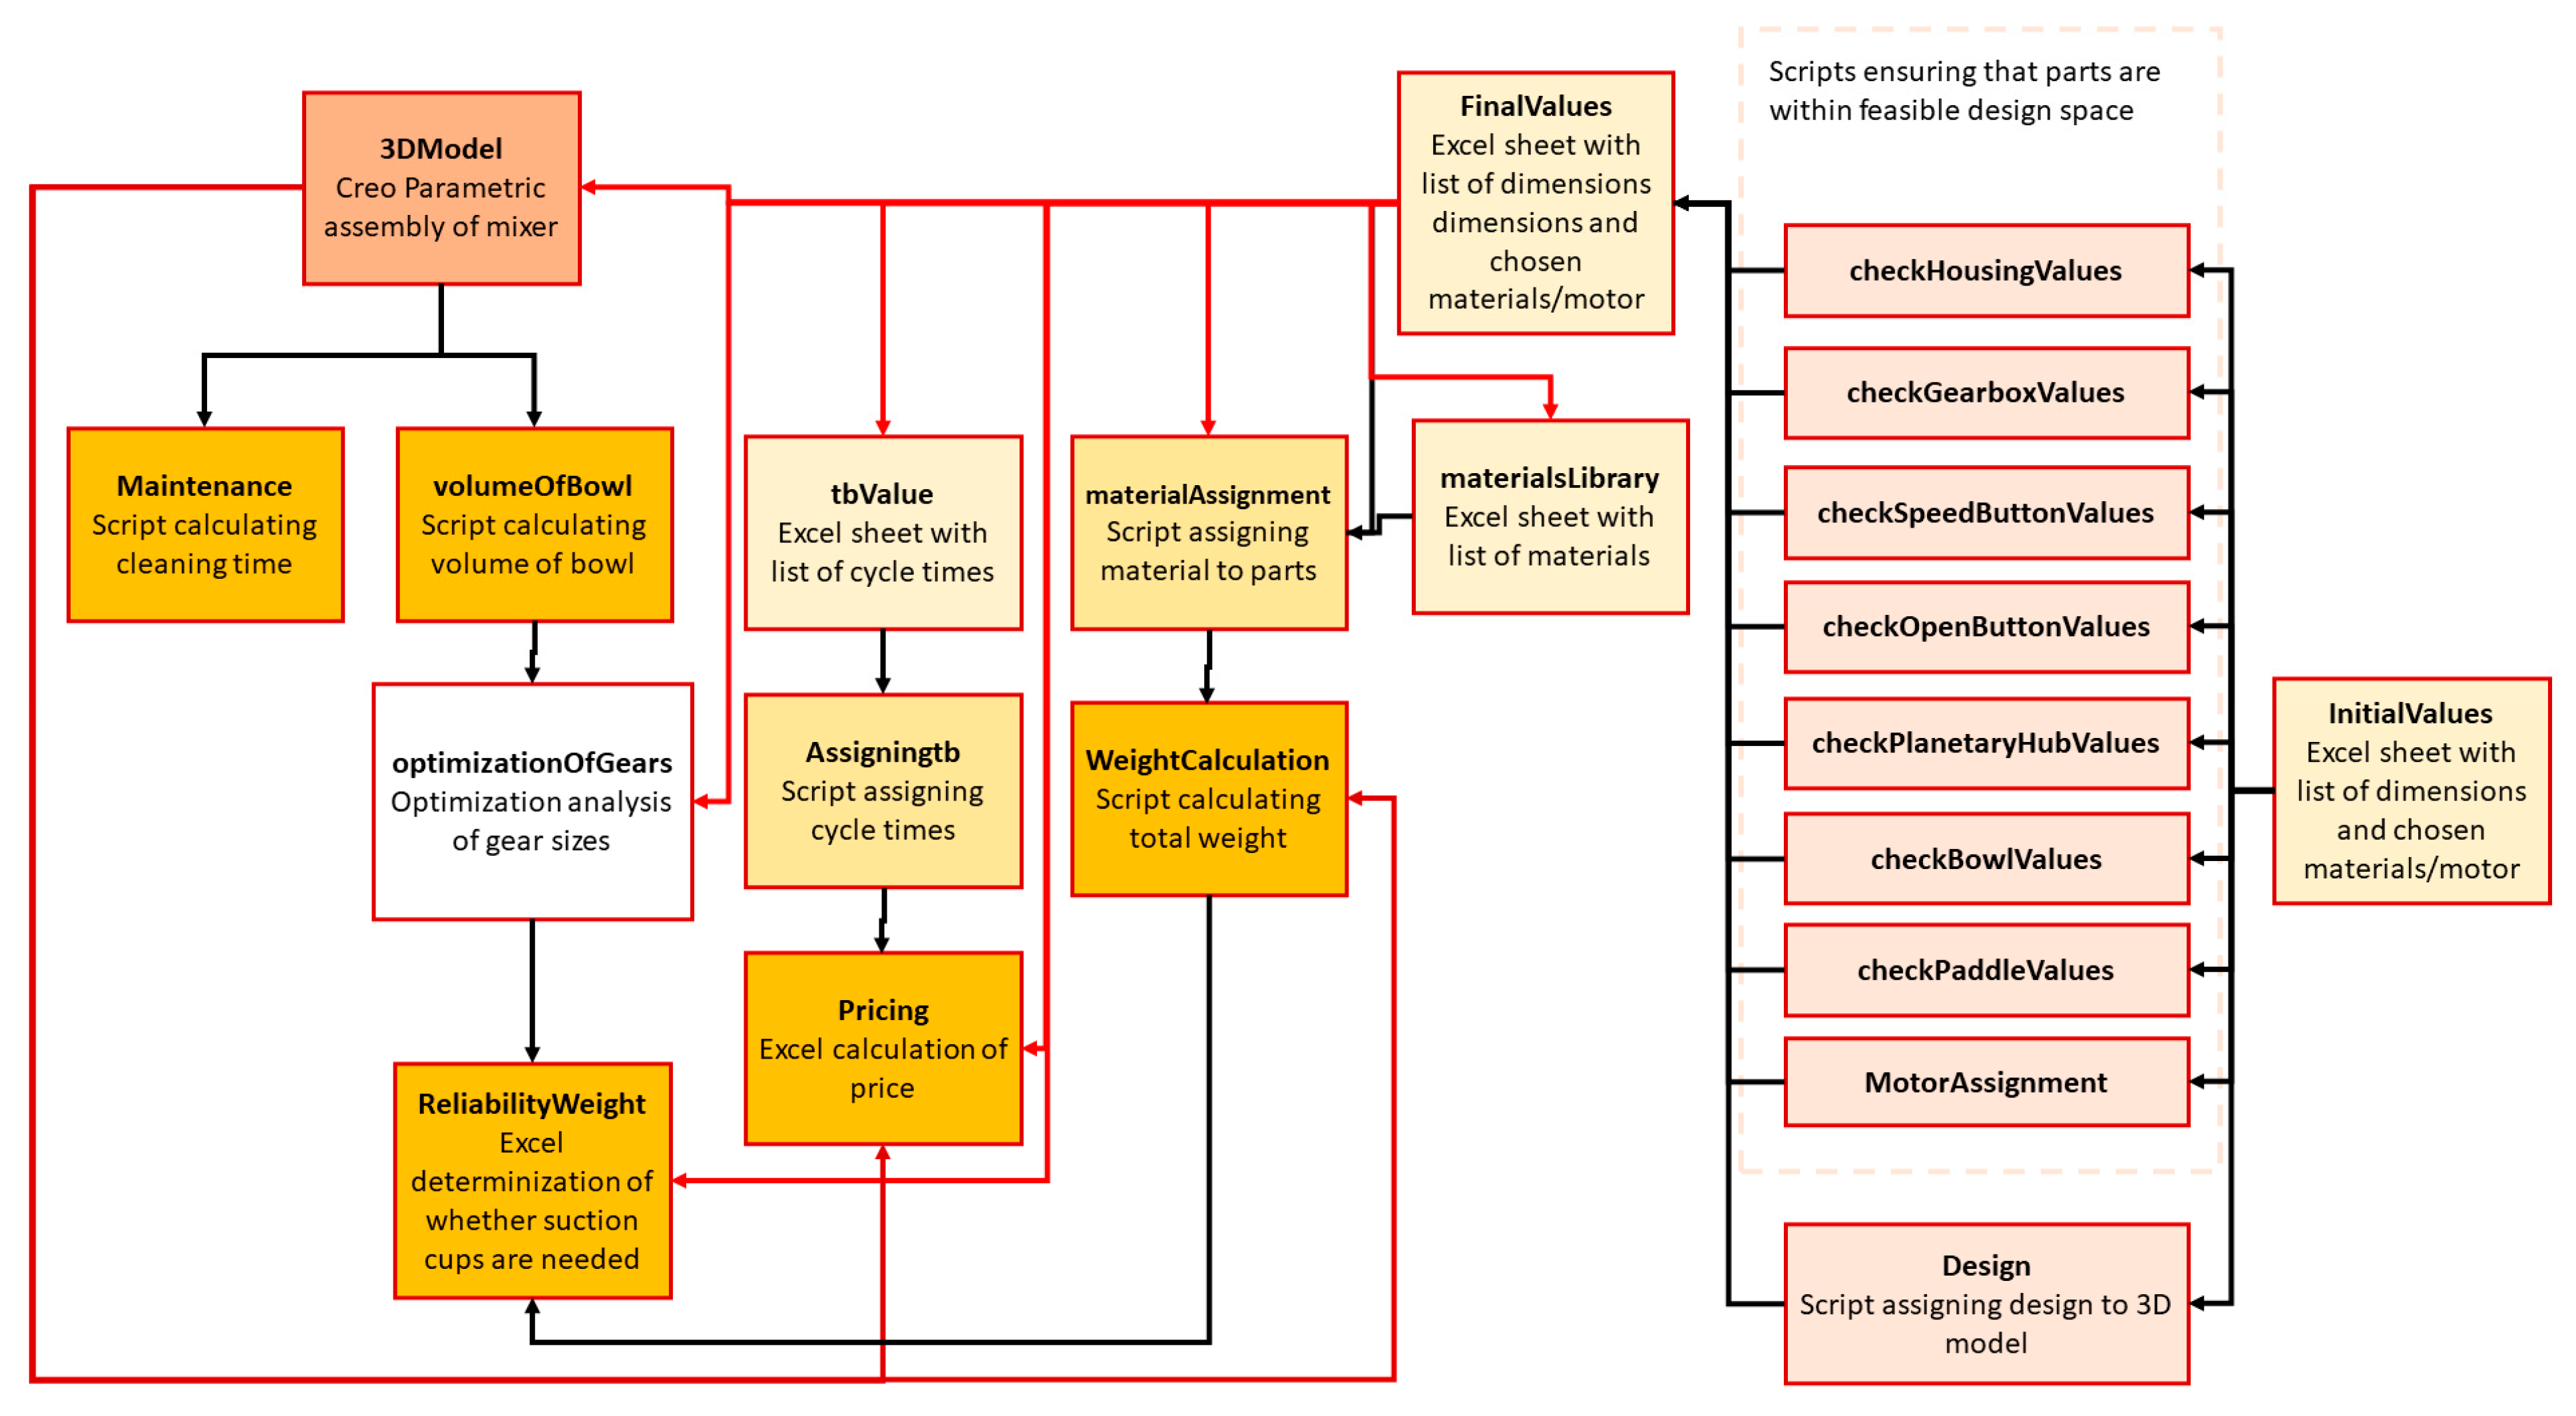
It became apparent during introduction of the first modalized part, the motor, that modulization was troublesome to incorporate into the integration software: it was necessary to create a separate script, which assigned the right values of each dimension of the module. Furthermore, if the module contained features which had to be suppressed/unsuppressed then this had to be specified in the programming window of Creo by manually writing an if-statement associated with a Boolean variable, which would then control this. Lastly, the modules could not be part of the Design of Experiments (DoE) analysis (since it was controlled by integer values). It was therefore decided to discard the option to modulate anything but the motor, since this had to be differentiated based on the different assortment of power (watt). Configurators often consist of different rules (constraints) regarding what modules can and cannot be combined [7]. This was assumed to be part of the model. However, due to the technical difficulties, only constraints in terms of changes in dimensions depending on the other dimensions were considered. The model (in the integration software) consisted of different files, which calculated different aspects of the design goal. Each file in the model consisted of data inputs, calculations/analysis based on these inputs, and data outputs. The inputs were either chosen during analysis or based on output variables of other parts, e.g., the weight calculation was based on the volume from the 3D model and the density of the material of the parts. Figure 10 provides an overview of the different parts of the model. The figure shows (from right to left) how the model consisted of a list of initial values of dimensions and other variables, which were then adjusted through the scripts, ensuring that the concept was within a feasible design space (e.g., parts were not overlapping). The final values were then used to calculate the different performance indicators. The materials library contained information about each material (e.g., price and density). This was used to calculate the weight of the part based on the volume from the CAD model. The pricing was calculated based on the tb values (which depended on the size of the part and the material), the chosen material, and the size of the part. The maintenance and volume of the bowl were calculated based on the size of the parts. The gears were optimized based on an optimization analysis with a CAD model of the gears. This was used to calculate whether the product would need suction cups as feet to stay in place during use.
During the development, it became clear that there existed some limitations between the integration tool and the CAD software, which affected the final model:
The integration software only received the dimensions from parts which were active/unsuppressed in the model. This made it very important that all major dimensions were stored in the skeleton model, which were always active. Features with dimensions, which were suppressed in some cases, e.g., the different designs, were stored as parameters as well. However, using parameters should be limited, since these would have to be stored as both a parameter in the local part (e.g., skeleton) and the assembly in order for the integration software to access it as an input, which added unnecessary complexity to the model.
Another downside of using the 3D model of the kitchen stand mixer to both produce a visual representation of the parts and volumes was that a circular reference was created when the on/off of the suction cups was based on the final weight of the product, since the weight depended on what parts were turned on/off, while the suction cups were turned on/off dependent on the weight. The suction cups were therefore not physically turned on/off in the 3D model, but stored as a Boolean (it was assumed that the suction cups would not affect the weight enough to change the outcome of the reliability calculation). Even though multiple scripts had been created to make sure that the changes in the dimensions of the model did not result in other parts of the model failing (or correlating), errors could still occur in some scenarios. This was especially true for the roundings and shell thickness of the parts, since it seemed impossible to determine when these had to be restricted, since they depended on the overall geometry of the product. There was a trade off in terms of how well the dimensions of the different parts should be restricted, since it would be beneficial if the majority of the designs created through analysis were successful designs. However, this was ensured through restricting the design space based on simplified rules. Making too many rules might therefore result in very similar designs, where scaling would be the main difference.

2.5. Phase Four: Concept Development and Test

Through initial analysis it became clear that the optimization of the sizes of the gears in the gearbox could be optimized for almost all box sizes (since they could be scaled) and that the gears could be optimized in a way which would make the watt needed in the motor very small (less than 10 watt). This was assumed to be due to the extensive sequence of gears in the gearbox or a calculation error. It was therefore determined that the gear ratio would not be the defining factor of the size of the motor. The gearbox optimization was therefore not part of the concept development of new kitchen stand mixers since this also severely slowed the process. The durability/reliability performance indicators were therefore not part of the analysis. Each variable (dimension) would need to be defined in terms of its upper and lower bound. The shells’ values were based on trial-and-error modeling on the 3D model (what upper and lower limit of the shell would break the model?). The upper and lower bounds of the housing geometry were based on the outside values of the Kenwood Chef mixer and then a range of 10 cm to 20 cm. The values of the geometries of the remaining parts were based on reasonable changes based on the maximum and minimum of the housing dimensions.
A design of experiment (DoE) was performed to understand which dimensions (of the 3D model) and other variables (variables defined for each performance indicator) had the largest effect on the different performance indicators. Some variables which had to be used as inputs in the DoE were integers and not double (e.g., motor no. and design no.). The only algorithm available for this scenario was “Parameter Scan”, which was deemed unfit for this project since the amount of runs necessary for the analysis was so great that the program would not allow it to run. This posed a problem, since some of the most important variables were integers, such as the design, motor type, and materials. It was decided to do the same DoE of the different designs with the double variables. The algorithm used was “Latin hypercube sampling” in order to equally uncover all parts of the design space while still controlling the number of runs. Only about 80 runs could be performed per analysis due to a technical issue between the integration software and the 3D model software. Three DoEs were performed per design in order to minimize any false positives due to the low number of runs. The variables which consistently had a significantly (by eye) larger sensitivity compared to the other variables were chosen as variables worth using in the optimization analysis. After the DoE it became clear that the variables with the most influence on the different parameters were:
  • Housing: Height of void.
  • Housing: Length of platform.
  • Housing: Bottom diameter.
  • Housing: Housing bottom width.
  • Housing: Length of the bottom vertical part.
  • Housing: Shell.
  • Bowl: Distance from the bowl to the housing.
It is also worth noting that the shell of the housing had the most significant effect on the weight (and therefore also price). Part of the reason why this shell’s sensitivity was so great compared to the other parts’ shells was that this varied from 1 to 4 mm, while the others only vary from 1 to 2 mm. The other parts’ shells had a smaller range due to their geometry.
An initial optimization analysis was performed with the variables that significantly affected the outcome (result of DoEs), important values for the design (design no., handle no, button no., and roundings), and the integer variables which were not evaluated based on the DoEs (types of materials, handle type on bowl, motor no., and button designs). The “NSGA II” algorithm was used since this could handle both runs with errors and multi-objective analysis. Three optimization analyses were performed in order to create more results due to the error of the model failing after 80 runs. The population size was set to 10 and max circles were set to 8, with max 2 cycles without improvements. This number was very low compared to the default of 48 runs and max 1000 cycles. This was not a very robust method since it left almost no time for the algorithm to create concepts which performed well in the performance indicators. The concepts were therefore relatively random. The results showed that the following of the integer variables had a significant influence on the outcomes (price and weight): (1) part material of the top housing, (2) part material of the bowl, and (3) part material of the buttons. An assumed solution was found to the technical difficulty limiting the number of runs. A final optimization analysis with the standard option of 48 runs per cycle and max 1000 cycles was performed. The variables in the final optimization analysis included the variables which proved to have significant effect on the output (from the previous sub-section) along with all integer variables (which could not be evaluated in the DoEs), and important variables for the design (all roundings, design number, button number, handle number, motor number). The outputs and algorithm were the same as the previous 3 optimization analyses. It became clear during the analysis that the technical issue was not solved and only about 100 runs could be performed.
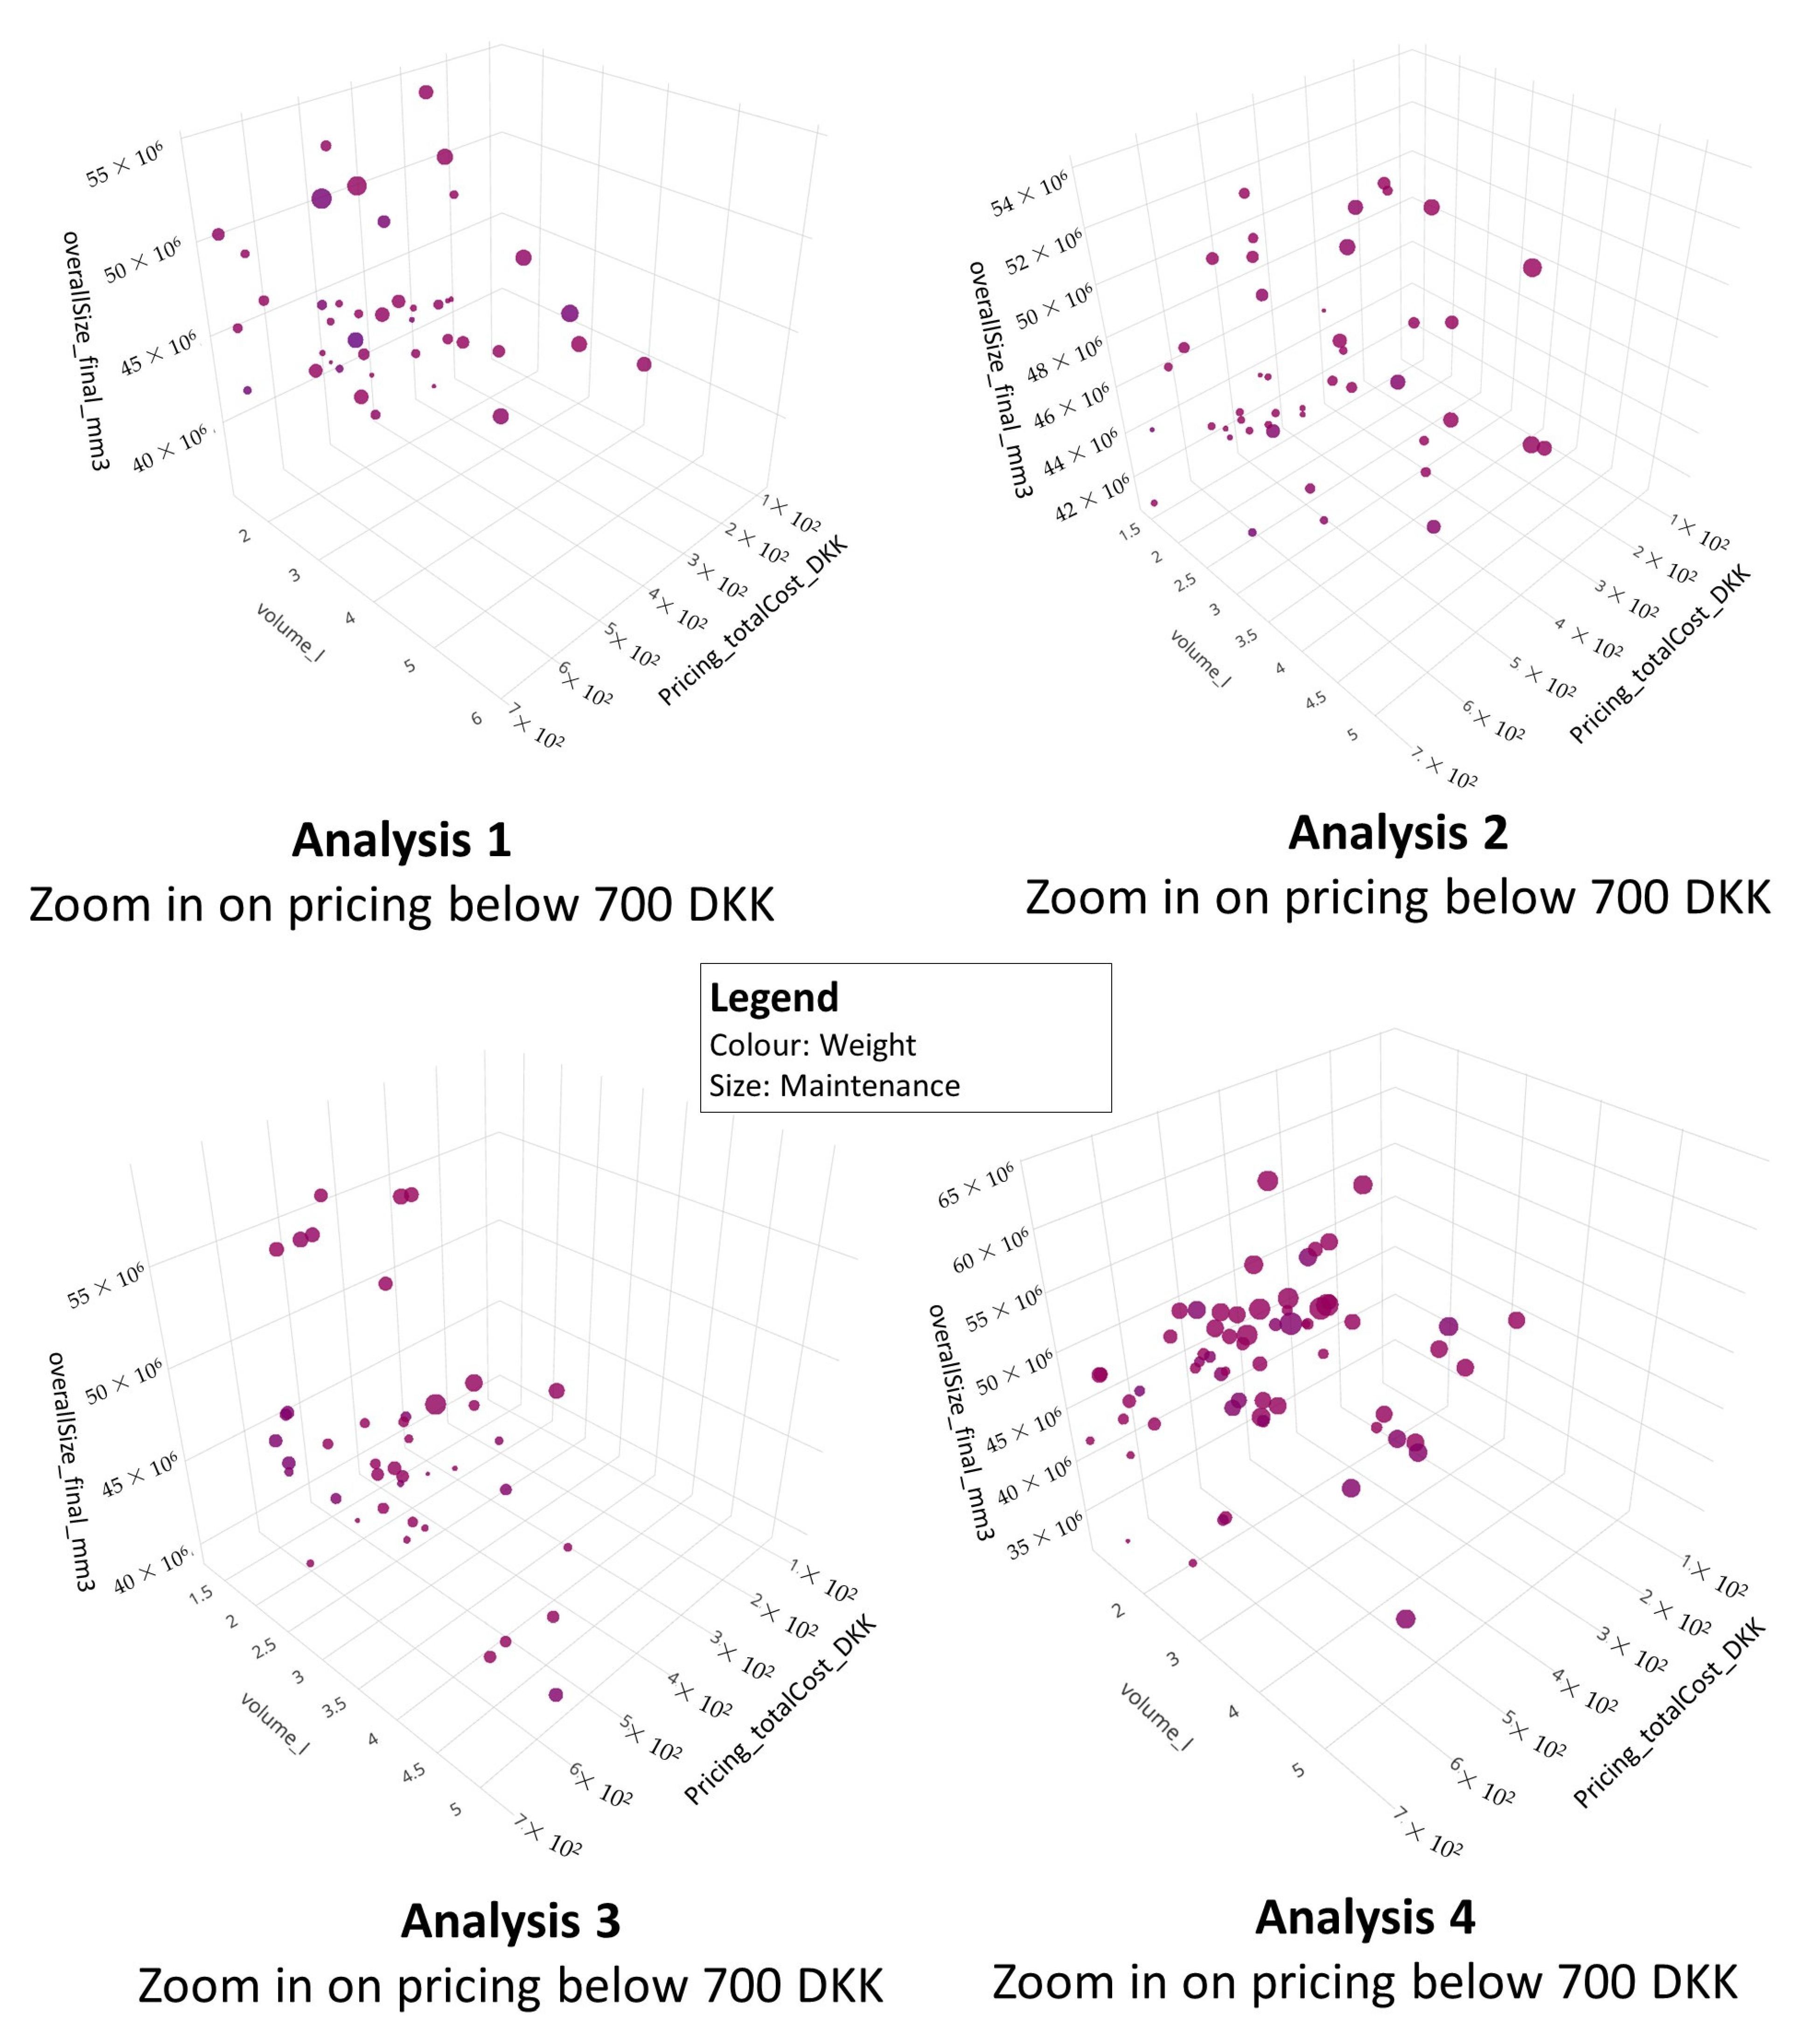
All four optimization analyses were used to decide on appropriate new designs of the mixer. A scatter plot showing all successful runs and their score in each of the outputs (performance indicators) was made for each analysis (see Figure 11). Some materials had a significant influence on the price (e.g., doubling it), which meant that there were some outliers which would not be feasible and therefore were not considered further.
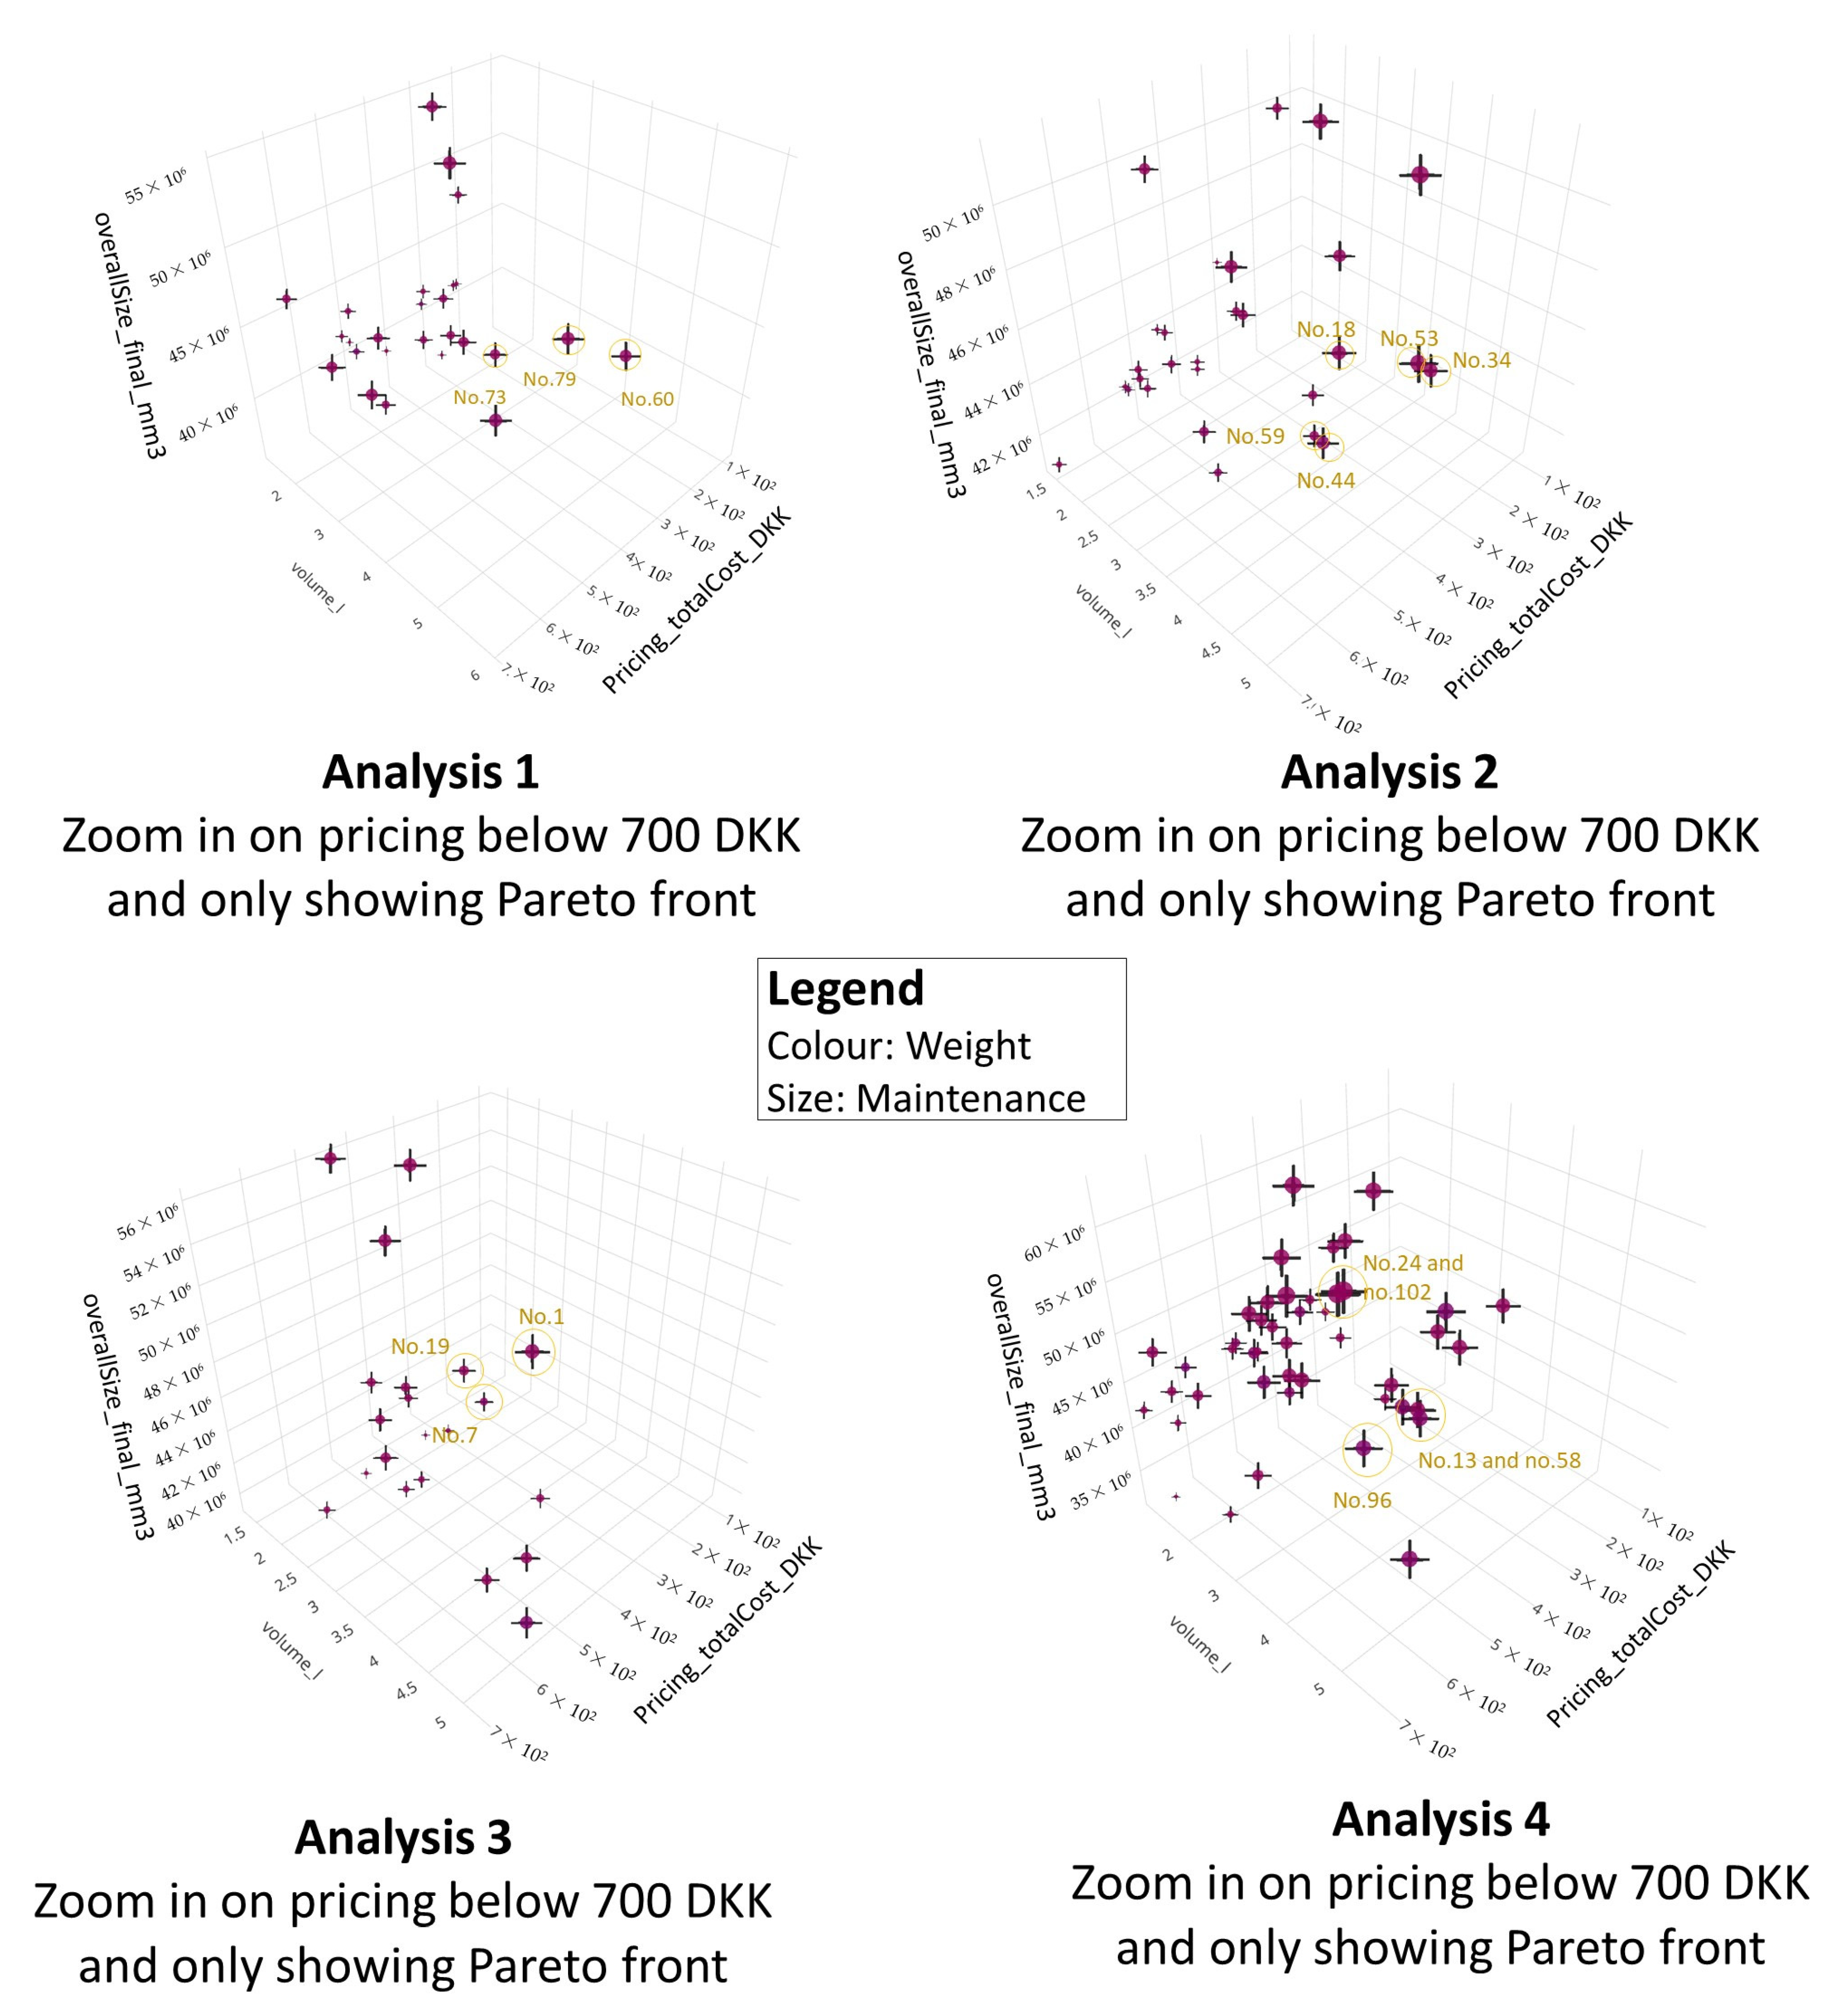
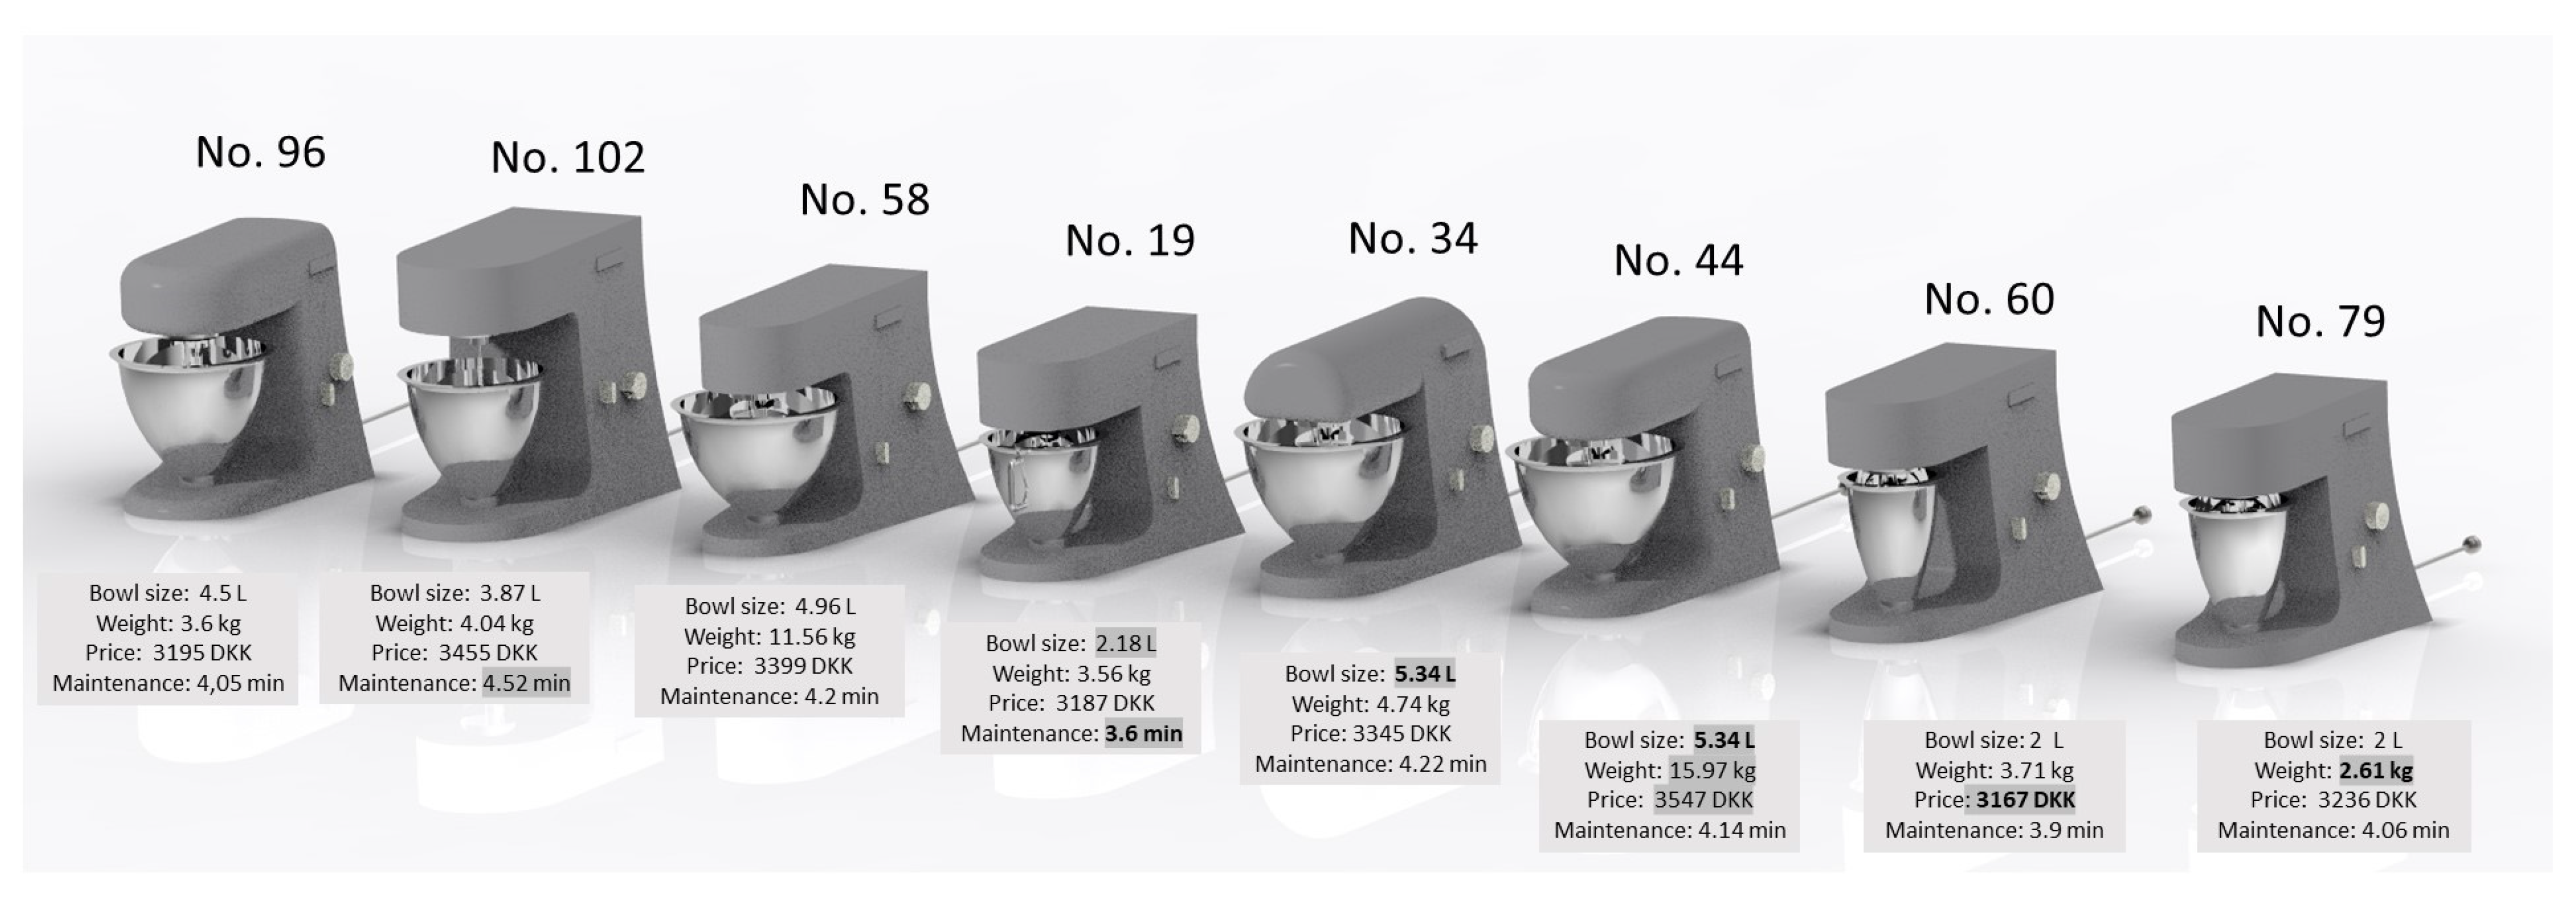
The Pareto front was used to indicate the most interesting concepts based on a tradeoff of the performance indicators (see Figure 12). Some of these concepts were chosen mainly based on low price and variation in bowl size and design (since preferences for these would probably vary from customer to customer). A total of 16 designs were chosen (between 3 and 5 from each analysis), indicated with a circle in Figure 12. Eight of these were discarded based on being too similar to other designs either in their performance indicator or their visual aesthetic. The remaining 8 designs were chosen as the final designs (see Figure 13).
The concepts were evaluated during semi-structured interviews (to gain in-depth understanding of their view on the concepts) with 6 potential customers (2 women and 4 men) through Zoom. During the beginning of the interview the participants were asked about age, occupation, and living situation along with six questions about what performance indicator values the participants preferred (e.g., max weight). The different designs/concepts of the kitchen stand mixer were shown to the participants along with information regarding their performance indicator values (e.g., size, weight, bowl size, price). The price shown to the participants was re-calculated, since the price estimated by the system/model did not correlate with the buying price: the Kenwood Chef, on which the initial dimensions in the 3D model (design 4) were based, costs in Danish currency DKK 3500 [30] in real life. The price of a model with approximately the same values (based on pictures of the product) made in the configurator is DKK 593. It was therefore estimated that about DKK 2900 of the product was not production cost. This was added to all prices of the concepts to produce a price for the customer. This assumption might not be accurate, since some parts of the price, which had not been estimated in the original calculation of the price of the concepts, would likely also be influenced by the design (such as packaging and shipping).
The potential customers were also asked about their preferences in terms of handles on the bowl and type of speed button. The 8 designs had different buttons and handles, but it was assumed to be worthwhile to investigate whether these details were important. Furthermore, the importance of color was investigated by showing the same design with different colors and asking about preferences.
3. Results

The result of this paper was an initial proposal on how tools from mass customization and systematic design could be used to create a product configurator, which could be used for both optimization and configuration of concepts for consumer products based on customer needs. The project showed how a 3D model and calculations of user needs could be used to choose between different concepts generated by the computer as well as provide insight into and overview of what dimensions or other parts of the product had the greatest influence on the user needs. The product configurator created an overview of the many different concepts’ scores in the different performance indicators.
The design space of the product had been systematically constrained through rules and a 3D model where only one quantified structure was possible.
The configurator was used to generate eight different concepts (read more about this in the Methods section), which was shown to as many different potential customers as possible within the scope of the project’s duration. The majority of the participants were engineering students (four out of six). Their age varied from 19 to 30 years old. The majority lived at a dormitory (five out of six). They all agreed on different aspects, such as that the bowl should be big, and the price low. However, the exact number varied a lot (bowl of 3 L to 5 L, price of DKK 1000 to DKK 10,000). The majority did not think that the weight was very important, since it would be standing on the kitchen table permanently. However, when the different designs were shown, the participants stated that some of these were too heavy (some stated that it should not weight more than 6 kg). The majority did not find the difference in size to be an important factor. The most liked design was no. 34 (chosen as the preferred one by half of the participants). Other appropriate designs (according to the participants) were no. 44 due to its small size, no. 96 due to its weight and small size, no. 44 due to its large bowl, and no. 102 due to its bowl size and price.
A list was synthesized by the main author during the end of the research with the needed capabilities of software for a similar project, since the software chosen for the project had been proven to show some unforeseen limitations. This list could be used during future similar research.
The integration software needs to be capable of:
  • Integrating 3D models with the possibility of importing volumes and surface areas of all parts and dimensions from all parts in the model (also dimensions of features which are turned off).
  • Integrating a programming language suitable for advanced calculations (e.g., MatLab, Python, Java).
  • Integrating lists of initially chosen variables and final variables (e.g., Excel sheets).
  • The possibility of transmitting data between 3D model, scripts, and lists as doubles, integers, strings, Booleans, arrays (one or two dimensions).
  • Performing a DoE and optimization analysis with:
    o
    Multiple variables as both doubles and integers which can be specified to be lower than 1.
    o
    Multiple outputs.
    o
    An algorithm which can deal with a model, which might fail/break/contain errors in some instances/runs.
    o
    An algorithm where the user has a certain amount of control over the number of runs or time which the analysis will take.
  • Creating an overview of all runs of an analysis with the values of all relevant variables and a 3D model of all runs.
  • Representing results of analysis in a structured way:
    o
    Sensitivity analysis of all variables and their influence on each output.
    o
    A 3D scatter plot with all outputs and runs with Pareto front.
    o
    Scatter plot of relation between two variables or variable and output.
    o
    Boxplots of all outputs.
This list can be used in further research to develop a more robust system with fewer of the problems we ran into during our research.

4. Discussion and Conclusions

At a general level, this paper demonstrates a configurator-based method to combine customer preference feedback with multi-disciplinary optimization. It is shown that incremental changes to existing designs of a kitchen stand mixer are feasible with this approach (which was the goal of this research). This was possible based on the calculation of different performance indicators for each concept, a 3D model, scripts restricting the design space, and design of experiment (DoE) and optimization analysis. Using the diverse set of engineering models, it was possible to gain an overview of the different concepts’ feasibility in different performance indicators (which were based on user needs). By pre-generating a variety of Pareto optimal concepts across this design space, it was possible to present a diverse and performant set of concept visualizations to potential customers. In this work, eight of the many generated concepts were validated with potential customers and half of the customers preferred the same concept. Based on this research we have identified a variety of practical challenges associated with incorporating customer preferences into multi-disciplinary optimization of concepts. However, further research is required, since it is unknown whether the extensive knowledge gathered and analysis needed during the project would outweigh the benefit of the system (especially since the tool could only suggest incremental changes). This suggests that a more flexible tool might have been beneficial, where the concepts have different quantified structure, and the geometry of the different parts varies to a greater extent.
Furthermore, the following problems (Table 2) encountered during the project would need to be solved before the process can be used in future projects. The problems will also be briefly described in the text after the table.
This sub-section summarizes the problem areas encountered during the synthesis of CAD concepts and evaluation of these with potential users. These problem areas represent the key findings of this work and serve as one set of user needs for researchers working on tools to integrate generative CAD with approaches that consider user needs.
Concepts: The system created incremental changes to the concept, which might not be beneficial in a real-world case. This was because the quantified structure was the same for all concepts and it used a bottom-up approach. This also resulted in the need for scripts ensuring that the concepts were feasible (the 3D model did not contain errors), creating very similar designs. A solution might have required a different approach in terms of how the 3D model was constructed by using a bottom-up approach instead of a top-down approach, where the parts inside the product determine the size of the shell and not the other way around, to be able to change the point in space where each part is placed in the 3D model. The configurator was also supposed to consist of both parts, where the system could choose between different modules, and parts, which could be topologically optimized. However, only one component was modularized due to a lack of data in terms of what parts exists in multiple modules and what their technical differences are as well as due to technical difficulties in terms of the integration between the 3D model software and the configuration tool. This was partially due to the time at which the CAD tool and integration software was chosen: the software was chosen before the structure of the product had been mapped. However, good practice according to Hvam et al. would be to choose software after the product structure has been defined [7].
Analysis: Furthermore, technical issues meant that only very few runs could be performed in each analysis, which was assumed to make the results less reliable. These issues led to a more precise knowledge of the needed capabilities of software for a future similar tool. It became apparent that the data which were naturally presented by the 3D model software were limited: an independent analysis tool would therefore be needed to analyze the concepts (3D model) and, e.g., estimate the number of holes in the housing. This would be needed to address more specific performance indicators, such as changes to the number of undercuts needed in an injection mold for a part (which would affect price).
Interpretation of analysis: The range of input variation did not always lead to a meaningfully different output from the customer perspective (e.g., if the product weighs less than 1 kg, then the difference between 0.5 kg and 1 kg might not matter). Thus, a possible future improvement in this method is to minimize the constraints of the model (e.g., by allowing different quantified structures) to ensure a large design space, where significantly different concepts can be created. Only very few people were interviewed, and the results are therefore not as robust as one might have hoped. Furthermore, user feedback on concepts based solely on pictures and information poses a limitation, since part of the customer experience would be the actual interaction and use of the product.
User needs vs. performance indicators: During the process it did not seem beneficial to use function modeling as a tool to translate the user needs into quantifiable performance indicators due to the nature of the user needs, where the majority were not connected to a specific function of the product. Instead, tools from different engineering disciplines were used to quantify the user needs. An overall procedure or structure of quantifying these needs is therefore still missing. Furthermore, limitations in terms of quantification of user needs were found: extensive knowledge about the system and how the geometry of the product would affect the needs (e.g., effectiveness of mixing) was missing. Understanding the performance of a given mixer arm, for example, might require a computationally expensive fluid simulation. Additionally, assessment of the qualitative aspects of the optimized designs (e.g., visual appearance or desirability of the mixed dough) may only be possible with physical prototyping. Many of these complex user needs were therefore not translated into performance indicators. Translating these (creating an extensive number of performance indicators) might also have diminished the overview of preferred concepts due to data overload for the engineer using the tool. A different approach might be needed in this case.
Maintenance: The system has to be easy to maintain, both during development and during use. Different problems arose regarding maintainability during development, in particular, the scripts created to constrain the design space were troublesome to maintain since they were tied to specific dimensions in the 3D model. Furthermore, many data-objects were created. Ensuring that they all had an understandable naming was also a challenge.

Author Contributions

Conceptualization, C.S.N. and R.M.A.; methodology, C.S.N. and R.M.A.; software, C.S.N.; validation, C.S.N.; formal analysis, C.S.N.; investigation, C.S.N.; data curation, C.S.N.; writing—original draft preparation, C.S.N.; writing—review and editing, R.M.A.; visualization, C.S.N.; supervision, R.M.A.; project administration, C.S.N. All authors have read and agreed to the published version of the manuscript.

Funding

This research received no external funding. This research is partially supported by the Technical University of Denmark. Any opinions or findings of this work are the responsibility of the authors, and do not necessarily reflect the views of the sponsors or collaborators.

Institutional Review Board Statement

Not applicable.

Informed Consent Statement

Not applicable.

Conflicts of Interest

The authors declare no conflict of interest.

References

  1. Nielsen, C.S. Exploration of the Use of Product Configurator in the Design Process to Develop a New Concept Based on User Feedback. Master’s Thesis, Design and Innovation–Technical University of Denmark, Kongens Lyngby, Denmark, 17 June 2021. Available online: https://findit.dtu.dk/en/catalog/2691222008 (accessed on 10 February 2022).
  2. Cross, N. Engineering Design Methods: Strategies for Product Design, 4th ed.; Wiley: Chichester, UK, 2008. [Google Scholar]
  3. French, M.J. 1 Introduction. Conceptual Design for Engineers, 3rd ed.; Springer: Heidelberg, Germany, 1999; pp. 1–15. [Google Scholar]
  4. What Is the Framework for Innovation? Design Council’s Evolved Double Diamond. Available online: https://www.designcouncil.org.uk/news-opinion/what-framework-innovation-design-councils-evolved-double-diamond (accessed on 24 May 2021).
  5. Forsberg, K.; Mooz, H.; Cotterman, H. Visualizing Project Management, 3rd ed.; John Wiley and Sons: New York, NY, USA, 2005; pp. 108–116, 242–248, 341–360. [Google Scholar]
  6. Spath, D.; Neithardt, W.; Bangert, C. Optimized design with topology and shape optimization. J. Eng. Manuf. 2002, 216, 1187–1191. [Google Scholar] [CrossRef]
  7. Hvam, L.; Mortensen, N.H.; Riis, J. 5 Analysis of the Product Range. In Product Customization, 1st ed.; Springer: Heidelberg, Germany, 2008; pp. 139–196. [Google Scholar]
  8. Entner, D.; Prante, T.; Vosgien, T.; Zavoianu, A.C.; Samingerplatz, S.; Schwarz, M.; Fink, K. Potential identification and industrial evaluation of an integrated design automation workflow. J.Eng. Des. Technol. 2019, 17, 1085–1109. [Google Scholar] [CrossRef]
  9. Komoto, H.; Tomiyama, T. A framework for computer-aided conceptual design and its application to system architecting of mechatronics products. Cad Comput. Aided Des. 2012, 44, 931–946. [Google Scholar] [CrossRef]
  10. Burnap, A.; Hauser, J.R.; Timoshenko, A. Design and Evaluation of Product Aesthetics: A Human-Machine Hybrid Approach; MIT Management School, Massachusetts Institute of Technology: Cambridge, MA, USA, 2019. [Google Scholar]
  11. Kang, N.; Ren, Y.; Feinberg, F.; Papalambros, P. Form + Function: Optimizing Aestheticproduct Design via Adaptive, Geometrized Preference Elicitation; Mechanical Systems Engineering, Sookmyung Women’s University: Seoul, Korea, 2019. [Google Scholar]
  12. Tjalve, E. Methods used in form design. In Systematic Design of Industrial Products; Institute for Product Development, Technical University of Denmark: Kgs. Lyngby, Denmark, 2003; pp. 17–92. [Google Scholar]
  13. Kallio, H.; Pietilä, A.; Johnson, M.; Kangasniemi, M. Systematic methodological review: Developing a framework for a qualitative semi-structured interview guide. J. Adv. Nurs. 2016, 72, 2954–2965. [Google Scholar] [CrossRef] [PubMed]
  14. Hoff, H.; Westergaard, K.; Jakobsen, G.S. Madkultur 2018. 2018. Available online: https://www.madkulturen.dk/wp-content/uploads/2019/08/Madkultur18_final.pdf (accessed on 2 March 2021).
  15. Mortensen, L.B.; Hybel, M.; Thomsen, B. Frysepizza er Favoritten: Andreas på 23 køber Færdigretter Hver Dag. 2019. Available online: https://www.dr.dk/mad/artikel/frysepizza-er-favoritten-andreas-paa-23-koeber-faerdigretter-hver-dag (accessed on 4 April 2021).
  16. Kenwood. Available online: https://www.kenwoodworld.com/da-dk (accessed on 27 May 2021).
  17. Crossfader, X. Kenwood Chef Titanium Disassemble Repair. Available online: https://www.youtube.com/watch?v=AdiNEwVQWCA&t=688s (accessed on 5 April 2021).
  18. Kenwood km 28. Available online: https://www.youtube.com/watch?v=6sLpO5hqdkA&ab_channel=TheSamodelTheSamodel (accessed on 5 April 2021).
  19. Kenwood Chef Titanium Disassemble Repair. Available online: https://www.youtube.com/watch?v=AdiNEwVQWCA&t=688s&ab_channel=CrossfaderX (accessed on 5 April 2021).
  20. Kenwood Chef A901 Food Mixer Repair Time-Lapse. Available online: https://www.youtube.com/watch?v=-dwpjGn-KLY&ab_channel=ElliottVeares (accessed on 5 April 2021).
  21. Kenwood Service Manual and Spare List for Chef Models a.701 a.701a & Attachments. Available online: http://www.britishexplorers.com/Kenwood%20gearbox/A701a%20service%20info.pdf (accessed on 5 April 2021).
  22. Chang, K.H. Product Manufacturing and Cost Estimating using CAD/CAE, 1st ed.; Elsevier Inc.: Amsterdam, The Netherlands, 2013; pp. 133–294. [Google Scholar]
  23. Kenwood Chef Service. Available online: https://kenwoodchefservice.co.uk/ (accessed on 4 April 2021).
  24. How to repair a Kenwood Chef Gearbox. Available online: http://www.britishexplorers.com/Kenwood\%20gearbox/homepage.html (accessed on 5 April 2021).
  25. Stephan, A.; Paetzold, H.; Heinzler, M.; Oesterle, S.; Fischer, U.; Gomeringer, R.; Näher, F.; Kilgus, R. Mechanical and Metal Trades Handbook, 3rd ed.; Verl. Europa-Lehrmittel, Nourney, Vollmer GmbH & Co. KG: Haan-Gruiten, German, 2012; p. 253. [Google Scholar]
  26. Describing Words. Available online: https://describingwords.io/for/design (accessed on 4 May 2021).
  27. Maritan, D. Four Phase and Comprehensive Models. In Practical Manual of Quality Function Deployment, 1st ed.; Springer: Heidelberg, Germany, 2015; pp. 15–19. [Google Scholar]
  28. Chen, X.; Gao, S.; Yang, Y.; Zhang, S. Multi-level assembly model for top-down design of mechanical products. Cad Comput. Aided Des. 2012, 44, 1033–1048. [Google Scholar] [CrossRef]
  29. Resilient Modeling Strategy. Available online: https://community.sw.siemens.com/s/article/seu13-122-a-resilient-modeling-strategy-richard-gebhard (accessed on 6 May 2021).
  30. Kenwood Køkkenmaskine kvc7300s–sØlv. Available online: https://www.bilka.dk/produkter/kenwood-koekkenmaskine-kvc7300s-soelv/100353711/ (accessed on 20 May 2021).
Figure 1. Overall project process showing the different tools used.
Systems 10 00060 g001
Figure 2. Showing how the different phases from the project in Figure 1 fit into the V-model.
Systems 10 00060 g002
Figure 3. Overall structure of kitchen stand mixer.
Systems 10 00060 g003
Figure 4. Class diagram of the kitchen stand mixer.
Systems 10 00060 g004
Figure 5. Functional surfaces (outlined with blue) and banned areas (marked with red slashes) of the kitchen stand mixer.
Systems 10 00060 g005
Figure 6. Quantified structure of kitchen stand mixer. B = bowl, P = paddle, G = gears, M = motor, FP = food processor, LM = locking mechanism.
Systems 10 00060 g006
Figure 7. Nineteen different designs of kitchen stand mixers with the same quantified structure.
Systems 10 00060 g007
Figure 8. Different 3D model designs of the Kenwood kitchen stand mixer.
Systems 10 00060 g008
Figure 9. House of quality of the kitchen stand mixer.
Systems 10 00060 g009
Figure 10. Overview of structure of configurator.
Systems 10 00060 g010
Figure 11. Scatter plots from the optimization analysis.
Systems 10 00060 g011
Figure 12. Pareto front scatter plots from the optimization analysis.
Systems 10 00060 g012
Figure 13. Rendering of final concepts with indication of values of performance indicators.
Systems 10 00060 g013
Table 1. Resilient modeling of the kitchen stand mixer.
GroupDescriptionFeatures in the ModelNotesLinks
1—RefAll “Reference” entities are first, making them available/visible to all features“Group plane” consisting of planes defining the design spaceNo solids
2—ConstructionConstruction features such as Surfaces or 3D Curves that will be used to define complex solid featuresNo featuresNo solids
3—CoreA “Super Base Feature” that determines the model’s shape, extent, and orientation“Housing group” consisting of sketches, points, and axis defining the housing as well as the plane for the motorMainly sketchesBased on 1–Ref and internal links
4—DetailDetail features complete the shape by only linking to the Core groupRemaining groups (except design groups)Mainly sketchesLinks to 3 and 1, but not internally in group
5—ModifyTilt faces and replicate features then add any “Final Features”No features
6—QuarantineVolatile features that should not be parentsDesign groupsLargest firstLink to 3 and 1
7—PublishFeatures which will be shared in the assemblyAll published features Link to all of the above
Table 2. Overview of problem areas encountered during the process along with the cause and possible solutions proposed by the authors. The colors in the Possible Solution section indicate the assumed maturity of the solution, whereby red is the lowest, yellow is medium, and white is the highest.
Problem AreaProblemCausePossible Solution
ConceptsLow variety in the constrained design spaceTop-down approach where the housing is the core (resilient modeling) and therefore determines the size of the parts inside the productBottom-up approach when structuring the 3D model, where the parts inside the product determines the structure of the housing
The quantified structure stays the same for all conceptsThe quantified structure of the concepts can be varied by changing the coordinates of each part in the 3D model
Scripts were created to ensure a feasible design spaceThis is minimized by doing a bottom-up approach. Furthermore, the CAD software should be able to detect collision between two parts and avoid this in the concepts
Modularization was potentially very cumbersomeFew data regarding the differences between parts in different kitchen stand mixer models were attainableThis issue would most probably not be an issue in a real-world case, where data can be gathered from the business utilizing this process
The search tool in the integration software could not include integer variables in (almost) all the analysis algorithmsCreate/include/access appropriate algorithms for the analysis
Dimensions on hidden parts of the 3D model could not be accessed by the integration softwareMake sure hidden dimensions in CAD software are accessible to integration software
Hiding/unhiding parts of the 3D model was very cumbersome to administer in the integration software Make sure hiding/unhiding parts in the CAD tool is easy to administer in the integration software
The software was chosen before requirements of the software and system were determinedChoose software after requirements are finalized to ensure that the above problems do not occur
Multiple parts are hard to control (even though there are so few). Introducing more parts would therefore be troublesomeScripts had to be manually created for each part to ensure that it would stay within a feasible design space based on dimensions of the different parts, which would be hard to maintainDividing the parts into a hierarchical structure of systems and sub-systems to minimize the number of constraints between parts
Manual interpretation (by the designer) of the (many) parts in terms of, e.g., calculation of cost of each partCreation of tool which can automate processes in terms of determining, e.g., what type of production/material is most appropriate
The model did in some cases create circular references when calculating the performance indicatorThe outcome of some calculations would change the concept (which the calculations were dependent on)Calculate an initial estimate and a later final estimate of the relevant calculations
AnalysisOnly few runs could be performed in the analysis phaseThe integration between the CAD tool and the integration software created an error during large analysis, however, the root of the problem has to be further investigatedThe cause has to be investigated further to propose a solution
It was not easily possible to measure the geometrical structure of the kitchen stand mixer, e.g., the number of holes in the mixer, resulting in limited estimation of, e.g., price and maintenance based on geometryThe CAD tool did not have this sort of built-in measurement toolCreation of an independent analysis tool which can measure this
Interpretation of analysisIt was not clear how much a change in score in a performance indicator would affect the potential customer’s preferenceThis was not investigated due to time constraintsEnsuring a large design space to allow for significantly different designs, where this could be investigated
Few people were interviewed and the sample size varies for each survey/interview guideTime/finance constraintsFurther interviews
Potential customers did not get to experience the product, but merely see itThe concepts were based on 3D models and finalized models/prototypes were not developedUnclear whether this would be necessary to add to the process at this stage of concept development. However, solutions could be introducing augmented reality and pretotyping
User needs vs. performance indicatorsTranslation of user needs into performance indicators does not have a clear methodologyThe use of function modeling was not appropriate for the translation of user needs, which were not related to a function in the product, e.g., maintenance. Different engineering methods were used depending on the specific user needStill unclear
Few user needs were translated into performance indicators, creating a limited overview of the conceptMany of the needs would require extensive knowledge about the system and maybe even simulations of different aspects of the conceptsCollecting needed information and extensive simulation. The value of this compared to the expense is unclear
The translation of many user needs into performance indicators would require a different analysis approach than the Pareto front, since a scatter plot creating an overview for the designer would not be possibleUnclear
MaintenanceThe system was hard to maintain during developmentMany scripts were created to constrain the design space based on specific dimensions. If the dimensions and 3D model change, then this will have to be redoneFewer/no scripts by building the 3D model in a more robust manner (see Concept Problem Area)
Naming of data-objects transferred between files was not always consistent in phrasing. The content of an object might therefore become unknown to a novel user of the system over timeConsistent use of naming
Publisher’s Note: MDPI stays neutral with regard to jurisdictional claims in published maps and institutional affiliations.