Article

Identification of the Dof Gene Family in Quinoa and Its Potential Role in Regulating Flavonoid Synthesis Under Different Stress Conditions

1
Interdisciplinary Eye Research Institute (EYE-X Institute), Bengbu Medical University, Bengbu 233030, China
2
Anhui Provincial Key Laboratory of Tumor Evolution and Intelligent Diagnosis and Treatment, School of Life Sciences, Bengbu Medical University, Bengbu 233030, China
3
Key Laboratory of Saline-Alkali Vegetation Ecology Restoration, Ministry of Education, School of Life Sciences, Northeast Forestry University, Harbin 150040, China
*
Author to whom correspondence should be addressed.
These authors contributed equally to this work.
Biology 2025, 14(4), 446; https://doi.org/10.3390/biology14040446
Submission received: 16 February 2025 / Revised: 17 April 2025 / Accepted: 18 April 2025 / Published: 20 April 2025

Simple Summary

This study examines the Dof gene family in quinoa, focusing on its role in flavonoid synthesis under different light conditions. A total of 36 CqDof genes were identified and divided into 10 subfamilies. These genes encode basic, hydrophilic, unstable nuclear proteins and are distributed across 15 chromosomes, with segmental duplication driving their expansion. Their promoters contain elements related to light responsiveness. Red and blue light significantly influences the expression of CqDofs and flavonoid accumulation, with 5 CqDofs showing a strong response and correlation with flavonoid levels. RT-PCR analysis also shows that CqDof expression is upregulated under drought, salt, and saline-alkali stress, except for CqDof21. These findings lay the groundwork for future research on the regulatory mechanisms of CqDofs in flavonoid biosynthesis under varying light qualities and their functions under abiotic stress.

Abstract

Quinoa (Chenopodium quinoa Willd.), often referred to as the “golden grain”, is a highly nutritious crop that has garnered significant global attention due to its exceptional nutritional profile and health benefits. Flavonoids present in quinoa have been shown to possess antioxidant, anti-inflammatory, antiviral, anticancer, and antidepressant properties. The DNA binding with one finger (Dof) transcription factor is crucial for regulating growth, development, and stress responses. However, the identification of the Dof family using the latest quinoa genomic data and its function in abiotic stress response have not been fully elucidated. Here, 36 CqDof genes were identified from the quinoa genome and classified into ten subfamilies through phylogenetic analysis. Physicochemical property analysis predicted that CqDofs predominantly encode basic, hydrophilic, and unstable nuclear proteins. CqDofs were distributed across 15 chromosomes, with segmental duplication being the primary driver of their expansion. Subsequently, basic information on CqDofs was systematically analyzed, including conserved motifs, gene structure, cis-acting elements, and expression patterns. Notably, the promoter regions of all CqDof genes were enriched with cis-acting elements related to light responsiveness. Further analysis revealed that red and blue light significantly affected CqDof expression and flavonoid accumulation (epigallocatechin, rutin, naringenin, morin, pinocembrin, quercetin-7-O-rutinoside, quercetin-3-O-glucoside, and naringenin), in which 5 CqDofs exhibited a pronounced response to both light conditions and showed a significant correlation with flavonoid levels. Finally, RT-PCR analysis indicated that the expression levels of CqDofs (except CqDof21) were significantly upregulated under drought, salt, and saline-alkali stresses. These findings lay the groundwork for future studies on how CqDofs regulate flavonoid biosynthesis under different light qualities and function in abiotic stress.

1. Introduction

The dicotyledonous plant quinoa (Chenopodium quinoa Willd.), a member of the Amaranthaceae family, has been cultivated for nearly 7000 years [1]. Quinoa is known for its high nutritional value, including a wide range of proteins, amino acids, vitamins, minerals, unsaturated fatty acids, and dietary fiber [2]. Remarkably, quinoa seeds provide all essential amino acids required for human nutrition [3]. Furthermore, quinoa contains bioactive substances such as flavonoids, phenolic acids, and terpenoids, which possess antioxidant, anti-inflammatory, antimicrobial, and anti-hypertensive properties, contributing to the prevention and treatment of cancer, heart disease, obesity, and neurodegenerative illnesses [4]. These attributes have led to a significant increase in quinoa production and consumption in recent years.
Plants are subjected to a variety of abiotic and biotic stresses during growth and development, including light, temperature, salinity, and heat [5]. Therefore, plants have evolved diverse adaptive strategies and signaling mechanisms to deal with these stresses. Transcription factors (TFs), including members of the NAC, MYB, bHLH, AP2/ERF, and Dof families, play crucial roles in regulating plant stress responses and enhancing plant resilience in these stressful environments [6]. Quinoa is a uniquely stress-tolerant crop and one of the most significant food crops globally, but these stresses also limit yield and quality [7]. Given its importance, quinoa has been extensively studied for stress tolerance, particularly to heat, drought, and cold. For example, CqERF24 enhanced drought tolerance by increasing antioxidant enzyme activities and activating stress-responsive genes [8], while CqZF-HD14 did so by interacting with CqHIPP34 and CqNAC79 [9]. Furthermore, heat stress changed fatty acid and mineral nutrient concentrations in quinoa seeds [10], and heat stress factors (HSFs) such as CqHsfs10 and CqHsfs4 are critical in quinoa thermotolerance [11]. As a facultative halophyte, quinoa exhibits remarkable salt tolerance, with some varieties enduring up to 400 mM NaCl [12]. However, salt stress can disrupt metabolism and inhibit growth. Light significantly impacts plant growth, development, and secondary metabolite biosynthesis, including flavonoids, which are renowned for their antioxidant properties and health benefits [13]. It should be highlighted that light quality is species-specific in regulating the accumulation of flavonoids. For instance, Camellia sinensis could accumulate higher levels of flavonoids when exposed to blue light [14], while red light significantly promoted flavonoid levels in Scrophularia kakudensis [15]. In quinoa, UV-B irradiation influences physiological responses and flavonoid accumulation, with studies showing a reduced total flavonoid content but an increased antioxidant capacity under UV-B treatment [16]. Additionally, UV-B intensity and duration affect chlorophyll and carotenoid levels in quinoa [17]. Overall, research on quinoa has concentrated on the impact of UV-B treatment, but the influence of monochromatic light, specifically blue and red light, on the synthesis of important flavonoids in quinoa remains largely unexplored.
The Dof (DNA binding with one finger) transcription factor, a member of the zinc finger superfamily, typically consists of 200–400 amino acids and features a C2–C2 type single zinc finger domain with 50–52 conserved residues, including one Zn2+ and four conserved Cys residues [18]. Furthermore, Dof TFs bind specifically to DNA sequences containing a 5′-AAAG-3′ core in target gene promoters [19]. Currently, numerous Dof TF members have been identified in various plants, including Oryza sativa, Gossypium hirsutum, Medicago polymorpha, Arabidopsis thaliana, and Brassica napus, with counts of 30, 51, 36, 36, and 117 Dof members, respectively [6]. Recent studies highlight the significance of Dof TFs in plant growth, development, stress responses, and secondary metabolite biosynthesis. For example, COG1 promotes photosynthesis and starch accumulation, affecting plant biomass [20]. Additionally, VDOF1 and VDOF2 can be involved in the regulation of vascular cell differentiation and lignin biosynthesis in Arabidopsis [21]. Overexpression of GhDof1.7 significantly increased salt tolerance in Arabidopsis, while silencing this gene reduced salt tolerance in cotton [22].
The quinoa genome was successfully assembled in 2017, laying the groundwork for comprehending its unique nutritional properties, stress tolerance mechanisms, and molecular breeding [23]. Subsequently, Rey et al. performed a chromosome-scale assembly of the Chilean accession PI 614886 (QQ74) using in vitro and in vivo Hi-C data [24]. Although recent quinoa genome data have provided abundant information, the function of Dof genes in quinoa’s response to abiotic stresses remains to be fully explored. Therefore, this study identified Dof family members in quinoa and analyzed their protein physicochemical properties, chromosomal locations, motif composition, gene structures, conserved domains, and cis-acting elements. Additionally, we investigated flavonoid content changes under red and blue light and correlated these with CqDof expression. Finally, five CqDof genes responsive to both red and blue light were selected and examined for their expression patterns under abiotic stress. These findings lay the groundwork for future investigations into their molecular response mechanisms under different light treatments and abiotic stresses and provide candidate genes for breeding strong stress-resistant quinoa in the future.

2. Materials and Methods

2.1. Plant Material and Abiotic Stress Treatments

The Jiaqi 3 quinoa variety (seed color: white; primary origin: Bolivia; ecotype: Altipolano) was obtained from Jiaqi Agricultural Technology Co., Ltd. (Taiyuan, China); it was used in our previous study and has a certain tolerance to saline-alkali stress [25]. Quinoa seeds were cultivated in a greenhouse at 25 °C under long-day conditions (16 h light/8 h dark, cool white fluorescent light) with a commercial substrate (Pindstrup Mosebrug A/S, Ryomgaard, Denmark). After 20 days of growth, quinoa seedlings were subjected to different abiotic treatments. Specifically, the seedlings were treated with salt (200 mM NaCl) [26], drought (30% PEG6000) [27], saline-alkali stress (100 mM Na2CO3:NaHCO3 = 1:9, molar ratio) [25], and monochromatic spectral light-emitting diodes (LEDs) emitting the following wavelengths: blue light (470 nm, 50 ± 5 μmol⋅m−2⋅s−1) and red light (670 nm, 50 ± 5 μmol⋅m−2⋅s−1) [28]. Quinoa seedling leaves were collected after 48 h of abiotic stress, while samples from the light treatment were harvested after 7 days. Thirty quinoa seedlings were collected from each treatment, randomly divided into 3 groups, and the leaves were immediately frozen in liquid nitrogen and stored at −80 °C for later analysis.

2.2. Identification and Basic Information Analysis of CqDofs

The genome sequences of quinoa, A. thaliana, and O. sativa were obtained from the NCBI database (https://www.ncbi.nlm.nih.gov, accessed on 15 September 2024). The A. thaliana Dof protein (AtDof) sequences were downloaded from the TAIR database (https://www.arabidopsis.org/, accessed on 16 September 2024). Additionally, the Dof domain was obtained from the Pfam database (http://pfam.xfam.org/family/PF02701, accessed on 16 September 2024). All Dof protein sequences from Arabidopsis were utilized as the query for BLASTp (E-value ≤ 1 × 10⁻⁵) to identify potential Dof family members in quinoa. The Pfam database (PF02701) was used to further screen the conserved domains of the candidate genes, and after removing incomplete domains and redundant sequences, the CqDof members were obtained. The fundamental features of CqDofs, including amino acid length, molecular weight (MW), theoretical isoelectric point (PI), instability index, grand average hydropathicity (GRAVY), and aliphatic index, were analyzed using online program ExPASy (https://www.expasy.org/, accessed on 20 September 2024). Subcellular localization prediction analysis of CqDofs was conducted using WoLF PSORT web tool (https://wolfpsort.hgc.jp/, accessed on 20 September 2024).

2.3. Multiple Sequence Alignment, Phylogenetic Relationship, and Conserved Domain Analysis of CqDofs

The CqDof and AtDof protein sequences were first aligned using ClustalW with default parameters. Subsequently, a phylogenetic analysis was performed using the neighbor-joining (NJ) method in MEGA11.0 software with 1000 bootstrap replicates, while adhering to the default settings for other parameters [6]. Ultimately, the evolutionary tree was visualized with the iTOL web tool (https://itol.embl.de/, accessed on 28 September 2024) for better visualization. The CqDof protein sequences were submitted to the NCBI-CDD database for structural domain analysis, and the results were visualized using TBtools (Version V2.154).

2.4. Chromosomal Localization, Gene Duplication Events, and Collinearity Analysis of CqDofs

According to the GFF annotation file of the quinoa genome [24], the number, length, starting and ending positions of chromosomes in quinoa were obtained, and the locations of CqDofs on chromosomes were visualized using TBtools software (Version V2.154). Duplication events of CqDofs and synteny to different species (Arabidopsis thaliana, Oryza sativa) were analyzed using MCScanX and plotted using TBtools software with default parameters [6].

2.5. Gene Structure, cis-Acting Element, and Gene Expression Analysis of CqDofs

The TBtools software visualized the number and location of the untranslated region (UTR) and coding sequence (CDS) in CqDofs based on the quinoa genome structure annotation information. The conserved motifs of CqDof proteins were analyzed using MEME (https://meme-suite.org/meme/tools/meme, accessed on 18 October 2024), with the motif parameter set to 15. The 2000 bp upstream sequences located immediately before the initiation codon of CqDofs were extracted. PlantCare (http://www.plantcare.co.uk/, accessed on 22 October 2024) was then employed to analyze and predict the cis-acting elements within this sequence. Furthermore, RNA-seq data from various tissues and organs (root, stem, leaf, flower, and fruit, accession numbers: PRJNA658178 and PRJNA578698) of quinoa, as well as data from salt stress of quinoa seedlings (accession numbers: PRJNA636120) were downloaded from NCBI. The fragments per kilobase of exon model per million mapped fragments (FPKM) values for each RNA-seq dataset were extracted, and the data of CqDofs were normalized using the log2 FPKM approach. All results were visualized using TBtools software with the default program.

2.6. RT-PCR Analysis of CqDofs Under Abiotic Stress

Total RNA and cDNA from each sample were extracted and reverse-transcribed using an RNA Extraction Kit (Tiangen Biotech, Beijing, China) and a SuperScript III reverse transcription kit (Tiangen Biotech, Beijing, China), respectively, following the manufacturer’s instructions. RT-PCR assays were performed on a Rotor-Gene Q system (Qiagen, Hilden, Germany) with a program that was consistent with that previously described [28]. Primer Premier 6.0 software was used to design RT-PCR primers, with UBQ9 (AUR62020068) as an internal control [29]. All RT-PCR primers are listed in Table S1. The RT-PCR contained three biological replicates, and the relative expression level of the target genes was determined using the 2−ΔΔCT method.

2.7. Sample Preparation and LC–MS Analysis

The light-treated quinoa leaves were freeze-dried for 24 h, followed by being completely ground with liquid nitrogen. Subsequently, 100 mg of the powder were weighed and added to 1.0 mL of a 70% aqueous methanol solution. This mixture was stored at 4 °C overnight and centrifuged at 13,800× g for 10 min. Ultimately, the supernatant was finally filtered through a 0.22 µm micropore filter. In this study, an Agilent G6400 triple quadrupole mass spectrometer coupled with an Agilent 1290II UPLC (Agilent Technologies, Santa Clara, CA, USA) system was employed for multiple reaction monitoring (MRM). The operating parameters and gradient program were consistent with those established in our previous study [30]. The specific conditions were as follows: column temperature: 35 °C; column: C18 (1.8 µm, 100 mm × 2.1 mm); mobile phase: elution A (aqueous solution of 0.5% acetic acid and 5 mM ammonium acetate), elution B (100% acetonitrile); sample injection volume: 3 μL; flow rate: 0.3 mL/min. The relative content of each metabolite in the samples was expressed as the chromatographic peak area.

2.8. Statistical Analysis

The protein–protein interaction network for CqDofs was predicted based on the STRING website (https://cn.string-db.org/, accessed on 12 November 2024), which contains known and predicted protein–protein interactions. All experiments were performed with 3 biological replicates, and TBtools Prism 8 software was used to draw graphs. The significance of the difference between each treatment group compared to the control was determined using one-way ANOVA in SPSS 26.0 (IBM Corp., Armonk, NY, USA); data were expressed as the means ± SD, and asterisks indicate significant differences between the treatments and the control: * p ≤ 0.05, ** p ≤ 0.01, *** p ≤ 0.001.

3. Results

3.1. Identification, Physicochemical Properties, and Chromosomal Locations Analysis of CqDof Genes in Quinoa

A total of 36 CqDof genes were identified after removing duplicated sequences and incomplete structural domains and named CqDof1CqDof36 according to their gene ID (Table 1). The physicochemical properties of CqDofs revealed that the amino acid sequence lengths ranged from 110 (CqDof29) to 558 (CqDof5), and the molecular weight (MW) varied from 12.22 kDa (CqDof29) to 59.1 kDa (CqDof5), exhibiting a considerable degree of variability. The theoretical isoelectric point (PI) value of the CqDofs ranged from 4.52 (CqDof14) to 11.46 (CqDof16); CqDof8, CqDof12, CqDof13, CqDof14, CqDof15, CqDof18, CqDof22, CqDof26, CqDof30, CqDof31, and CqDof35 were classified as acidic proteins due to their isoelectric point value being less than 7, while the others were basic proteins. The instability index of CqDofs ranged from 32.55 (CqDof20) to 85.15 (CqDof16), and all proteins were unstable except for CqDof20. Furthermore, the grand average hydropathicity (GRAVY) value for all CqDof proteins was negative, indicating they were hydrophilic, and subcellular localization prediction showed that all CqDof proteins were nuclear-localized.
The chromosomal locations of the 36 CqDofs were determined based on the quinoa genome annotation file. The results showed that 36 CqDof genes were unevenly distributed on 15 chromosomes, but no CqDofs were present on Cq3A, Cq3B, and Cq7B (Figure 1). The CqDofs were predominantly distributed at both ends of the chromosome, with a sparser presence in the middle regions. The highest numbers of genes (four) were distributed on Cq5A, Cq6A, and Cq8B, followed by three genes on Cq5B, Cq2B, Cq9B, Cq6B, and Cq8A and one gene on Cq1B, Cq4A, Cq7A, Cq2A, and Cq4B. In addition, some genes were physically adjacent to each other, such as CqDof16, CqDof17, and CqDof19 (Figure 1), suggesting they may have similar functions.

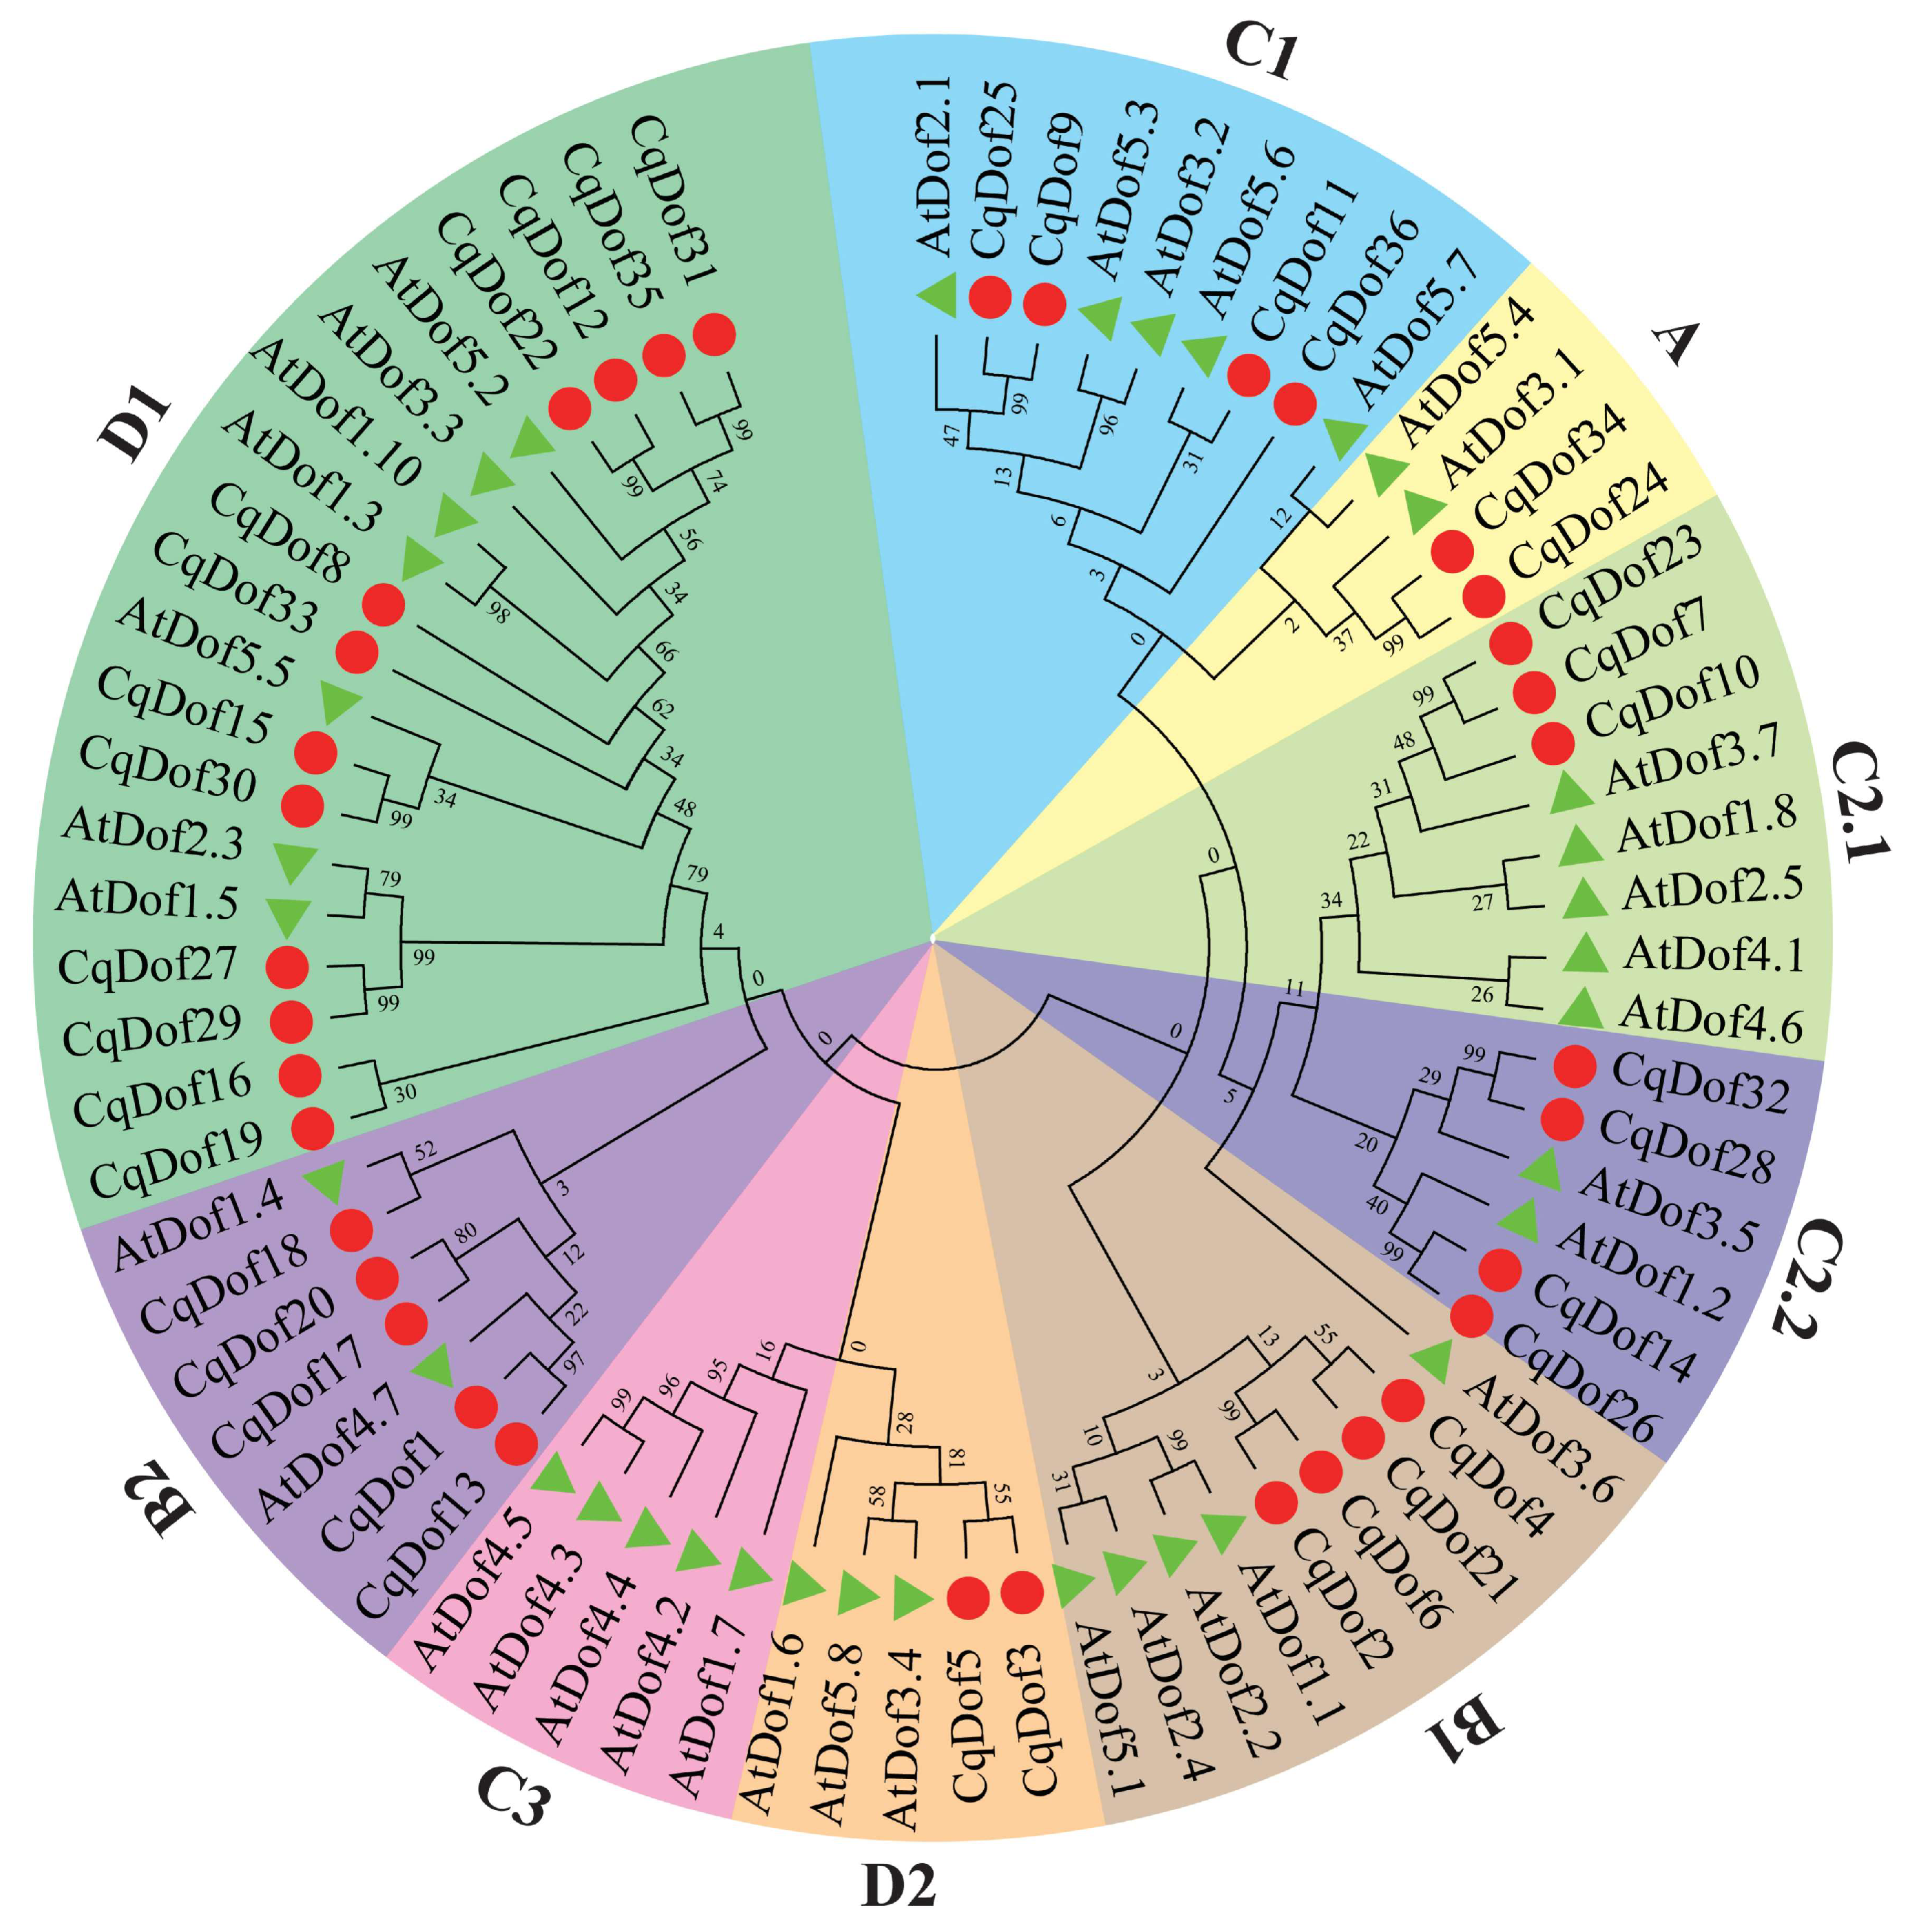
3.2. Phylogenetic Relationship and Classification of CqDof Genes in Quinoa

To elucidate the evolutionary relationship among CqDofs in quinoa, an NJ phylogenetic tree was constructed using the complete amino acid sequences of CqDofs and AtDofs using MEGA software (Figure 2). The results revealed that CqDof proteins were categorized into 9 subgroups (A, B1, B2, C1, C2.1, C2.2, C3, D1, D2), and the distribution of individuals within each subgroup varied greatly. The subgroup D1 contained the highest number of CqDof proteins (12 members), followed by B2 (5 members), B1, C1, and C2.2 (4 members), C2.2 (3 members), and A and D2 (2 members). Significantly, no CqDof proteins from the C3 subfamily were found to co-occur with AtDof proteins on the same branch, indicating that some CqDof genes have undergone genetic evolutionary changes and may be lost in quinoa. Furthermore, some gene pairs, including CqDof18 with AtDof1.4, CqDof11 with AtDof5.6, were directly homologous between A. thaliana and quinoa, suggesting potential similarities in their evolutionary patterns and gene functions.

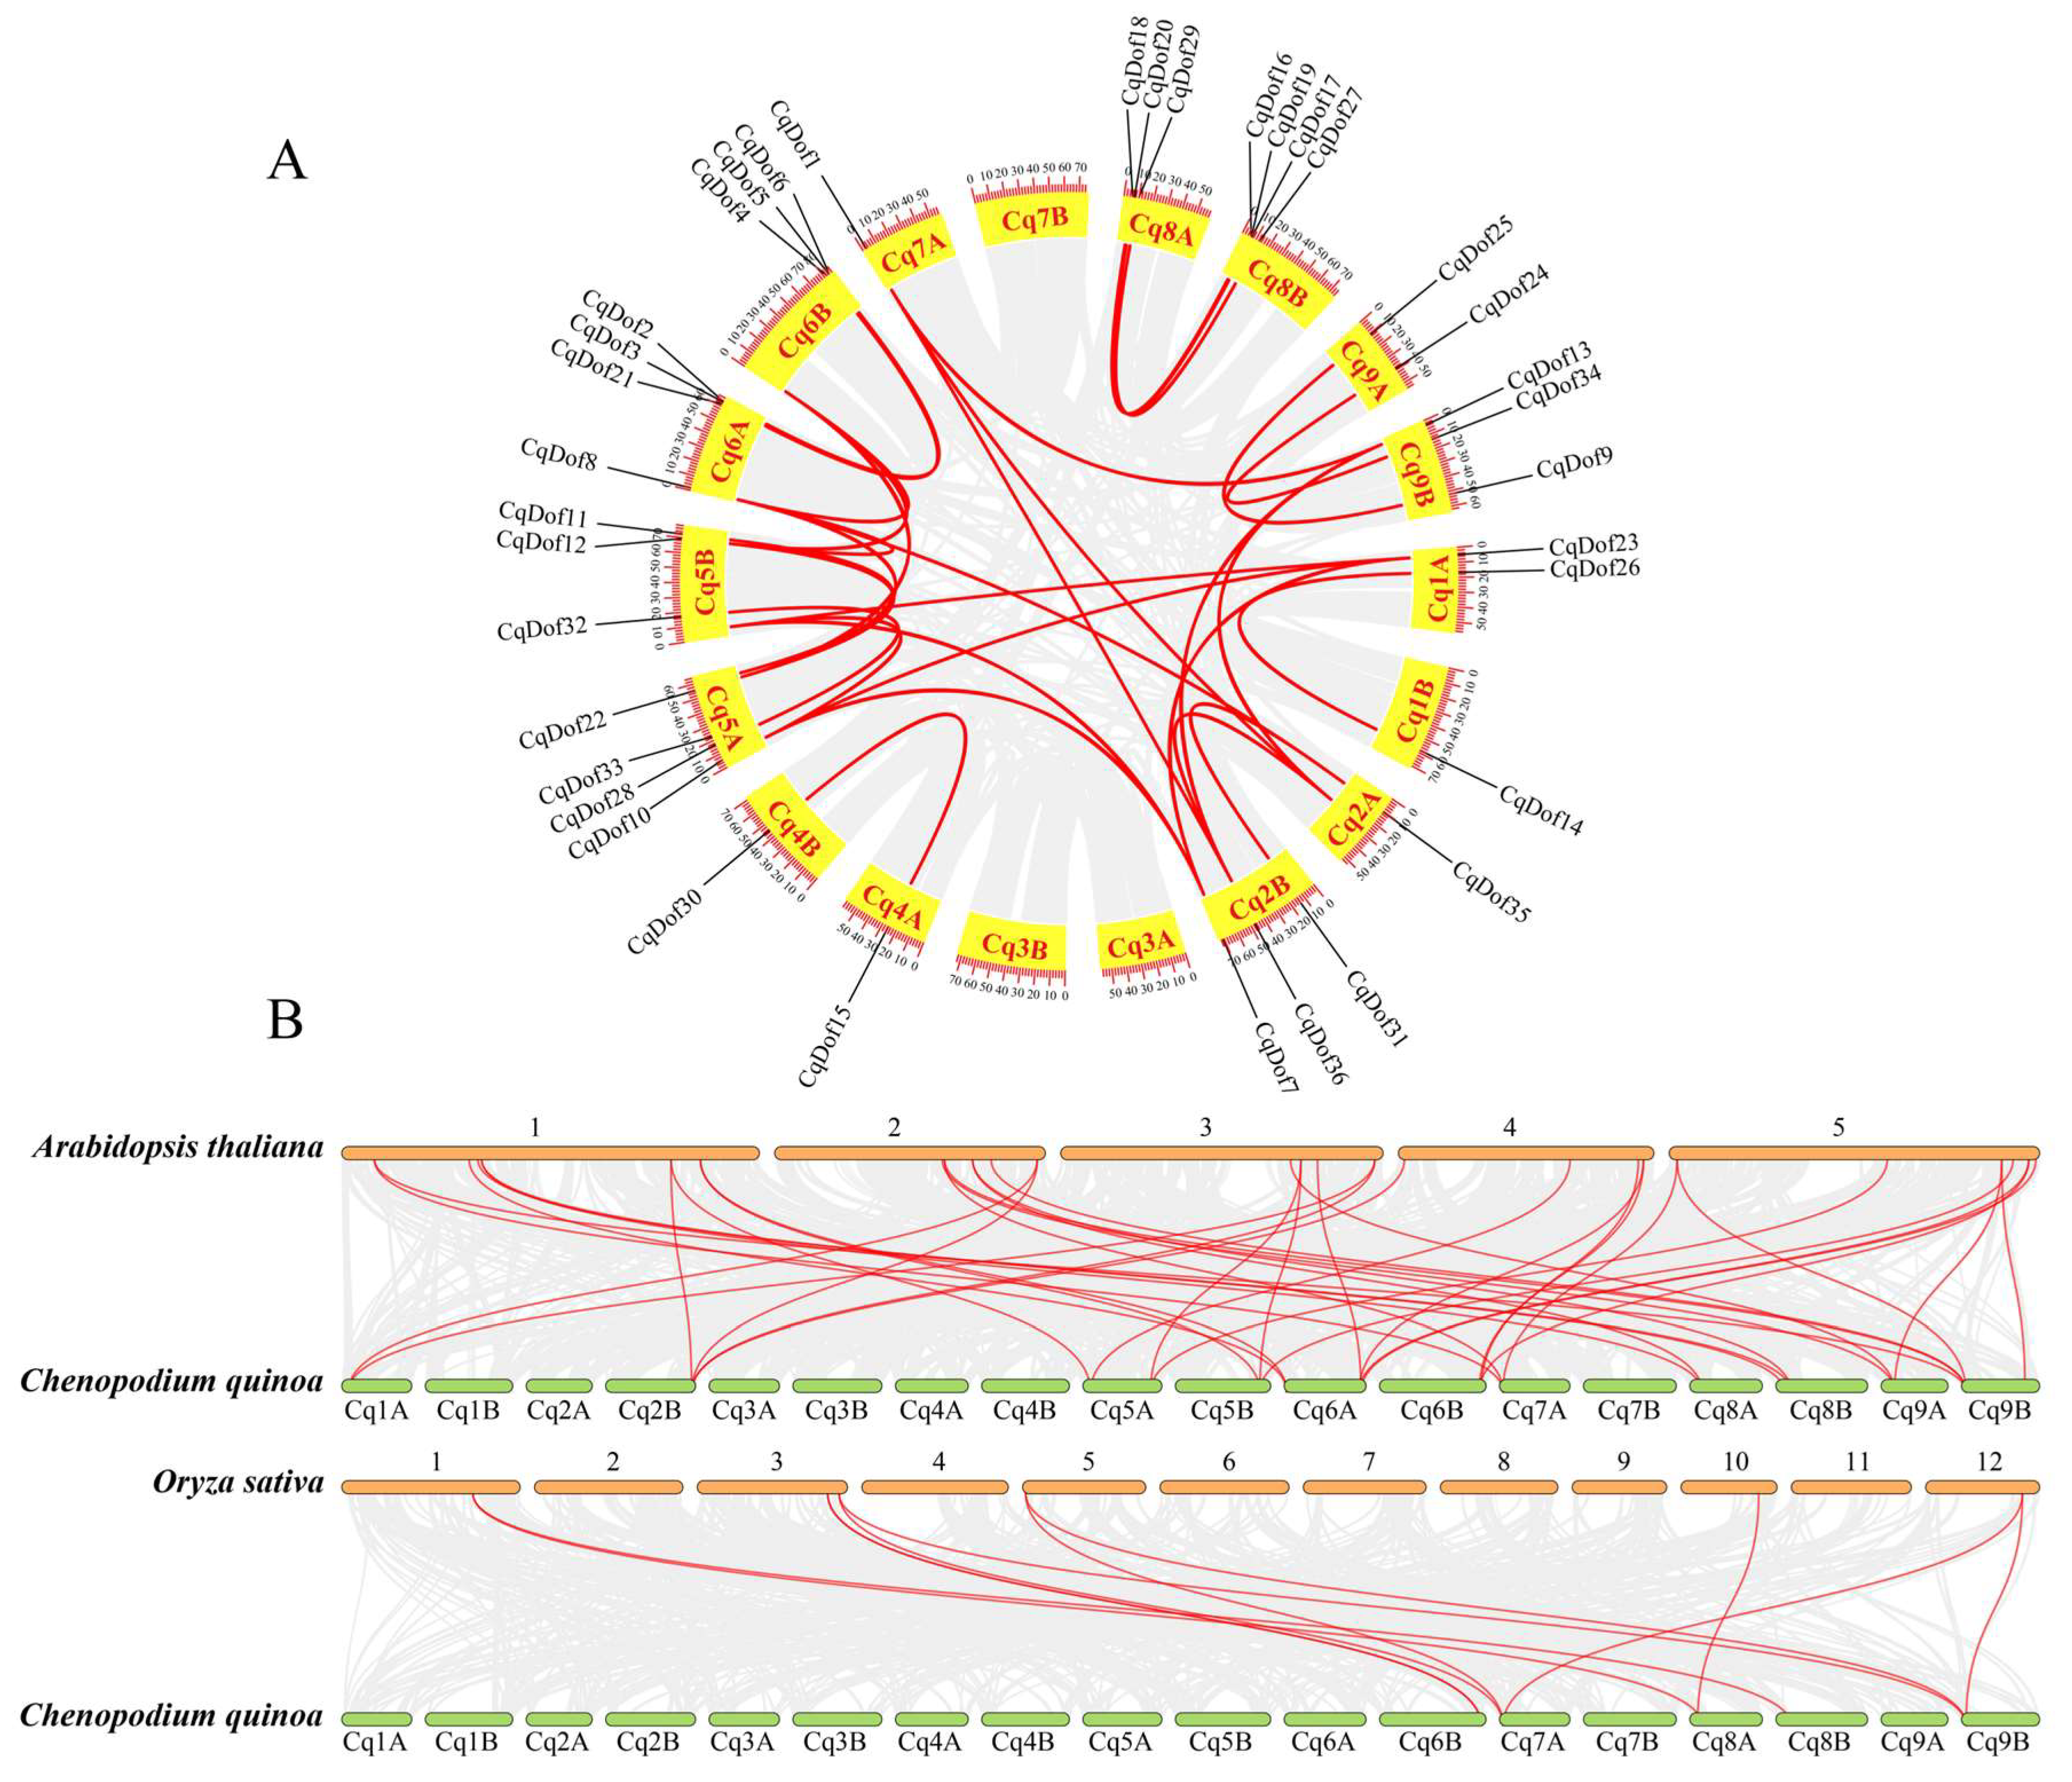
3.3. Gene Duplication and Syntenic Analysis of CqDof Genes in Quinoa

Gene duplication has an important role in the evolution of a gene family and the exploration of gene function. Therefore, this research analyzed the tandem and fragment duplication events to explore the evolutionary relationship among 36 CqDof genes. The results showed that 25 pairs of segmental gene replication were detected, with no tandem duplication events observed among the CqDof genes, suggesting that segmental duplication might be a major driving force in the evolution of the CsDof gene family (Figure 3A). In addition, the evolutionary trend and genetic relationship of the Dof family in quinoa, A. thaliana, and O. sativa were also analyzed, and it was found that quinoa had a strong synteny relationship with A. thaliana and a simpler synteny relationship with rice (Figure 3B). Among them, chromosome Cq6B exhibited the highest number of homologous gene pairs with A. thaliana, while chromosomes Cq7A and Cq9B had the most homologous gene pairs with O. sativa. Collectively, these findings provide foundational insights into the evolution and origin of species.

3.4. Gene Structure, Conserved Domain, and Motif Analysis of the CqDof Genes

Consistent with expectations, the Batch CD-Search analysis revealed that all 36 CqDof proteins possess a highly conserved Dof domain (Figure 4A), confirming the reliability of the gene identification outcomes. In this study, we utilized MEME to identify 15 conserved motifs within the CqDof proteins, and each CqDof contained 1–10 conserved motifs, with CqDof12 and CqDof22 exhibiting the highest number of motifs. Furthermore, the majority of CqDofs contained both motif 1 and motif 2, and the CqDof genes located on the same phylogenetic branch exhibited similar motif compositions, highlighting the structural homology among the CqDof proteins (Figure 4B).
Similarly, we mapped the distribution of CDS, UTR, and introns of CqDof genes to enhance the understanding of their structural features. The CqDof genes exhibited a variable intron count, with CqDof5 featuring the longest intron. Notably, CqDof29, CqDof30, CqDof24, CqDof34, CqDof9, CqDof25, CqDof26, CqDof14, and CqDof19 lacked introns and UTRs, consisting exclusively of exons. The CqDof genes belonging to the same subfamily exhibited comparable exon and intron counts. For instance, CqDof7 and CqDof23 each contain four exons and three introns (Figure 4C), indicating that members of the same subfamily are highly conserved in gene structure, providing a foundation for future functional studies of this gene family.

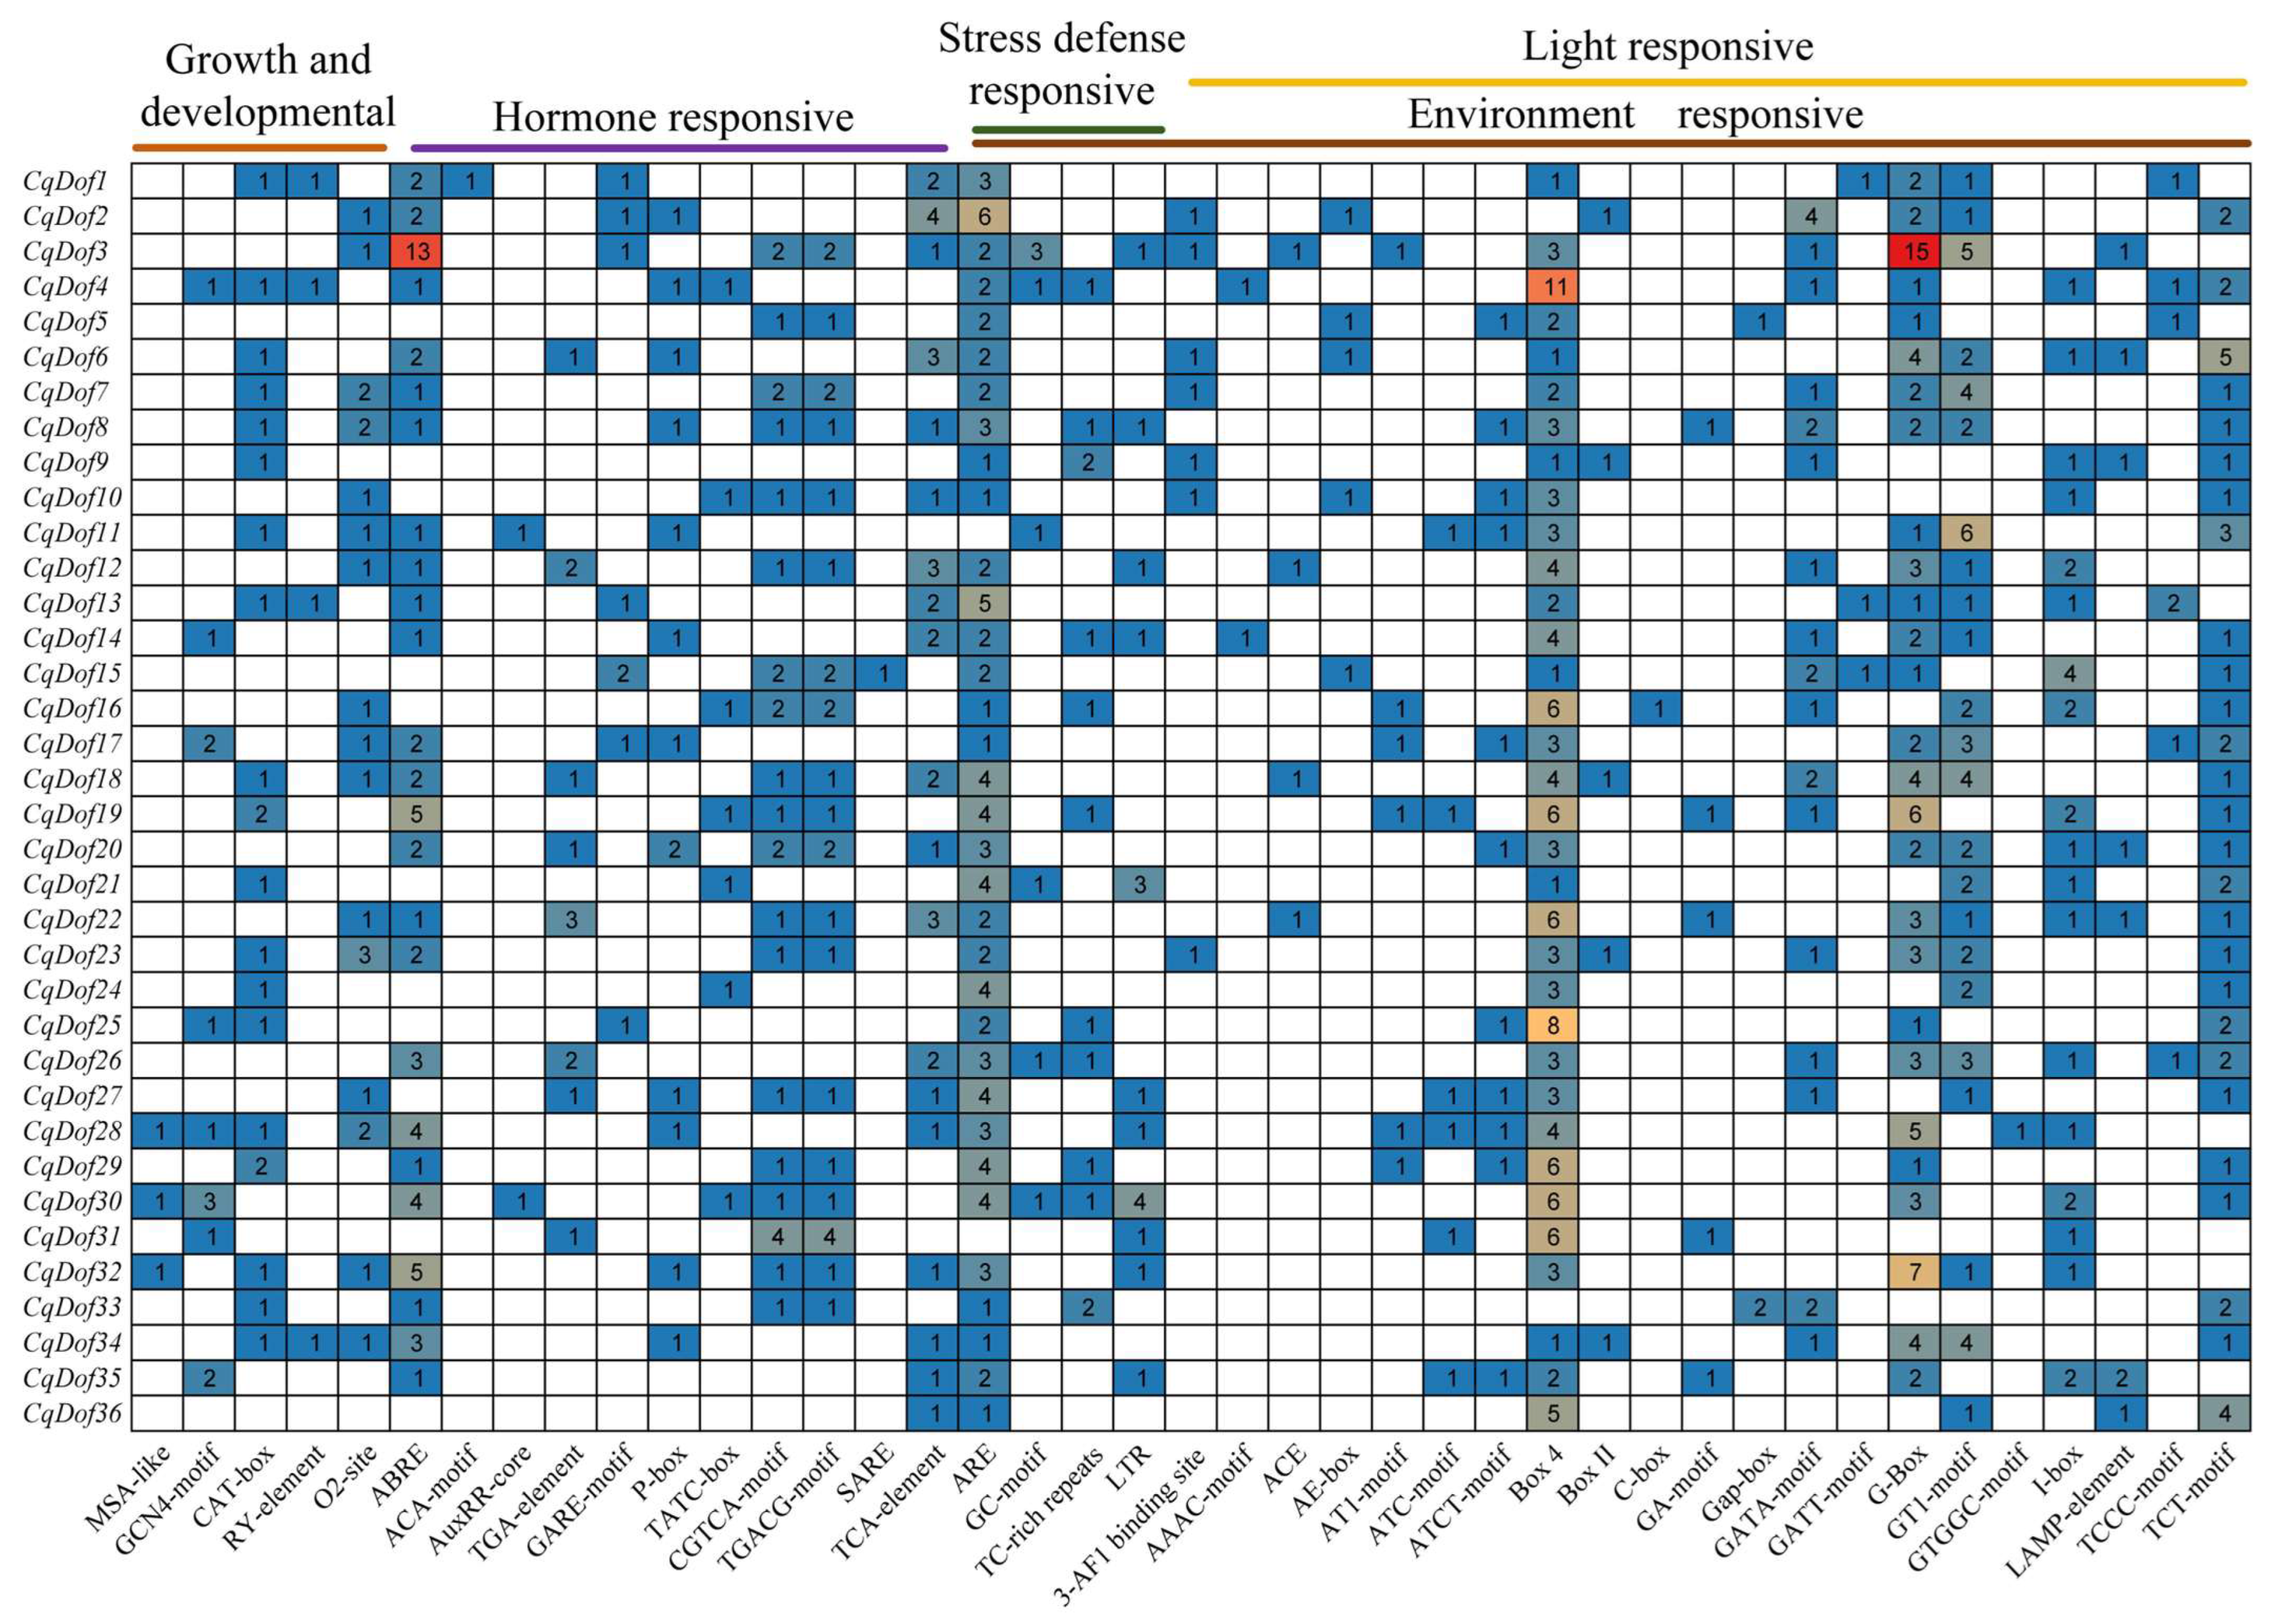
3.5. Promoter cis-Acting Element Analysis of the CqDof Genes

Transcription factors interact with cis-acting elements in promoter regions to initiate gene transcription, potentially modulating the expression of specific genes. To further understand the potential regulatory mechanisms of CqDofs in response to abiotic stress, hormone treatment, and plant growth and development, we analyzed the specific cis-elements of CqDofs. The results showed that CqDof gene cis-acting elements can be primarily categorized into three types: plant growth and developmental, hormone-responsive, and environmentally responsive (Figure 5). The plant growth and developmental types included cell cycle regulation, circadian control, endosperm expression, meristem expression, seed-specific regulation, and the Box and O2-site elements were most distributed in the CqDof genes. The hormone-responsive types included elements involved in salicylic acid, methyl jasmonate (MeJA), gibberellin, auxin, and abscisic acid. Among these, the ABRE element was most abundant in CqDof gene promoters. The environmentally responsive types included elements associated with light responsiveness, stress defense responsiveness, low-temperature responsiveness, and anaerobic induction responsiveness, with the Box 4 element being the most abundant, followed by the G-Box and TCT-motif. In addition, a total of 804 cis-acting elements were identified in CqDofs, including 61 growth and developmental elements, 193 hormone-responsive elements, and 550 environmentally responsive elements (Figure 5). Notably, all CqDof gene promoter regions contained light-responsive elements, and these were the most numerous elements of the environmentally responsive type, suggesting that the CqDof genes likely play a role in regulating plant growth, metabolism, hormone signaling, or other physiological processes by participating in the plant response to light signals.

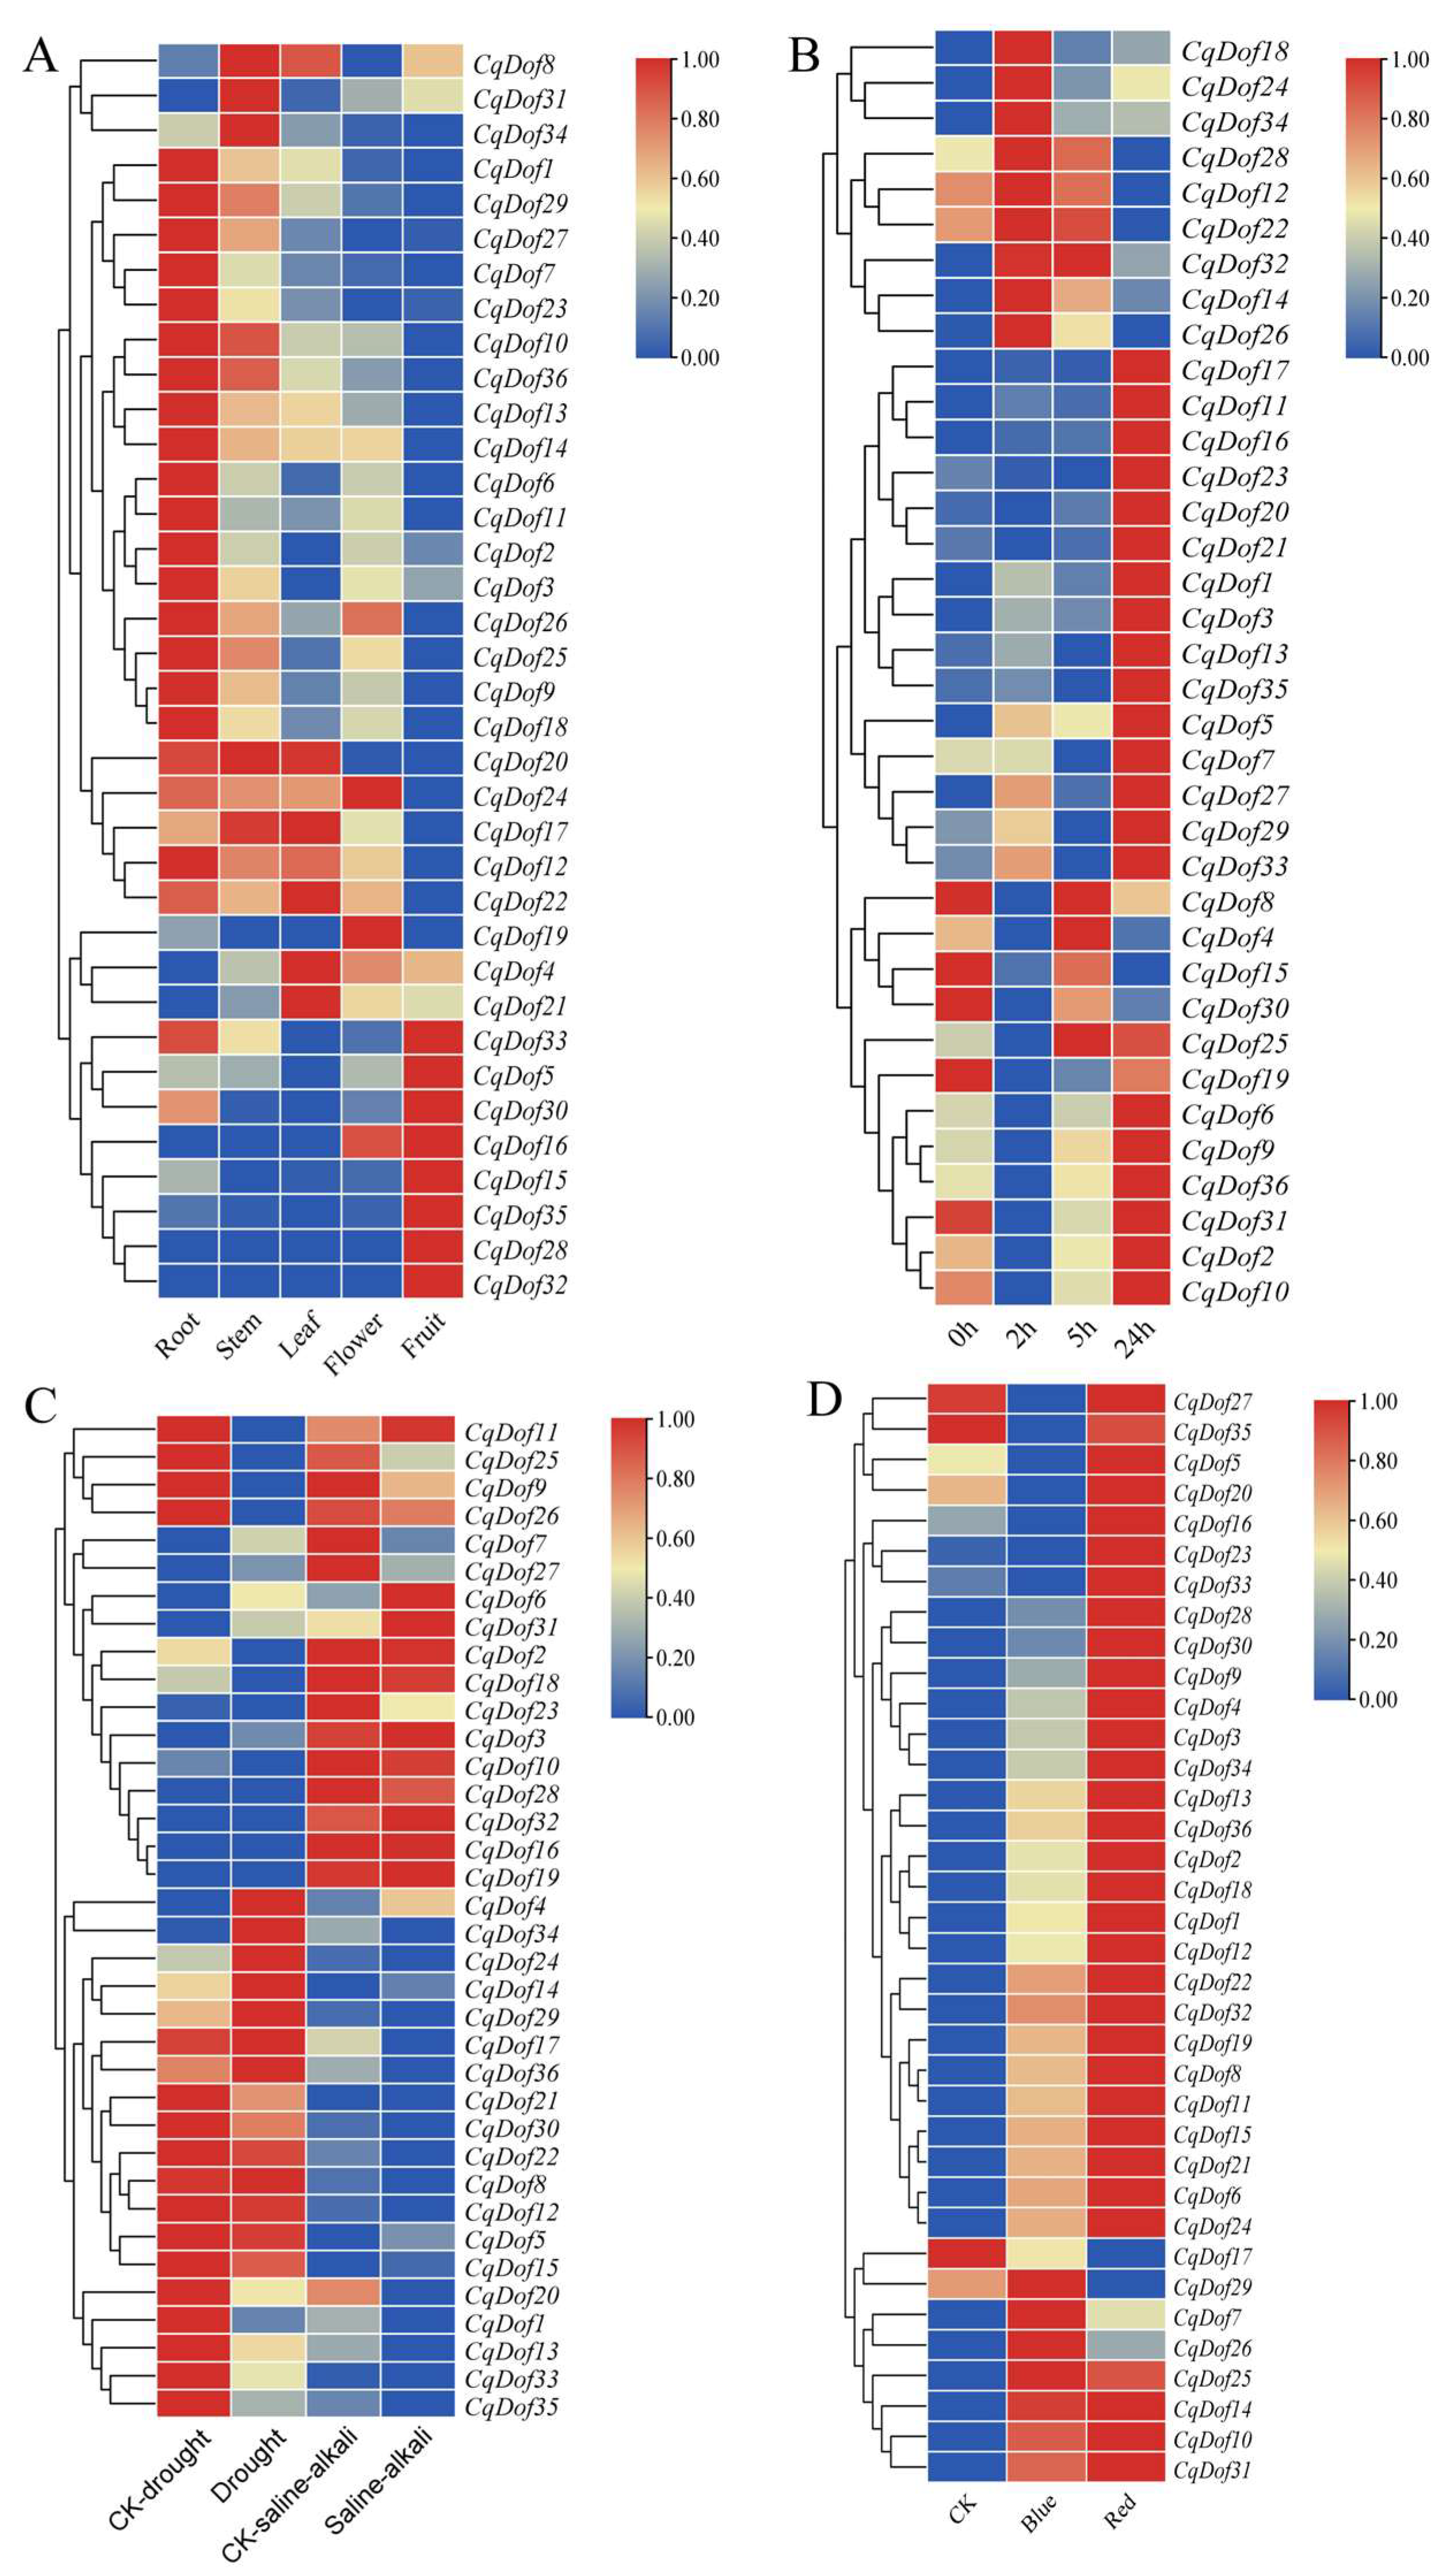
3.6. Expression Pattern of the CqDof Genes in Various Tissues Under Abiotic Stresses

To assess the expression pattern of CqDofs in different tissues of quinoa, we constructed expression profiles for 36 CqDofs in roots, stems, leaves, flowers, and fruits using RNA-seq data (FPKM values converted to log2FC). The results revealed tissue-specific expression profiles for CqDofs, with the majority of CqDofs showing high expression in roots (Figure 6A). Conversely, CqDof16, CqDof28, and CqDof32 were not expressed in roots, stems, or leaves, indicating their potential lack of involvement in quinoa’s growth and development. In addition, CqDof12, CqDo17, CqDo22, CqDo24, and CqDof34 exhibited high expression in stems and leaves, while CqDof28, CqDo35, CqDo5, CqDo15, CqDo32, CqDof30, and CqDof33 were markedly expressed in fruits, with low CqDof expression observed in flowers (Figure 6A).
The expression profiles of CqDofs under several abiotic stresses and different light treatments were also examined in this study. The findings indicated a dynamic expression pattern of CqDofs during salt stress, with most genes, including CqDof17, CqDof11, CqDof16, and CqDof23, being upregulated in response (Figure 6B). Some CqDof genes also responded to drought stress, with CqDof11, CqDof25, CqDof9, CqDof26, CqDof20, CqDof1, CqDof13, CqDof33, and CqDof35 were downregulated, while CqDof4, CqDof34, CqDof24, CqDof14, and CqDof29 were upregulated (Figure 6C). Saline-alkali stress resulted in an increased expression of CqDof6, CqDof31, and CqDof11 and a decreased expression of CqDof25, CqDof9, CqDof7, CqDof27, and CqDof23 (Figure 6C). Given that all CqDof genes contain light-responsive elements, this implies that these genes may play a significant regulatory role in light response. Consequently, this study conducted an RNA-Seq analysis on quinoa samples treated with red and blue light. The results revealed that the majority of genes exhibited an enhanced expression under both blue and red light, with a more pronounced increase observed following red light treatment (Figure 6D). Notably, some genes, such as CqDof6, CqDof7, and CqDof20, were responsive to these treatments, suggesting a potential role for them in adapting to salt, drought, saline-alkali stress, and light treatment.

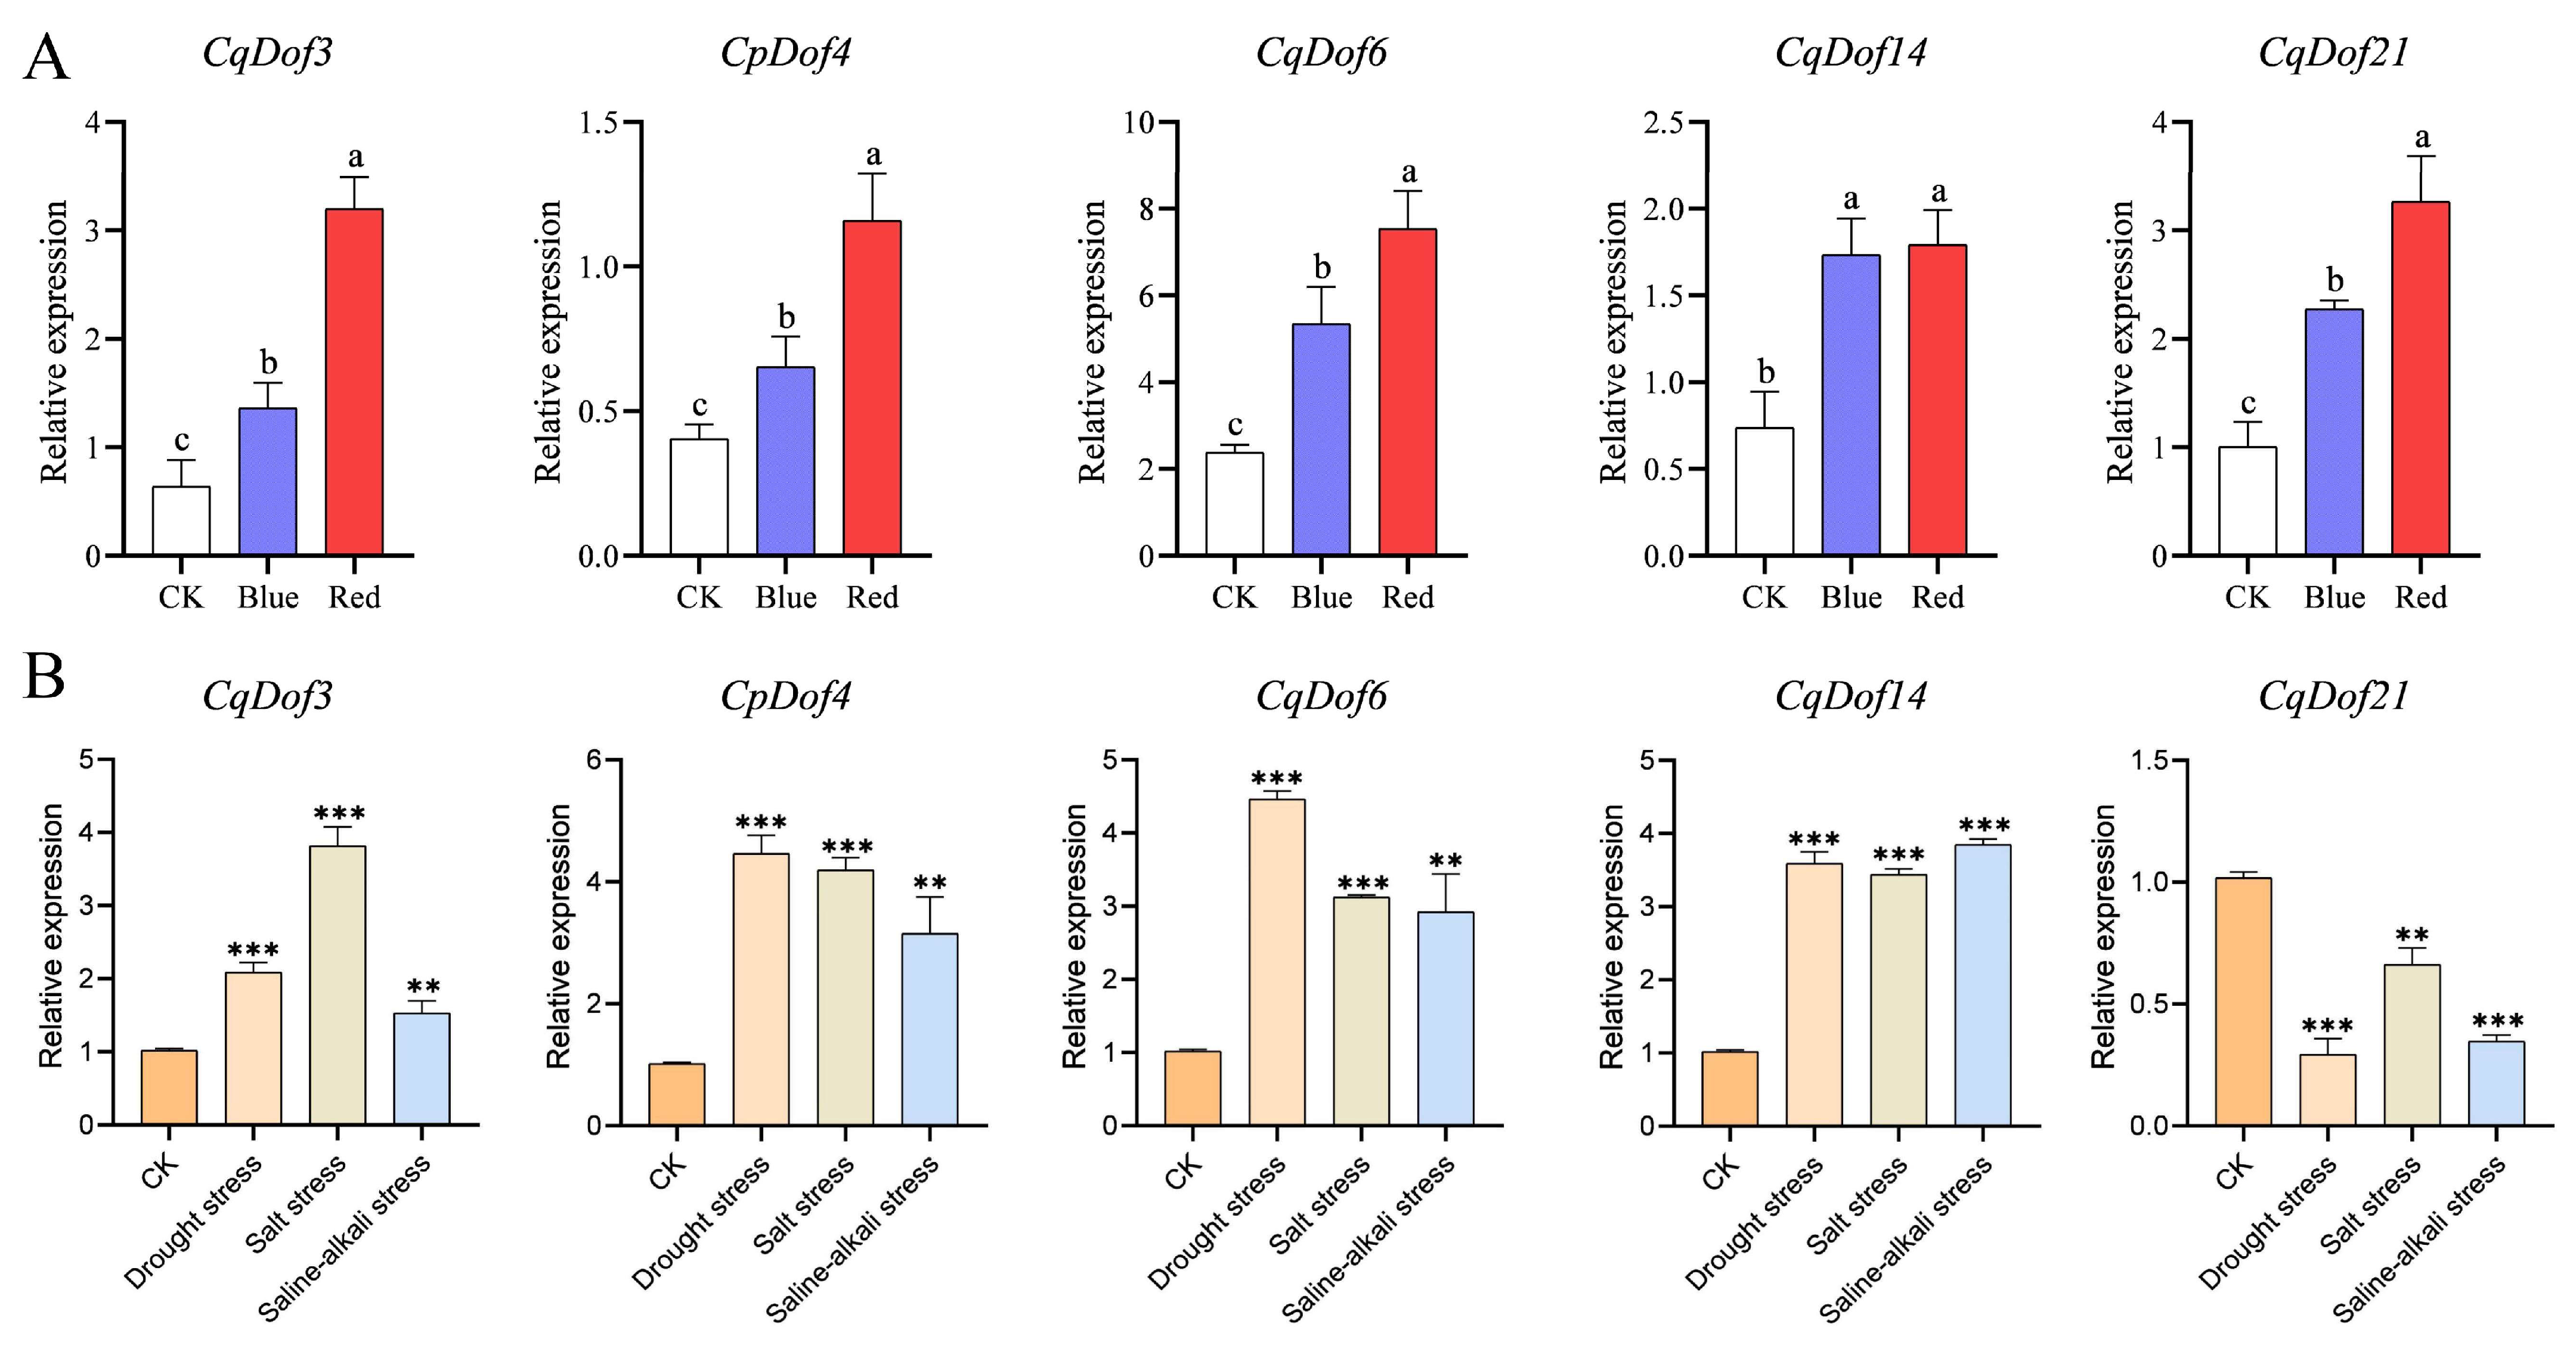
3.7. Expression Analysis of the CqDof Genes Under Abiotic Stress and Light Treatment

DEGs in response to light treatment were identified based on the criteria of log2 fold change ≥ 1 and p-value < 0.05, leading to the identification of five genes (CqDof3, CqDof4, CqDof6, CqDof14, CqDof21) that were all upregulated by the light treatment. Subsequently, the expression levels of five DEGs were verified using RT-PCR, which confirmed the RNA-seq data, indicating that the data were accurate and reliable (Figure 7A). To further explore the functions of the above 5 CqDof genes under abiotic stress, RT-PCR was used to analyze their expression profiles under abiotic stress in this study. The results indicated that these CqDof genes exhibited distinct responses to drought, salt, and saline-alkali stresses (Figure 7B). Specifically, CqDof3, CqDof4, CqDof6, and CqDof14 exhibited the most significant upregulation in expression levels under salt stress, drought stress, and saline-alkali stress, respectively, with 3.75-fold, 4.38-fold, 4.39-fold, and 3.78-fold increases. Notably, CqDof14 showed a consistent response pattern under three different abiotic stresses, suggesting its potential role as a common factor in plant adaptation to multiple stress conditions. Furthermore, the expression of CqDof21 was significantly downregulated under drought, salt, and saline-alkali stresses, with 3.49-fold, 1.54-fold, and 2.94-fold reductions, respectively. These results suggest that CqDof21 may play an inhibitory role in the regulation of plant responses to abiotic stress.

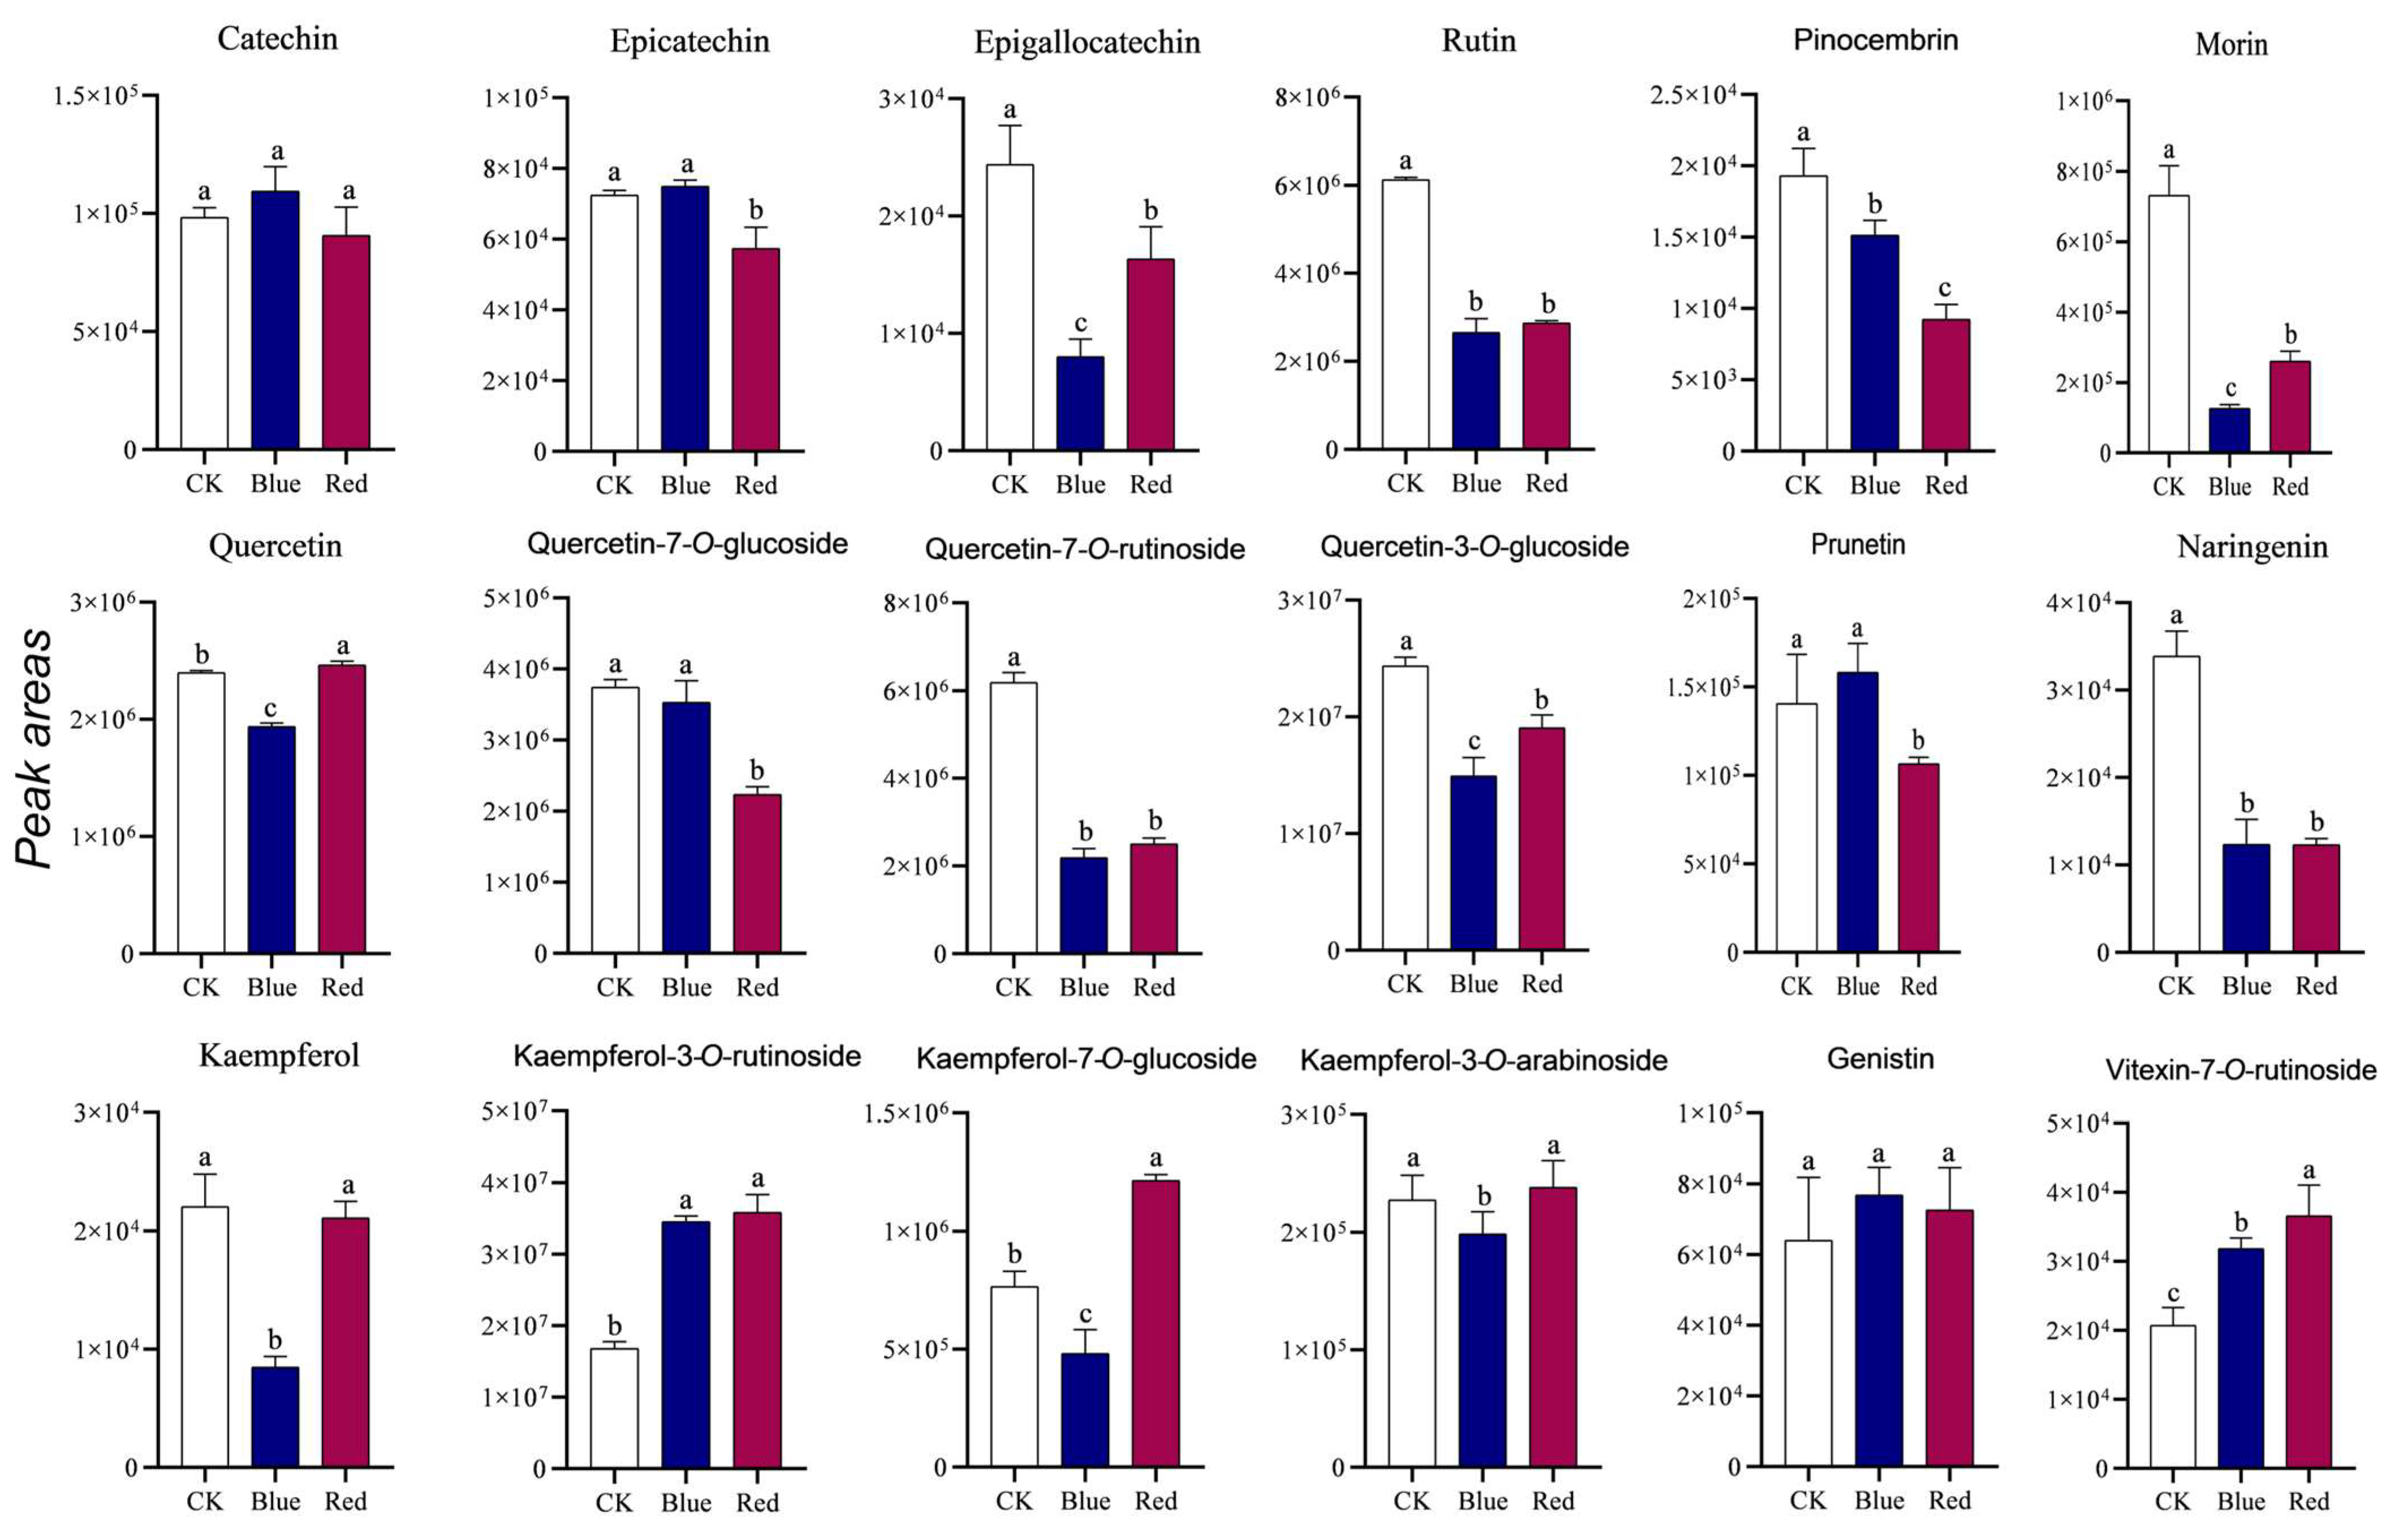
3.8. Analysis of the Flavonoid Content After Light Treatment

Quinoa is rich in a variety of flavonoid compounds, including rutin, catechin, epicatechin, morin, quercetin, and kaempferol [31]. Previous studies demonstrated that light treatment can influence the accumulation of flavonoids in plants [32]. Consequently, this study employed LC–MS to assess the levels of certain flavonoids in quinoa subjected to red and blue light treatments. The results revealed that the contents of most flavonoids decreased under blue and red light treatments. Specifically, blue light treatment led to a significant reduction in the levels of epigallocatechin, rutin, naringenin, morin, pinocembrin, quercetin-7-O-rutinoside, quercetin-3-O-glucoside, and naringenin by factors of 2.78, 2.31, 2.74, 5.80, 1.28, 2.82, 1.63, and 2.74, respectively. In contrast, red light treatment resulted in decreases in their concentrations by factors of 1.48, 2.13, 2.76, 2.82, 2.09, 2.47, 1.28, and 2.76, respectively (Figure 8). Additionally, the concentrations of kaempferol-3-O-rutinoside and vitexin-7-O-rutinoside were found to be approximately 2.01-fold and 1.54-fold greater under blue light conditions, and 2.13-fold and 1.76-fold greater under red light conditions, respectively. It is noteworthy that epicatechin, quercetin-7-O-glucoside, and prunitrin showed no significant alteration under blue light treatment, while catechin and genistin exhibited no significant change under both red and blue light treatments (Figure 8).

3.9. Correlation and Interaction Analysis Between CqDofs and Flavonoids

The correlation analysis revealed that CqDof3, CqDof4, CqDof6, CqDof14, and CqDof21 were significantly negatively correlated with rutin, pinocembrin, naringenin, quercetin-7-O-rutinoside, and quercetin-7-O-glucoside, and significantly positively correlated with vitexin-7-O-rutinoside and kaempferol-3-O-rutinoside. However, there was no significant correlation between these 5 CqDof genes and catechin, epigallocatechin, kaempferol, quercetin, genistin, prunitrin, and kaempferol-3-O-arabinoside (Figure 9A). These results indicate that blue light and red light potentially regulate flavonoid biosynthesis in quinoa by modulating the CqDof genes’ expression levels. Meanwhile, the Dof domain in Dof TFs is a key domain that can mediate protein–protein interactions, implying that Dof TFs may also play a role by forming protein complexes. To explore potential interactions between CqDofs, an interaction network was constructed using the STRING database, which was predicated on the orthologous relationships between CqDofs and AtDofs. The results indicated that there were protein interactions between homologous CqDofs corresponding to AtDofs, such as DOF3.5 (CqDof14/–26/–28/–32) interacting with DOF1.4 (CqDof18) and DOF3.4 (CqDof3) interacting with DOF3.6 (CqDof16)/DOF3.7 (CqDof19)/DOF5.1 (CqDof20)/DOF5.6 (CqDof11)/DOF2.4 (CqDof3.6). Furthermore, each of the five identified CqDofs (CqDof3, CqDof4, CqDof6, CqDof14, CqDof21) were found to interact with additional members of the quinoa Dof family (Figure 9B). In brief, the interaction network of CqDofs exhibits a potential intricacy in their associations, indicating a potential role for the CqDof genes in modulating flavonoid biosynthesis in quinoa through interactions with other CqDof proteins.

4. Discussion

Dof proteins are plant-specific transcription factors. In plants, Dof transcription factors are not only associated with vascular development, seed germination, pollen development, hormone response, and secondary metabolite synthesis, but also play important roles in abiotic stress tolerance, including resistance to salt, drought, high temperature, and cold [33]. Quinoa, as a nutritionally prominent functional health food, is rich in polyphenols, flavonoids, saponins, and polysaccharides, as well as essential nutrients such as vitamins, essential amino acids, and minerals (K, P, Mg, Ca, Zn, Fe), which possess antioxidant, hypoglycemic, lipid-lowering, anti-inflammatory, immune system-related, and cardiovascular disease-preventive physiological activities [25]. The Dof gene family has been extensively studied in many plant species, but no studies have specifically addressed the Dof gene family in quinoa. In this study, 36 CqDof genes were identified in the quinoa genome, a number comparable to the Dof genes reported in A. thaliana (36), Solanum tuberosum (35), Solanum lycopersicum (34), and Piper nigrum (33). However, the number of genes was lower than that in Brassica napus (117), Triticum aestivum (108), and Saccharum officinarum (119), and the number of transcription factors varied considerably between monocotyledonous and dicotyledonous plants, which may be related to the fact that they have experienced different evolutionary pressures in the expansion and contraction of their gene families [6]. Additionally, most CqDof proteins are basic, hydrophilic, and unstable, which is similar to the physicochemical properties of CqDof proteins in Medicago polymorpha [34] and Camelina sativa [35], suggesting a high degree of conservation of Dof genes across different species.
The chromosomal distribution of the 36 CqDof genes in quinoa was uneven, and the number of genes did not correlate with chromosome size. Notably, no CqDof genes were found on chromosomes Cq3A, Cq3B, and Cq7B, which may be related to fragment loss or chromosomal translocation events during the evolutionary process. Phylogenetic analysis showed that 36 CqDof genes were divided into 9 subgroups based on the Dof proteins from quinoa and Arabidopsis, consistent with the results for Brassica napus [36] and watermelon [37]. Multiple homologs were identified between the CqDof and AtDof genes across various subfamilies, including CqDof18 with AtDof1.4 (B2 subfamily) and CqDof11 with AtDof5.6 (C1 subfamily). AtDof5.6 (AT5G62940) exhibited high expression levels in Arabidopsis stems and leaves and modulated the stem size through the regulation of vascular tissue development, suggesting a potential analogous biological function for CqDof11 [38]. Interestingly, the C3 subfamily has only AtDofs but no CqDofs, which also occurs in Vaccinium corymbosum, indicating that the CqDof gene family may have undergone a contraction event during evolution [39]. Gene structure analysis revealed that all CqDof proteins contained a Dof domain, and CqDof genes from different subfamilies differed significantly in motif composition, while those from the same subgroup had a similar motif composition. Furthermore, the majority of CqDofs contained only one intron, and 7 CqDofs were intronless, which was similar to the findings in sweet potatoes [6]. Genes without introns have been reported to be more likely to function in abiotic stress responses such as drought and salinity, but the specific functions of intron deficiency in plant resistance to abiotic stresses need to be further studied [40].
Gene duplication is one of the key drivers of plant genome evolution, plays an essential role in the expansion of gene family members, and promotes specificity and diversity of gene functions [41]. In this study, 25 pairs of CqDof genes were involved in fragment replication, but no tandem duplication events were detected, indicating that fragment repetition events played a leading role in CqDof gene amplification, consistent with the results observed in roses [42] and Tartary buckwheat [43]. Furthermore, syntenic analysis revealed a significant number of orthologous gene pairs between quinoa and Arabidopsis, implying a closer evolutionary relationship between these two species.
Gene expression analysis in different tissues and various stress conditions is a critical approach for elucidating gene function [44]. In this study, the CqDof genes exhibited differential tissue-specific expression, with a majority being highly expressed in roots, which was consistent with the expression profiles observed in pepper and cucumber [45,46]. Transcriptomic analysis demonstrated that salt, drought, and saline-alkali stresses differentially induced CqDof gene expression, revealing that these genes may serve distinct functions in the response to diverse abiotic stresses. For example, CqDof14 was induced by all three different abiotic stresses, suggesting that it plays an important role in improving quinoa stress tolerance. These findings are important for understanding the response mechanism of Dof genes to abiotic stress in crops and their role in agronomic traits. Furthermore, cis-elements, serving as specific binding sites for transcription factors, are essential for the regulation of gene expression [41]. Therefore, this investigation explored the type and number of cis-elements in the promoter of CqDof genes. The results showed numerous developmental, hormonal, and stress-responsive cis-elements, including ABRE, ARE, LTR, CAT-box, P-box, Box-4, G-box, GT1-motif, and TCT-motif. Notably, the promoter regions exhibited abundant light-responsive elements. Previous studies demonstrated that Dof TFs influenced plant growth, development, and the biosynthesis of secondary metabolites by responding to light signaling. For instance, Gao et al. reported that Arabidopsis Dof TFs, specifically CDFs, modulated light responses by promoting hypocotyl cell elongation [47]. Additionally, DAG2 was identified as a positive regulator in light-induced seed germination, with red light markedly suppressing germination rates in DAG2 mutant seeds [48]. Huang et al. discovered that red light enhanced the expression of Dof TFs and stimulated carotenoid synthesis in Citrus paradisi [49]. However, the response of Dof TFs and alterations in secondary metabolites in quinoa under different light stresses have not been studied. In this study, transcriptome data analysis indicated that red light and blue light induced the expression of most CqDof genes, with red light eliciting a stronger response. Further investigation identified 5 CqDof genes (CqDof3, CqDof4, CqDof6, CqDof14, and CqDof21) that exhibited significant expression changes following both blue and red light treatments, as confirmed by RT-PCR assays, suggesting their critical regulatory roles in light response.
Numerous studies have demonstrated that red and blue light can induce flavonoid synthesis. Specifically, blue light induced flavonoid biosynthesis in Epimedium sagittatum [50], while red light enhanced the total flavonoid content in buckwheat sprouts [51]. In the present study, the content of various flavonoids, except for catechin and genistin, was altered by monochromatic blue and red light treatments, including changes in rutin, naringenin, morin, pinocembrin, and quercetin-7-O-rutinoside. Both blue and red light treatments influenced secondary metabolite accumulation in quinoa, but their effects differed significantly. For example, red light significantly increased the content of kaempferol-3-O-glucoside, whereas blue light negatively affected the accumulation of this compound. Red light increased the content of vitexin-7-O-rutinoside more effectively than blue light, which is also consistent with previous studies [52]. Correlation analysis between the 5 CqDof genes and 18 flavonoids indicated significant relationships, such as a positive correlation between CqDof14 and kaempferol-3-O-rutinoside, and a negative correlation between CqDof6 and rutin. These findings suggest varying functional roles among the CqDof genes in the regulation of flavonoid synthesis, as well as potential differences in the regulatory capacity. Additionally, protein interaction network predictions showed that the CqDof proteins can interact with one another, exemplified by the potential interaction between DOF3.5 (CqDof14/-26/-28/-32) and DOF1.4 (CqDof18). This highlights the complex interaction network among the CqDof proteins, but the precise mechanisms of these interactions require further investigation. Overall, these results provide a theoretical basis for the elucidation of the specific mechanisms by which the CqDof genes regulate flavonoid synthesis under various light conditions, which will be crucial for future efforts to enhance flavonoid production in quinoa, as well as for crop quality enhancement.

5. Conclusions

In summary, this study identified the CqDof gene family in quinoa at the genome-wide level, and further investigated their physicochemical properties, phylogenetic relationships, gene structures, and cis-acting elements. In addition, blue and red light treatments significantly altered CqDof gene expression and flavonoid accumulation, while CqDof3, CqDof4, CqDof6, CqDof14, and CqDof21 were also affected by abiotic stresses. Therefore, the results of this study will help to study the function of the CqDof gene family in quinoa and the mechanism of regulating flavonoid synthesis and provide a theoretical basis for screening genetic improvement genes to enhance quinoa stress tolerance.

Supplementary Materials

The following supporting information can be downloaded at: https://www.mdpi.com/article/10.3390/biology14040446/s1, Table S1: RT-PCR primers for the CqDof genes.

Author Contributions

Conceptualization, G.Q.; supervision, G.Q.; experiment design, L.L. and G.Q.; data analysis, M.W.; experiments, G.Q. and J.Y.; writing—original draft preparation, G.Q. and J.Y.; G.Q., J.Y., M.W. and L.L. contributed to manuscript revision, read, and approved the submitted version. All authors have read and agreed to the published version of the manuscript.

Funding

This work was supported by the National Natural Science Foundation of China (32170279) and the Fundamental Research Funds for the Central Universities (2572019CT03).

Institutional Review Board Statement

Not applicable.

Informed Consent Statement

Not applicable.

Data Availability Statement

The quinoa genome data used in this study can be found at https://datadryad.org/stash/dataset/doi:10.5061/dryad.kwh70rz70, accessed on 15 September 2024. The transcriptome data were deposited in the NCBI database under accession numbers PRJNA658178, PRJNA578698, and PRJNA636120.

Conflicts of Interest

The authors declare that they have no competing interests. The funders had no role in the design of the study, in the collection, analysis, and interpretation of the data, and in the writing of the manuscript.

References

  1. Qian, G.; Li, X.; Zhang, H.; Zhang, H.; Zhou, J.; Ma, X.; Sun, W.; Yang, W.; He, R.; Wahab, A.T.; et al. Metabolomics analysis reveals the accumulation patterns of flavonoids and phenolic acids in quinoa (Chenopodium quinoa Willd.) grains of different colors. Food Chem. X 2023, 17, 100594. [Google Scholar] [CrossRef] [PubMed]
  2. Sampaio, S.L.; Fernandes, A.; Pereira, C.; Calhelha, R.C.; Sokovic, M.; Santos-Buelga, C.; Barros, L.; Ferreira, I. Nutritional value, physicochemical characterization and bioactive properties of the Brazilian quinoa brs piabiru. Food Funct. 2020, 11, 2969–2977. [Google Scholar] [CrossRef]
  3. Melini, V.; Melini, F. Functional components and anti-nutritional factors in gluten-free grains: A focus on quinoa seeds. Foods 2021, 10, 351. [Google Scholar] [CrossRef] [PubMed]
  4. Pereira, E.; Cadavez, V.; Barros, L.; Encina-Zelada, C.; Stojkovic, D.; Sokovic, M.; Calhelha, R.C.; Gonzales-Barron, U.; Ferreira, I. Chenopodium quinoa Willd. (quinoa) grains: A good source of phenolic compounds. Food Res. Int. 2020, 137, 109574. [Google Scholar] [CrossRef]
  5. Zhang, J.; Liu, B.; Li, J.; Zhang, L.; Wang, Y.; Zheng, H.; Lu, M.; Chen, J. Hsf and Hsp gene families in populus: Genome-wide identification, organization and correlated expression during development and in stress responses. BMC Genom. 2015, 16, 181. [Google Scholar] [CrossRef]
  6. Zhang, C.; Dong, T.; Yu, J.; Hong, H.; Liu, S.; Guo, F.; Ma, H.; Zhang, J.; Zhu, M.; Meng, X. Genome-wide survey and expression analysis of Dof transcription factor family in sweetpotato shed light on their promising functions in stress tolerance. Front. Plant Sci. 2023, 14, 1140727. [Google Scholar] [CrossRef] [PubMed]
  7. Sellami, M.H.; Pulvento, C.; Lavini, A. Agronomic practices and performances of quinoa under field conditions: A systematic review. Plants 2020, 10, 72. [Google Scholar] [CrossRef]
  8. Zhu, X.; Wang, B.; Liu, W.; Wei, X.; Wang, X.; Du, X.; Liu, H. Genome-wide analysis of AP2/ERF gene and functional analysis of CqERF24 gene in drought stress in quinoa. Int. J. Biol. Macromol 2023, 253, 127582. [Google Scholar] [CrossRef] [PubMed]
  9. Sun, W.; Wei, J.; Wu, G.; Xu, H.; Chen, Y.; Yao, M.; Zhan, J.; Yan, J.; Wu, N.; Chen, H.; et al. CqZF-HD14 enhances drought tolerance in quinoa seedlings through interaction with CqHIPP34 and CqNAC79. Plant Sci. 2022, 323, 111406. [Google Scholar] [CrossRef]
  10. Tovar, J.C.; Berry, J.C.; Quillatupa, C.; Castillo, S.E.; Acosta-Gamboa, L.; Fahlgren, N.; Gehan, M.A. Heat stress changes mineral nutrient concentrations in Chenopodium quinoa seed. Plant Direct 2022, 6, e384. [Google Scholar] [CrossRef]
  11. Tashi, G.; Zhan, H.; Xing, G.; Chang, X.; Zhang, H.; Nie, X.; Ji, W. Genome-wide identification and expression analysis of heat shock transcription factor family in Chenopodium quinoa Willd. Agronomy 2018, 8, 103. [Google Scholar] [CrossRef]
  12. Hussin, S.A.; Ali, S.H.; Lotfy, M.E.; El-Samad, E.; Eid, M.A.; Abd-Elkader, A.M.; Eisa, S.S. Morpho-physiological mechanisms of two different quinoa ecotypes to resist salt stress. BMC Plant Biol. 2023, 23, 374. [Google Scholar] [CrossRef]
  13. Yang, F.; Fan, Y.; Wu, X.; Cheng, Y.; Liu, Q.; Feng, L.; Chen, J.; Wang, Z.; Wang, X.; Yong, T.; et al. Auxin-to-gibberellin ratio as a signal for light intensity and quality in regulating soybean growth and matter partitioning. Front. Plant Sci. 2018, 9, 56. [Google Scholar] [CrossRef]
  14. Zheng, C.; Ma, J.Q.; Ma, C.L.; Shen, S.Y.; Liu, Y.F.; Chen, L. Regulation of growth and flavonoid formation of tea plants (Camellia sinensis) by blue and green light. J. Agric. Food. Chem. 2019, 67, 2408–2419. [Google Scholar] [CrossRef] [PubMed]
  15. Manivannan, A.; Soundararajan, P.; Park, Y.G.; Jeong, B.R. Physiological and proteomic insights into red and blue light-mediated enhancement of in vitro growth in scrophularia kakudensis—A potential medicinal plant. Front. Plant Sci. 2020, 11, 607007. [Google Scholar] [CrossRef]
  16. Huarancca Reyes, T.; Scartazza, A.; Castagna, A.; Cosio, E.G.; Ranieri, A.; Guglielminetti, L. Physiological effects of short acute UVB treatments in Chenopodium quinoa Willd. Sci. Rep. 2018, 8, 371. [Google Scholar] [CrossRef]
  17. Prado, F.E.; Perez, M.L.; González, Y.J.A. Efectos de la radiación ultravioleta B (UV-B) sobre diferentes variedades de quinoa: II.- efectos sobre la síntesis de pigmentos fotosintéticos, protectores y azúcares solubles en condiciones controladas. Boletín La Soc. Argent. Botánica 2016, 51, 665–673. [Google Scholar] [CrossRef]
  18. Gupta, S.; Malviya, N.; Kushwaha, H.; Nasim, J.; Bisht, N.C.; Singh, V.K.; Yadav, D. Insights into structural and functional diversity of Dof (DNA binding with one finger) transcription factor. Planta 2015, 241, 549–562. [Google Scholar] [CrossRef]
  19. Yanagisawa, S.; Schmidt, R.J. Diversity and similarity among recognition sequences of Dof transcription factors. Plant J. 1999, 17, 209–214. [Google Scholar] [CrossRef]
  20. Wei, Z.; Zhang, H.; Fang, M.; Lin, S.; Zhu, M.; Li, Y.; Jiang, L.; Cui, T.; Cui, Y.; Kui, H.; et al. The Dof transcription factor COG1 acts as a key regulator of plant biomass by promoting photosynthesis and starch accumulation. Mol. Plant 2023, 16, 1759–1772. [Google Scholar] [CrossRef]
  21. Ramachandran, V.; Tobimatsu, Y.; Masaomi, Y.; Sano, R.; Umezawa, T.; Demura, T.; Ohtani, M. Plant-specific dof transcription factors vascular-related dof1 and vascular-related dof2 regulate vascular cell differentiation and lignin biosynthesis in Arabidopsis. Plant Mol. Biol. 2020, 104, 263–281. [Google Scholar] [CrossRef]
  22. Li, Y.; Tian, M.; Feng, Z.; Zhang, J.; Lu, J.; Fu, X.; Ma, L.; Wei, H.; Wang, H. GhDof1.7, a dof transcription factor, plays positive regulatory role under salinity stress in upland cotton. Plants 2023, 12, 3740. [Google Scholar] [CrossRef] [PubMed]
  23. Jarvis, D.E.; Ho, Y.S.; Lightfoot, D.J.; Schmockel, S.M.; Li, B.; Borm, T.J.; Ohyanagi, H.; Mineta, K.; Michell, C.T.; Saber, N.; et al. The genome of Chenopodium quinoa. Nature 2017, 542, 307–312. [Google Scholar] [CrossRef]
  24. Rey, E.; Maughan, P.J.; Maumus, F.; Lewis, D.; Wilson, L.; Fuller, J.; Schmockel, S.M.; Jellen, E.N.; Tester, M.; Jarvis, D.E. A chromosome-scale assembly of the quinoa genome provides insights into the structure and dynamics of its subgenomes. Commun. Biol. 2023, 6, 1263. [Google Scholar] [CrossRef]
  25. Qian, G.; Wang, M.; Zhou, J.; Wang, X.; Zhang, Y.; Liu, Y.; Zhu, P.; Han, L.; Li, X.; Liu, C.; et al. Analysis of widely targeted metabolites of quinoa sprouts (Chenopodium quinoa Willd.) under saline-alkali stress provides new insights into nutritional value. Food Chem. 2024, 448, 138575. [Google Scholar] [CrossRef] [PubMed]
  26. Cai, Z.Q.; Gao, Q. Comparative physiological and biochemical mechanisms of salt tolerance in five contrasting highland quinoa cultivars. BMC Plant Biol. 2020, 20, 70. [Google Scholar] [CrossRef]
  27. Wang, Y.; Wu, Y.; Bao, Q.; Shi, H.; Zhang, Y. Integrating physiology, transcriptome, and metabolome analyses reveals the drought response in two quinoa cultivars with contrasting drought tolerance. Int. J. Mol. Sci. 2024, 25, 12188. [Google Scholar] [CrossRef] [PubMed]
  28. Qian, G.; Meng, X.; Wang, S.; Mi, Y.; Qin, Z.; Liu, T.; Zhang, Y.; Wan, H.; Chen, W.; Sun, W.; et al. Genome-wide identification of HSF gene family and their expression analysis in vegetative tissue of young seedlings of hemp under different light treatments. Ind. Crop Prod. 2023, 204, 117375. [Google Scholar] [CrossRef]
  29. Xiaolin, Z.; Baoqiang, W.; Xian, W.; Xiaohong, W. Identification of the CIPK-CBL family gene and functional characterization of CqCIPK14 gene under drought stress in quinoa. BMC Genom. 2022, 23, 447. [Google Scholar] [CrossRef]
  30. Yang, W.; Qian, G.; Chen, Y.; Liu, T.; Wan, H.; Wang, S.; Meng, X.; Chen, W.; Su, Y.; Zhang, Y.; et al. Profiling of polyphenols for in-depth understanding of Tartary buckwheat sprouts: Correlation between cultivars and active components, dynamic changes and the effects of ultraviolet B stress. Food Chem. X 2022, 14, 100295. [Google Scholar] [CrossRef]
  31. Ren, G.; Teng, C.; Fan, X.; Guo, S.; Zhao, G.; Zhang, L.; Liang, Z.; Qin, P. Nutrient composition, functional activity and industrial applications of quinoa (Chenopodium quinoa Willd.). Food Chem. 2023, 410, 135290. [Google Scholar] [CrossRef] [PubMed]
  32. Fu, B.; Ji, X.; Zhao, M.; He, F.; Wang, X.; Wang, Y.; Liu, P.; Niu, L. The influence of light quality on the accumulation of flavonoids in tobacco (Nicotiana tabacum L.) leaves. J. Photochem. Photobiol. B 2016, 162, 544–549. [Google Scholar] [CrossRef] [PubMed]
  33. Zou, X.; Sun, H. DOF transcription factors: Specific regulators of plant biological processes. Front. Plant Sci. 2023, 14, 1044918. [Google Scholar] [CrossRef]
  34. Yang, L.; Min, X.; Wei, Z.; Liu, N.; Li, J.; Zhang, Y.; Yang, Y. Genome-wide identification and expression analysis of the dof transcription factor in Annual Alfalfa Medicago polymorpha. Plants 2023, 12, 1831. [Google Scholar] [CrossRef] [PubMed]
  35. Luo, T.; Song, Y.; Gao, H.; Wang, M.; Cui, H.; Ji, C.; Wang, J.; Yuan, L.; Li, R. Genome-wide identification and functional analysis of Dof transcription factor family in Camelina sativa. BMC Genom. 2022, 23, 812. [Google Scholar] [CrossRef]
  36. Lohani, N.; Babaei, S.; Singh, M.B.; Bhalla, P.L. Genome-wide in silico identification and comparative analysis of dof gene family in Brassica napus. Plants 2021, 10, 709. [Google Scholar] [CrossRef]
  37. Zhou, Y.; Cheng, Y.; Wan, C.; Li, J.; Yang, Y.; Chen, J. Genome-wide characterization and expression analysis of the Dof gene family related to abiotic stress in watermelon. PeerJ 2020, 8, e8358. [Google Scholar] [CrossRef]
  38. Yue, Y.; Du, J.; Li, Y.; Thomas, H.R.; Frank, M.H.; Wang, L.; Hu, H. Insight into the petunia Dof transcription factor family reveals a new regulator of male-sterility. Ind. Crop Prod 2021, 161, 113196. [Google Scholar] [CrossRef]
  39. Li, T.; Wang, X.; Elango, D.; Zhang, W.; Li, M.; Zhang, F.; Pan, Q.; Wu, Y. Genome-wide identification, phylogenetic and expression pattern analysis of Dof transcription factors in blueberry (Vaccinium corymbosum L.). PeerJ 2022, 10, e14087. [Google Scholar] [CrossRef]
  40. Liu, H.; Lyu, H.M.; Zhu, K.; Van de Peer, Y.; Max, C.Z. The emergence and evolution of intron-poor and intronless genes in intron-rich plant gene families. Plant J. 2021, 105, 1072–1082. [Google Scholar] [CrossRef]
  41. Tabassum, J.; Raza, Q.; Riaz, A.; Ahmad, S.; Rashid, M.; Javed, M.A.; Ali, Z.; Kang, F.; Khan, I.A.; Atif, R.M.; et al. Exploration of the genomic atlas of Dof transcription factor family across genus Oryza provides novel insights on rice breeding in changing climate. Front. Plant Sci. 2022, 13, 1004359. [Google Scholar] [CrossRef] [PubMed]
  42. Nan, H.; Ludlow, R.A.; Lu, M.; An, H. Genome-wide analysis of Dof genes and their response to abiotic stress in rose (Rosa chinensis). Front. Genet. 2021, 12, 538733. [Google Scholar] [CrossRef] [PubMed]
  43. Li, J.; Zhang, Y.; Xu, L.; Wang, C.; Luo, Y.; Feng, S.; Yuan, Y.; Yang, Q.; Feng, B. Genome-wide identification of dna binding with one finger (Dof) gene family in Tartary Buckwheat (Fagopyrum tataricum) and analysis of its expression pattern after exogenous hormone stimulation. Biology 2022, 11, 173. [Google Scholar] [CrossRef]
  44. Meng, X.; Liu, S.; Zhang, C.; He, J.; Ma, D.; Wang, X.; Dong, T.; Guo, F.; Cai, J.; Long, T.; et al. The unique sweet potato NAC transcription factor IbNAC3 modulates combined salt and drought stresses. Plant Physiol. 2023, 191, 747–771. [Google Scholar] [CrossRef]
  45. Wu, Z.; Cheng, J.; Cui, J.; Xu, X.; Liang, G.; Luo, X.; Chen, X.; Tang, X.; Hu, K.; Qin, C. Genome-wide identification and expression profile of dof transcription factor gene family in pepper (Capsicum annuum L.). Front. Plant Sci. 2016, 7, 574. [Google Scholar] [CrossRef]
  46. Wen, C.L.; Cheng, Q.; Zhao, L.; Mao, A.; Yang, J.; Yu, S.; Weng, Y.; Xu, Y. Identification and characterisation of Dof transcription factors in the cucumber genome. Sci. Rep. 2016, 6, 23072. [Google Scholar] [CrossRef]
  47. Gao, H.; Song, W.; Severing, E.; Vayssieres, A.; Huettel, B.; Franzen, R.; Richter, R.; Chai, J.; Coupland, G. PIF4 enhances DNA binding of CDF2 to co-regulate target gene expression and promote Arabidopsis hypocotyl cell elongation. Nat. Plants 2022, 8, 1082–1093. [Google Scholar] [CrossRef]
  48. Santopolo, S.; Boccaccini, A.; Lorrai, R.; Ruta, V.; Capauto, D.; Minutello, E.; Serino, G.; Costantino, P.; Vittorioso, P. Dof affecting germination 2 is a positive regulator of light-mediated seed germination and is repressed by dof affecting germination 1. BMC Plant Biol. 2015, 15, 72. [Google Scholar] [CrossRef] [PubMed]
  49. Huang, X.; Hu, L.; Kong, W.; Yang, C.; Xi, W. Red light-transmittance bagging promotes carotenoid accumulation of grapefruit during ripening. Commun. Biol. 2022, 5, 303. [Google Scholar] [CrossRef]
  50. Yang, L.; Zhou, S.; Hou, Y.; Ji, B.; Pei, L.; Su, X.; Zhong, H.; Dong, C. Blue light induces biosynthesis of flavonoids in Epimedium sagittatum (Sieb.et Zucc.) Maxim. leaves, a study on a light-demanding medicinal shade herb. Ind. Crop. Prod. 2022, 187, 115512. [Google Scholar] [CrossRef]
  51. Nam, T.G.; Kim, D.O.; Eom, S.H. Effects of light sources on major flavonoids and antioxidant activity in common buckwheat sprouts. Food Sci. Biotechnol. 2018, 27, 169–176. [Google Scholar] [CrossRef] [PubMed]
  52. Zhang, S.; Ma, J.; Zou, H.; Zhang, L.; Li, S.; Wang, Y. The combination of blue and red LED light improves growth and phenolic acid contents in Salvia miltiorrhiza Bunge. Ind. Crop. Prod. 2020, 158, 112959. [Google Scholar] [CrossRef]
Figure 1. Chromosome localization of CqDof genes in quinoa. The scale on the left denotes chromosome length. Suffixes A and B for the chromosome number indicate subgenomes A and B in the quinoa genome, respectively.
Biology 14 00446 g001
Figure 2. Phylogenetic relationships of Dof proteins from quinoa and A. thaliana. The Dof genes of quinoa and A. thaliana are represented by circles and triangles, respectively. The phylogenetic tree was constructed using the neighbor-joining method. The best evolutionary model JTT + G + I + F calculated through MEGA X was selected with the bootstrap value of 1000. Numbers in the tree represent the bootstrap values of the nodes and branches.
Biology 14 00446 g002
Figure 3. Gene duplication and syntenic analysis of the CqDof genes in quinoa. (A) Gene duplication analysis of the CqDof genes. The grey lines represent all collinear blocks in the quinoa genome, and the red lines represent the segmental replication line relationship between the CqDof genes. The number on the perimeter of the circle represents the length of the chromosome. (B) Syntenic analysis of the Dof genes among C. quinoa, A. thaliana, and O. sativa. The gray lines in the background show collinearity between the C. quinoa and A. thaliana, O. sativa genomes. The red lines denote syntenic Dof gene pairs between quinoa and other plant genomes.
Biology 14 00446 g003
Figure 4. Analysis of conserved domains (A), motif (B), and gene structure (C) of the CqDof genes. Different color modules represent different elements. UTR: untranslated region, CDS: coding sequence, lines indicate introns.
Biology 14 00446 g004
Figure 5. Distribution of cis-acting elements in the promoter regions of the CqDof genes. The color intensity and the numbers in the grids indicate the numbers of cis-acting elements.
Biology 14 00446 g005
Figure 6. Heatmap display of the CqDof genes in quinoa. (A) Expression profile of CqDofs in roots, stems, leaves, flowers, and fruits. (B) Expression profile of CqDofs under salt stress. (C) Expression profile of CqDofs under drought and saline-alkali stress. (D) Expression profile of CqDofs under red and blue light treatments. The color gradient represents log2 fold change, ranging from higher (red) to lower (blue). CK: normal condition.
Biology 14 00446 g006
Figure 7. The relative expression levels of the CqDof genes in leaves under light treatment (A) and under drought, salt, and saline-alkali stress (B). The error bars represent standard deviations (n = 3). Note: Different lowercase letters represent significant differences (p < 0.05) followed by Tukey’s multiple range test. **, and *** represent p < 0.01, p < 0.001 using Student′s t-test. CK: normal growth condition; Blue: blue light treatment; Red: red light treatment.
Biology 14 00446 g007
Figure 8. Statistical analysis of the relative contents of flavonoids under red and blue light treatments. The error bars represent standard deviations (n = 3). Different lowercase letters represent significant differences (p < 0.05) followed by Tukey’s multiple range test. CK: normal growth condition; Blue: blue light treatment; Red: red light treatment.
Biology 14 00446 g008
Figure 9. Pearson correlation and protein interaction network analysis. (A) Pearson correlation analysis between CqDofs and flavonoids. The color intensity (ranging from red to blue) and the circle diameter represent the correlation strength depicted as the r-value. Circles marked with asterisks denote the statistical significance of the correlations, where *, **, and *** represent p < 0.05, p < 0.01, p < 0.001, respectively. (B) Interaction network analysis of the CqDof proteins. The numbers (CqDof gene number) in brackets represent the corresponding orthologs in quinoa, where distinct line colors signify the categories of interactions as defined in the legend.
Biology 14 00446 g009
Table 1. The basic information of CqDof genes in quinoa.
Gene IDGene NameLength (Aa)MV (kDa)PIInstability IndexGRAVYAliphatic IndexSubcellular Location
AUR62001807CqDof130532.519.0644.57−0.74249.61Nucleus
AUR62001970CqDof219621.939.3843.76−0.88652.76Nucleus
AUR62001976CqDof318619.178.7250.76−0.35655.97Nucleus
AUR62003691CqDof429131.139.4051.63−0.60461.07Nucleus
AUR62003828CqDof555859.109.0956.97−0.25366.49Nucleus
AUR62003833CqDof633735.849.1849.13−0.62053.23Nucleus
AUR62004520CqDof719621.939.3843.76−0.88652.76Nucleus
AUR62005809CqDof845750.135.6050.34−0.76555.30Nucleus
AUR62006501CqDof930433.908.0752.68−0.83855.49Nucleus
AUR62007029CqDof1022325.329.4451.32−0.90455.96Nucleus
AUR62008205CqDof1134636.878.0350.31−0.64048.50Nucleus
AUR62008425CqDof1245049.655.1355.16−0.90148.56Nucleus
AUR62009593CqDof1339842.416.6551.28−0.81649.30Nucleus
AUR62013510CqDof1425528.014.5257.45−0.65651.29Nucleus
AUR62014301CqDof1530433.446.0345.24−0.56062.96Nucleus
AUR62014841CqDof1631334.9611.4685.15−0.70867.48Nucleus
AUR62014843CqDof1716918.788.3146.39−0.80547.46Nucleus
AUR62016967CqDof1826729.856.3757.96−0.91047.12Nucleus
AUR62017038CqDof1927630.088.2256.50−0.69162.10Nucleus
AUR62017040CqDof2014316.088.2432.55−0.85942.45Nucleus
AUR62018002CqDof2133236.198.0745.31−0.77255.84Nucleus
AUR62021670CqDof2244949.555.1354.30−0.90248.66Nucleus
AUR62022735CqDof2320422.649.6048.23−0.94849.75Nucleus
AUR62023916CqDof2422323.499.3256.20−0.53559.15Nucleus
AUR62025032CqDof2530133.498.0754.93−0.82956.05Nucleus
AUR62026763CqDof2627430.314.6158.22−0.62651.64Nucleus
AUR62027677CqDof2711312.699.2650.58−0.53656.99Nucleus
AUR62030727CqDof2821023.529.1147.08−0.59260.76Nucleus
AUR62031206CqDof2911012.228.6945.05−0.59245.27Nucleus
AUR62034094CqDof3033537.296.5551.77−0.62665.25Nucleus
AUR62034427CqDof3151256.465.4745.21−0.68464.20Nucleus
AUR62036367CqDof3220222.658.9647.13−0.76051.14Nucleus
AUR62036527CqDof3335338.877.1461.18−0.62061.81Nucleus
AUR62038328CqDof3422423.799.4153.53−0.63151.47Nucleus
AUR62039802CqDof3544248.706.8043.72−0.77853.46Nucleus
AUR62041860CqDof3633135.748.9353.75−0.66257.73Nucleus
MW: molecular weight; PI: isoelectric point; GRAVY: grand average hydropathicity.
Disclaimer/Publisher’s Note: The statements, opinions and data contained in all publications are solely those of the individual author(s) and contributor(s) and not of MDPI and/or the editor(s). MDPI and/or the editor(s) disclaim responsibility for any injury to people or property resulting from any ideas, methods, instructions or products referred to in the content.

