1. Introduction
Neurodegenerative diseases, including Alzheimer’s disease (AD), Parkinson’s disease, and Huntington’s disease, have emerged as a global health concern, exerting a profound impact on both families and society [
1]. Neurodegenerative diseases have complex etiologies, involving multiple factors such as gene mutations, oxidative stress, mitochondrial dysfunction, abnormal immune responses, inflammation, and excitotoxicity. These diseases are irreversible. During disease progression, patients gradually lose their ability to perform daily activities and may ultimately die due to complications [
2].
The
N-methyl-D-aspartate receptor (NMDAR) glutamate-gated ion channel has a big impact on how people learn and remember things. It can change the structure of dendritic and axonal cells and the flexibility of synapses by changing how neurons work, which in turn, changes how neurons connect to each other [
3]. During normal excitability, after the NMDAR is positively modulated by glutamic acid (Glu), the main excitatory neurotransmitter in the neuronal cells of the brain, the postsynaptic neuron undergoes a depolarization process in which Mg
2+ ions blocking the channel are removed, allowing Ca
2+ ions to flow through the channel and enter the nerve cell. This process has a far-reaching and significant impact on learning and memory functions. However, excessive release of glutamate can stimulate neuronal death in the mammalian central nervous system, manifesting as excitatory neurotoxicity [
4]. Excessive glutamate over-activates NMDAR, promoting Ca
2+ influx and resulting in intracellular calcium overload. This triggers mitochondrial membrane depolarization, induces changes in mitochondrial morphology and structure, and releases cytochrome C [
5]. Simultaneously, it facilitates the generation of reactive oxygen species clusters (ROS), which induces downstream caspase cascade reactions [
6] and ultimately leads to cell death [
7]. And when excessive ROS production is induced after a noxious stimulus to the organism, the degree of oxidation exceeds the oxidant-scavenging capacity of the organism, resulting in a disruption of the balance of the antioxidant system in the body. The process is known as oxidative stress [
8]. ROS-induced neuronal damage has been shown to be associated with the etiology of many common neurological disorders [
9,
10]. Studies have shown that oxidative stress in the brain under progressive aggravation reduces antioxidant defenses, accelerates neuronal cell senescence, and is one of the major risk factors for neurodegenerative disease [
11].
Periplaneta americana (L.) (PA), commonly referred to as the “cockroach” [
12], has been investigated in modern studies. It has been demonstrated that its extracts are rich in small molecular peptides, amino acids, nucleosides, and numerous types of organic small molecules [
13,
14]. Within these components, certain substances possess diverse pharmacological activities, including antioxidant, anti-inflammatory, anti-heart failure, anti-fibrotic, and tissue repair properties [
15,
16].
This study is based on our group’s previous finding that the PA extract (PAS840, named according to the drug extraction process in
Section 2.3) can effectively protect PC12 cells from hydrogen peroxide-induced damage. In this study, taking the typical neurodegenerative disease AD as the target disease, after analyzing the material components of PAS840 by LC-MS/MS, network pharmacology was used to predict and analyze the targets of PAS840 for AD. An in vitro excitotoxic PC12 cell (cell line derived from a rat pheochromocytoma, a tumor of the adrenal medulla) model was established using Glu induction. After intervening with PAS840 in the model cells, the effects of PAS840 on cell viability, intracellular Ca
2+ levels, oxidative stress, and NMDAR1 expression were explored, aiming to lay the foundation for subsequent studies on the impact of PAS840 on neurodegenerative diseases.
2. Materials and Methods
2.1. Instruments
A CKX41SF inverted microscope (OLYMPUS, Center Valley, PA, USA); Varisoskan LUX multifunctional enzyme labeling instrument (Thermo Fisher Scientific, Waltham, MA, USA); BD FACSCantoTM II flow cytometer (BD, Franklin Lake, NJ, USA); TCS SP8 laser confocal scanning microscope (Leica, Hesse, Germany); Optics Module PCR instrument, Mini-Protein vertical electrophoresis tank and electrophoresis apparatus (model 1658033, BIO-RAD, Hercules, CA, USA); Thermo Vanquish (Thermo Fisher Scientific, Waltham, MA, USA); and Thermo Q Exactive mass spectrometry detector (Thermo Fisher Scientific, Waltham, MA, USA) were obtained.
2.2. Reagents
L-Glu (Beijing Inokai Science and Technology Co., Ltd., Beijing, China, Lot No.: A21524); PC12 cell culture medium (Wuhan Pnosay, Wuhan, China, Lot No.: WH01112107-10SP); LDH, GSH-Px, GSH, MDA, ROS kits (Beijing Solepol, Beijing, China, Lot Nos., respectively, PC0020, BC0685, BC1195, BC1175, BC0025, CA1410); Total SOD Assay Kit/Calcium content color detection kit (Biyuntian Company, Lot No. S0101S, S1063S, Shanghai, China); Annexin V-FITC/PI Apoptosis Detection Kit (BD Company, Lot No. 556547, Franklin Lake, NJ, USA); PAGE Gel Rapid Preparation Kit (Yase, Lot No. PG112, Qingdao, China); Fekt Ultrasensitive ECL Luminescent Liquid (Mellen Biological Company, Lot No.: MA0186-Apr-29G, Dalian, China); RT-qPCR primers (synthesized by Shanghai Sangong Bioengineering Company, Shanghai, China); Tumor Necrosis Factor-alpha (TNF-alpha) kit, Interleukin-6 (IL-6) (Nanjing Jianjian Biological Co. Ltd., Nanjing, China, Lot No.: 20220827); rabbit anticlonal antibody GAPDH, rabbit anticlonal antibody NMDAR1, rabbit anticlonal antibody Cytc, rabbit anticlonal antibody Caspase-3, rabbit anticlonal HO-1 antibody (Cell Signaling Technology, Danvers, MA, USA, batch No. 8, 4, 8, 3, 1, respectively); and rabbit anticlonal antibody Bax, rabbit anticlonal antibody Bcl2, goat anti-rabbit IgG-HRP secondary antibody (Wuhan Sanying. Wuhan, China, Lot numbers: 00104968, 00110639, 20000483), Highly differentiated PC12 cells (Wuhan Punosai Life Science and Technology Company Limited, Wuhan, China, No. 8300L222009) were obtained.
2.3. Sample Preparation
P. Americana (L.) was purchased from Yunnan Jingxin Biotechnology Co., Ltd. (Dali, China) and identified as P. Americana (L.) by Prof. Yang Zizhong from the Yunnan Key Laboratory of Insect Biomedicine R&D, Dali University. The dried insect body of P. Americana (L.) was crushed and extracted with 5 times the mass of the insect body in 90% ethanol, and the extracted alcohol was concentrated and defatted to obtain a defatted extract, which was then chromatographed on an S-8 macroporous adsorbent resin column, washed with ultrapure water, and then eluted with 40% ethanol. The ethanol solution was then collected, concentrated under reduced pressure at 60 °C, and freeze-dried, which resulted in the sample PAS840, which was used for the analysis of LC-MS/MS and in vitro experiments.
2.4. Mass Spectrometry Identification of Compounds Present in PAS840
The PAS840 samples were gathered and ground using a tissue grinder (Zhejiang Meibi Technology Co., Hangzhou, China) for 120 s at 50 Hz. After grinding, the samples were vortexed for 30 s in 600 µL of methanol containing 4-chloro-L-phenylalanine (4 ppm) to facilitate extraction. The samples were then centrifuged for 10 min at 12,000 rpm following sonication at 24 ± 2 °C. The supernatant was filtered through a 0.22 μm filter membrane, and the filtrate was finally introduced into the test bottle for LC-MS/MS analysis to detect small-molecule compounds.
The ACQUITY UPLC® HSS T3 (2.1 × 100 mm, 1.8 µm) (Waters, Milford, MA, USA) column was used for the analysis of the samples on a Thermo Vanquish (Thermo Fisher Scientific, USA) ultra-high-performance liquid chromatography (UHPLC) system. The column temperature was set at 40 °C, a flow rate of 0.3 mL/min, and an injection volume of 2 μL. The positive ionization mode used 0.1% formic acid in acetonitrile (B2) and 0.1% formic acid in water (A2) as the mobile phases. The gradient elution program was 0 to 1 min, 8% B2; 1 to 8 min, 8% to 98% B2; 8 to 10 min, 98% B2; 10 to 10.1 min, 98% to 8%B2; and 10.1~12 min, 8% B2. And the negative ionization mode used acetonitrile (B3) and 5 mM ammonium formate in water (A3) as the mobile phases. The gradient elution program was 0–1 min, 8% B3; 1–8 min, 8–98% B3; 8–10 min, 98% B3; 10–10.1 min, 98–8% B3; and 10.1–12 min, 8% B3. A Thermo Q Exactive Mass Spectrometry Detector (Thermo Fisher Scientific, USA) equipped with an electrospray ionization (ESI) source in the positive and negative ion modes was used to collect data separately. The auxiliary gas, sheath gas, and positive ion spray voltage were 10 arb, 40 arb, and 3.50 kV, respectively. The negative ion spray voltage was −2.50 kV. The main ion-scanning range was m/z 100–1000. The capillary temperature was 325 °C, and a resolution of 70,000 was achieved during the primary complete scan. Secondary cleavage was performed using HCD with a collision energy of 30 eV and a secondary resolution of 17,500. The first ten ions obtained were broken, and any extraneous MS/MS data were eliminated using dynamic exclusion.
In the detection of peptide components in the PAS840 samples, liquids A (100% water and 0.1% formic acid) and B (80% acetonitrile and 0.1% formic acid) were used as mobile phases. Liquid A (10 mL) was used to dissolve the lyophilized powder sample. For liquid–liquid detection, 1 µg of the supernatant was injected into the sample after it had been centrifuged for 20 min at 4 °C at 14,000 rpm The elution conditions used for liquid chromatography are listed in
Table 1. Using a Nanospray FlexTM (NSI) ion source and a Q Exactive HF-X mass spectrometer, the ion spray voltage was set at 2.4 kV, the ion transfer tube temperature at 275 °C, and the mass spectrum was acquired in data-dependent mode with a full scan range of
m/
z 100–1500 and a resolution of 120,000 (200
m/
z) for the first stage of the mass spectrum. The AGC measured 3 × 10
6 and the maximum C-trap injection time was 80 ms. The parent ion with the highest ion intensity in the entire scan was chosen for fragmentation using the high-energy collision cleavage (HCD) method. Secondary mass spectrometry (MS) was performed at a resolution of 15,000 (200
m/
z). The AGC was 5 × 10
4, with a maximum injection time of 45 ms and the energy of peptide fragmentation and collision set at 27%. Raw data (.raw) were used for MS detection. Peptide sequences were retrieved by de novo analysis using the peptides’ de novo-only peptide databases.
2.5. Network Pharmacology Analysis of PAS840 Against AD
2.5.1. Acquisition of Disease Targets Corresponding to PAS840 Components
The molecular details and structures for the small-molecule compounds detected using PAS840 and entered into the SwissADME database (
http://www.swissadme.ch/index.php, accessed on 5 April 2024) [
17] were obtained from the PubChem database (
https://pubchem.ncbi.nlm.nih.gov/, accessed on 5 April 2024) [
18]. Following a screening process that identified compounds with therapeutic disease target effects, columns with a probability > 0.01 were chosen, and the associated targets were observed.
To obtain the related protein information, the peptide sequences that scored highest on the database peptides analysis (−10 lg
p value) and those that scored higher on de novo-only peptide analysis (>95 confidence level) were chosen and added to the Emboss database (
https://www.ebi.ac.uk/Tools/seqstats/emboss_pepstats/, accessed on 12 April 2024). Peptide sequences with a charge value of ≥0 and an isoelectric point value of ≤12 were screened according to the conditional characteristics of food-borne anti-inflammatory peptides and neuroprotective peptides [
19,
20,
21,
22], The peptide sequence numbers were then entered into the NoverPor (
https://www.novoprolabs.com/tools/convert-peptide-to-smiles-string, accessed on 12 April 2024) web tool to convert the sequence numbers to the smile format, and the similarity ensemble approach (SEA) (
https://sea.bkslab.org/, accessed on 15 April 2024) was used to obtain the target protein for each peptide prediction information. After eliminating duplicates, the target protein information of the peptides and small molecules were combined to obtain the desired information.
2.5.2. Alzheimer’s Disease Target Acquisition
The search terms “Alzheimer” and “AD” were selected to access the OMIM (
https://omim.org/, accessed on 18 March 2024), GeneCards (
www.genecards.org/, accessed on 18 March 2024), and DisGeNET (
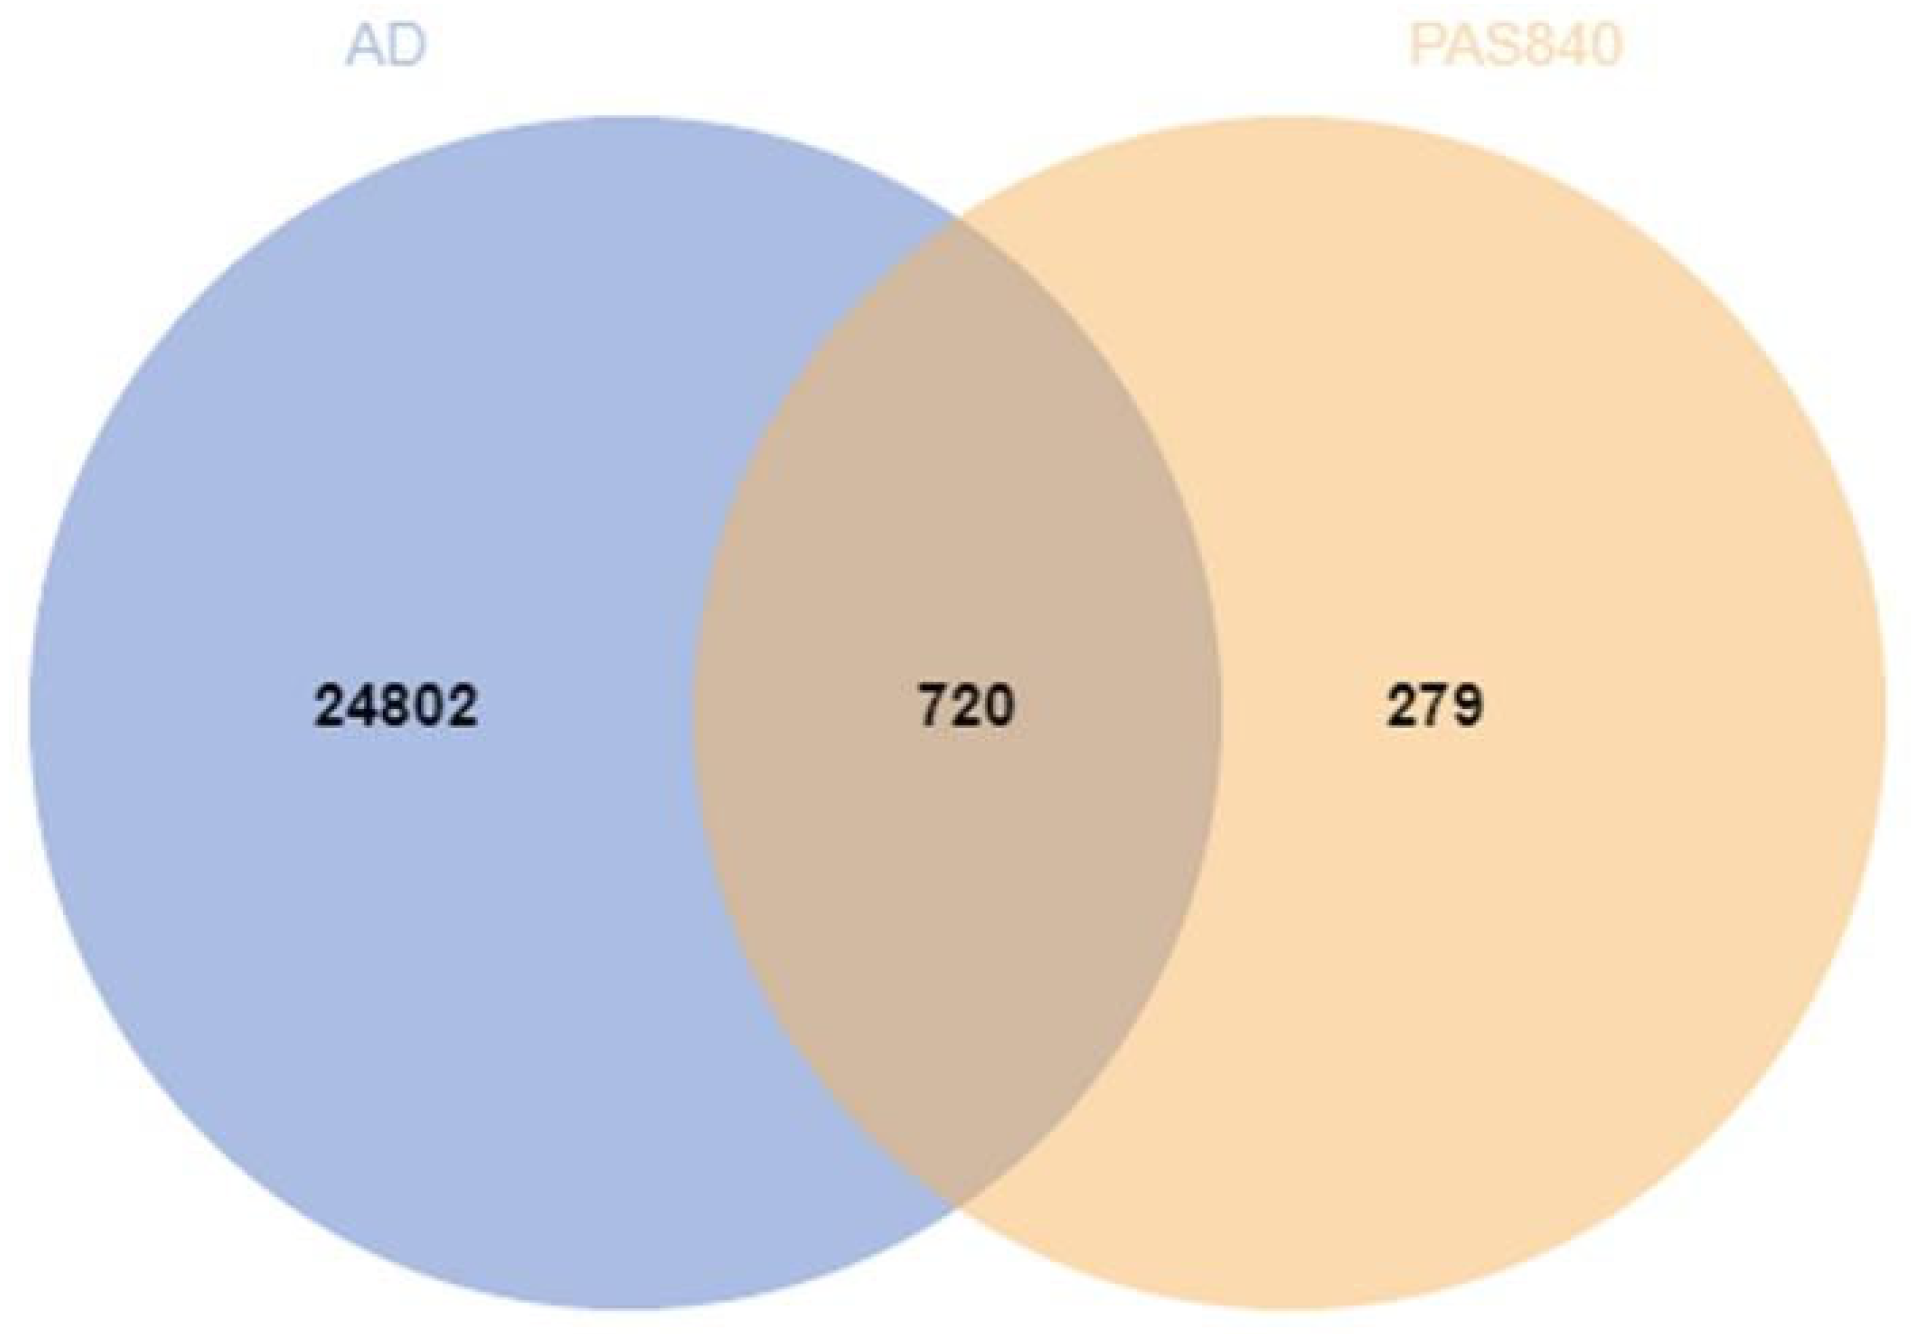
https://www.disgenet.org/search, accessed on 18 March 2024) databases to obtain the excel results of disease genes. The search results of the three databases were combined to remove the duplicate disease target information, and finally, the obtained targets of drugs and diseases were processed using Venny 2.0.1 to obtain the cross-targets of drugs and diseases.
2.5.3. Disease Target Interaction Network Construction (PPI)
The protein interaction search prediction database STRING (
https://string-db.org/, accessed on 3 May 2024) [
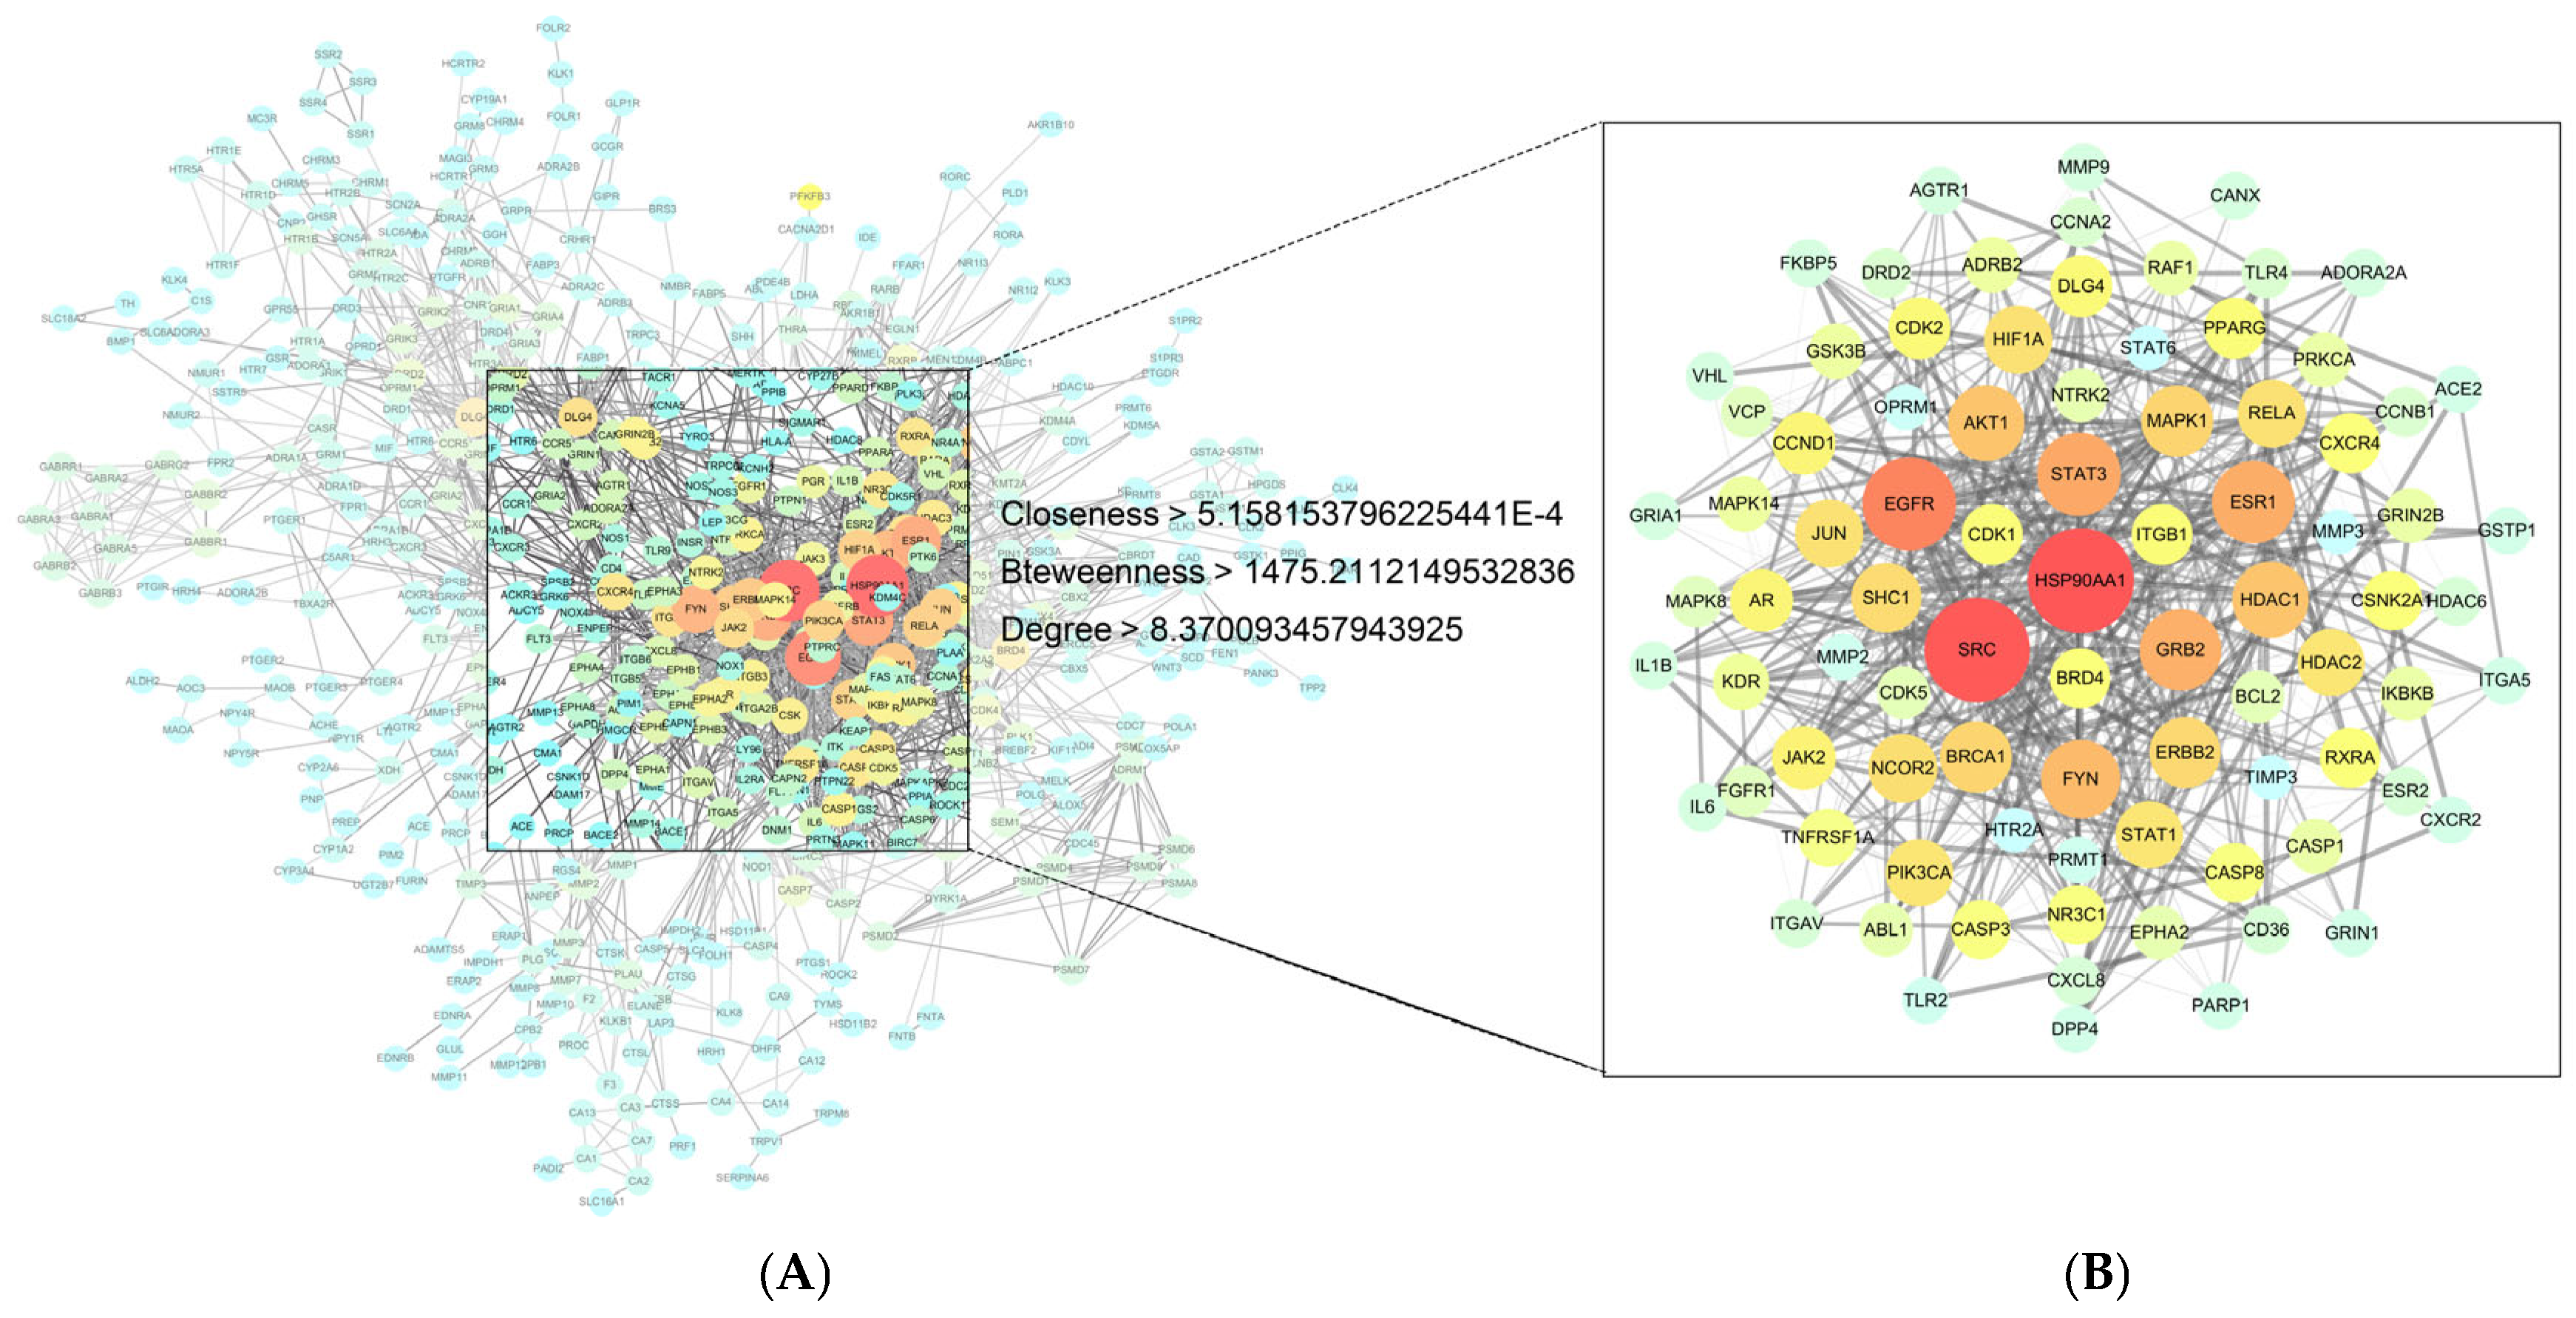
23] was used to hide the nodes that were not connected to the network, and the rest of the parameters were set by default to export the relevant data. The protein–protein interaction (PPI) network was analyzed using the Centiscape 2.2 plugin in Cytoscape 3.9.1 software, based on the default filters of Closeness (>5.158153796225441 × 10
−4), Betweenness (>1475.2112149532836), and Degree (>8.370093457943925). The core protein target information was obtained, and then, Network Analyzer was used to calculate the node Degree to evaluate the roles of different protein targets and differentiate them with different colors or sizes, respectively.
2.5.4. GO and KEGG Enrichment Analysis
The core protein target information was imported into the Metascape (
https://metascape.org/, accessed on 3 May 2024) database and the DAVID (
https://david.ncifcrf.gov/, accessed on 3 May 2024) database, respectively, and OFFICIAL_GENE_SYMBOL was selected in DAVID to perform gene ontology (GO) biological process analysis and Kyoto encyclopedia of genes and genomes (KEGG) pathway enrichment analysis, respectively. The enrichment results were then visualized using the online bioinformatics platform Microbiosense (
http://www.bioinformatics.com.cn/, accessed on 3 May 2024).
2.5.5. Active Ingredient–Pharmacological Target Network Construction
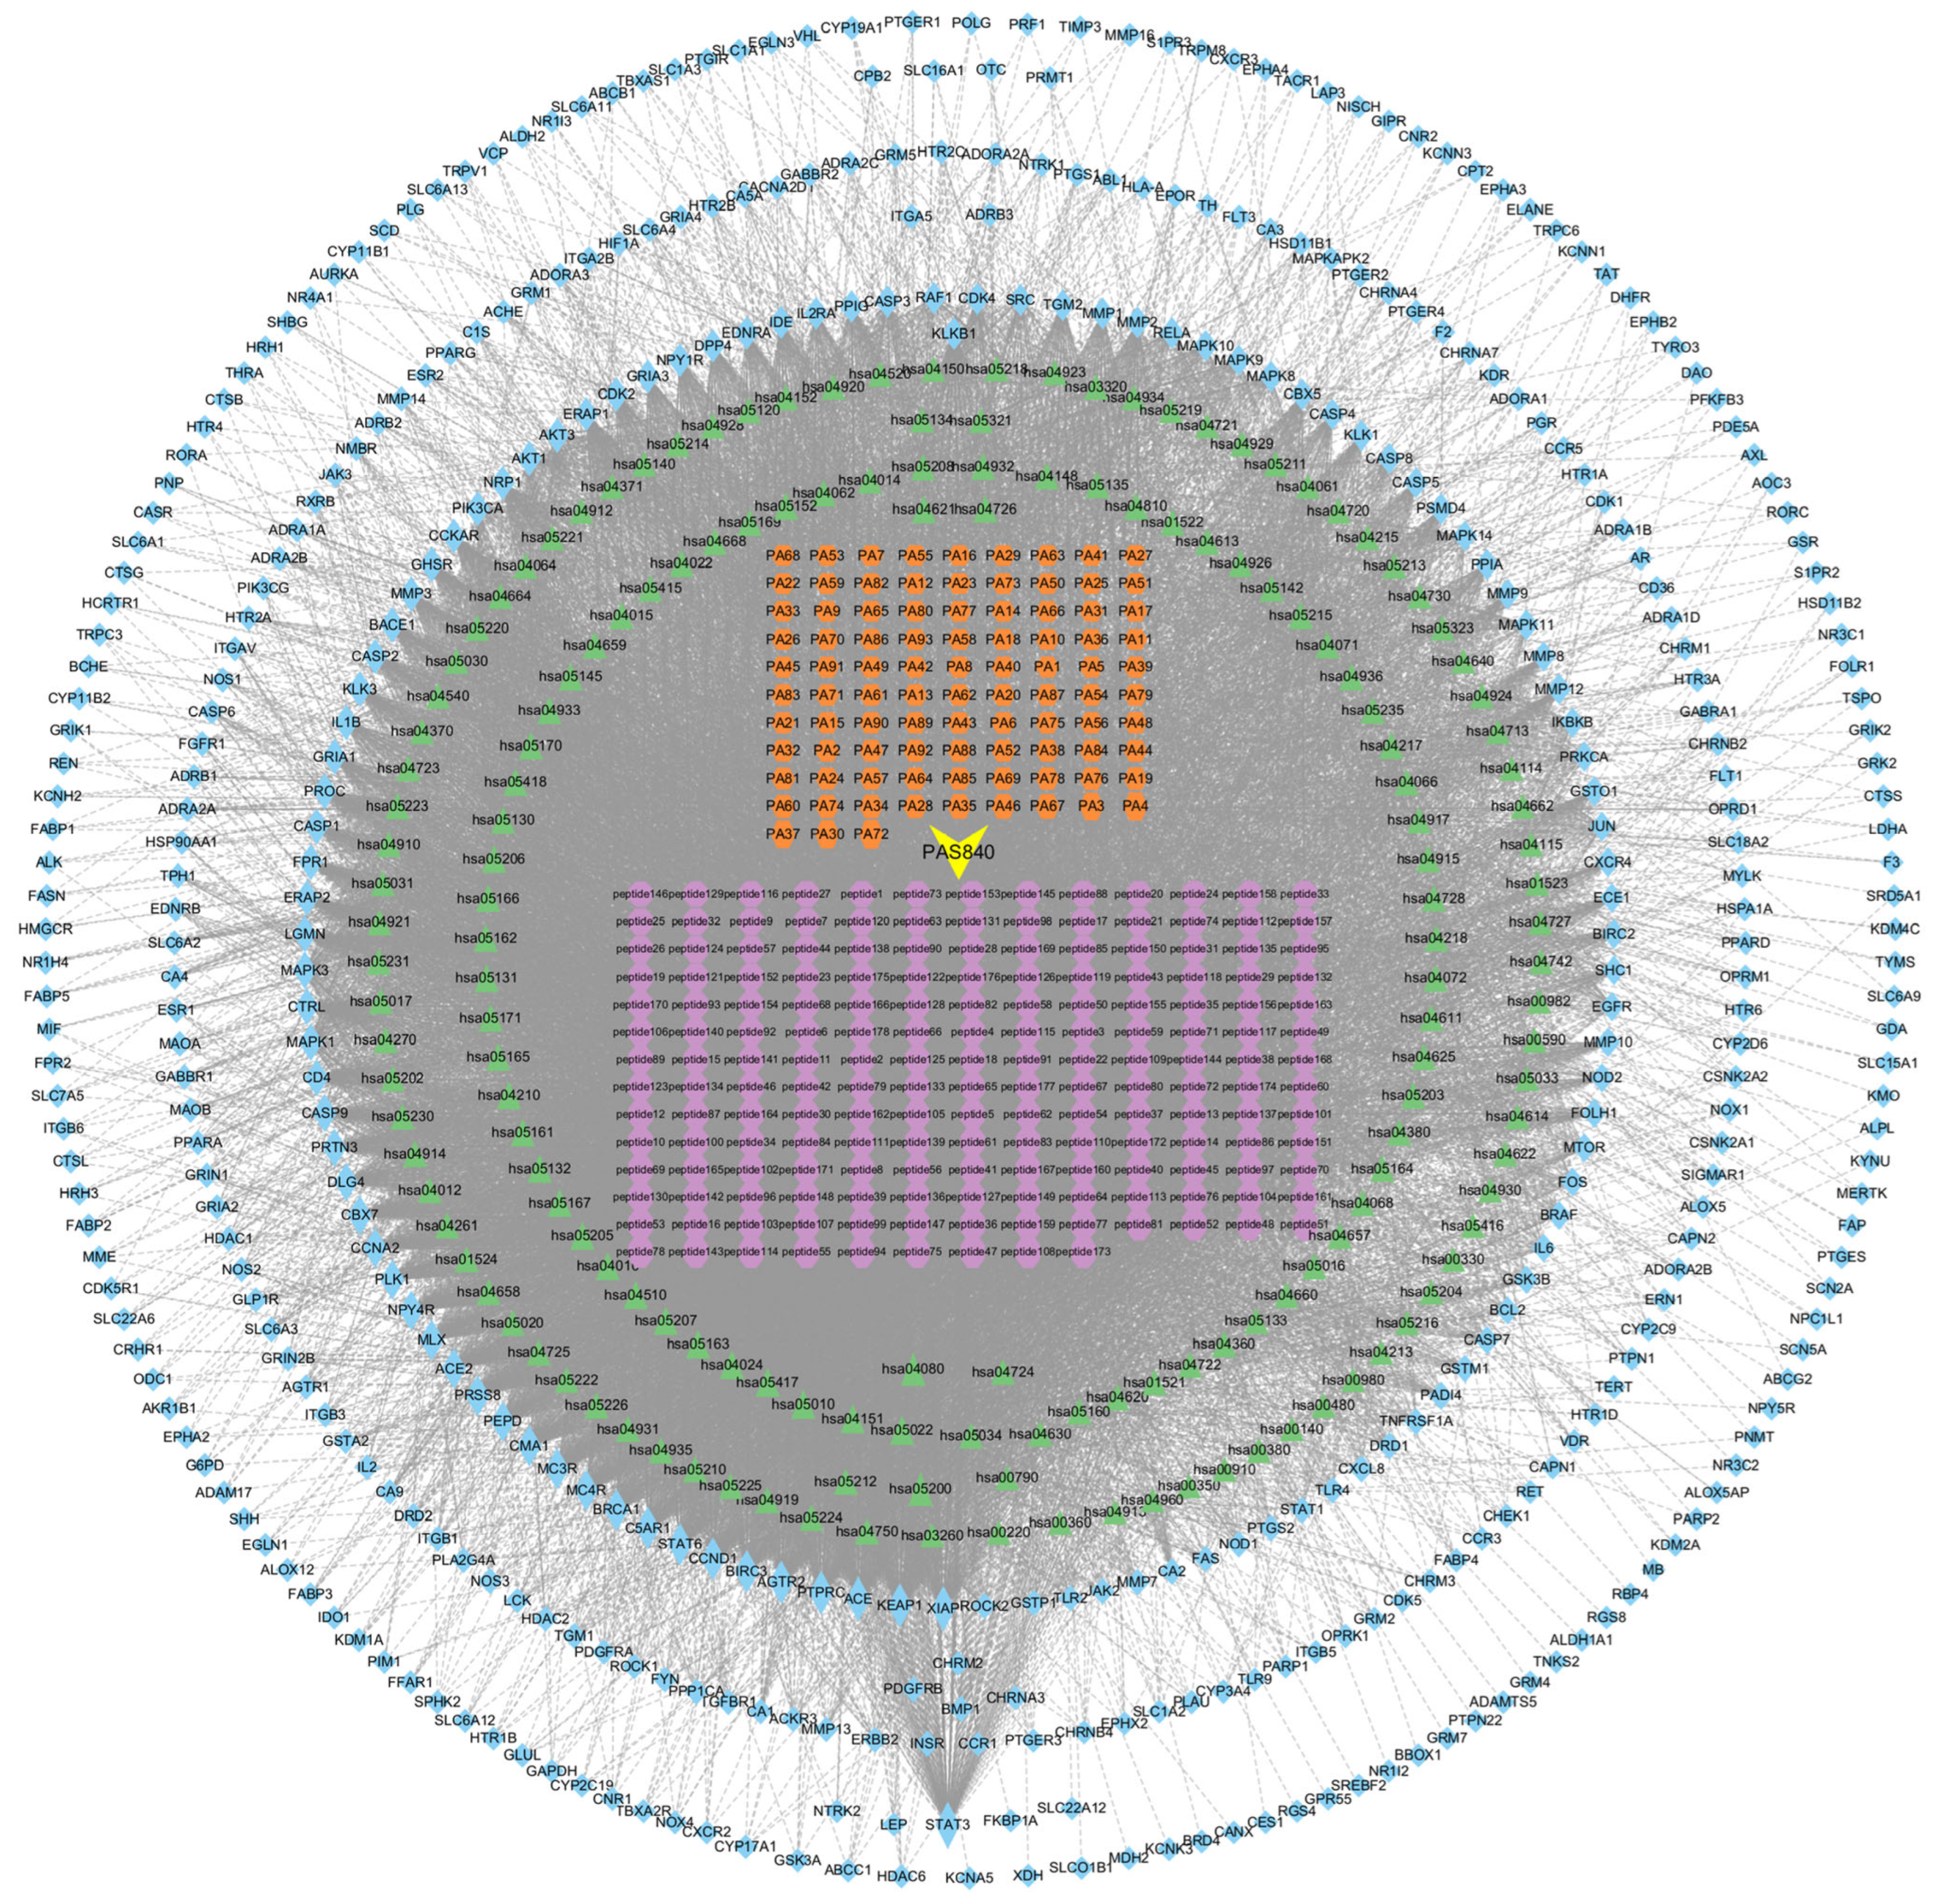
With the obtained information on the constituent targets, disease intersection targets, and KEGG pathway targets, the network worksheet of constituent-pharmacodynamic target–disease pathway was created. The information was integrated into a Tape file, and the data were finally imported into the Cytoscape 3.9.1 software to construct the constituent-pharmacodynamic target–disease pathway network diagram. At the same time, Centiscape 2.2, a plug-in for Cytoscape 3.9.1, was utilized to calculate the node Degree values to evaluate the relationships among the sample components, pharmacodynamic targets, and disease pathways.
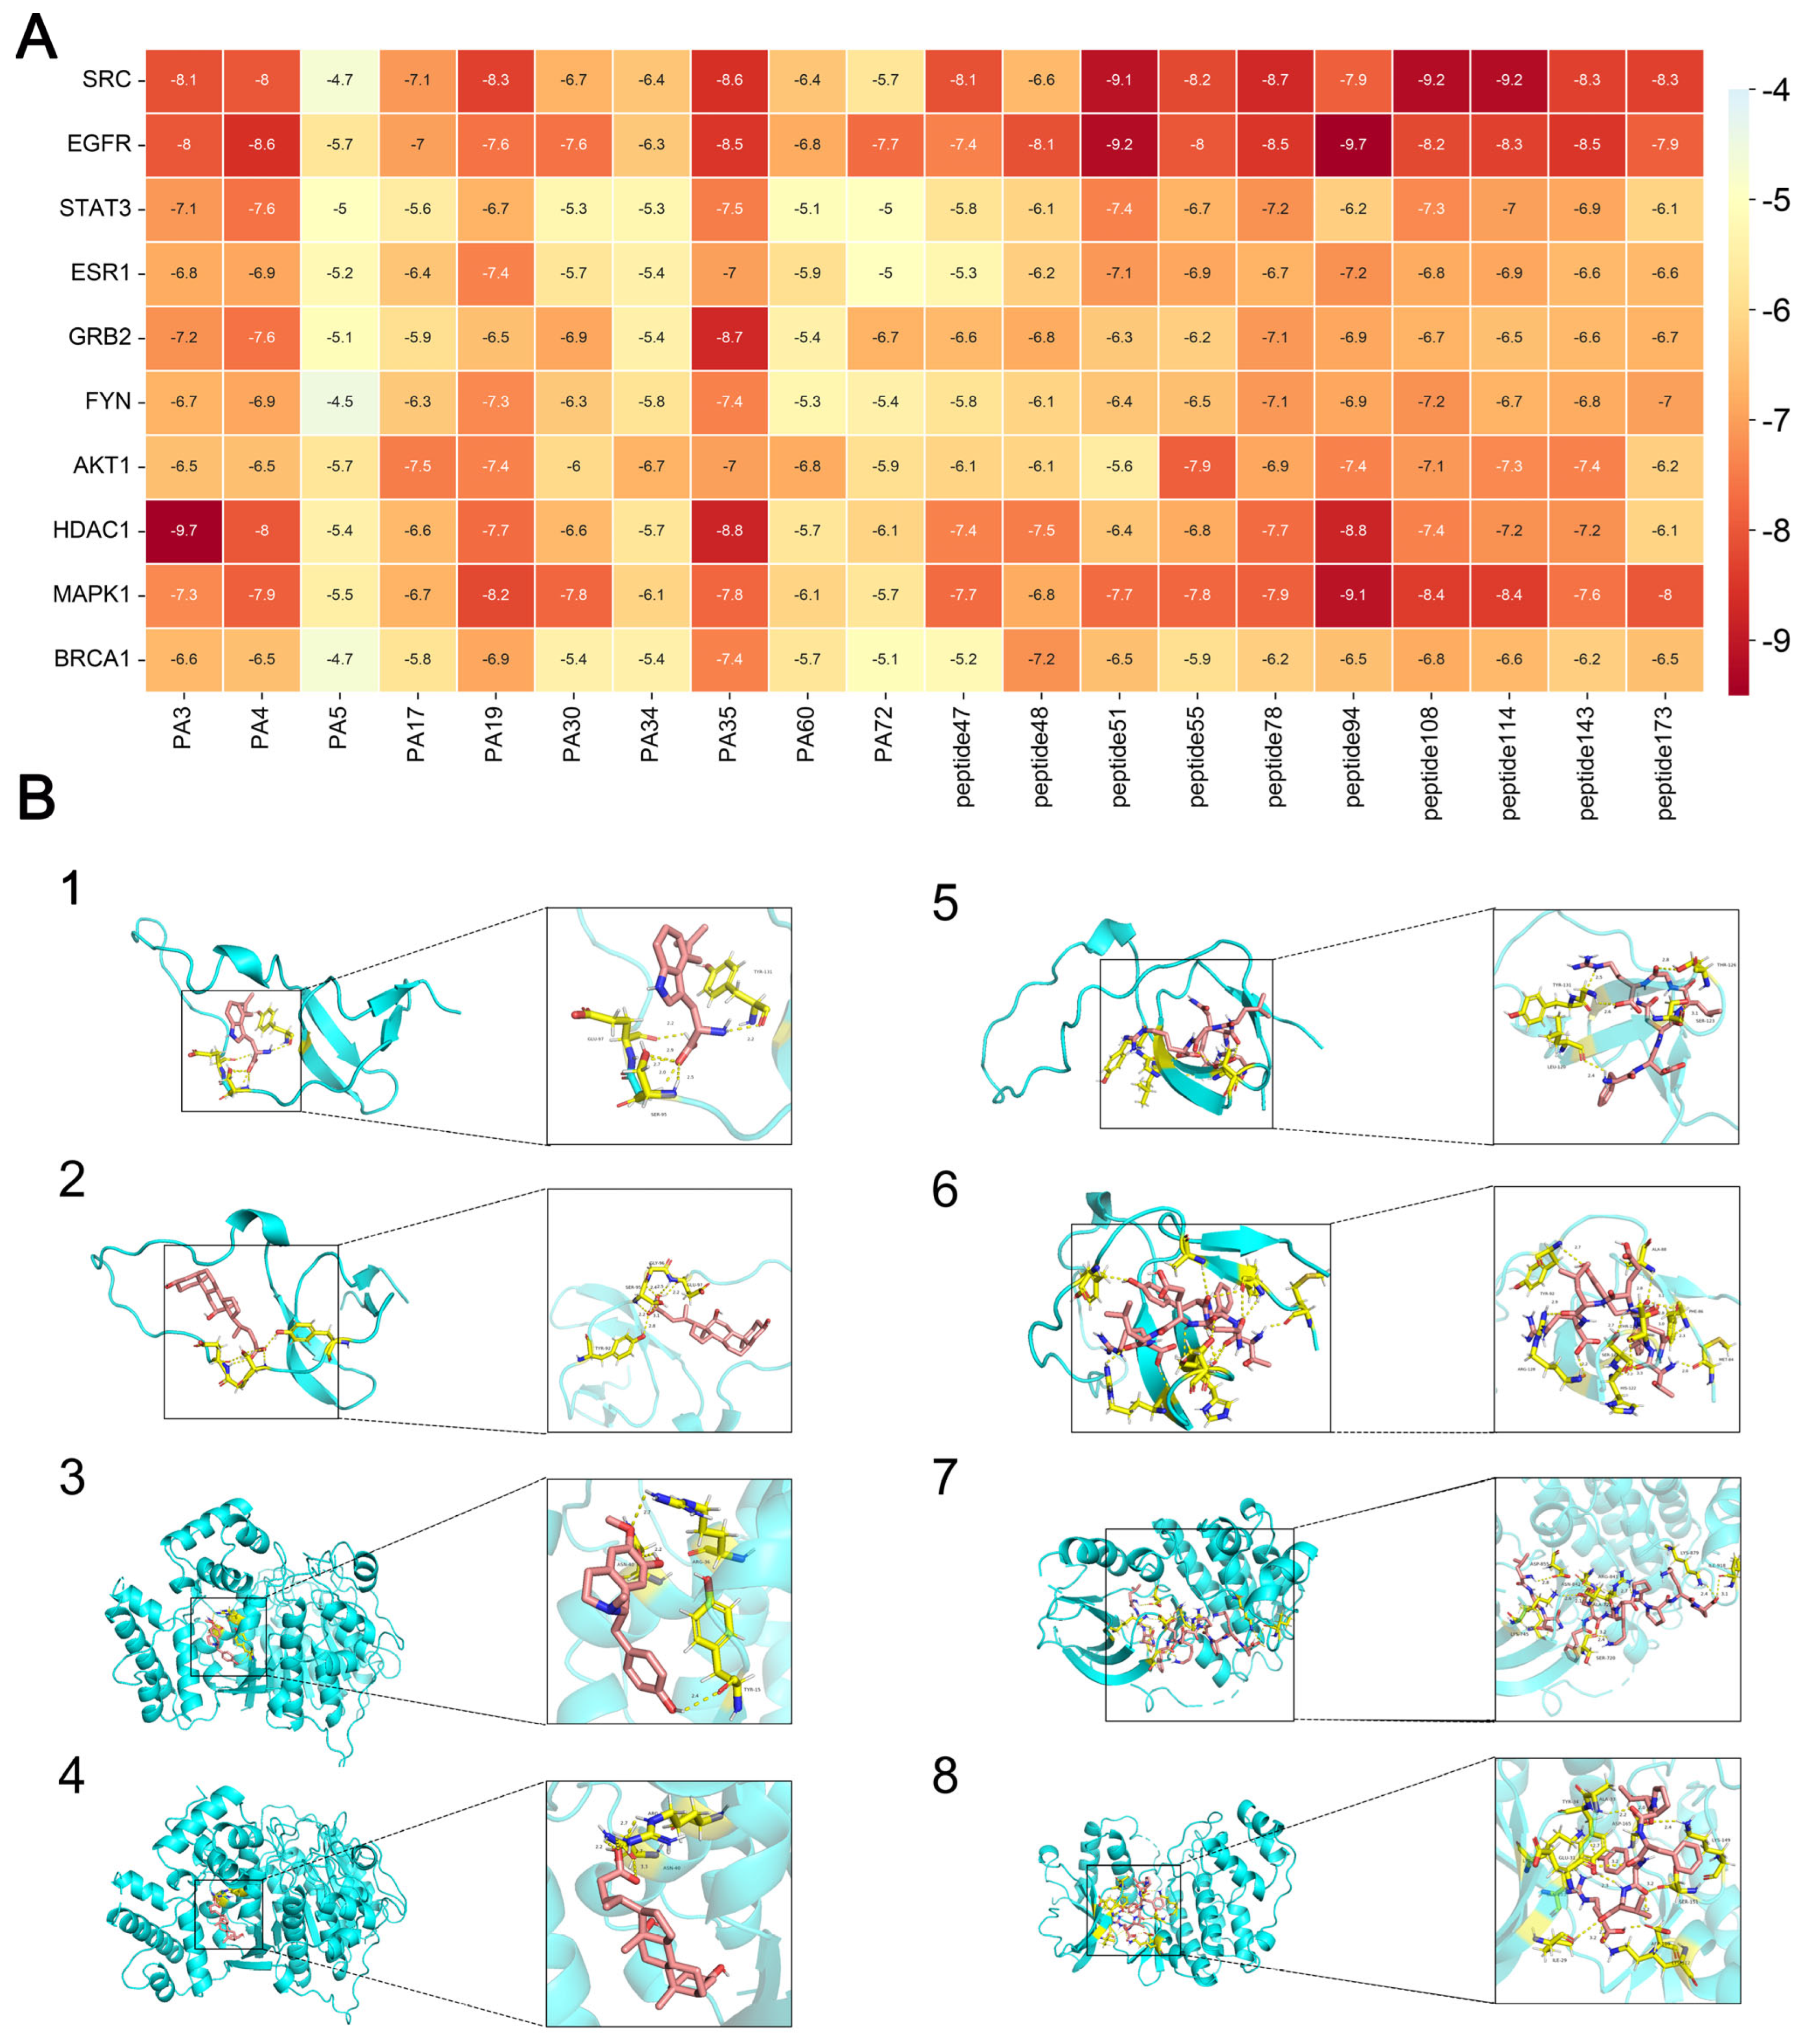
2.5.6. Molecular Docking
To verify the binding activity between core target proteins and active ingredients, molecular docking was performed using the software AutoDock Vina 1.5.7 [
24]. The molecular docking was performed for the target proteins with the highest degree of association screened in the PPI network and the corresponding active ingredients. The structure files of the target proteins and active ingredients were obtained through the PDB (
https://www.rcsb.org/, accessed on 8 May 2024) database. The search space volume was >27,000 Angstrom
3 (see FAQ) (use random seed files to refer to the raw data), and the affinity value was recorded. Then, the proteins were de-watered and de-liganded using PyMoL 4.6.0 software, and the active sites were selected for molecular docking centered on the original ligands of the target proteins. And the PyMoL software was selected to obtain the visualization results.
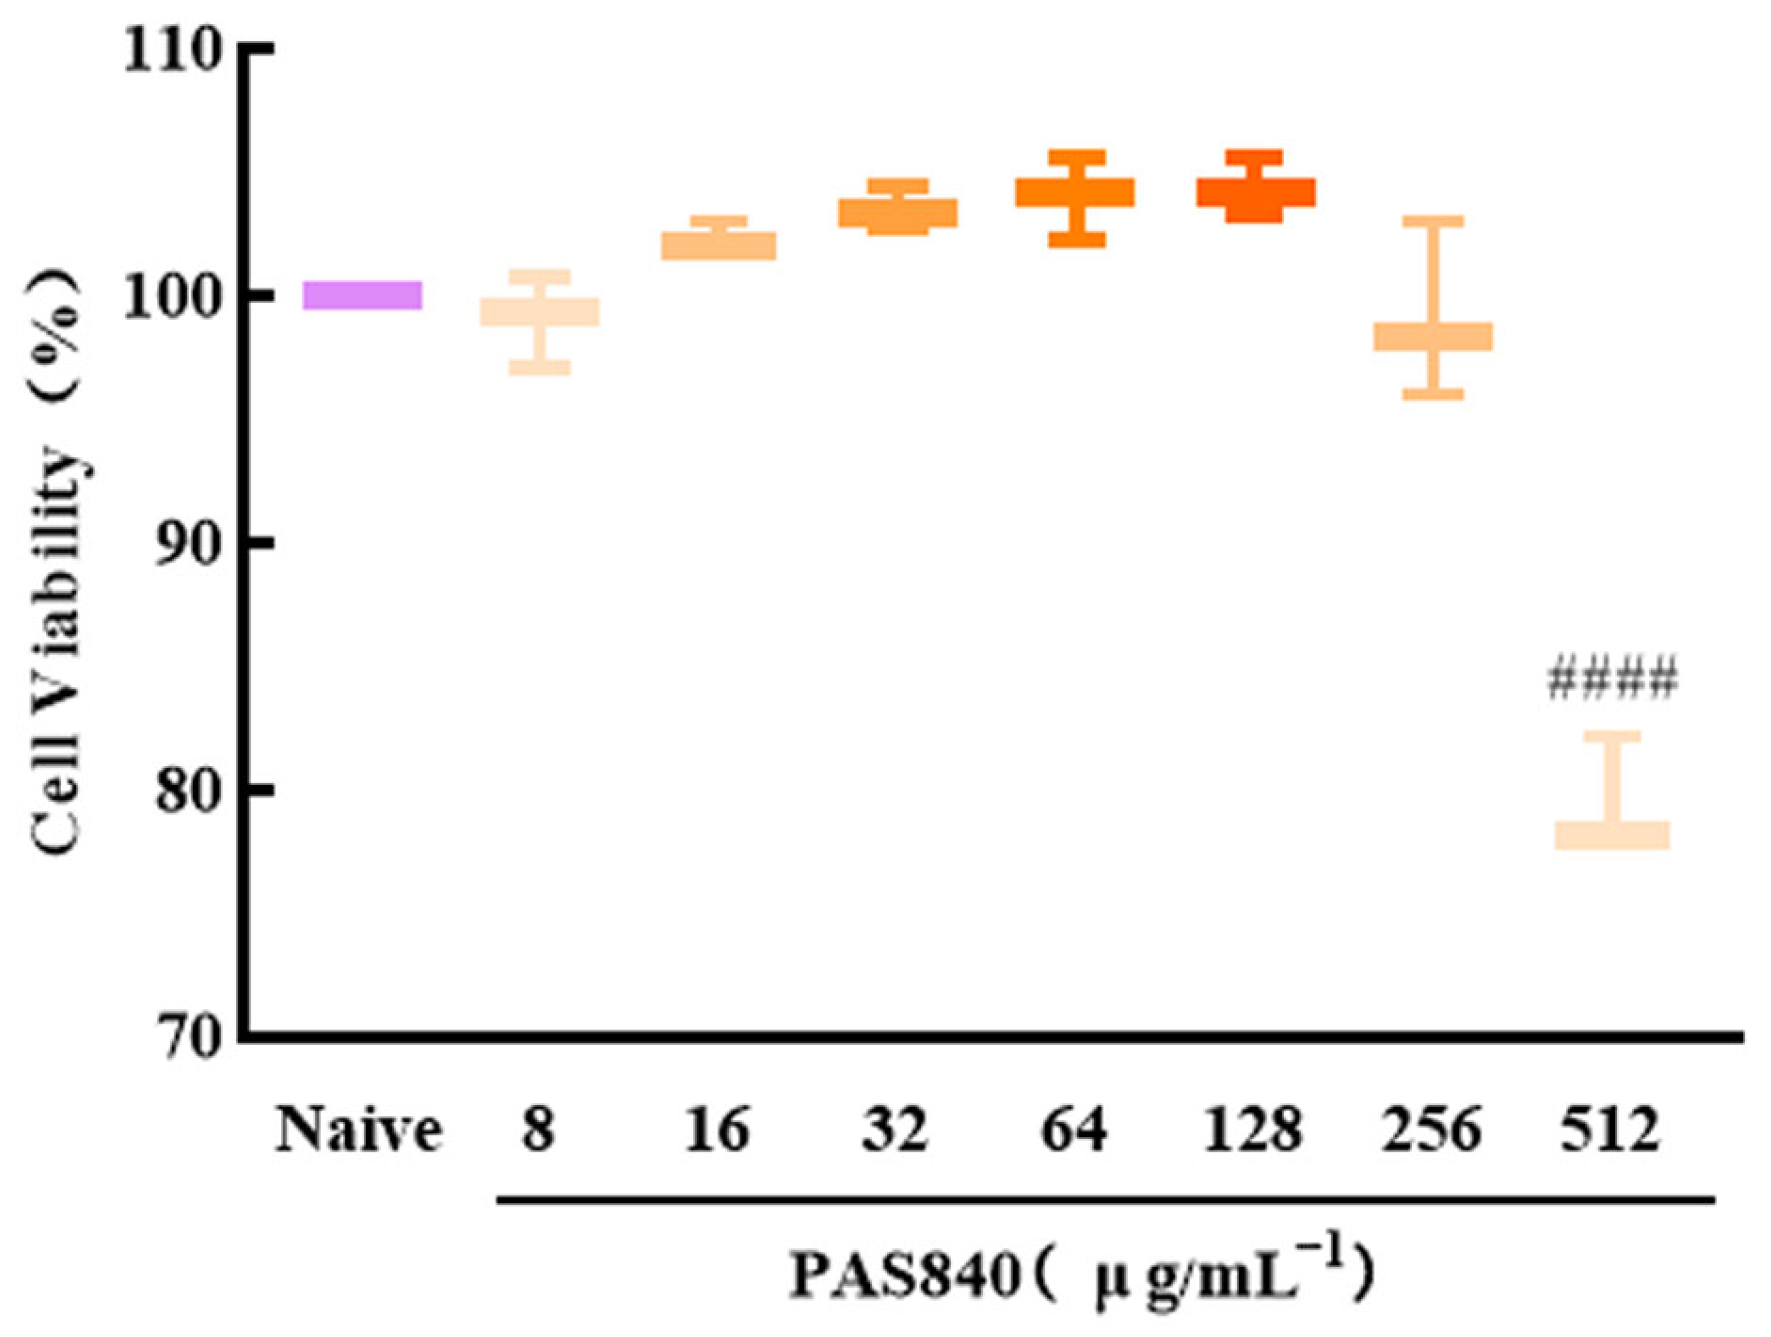
2.6. Effect of PAS840 on the Viability of PC12 Cells
PC12 cells in the logarithmic growth phase were harvested and subsequently diluted to form a cell suspension with a density of 1 × 10⁵ cells/mL. The resulting cell suspension was then inoculated into 96-well plates, with 100 μL of the suspension per well. The plates were cultured at 37 °C in an environment containing 5% CO2 for 24 h. After the initial incubation, 50 μL of PAS840 medium at final concentrations of 8, 16, 32, 64, 128, 256, and 512 μg/mL were added to the respective wells. In the naive group, specifically, only 50 μL of the medium were introduced. The cells were then incubated for an additional 24 h. Subsequently, the cell morphology was observed under an inverted microscope, and pictures were taken for documentation. Next, 10 μL of Cell Counting Kit-8 (CCK-8) were added to each well. After a reaction period of 1 h, the absorbance (OD) value of each group at 450 nm was measured using a multifunctional microplate reader. Based on these measurements, the survival rate of the cells (%) was calculated, thereby determining the safe dosage of PAS840.
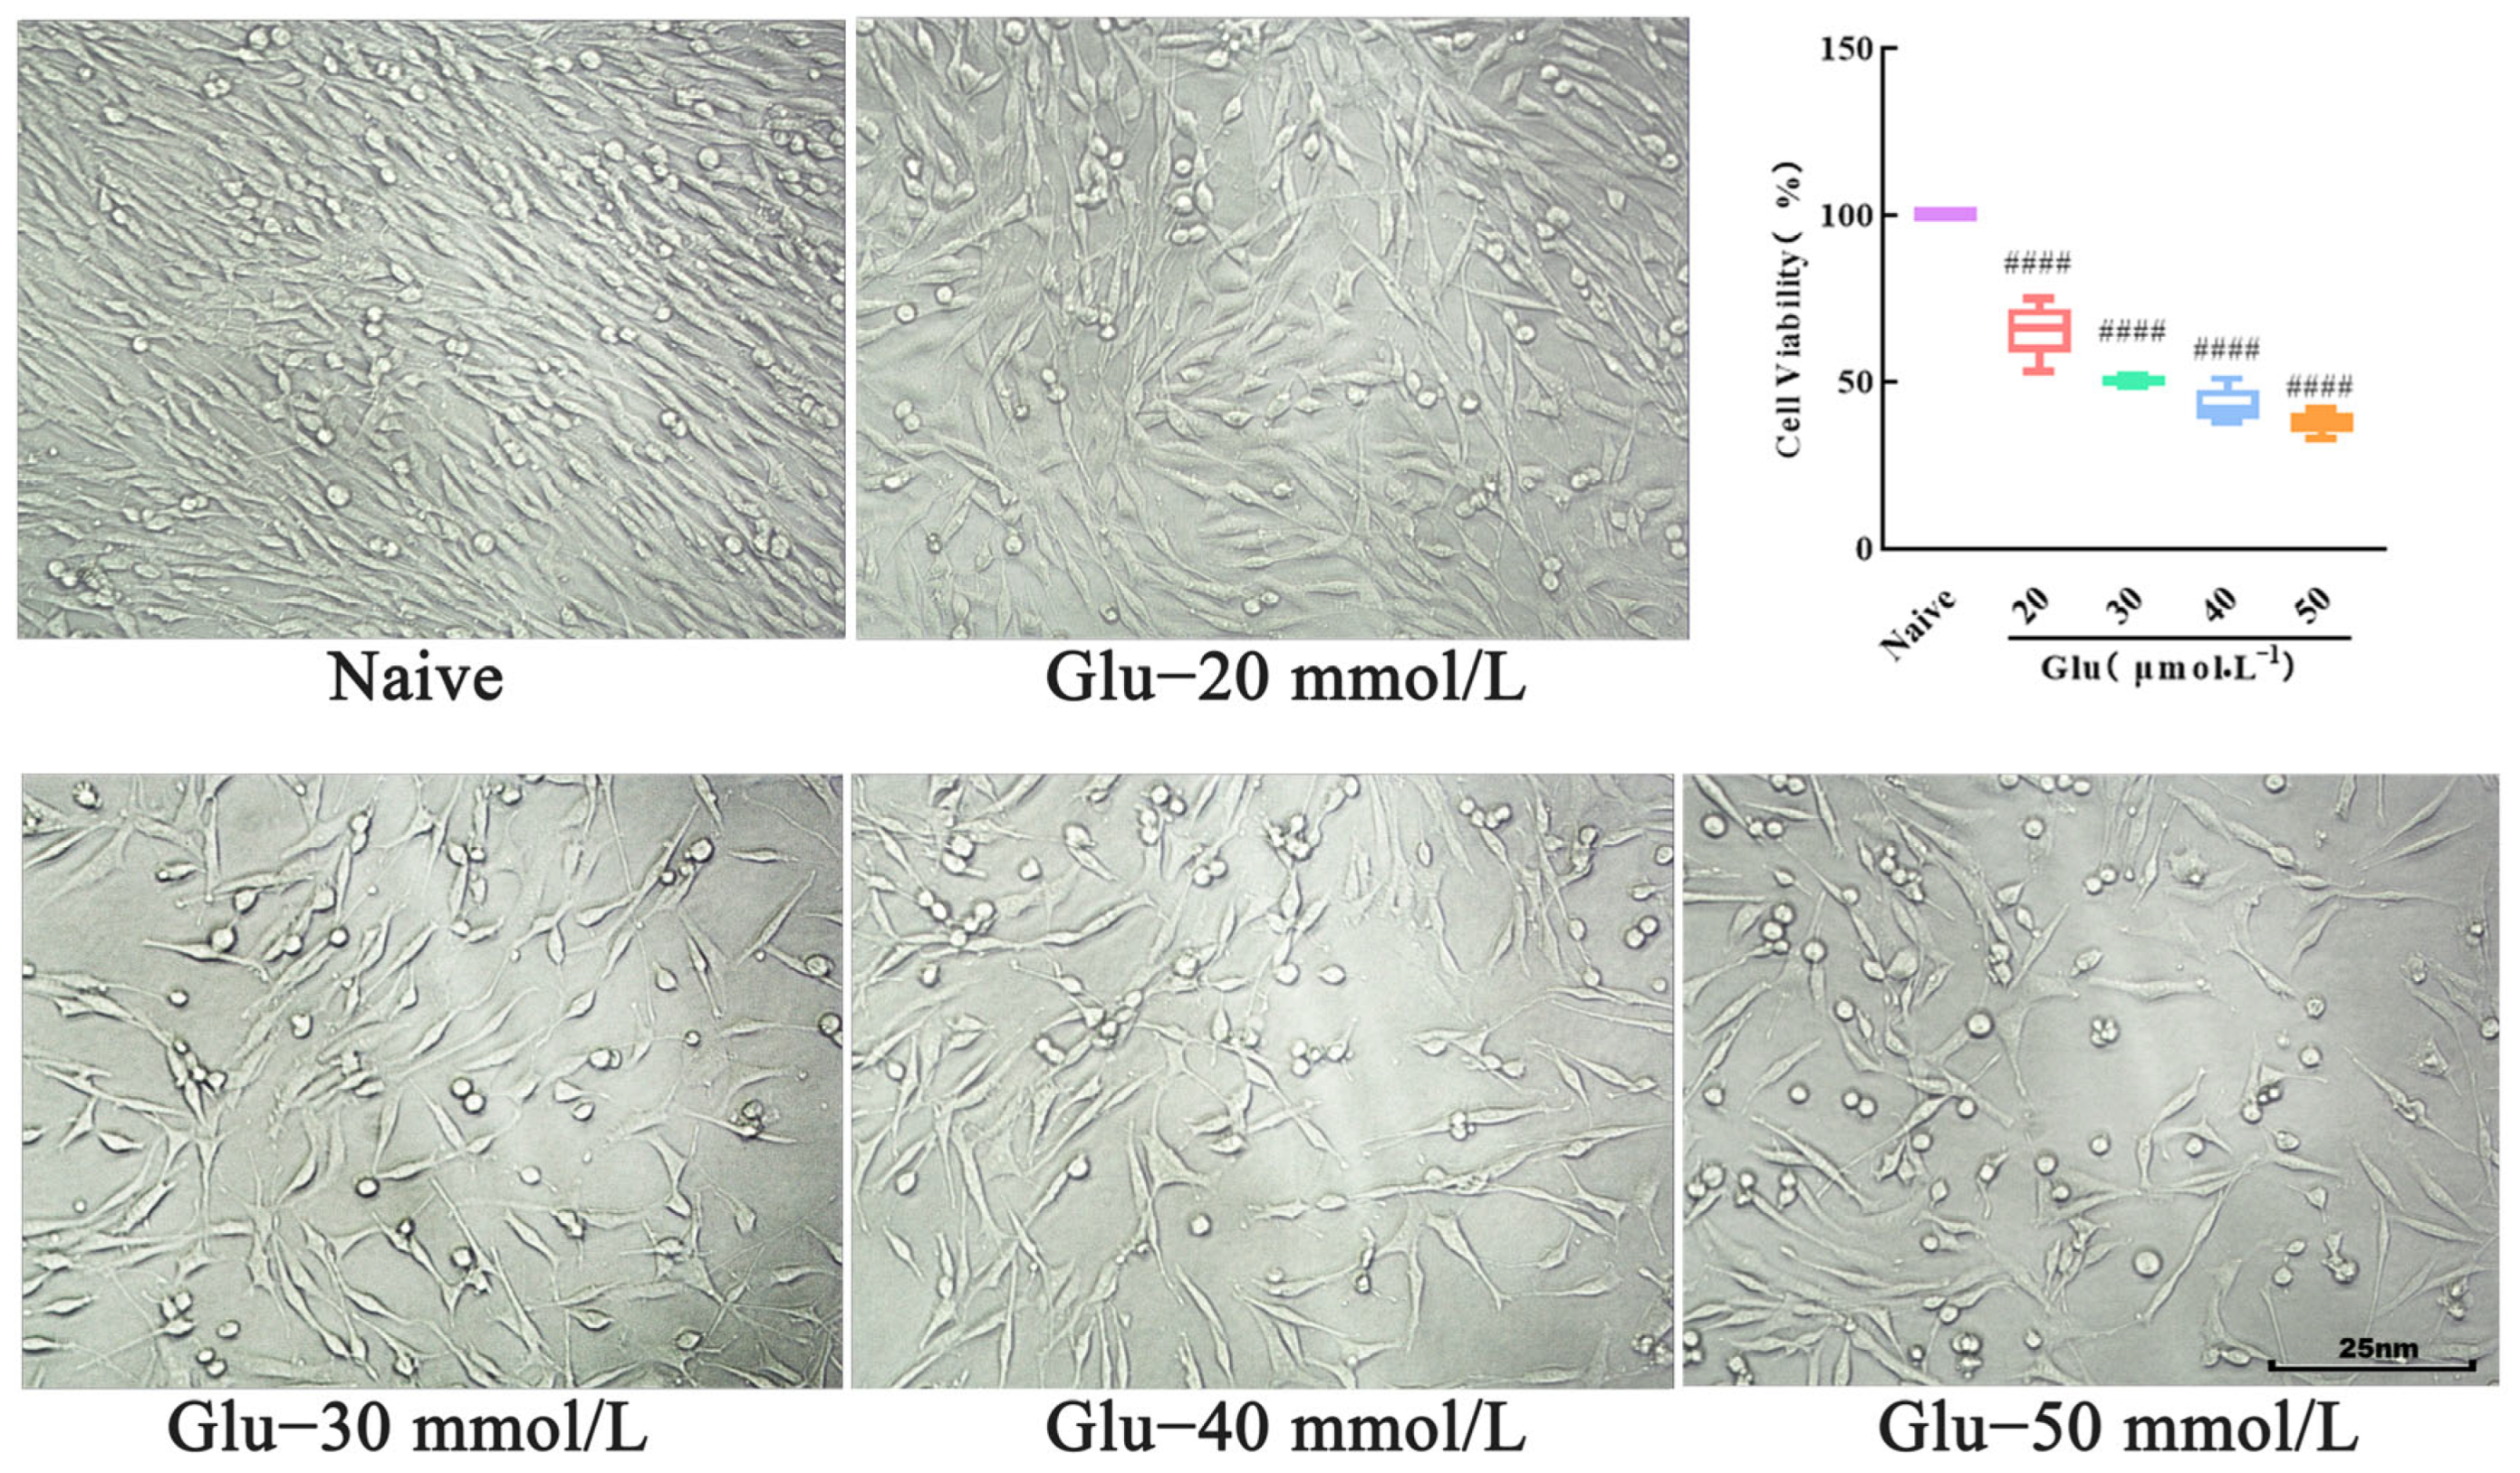
2.7. Establishment of PC12 Cell Injury Model
Cultured and inoculated cells were placed into 96-well plates, as described in
Section 2.6. The cell morphology was observed under an inverted microscope and image. Subsequently, in the model group, Glu solutions at concentrations of 20, 30, 40, and 50 mmol/L were added, and in the naive group, an equal volume of PBS was added. After a further 24 h incubation, the cell morphology was observed under the inverted microscope, and pictures were taken for recording. Then, 10 μL of CCK-8 were added to each well. After a 1 h reaction, the OD value of each group was measured at 450 nm using a multifunctional microplate reader. The cell viability (%) was calculated to determine the appropriate Glu concentration for modeling purposes.
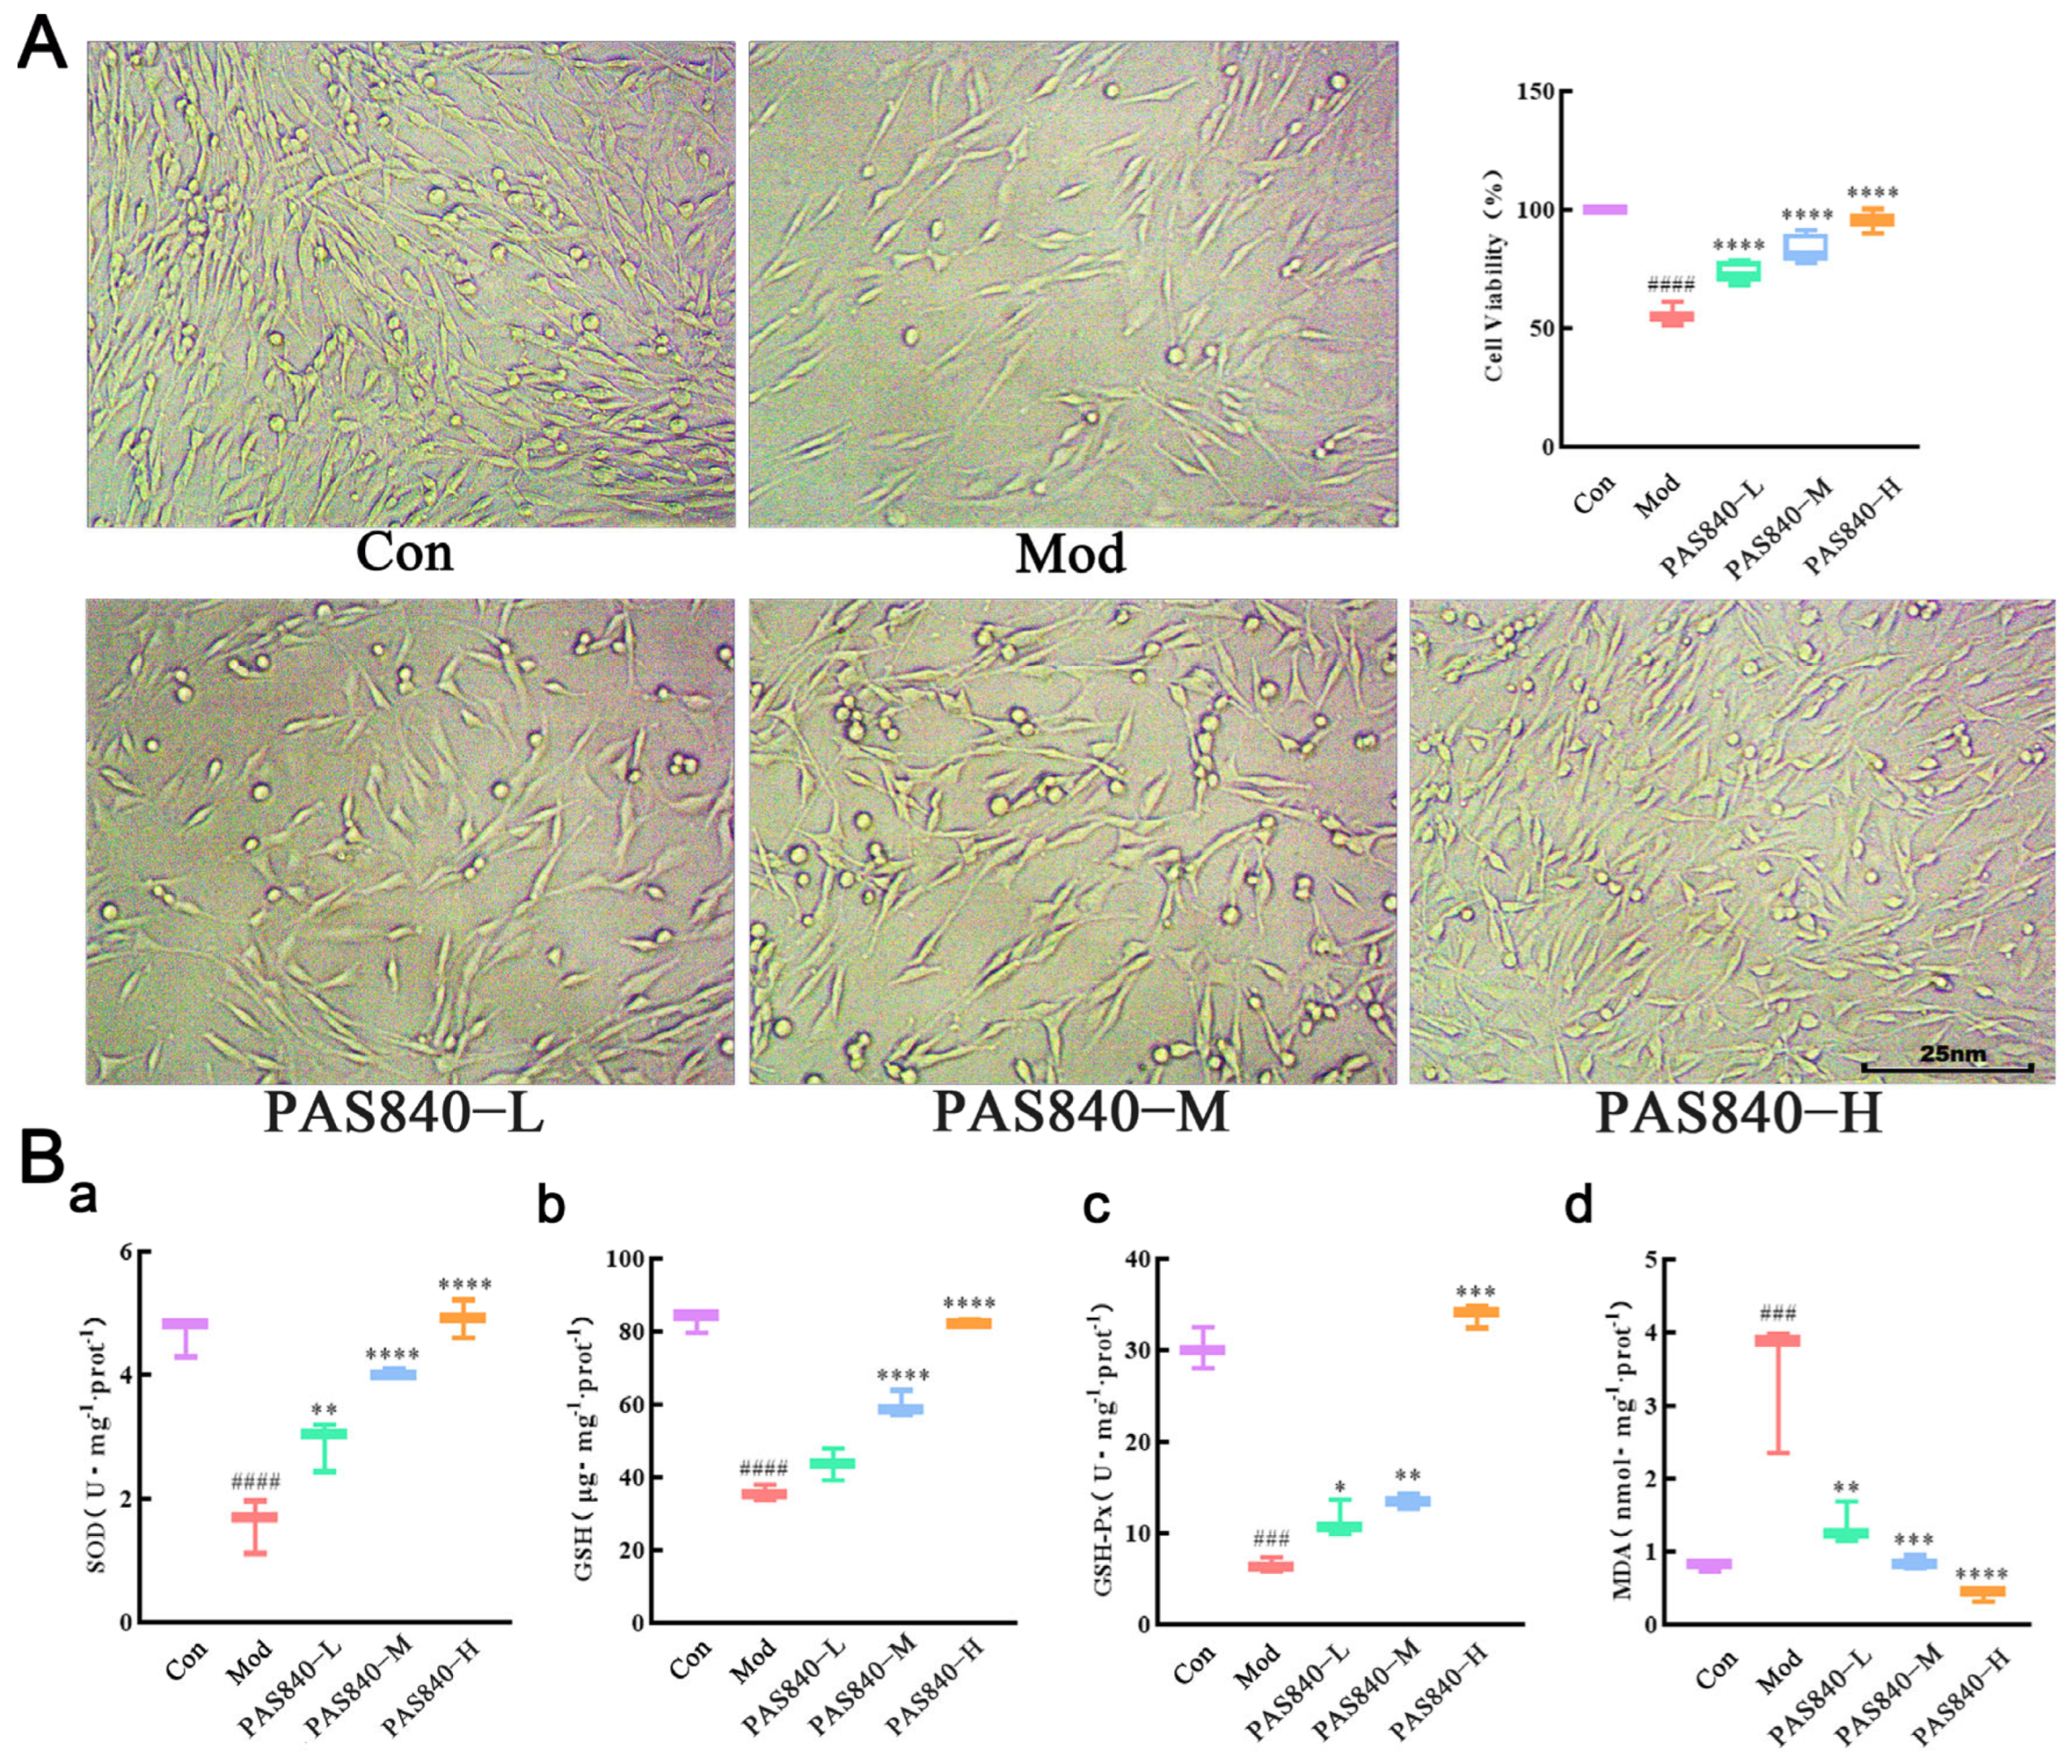
2.8. Effect of Experimental Grouping and PAS840 on the Survival Rate of Damaged Cells
The cells were counted at the logarithmic growth phase in a 96-well plate. The cell density was adjusted to 1 × 10⁵ cells/mL, 100 μL/well. In the 6-well plate, the cell density was adjusted to 3.5 × 10⁵ cells/mL, 2 mL/well, and cultured for 24 h at 37 °C with 5% CO2, then grouped into different treatments: PAS840-L, PAS840-M, and PAS840-H. After the culture was completed, the cell morphology was observed under an inverted microscope and imaged for recording, and the OD values of each group at 450 nm were detected by a multifunctional microplate reader after adding the CCK-8 reaction for 1 h. The survival rate (%) of the cells was calculated.
2.9. Effects of PAS840 on SOD, GSH-Px, GSH, and MDA Levels in Damaged Cells
After the cells were cultured and grouped as described in item 2.8, the media solution was removed, and the cells from each group were collected. Subsequently, 100 μL of cell lysate were added to ensure complete cell lysis. The mixture was then centrifuged at 1200 rpm/min for 5 min, and the supernatant was collected. The samples were then detected following the kit instructions, with the OD values of the samples from each group being measured by a multifunctional microplate reader at the specified wavelength. Record the detected OD values, and analysis should be performed in accordance with the kit instructions (the test instruction manual of the kit has been uploaded to the
Supplementary Materials Figures S1–S4).
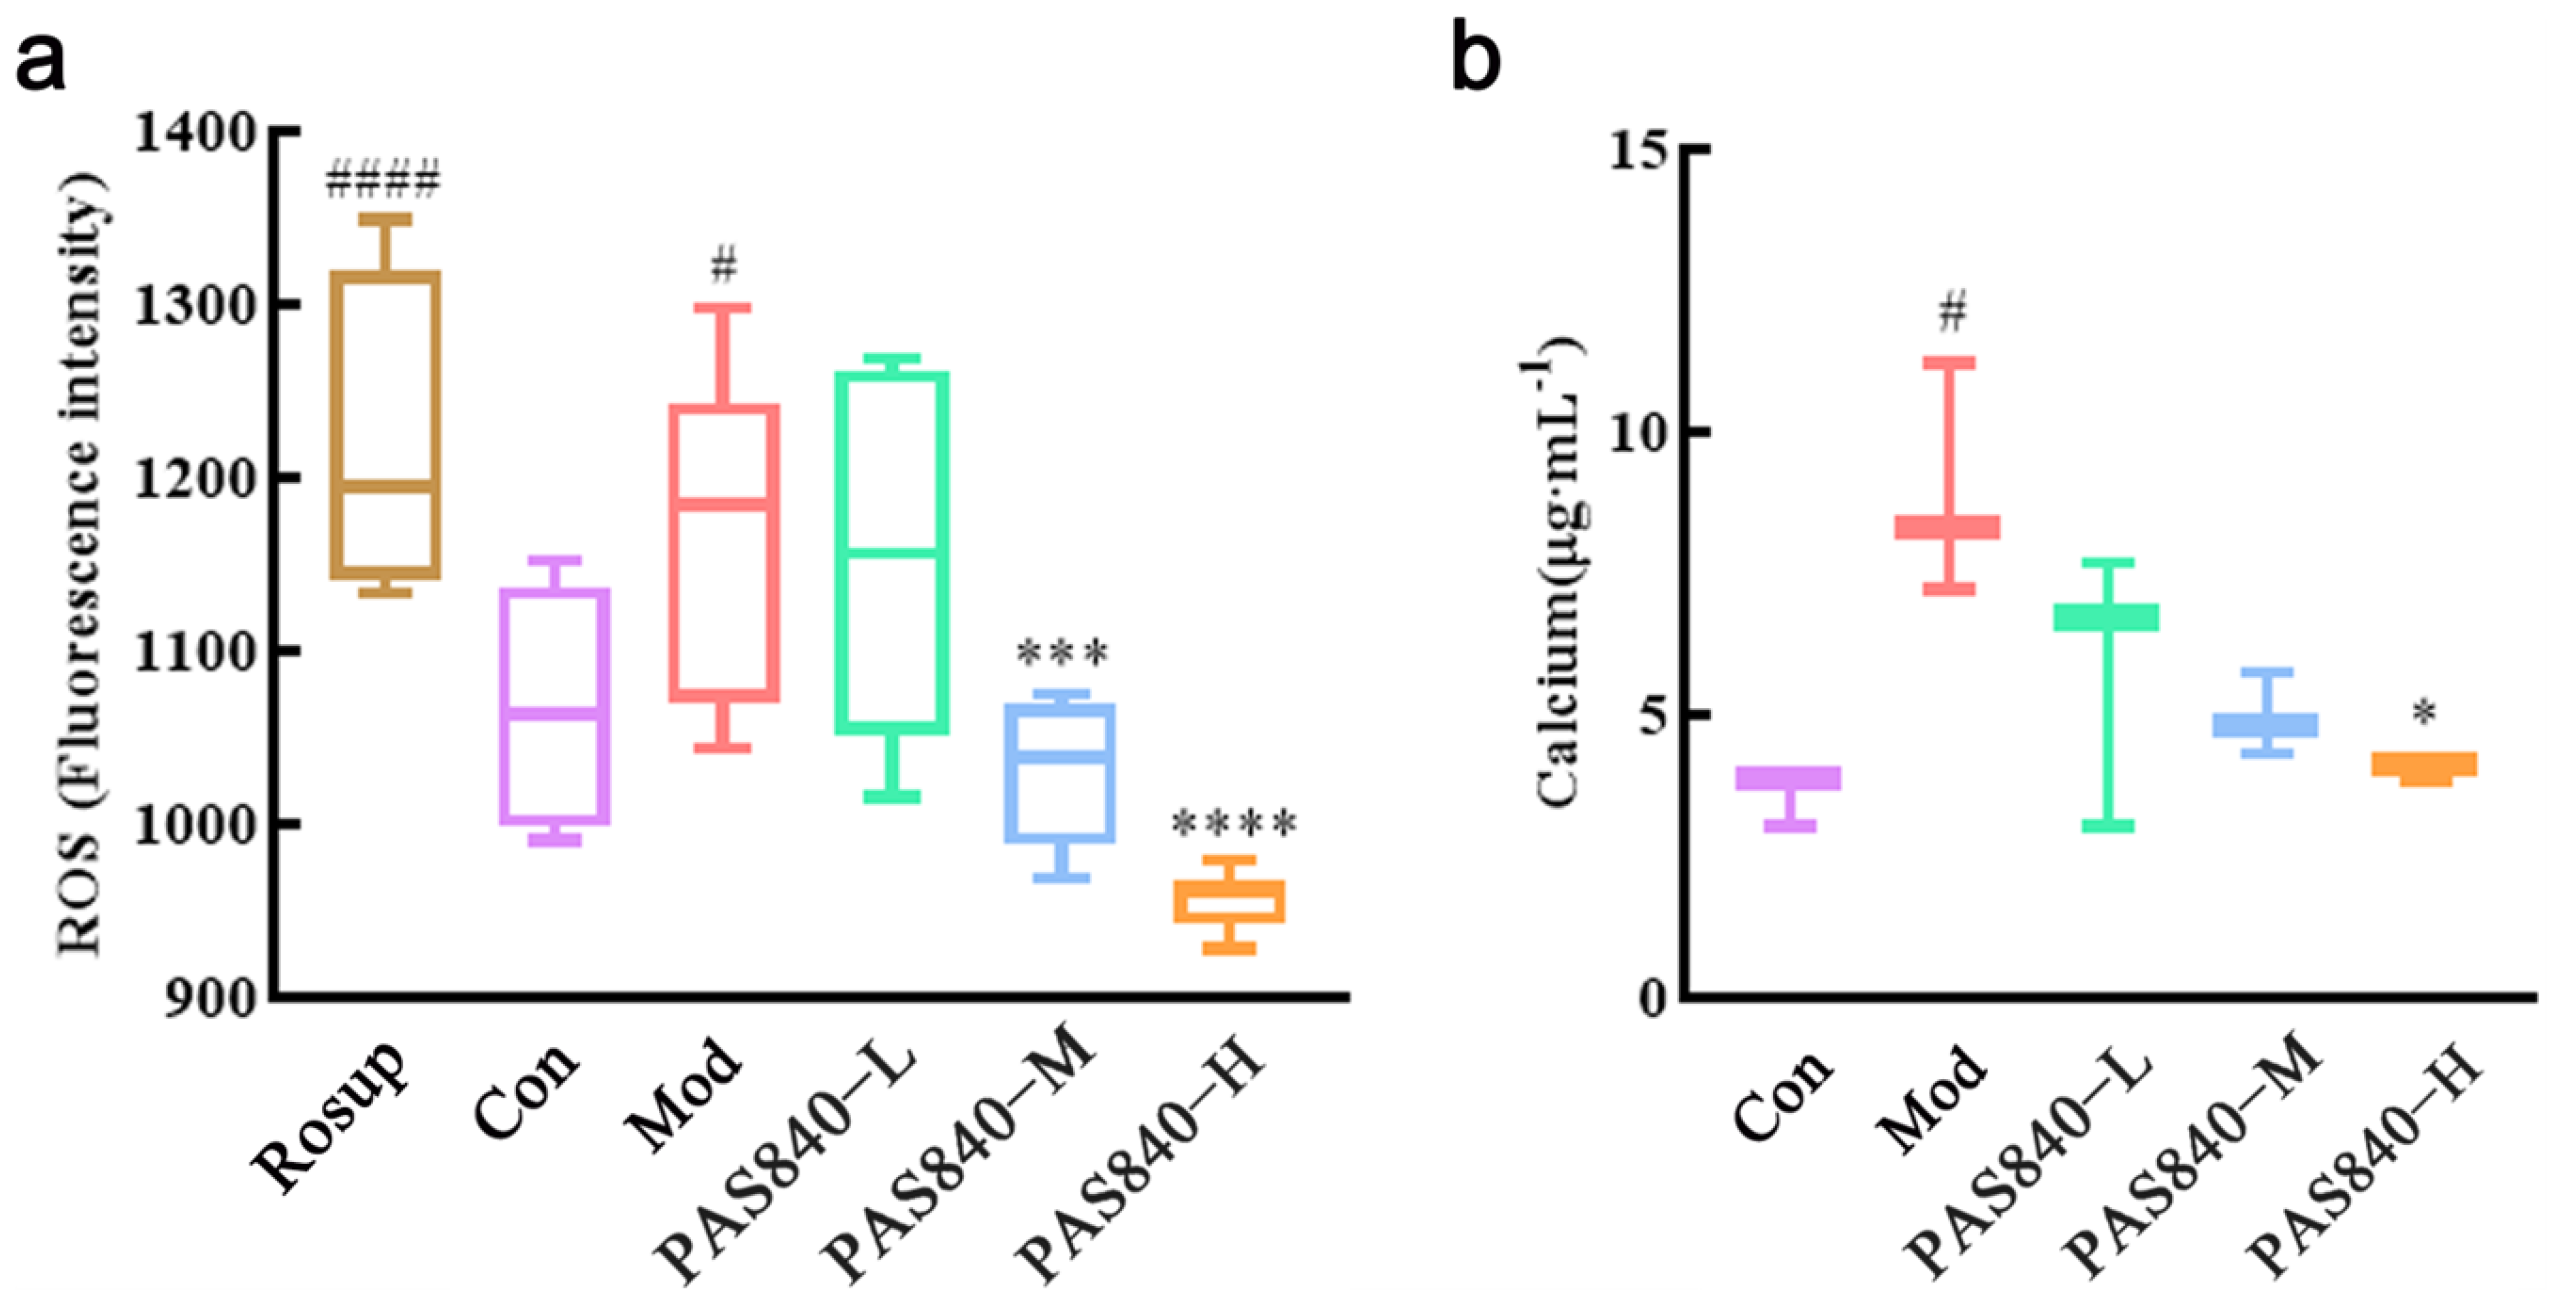
2.10. Effect of PAS840 on ROS in Damaged Cells
The DCFH-DA probe was employed to facilitate the entry of the probe into the cell membrane and interact with intracellular ROS, thereby generating strongly fluorescent DCF. The fluorescence intensity is positively correlated with the production of ROS. Cells were cultured and grouped according to “2.8” (ROS-positive control—Rosup group was set at the same time). Then, the culture medium was removed, 1.5 mL DCFH-DA with a final concentration of 10 μmol/L was added to each well, and incubated in an incubator at 30 °C for 20 min under dark light. The well plates were removed and mixed every 5 min. Make the probe fully contact the cell. After incubation, the DCFH-DA was discarded, and the cells in each group were washed twice with serum-free 1640. Then, the cell suspension was collected and prepared. One hundred μL of cell suspension were taken from each group into the 96-well plates. The fluorescence intensity (ROS-RFU) of the ROS in each group at an excitation wavelength of 488 nm and an emission wavelength of 525 nm was detected by a multifunctional microplate reader (the test instruction manual of the kit has been uploaded to the
Supplementary Materials Figure S5).
2.11. Effect of PAS840 on Ca2+ in Damaged Cells
After the cells were processed according to the culture grouping under “2.8”, remove the medium, collect the cells of each group, and add 150 μL of cell lysate, respectively. Once fully lysed, centrifuge at 1200 rpm/min for 5 min, take 50 μL of supernatant in a 96-well plate, refer to the operation instructions of the Ca
2+ test kit, and add 150 μL of working liquid in the kit to the 96-well plate (the test instruction manual of the kit has been uploaded to the
Supplementary Materials Figure S6). Incubate for 8 min at room temperature and avoid light. Then use a multi-functional enzyme marker to detect the OD value at 575 nm and calculate the Ca
2+ concentration of each group according to the Ca
2+ standard curve.
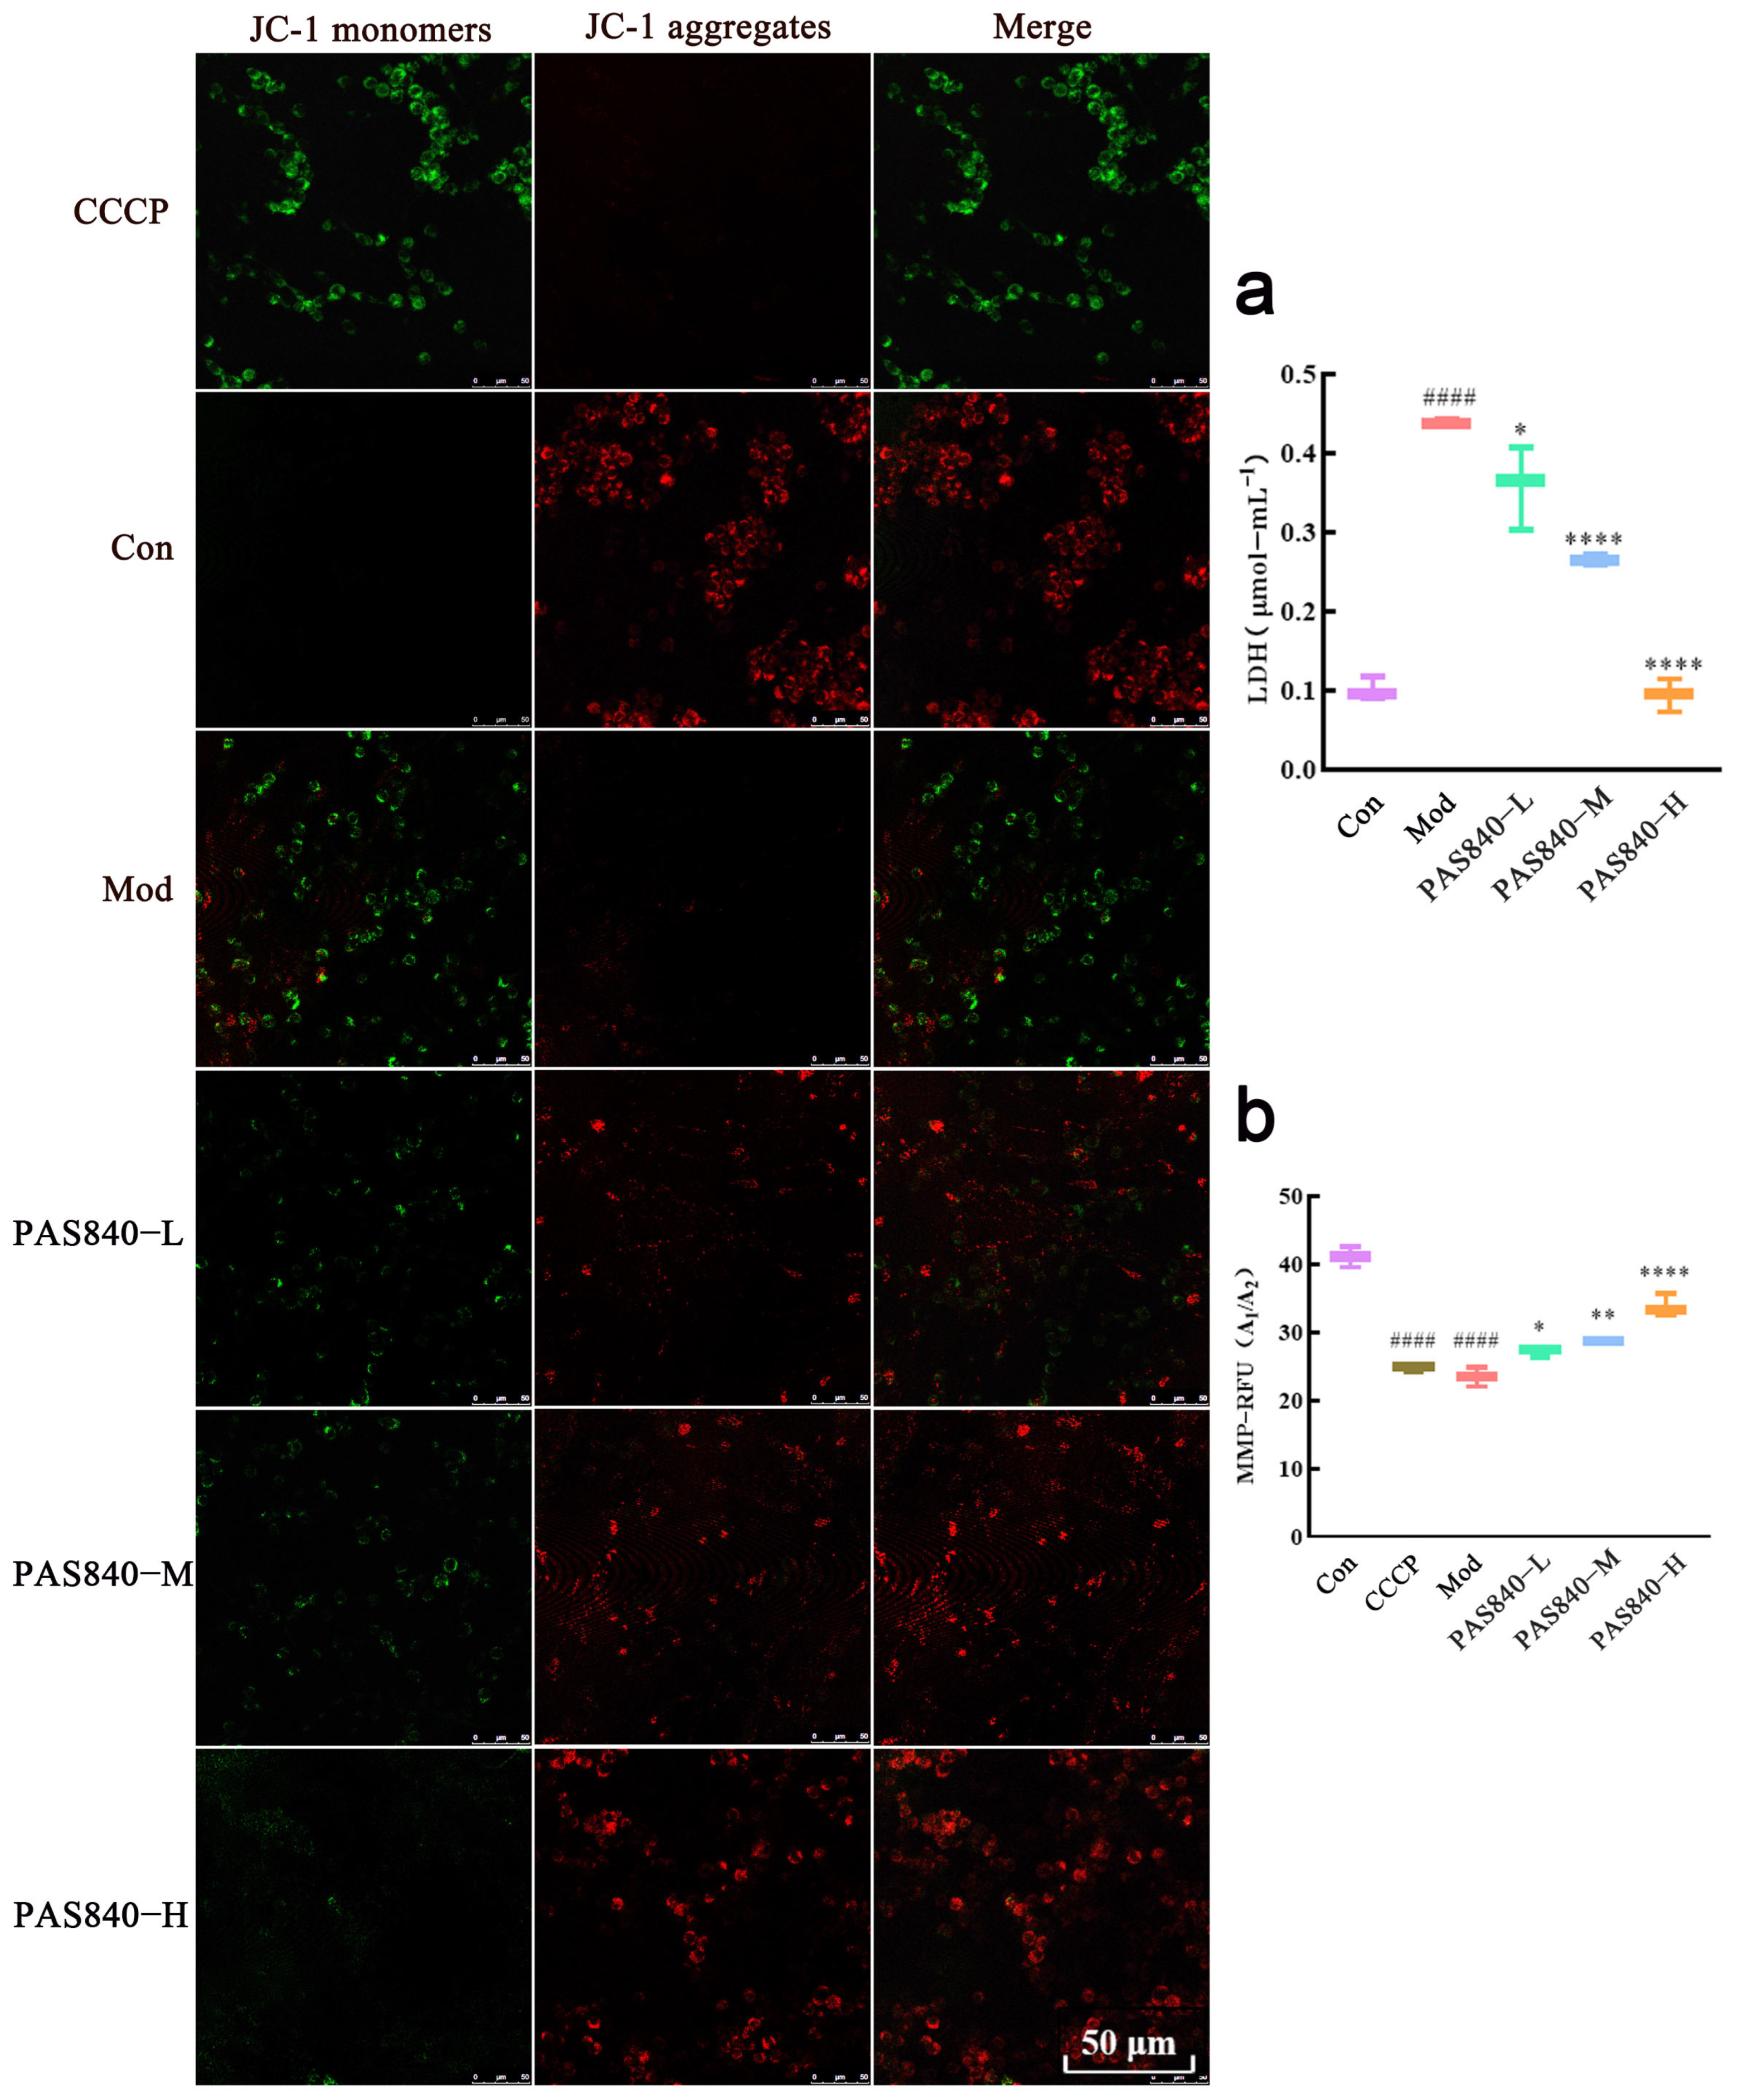
2.12. Effect of PAS840 on the Release of LDH from Damaged Cell Cultures
After the cells were processed according to the culture group under “2.8”, collect the cell culture medium of each group, centrifuge at 1200 rpm/min for 5 min, take 10 μL of supernatant from each group, and add it into a 96-well plate. Follow the instructions of the LDH activity quantitative assay kit (the test instruction manual of the kit has been uploaded to the
Supplementary Materials Figure S7). Then, leave it at room temperature for 3 min and, then, detect the OD value of each group at 450 nm with a multifunctional enzyme marker. After 3 min at room temperature, the OD value of each group was measured by a multifunctional enzyme-labeling instrument at 450 nm. The data were recorded, and the amount of LDH released was calculated.
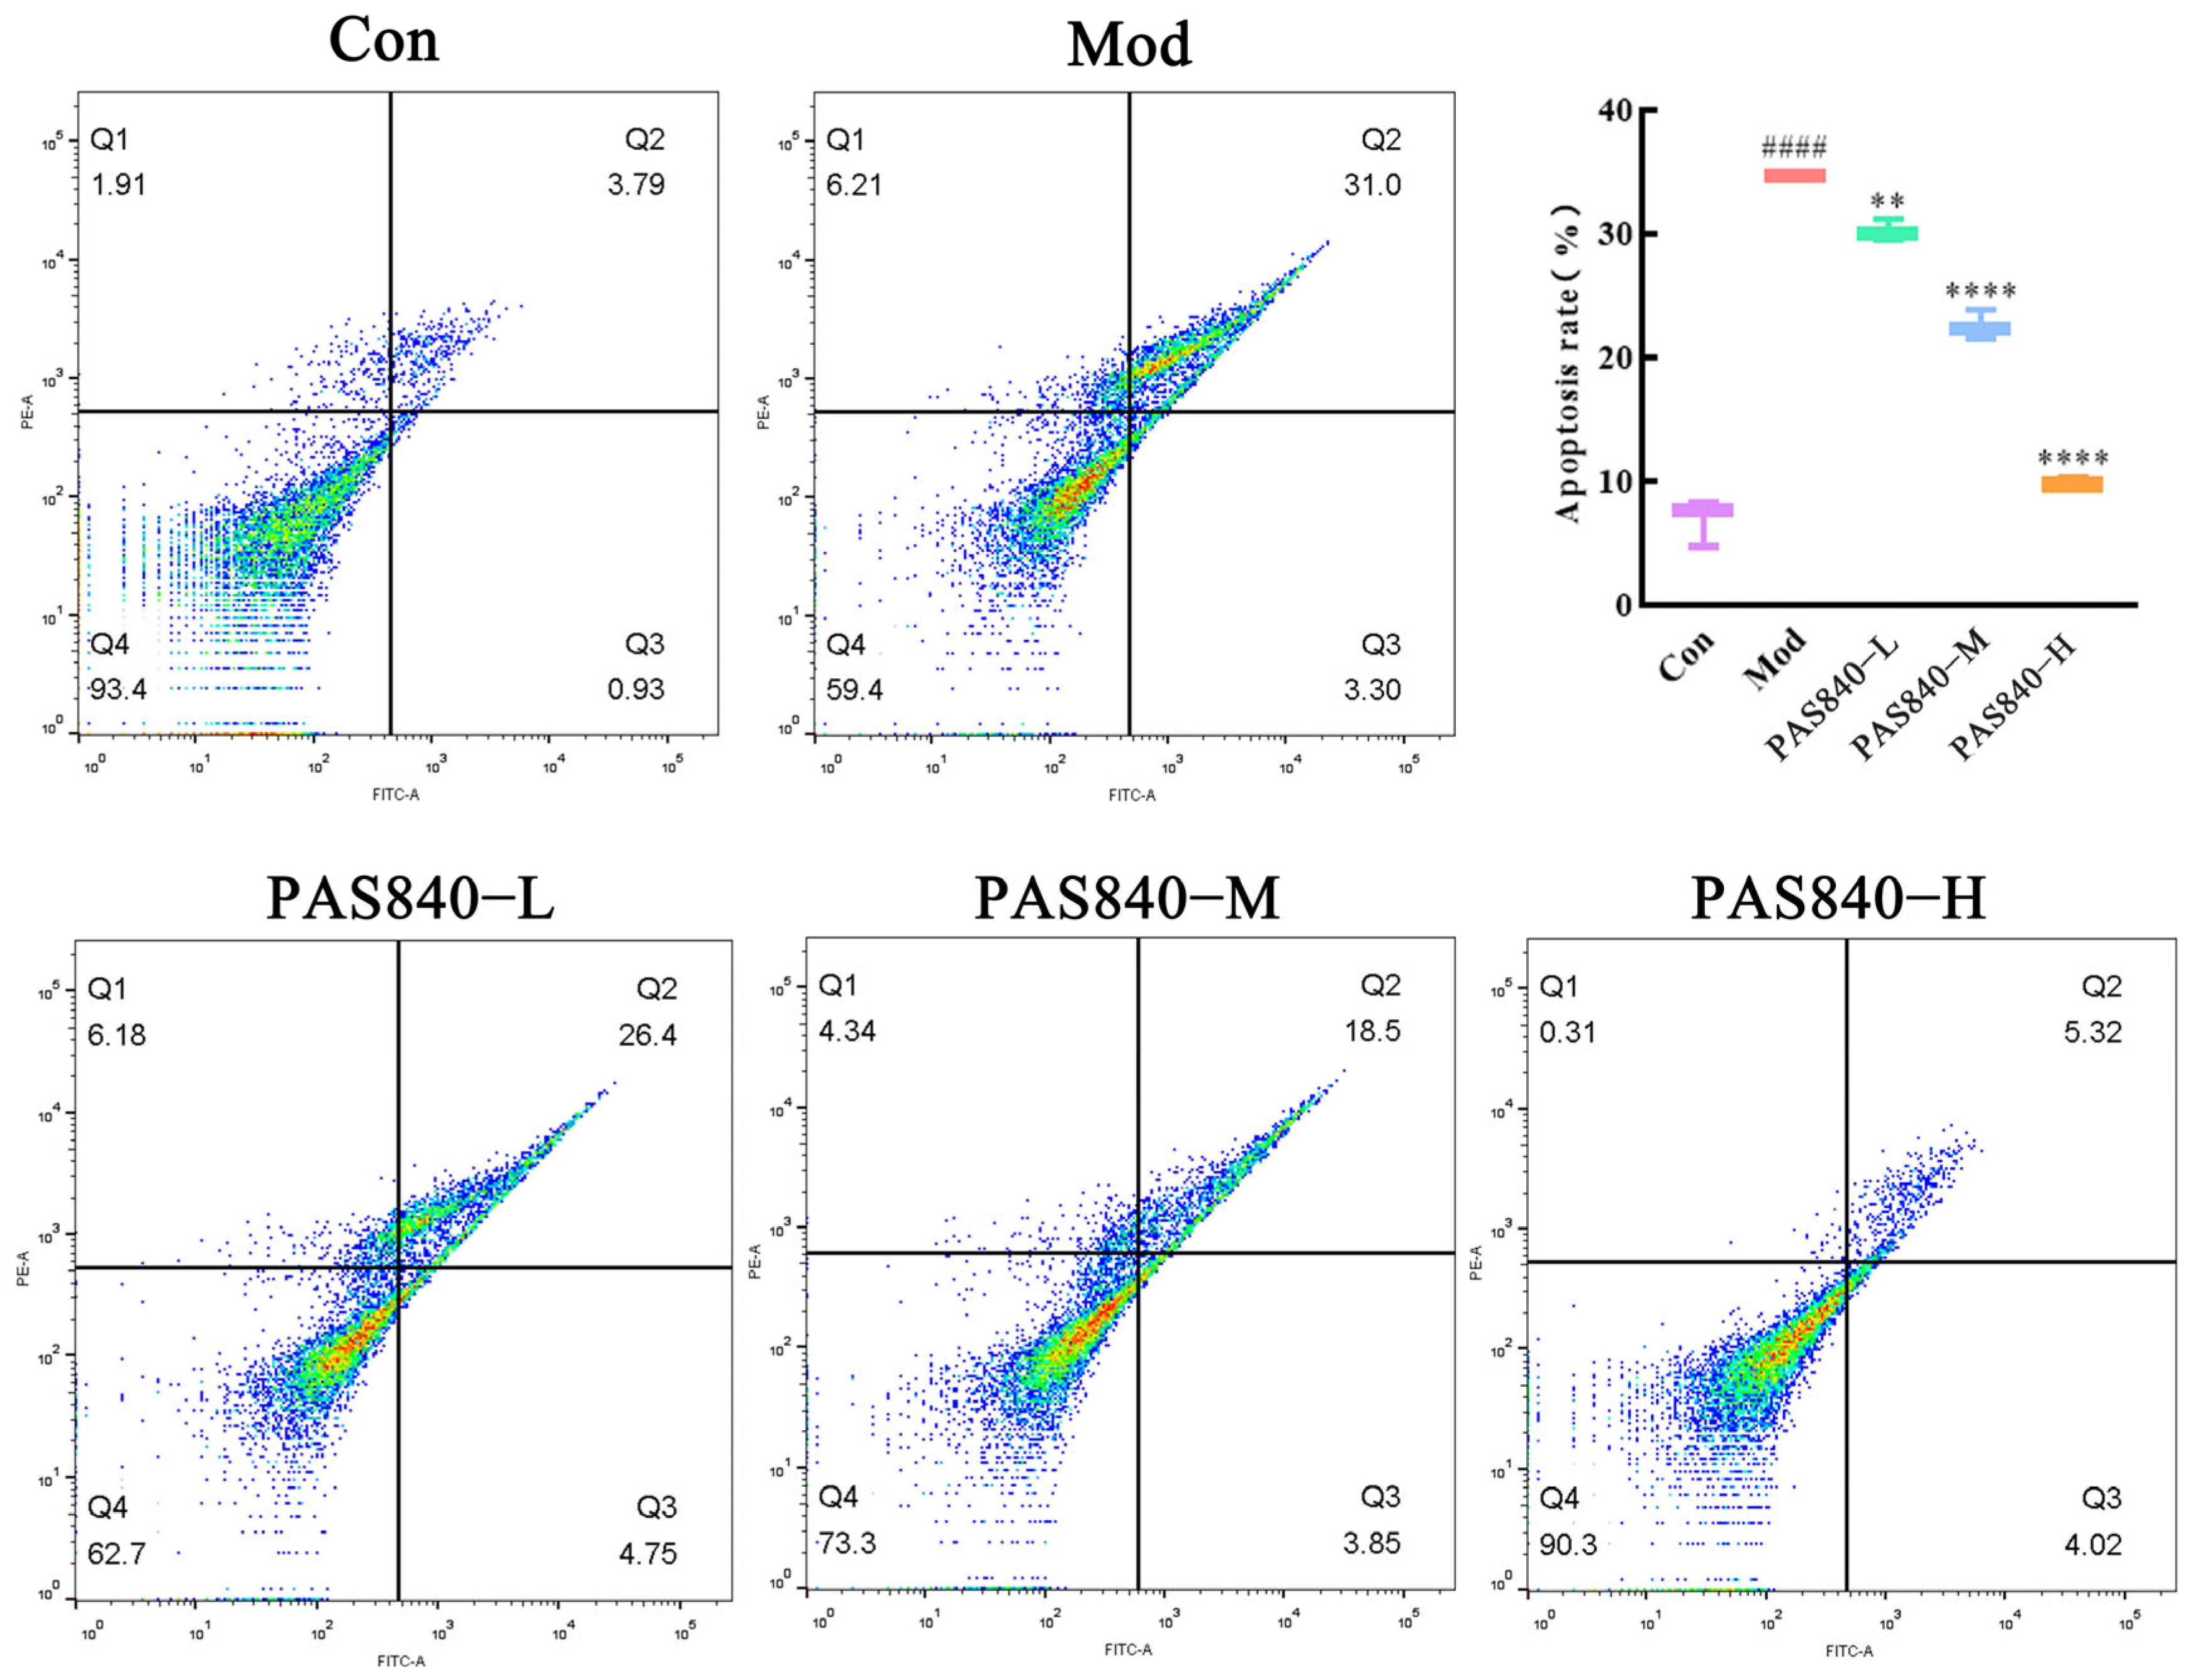
2.13. Effect of PAS840 on the Apoptosis Rate of Damaged Cells
After the cells were treated according to the culture group under “2.8”, the cell culture medium and the cells of each group were collected in the same centrifuge tube, centrifuged at room temperature for 5 min at 1200 r/min, and the supernatant was discarded. The cells were gently resuspended in PBS and washed twice, then centrifuged, and the supernatant was discarded. A 1× binding solution (the fully prepared working solution in the kit; the test instruction manual of the kit has been uploaded to the
Supplementary Materials Figure S8) was added to gently resuspend the cells, and then, the cells were incubated with Annexin V-FITC and PI staining solution at room temperature and protected from light for 15 min. The single-positive and double-positive tubes were also set up for the Annexin V-FITC and PI staining solution. The cells were detected on a flow cytometer immediately after the incubation was completed.
2.14. Effect of PAS840 on MMP in Damaged Cells
After the cells were processed according to the culture group under “2.8” (a positive control group with decreased mitochondrial membrane potential was also set up: CCCP group), the culture medium was removed, and 1.5 mL of JC-1 staining working solution was added to each well (5 μL of JC-1 and 0.8 mL of ultrapure water were vigorously vortexed and mixed thoroughly, and 0.2 mL of 5 μL of 5 × JC-1 staining buffer was added and mixed thoroughly) and incubated for 20 min in an incubator protected from light. After incubation, discard the working solution and, then, wash the adherent cells with JC-1 staining buffer (1×) 2 times. Then, add 1 mL of cell culture medium. Three fields of view were randomly selected for each group, and they were then observed and imaged with a laser confocal scanning microscope (green fluorescence to detect JC-1 monomer; red fluorescence to detect JC-1 polymer). At the same time, collect the cells of each group to prepare the cell suspension and use multi-functional enzyme markers to detect the fluorescence value A1 of the JC-1 monomer (excitation wavelength 488 nm, emission wavelength 530 nm) and the fluorescence value A2 of the JC-1 polymer (excitation wavelength 529 nm, emission wavelength 590 nm). Calculate the fluorescence value A2 of the polymer and the fluorescence value A2 of the polymer. The fluorescence value A2 of the JC-1 monomer (excitation wavelength 488 nm, emission wavelength 530 nm) and the fluorescence value A2 of the JC-1 polymer (excitation wavelength 529 nm, emission wavelength 590 nm) were calculated, and the fluorescence ratio A (A = A2/A1) of each group was calculated to quantify MMP.
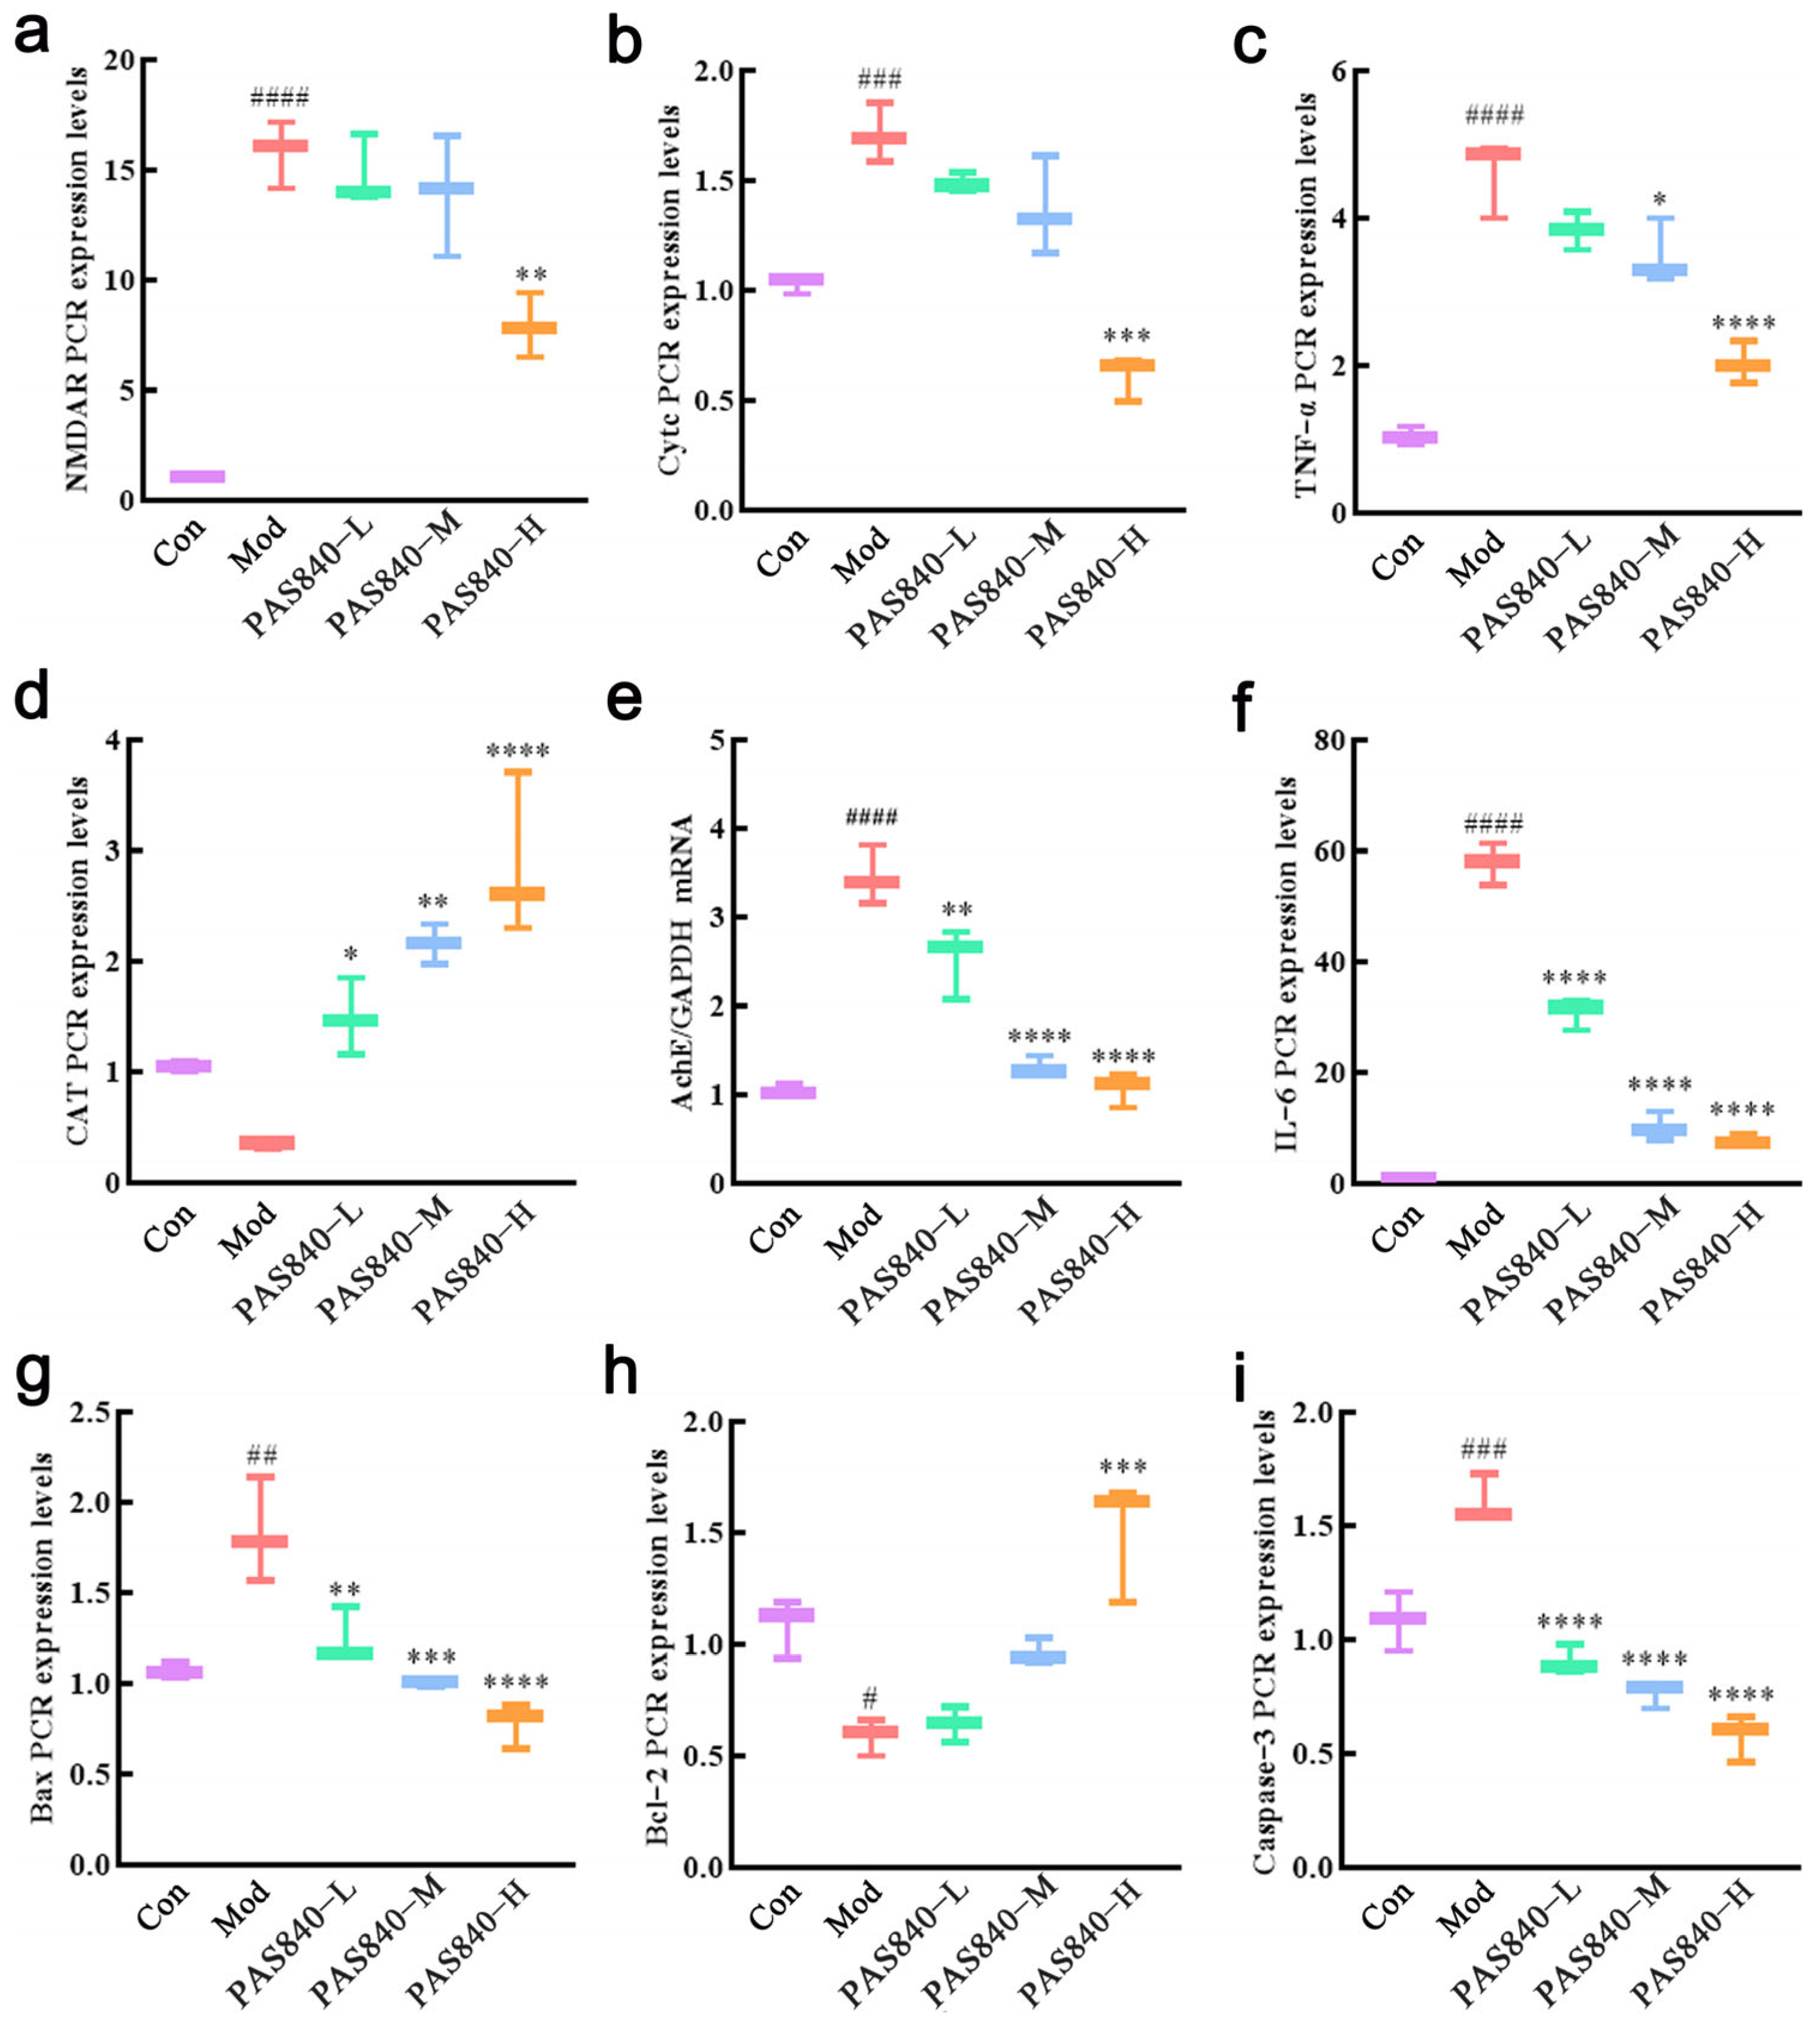
2.15. Effect of PAS840 on mRNA Levels of Damaged Cell-Related Proteins
After the cells were cultured and grouped according to item 2.8, the culture medium was removed, and the cells were collected. One mL of RNAiso Plus was added to each group of cells to extract the total RNA. The purity and concentration of RNA were detected by an ultraviolet spectrophotometer, and the cDNA was synthesized by reverse transcription and amplified by RT-qPCR after the concentration of sample RNA was unified. GAPDH was used as the internal reference, and the target gene was quantitatively analyzed by 2
−ΔΔCt. The primers are shown in
Table 2.
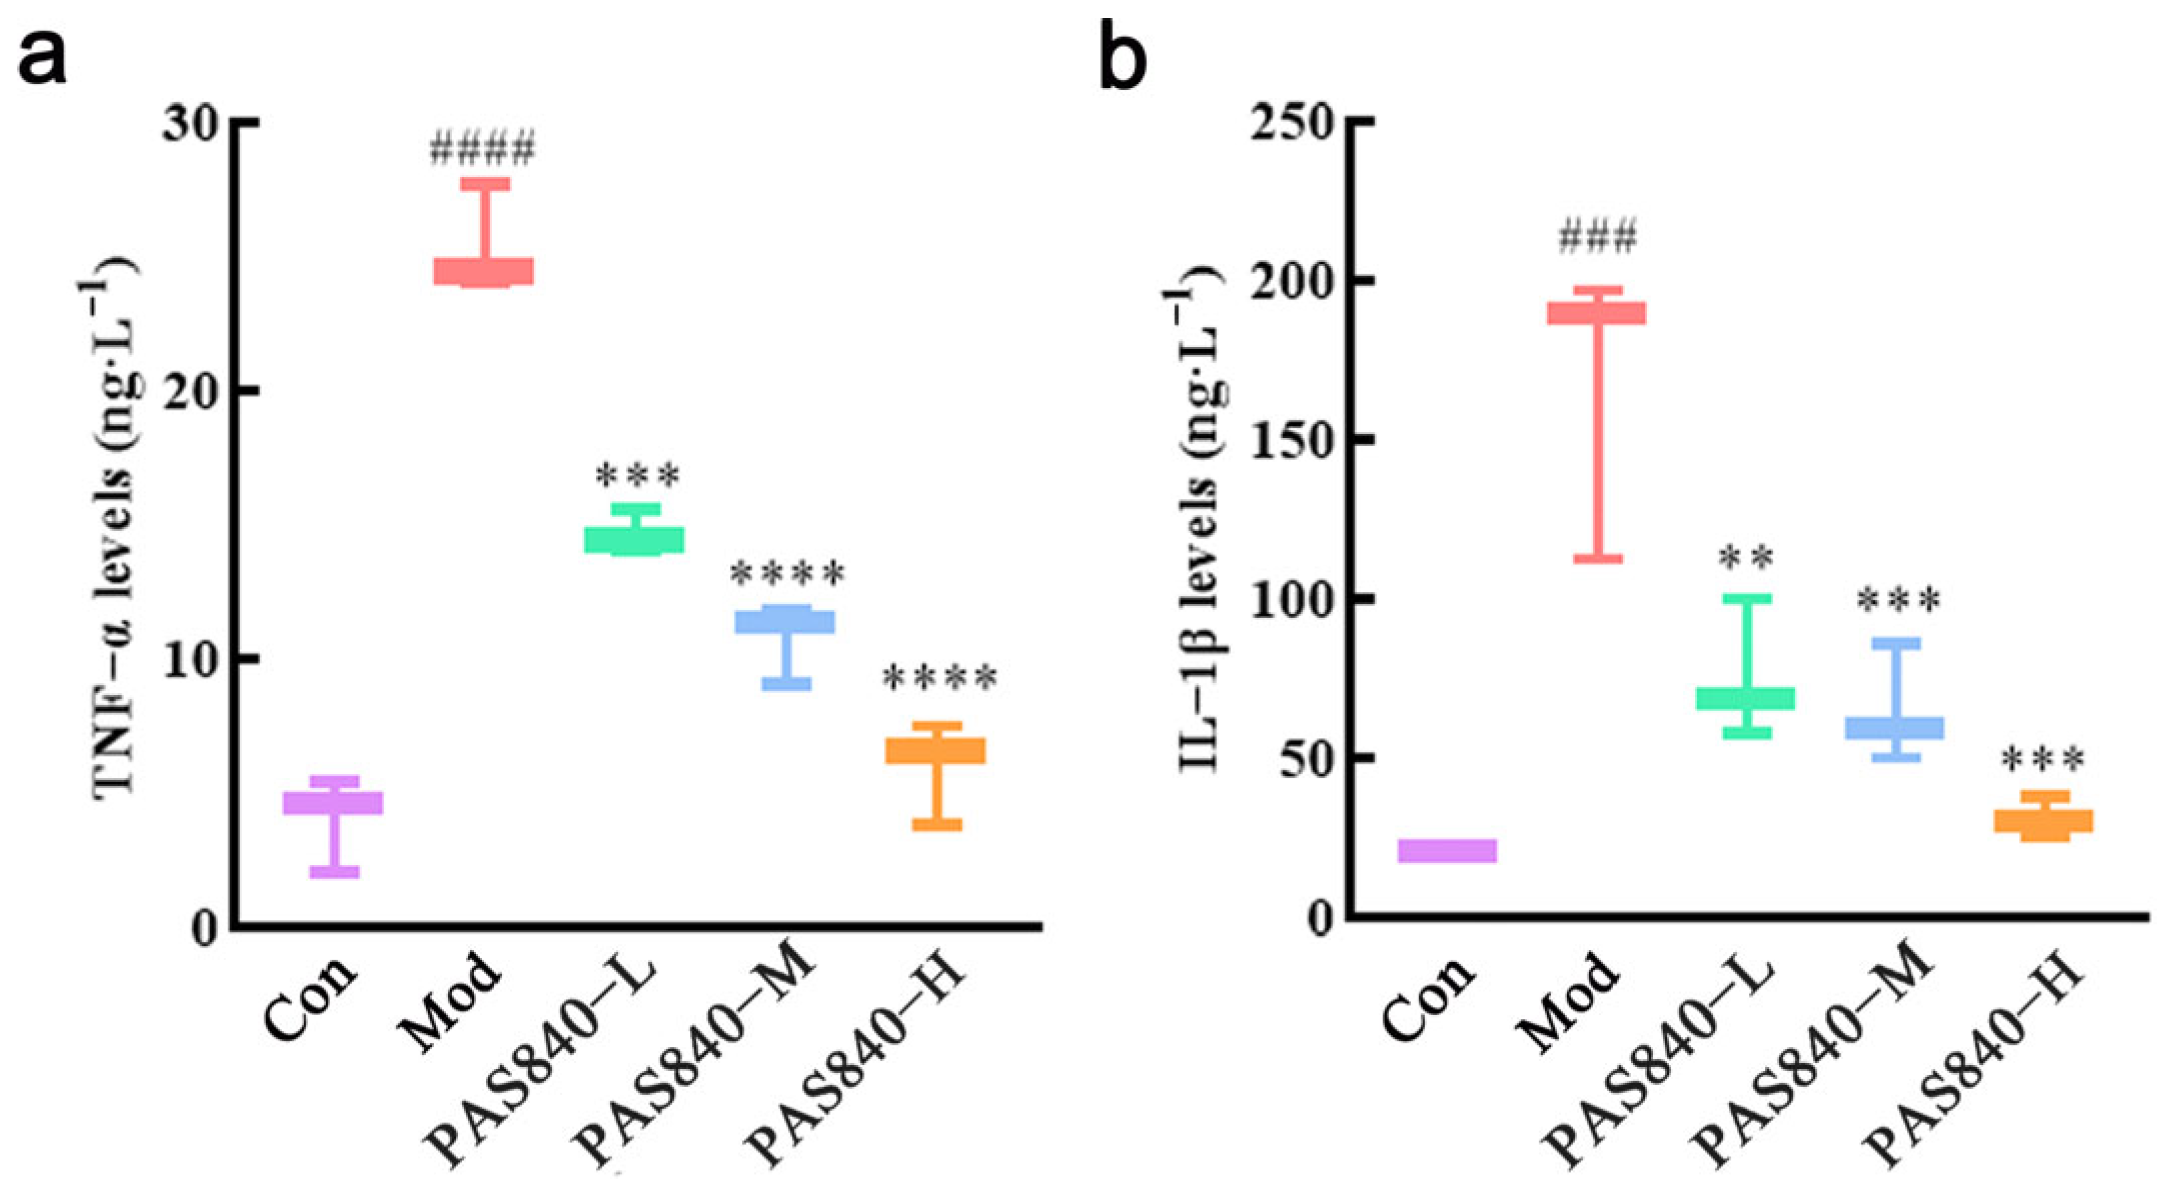
2.16. Determination of TNF-α and IL-6 in Culture Medium of Each Group by ELISA
After the cells were cultured according to “2.8”, the cell culture medium of each group was collected, and the supernatant was centrifuged as the sample. The kit was equilibrated at room temperature for 30 min; 50 μL of supernatant were taken from each group. The OD values of each group were measured at 450 nm using a multifunctional enzyme labeling instrument, and the data were recorded. The results were calculated by ELISAcala, and the fitting model was chosen logistically (four parameters) to draw the standard curve. The levels of TNF-α and IL-6 factors in each group were calculated according to the standard curve.
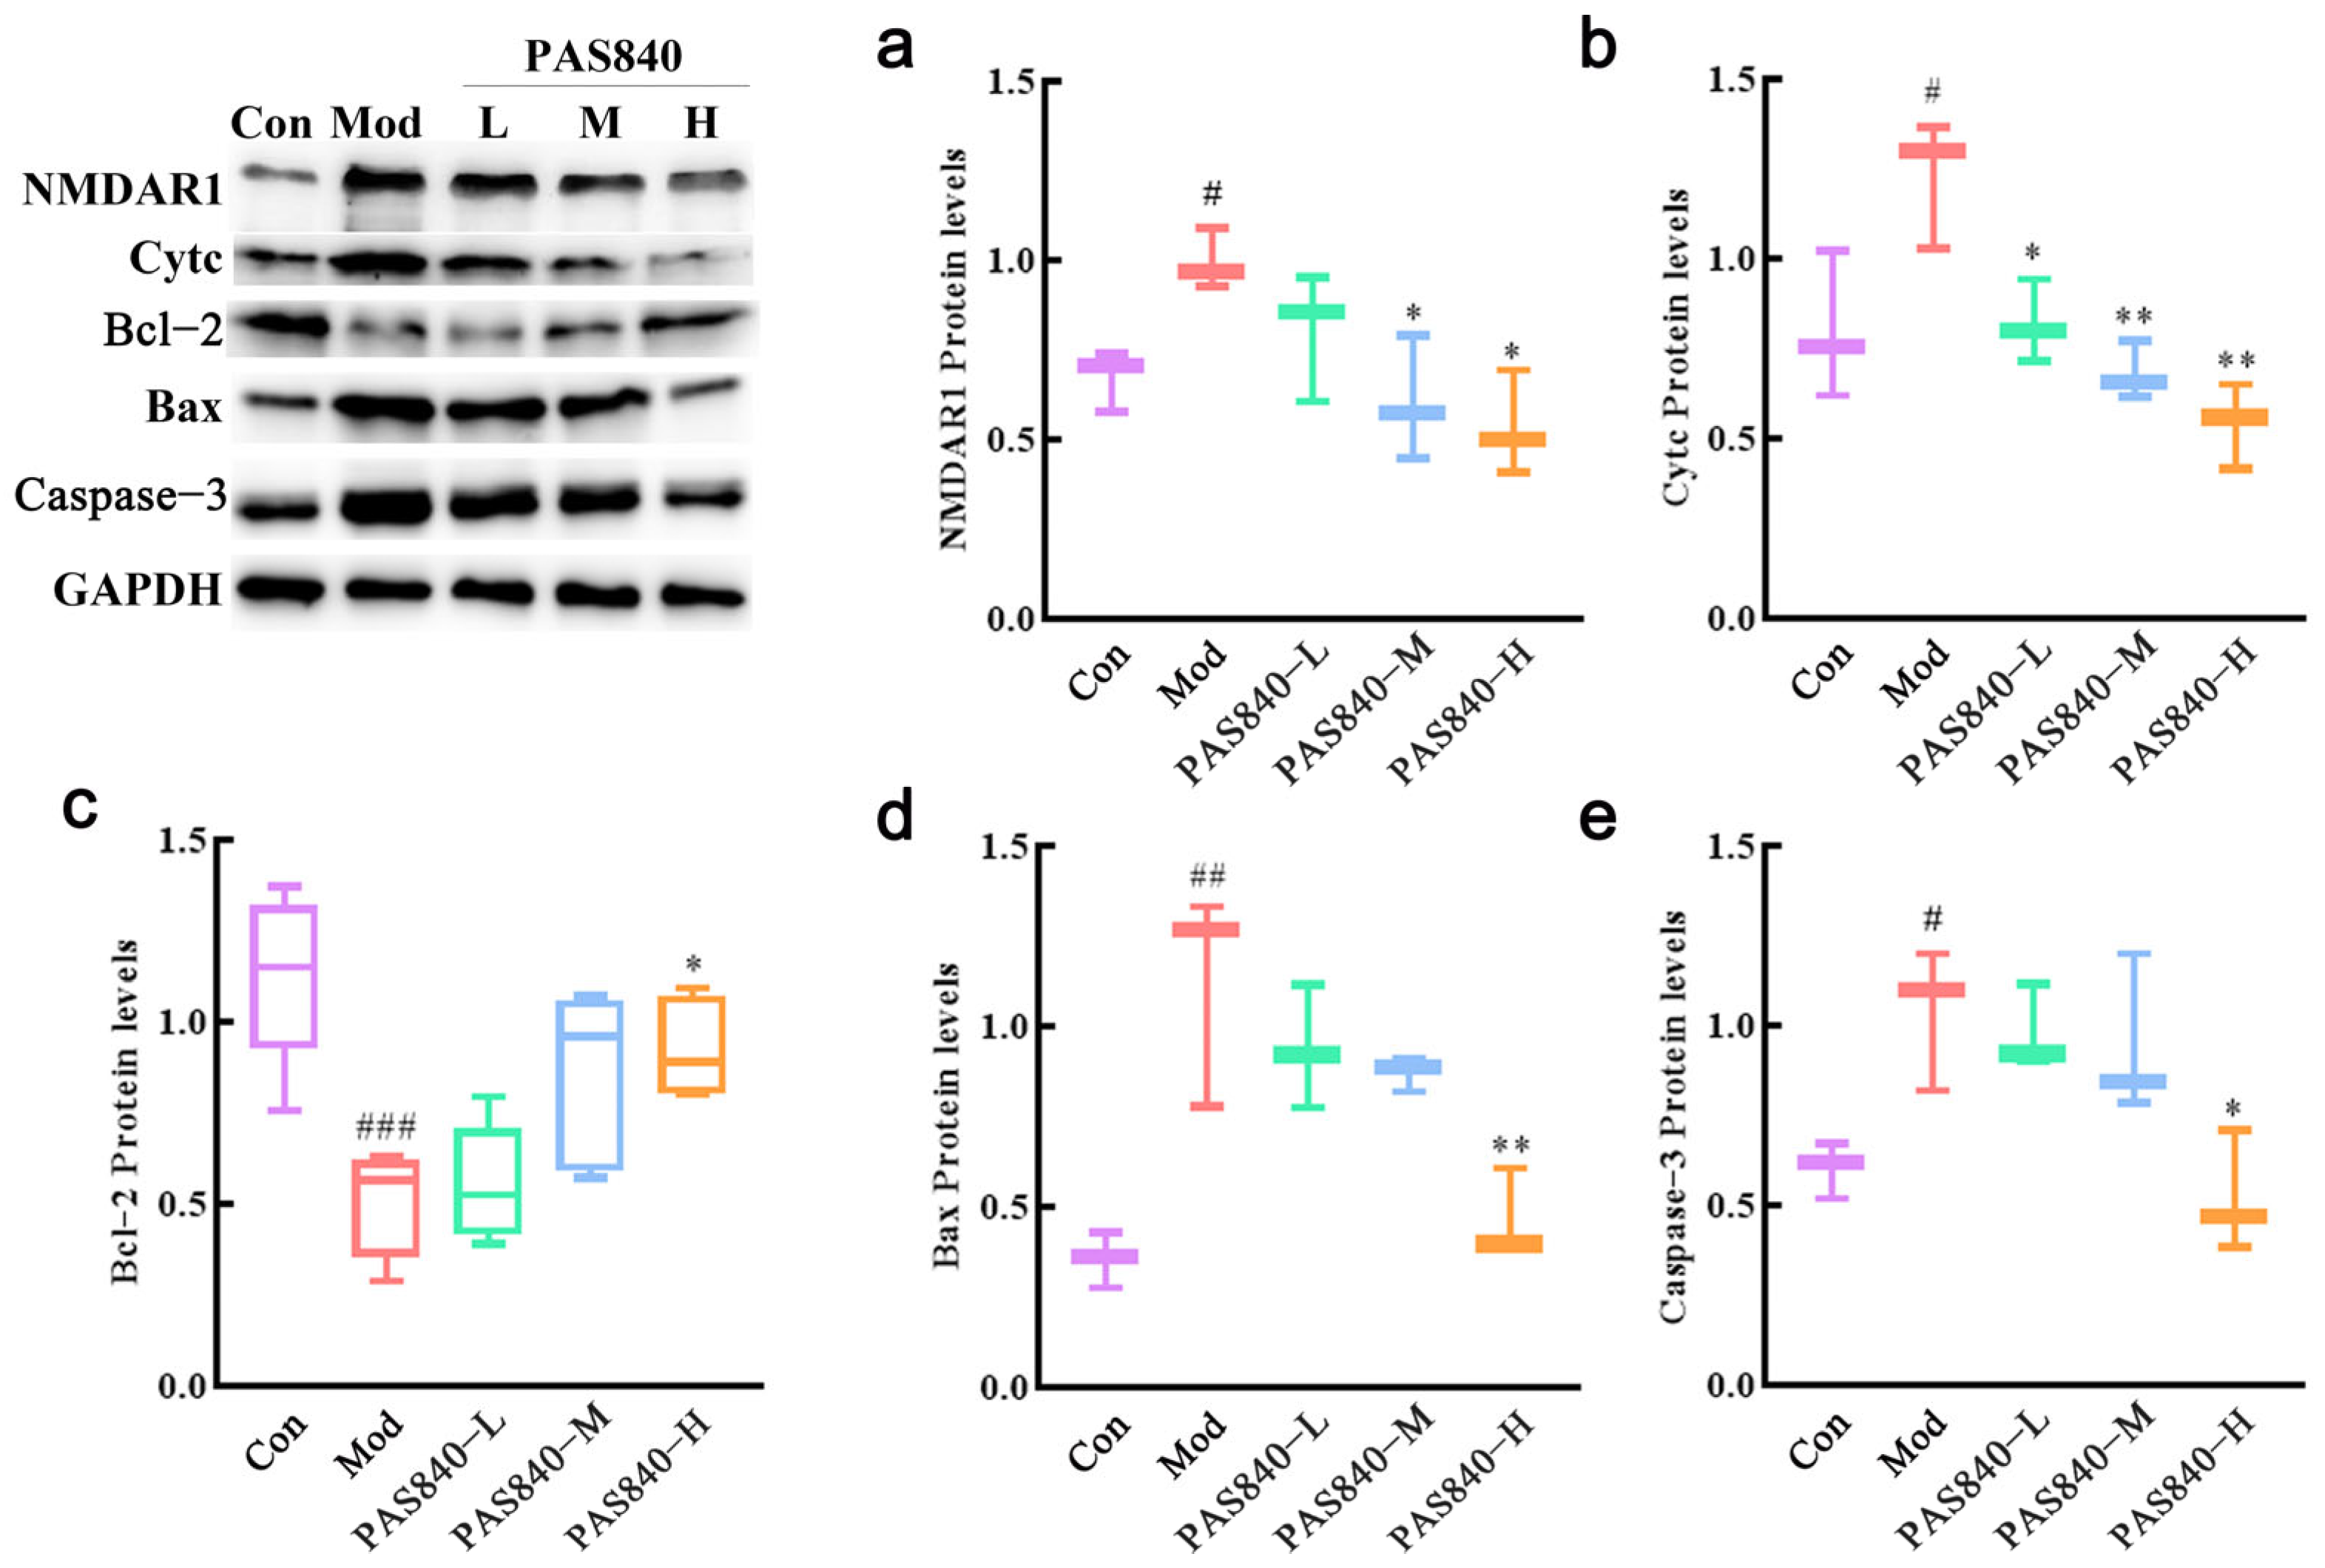
2.17. Detection of Related Proteins by Western Blot Assay
After the cells were grouped according to “2.8”, the culture medium was removed, and 200 μL of lysate were added to the cells of each group. The supernatant was collected by centrifugation after lysis at 4 °C for 30 min. The protein concentration was detected by the BCA (bicinchoninic acid assay) method, and 20 μg of the sample were quantified. The protein samples were separated by 10% SDS-PAGE gel electrophoresis, and the separated protein samples were transferred onto a PVDF membrane, which was closed with a 5% BSA sealing solution for 2.5 h. After the sealing was completed, the membrane was washed three times, and NMDAR1 (1:1000), Cytc (1:1000), Bax (1:5000), and Bcl2 (1:1000) were added, along with Capsase-3 (1:1000), and incubated at 4 °C overnight. The primary antibody was discarded. The secondary antibody was added and incubated for 1 h at room temperature on a shaking table. The color was developed, and the bands were observed. The grayscale value of each band was calculated by ImageJ 1.8.0 software and compared with that of GAPDH for semi-quantitative analysis.
2.18. Statistical Analysis
SPSS 22.0 statistical software was used to analyze the data; the measured data were expressed as x ± s. Comparisons between multiple groups were made by one-way ANOVA, and two-by-two comparisons were made by a Tukey t-test; p < 0.05 was used to indicate that the difference was statistically significant.
4. Discussion
Excitotoxicity was initially proposed in 1969. It is a pathological process that is triggered by the excessive or prolonged activation of excitatory amino acid receptors and has the potential to lead to various neurological disorders, such as Alzheimer’s disease [
25,
26]. Thus, controlling excitotoxicity is crucial for controlling neurodegeneration and protecting neural functions. Glutamate (Glu) is an important excitatory amino acid in the central nervous system. It is released from vesicles of glutamatergic neurons upon stimulation and functions by binding to
N-methyl-D-aspartate receptors (NMDAR). Glu exists in about one-third of central nervous system (CNS) synapses, maintaining synaptic stability and being vital for synaptic plasticity. It influences neuronal differentiation, migration, growth, and survival [
27]. Therefore, Glu plays an important role in the early neurotransmission of neurological diseases like Alzheimer’s disease.
The PC12 cell line originates from the monoclonal transplantation of rat adrenal pheochromocytoma to the adrenal gland and shows neuronal-like functional characteristics after differentiation, being widely used in in vitro neurobiology and neurological disease research. In this study, we employed liquid chromatography–tandem mass spectrometry (LC-MS/MS) technology to analyze the material basis of the Periplaneta americana extract PAS840. Subsequently, taking the typical neurodegenerative disease AD as the target disease, we used network pharmacology to perform AD target docking for the components of PAS840, and the results indicated that PAS840 contains various active ingredients with potential anti-AD properties. For this reason, we established an in vitro excitotoxic cell model by inducing PC12 cells with glutamate. After the PAS840 intervention, we explored PAS840’s protective effect and potential mechanism against the excitotoxicity caused by glutamate from aspects such as cell survival rate, intracellular Ca2+ level, oxidative stress level, and the influence on NMDAR1 expression, hoping to provide a basis for PAS840’s research on combating neurological diseases at the animal level.
Network pharmacology, a tool capable of analyzing the effect of complex mixtures on diseases in multiple dimensions, perspectives, and levels, has been widely used in the study of traditional Chinese medicine pharmacodynamics. The PA contains abundant components such as amino acids, nucleosides, polysaccharides, peptides, and fatty acids [
13,
14]. Previous studies have shown that the active ingredients in PA have excellent anti-inflammatory, antioxidant, tissue repair-promoting, vasodilatory, anti-hypertensive, and angiogenesis-promoting effects [
15,
16]. Based on these favorable pharmacological actions of PA, in this study, LC/MS was used to detect the components of PAS840, and with AD as the target disease, network pharmacology was employed to predict its effect on AD. The results showed that PAS840 contains components that are involved in typical inflammatory target proteins, such as MPKA1/IL-6/IL-1β/CASP3 [
28,
29], as well as target proteins that regulate cell proliferation and apoptosis, like EGFR/AKT1/STST3.
Post-inflammatory sequelae of the brain are key pathogenic factors in AD development [
30], and inhibiting brain inflammation is crucial for protecting neurological function, maintaining the blood–brain barrier, and preventing AD deterioration due to brain inflammation [
31,
32]. In addition, modern research has found that the SRC family tyrosine kinase is a core target receptor for neurodegenerative diseases [
33], and the genetic polymorphism of the estrogen receptor (ESR) also has a strong correlation with AD [
34], making it a potential therapeutic intervention target for neurodegenerative diseases. By inhibiting the activation of tyrosine kinase and regulating the BARHL1–ESR1 axis to reduce β-amyloid processing, the progression of neurodegenerative diseases, such as AD, can be slowed down [
35].
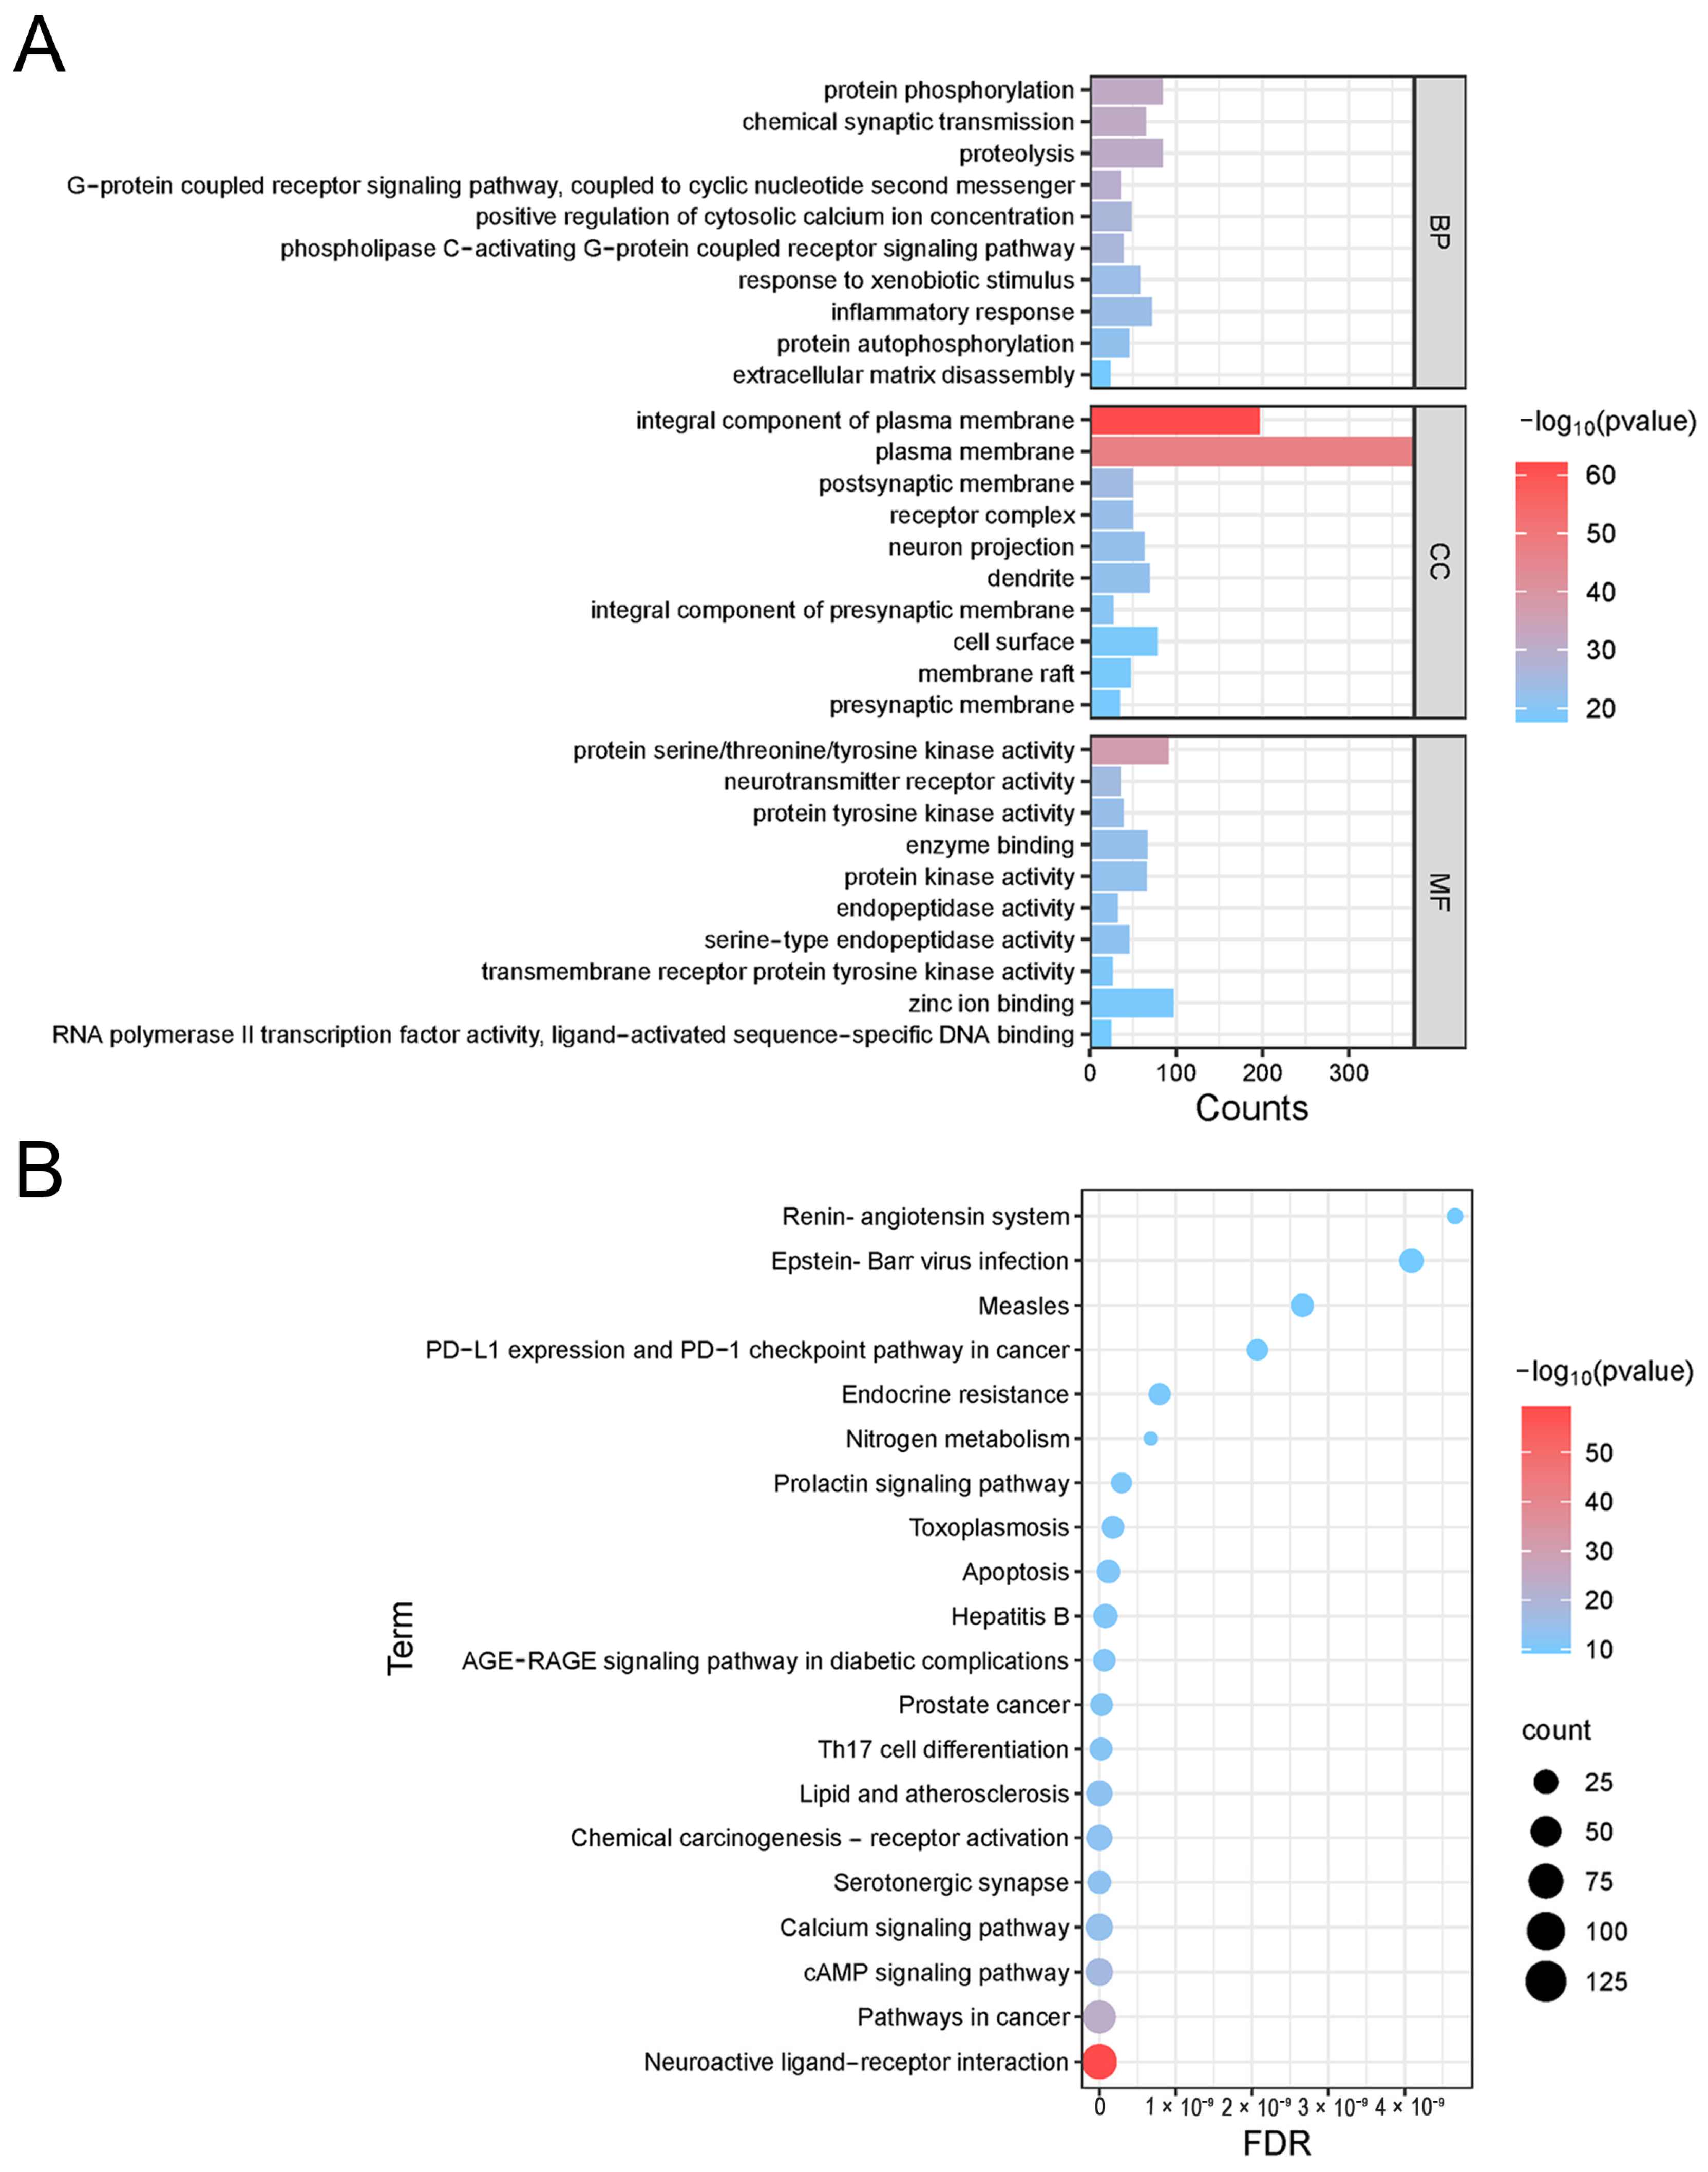
Pathway enrichment analysis shows that PAS840 is mainly involved in processes such as calcium channel regulation, inflammatory response, apoptosis control, and G-protein coupling. It actively regulates the cell’s resistance to stimulatory damage, inflammatory response, neural signal regulation, and anti-apoptosis. It also affects various disease pathways, including immune disorders and toxoplasmosis. Among them, neural receptor–ligand interactions, calcium channels, and the renin–angiotensin system are closely related to neurological diseases. Calcium channel regulation is crucial for neural signal transduction; abnormal calcium accumulation in the pineal gland can cause ectopic calcification, leading to AD [
36]. Renin–angiotensin may also unveil novel molecular targets for rectifying memory pathways, cerebrovascular function, and other AD-related issues [
1]. The renin–angiotensin system, which controls blood pressure, can slow down the onset and progression of AD. These results are highly consistent with those of core protein analysis.
Inflammatory response is of significant importance in pathways related to neurodegenerative diseases. Up to now, two major classes of Glu receptors have been identified: ionotropic receptors, including NMDAR, kainic acid receptor (KAR), and α-amino-3-hydroxy-5-methyl-4-isoxazole receptor (AMPAR). They can couple with ion channels to form receptor-associated channel complexes that are essential for signal transduction [
37]. NMDAR is the predominant subtype of Glu receptors and is crucial for initial neuronal signal conduction [
38]. It is a heterotetramer usually composed of two GluN1 (NMDAR1) and two GluN2 (NMDAR2) subunits, among which NMDAR1 plays a major role [
39,
40,
41]. NMDAR1 can induce long-term synaptic potentiation, which is a key phenomenon of enhanced synaptic transmission efficacy and a manifestation of synaptic plasticity closely associated with brain learning and memory formation [
42,
43].
Research indicates that NMDAR1 couples with calcium ion channels to form receptor–ion channel complexes, which mediate intercellular signal transduction. Glutamate-induced overactivation of NMDAR1 can lead to a massive Ca
2+ influx, resulting in calcium overload and triggering downstream pathways, thereby causing neuronal damage [
44]. The use of NMDAR antagonists can be used for the treatment of moderate-to-severe AD caused by synaptic damage involving NMDAR [
45]. In our study, PAS840 significantly mitigated the activation of NMDAR1, reduced the influx of Ca
2+, and decreased the cell apoptosis rate, which is similar to Koh’s finding that blocking NMDAR and reducing Ca
2+ influx can decrease neuronal death during excitotoxicity [
46]. Here, the representative drug pethidine is a low-affinity NMDAR antagonist that can reduce Glu excitotoxicity and has a neuroprotective effect on traumatic brain injury [
47]. RT-qPCR and ELISA assays showed that the levels of inflammatory factors TNF-α and IL-6 in Glu-induced PC12 cells significantly increased, but these levels were markedly reduced after PAS840 intervention, indicating that Glu-induced neuroinflammation was alleviated.
Mitochondria, in addition to being the primary energy source of neurons, serve as an important buffer for cytoplasmic Ca
2+, inhibiting excessive and prolonged elevation of Ca
2+ [
48]. Inhibition of mitochondrial Ca
2+ uptake or disruption of mitochondrial structure and function can severely impair the clearance of cytoplasmic Ca
2+, leading to its accumulation and subsequent cell damage, such as oxidative damage and apoptosis [
49]. Studies have shown that mitochondrial Ca
2+ uptake buffers the massive Ca
2+ influx caused by intense Glu receptor stimulation [
50,
51]. Continuous Glu receptor activation increases Ca
2+ influx, reduces MMP, impairs ATP production, increases ROS production, and disrupts the function of other organelles, all of which are closely related to neuronal death. In our research results, after PC12 cells were induced by Glu, intracellular Ca
2+, ROS, and malondialdehyde (MDA) levels significantly increased, while MMP and antioxidant indicators, such as SOD, GSH-Px, and GSH, significantly decreased, indicating the successful establishment of a Glu-induced PC12 cell injury model. However, after treatment with PAS840, intracellular Ca
2+, ROS, and MDA levels significantly decreased, antioxidant indicator levels increased, Bcl-2 expression was upregulated, Bax expression was inhibited, mitochondrial morphology and function were protected, the release of Cytc due to mitochondrial membrane rupture was reduced, and further, Caspase-3 expression was inhibited. This indicates that PAS840 intervention can effectively prevent Glu-induced mitochondrial damage, reduce ROS-mediated oxidative damage, enhance cellular antioxidant capacity, and inhibit apoptosis.
In conclusion, PAS840 can protect nerve cells by inhibiting the activity of the NMDAR1 receptor, counteracting excessive Ca2+ influx caused by the overactivation of NMDAR1, protecting mitochondrial morphology and function, alleviating oxidative stress damage, suppressing neurotoxicity, and preventing neuronal cell damage and death. These results suggest that PAS840 may have potential preventive or therapeutic effects on neurological diseases, which will provide scientific support for our next step of exploring the impact of PAS840 on AD and other neurological diseases at the in vivo experimental level.


