

MeStanG—Resource for High-Throughput Sequencing Standard Data Sets Generation for Bioinformatic Methods Evaluation and Validation


Simple Summary
Abstract
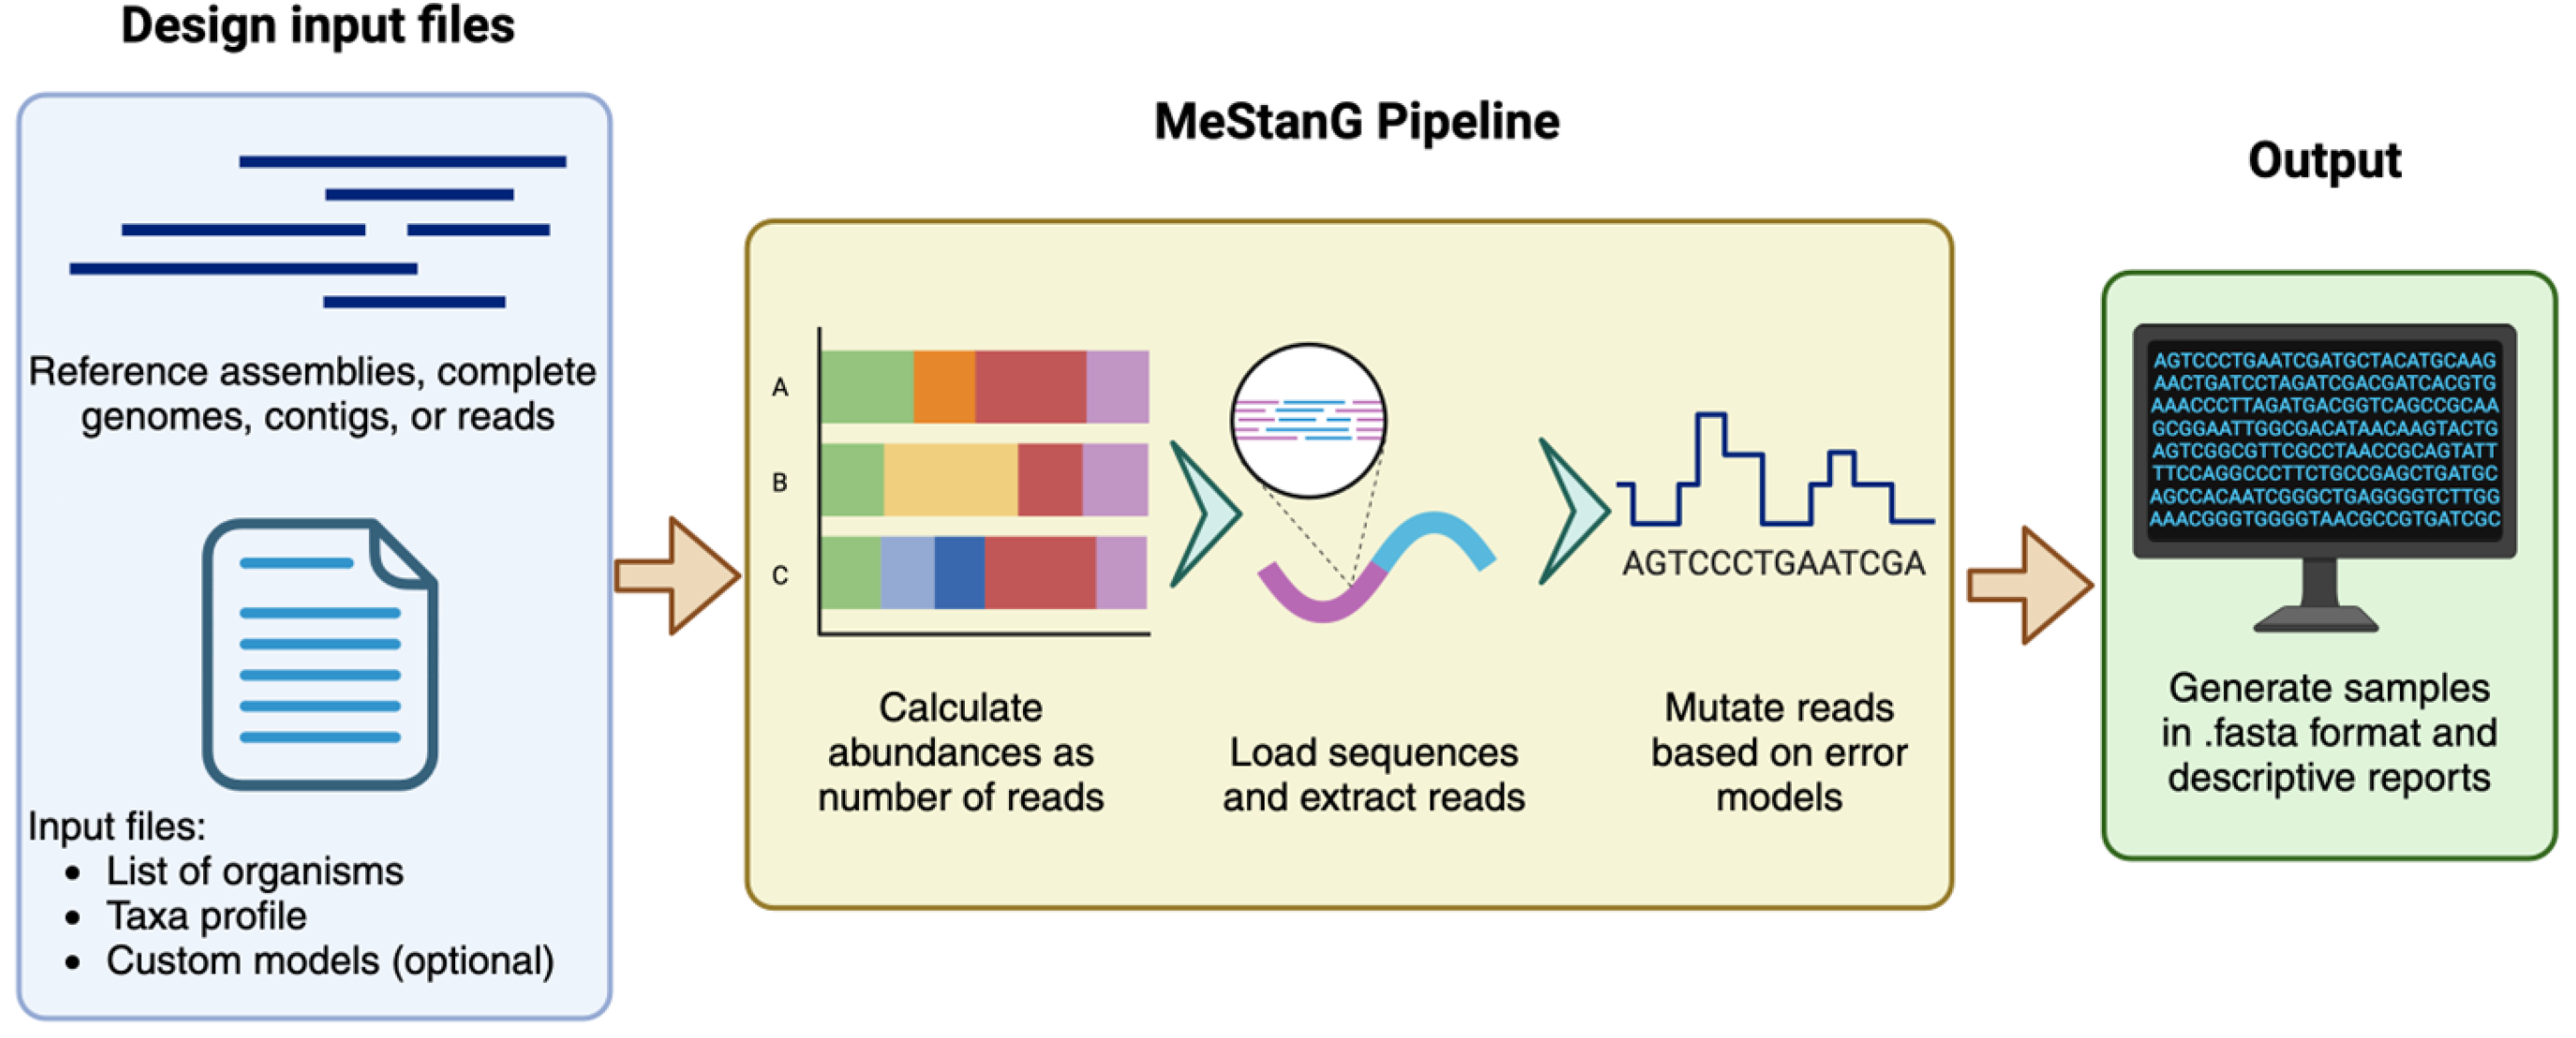
1. Introduction
2. Materials and Methods
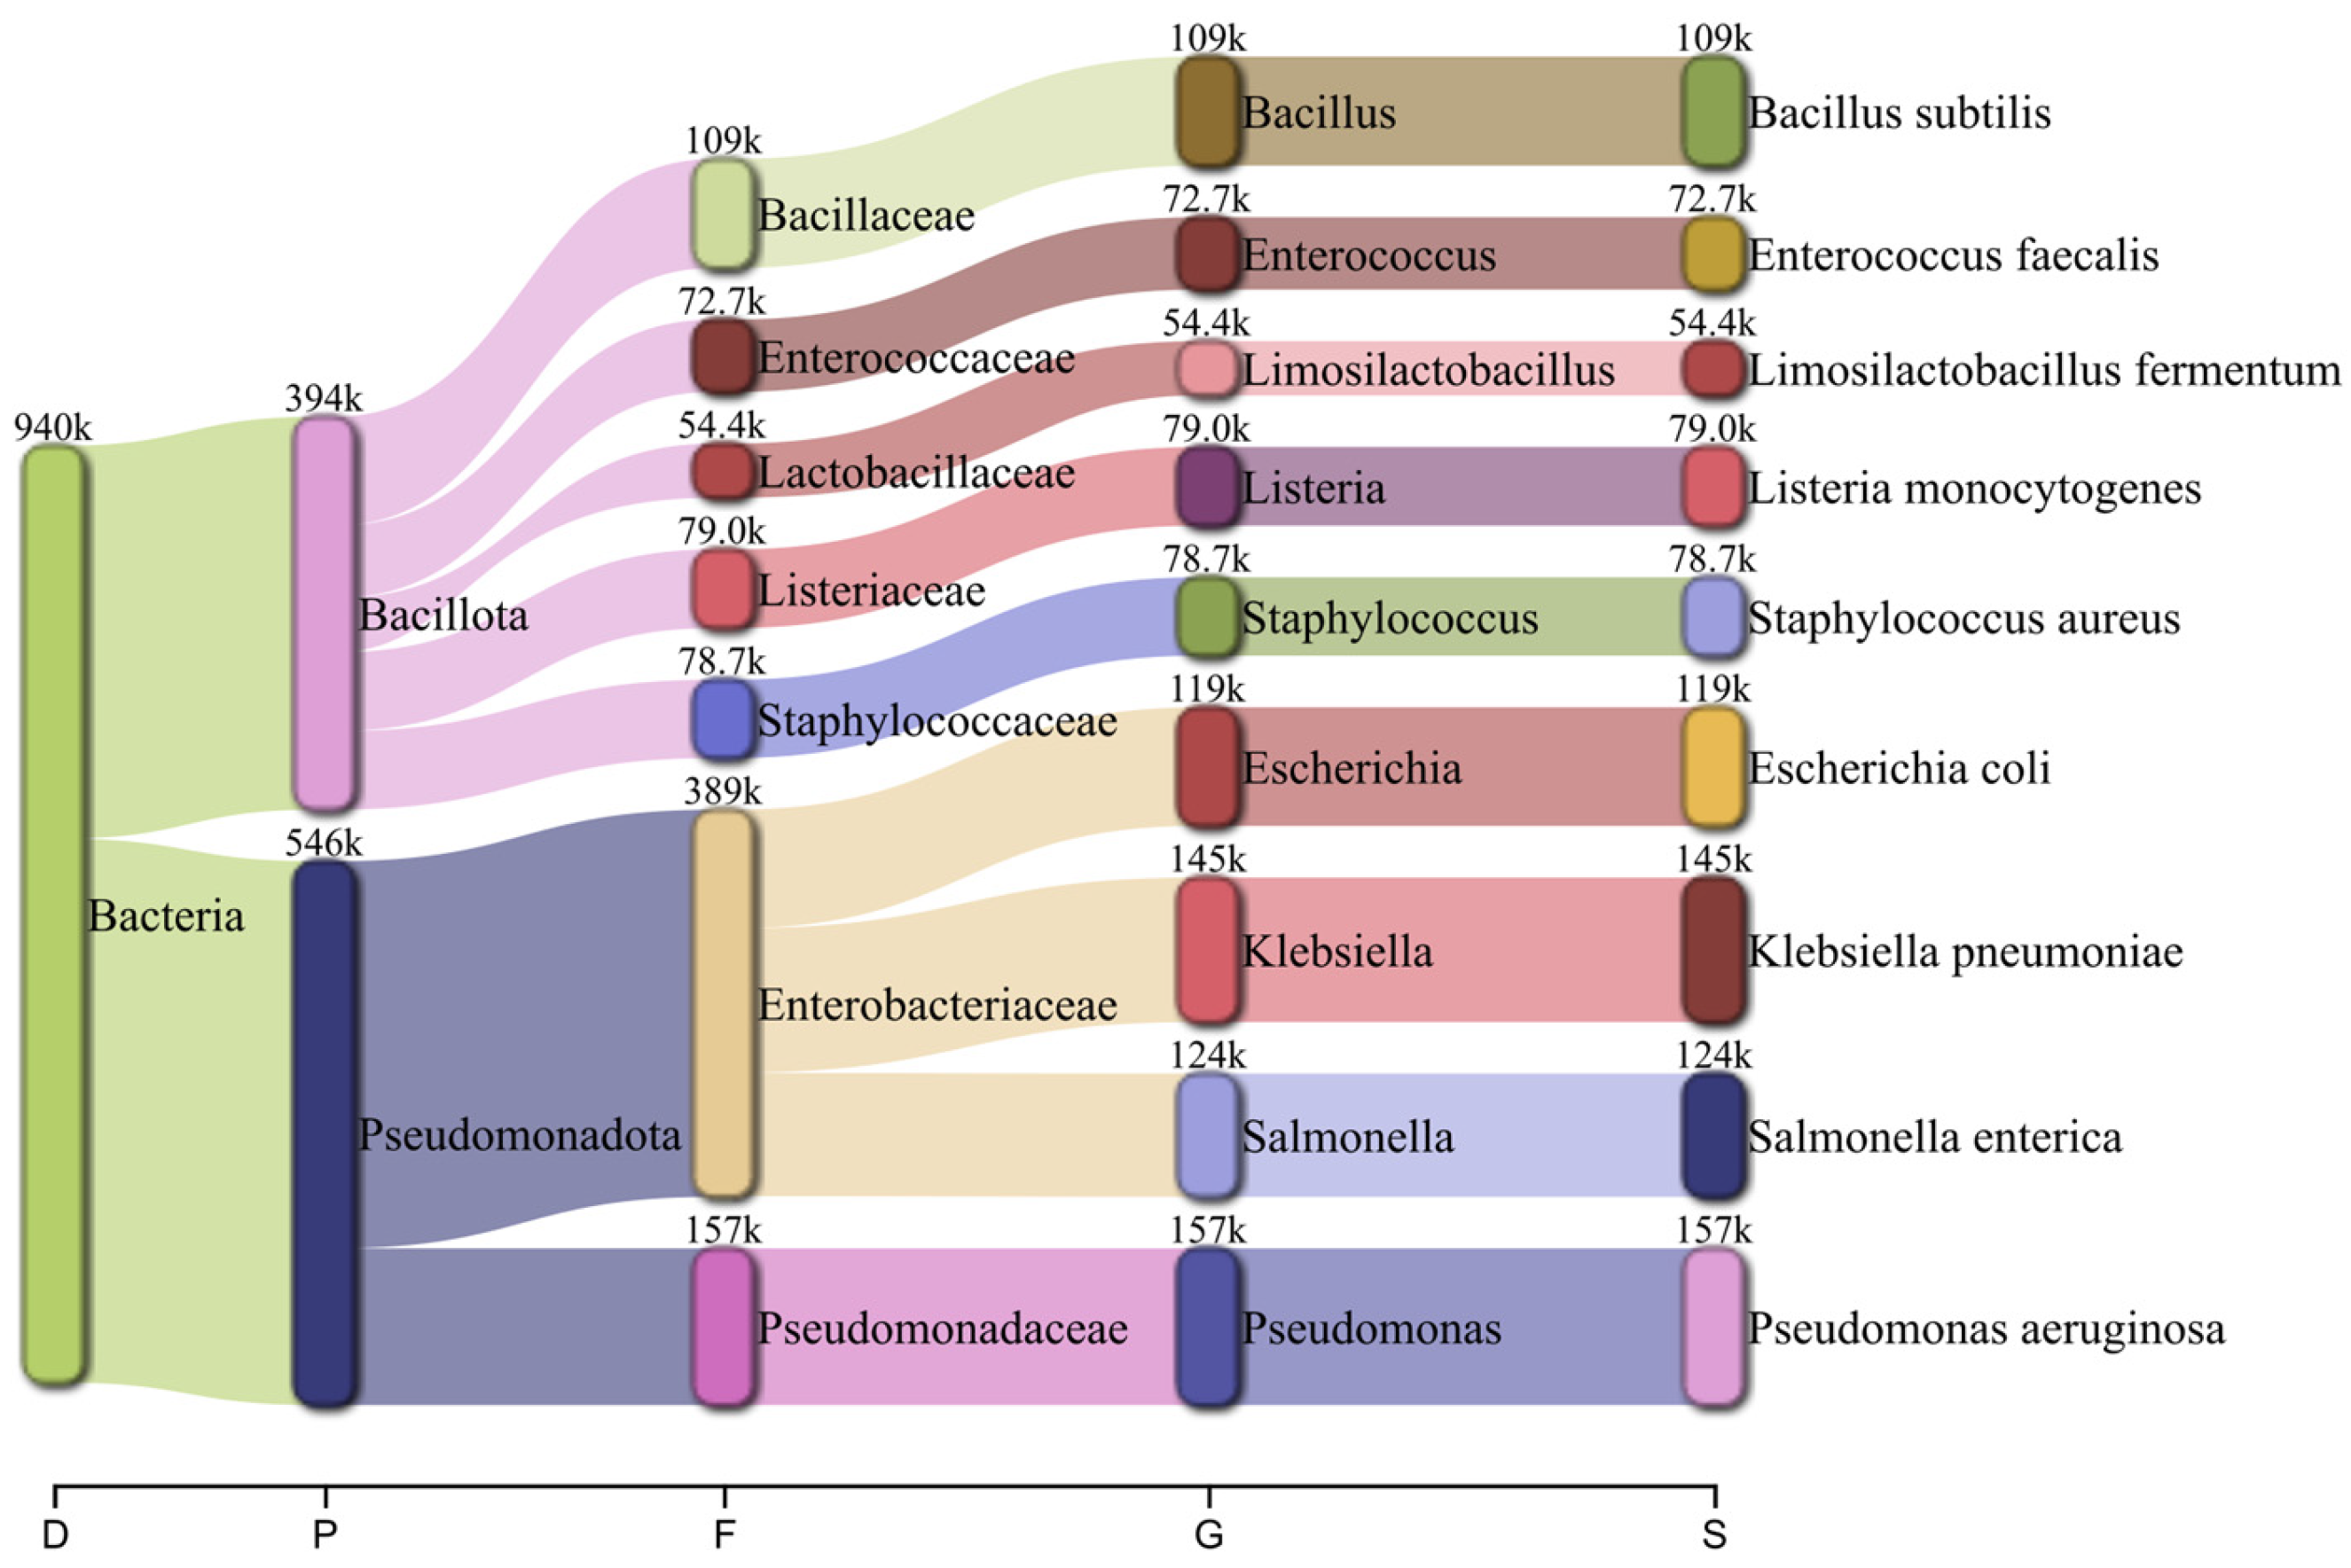
2.1. Bacterial-Only Metagenome
2.2. Host-Pathogen Metagenome Sample Generation
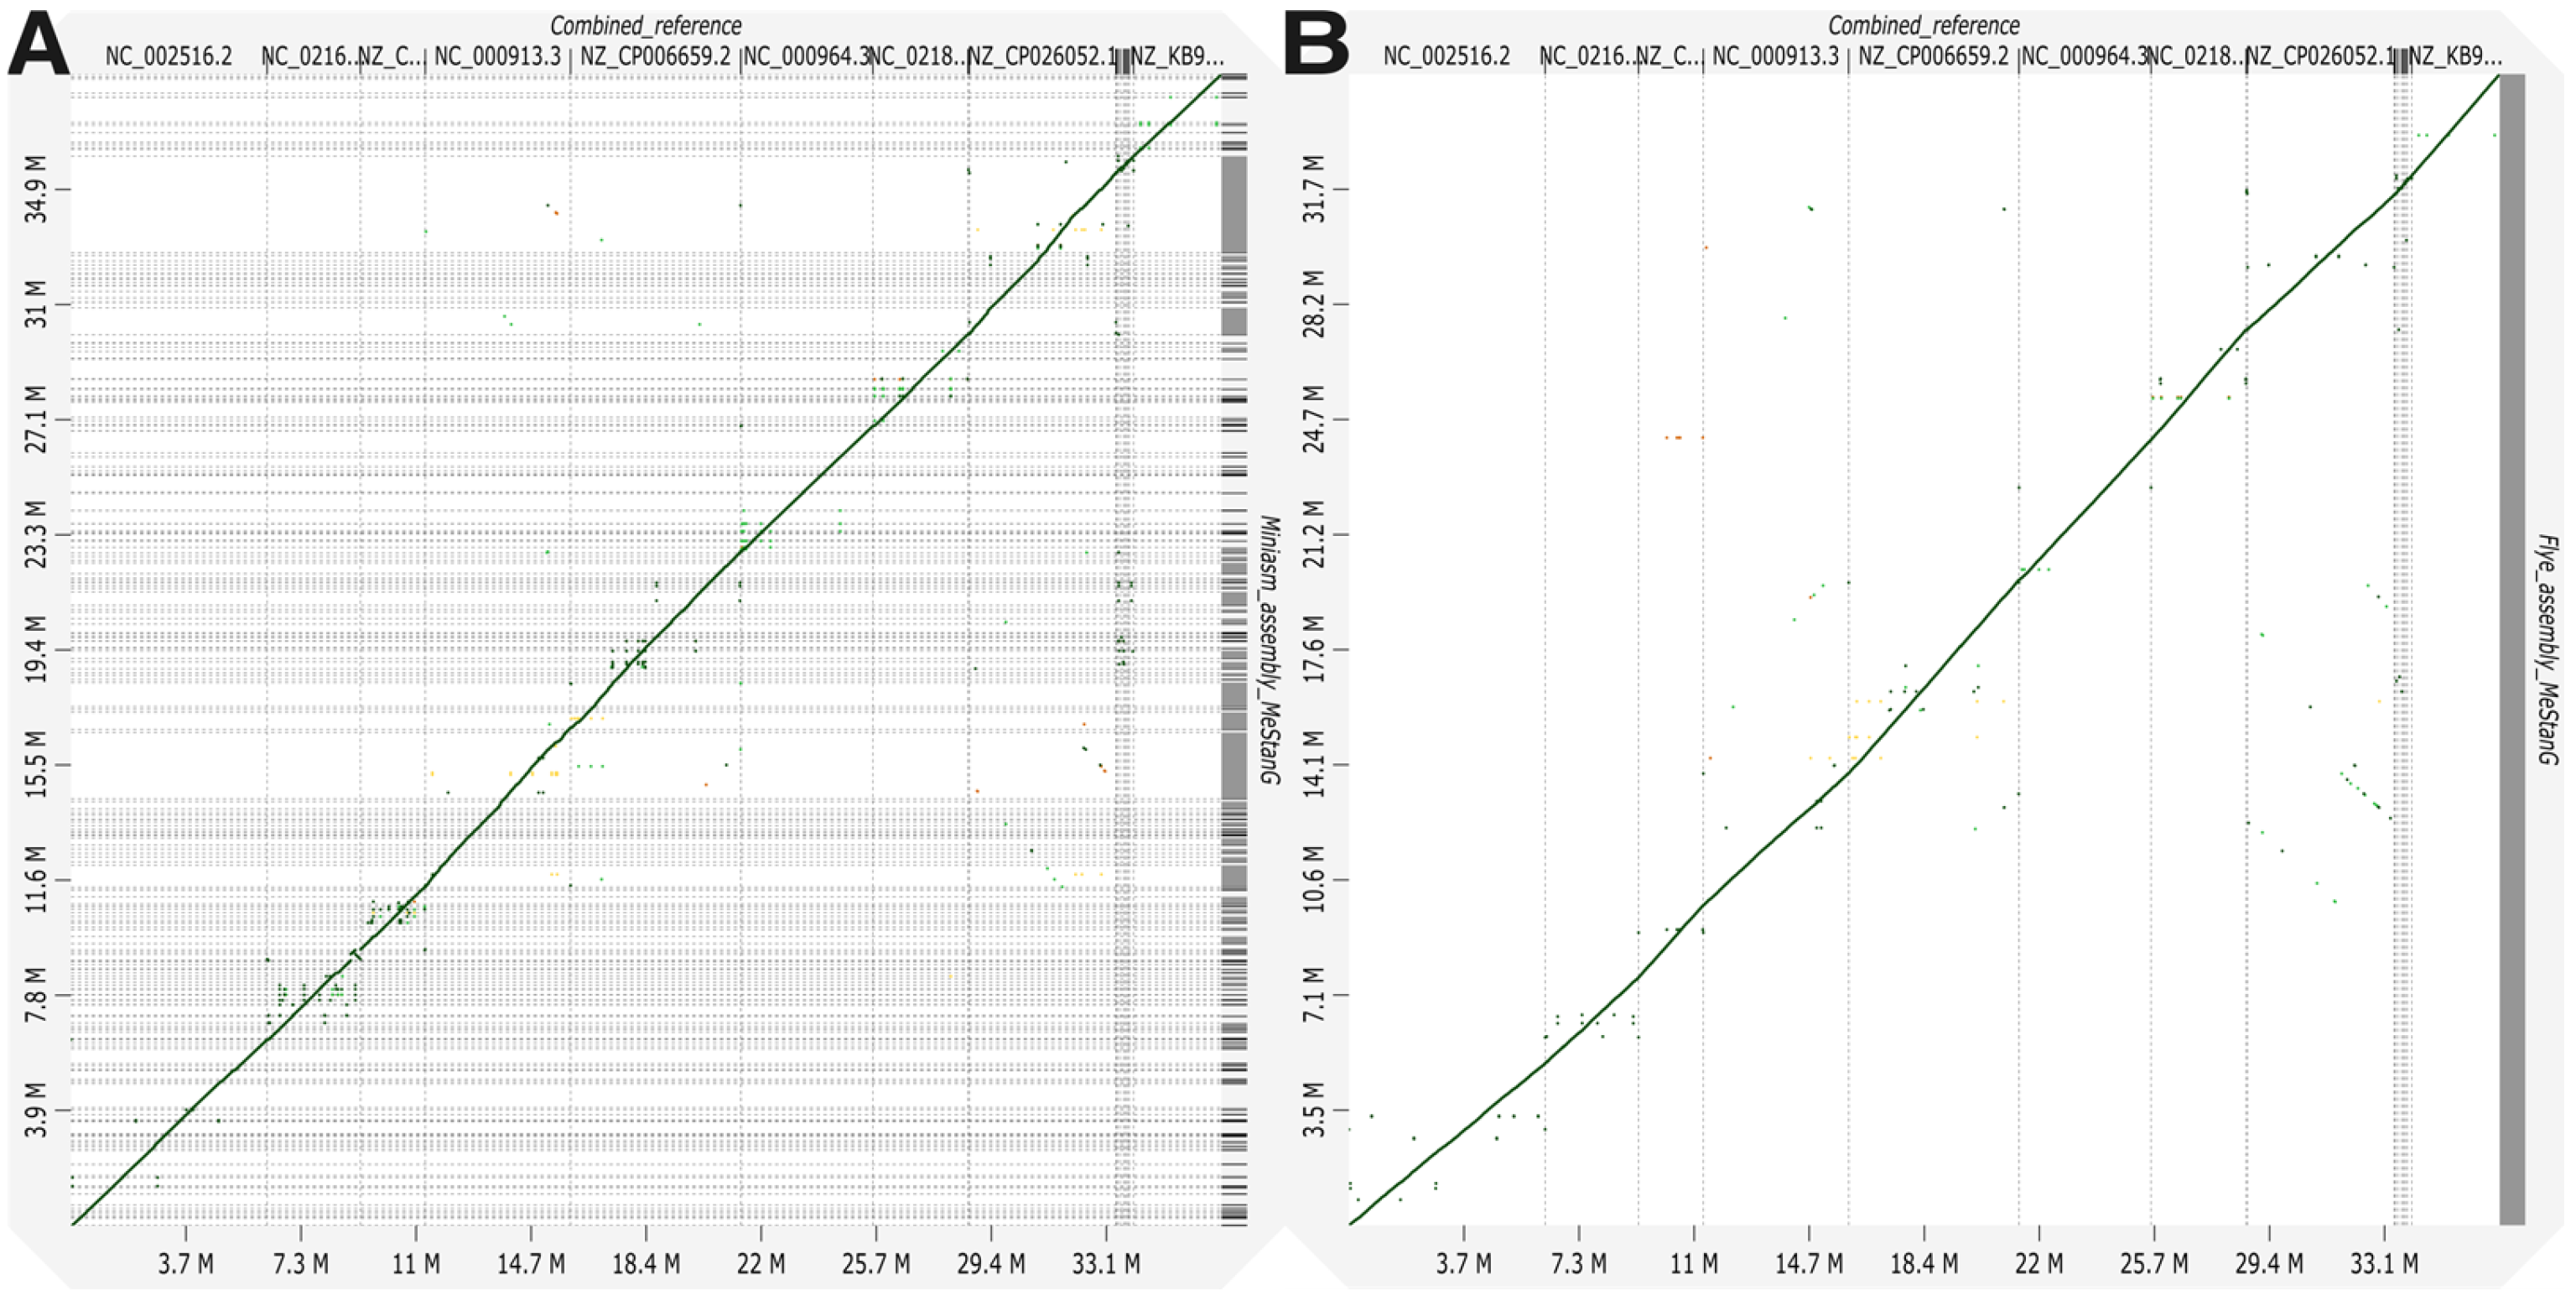
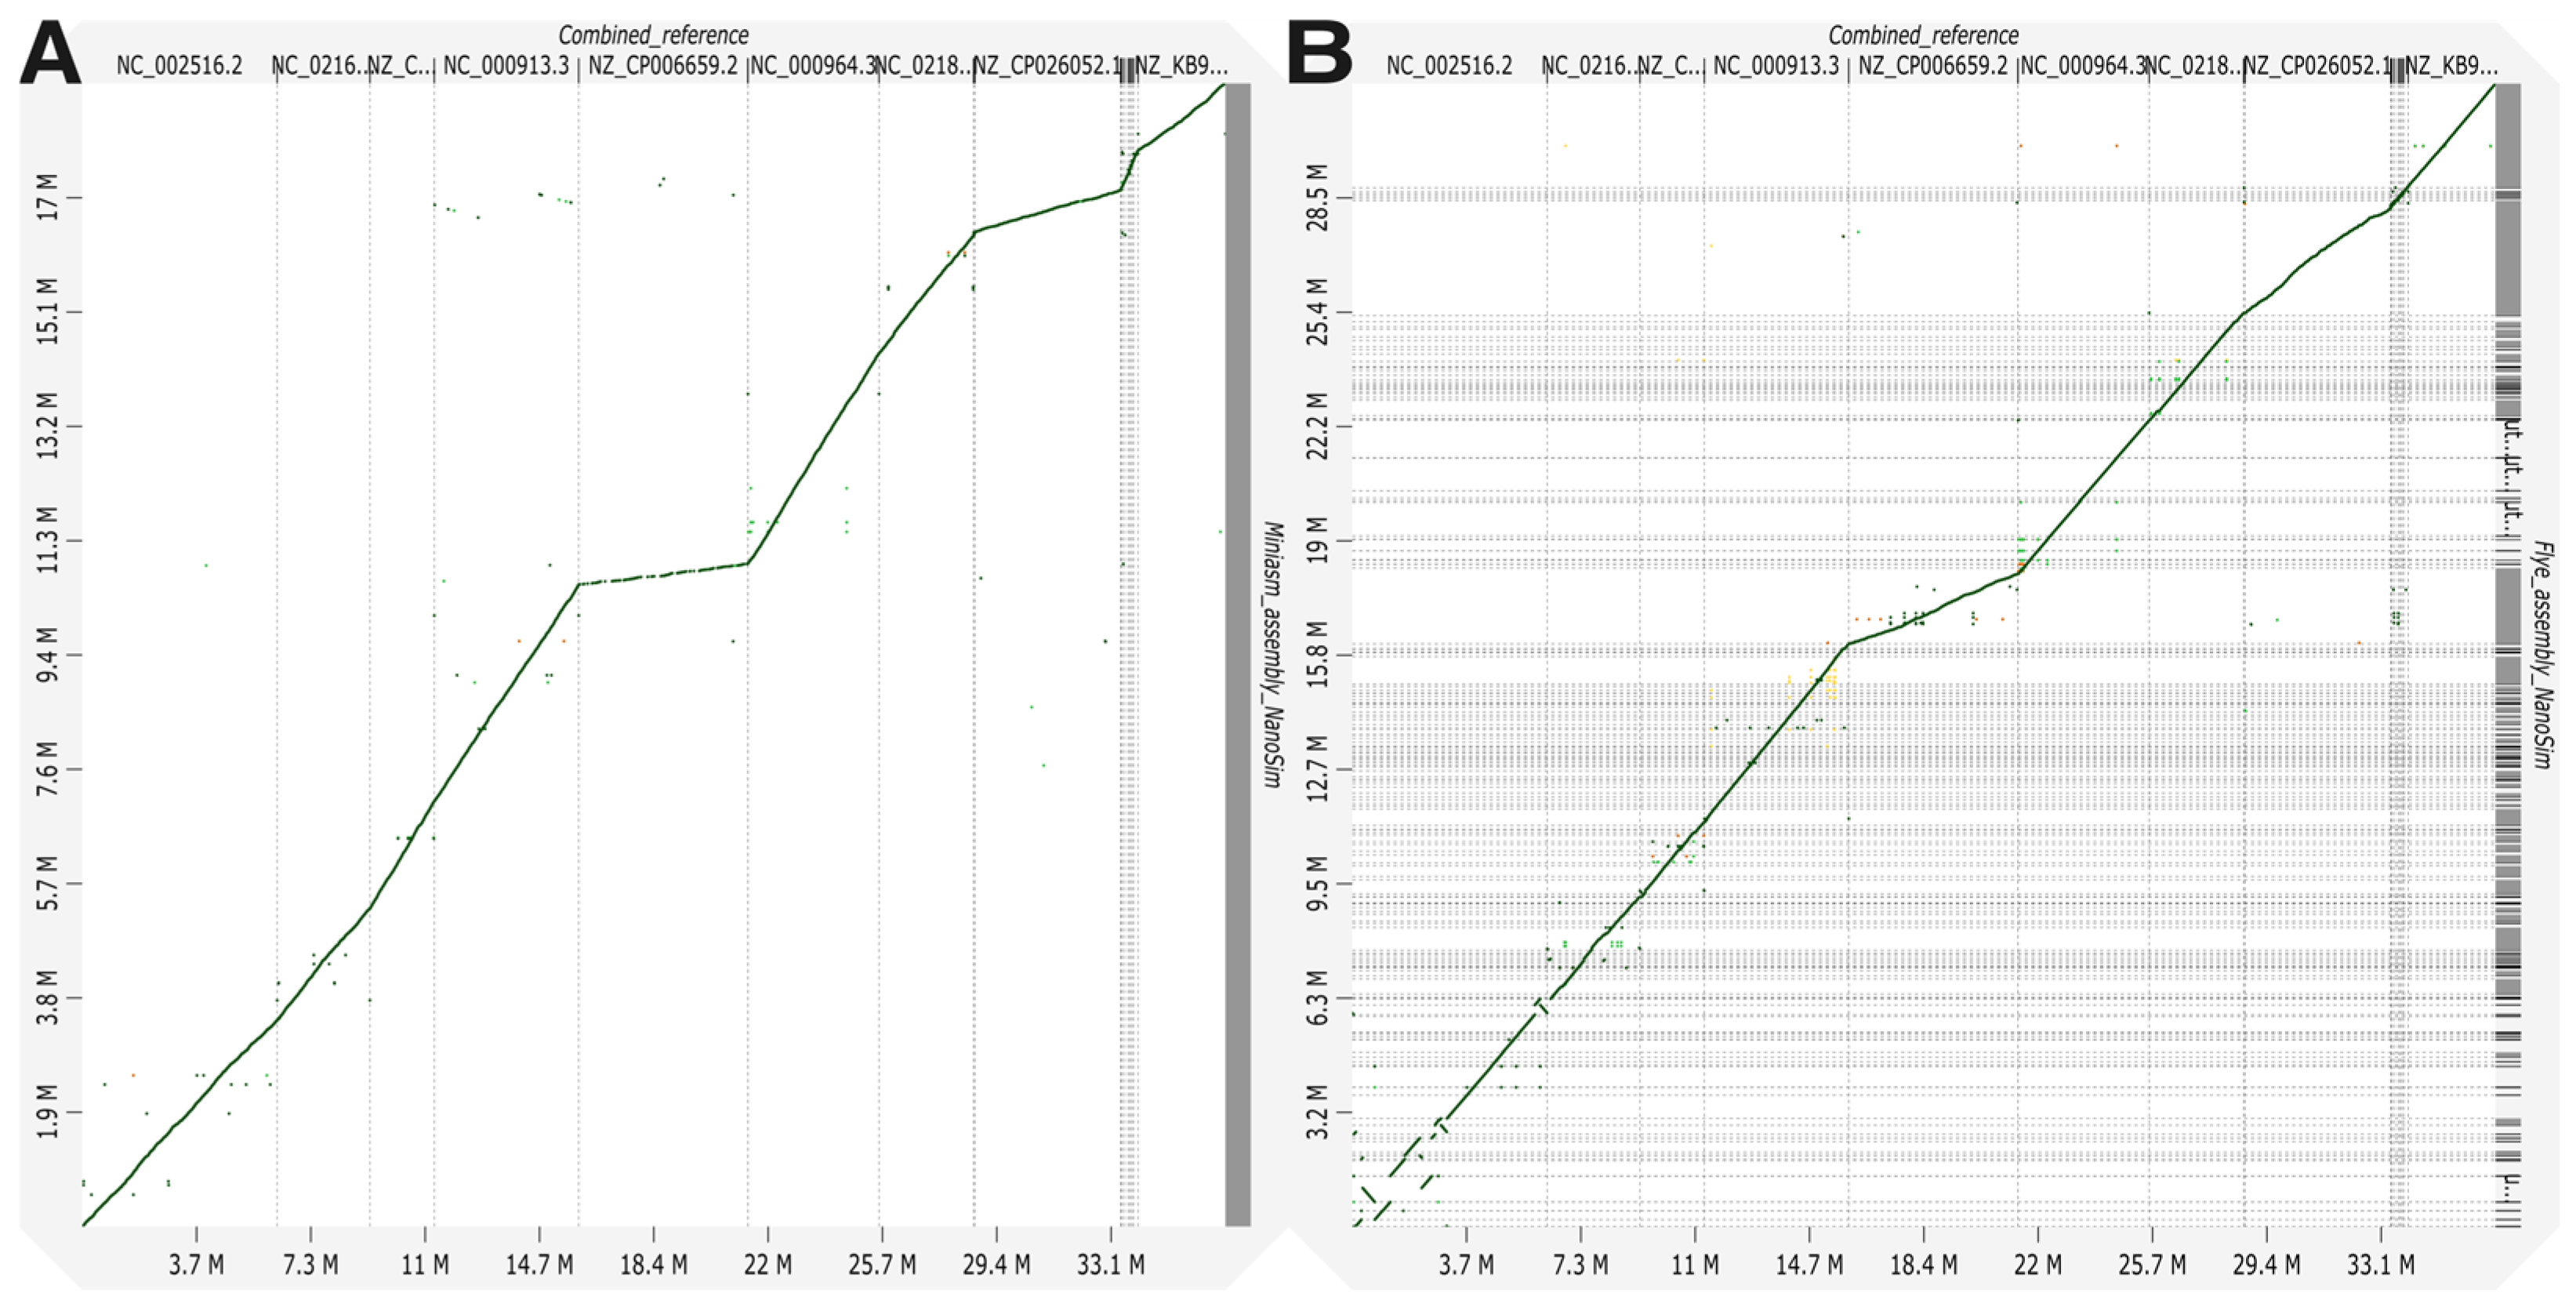
3. Results and Discussion
3.1. Bacterial-Only Metagenome Assessment
3.2. Host-Pathogen Sample Generation
4. Conclusions
Author Contributions
Funding
Institutional Review Board Statement
Informed Consent Statement
Data Availability Statement
Acknowledgments
Conflicts of Interest
References
- Handelsman, J.; Rondon, M.R.; Brady, S.F.; Clardy, J.; Goodman, R.M. Molecular Biological Access to the Chemistry of Unknown Soil Microbes: A New Frontier for Natural Products. Chem. Biol. 1998, 5, R245–R249. [Google Scholar] [CrossRef] [PubMed]
- Vecherskii, M.V.; Semenov, M.V.; Lisenkova, A.A.; Stepankov, A.A. Metagenomics: A New Direction in Ecology. Biol. Bull. Russ. Acad. Sci. 2021, 48, S107–S117. [Google Scholar] [CrossRef]
- Fierer, N.; Leff, J.W.; Adams, B.J.; Nielsen, U.N.; Bates, S.T.; Lauber, C.L.; Owens, S.; Gilbert, J.A.; Wall, D.H.; Caporaso, J.G. Cross-Biome Metagenomic Analyses of Soil Microbial Communities and Their Functional Attributes. Proc. Natl. Acad. Sci. USA 2012, 109, 21390–21395. [Google Scholar] [CrossRef] [PubMed]
- Tyson, G.W.; Chapman, J.; Hugenholtz, P.; Allen, E.E.; Ram, R.J.; Richardson, P.M.; Solovyev, V.V.; Rubin, E.M.; Rokhsar, D.S.; Banfield, J.F. Community Structure and Metabolism through Reconstruction of Microbial Genomes from the Environment. Nature 2004, 428, 37–43. [Google Scholar] [CrossRef]
- Von Meijenfeldt, F.A.B.; Arkhipova, K.; Cambuy, D.D.; Coutinho, F.H.; Dutilh, B.E. Robust Taxonomic Classification of Uncharted Microbial Sequences and Bins with CAT and BAT. Genome Biol. 2019, 20, 217. [Google Scholar] [CrossRef]
- Benoit, G.; Raguideau, S.; James, R.; Phillippy, A.M.; Chikhi, R.; Quince, C. High-Quality Metagenome Assembly from Long Accurate Reads with metaMDBG. Nat. Biotechnol. 2024, 42, 1378–1383. [Google Scholar] [CrossRef]
- Chuzel, L.; Sinha, A.; Cunningham, C.V.; Taron, C.H. High-Throughput Nanopore DNA Sequencing of Large Insert Fosmid Clones Directly from Bacterial Colonies. Appl. Environ. Microbiol. 2024, 90, e00243-24. [Google Scholar] [CrossRef]
- Zhou, J.; He, Z.; Yang, Y.; Deng, Y.; Tringe, S.G.; Alvarez-Cohen, L. High-Throughput Metagenomic Technologies for Complex Microbial Community Analysis: Open and Closed Formats. mBio 2015, 6, e02288-14. [Google Scholar] [CrossRef]
- Setubal, J.C. Metagenome-Assembled Genomes: Concepts, Analogies, and Challenges. Biophys. Rev. 2021, 13, 905–909. [Google Scholar] [CrossRef]
- Lu, C.; Peng, Y. Computational Viromics: Applications of the Computational Biology in Viromics Studies. Virol. Sin. 2021, 36, 1256–1260. [Google Scholar] [CrossRef]
- Liu, S.; Moon, C.D.; Zheng, N.; Huws, S.; Zhao, S.; Wang, J. Opportunities and Challenges of Using Metagenomic Data to Bring Uncultured Microbes into Cultivation. Microbiome 2022, 10, 76. [Google Scholar] [CrossRef] [PubMed]
- Sekse, C.; Holst-Jensen, A.; Dobrindt, U.; Johannessen, G.S.; Li, W.; Spilsberg, B.; Shi, J. High Throughput Sequencing for Detection of Foodborne Pathogens. Front. Microbiol. 2017, 8, 2029. [Google Scholar] [CrossRef] [PubMed]
- Espindola, A.S. Simulated High Throughput Sequencing Datasets: A Crucial Tool for Validating Bioinformatic Pathogen Detection Pipelines. Biology 2024, 13, 700. [Google Scholar] [CrossRef]
- Schlaberg, R.; Chiu, C.Y.; Miller, S.; Procop, G.W.; Weinstock, G.; the Professional Practice Committee and Committee on Laboratory Practices of the American Society for Microbiology; the Microbiology Resource Committee of the College of American Pathologists. Validation of Metagenomic Next-Generation Sequencing Tests for Universal Pathogen Detection. Arch. Pathol. Lab. Med. 2017, 141, 776–786. [Google Scholar] [CrossRef]
- Dulanto Chiang, A.; Dekker, J.P. From the Pipeline to the Bedside: Advances and Challenges in Clinical Metagenomics. J. Infect. Dis. 2020, 221, S331–S340. [Google Scholar] [CrossRef]
- Milhaven, M.; Pfeifer, S.P. Performance Evaluation of Six Popular Short-Read Simulators. Heredity 2023, 130, 55–63. [Google Scholar] [CrossRef]
- Tanner, G.; Westhead, D.R.; Droop, A.; Stead, L.F. Simulation of Heterogeneous Tumour Genomes with HeteroGenesis and in Silico Whole Exome Sequencing. Bioinformatics 2019, 35, 2850–2852. [Google Scholar] [CrossRef]
- Fritz, A.; Hofmann, P.; Majda, S.; Dahms, E.; Dröge, J.; Fiedler, J.; Lesker, T.R.; Belmann, P.; DeMaere, M.Z.; Darling, A.E.; et al. CAMISIM: Simulating Metagenomes and Microbial Communities. Microbiome 2019, 7, 17. [Google Scholar] [CrossRef]
- Yang, C.; Lo, T.; Nip, K.M.; Hafezqorani, S.; Warren, R.L.; Birol, I. Characterization and Simulation of Metagenomic Nanopore Sequencing Data with Meta-NanoSim. GigaScience 2023, 12, giad013. [Google Scholar] [CrossRef]
- Wick, R.R. ONT-Only Accuracy: 5 kHz and Dorado 2023. Zenodo. Available online: https://zenodo.org/records/10038673 (accessed on 20 September 2024).
- Wick, R.R. Yet Another ONT Accuracy Test: Dorado v0.5.0 2023. Zenodo. Available online: https://zenodo.org/records/10397818 (accessed on 20 September 2024).
- Zeng, J.; Cai, H.; Peng, H.; Wang, H.; Zhang, Y.; Akutsu, T. Causalcall: Nanopore Basecalling Using a Temporal Convolutional Network. Front. Genet. 2020, 10, 1332. [Google Scholar] [CrossRef]
- BioRender. Available online: https://app.biorender.com/citation/677829ec555ed7c8e986a946 (accessed on 10 January 2025).
- Latorre-Pérez, A.; Villalba-Bermell, P.; Pascual, J.; Vilanova, C. Assembly Methods for Nanopore-Based Metagenomic Sequencing: A Comparative Study. Sci. Rep. 2020, 10, 13588. [Google Scholar] [CrossRef] [PubMed]
- Abou Kubaa, R.; Amoia, S.S.; Altamura, G.; Minafra, A.; Chiumenti, M.; Cillo, F. Nanopore Technology Applied to Targeted Detection of Tomato Brown Rugose Fruit Virus Allows Sequencing of Related Viruses and the Diagnosis of Mixed Infections. Plants 2023, 12, 999. [Google Scholar] [CrossRef] [PubMed]
- Diao, Z.; Lai, H.; Han, D.; Yang, B.; Zhang, R.; Li, J. Validation of a Metagenomic Next-Generation Sequencing Assay for Lower Respiratory Pathogen Detection. Microbiol. Spectr. 2023, 11, e03812-22. [Google Scholar] [CrossRef]
- Khrenova, M.G.; Panova, T.V.; Rodin, V.A.; Kryakvin, M.A.; Lukyanov, D.A.; Osterman, I.A.; Zvereva, M.I. Nanopore Sequencing for De Novo Bacterial Genome Assembly and Search for Single-Nucleotide Polymorphism. Int. J. Mol. Sci. 2022, 23, 8569. [Google Scholar] [CrossRef] [PubMed]
- Li, H. New Strategies to Improve Minimap2 Alignment Accuracy. Bioinformatics 2021, 37, 4572–4574. [Google Scholar] [CrossRef] [PubMed]
- Danecek, P.; Bonfield, J.K.; Liddle, J.; Marshall, J.; Ohan, V.; Pollard, M.O.; Whitwham, A.; Keane, T.; McCarthy, S.A.; Davies, R.M.; et al. Twelve Years of SAMtools and BCFtools. GigaScience 2021, 10, giab008. [Google Scholar] [CrossRef]
- Li, H. Minimap and Miniasm: Fast Mapping and de Novo Assembly for Noisy Long Sequences. Bioinformatics 2016, 32, 2103–2110. [Google Scholar] [CrossRef]
- Vaser, R.; Sović, I.; Nagarajan, N.; Šikić, M. Fast and Accurate de Novo Genome Assembly from Long Uncorrected Reads. Genome Res. 2017, 27, 737–746. [Google Scholar] [CrossRef]
- Kolmogorov, M.; Bickhart, D.M.; Behsaz, B.; Gurevich, A.; Rayko, M.; Shin, S.B.; Kuhn, K.; Yuan, J.; Polevikov, E.; Smith, T.P.L.; et al. metaFlye: Scalable Long-Read Metagenome Assembly Using Repeat Graphs. Nat. Methods 2020, 17, 1103–1110. [Google Scholar] [CrossRef]
- Mikheenko, A.; Prjibelski, A.; Saveliev, V.; Antipov, D.; Gurevich, A. Versatile Genome Assembly Evaluation with QUAST-LG. Bioinformatics 2018, 34, i142–i150. [Google Scholar] [CrossRef]
- Cabanettes, F.; Klopp, C. D-GENIES: Dot Plot Large Genomes in an Interactive, Efficient and Simple Way. PeerJ 2018, 6, e4958. [Google Scholar] [CrossRef] [PubMed]
- Wood, D.E.; Lu, J.; Langmead, B. Improved Metagenomic Analysis with Kraken 2. Genome Biol. 2019, 20, 257. [Google Scholar] [CrossRef] [PubMed]
- Lu, J.; Breitwieser, F.P.; Thielen, P.; Salzberg, S.L. Bracken: Estimating Species Abundance in Metagenomics Data. PeerJ Comput. Sci. 2017, 3, e104. [Google Scholar] [CrossRef]
- Breitwieser, F.P.; Salzberg, S.L. Pavian: Interactive Analysis of Metagenomics Data for Microbiome Studies and Pathogen Identification. Bioinformatics 2020, 36, 1303–1304. [Google Scholar] [CrossRef]
- Espindola, A.S.; Cardwell, K.F. Microbe Finder (MiFi®): Implementation of an Interactive Pathogen Detection Tool in Metagenomic Sequence Data. Plants 2021, 10, 250. [Google Scholar] [CrossRef]
- Stobbe, A.H.; Daniels, J.; Espindola, A.S.; Verma, R.; Melcher, U.; Ochoa-Corona, F.; Garzon, C.; Fletcher, J.; Schneider, W. E-Probe Diagnostic Nucleic Acid Analysis (EDNA): A Theoretical Approach for Handling of next Generation Sequencing Data for Diagnostics. J. Microbiol. Methods 2013, 94, 356–366. [Google Scholar] [CrossRef]
- Gurevich, A.; Saveliev, V.; Vyahhi, N.; Tesler, G. QUAST: Quality Assessment Tool for Genome Assemblies. Bioinformatics 2013, 29, 1072–1075. [Google Scholar] [CrossRef]
- Wick, R.R.; Judd, L.M.; Gorrie, C.L.; Holt, K.E. Unicycler: Resolving Bacterial Genome Assemblies from Short and Long Sequencing Reads. PLoS Comput. Biol. 2017, 13, e1005595. [Google Scholar] [CrossRef]
- Da Silva, K.; Pons, N.; Berland, M.; Plaza Oñate, F.; Almeida, M.; Peterlongo, P. StrainFLAIR: Strain-Level Profiling of Metagenomic Samples Using Variation Graphs. PeerJ 2021, 9, e11884. [Google Scholar] [CrossRef]
- Zhu, K.; Schäffer, A.A.; Robinson, W.; Xu, J.; Ruppin, E.; Ergun, A.F.; Ye, Y.; Sahinalp, S.C. Strain Level Microbial Detection and Quantification with Applications to Single Cell Metagenomics. Nat. Commun. 2022, 13, 6430. [Google Scholar] [CrossRef]
- Chen, Y.; Nie, F.; Xie, S.-Q.; Zheng, Y.-F.; Dai, Q.; Bray, T.; Wang, Y.-X.; Xing, J.-F.; Huang, Z.-J.; Wang, D.-P.; et al. Efficient Assembly of Nanopore Reads via Highly Accurate and Intact Error Correction. Nat. Commun. 2021, 12, 60. [Google Scholar] [CrossRef] [PubMed]

| Organism | SP | RA | # Reads Mapped | Mapq | Assembly Statistics with MetaQUAST | |||||||
|---|---|---|---|---|---|---|---|---|---|---|---|---|
| # Contigs | N50 (kbp) | NGA50 (kbp) | Genome Fraction (%) | |||||||||
| MinR | Flye | MinR | Flye | MinR | Flye | MinR | Flye | |||||
| B. subtilis | MSG | 110000 | 110000 | 59.6 | 54 | 1850 | 436.656 | 2.302 | 436.656 | 2.303 | 99.392 | 83.513 |
| NS | 11.518 | 98823 | 59.6 | 53 | 1335 | 906.356 | 2.389 | 897.144 | 2.274 | 99.621 | 68.313 | |
| E. coli | MSG | 120000 | 119999 | 59.8 | 605 | 1741 | 29.770 | 2.325 | 34.623 | 2.311 | 96.015 | 75.711 |
| NS | 12.565 | 109231 | 59.7 | 243 | 1369 | 56.722 | 2.407 | 61.704 | 2.269 | 98.073 | 64.021 | |
| E. faecalis | MSG | 75000 | 74997 | 59.9 | 24 | 1414 | 322.042 | 2.180 | 321.587 | 2.194 | 97.577 | 92.381 |
| NS | 7.853 | 64507 | 59.9 | 402 | 439 | 11.713 | 2.434 | 8.771 | NA | 94.618 | 35.953 | |
| K. pneumoniae | MSG | 150000 | 150000 | 59.06 | 500 | 2764 | 59.197 | 2.253 | 61.164 | 2.259 | 96.337 | 88.924 |
| NS | 15.707 | 143666 | 58.64 | 581 | 252 | 3.775 | 2.521 | NA | NA | 37.440 | 10.460 | |
| L. fermentum | MSG | 55000 | 54998 | 59.7 | 81 | 999 | 88.468 | 2.186 | 86.192 | 2.192 | 97.247 | 89.566 |
| NS | 5.759 | 45869 | 59.7 | 133 | 701 | 38.395 | 2.392 | 38.395 | 2.293 | 94.035 | 71.668 | |
| L. monocytogenes | MSG | 80000 | 80000 | 59.65 | 89 | 1514 | 264.636 | 2.237 | 262.428 | 2.246 | 96.893 | 90.898 |
| NS | 8.377 | 69162 | 59.65 | 93 | 743 | 79.871 | 2.431 | 59.473 | 2.240 | 95.488 | 54.202 | |
| P. aeruginosa | MSG | 160000 | 160000 | 59.8 | 92 | 2091 | 304.150 | 2.353 | 304.150 | 2.325 | 97.888 | 69.373 |
| NS | 16.754 | 165027 | 59.6 | 85 | 1260 | 296.041 | 2.424 | 242.860 | NA | 98.988 | 45.533 | |
| S. aureus | MSG | 80000 | 80000 | 59.75 | 86 | 1116 | 136.220 | 2.340 | 136.220 | 2.325 | 97.494 | 75.045 |
| NS | 8.377 | 69243 | 59.8 | 97 | 692 | 75.472 | 2.408 | 51.404 | 2.222 | 91.277 | 52.110 | |
| S. enterica | MSG | 125000 | 125001 | 58.867 | 640 | 1793 | 31.082 | 2.337 | 35.386 | 2.321 | 95.890 | 74.873 |
| NS | 13.089 | 113958 | 59.067 | 599 | 300 | 6.159 | 2.536 | 3.498 | NA | 57.236 | 15.050 | |
| Sample | Barley Yellow Dwarf Virus | Puccinia striiformis f. sp. tritici | Xanthomonas translucens pv. undulosa | ||||||||||||
|---|---|---|---|---|---|---|---|---|---|---|---|---|---|---|---|
| RA | # Reads Mapped | Mapq | KB | EM | RA | # Reads Mapped | Mapq | KB | EM | RA | # Reads Mapped | Mapq | KB | EM | |
| 1_MSG | 0 | 0 | 0 | 0 | N | 19233 | 19239 | 30.345 | 18433 | P | 0 | 5 | 0.333 | 0 | N |
| 1_NS | 0 | 0 | 0 | 0 | N | 19.233 | 16337 | 31.923 | 16304 | P | 0 | 3 | 0.667 | 0 | N |
| 2_MSG | 0 | 0 | 0 | 0 | N | 5303 | 5308 | 29.078 | 5081 | P | 0 | 2 | 5.000 | 0 | N |
| 2_NS | 0 | 0 | 0 | 0 | N | 5.303 | 4283 | 29.400 | 4272 | P | 0 | 3 | 1.110 | 0 | N |
| 3_MSG | 0 | 0 | 0 | 0 | N | 11571 | 11576 | 27.886 | 11377 | P | 9189 | 9196 | 59.967 | 9147 | P |
| 3_NS | 0 | 0 | 0 | 0 | N | 11.571 | 9566 | 28.022 | 9551 | P | 9.189 | 7629 | 59.867 | 7611 | P |
| 4_MSG | 0 | 0 | 0 | 0 | N | 7363 | 7373 | 21.974 | 6953 | P | 0 | 84 | 0.747 | 0 | N |
| 4_NS | 0 | 0 | 0 | 0 | N | 7.363 | 6150 | 19.584 | 6141 | P | 0 | 159 | 1.087 | 0 | N |
| 5_MSG | 19793 | 19793 | 60 | 18610 | P | 4084 | 4122 | 33.020 | 3933 | P | 0 | 19 | 1.157 | 0 | N |
| 5_NS | 19.793 | 17337 | 60 | 17324 | P | 4.084 | 3346 | 32.354 | 3325 | P | 0 | 54 | 1.270 | 0 | N |
| 6_MSG | 0 | 0 | 0 | 0 | N | 0 | 6 | 0.167 | 0 | N | 2758 | 2760 | 59.933 | 2654 | P |
| 6_NS | 0 | 0 | 0 | 0 | N | 0 | 8 | 0.185 | 0 | N | 2.758 | 2102 | 59.000 | 2102 | P |
| 7_MSG | 0 | 0 | 0 | 0 | N | 4476 | 4481 | 16.928 | 4266 | P | 5322 | 5322 | 59.933 | 5257 | P |
| 7_NS | 0 | 0 | 0 | 0 | N | 4.476 | 3513 | 17.970 | 3503 | P | 5.322 | 4247 | 59.700 | 4244 | P |
| 8_MSG | 3382 | 3382 | 60 | 3320 | P | 0 | 2 | 0.111 | 0 | N | 9310 | 9454 | 43.280 | 9260 | P |
| 8_NS | 3.382 | 2700 | 60 | 2698 | P | 0 | 1 | 0.056 | 0 | N | 9.31 | 8096 | 42.063 | 7981 | P |
| 9_MSG | 0 | 0 | 0 | 0 | N | 0 | 10 | 0.389 | 0 | N | 18520 | 18520 | 59.933 | 18099 | P |
| 9_NS | 0 | 0 | 0 | 0 | N | 0 | 12 | 1.252 | 0 | N | 18.52 | 16025 | 59.500 | 16020 | P |
| 10_MSG | 0 | 0 | 0 | 0 | N | 0 | 4 | 0.222 | 0 | N | 16140 | 16272 | 59.800 | 15824 | P |
| 10_NS | 0 | 0 | 0 | 0 | N | 0 | 5 | 0.167 | 0 | N | 16.14 | 14013 | 59.533 | 13915 | P |
| 11_MSG | 2947 | 2947 | 60 | 2831 | P | 658 | 663 | 28.289 | 642 | P | 0 | 2 | 1.500 | 0 | N |
| 11_NS | 2.947 | 2324 | 60 | 2323 | P | 0.658 | 589 | 25.293 | 575 | P | 0 | 2 | 2.833 | 0 | N |
| 12_MSG | 24813 | 24812 | 60 | 23676 | P | 0 | 4 | 0.389 | 0 | N | 0 | 8 | 2.500 | 0 | N |
| 12_NS | 24.813 | 21568 | 60 | 21555 | P | 0 | 6 | 1.667 | 0 | N | 0 | 11 | 1.060 | 0 | N |
| 13_MSG | 23626 | 23626 | 60 | 22534 | P | 0 | 6 | 0.019 | 0 | N | 0 | 2 | 0.333 | 0 | N |
| 13_NS | 23.626 | 20117 | 60 | 20103 | P | 0 | 4 | 0.069 | 0 | N | 0 | 3 | 1.890 | 0 | N |
| 14_MSG | 9560 | 9560 | 60 | 9280 | P | 0 | 13 | 0.619 | 0 | N | 0 | 0 | 0 | 0 | N |
| 14_NS | 9.56 | 7666 | 60 | 7664 | P | 0 | 12 | 0.234 | 0 | N | 0 | 5 | 0.600 | 0 | N |
| 15_MSG | 2123 | 2123 | 60 | 2039 | P | 0 | 10 | 0.454 | 0 | N | 3655 | 3656 | 59.967 | 3613 | P |
| 15_NS | 2.123 | 1653 | 59.900 | 1654 | P | 0 | 3 | 1.500 | 0 | N | 3.655 | 2838 | 59.933 | 2838 | P |
| Absolute RA | Relative RA (%) | # Reads Mapped | Mapq | Kraken2 + Bracken Hits | EM (TPR%) |
|---|---|---|---|---|---|
| 500 | 0.5 | 500 | 60 | 490 ± 7 | 100 |
| 100 | 0.1 | 100 | 60 | 98 ± 1 | 100 |
| 50 | 0.05 | 50 | 60 | 48 ± 1 | 100 |
| 10 | 0.01 | 10 | 60 | 9 ± 1 | 80 |
| 5 | 0.005 | 5 | 60 | 4 ± 1 | 40 |
Disclaimer/Publisher’s Note: The statements, opinions and data contained in all publications are solely those of the individual author(s) and contributor(s) and not of MDPI and/or the editor(s). MDPI and/or the editor(s) disclaim responsibility for any injury to people or property resulting from any ideas, methods, instructions or products referred to in the content. |
© 2025 by the authors. Licensee MDPI, Basel, Switzerland. This article is an open access article distributed under the terms and conditions of the Creative Commons Attribution (CC BY) license (https://creativecommons.org/licenses/by/4.0/).
Share and Cite
Ramos Lopez, D.; Flores, F.J.; Espindola, A.S. MeStanG—Resource for High-Throughput Sequencing Standard Data Sets Generation for Bioinformatic Methods Evaluation and Validation. Biology 2025, 14, 69. https://doi.org/10.3390/biology14010069
Ramos Lopez D, Flores FJ, Espindola AS. MeStanG—Resource for High-Throughput Sequencing Standard Data Sets Generation for Bioinformatic Methods Evaluation and Validation. Biology. 2025; 14(1):69. https://doi.org/10.3390/biology14010069
Chicago/Turabian StyleRamos Lopez, Daniel, Francisco J. Flores, and Andres S. Espindola. 2025. "MeStanG—Resource for High-Throughput Sequencing Standard Data Sets Generation for Bioinformatic Methods Evaluation and Validation" Biology 14, no. 1: 69. https://doi.org/10.3390/biology14010069
APA StyleRamos Lopez, D., Flores, F. J., & Espindola, A. S. (2025). MeStanG—Resource for High-Throughput Sequencing Standard Data Sets Generation for Bioinformatic Methods Evaluation and Validation. Biology, 14(1), 69. https://doi.org/10.3390/biology14010069