Simple Summary
The whitemouth croaker Micropogonias furnieri is an important fishery resource on the southwest Atlantic coast. Despite being heavily exploited, there are a few uncertainties regarding the population structure in the transition area between the tropical and warm temperate zones (South Brazilian Bight). In the State of Rio de Janeiro (the northern part of this area), local environmental conditions, such as an upwelling phenomena and large estuarine bays, together with contributions of continental drainage and anthropogenic activities, could determine different croaker populations. The aim of this study was to assess the fine-scale population structure of this species in three localities in Rio de Janeiro State (Brazil) and to compare it with previous studies that used different approaches. Through the combined use of genetic markers (nuclear microsatellites) and otolith signatures (morphometry and chemistry), two genotypic (North + Center/South) and three phenotypic (North + Center + South) populations were found. These results could contribute to a better understanding of the M. furnieri population dynamics and allow a rational management of this important fishing resource.
Abstract
The inshore area of the Southwestern Atlantic between 22 °S and 29 °S (South Brazilian Bight) is a transitional climatic zone, where the tropical and warm temperate provinces mix. In its northern part, i.e., in the coastal waters of Rio de Janeiro, Brazil, local oceanographic conditions, such as upwelling in the north, and great bays with different degrees of anthropogenic influences in the center and south can determine the population structure of several fish stocks. The Whitemouth croaker (Micropogonias furnieri) is one the most heavily exploited fishing resources in this area, but there are still some doubts about its population structure. In this study, through combined analyses using nuclear genetic markers and morphological and geochemical signatures of otoliths, a divergence of individuals between two populations was identified using microsatellites, while a finer spatial structure with three populations (north, center and south, respectively) was found based on otolith shapes and elemental signatures. This regional population structure may have direct implications for rational fisheries management and conservation of the species.
1. Introduction
The whitemouth croaker Micropogonias furnieri, one of the most important fishery resources in Brazil, has been overfished since 1960 [1]. Although the species distribution area covers the entire Brazilian coast, the largest catches occur in the south-southeastern waters [1,2,3]. In the last few years, several studies using different methodologies have attempted to unravel the population structure of M. furnieri along the South American coast. Nevertheless, the results have been somewhat contradictory [1,4,5,6,7].
Regarding the main fishing area, the existence of one, two, or even three distinct population units of M. furnieri has been previously suggested [4,5,6,7,8,9,10,11,12]. A single south-southeasterner coastal population unit has been proposed using biochemical muscle analyses [8], alloenzyme electrophoresis [9] and mitochondrial DNA restriction patterns [6,10] (yellow line, Figure 1). However, two population units were proposed using data from the fisheries and reproductive biology: one distributed from Cabo Frio (23 °S) to Cabo de Santa Marta (29 °S); and another located between Cabo de Santa Marta and Chuí (33 °S), with close agreement between their boundary area [4,5,11] (green line, Figure 1). Later, another study using mitochondrial and nuclear genetic markers suggested the existence of a population unit between 23 °S (center of Rio de Janeiro State) to 29 °S (southern of Santa Catarina) and another one south of 29 °S [7], which closely coincides with the limits of the two populations previously suggested. The proposal for the existence of three population units was based on morphometric and age-determination analyses [1]. The study suggested the existence of one population between Chuí–Rio Grande do Sul (33 °S) and Santa Marta–Santa Catarina (29 °S), a second population between Santa Marta–Santa Catarina and Cabo Frio–Rio de Janeiro (23 °S), and a third population north of Cabo Frio–Rio de Janeiro (blue line, Figure 1). Moreover, using intron size polymorphism analysis (EPIC-PCR), a previous study [12] suggested the existence of a population in Rio de Janeiro (23 °S), another between Santos–São Paulo (24 °S) and Torres–Rio Grande do Sul (29 °S) and a third one between Torres and Chuí–Rio Grande do Sul (33 °S) (brown line, Figure 1). From the studies mentioned above, Rio de Janeiro, and especially the Cabo Frio region, appears to be the northern limit of the southeastern population of M. furnieri in the three studies [6,7,12] and one also pointed out the existence of another population north of Cabo Frio, although they did not present any results to corroborate it [1]. Therefore, the identification of their population units and associated stock boundaries, essential information for conservation requirements and sustainable fisheries management purposes, remains debatable.
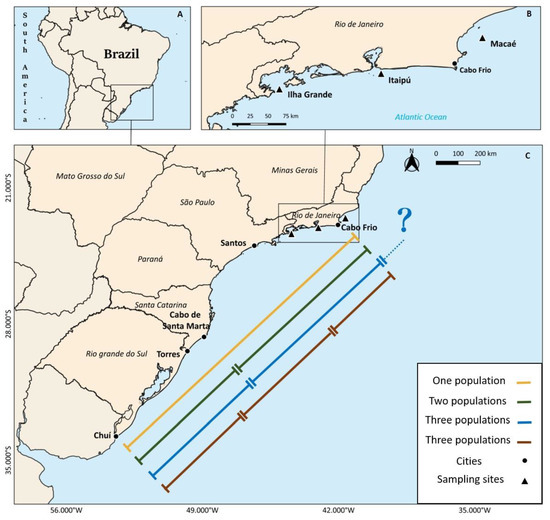
Figure 1.
Location of Brazil in South America (A), and the southeastern‐south Brazilian coast (B), indicating the different population units of Micropogonias furnieri previously described (for further information, see Introduction). In the upper right corner (C), the map of the coast of the State of Rio de Janeiro, Brazil, is presented showing the three areas sampled in this study (black triangles): Macaé (North), Itaipú (Center) and Ilha Grande (South).
Rio de Janeiro is in a transitional climatic zone [13,14,15] and exhibits peculiar local influences, such as a seasonal phenomenon in the north caused by the subtropical convergence waters which bring cold water to the surface on the north coast. The Cabo Frio region is considered by some authors as the limit and a transitional area between the tropical and temperate (or Patagonian) provinces [16,17]. The region is characterized by the existence of cooler outcrops that occur mainly between September and April, when the prevailing winds from the northeast transport waters from the uppermost layers to areas far from the coast, favoring the transport of lower layers deep into the surface layers [18]. This upwelling phenomenon, which brings nutrient-rich cold waters from the bottom to the surface, increases primary productivity and biomass [19]. Although the complexity of the coastal currents in this area makes it challenging to understand them as oceanographic barriers, the Cabo Frio upwelling area could act as a barrier to the dispersal of some species [20,21] (Figure 1).
Among the modern techniques used to study the population structure of fish, nuclear genetic markers and otolith morphology and geochemistry signatures have been of growing interest to scientists. Microsatellites have been widely used in fishery genetics to identify contemporary population structures, revealing subtler patterns than conventional mitochondrial markers [22,23,24]. Moreover, otoliths can be used as complementary natural tags to the molecular markers for studying marine fish populations living in water bodies with spatial heterogeneity. Factors such as extended larval period, large population size, and the absence of physical barriers favor high gene flow that masks genetic spatial differentiation [25,26,27]. Otoliths are calcified structures present in the inner ear of teleost fish with balance and hearing functions. They are species-specific and metabolic inert structures that grow continuously through the deposition of calcium carbonate in concentric layers and incorporate trace elements from the environment [28,29]. Otolith shape and chemical composition appear to be related to exogenous factors such as water salinity and temperature, but they could also be influenced by endogenous factors such as feeding regimes and ontogenetic changes [30,31,32,33]. The intrinsic characteristics of otoliths allow them the preservation of a chronological signature of the environment and therefore help us to identify population units [34,35], fish movements [36,37], habitat connectivity [38,39], and natal areas [40], among others.
The objective of this study was to assess, for the first time, through nuclear markers (microsatellites) and otolith analyses (elemental and morphological signatures), the microscale population structure of M. furnieri on the Rio de Janeiro coastal area, Brazil.
2. Materials and Methods
2.1. Study Area and Fish Sampling
The Southern Brazilian Bight (SBB) is the region along the southwestern Atlantic coast between the latitudes of 22 °S (Cabo de São Tomé–Campos dos Goytacazes/Rio de Janeiro) and 29 °S (Cabo de Santa Marta–Laguna/Santa Catarina). It is a transitional region between the tropical and temperate provinces. There are several upwelling areas that increase productivity across this area; one in the north of Cabo Frio (22.7 °S); another in the south near Cabo de Santa Marta (28.6 °S), and a third, less conspicuous, is near the Ilha Bela coast (23.8 °S). In these areas, seasonal upwelling takes place mainly between September and April, resulting in cold water temperatures that reach 18 °C [41].
Rio de Janeiro is situated in the north of the SBB and has different influences along its 650 km coast extension, encompassing different coastal systems determined by geomorphological and ecological characteristics. In the present study, three localities along the Rio de Janeiro coast, separated by approximately 400 km, were studied: (1) Macaé, located in the north of Cabo Frio (22.7 °S), is the region most influenced by the up-welling; (2) Itaipú (23 °S), located in the center, has the influence of Guanabara Bay, an anthropized estuarine system; and (3) Ilha Grande (23.2 °S), located in the south, has the most environmentally preserved system (Figure 1).
Priviously described hjhjhFor the microsatellite analyses, one hundred individuals of M. furnieri from an unpublished work [42] and historical collection were used. Adult individuals (unknown total length, TL) from the North (n = 18), Center (n = 45) and South (n = 37) were collected between August 2002 and May 2006 (for more details see Table 3.1 of [42]). A muscle portion of the fish dorsal region was removed and stored in ethanol 90%.
For the otolith analyses, ninety individuals were collected between September and October 2016: 30 from the North, 30 from the Center and 30 from the South. All sampled fish were adults (TL > size at first maturity) and ranged between 29.5 and 39.5 cm of TL (to 0.1 cm). Sagittal otoliths were carefully removed, measured (otolith length: OL, to 0.1 cm) and weighed (otolith weight: OW, to 0.001 g). Left otoliths were photographed for shape analyses and right otoliths were preserved clean and dry for elemental chemical analyses.
For both molecular and otolith analyses, fish were collected from the artisanal fishermen over several consecutive days until the desired sampling size was achieved, ensuring that the fishing area corresponded to the landing location.
2.2. Microsatellite Analysis
DNA from muscle tissue samples was extracted using the saline method [43]. Microsatellite genotyping was performed using the tailed primer method [44,45], and twelve microsatellite markers previously developed for M. furnieri were used [42]. Amplification reactions contained 200 M of each dNTP, 2.5 mM of MgCl2, 50 μg acetylated bovine serum albumin (BSA), 0.5 mM of each primer and 0.5 mM of the fluorescent tail, 1 unit of Taq polymerase (Sinapse Inc., Hollywood, FL, USA), 1X PCR buffer, and 30 ng of template DNA in a final volume of 15 μL per reaction. PCR thermocycling conditions were one cycle of 94 °C for 5 min followed by 30 cycles of 94 °C for 45 s, 60 °C for 45 s, 72 °C for 45 s. After these first amplification steps, eight more cycles at 94 °C for 45 s, 53 °C for 45 s and 72 °C for 45 s were performed to incorporate fluorescent-labeled primers (tail) into the amplified products. Genotyping, using GeneScan Liz 500 (Thermo fisher Sci. Inc, Waltham, MA, USA) as size standard, was performed in an automated sequencer ABI 3130 at Plataforma Genômica Multifuncional e Multiusuária (IBRAG/UERJ). It is noteworthy to highlight that samples from the North were genotyped and compared to genotypic data generated under the same conditions from a previous study [42].
To evaluate the occurrence of problems inherent to genotyping, such as the presence of null alleles and drop-out alleles, the Micro-Checker 2.2 (Hull, England) [46] was used. After correcting the genotyping problems, the raw data was converted to the input files of all programs used for analysis using Create 1.3.7 (Amherst, MA, USA) [47]. For linkage disequilibrium analyses between all loci pairs, the online version of the GENEPOP program (Montpellier, France) [48] (http://genepop.curtin.edu.au/ (accessed on 4 October 2021)) was used, with 10,000 iterations. A linkage disequilibrium analysis was also performed in Arlequin 3.5 (Bern Switzerland), which sought to identify the presence of associated alleles at a higher frequency than would be expected at random. To calculate the number of alleles of each loci, expected and observed heterozygosities, deviations from the expected Hardy-Weinberg equilibrium and inbreeding coefficient estimates (FIS) in the three populations, GeneAlex 6.5 (Acton, Australia) was used [49,50]. The Arlequin 3.5 [51] was also used to test population structures and compare gene frequencies through pairwise FST and Analysis of Molecular Variance (AMOVA). Genetic structuring was also evaluated with a Bayesian analysis using the STRUCTURE software (Chicago, IL, USA) [52]. This analysis seeks to estimate which number of K populations best explains the data obtained. The algorithm assigns individuals to populations, seeking to minimize Hardy-Weinberg imbalances within these populations. The STRUCTURE program was used for population data analysis. Ten independent runs were made for each of the K values. The K values analyzed ranged from 1 to 6 for the population data set. In each run, 100,000 burn-in replicas were used followed by 1,000,000 Markov chain replicas (MCMC) and was considered an admixture model. Another approach used to identify the most likely number of clusters (or populations) was the ΔK [53]. The ΔK statistic is defined as a second-order measure of the rate of change in the K-dependent probability function, and the highest ΔK value is expected to indicate the most likely K value. The ΔK values were calculated by the STRUCTURE Harvester program [54] from the data obtained in the STRUCTURE runs. The data obtained from the 10 independent STRUCTURE runs for the most likely K were compiled by the CLUMPP program [55] using the Greedy algorithm option, and the structure obtained was visualized in the DISTRUCT program (Stanford, CA, USA) [56]. A correspondence factor analysis (CFA) was used to visualize the distribution of genetic variation among individuals in a multidimensional space. This analysis was performed using Genetix 4.02 (Montpellier, France) [57]. Maximum likelihood estimates of gene flow between pairs of populations were performed with Migrate-n 5.0.4 [58,59]. This analysis was performed considering a full migration matrix model along 10 long chains with a burn-in of 1 × 10⁵ with 5 independent replicas. To identify the presence of relatedness between individuals (Unrelated, Half Siblings, Full Siblings, and Parent) within each location group, ML-RELATE software (Bozeman, MT, USA) was used [60]. This software uses maximum likelihood estimates to determine which relationships are consistent with genotype data and to compare potential relationships with alternative ones. The related pairs identified by the analysis were then subjected to a hypothesis test using a Likelihood Ratio test for two a priori relationships with a significance threshold of p < 0.05 [60].
2.3. Otolith Analysis
For the shape analyses, the otoliths were photographed on a black background with a Leica 205M stereomicroscope with a MC 170 HD camera and the software Leica Application Suite (LAS V2.0) (Leica Micro-systems, Wetzlar, Germany). Multivariate analysis of otolith shape was performed using elliptical Fourier descriptors (EFDs) according to a shapeR package routine [61]. The sequence of the package includes transforming the images into grayscale and binarizing them using a threshold pixel (a value of 0.3 was used in the Whitemouth croaker otoliths) to collect otolith outlines. The mean otolith shape of the three areas was also obtained. Basically, the analysis describes, in two dimensions, the otolith contours using the sum of sine and cosine functions and adjusting harmonics in relation to the real otolith contour [61]. Each individual consists of four harmonic coefficients (A, B, C and D) and the first 12 harmonics had enough power to represent the otolith outlines. The first three Fourier Coefficients (FCs: A1, B1 and C1) are constants resulting in 45 FCs to test the contours of the catch sites. These coefficients were logarithmized to attend to the parametric assumption and used to compare the three catch locations (PERMANOVA) and the possibility to re-classify the individuals according to the contours with the linear discriminant function analysis (LDFA).
For the chemical analyses, the otoliths were decontaminated with 3% ultrapure hydrogen peroxide (H2O2, Fluka TraceSelect) for 15 min, followed by 1% ultrapure nitric acid (HNO3, Fluka TraceSelect) for 10 s, and then double-washed with ultrapure water (H20, Millli-Q -Water) for 5 min, and then dried in a laminar flow chamber [62]. Otoliths were thereafter weighed (OW, to 0.0001 g) and dissolved overnight with 10% ultrapure HNO3 to a final volume of 15 mL. The whole otolith samples were analyzed by inductively coupled plasma atomic emission spectrometry (ICP-OES) equipped with a cyclonic spray chamber and a Burgener MiraMist nebulizer, under the following conditions: forward power 1000 W, argon flow plasma 12 L/min, sheath gas 0.8 L/min. Otoliths were randomly analyzed to avoid sequence effects. The calibration curve was constructed using six standards made by successive dilutions with the Inorganic Venture multi-element LCA pattern, Christiansburg, VA, USA. The elements to be analyzed were pre-selected based on a previous otolith microchemistry study on this species [63]. Six elements (42Ca, 88Sr, 137Ba, 55Mn, 24Mg, and 63Cu) were consistently detected above the limit of detection limit. A certified reference material (FEBS-1) was used for quality analytical control [64]. The elemental concentrations determined in FEBS-1 were within certified values, and a recovery rate of 90% to 110% was obtained. The accuracy of the replicated analyzes for the individual elements was between 2% and 5% of the relative standard deviation (RSD). The detection limits of the calibration curves using the three-sigma criteria were (in ppb): 42Ca (100), 88Sr (4), 137Ba (20), 55Mn (20), 24Mg (20) and 63Cu (20). Geochemical signatures of otoliths were tested for normality (Shapiro–Wilk, p > 0.05) and homogeneity of variances (Levene, p> 0.05), and data Log(x + 1) transformed if necessary (Ba:Ca and Mn:Ca). To prevent any size/age differences in individuals from influencing the microchemistry results among locations, thereby confounding the spatial variation, an analysis of covariance (ANCOVA) was performed [38,65,66]. Thus, the relationships between the elemental ratios (Element:Ca) and the OW of otoliths were tested by ANCOVA. OW was considered a proxy for age and growth variation and was therefore used as a covariate in ANCOVA. The location was treated as a fixed factor. A One-way Analysis of Variance (ANOVA) was performed to test each Element:Ca ratio separately to identify differences among locations, followed by a Tukey post-hoc test, if needed (p < 0,05). Multivariate analysis of variance (MANOVA) and linear discriminant function analysis (LDFA) were used to explore the variation of multi-elemental signatures among locations [67]. For MANOVA, the Pillai statistic test was used. The reclassification accuracy of each site was assessed by the percentage of cases correctly re-classified through a Jackknife cross-validation analysis (leave-one-out). For a joint approach using multi-elemental signatures and EFDs, a PERMANOVA and a LDFA was performed using the package CARET in R. Statistics were calculated using Systat software 12 (Chicago, IL, USA) and R 4.1.3. Results are presented as mean ± standard errors. A significance level of p < 0.05 was adopted.
3. Results
3.1. Microsatellites
Some deviations from Hardy-Weinberg equilibrium in Mfur 02 (South), Mfur04 (North and South), Mfur07 (South), Mfur10 (South), Mfur12 (North and South), Mfur17(North), Mfur25 (South) and Mfur26 (South) were detected. However, none of the linkage disequilibrium analyses showed significant values, demonstrating independence between the data.
The suspicion of null alleles in markers Mfur02 in the Southern population, Mfur10 in the Center population, and Mfur12 in the North population (p < 0.05) was detected. The number of alleles per loci ranged from 6 at the Mfur20 loci to 33 at the Mfur03 loci with a mean value of 11.722 ± 1.105. Summary statistics for the microsatellite dataset is provided in Table 1.

Table 1.
Basic statistics of microsatellite diversity in M. furnieri sampled at three sites at Rio de Janeiro State (Brazil). TNA = Total number of alleles at each loci; N = sampled individuals; NA = number of alleles; HO = Observed heterozygosity; HE = Expected Heterozygosity; HWE= Probability values of Hardy-Weinberg Equilibrium; FIS= Inbreeding coefficient estimates.
All Pairwise FST comparisons were significant (p < 0.05), with higher values in comparisons between the north and the other locations (Table 2). Bayesian analysis performed in STRUCTURE suggests K = 2 as the more likely number of partitions in the dataset. The Q coefficient bar plot suggested that the North population is the most divergent from the others (Figure 2). This scenario of two populations is also supported by Correspondence factor analysis, which indicates similarity between individuals from the Central and Southern populations in contrast to those from the North (Figure 3). AMOVA analysis also supports this genetic structure scenario, with 10.8% of variance observed among groups (ΦCT = 0.10828; p < 0.01), 0.21% among populations within groups, and 88.9% within populations.
Table 2.
Pairwise FST values between the Micropogonias furnieri populations of the three different locations for the 12 microsatellite loci.
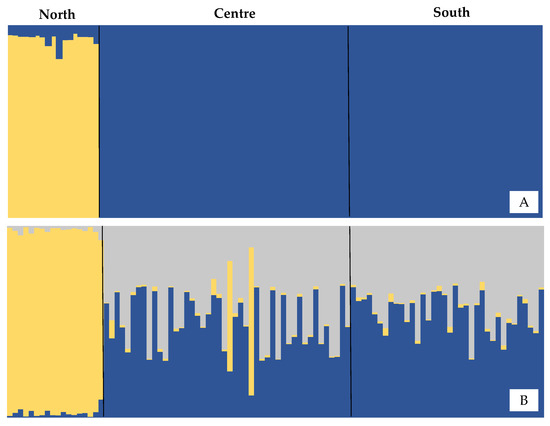
Figure 2.
Q coefficient bar graph for each population, considering K = 2 (A) and K = 3 (B) population units for Micropogonias furnieri.
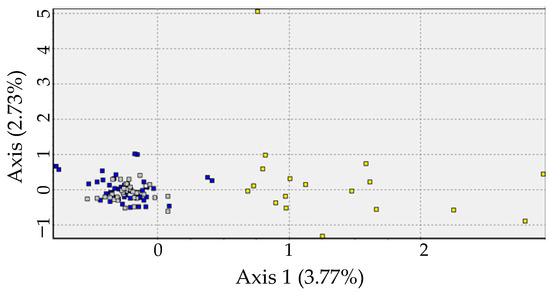
Figure 3.
Relationship of the first two axes of the correspondence factor analysis per individual according to the microsatellite markers found in Micropogonias furnieri in Rio de Janeiro state. Yellow squares: North; grey squares: Center; blue squares: South.
Gene flow analysis showed an asymmetric migration pattern between pairs of locations (Table 3). Theta estimates were 7.20109 (CI 95%: 5.46667–11.46667) for the North, 2.94961 (CI 95%: 0.6667–5.0667) for the Center and 4.57987 (CI 95%: 1.33333–7.46667) for the South.
Table 3.
Asymmetric estimations of gene flow between pairs of populations as calculated in Migrate. M: Mean value of the estimator of migrants per generation; CI 95%: 95% confidence intervals of estimates.
The mean relatedness (k) in the North was 0.035. Only one parent/offspring relationship, one full sibling relationship, and eight half-sibling relationships were confirmed by the hypothesis test (Likelihood Ratio test for two a priori relationships, p < 0.05). In the Center, the mean k was 0.042, with one parent/offspring relationship, 13 full sibling relationships, and 12 half-sibling relationships confirmed by the hypothesis test (Likelihood Ratio test for two a priori relationships, p < 0.05). In the South, k was 0.031, with all 13 half-sibling relationships significant (Likelihood Ratio test for two a priori relationships, p < 0.05). All other pairs of relationships were considered unrelated (total pairs comparisons: 134, 664, 990 for the North, Center, and South, respectively).
3.2. Otoliths
Otolith shape showed differences among the three locations (PERMANOVA, Pseudo-F = 5.08, df = 2, p < 0.01). These differences are reflected in the mean shape at different points as the rostrum and excisura (Figure 4). Overall, a total of 97% of individuals were correctly re-classified to the original site by the Jackknife classification matrix, ranging from 90% in the Center to 100% in the North and South (Table 4, Figure 4).
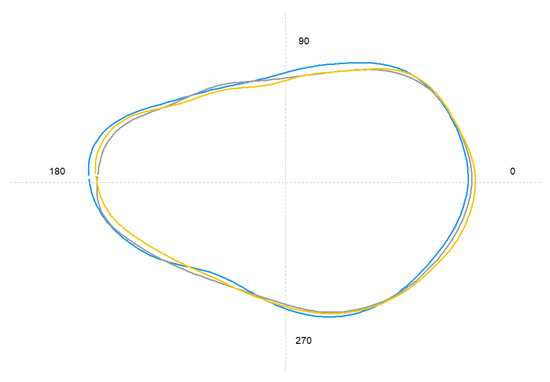
Figure 4.
Average shape of otolith contour extracted from elliptical Fourier descriptors of the three sampling locations (yellow line: North; grey line: Center; blue line: South).
Table 4.
Jackknife re-classification matrix based on Element:Ca ratios (ER), elliptical Fourier descriptors (EFDs) and both methodologies (ER + EFDs) for the North, Center and South locations.
Sr:Ca and Mg:Ca were significantly different between the extreme locations (Figure 5), with Sr:Ca being higher in the South (One-way ANOVA: F = 23.212; df = 2.87; p < 0.001. Tukey-test: p < 0.001) and Mg:Ca in the North (One-way ANOVA: F = 34.336; df = 2.87; p < 0.001. Tukey-test: p < 0.001). The Ba:Ca (One-way ANOVA: F = 87.308; df = 2.87; p < 0.01. Tukey-test: p < 0.01), Mn:Ca (One-way ANOVA F = 95.665, df = 2.87; p < 0.001. Tukey-test: p < 0.001) and Cu:Ca (One-way ANOVA F = 155.724, df = 2.87; p < 0.001. Tukey-test: p < 0.001) ratios were higher in the Center compared with the other two locations (Figure 5). The multi-element signatures also showed differences among locations (MANOVA: Pillai’s test; F = 1.431; df = 10.168; p < 0.001). LFDA depicted a clear separation of the individuals among the 3 locations. Overall, 99% of the individuals were correctly re-classified to the original location by the Jackknife classification matrix, ranging from 97% in the North to 100% in the Center and South (Table 4).
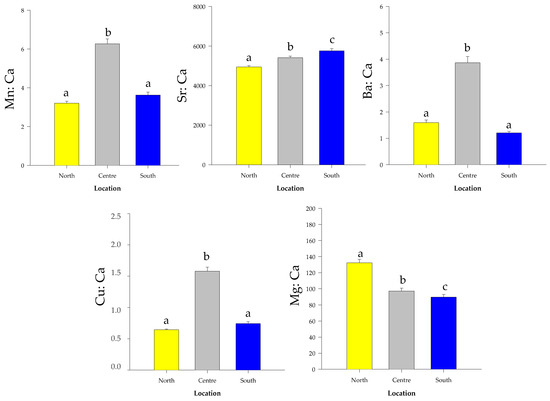
Figure 5.
Element:Ca ratios (mean ± standard errors) of Micropogonias furnieri whole otoliths collected in the three sampling locations. The locations marked with the same letter above the error bars are not significantly different concerning the elemental concentrations (One-way ANOVA, followed by a Tukey test: p < 0.05).
The combined analyses of otolith shape and elemental signatures showed differences among locations (PERMANOVA: Pseudo F = 5.32, df = 2, p < 0.01) and a re-classification success of 100% for the entire dataset was achieved (LDA). Despite the result being similar between EFDs and ER, the three groups seem to be better separated using EFDs + ER (Figure 6).
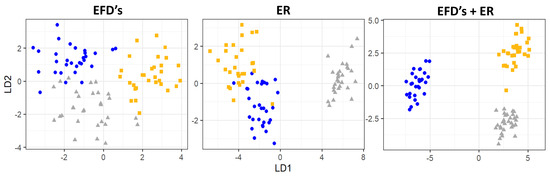
Figure 6.
Scatterplot of the first and second discriminant function scores for the elliptical Fourier descriptors (EFDs), Element:Ca ratios (ER) and both (EFDs + ER) for Micropogonias furnieri individuals sampled in the study area (yellow squares: North; grey squares: Center; blue squares: South).
4. Discussion
Combined analyses of microsatellites and otolith morphology and elemental signatures have allowed us to unravel, for the first time, the fine-scale population structure of Whitemouth croaker in Rio de Janeiro State Coast, Brazil.
The microsatellite dataset supports the occurrence of two genetic clusters with consistent genetic difference between individuals of the North and the other two locations. This scenario is supported by multiple lines of evidence, namely Bayesian analysis, as implemented in STRUCTURE, AMOVA, the correspondence factor analysis and the gene flow analysis, which showed an asymmetric migration pattern between pairs of locations. Values of the fixation index FST also suggest the occurrence of heterogeneity among samples of M. furnieri collected along the coast of Rio de Janeiro, but with slight differences. Higher values of FST were observed in the comparisons between the North and the other two populations, although a lower but significant value was observed between the Central and Southern populations.
The shape and elemental otolith signatures suggested a similar scenario, but differentiated all the three sampling locations, mainly as a result of a latitudinal gradient for Sr:Ca and Mg:Ca and higher concentrations of Ba:Ca, Mn:Ca and Cu:Ca in the central area. These results suggest that the individuals have inhabited enough time in different water masses throughout their lives and/or present different life history traits. The well-known upwelling at the North, the highly anthropized Guanabara Bay at the Center, and the environmental well preserved Ilha Grande Bay at the South, could somewhat explain these results in the Rio de Janeiro coastal waters.
Our main hypothesis to explain the existence of a clear separation between the North and the other localities is that the limit of the oceanographic provinces (Cabo Frio) is somehow acting as a barrier for the species gene flow, causing a genetic differentiation between the populations at the Northern and Central/Southern areas. The differentiation between these populations in Rio de Janeiro may be due to the intersection of currents, where tropical waters of the Brazilian current meet cold waters of the sub-Antarctic current, giving rise to waters of subtropical convergence or Central Atlantic South Waters (ACAS) [68]. These water bodies flow northwards below the Brazilian Current and seasonally come to surface, giving rise to the upwelling phenomenon [19,41]. One alternative explanation for the observed differences could be a bias caused by relatedness among the samples. However, the relatedness analysis indicated that there were relatively few significant interactions, representing less than 8% of the relationship pairs from each location. It is important to highlight that analysis of gene flow indicates that this barrier seems to be permeable at some level, probably in some seasons of the year where the effects of the upwelling are less pronounced.
Little is known about the permeability effect of the barrier for species distributed across the region, but Cabo Frio in the north of Rio de Janeiro is considered a border of congeneric dividing currents and species populations [13,69]. However, there are some previous findings about the effects of this oceanographic barrier on other fish species, such as the case of the Sciaenidae species Macrodon atricauda in the southeastern region of Brazil, which differs from the M. ancylodon species through shape analysis [70,71], the Mugilidae Mugil liza with a differentiated population unit in Rio de Janeiro inferred from microsatellites [69,72], and, more recently, a new population unit of the Clupeidae Sardinella brasiliensis identified by shape and multi-elemental analyses was found in Rio de Janeiro [34]. Genetic divergences in the populations of the Sciaenidae Atractoscion aequidens and Argyrosomus inodurus were also recorded between the northern and southern Benguela regions, an area known to have a consistent seasonal upwelling mechanism [73,74,75]. The structure of marine populations is usually related to the flow of currents, coastal topography, circulation patterns and water temperatures, but larval retention mechanisms, adult migrations patterns and species life histories also play an important role [70,73,75,76].
Otoliths were efficient tools in ichthyology and can give us clues as to whether fish live in different environments, experience different feeding regimes or have different genetic backgrounds [77,78,79,80,81]. In our study area, the Center is directly influenced by the continental runoff of Guanabara Bay, while the North is influenced by the upwelling with low water temperatures throughout most of the year. These differences could explain the results from both otolith shape and chemical signatures; if the populations are isolated from each other through a barrier or do not move between the studied locations for other reasons, or even if they have inhabited enough time in different water masses throughout their lives to have distinct natural tags.
The data recorded in fish otoliths showed higher concentrations of Mg:Ca in the North and Sr:Ca in the South. Such elemental concentrations present in otoliths are generally imposed by the water surrounding the environment, which constantly responds to variations caused by hydrogeological processes, tidal regimes, precipitation patterns and upwelling phenomena [82]. Upwelling currents bring from the sea floor elemental concentrations previously preserved in the sediment under aphotic conditions. The lower concentration of Sr:Ca found in the North may be related to the temperature difference caused by the upwelling [82,83]. However, the expected increase in the otolith Ba:Ca content also resulting from the upwelling was not observed in the present study. Instead, the higher Ba:Ca found in the Center was probably related to the influence of Guanabara bay and its continental water runoff with low salinity, as found in many studies focused on estuarine waters [29,38,84]. At the same time, this anthropogenic water input could explain the higher relation of Cu:Ca, namely in places contaminated with toxic metals [39,40], and Mn:Ca, with higher concentrations in hypoxic environments, although it also varies with salinity and temperature [85,86].
Several studies showed that the incorporation of vestigial and trace elements in the aragonite matrix of otoliths could be also influenced by physiological variables such as feeding regime, growth and ontogenetic differences and sex-specific variations [87]. That is why the combination of trace elements and contour shape analyses in otoliths has been used to identify spatial segregation in marine fish populations [72,88,89]. In addition, these natural tags are usually related to various abiotic and biotic factors that often allow us to differentiate individuals who occupy different water bodies and/or habitats [90,91,92]. The chemical composition of the whole otoliths provides a tag that integrates the entire life of the fish, from embryonic stages to capture, and can serve as a tracer of a particular group. This raw approach is useful for characterizing chemical tags of groups of fish, and then subsequently tracking the movement or mixture of those groups over time. The chemical composition will remain distinct and identifiable for a period of time, even if the groups move or mix, thereby accreting new otolith material with new chemistry, provided this additional material is minimal [84].
The microsatellite dataset corroborated the feeling that individuals found in Rio de Janeiro coastal waters are not genetically homogenous. The big challenge now is to identify what kind of barrier separates these populations (northern from central/southern individuals). The role of the upwelling phenomena as an oceanographic geographical barrier is well accepted for eggs and larvae that are passively dispersed through water currents [20,21,76]. However, juvenile and adult fish that swim actively would not have great dispersal difficulties. Moreover, M. furnieri adults can perform regular migrations from estuarine areas to continental shelf waters and should not suffer from such limitations. However, the upwelling occurs in the same period of the year in which the spawning of the species takes place in the state of Rio de Janeiro. This species spawns during spring, summer and autumn, coinciding with the upwelling of Cabo Frio in northern area of Rio de Janeiro [93]. This could act as an obstacle to the dispersal of eggs and larvae that will find suitable conditions here for the early life stages [75,76]. Furthermore, these low temperatures could alter physiological factors such as gonadal development and spawning, as this process is usually related to water temperature in fish species [94,95].
Among the obstacles that could cause constraints to the gene flow in marine environments, upwelling cells, environmental waters transitions, and sea surface temperature gradients are known to be incomplete/permeable barriers, leading to the divergence of allopatric populations and species [74,96,97]. Thus, it must be assumed that the difference between the water bodies’ temperatures in the study region, as a result of the Cabo Frio upwelling, is functioning as an effective barrier for the displacement of M. furnieri individuals.
The existence of a population structure in such a small-scale geographic area like that presented here is surprisingly, but not unprecedented, in M. furnieri. Indeed, a previous study found moderate to high genetic divergence among three populations of Whitemouth croaker sampled nearly 200 km apart long the Uruguayan Coast [35]. This highlights that other factors, such as local adaptation to environmental conditions including salinity and temperature, or the use of different bays and/or estuaries, can be important factors for differentiation in M. furnieri. Probably the apparent incongruence among the two population markers used in the current study is likely related to the evolutionary timescale at which each marker varies. Natural tags such as genetic markers are usually more conservative at broader spatio-temporal frames, whereas otolith chemical and morphological markers are usually environmentally dependent phenotypic traits [92]. However, more studies, with larger sample sizes collected in a broad distribution area during a short temporal window and designed specifically to disentangle the role of such environmental variables, are needed to elucidate the complex patterns of the population structure of this important fish species.
5. Conclusions
Nuclear markers suggested the existence of two populations of Micropogonias furnieri in the coast of Rio de Janeiro, geographically separated by Cabo Frio. However, otolith analyses have been able to discriminate the individuals of the three sampling regions in Rio de Janeiro, suggesting three populations instead. This study showed the importance of a holistic approach using genotypic and phenotypic complementary tools to study fish populations. New studies must be carried out to understand the cause behind the differentiation of these populations in this region. To continue to unravel this complex fish population structure, subsequent research should focus on the effects of the upwelling of the Cabo Frio region, the surface currents, the proximity of tropical regions or other environmental factors in its population dynamics.
Author Contributions
Conceptualization, T.P.F., A.V., F.G.A. and A.T.C.; methodology, T.P.F., A.V., J.d.M.G. and A.T.C.; software, T.P.F., A.V. and A.T.C.; validation, T.P.F., A.V., F.G.A. and A.T.C.; formal analysis, T.P.F., A.V. and A.T.C.; investigation, T.P.F.; resources, F.G.A., A.V. and A.T.C.; data curation, T.P.F.; writing—original draft preparation, T.P.F.; writing—review and editing, T.P.F., A.V., F.G.A., J.d.M.G. and A.T.C.; visualization, T.P.F., A.V. and A.T.C.; supervision, F.G.A. and A.T.C.; project administration, T.P.F.; funding acquisition, T.P.F., F.G.A. and A.T.C. All authors have read and agreed to the published version of the manuscript.
Funding
This work was partially supported by a compensatory measure established by the Term of Adjustment of Conduct of responsibility of PetroRio, conducted by the Ministério Público Federal-MPF/RJ, with the implementation of the Fundo Brasileiro para a Biodiversidade—FUNBIO (Grant #16/2017 to FGA) and partially supported by the Strategic Funding UID/Multi/ 04423/2019 through national funds provided by FCT and European Regional Development Fund (ERDF), in the framework of the program PT2020. This research was conducted under SISBIO Collection of Species Permit number 10707 issued by ICMBio, Brazilian Environmental Agency. Grants for TPF were provided by the Fundação Carlos Chagas Filho de Amparo à Pesquisa do Estado do Rio de Janeiro—FAPERJ (PDR10 E-26/202.301/2018 and E-26/202.302/2018).
Institutional Review Board Statement
The animal study protocol was approved by the Institutional Ethics Committee of Universidade Federal Rural do Rio de Janeiro (protocol code #11874). This research was conducted under SISBIO Collection of Species Permit number 10707 issued by ICMBio, Brazilian Environmental Agency.
Informed Consent Statement
Not applicable.
Data Availability Statement
Not applicable.
Acknowledgments
We are thankful for the invaluable support provided by all the students; for Wagner Uehara and Raissa Moara Barbosa Corrêa, who participated in the field and laboratory activities; and for Rafael Schroeder and João Eduardo Teixeira, for their help with the shape analysis.
Conflicts of Interest
The authors declare no conflict of interest.
References
- Haimovici, M.; Ignacio, J.M. Micropogonias furnieri (Desmarest, 1823). In Análise das Principais Pescarias Comerciais da Região Sudesde-Sul do Brasil: Dinâmica Populacional das Espécies em Exploração, 1st ed.; Cergole, M.C., Ávila-da-Silva, A.O., Rossi- Wongtschowski, C.L.D.B., Eds.; Sér. Doc. Revizee-Score Sul: São Paulo, Brazil, 2005; pp. 101–107. [Google Scholar]
- Vasconcelos, M.; Haimovici, M. Status of white croaker Micropogonias furnieri exploited in southern Brazil according to alternative hypotheses of stock discreetness. Fish. Res. 2006, 80, 196–202. [Google Scholar] [CrossRef]
- Haimovici, M.; Cardoso, L.G.; Unpierre, R.G. Stocks and management units of Micropogonias furnieri (Desmarest, 1823) in southwestern Atlantic. Lat. Am. J. Aquat. Res. 2016, 44, 1080–1095. [Google Scholar] [CrossRef]
- Vazzoler, A.E.A.D.M. Diversificação fisiológica e morfológica de Micropogonias furnieri (Desmarest, 1823) ao sul de Cabo Frio, Brasil. Bol. Do Inst. Ocean. 1971, 20, 1–70. [Google Scholar] [CrossRef]
- Isaac, V.J. Synopsis of biological data on the whitemouth croaker Micropogonias furnieri (Desmarest, l823). FAO Fish. Synop. 1988, 150, 35. [Google Scholar]
- Puchnick-Legat, A.; Levy, J.A. Genetic structure of Brazilian populations of white mouth croaker Micropogronias furnieri (Perciformes: Sciaenidae). Braz. Arch. Biol. Technol. 2006, 49, 429–439. [Google Scholar] [CrossRef]
- de Vasconcellos, A.V.; Lima, D.; Bonhomme, F.; Vianna, M.; Solé-Cava, A.M. Genetic population structure of the commercially most important demersal fish in the Southwest Atlantic: The whitemouth croaker (Micropogonias furnieri). Fish. Res. 2015, 167, 333–337. [Google Scholar] [CrossRef]
- Suzuki, H.; Vazzoler, A.E.A.D.M.; Phan, V.N. Estudo electroforético de proteínas de músculo esquelético de Micropogonias furnieri (Desmarest, 1823) da costa SE-S do Brasil. 1, Considerações técnicas. Bol. Inst. Oceanoqr. 1983, 32, 153–165. [Google Scholar] [CrossRef]
- Maggioni, R.; Pereira, A.; Jerez, B.; Marins, L.; Conceição, M.; Levy, J.A. Estudio preliminar de la estructura genética de la corvina Micropogonias furnieri, entre Rio Grande (Brasil) y el Rincon (Argentina). Frente Maritmo 1994, 15, 127–131. [Google Scholar]
- Levy, J.A.; Maggioni, R.; Conceição, M.B. Close genetic similarity among populations of the white croaker (Micropogonias furnieri) in the south and south-eastern Brazilian Coast. I. Allozyme studies. Fish. Res. 1998, 39, 87–94. [Google Scholar] [CrossRef]
- Vazzoler, A.E.A.D.M.; Ngan, P.V. Padrões electroforéticos de proteínas gerais de cristalino de Micropogonias furnieri (Demarest, 1823), da costa sudeste-sul do Brasil: Estudo populacional. Bolm. Inst. Oceanogr. 1989, 37, 21–28. [Google Scholar] [CrossRef]
- Lima, D. Genética de Populações da Corvina Micropogonias furnieri e Sistemática Molecular da Maria-da-Toca Bathygobius soporator. Ph.D. Thesis, Universidade Federal do Rio de Janeiro, Rio de Janeiro, Brazil, 2005. [Google Scholar]
- Palacio, F.J. Revisión zoogeográfica marina del sur del Brasil. Bol. Inst. Oceanogr. 1980, 31, 69–92. [Google Scholar] [CrossRef]
- Floeter, S.R.; Soares-Gomes, A. Biogeographic and species richness patterns of Gastropoda on the southwestern Atlantic. Rev. Bras. Biol. 1999, 59, 567–575. [Google Scholar] [CrossRef] [PubMed]
- Araújo, F.G.; Rodrigues, F.L.; Teixeira-Neves, T.P.; Vieira, J.P.; Azevedo, M.C.C.; Guedes, A.P.P.; Garcia, A.M.; Pessanha, A.L.M. Regional patterns in species richness and taxonomic diversity of the nearshore fish community in the Brazilian coast. Estuar. Coast. Shelf Sci. 2018, 208, 9–28. [Google Scholar] [CrossRef]
- Ekman, S. Zoogeography of the Sea, 1st ed.; Sidgwick & Jackson: London, UK, 1953; 417p. [Google Scholar]
- Briggs, J.C. Marine Zoogeography, 1st ed.; McGraw-Hill: New York, NY, USA, 1974; 475p. [Google Scholar]
- Valentin, J.L.; Moreira, A.P. A matéria orgânica de origem zooplanctônica nas âguas de ressurgência de Cabo Frio (Brasil). Pascal Fr. Bibliogr. Databases 1978, 50, 103–112. [Google Scholar]
- Gonzalez-Rodriguez, E.; Valentin, J.V.; Lacerda, D.; Jacob, S.A. Upwelling and downwelling at Cabo Frio (Brazil): Comparison of biomass and primary production responses. J. Plankton Res. 1992, 12, 289–306. [Google Scholar] [CrossRef]
- Kritzer, P.J.; Sale, P.F. (Eds.) Marine Metapopulations, 1st ed.; Elservier: Amsterdam, The Netherlands, 2006; 577p. [Google Scholar]
- Shanks, A.L.; Largier, J.; Brink, L.; Brubaker, J.; Hoof, R. Demonstration of the onshore transport of larval invertebrates by the shoreward movement of an upwelling front. Limnol. Oceanogr. 2000, 45, 230–236. [Google Scholar] [CrossRef]
- Dahle, G.; Johansen, T.; Westgaardc, J.; Aglena, A.; Glover, K.A. Genetic management of mixed-stock fisheries “real-time”: The case of the largest remaining cod fishery operating in the Atlantic in 2007–2017. Fish. Res. 2018, 205, 77–85. [Google Scholar] [CrossRef]
- Moreira, C.; Correia, A.T.; Vaz-Pires, P.; Froufe, E. Genetic diversity and population structure of the blue jack mackerel Trachurus picturatus across its western distribution. J. Fish Biol. 2019, 94, 725–731. [Google Scholar] [CrossRef]
- Moreira, C.; Presa, P.; Correia, A.T.; Vaz-Pires, P.; Froufe, E. Spatio-temporal microsatellite data suggest a multidirectional connectivity pattern in Trachurus picturatus metapopulation from the NE Atlantic. Fish. Res. 2020, 225, 105499. [Google Scholar] [CrossRef]
- Bradbury, I.R.; Campana, S.E.; Bentzen, P. Estimating contemporary early life-history dispersal in an estuarine fish: Integrating molecular and otoliths elemental approaches. Mar. Ecol. 2008, 17, 1438–1450. [Google Scholar] [CrossRef] [PubMed]
- Smith, S.J.; Campana, S.E. Integrated stock mixture analysis for continuous and categorical data, with application to genetic–otolith combinations. Can. J. Fish. Aquat. Sci. 2010, 67, 1533–1567. [Google Scholar] [CrossRef]
- Correia, A.T.; Ramos, A.A.; Barros, F.; Silva, G.; Hamer, P.; Morais, P.; Cunha, R.L.; Castilho, R. Population structure and connectivity of the European conger eel (Conger conger) across the Northeastern-Atlantic and Western- Mediterranean: Integrating molecular and otolith elemental approaches. Mar. Biol. 2012, 159, 1509–1525. [Google Scholar] [CrossRef]
- Popper, A.N.; Coombs, S. Auditing mechanisms in teleost fishes: Significant variations in both hearing capabilities and auditory structures are found among species of bony fishes. Am. Sci. 1980, 68, 429–440. [Google Scholar]
- Campana, S.E. Chemistry and composition of fish otoliths: Pathways, mechanisms and applications. Mar. Ecol. Prog. Ser. 1999, 188, 263–297. [Google Scholar] [CrossRef]
- Morales-Nin, B. Review of the growth regulation processes of otolith daily increment formation. Fish. Res. 2000, 46, 53–67. [Google Scholar] [CrossRef]
- Clarke, L.M.; Thorrold, S.R.; David, O. Conover. Population differences in otolith chemistry have a genetic basis in Menidia menidia. Can. J. Fish. Aquat. Sci. 2011, 68, 105–114. [Google Scholar] [CrossRef]
- Avigliano, E.; Velasco, G.; Volpedo, A.V. Use of lapillus otolith microchemistry as an indicator of the habitat of Genidens barbus from different estuarine environments in the southwestern Atlantic Ocean. Environ. Biol. Fish. 2015, 98, 1623–1632. [Google Scholar] [CrossRef]
- Hüssy, K.; Limburg, K.E.; Hélène, D.P.; Thomas, O.R.B.; Cook, K.; Heimbrand, Y.; Blass, M.; Sturrock, A.M. Trace element patterns in otoliths: The role of biomineralization. Rev. Fish. Sci. Aquac. 2020, 29, 445–477. [Google Scholar] [CrossRef]
- Schroeder, R.; Schwingel, P.R.; Pinto, E.; Almeida, A.; Correia, A.T. Stock structure of the Brazilian sardine Sardinella brasiliensis from Southwest Atlantic Ocean inferred from otolith elemental signatures. Fish. Res. 2022, 248, 106192. [Google Scholar] [CrossRef]
- D’Anatro, A.; Pereira, A.N.; Lessa, E.P. Genetic structure of the white croaker, Micropogonias furnieri Desmarest 1823 (Perciformes: Sciaenidae) along Uruguayan coasts: Contrasting marine, estuarine, and lacustrine populations. Environ. Biol. Fish. 2011, 91, 407–420. [Google Scholar] [CrossRef]
- Tanner, S.E.; Pérez, M.; Presa, P.; Thorrold, S.R.; Cabral, H.N. Integrating microsatellite DNA markers and otolith geochemistry to assess population struture ofEuropean hake (Merlucius merluccius). Estuar. Coast. Shelf Sci. 2014, 142, 68–75. [Google Scholar] [CrossRef]
- Tanner, S.; Reis-Santos, P.; Cabral, H.N. Otolith chemistry in stock delineation: A brief overview, current challenges and future prospects. Fish. Res. 2016, 173, 206–213. [Google Scholar] [CrossRef]
- Reis-Santos, P.; Vasconcelos, R.P.; Ruano, M.; Latkoczy, C.; Gunther, D.; Costa, M.J.; Cabral, H. Interspecific variations of otolith chemistry in estuarine fish nurseries. J. Fish Biol. 2008, 72, 2595–2614. [Google Scholar] [CrossRef]
- Maciel, T.R.; Avigliano, E.; Carvalho, B.M.; Miller, N.; Vianna, M. Population structure and habitat connectivity of Genidens genidens (Siluriformes) in tropical and subtropical coasts from Southwestern Atlantic. Estuar. Coast. Shelf Sci. 2020, 242, 106839. [Google Scholar] [CrossRef]
- Avigliano, E.; Pisonero, J.; Dománico, A.; Silva, N.; Sánches, S.; Volpedo, A.V. Spatial segregation and connectivity in young and adult stages of Megaleporinus obtusidens inferred from otolith elemental signatures: Implications for management. Fish. Res. 2018, 204, 239–244. [Google Scholar] [CrossRef]
- Paes, E.T.; Moraes, L.E.; Fernandes, F.C.; Fagundes Netto, E.B.; Gaelzer, L.R. Influência do fenômeno “El Niño” sobre as comunidades de peixes demersais da região de ressurgência de Arraial do Cabo Rio de Janeiro Brasil. In Proceedings of the VIII Colacmar: Congresso Latino-americano sobre Ciências do Mar, Trujillo, Peru, 17–21 October 1999; pp. 36–39. [Google Scholar]
- Vasconcellos, A.V. Diferenciação molecular de estoques de corvinas (Micropogonias furnieri) na costa Atlântica da América do Sul. Ph.D. Thesis, UFRJ Rio de Janeiro, Rio de Janeiro, Brasil, 2012; 203p. [Google Scholar]
- Miller, S.A.; Dykes, D.D.; Polesky, H.F. A simple salting out procedure for extracting DNA from human nucleated cells. Nucleic Acids Res. 1988, 16, 1215. [Google Scholar] [CrossRef]
- Schuelke, M. An economic method for the fluorescent labeling of PCR fragments. Nat. Biotechnol. 2000, 18, 233–234. [Google Scholar] [CrossRef] [PubMed]
- Molecular Ecology Resources Primer Development Consortium; Arias, M.C.; Arnoux, E.; Bell, J.J.; Bernadou, A.; Bino, G.; Blatrix, R.; Bourgout, D.; Carrea, C.; Clamens, A.L.; et al. Permanent Genetic Resources added to Molecular Ecology Resources Databaser. Mol. Ecol. Resour. 2012, 12, 570–572. [Google Scholar] [CrossRef]
- Van Oosterhout, C.; Hutchinson, W.F.; Wills, D.P.M.; Shipley, P. Micro-checker: Software for identifying and correcting genotyping errors in microsatellite data. Mol. Ecol. Notes 2004, 4, 535–538. [Google Scholar] [CrossRef]
- Coombs, J.A.; Letcher, B.H.; Nislow, K.H. CREATE: A software to create input files from diploid genotypic data for 52 genetic software programs. Mol. Ecol. Resour. 2008, 8, 578–580. [Google Scholar] [CrossRef] [PubMed]
- Raymond, M.; Rousset, F. GENEPOP (version 1.2): Population genetics software for exact tests and ecumenicism. J. Hered. 1995, 86, 248–249. [Google Scholar] [CrossRef]
- Peakall, R.; Smouse, P.E. GenAlEx 6.5: Genetic analysis in Excel. Population genetic software for teaching and research-an update. Bioinformatics 2012, 28, 2537–2539. [Google Scholar] [CrossRef] [PubMed]
- Peakall, R.; Smouse, P.E. GENALEX 6: Genetic analysis in Excel. Population genetic software for teaching and research. Mol. Ecol. Notes 2006, 6, 288–295. [Google Scholar] [CrossRef]
- Excoffier, L.; Laval, G.; Schneider, S. Arlequin ver. 3.0: An integrated software package for population genetics data analysis. Evol. Bioinform. 2005, 1, 47–50. [Google Scholar] [CrossRef]
- Pritchard, J.K.; Stephens, M.; Donnelly, P. Inference of population structure using multilocus genotype data. Genetics 2000, 155, 945–959. [Google Scholar] [CrossRef]
- Evanno, G.; Regnaut, S.; Goudet, J. Detecting the number of clusters of individuals using the software structure: A simulation study. Mol. Ecol. 2005, 14, 2611–2620. [Google Scholar] [CrossRef]
- Earl, D.A.; Von Holdt, B.M. STRUCTURE HARVESTER: A website and program for visualizing STRUCTURE output and implementing the Evanno method. Conser. Genet. Resour. 2012, 4, 359–361. [Google Scholar] [CrossRef]
- Jakobsson, M.; Rosenberg, N.A. CLUMPP: A cluster matching and permutation program for dealing with label switching and multimodality in analysis of population structure. Bioinformatics 2007, 23, 1801–1806. [Google Scholar] [CrossRef]
- Rosenberg, N.A. Distruct: A program for the graphical display of population structure. Mol. Ecol. Notes 2004, 4, 137–138. [Google Scholar] [CrossRef]
- Belkhir, K.; Borsa, P.; Chikhi, L.; Raufaste, N.; Bonhomme, F. GENETIX 4.04, Logiciel sous Windows TM Pour la Génétique des Populations. Laboratoire Génome, Populations, Interactions; CNRS UMR 5000; Université de Montpellier II: Montpellier, France, 2004. [Google Scholar] [CrossRef]
- Beerli, P.; Felsenstein, J. Maximum likelihood estimation of a migration matrix and effective population sizes in n subpopulations by using a coalescent approach. Proc. Natl. Acad. Sci. USA 2001, 98, 4563–4568. [Google Scholar] [CrossRef]
- Beerli, P. Comparison of Bayesian and maximum likelihood inference of population genetic parameters. Bioinformatics 2006, 22, 341–345. [Google Scholar] [CrossRef] [PubMed]
- Kalinowski, S.T.; Wagner, A.P.; Taper, M.L. ML-RELATE: A computer program for maximum likelihood estimation of relatedness and relationship. Mol. Ecol. Notes 2006, 6, 576–579. [Google Scholar] [CrossRef]
- Libungan, L.A.; Pálsson, S. ShapeR: An R Package to Study Otolith Shape Variation among Fish Populations. PLoS ONE 2015, 10, e0121102. [Google Scholar] [CrossRef]
- Patterson, H.M.; Thorrold, S.R.; Shenker, J.M. Analysis of otolith chemistry in Nassau grouper (Epinephelus striatus) from the Bahamas and Belize using solution-based ICPMS. Coral Reefs 1999, 18, 171–178. [Google Scholar] [CrossRef]
- Volpedo, A.V.; Cirelli, A.F. Otolith chemical composition as a useful tool for sciaenid stock discrimination in the south-western Atlantic. Sci. Mar. 2006, 70, 25–334. [Google Scholar] [CrossRef]
- Sturgeon, R.E.; Willie, S.N.; Yang, L.; Greenberg, R.; Spatz, R.O.; Chen, Z.; Scriver, C.; Clancy, V.; Lam, J.W.; Thorrold, S. Certification of a fish otolith reference material in support of quality assurance for trace element analysis. J. Anal. At. Spectrom. 2005, 20, 1067–1071. [Google Scholar] [CrossRef]
- Bath, G.E.; Thorrold, S.R.; Jones, C.M.; Campana, S.E.; Mclaren, J.W.; Lam, J.W.H. Strontium and barium uptake in aragonitic otoliths of marine fish. Geochim. Cosmochim. Acta 2000, 64, 1705–1714. [Google Scholar] [CrossRef]
- Fowler, A.J.; Campana, S.E.; Jones, C.M.; Thorrold, S.R. Experimental assessment of the effect of temperature and salinity on elemental composition of otoliths using laser ablation ICPMS. Can. J. Fish. Aquat. Sci. 1995, 52, 1431–1441. [Google Scholar] [CrossRef]
- Silva, D.M.; Santos, P.; Correia, A.T. Discrimination of Trisopterus luscus stocks in the northern of Portugal using otolith elemental fingerprints. Aquat. Living Resour. 2011, 24, 85–91. [Google Scholar] [CrossRef][Green Version]
- Matano, R.P.; Palma, E.D.; Piola, A.R. The influence of the Brazil and Malvinas Currents on the southwestern Atlantic Shelf circulation. Ocean. Sci. 2010, 6, 983–995. [Google Scholar] [CrossRef]
- Mai, A.C.G.; Miño, C.I.; Marins, L.F.F.; Monteiro-Neto, C.; Miranda, L.; Schwingel, P.R.; Lemos, V.M.; González-Castro, M.; Castello, J.P.; Vieira, J.P. Microsatellite variation and genetic structuring in Mugil liza (Teleostei: Mugilidae) populations from Argentina and Brazil. Estuar. Coast. Shelf Sci. 2014, 149, 80–86. [Google Scholar] [CrossRef]
- Santos, S.; Hrbek, T.; Farias, I.P.; Schneider, H.; Sampaio, I. Population genetic structuring of the king weakfish, Macrodon ancylodon (Sciaenidae), in Atlantic coastal waters of South America: Deep genetic divergence without morphological change. Mol. Ecol. 2006, 15, 4361–4373. [Google Scholar] [CrossRef]
- Carvalho-Filho, A.; Santos, S.; Sampaio, I. Macrodon atricauda (Günther, 1880) (Perciformes: Sciaenidae), a valid species from the southwestern Atlantic, with comments on its conservation. Zootaxa 2010, 2519, 45–58. [Google Scholar] [CrossRef]
- Lemos, V.M.; Monteiro-Neto, C.; Cabral, H.; Vieira, J.P. Stock identification of tainha (Mugil liza) by analyzing stable carbon and oxygen isotopes in otoliths. Fish. Bull. 2017, 115, 201–205. [Google Scholar] [CrossRef]
- Henriques, R.; Potts, W.M.; Santos, C.V.; Sauer, W.H.H.; Shaw, P.W. Population connectivity and phylogeography of a coastal fish, Atractoscion aequidens (Sciaenidae), across the Benguela Current region: Evidence of an ancient vicariant event. PLoS ONE 2014, 9, e87907. [Google Scholar] [CrossRef]
- Henriques, R.; Potts, W.M.; Sauer, W.H.H.; Shaw, P.W. Incipient genetic isolation of a temperate migratory coastal sciaenid fish (Argyrosomus inodorus) within the Benguela Cold Current system. Mar. Biol. Res. 2015, 11, 423–429. [Google Scholar] [CrossRef]
- Henriques, R.; Potts, W.M.; Sauer, W.H.; Santos, C.V.; Kruger, J.; Thomas, J.A.; Shaw, P.W. Molecular genetic, life-history and morphological variation in a coastal warm-temperate sciaenid fish: Evidence for an upwelling-driven speciation event. J. Biogeogr. 2016, 43, 1820–1831. [Google Scholar] [CrossRef]
- Lett, C.; Veitch, J.; Van Der Lingen, C.D.; Hutchings, L. Assessment of an environmental barrier to transport of ichthyoplankton from the southern to the northern Benguela ecosystems. Mar. Ecol. Prog. Ser. 2007, 347, 247–259. [Google Scholar] [CrossRef]
- Secor, D.H.; Dean, M. Somatic growth effects on the otolith -fish size relationship in young pondreared striped bass, Mosone saxatilis. Can. J. Fish. Aquat. Sci. 1989, 46, 113–121. [Google Scholar] [CrossRef]
- Friedland, K.D.; Reddin, D. Use of otolith morphology in stock discriminations of Atlantic salmon (Salmo salar). Can. J. Fish. Aquat. Sci. 1994, 54, 91–98. [Google Scholar] [CrossRef]
- Longmore, C.; Fogarty, K.; Neat, F.; Brophy, D.; Trueman, C.N.; Milton, A.; Mariani, S. A comparison of otolith microchemistry and otolith shape analysis for the study of spatial variation in a deep-sea teleost, Coryphaenoides rupestris. Environ. Biol. Fish. 2010, 89, 591–605. [Google Scholar] [CrossRef]
- Vignon, M.; Morat., F. Environmental and genetic determinant of otolith shape revealed by non-indigenous tropical fish. Mar. Ecol. Prog. Ser. 2010, 411, 231–241. [Google Scholar] [CrossRef]
- Vignon, M. Ontogenetic trajectories of otolith shape during shift in habitat use: Interaction between otolith growth and environment. J. Exp. Mar. Biol. Ecol. 2012, 420–421, 26–32. [Google Scholar] [CrossRef]
- Elsdon, T.S.; Wells, B.K.; Campana, S.E.; Gillanders, B.M.; Jones, C.M.; Limburg, K.E.; Secor, D.H.; Thorrold, S.R.; Walther, B.D. Otolith Chemistry to Describe Movements and Life-History Parameters of Fishes-Hypotheses, Assumptions, Limitations and Inferences, 1st ed.; CRC Press In Oceanography Marine Biology: New York, NY, USA, 2008; p. 34. [Google Scholar] [CrossRef]
- Woodson, L.E.; Wells, B.K.; Grimes, C.B.; Franks, R.P.; Santora, J.A.; Carr, M.H. Water and otolith chemistry identify exposure of juvenile rockfish to upwelled waters in an open coastal system. Mar. Ecol. Prog. Ser. 2013, 473, 261–273. [Google Scholar] [CrossRef]
- Brown, R.J.; Severin, K.P. Otolith chemistry analyses indicate that water Sr:Ca is the primary factor influencing otolith Sr:Ca for freshwater and diadromous fish but not for marine fish. Can. J. Fish. Aquat. Sci. 2009, 66, 1790–1808. [Google Scholar] [CrossRef]
- Limburg, K.E.; Olsonb, C.; Waltherc, Y.; Daled, D.; Slompe, C.P.; Høie, H. Tracking Baltic hypoxia and cod migration over millennia with natural tags. Proc. Natl. Acad. Sci. 2011, 108, 177–182. [Google Scholar] [CrossRef]
- Limburg, K.E.; Walther, B.D.; Lu, Z.; Jackman, G.; Mohan, J.; Walther, Y.; Nissling, A.; Weber, P.K.; Schmitt, A.K. In search of the dead zone: Use of otoliths for tracking fish exposure to hypoxia. J. Mar. Syst. 2015, 141, 167–178. [Google Scholar] [CrossRef]
- Avigliano, E. Optimizing the methodological design in fish stock delineation from otolith chemistry: Review of spatio-temporal analysis scales. Rev. Fish. Sci. Aquac. 2021, 30, 330–345. [Google Scholar] [CrossRef]
- Daros, A.; Spach, H.L.; Correia, A.T. Habitat residency and movement patterns of Centropomus parallelus juveniles in a subtropical estuarine complex. J. Fish. Biol. 2016, 88, 1796–1810. [Google Scholar] [CrossRef]
- Moreira, C.; Froufe, E.; Sial, A.N.; Caeiro, A.; Vaz-Pires, P.; Correia, A.T. Population structure of the blue jack mackerel (Trachurus picturatus) in the NE Atlantic inferred from otolith microchemistry. Fish. Res. 2018, 197, 113–122. [Google Scholar] [CrossRef]
- Carvalho, M.G.; Moreira, C.; Cardoso, J.F.M.F.; Brummer, G.J.A.; Van Gaever, P.; Van Der Veer, H.W.; Queiroga, H.; Santos, P.T.; Correia, A.T. Movement, connectivity and population structure of the intertidal fish Lipophrys pholis as revealed by otolith oxygen and carbon stable isotopes. Mar. Biol. Res. 2017, 13, 764–773. [Google Scholar] [CrossRef]
- Adelir-Alves, J.; Daros, F.A.; Spach, H.L.; Soeth., M.; Correia, A.T. Otoliths as a tool to study reef fish population structure from coastal islands of south Brazil. Mar. Biol. Res. 2018, 14, 973–988. [Google Scholar] [CrossRef]
- Soeth, M.; Spach, H.L.; Daros, F.A.; Adelir-Alvesa, J.; Almeida, A.C.O.; Correia, A.T. Stock structure of Atlantic spadefish Chaetodipterus faber from Southwest Atlantic Ocean inferred from otolith elemental and shape signatures. Fish. Res. 2019, 211, 81–90. [Google Scholar] [CrossRef]
- Costa, M.R.; Araújo, F.G. Use of a tropical bay in south eastern Brazil by juvenile and subadult Micropogonias furnieri (Perciformes.Sciaenidae). ICES J. Mar. Sci. 2003, 60, 268–277. [Google Scholar] [CrossRef]
- Ware, D.M.; Tanasichuk, R.W. Biological basis of maturation and spawning waves in pacific Herring (Clupea harengus pallasi). Can. J. Fish. Aquat. Sci. 1989, 46, 1776–1784. [Google Scholar] [CrossRef]
- Takasuka, A.; Oozeki, Y.; And Kubota, H. Multi-species regime shifts reflect in spawning temperature optima of small pelagic fish in the western North Pacific. Mar. Ecol. Prog. Ser. 2008, 360, 211–217. [Google Scholar] [CrossRef]
- Waters, J.M.; Roy, M.S. Phylogeography of a high-dispersal New Zealand sea-star: Does upwelling block geneflow? Mol. Ecol. 2004, 13, 2797–2806. [Google Scholar] [CrossRef]
- Teske, P.R.; Papadopoulos, I.; Mmonwa, K.L.; Matumba, T.G.; Mcquaid, C.D.; Barker, N.P.; Beheregaray, L.B. Climate-driven genetic divergence of limpets with different life histories across a southeast African marine biogeographic disjunction: Different processes, same outcome. Mol. Ecol. 2011, 20, 5025–5041. [Google Scholar] [CrossRef]


Disclaimer/Publisher’s Note: The statements, opinions and data contained in all publications are solely those of the individual author(s) and contributor(s) and not of MDPI and/or the editor(s). MDPI and/or the editor(s) disclaim responsibility for any injury to people or property resulting from any ideas, methods, instructions or products referred to in the content. |
© 2023 by the authors. Licensee MDPI, Basel, Switzerland. This article is an open access article distributed under the terms and conditions of the Creative Commons Attribution (CC BY) license (https://creativecommons.org/licenses/by/4.0/).