
Effects of Hypoxia on Coral Photobiology and Oxidative Stress

 ,
,  ,
,  ,
,  ,
,  and
and 
Abstract
:Simple Summary
Abstract
1. Introduction
2. Materials and Methods
2.1. Species Collection
2.2. Acclimation Procedure and Hypoxia Exposure
2.3. Chlorophyll a Pulse Amplitude Modulated Fluorometry
2.4. Coral Fragment Preparation and Homogenization Procedure
2.5. Pigment Composition
2.6. Oxidative Stress and Antioxidant Enzyme Assay
2.7. Statistical Analyses
3. Results
3.1. Photobiological Response
3.2. Pigment Content
3.3. Oxidative Stress Biomarkers
4. Discussion
5. Conclusions
Supplementary Materials
Author Contributions
Funding
Institutional Review Board Statement
Informed Consent Statement
Data Availability Statement
Conflicts of Interest
References
- Bopp, L.; Resplandy, L.; Orr, J.C.; Doney, S.C.; Dunne, J.P.; Gehlen, M.; Halloran, P.; Heinze, C.; Ilyina, T.; Séférian, R.; et al. Multiple Stressors of Ocean Ecosystems in the 21st Century: Projections with CMIP5 Models. Biogeosciences 2013, 10, 6225–6245. [Google Scholar] [CrossRef] [Green Version]
- Camp, E.F.; Schoepf, V.; Mumby, P.J.; Hardtke, L.A.; Rodolfo-Metalpa, R.; Smith, D.J.; Suggett, D.J. The Future of Coral Reefs Subject to Rapid Climate Change: Lessons from Natural Extreme Environments. Front. Mar. Sci. 2018, 5, 4. [Google Scholar] [CrossRef] [Green Version]
- Sampaio, E.; Santos, C.; Rosa, I.C.; Ferreira, V.; Pörtner, H.-O.; Duarte, C.M.; Levin, L.A.; Rosa, R. Impacts of Hypoxic Events Surpass Those of Future Ocean Warming and Acidification. Nat. Ecol. Evol. 2021, 5, 311–321. [Google Scholar] [CrossRef] [PubMed]
- Pörtner, H.-O.; Roberts, D.C.; Masson-Delmotte, V.; Zhai, P.; Tignor, M.; Poloczanska, E.; Mintenbeck, K.; Alegría, A.; Nicolai, M.; Okem, A.; et al. (Eds.) IPCC, 2019: Summary for Policymakers. In IPCC Special Report on the Ocean and Cryosphere in a Changing Climate; Cambridge University Press: Cambridge, UK; New York, NY, USA, 2022; pp. 3–35. [Google Scholar] [CrossRef]
- Gattuso, J.-P.; Magnan, A.K.; Bopp, L.; Cheung, W.W.L.; Duarte, C.M.; Hinkel, J.; Mcleod, E.; Micheli, F.; Oschlies, A.; Williamson, P.; et al. Ocean Solutions to Address Climate Change and Its Effects on Marine Ecosystems. Front. Mar. Sci. 2018, 5, 337. [Google Scholar] [CrossRef] [Green Version]
- Henson, S.A.; Beaulieu, C.; Lampitt, R. Observing Climate Change Trends in Ocean Biogeochemistry: When and Where. Glob. Chang. Biol. 2016, 22, 1561–1571. [Google Scholar] [CrossRef] [PubMed] [Green Version]
- Levin, L.A.; Le Bris, N. The Deep Ocean under Climate Change. Science 2015, 350, 766–768. [Google Scholar] [CrossRef] [PubMed] [Green Version]
- Torda, G.; Donelson, J.M.; Aranda, M.; Barshis, D.J.; Bay, L.; Berumen, M.L.; Bourne, D.G.; Cantin, N.; Foret, S.; Matz, M.; et al. Rapid Adaptive Responses to Climate Change in Corals. Nat. Clim. Chang. 2017, 7, 627–636. [Google Scholar] [CrossRef]
- Sørensen, C.; Munday, P.L.; Nilsson, G.E. Aerobic vs. Anaerobic Scope: Sibling Species of Fish Indicate That Temperature Dependence of Hypoxia Tolerance Can Predict Future Survival. Glob. Chang. Biol. 2014, 20, 724–729. [Google Scholar] [CrossRef]
- Hughes, D.J.; Alderdice, R.; Cooney, C.; Kühl, M.; Pernice, M.; Voolstra, C.R.; Suggett, D.J. Coral Reef Survival under Accelerating Ocean Deoxygenation. Nat. Clim. Chang. 2020, 10, 296–307. [Google Scholar] [CrossRef]
- Raj, K.D.; Mathews, G.; Obura, D.O.; Laju, R.L.; Bharath, M.S.; Kumar, P.D.; Arasamuthu, A.; Kumar, T.K.A.; Edward, J.K.P. Low Oxygen Levels Caused by Noctiluca Scintillans Bloom Kills Corals in Gulf of Mannar, India. Sci. Rep. 2020, 10, 22133. [Google Scholar] [CrossRef]
- Altieri, A.H. Dead zones enhance key fisheries species by providing predation refuge. Ecology 2008, 89, 2808–2818. [Google Scholar] [CrossRef]
- Breitburg, D.; Levin, L.A.; Oschlies, A.; Grégoire, M.; Chavez, F.P.; Conley, D.J.; Garçon, V.; Gilbert, D.; Gutiérrez, D.; Isensee, K.; et al. Declining Oxygen in the Global Ocean and Coastal Waters. Science 2018, 359, eaam7240. [Google Scholar] [CrossRef] [PubMed] [Green Version]
- Bijma, J.; Pörtner, H.-O.; Yesson, C.; Rogers, A.D. Climate Change and the Oceans–What Does the Future Hold? Mar. Pollut. Bull. 2013, 74, 495–505. [Google Scholar] [CrossRef]
- Haas, A.F.; Smith, J.E.; Thompson, M.; Deheyn, D.D. Effects of Reduced Dissolved Oxygen Concentrations on Physiology and Fluorescence of Hermatypic Corals and Benthic Algae. PeerJ 2014, 2, e235. [Google Scholar] [CrossRef] [PubMed]
- Klein, S.G.; Steckbauer, A.; Duarte, C.M. Defining CO2 and O2 Syndromes of Marine Biomes in the Anthropocene. Glob. Chang. Biol. 2020, 26, 355–363. [Google Scholar] [CrossRef] [PubMed]
- Vaquer-Sunyer, R.; Duarte, C.M. Thresholds of Hypoxia for Marine Biodiversity. Proc. Natl. Acad. Sci. USA. 2008, 105, 15452–15457. [Google Scholar] [CrossRef] [PubMed] [Green Version]
- Diaz, R.J.; Breitburg, D.L. Chapter 1 The Hypoxic Environment. In Fish Physiology; Elsevier: Amsterdam, The Netherlands, 2009; Volume 27, pp. 1–23. ISBN 978-0-12-374632-0. [Google Scholar]
- Keeling, R.F.; Körtzinger, A.; Gruber, N. Ocean Deoxygenation in a Warming World. Annu. Rev. Mar. Sci. 2010, 2, 199–229. [Google Scholar] [CrossRef] [PubMed] [Green Version]
- Oschlies, A.; Brandt, P.; Stramma, L.; Schmidtko, S. Drivers and Mechanisms of Ocean Deoxygenation. Nat. Geosci. 2018, 11, 467–473. [Google Scholar] [CrossRef]
- Rabalais, N.N.; Díaz, R.J.; Levin, L.A.; Turner, R.E.; Gilbert, D.; Zhang, J. Dynamics and Distribution of Natural and Human-Caused Hypoxia. Biogeosciences 2010, 7, 585–619. [Google Scholar] [CrossRef] [Green Version]
- Stramma, L.; Johnson, G.C.; Sprintall, J.; Mohrholz, V. Expanding Oxygen-Minimum Zones in the Tropical Oceans. Science 2008, 320, 655–658. [Google Scholar] [CrossRef] [PubMed] [Green Version]
- Altieri, A.H.; Harrison, S.B.; Seeman, J.; Collin, R.; Diaz, R.J.; Knowlton, N. Tropical dead zones and mass mortalities on coral reefs. Proc. Natl. Acad. Sci. USA. 2017, 114, 3660–3665. [Google Scholar] [CrossRef] [PubMed] [Green Version]
- Anthony, K.; Bay, L.K.; Costanza, R.; Firn, J.; Gunn, J.; Harrison, P.; Heyward, A.; Lundgren, P.; Mead, D.; Moore, T.; et al. New Interventions Are Needed to Save Coral Reefs. Nat. Ecol. Evol. 2017, 1, 1420–1422. [Google Scholar] [CrossRef] [PubMed]
- Dance, A. These Corals Could Survive Climate Change—and Help Save the World’s Reefs. Nature 2019, 575, 580–582. [Google Scholar] [CrossRef] [PubMed]
- D’Angelo, C.; Wiedenmann, J. Impacts of Nutrient Enrichment on Coral Reefs: New Perspectives and Implications for Coastal Management and Reef Survival. Curr. Opin. Environ. Sustain. 2014, 7, 82–93. [Google Scholar] [CrossRef] [Green Version]
- Munday, P.L. Habitat Loss, Resource Specialization, and Extinction on Coral Reefs: Specialization and extinction. Glob. Chang. Biol. 2004, 10, 1642–1647. [Google Scholar] [CrossRef]
- Pernice, M.; Hughes, D.J. Forecasting Global Coral Bleaching. Nat. Clim. Chang. 2019, 9, 803–804. [Google Scholar] [CrossRef]
- Bourne, D.; Iida, Y.; Uthicke, S.; Smith-Keune, C. Changes in Coral-Associated Microbial Communities during a Bleaching Event. ISME J. 2008, 2, 350–363. [Google Scholar] [CrossRef]
- Liao, B.; Xiao, B.; Li, Z. Coral Reef Ecosystem. In Symbiotic Microbiomes of Coral Reefs Sponges and Corals; Li, Z., Ed.; Springer: Berlin/Heidelberg, Germany, 2019; pp. 1–15. ISBN 978-94-024-1610-7. [Google Scholar]
- Raphael, A.; Dubinsky, Z.; Iluz, D.; Netanyahu, N.S. Neural Network Recognition of Marine Benthos and Corals. Diversity 2020, 12, 29. [Google Scholar] [CrossRef] [Green Version]
- Baird, A.H.; Bhagooli, R.; Ralph, P.J.; Takahashi, S. Coral Bleaching: The Role of the Host. Trends Ecol. Evol. 2009, 24, 16–20. [Google Scholar] [CrossRef]
- Suggett, D.J.; Smith, D.J. Coral Bleaching Patterns Are the Outcome of Complex Biological and Environmental Networking. Glob. Chang. Biol. 2020, 26, 68–79. [Google Scholar] [CrossRef]
- Zhu, B.; Wang, G.; Huang, B.; Tseng, C.K. Effects of Temperature, Hypoxia, Ammonia and Nitrate on the Bleaching among Three Coral Species. Chin. Sci. Bull. 2004, 49, 1923–1928. [Google Scholar] [CrossRef]
- Alva-Basurto, J.C.; Arias-González, J.E. Modelling the Effects of Climate Change on a Caribbean Coral Reef Food Web. Ecol. Modell. 2014, 289, 1–14. [Google Scholar] [CrossRef]
- Figuerola, B.; Grossman, E.L.; Lucey, N.; Leonard, N.D.; O’Dea, A. Millennial-scale Change on a Caribbean Reef System That Experiences Hypoxia. Ecography 2021, 44, 1270–1282. [Google Scholar] [CrossRef]
- Nelson, H.R.; Altieri, A.H. Oxygen: The Universal Currency on Coral Reefs. Coral Reefs 2019, 38, 177–198. [Google Scholar] [CrossRef]
- DeSalvo, M.K.; Estrada, A.; Sunagawa, S.; Medina, M. Transcriptomic Responses to Darkness Stress Point to Common Coral Bleaching Mechanisms. Coral Reefs 2012, 31, 215–228. [Google Scholar] [CrossRef]
- Nielsen, D.A.; Petrou, K.; Gates, R.D. Coral Bleaching from a Single Cell Perspective. ISME J. 2018, 12, 1558–1567. [Google Scholar] [CrossRef]
- Yakovleva, I.; Bhagooli, R.; Takemura, A.; Hidaka, M. Differential Susceptibility to Oxidative Stress of Two Scleractinian Corals: Antioxidant Functioning of Mycosporine-Glycine. Comp. Biochem. Physiol. Part B Biochem. Mol. Biol. 2004, 139, 721–730. [Google Scholar] [CrossRef]
- Grabb, K.C.; Kapit, J.; Wankel, S.D.; Manganini, K.; Apprill, A.; Armenteros, M.; Hansel, C.M. Development of a Handheld Submersible Chemiluminescent Sensor: Quantification of Superoxide at Coral Surfaces. Environ. Sci. Technol. 2019, 53, 13850–13858. [Google Scholar] [CrossRef]
- Oakley, C.A.; Davy, S.K. Cell Biology of Coral Bleaching. In Coral Bleaching; van Oppen, M.J.H., Lough, J.M., Eds.; Ecological Studies; Springer International Publishing: Berlin/Heidelberg, Germany, 2018; Volume 233, pp. 189–211. ISBN 978-3-319-75392-8. [Google Scholar]
- Nilsson, G.E.; Hobbs, J.P.A.; Ostlund-Nilsson, S. Tribute to PL Lutz: Respiratory ecophysiology of coral-reef teleosts. J. Exp. Biol. 2007, 210, 1673–1686. [Google Scholar] [CrossRef] [Green Version]
- Routley, M.H.; Nilsson, G.E.; Renshaw, G.M. Exposure to hypoxia primes the respiratory and metabolic responses of the epaulette shark to progressive hypoxia. Comp. Biochem. Physiol. A Mol. Int. Physiol. 2002, 131, 313–321. [Google Scholar] [CrossRef]
- Diaz, R.J. Overview of hypoxia around the world. J. Environ. Qual. 2001, 30, 275–281. [Google Scholar] [CrossRef] [PubMed]
- Forrest, D.R.; Hetland, R.D.; DiMarco, S.F. Multivariable statistical regression models of the areal extent of hypoxia over the Texas–Louisiana continental shelf. Environ. Res. Lett. 2011, 6, 045002. [Google Scholar] [CrossRef] [Green Version]
- Wu, R.S. Hypoxia: From molecular responses to ecosystem responses. Mar. Pollut. Bull. 2002, 45, 35–45. [Google Scholar] [CrossRef]
- Sarazin, G.; Michard, G.; Prevot, F. A rapid and accurate spectroscopic method for alkalinity measurements in sea water samples. Water Res. 1999, 33, 290–294. [Google Scholar] [CrossRef]
- Stirbet, A.; Lazár, D.; Kromdijk, J.; Govindjee, G. Chlorophyll a Fluorescence Induction: Can Just a One-Second Measurement Be Used to Quantify Abiotic Stress Responses? Photosynthecita 2018, 56, 86–104. [Google Scholar] [CrossRef]
- Strasser, R.J.; Tsimilli-Michael, M.; Srivastava, A. Analysis of the chlorophyll a fluorescence transient. In Hlorophyll a Fluorescence: A Singature of Photosynthesis; Papageorgiou, C., Govindjee, Eds.; Springer: Berlin/Heidelberg, Germany, 2004; pp. 321–362. ISBN 978-1-4020-3218-9. [Google Scholar]
- Strasser, R.J.; Srivastava, A.; Tsimilli-Michael, M. The fluorescence transient as a tool to characterize and screen photosynthetic samples. In Probing Photosynthesis: Mechanisms, Regulation and Adaptation; Yunus, M., Pathre, U., Mohanty, P., Eds.; Taylor and Francis: Boca Raton, FL, USA, 2000; pp. 445–483. [Google Scholar]
- Duarte, B.; Goessling, J.W.; Marques, J.C.; Caçador, I. Ecophysiological Constraints of Aster Tripolium under Extreme Thermal Events Impacts: Merging Biophysical, Biochemical and Genetic Insights. Plant Physiol. Biochem. 2015, 97, 217–228. [Google Scholar] [CrossRef] [PubMed]
- Duarte, B.; Pedro, S.; Marques, J.C.; Adão, H.; Caçador, I. Zostera Noltii Development Probing Using Chlorophyll a Transient Analysis (JIP-Test) under Field Conditions: Integrating Physiological Insights into a Photochemical Stress Index. Ecol. Indic. 2017, 76, 219–229. [Google Scholar] [CrossRef]
- Duarte, B.; Cabrita, M.T.; Gameiro, C.; Matos, A.R.; Godinho, R.; Marques, J.C.; Caçador, I. Disentangling the Photochemical Salinity Tolerance in Aster Tripolium L.: Connecting Biophysical Traits with Changes in Fatty Acid Composition. Plant Biol. J. 2017, 19, 239–248. [Google Scholar] [CrossRef]
- Torres-Pérez, J.L.; Guild, L.S.; Armstrong, R.A.; Corredor, J.; Zuluaga-Montero, A.; Polanco, R. Relative pigment composition and remote sensing reflectance of Caribbean shallow-water corals. PLoS ONE 2015, 10, e0143709. [Google Scholar] [CrossRef]
- Küpper, H.; Seibert, S.; Parameswaran, A. Fast, Sensitive, and Inexpensive Alternative to Analytical Pigment HPLC: Quantification of Chlorophylls and Carotenoids in Crude Extracts by Fitting with Gauss Peak Spectra. Anal. Chem. 2007, 79, 7611–7627. [Google Scholar] [CrossRef]
- Olive, P.L. DNA Precipitation Assay: A Rapid and Simple Method for Detecting DNA Damage in Mammalian Cells. Environ. Mol. Mutagen. 1988, 11, 487–495. [Google Scholar] [CrossRef] [PubMed]
- Ohkawa, H.; Ohishi, N.; Yagi, K. Assay for Lipid Peroxides in Animal Tissues by Thiobarbituric Acid Reaction. Anal. Biochem. 1979, 95, 351–358. [Google Scholar] [CrossRef]
- Bradford, M.M. A Rapid and Sensitive Method for the Quantitation of Microgram Quantities of Protein Utilizing the Principle of Protein-Dye Binding. Anal. Biochem. 1976, 72, 248–254. [Google Scholar] [CrossRef]
- Aebi, H. Catalase in Vitro. In Methods in Enzymology; Elsevier: Amsterdam, The Netherlands, 1984; Volume 105, pp. 121–126. ISBN 978-0-12-182005-3. [Google Scholar]
- McCord, J.M.; Fridovich, I. Superoxide Dismutase. J. Biol. Chem. 1969, 244, 6049–6055. [Google Scholar] [CrossRef]
- Lima, I.; Moreira, S.M.; Osten, J.R.-V.; Soares, A.M.V.M.; Guilhermino, L. Biochemical Responses of the Marine Mussel Mytilus Galloprovincialis to Petrochemical Environmental Contamination along the North-Western Coast of Portugal. Chemosphere 2007, 66, 1230–1242. [Google Scholar] [CrossRef]
- Zuur, A.F.; Ieno, E.N.; Walker, N.J.; Saveliec, A.A.; Smith, G.M. Mixed effects modelling for nested data. In Mixed Effects Models and Extensions in Ecology with R; Gail, M., Krickeber, J.M., Samet, M., Tsiatis, A., Wong, W., Eds.; Statistics for Biology and Health; Springer: New York, NY, USA, 2009; pp. 101–142. ISBN 978-0-387-87457-9. [Google Scholar]
- Fox, J.; Fox, J. Applied Regression Analysis and Generalized Linear Models, 3rd ed.; SAGE: Los Angeles, CA, USA, 2016; ISBN 978-1-4522-0566-3. [Google Scholar]
- Team, C.R. R: A Language and Environment for Statistical Computing; R Foundation for Statistical Computing: Vienna, Austria; Available online: https://www.R-project.org/ (accessed on 16 February 2022).
- Nilsson, G.E.; Östlund-Nilsson, S. Hypoxia in Paradise: Widespread Hypoxia Tolerance in Coral Reef Fishes. Proc. R. Soc. Lond. B 2004, 271, S30–S33. [Google Scholar] [CrossRef] [PubMed] [Green Version]
- Alderdice, R.; Suggett, D.J.; Cárdenas, A.; Hughes, D.J.; Kühl, M.; Pernice, M.; Voolstra, C.R. Divergent Expression of Hypoxia Response Systems under Deoxygenation in Reef-forming Corals Aligns with Bleaching Susceptibility. Glob. Chang. Biol. 2021, 27, 312–326. [Google Scholar] [CrossRef]
- Alderdice, R.; Pernice, M.; Cárdenas, A.; Hughes, D.J.; Harrison, P.L.; Boulotte, N.; Chartrand, K.; Kühl, M.; Suggett, D.J.; Voolstra, C.R. Hypoxia as a physiological cue and pathological stress for coral larvae. Mol. Ecol. 2022, 31, 571–587. [Google Scholar] [CrossRef]
- Feijão, E.; Cruz de Carvalho, R.; Duarte, I.A.; Matos, A.R.; Cabrita, M.T.; Novais, S.C.; Lemos, M.F.L.; Caçador, I.; Marques, J.C.; Reis-Santos, P.; et al. Fluoxetine Arrests Growth of the Model Diatom Phaeodactylum Tricornutum by Increasing Oxidative Stress and Altering Energetic and Lipid Metabolism. Front. Microbiol. 2020, 11, 1803. [Google Scholar] [CrossRef]
- Albright, R. Ocean Acidification and Coral Bleaching. In Coral Bleaching; van Oppen, M.J.H., Lough, J.M., Eds.; Ecological Studies; Springer International Publishing: Berlin/Heidelberg, Germany, 2018; Volume 233, pp. 295–323. ISBN 978-3-319-75392-8. [Google Scholar]
- Warner, M.E.; Fitt, W.K.; Schmidt, G.W. Damage to Photosystem II in Symbiotic Dinoflagellates: A Determinant of Coral Bleaching. Proc. Natl. Acad. Sci. USA 1999, 96, 8007–8012. [Google Scholar] [CrossRef] [Green Version]
- Strasser, R.J.; Stirbet, A.D. Estimation of the Energetic Connectivity of PS II Centres in Plants Using the Fluorescence Rise O–J–I–P. Math. Comput. Simul. 2001, 56, 451–462. [Google Scholar] [CrossRef]
- Feijão, E.; Gameiro, C.; Franzitta, M.; Duarte, B.; Caçador, I.; Cabrita, M.T.; Matos, A.R. Heat Wave Impacts on the Model Diatom Phaeodactylum Tricornutum: Searching for Photochemical and Fatty Acid Biomarkers of Thermal Stress. Ecol. Indic. 2018, 95, 1026–1037. [Google Scholar] [CrossRef]
- Franzitta, M.; Feijão, E.; Cabrita, M.T.; Gameiro, C.; Matos, A.R.; Marques, J.C.; Goessling, J.W.; Reis-Santos, P.; Fonseca, V.F.; Pretti, C.; et al. Toxicity Going Nano: Ionic Versus Engineered Cu Nanoparticles Impacts on the Physiological Fitness of the Model Diatom Phaeodactylum Tricornutum. Front. Mar. Sci. 2020, 7, 539827. [Google Scholar] [CrossRef]
- Ulstrup, K.; Hill, R.; Ralph, P. Photosynthetic Impact of Hypoxia on in Hospite Zooxanthellae in the Scleractinian Coral Pocillopora Damicornis. Mar. Ecol. Prog. Ser. 2005, 286, 125–132. [Google Scholar] [CrossRef]
- Duarte, B.; Matos, A.R.; Caçador, I. Photobiological and Lipidic Responses Reveal the Drought Tolerance of Aster Tripolium Cultivated under Severe and Moderate Drought: Perspectives for Arid Agriculture in the Mediterranean. Plant Physiol. Biochem. 2020, 154, 304–315. [Google Scholar] [CrossRef]
- Finelli, C.M.; Helmuth, B.S.T.; Pentcheff, N.D.; Wethey, D.S. Water Flow Influences OxygenTransport and Photosynthetic Efficiency in Corals. Coral Reefs 2006, 25, 47–57. [Google Scholar] [CrossRef]
- Mass, T.; Genin, A.; Shavit, U.; Grinstein, M.; Tchernov, D. Flow Enhances Photosynthesis in Marine Benthic Autotrophs by Increasing the Efflux of Oxygen from the Organism to the Water. Proc. Natl. Acad. Sci. USA 2010, 107, 2527–2531. [Google Scholar] [CrossRef] [Green Version]
- Roth, M.S. The Engine of the Reef: Photobiology of the Coral–algal Symbiosis. Front. Microbiol. 2014, 5. [Google Scholar] [CrossRef]
- Duarte, B.; Feijão, E.; Goessling, J.W.; Caçador, I.; Matos, A.R. Pigment and Fatty Acid Production under Different Light Qualities in the Diatom Phaeodactylum Tricornutum. Appl. Sci. 2021, 11, 2550. [Google Scholar] [CrossRef]
- Roberty, S.; Furla, P.; Plumier, J.-C. Differential Antioxidant Response between Two Symbiodinium Species from Contrasting Environments: Antioxidant Responses of Symbiodinium sp. Plant Cell Environ. 2016, 39, 2713–2724. [Google Scholar] [CrossRef]
- Wehner, A.; Storf, S.; Jahns, P.; Schmid, V.H. De-epoxidation of violaxanthin in light-harvesting complex I proteins. J. Biol. Chem. 2004, 279, 26823–26829. [Google Scholar] [CrossRef] [PubMed] [Green Version]
- Downs, C.A.; Fauth, J.E.; Halas, J.C.; Dustan, P.; Bemiss, J.; Woodley, C.M. Oxidative Stress and Seasonal Coral Bleaching. Free Radical. Biol. Med. 2002, 33, 533–543. [Google Scholar] [CrossRef]
- Lesser, M.P. Oxidative stress in marine environments: Biochemistry and Physiological Ecology. Annu. Rev. Physiol. 2006, 68, 253–278. [Google Scholar] [CrossRef] [PubMed] [Green Version]
- Lesser, M.P. Experimental Biology of Coral Reef Ecosystems. J. Exp. Mar. Biol. Ecol. 2004, 300, 217–252. [Google Scholar] [CrossRef]
- Dias, M.; Madeira, C.; Jogee, N.; Ferreira, A.; Gouveia, R.; Cabral, H.; Diniz, M.; Vinagre, C. Oxidative Stress on Scleractinian Coral Fragments Following Exposure to High Temperature and Low Salinity. Ecol. Indic. 2019, 107, 105586. [Google Scholar] [CrossRef]
- Abele, D. Toxic Oxygen: The Radical Life-Giver. Nature 2002, 420, 27. [Google Scholar] [CrossRef] [Green Version]
- Teixeira, T.; Diniz, M.; Calado, R.; Rosa, R. Coral Physiological Adaptations to Air Exposure: Heat Shock and Oxidative Stress Responses in Veretillum Cynomorium. J. Exp. Mar. Biol. Ecol. 2013, 439, 35–41. [Google Scholar] [CrossRef]
- Dykens, J.A.; Shick, J.M. Oxygen production by endosymbiotic algae controls superoxide dismutase activity in their animal host. Nature 1982, 297, 579–580. [Google Scholar] [CrossRef]
- Altieri, A.H.; Johnson, M.D.; Swaminathan, S.D.; Nelson, H.R.; Gedan, K.B. Resilience of Tropical Ecosystems to Ocean Deoxygenation. Trends Ecol. Evol. 2021, 36, 227–238. [Google Scholar] [CrossRef]


| Variable | Description |
|---|---|
| Rapid light curves | |
| ETRmax | Maximum ETR obtained from the RLC |
| EK | The onset of light saturation |
| α | Photosynthetic efficiency extracted from the RLC initial slope |
| β | Respiratory efficiency |
| Kautsky curves | |
| Area | Oxidized quinone pool size available for reduction and is a function of the area above the Kautsky plot |
| SM | The energy needed to close all reaction centres |
| M0 | The net rate of PS II reaction centres closure. |
| N | Reaction centre turnover rate |
| PG | Grouping probability between the two PS II units |
| ABS/CS | Absorbed energy flux per cross-section. |
| TR/CS | Trapped energy flux per cross-section. |
| ET/CS | Electron transport energy flux per cross-section. |
| DI/CS | Dissipated energy flux per cross-section |
| RC/CS | The density of available reaction centres (QA-reducing PS II reaction centres) per cross-section |
| RC/ABS | The density of the reaction centres II within the PS II antenna chlorophyll bed |
| PI/ABS | Performance index on equal absorption basis |
| Variable | Mean (Control) | Mean (Hypoxia) | SE | Estimate | t-Value | p |
|---|---|---|---|---|---|---|
| Rapid light curves | ||||||
| ETRmax | 15.3333 | 18.6364 | 0.3804 | 0.1951 | 0.513 | 0.608 |
| EK | 475.8107 | 313.3652 | 0.3994 | −0.4177 | −1.046 | 0.299 |
| α | 0.0422 | 0.0432 | 0.1079 | 0.0223 | 0.206 | 0.837 |
| β | 0.1885 | 0.1811 | 0.0625 | −0.0403 | −0.644 | 0.520 |
| Kautsky curves | ||||||
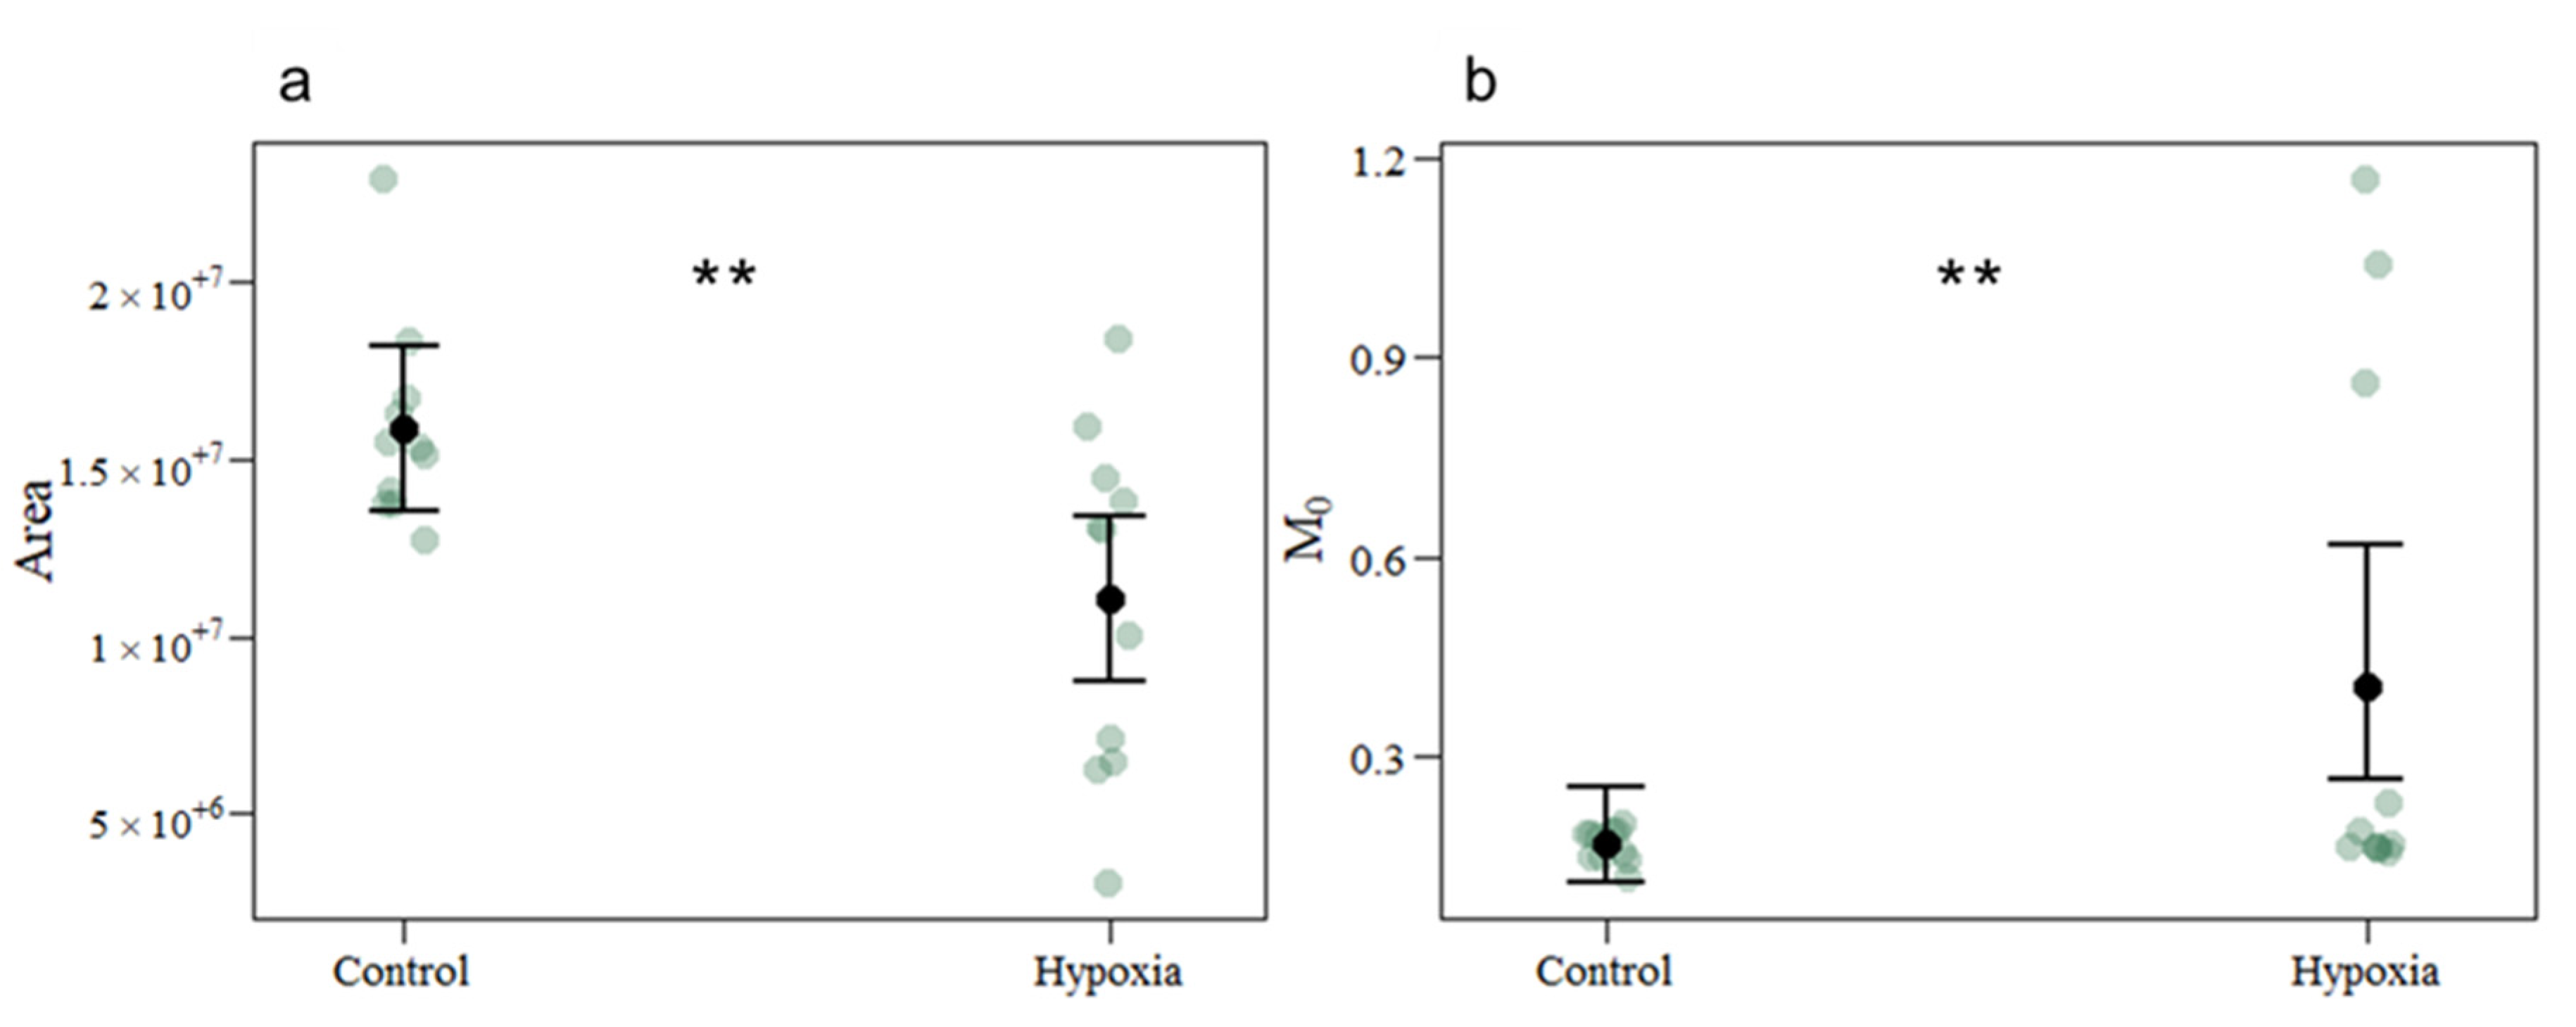
| Area | 15,891,063.4545 | 11,075,497.2727 | 167,746 | −4,815,566 | −2.871 | 0.004 |
| SM | 3696.1655 | 4012.1709 | 181.9 | 316 | 1.738 | 0.082 |
| M0 | 0.1676 | 0.4065 | 0.3021 | 0.8859 | 2.932 | 0.004 |
| N | 6.2543 | 8.1671 | 0.1634 | 0.2668 | 1.633 | 0.103 |
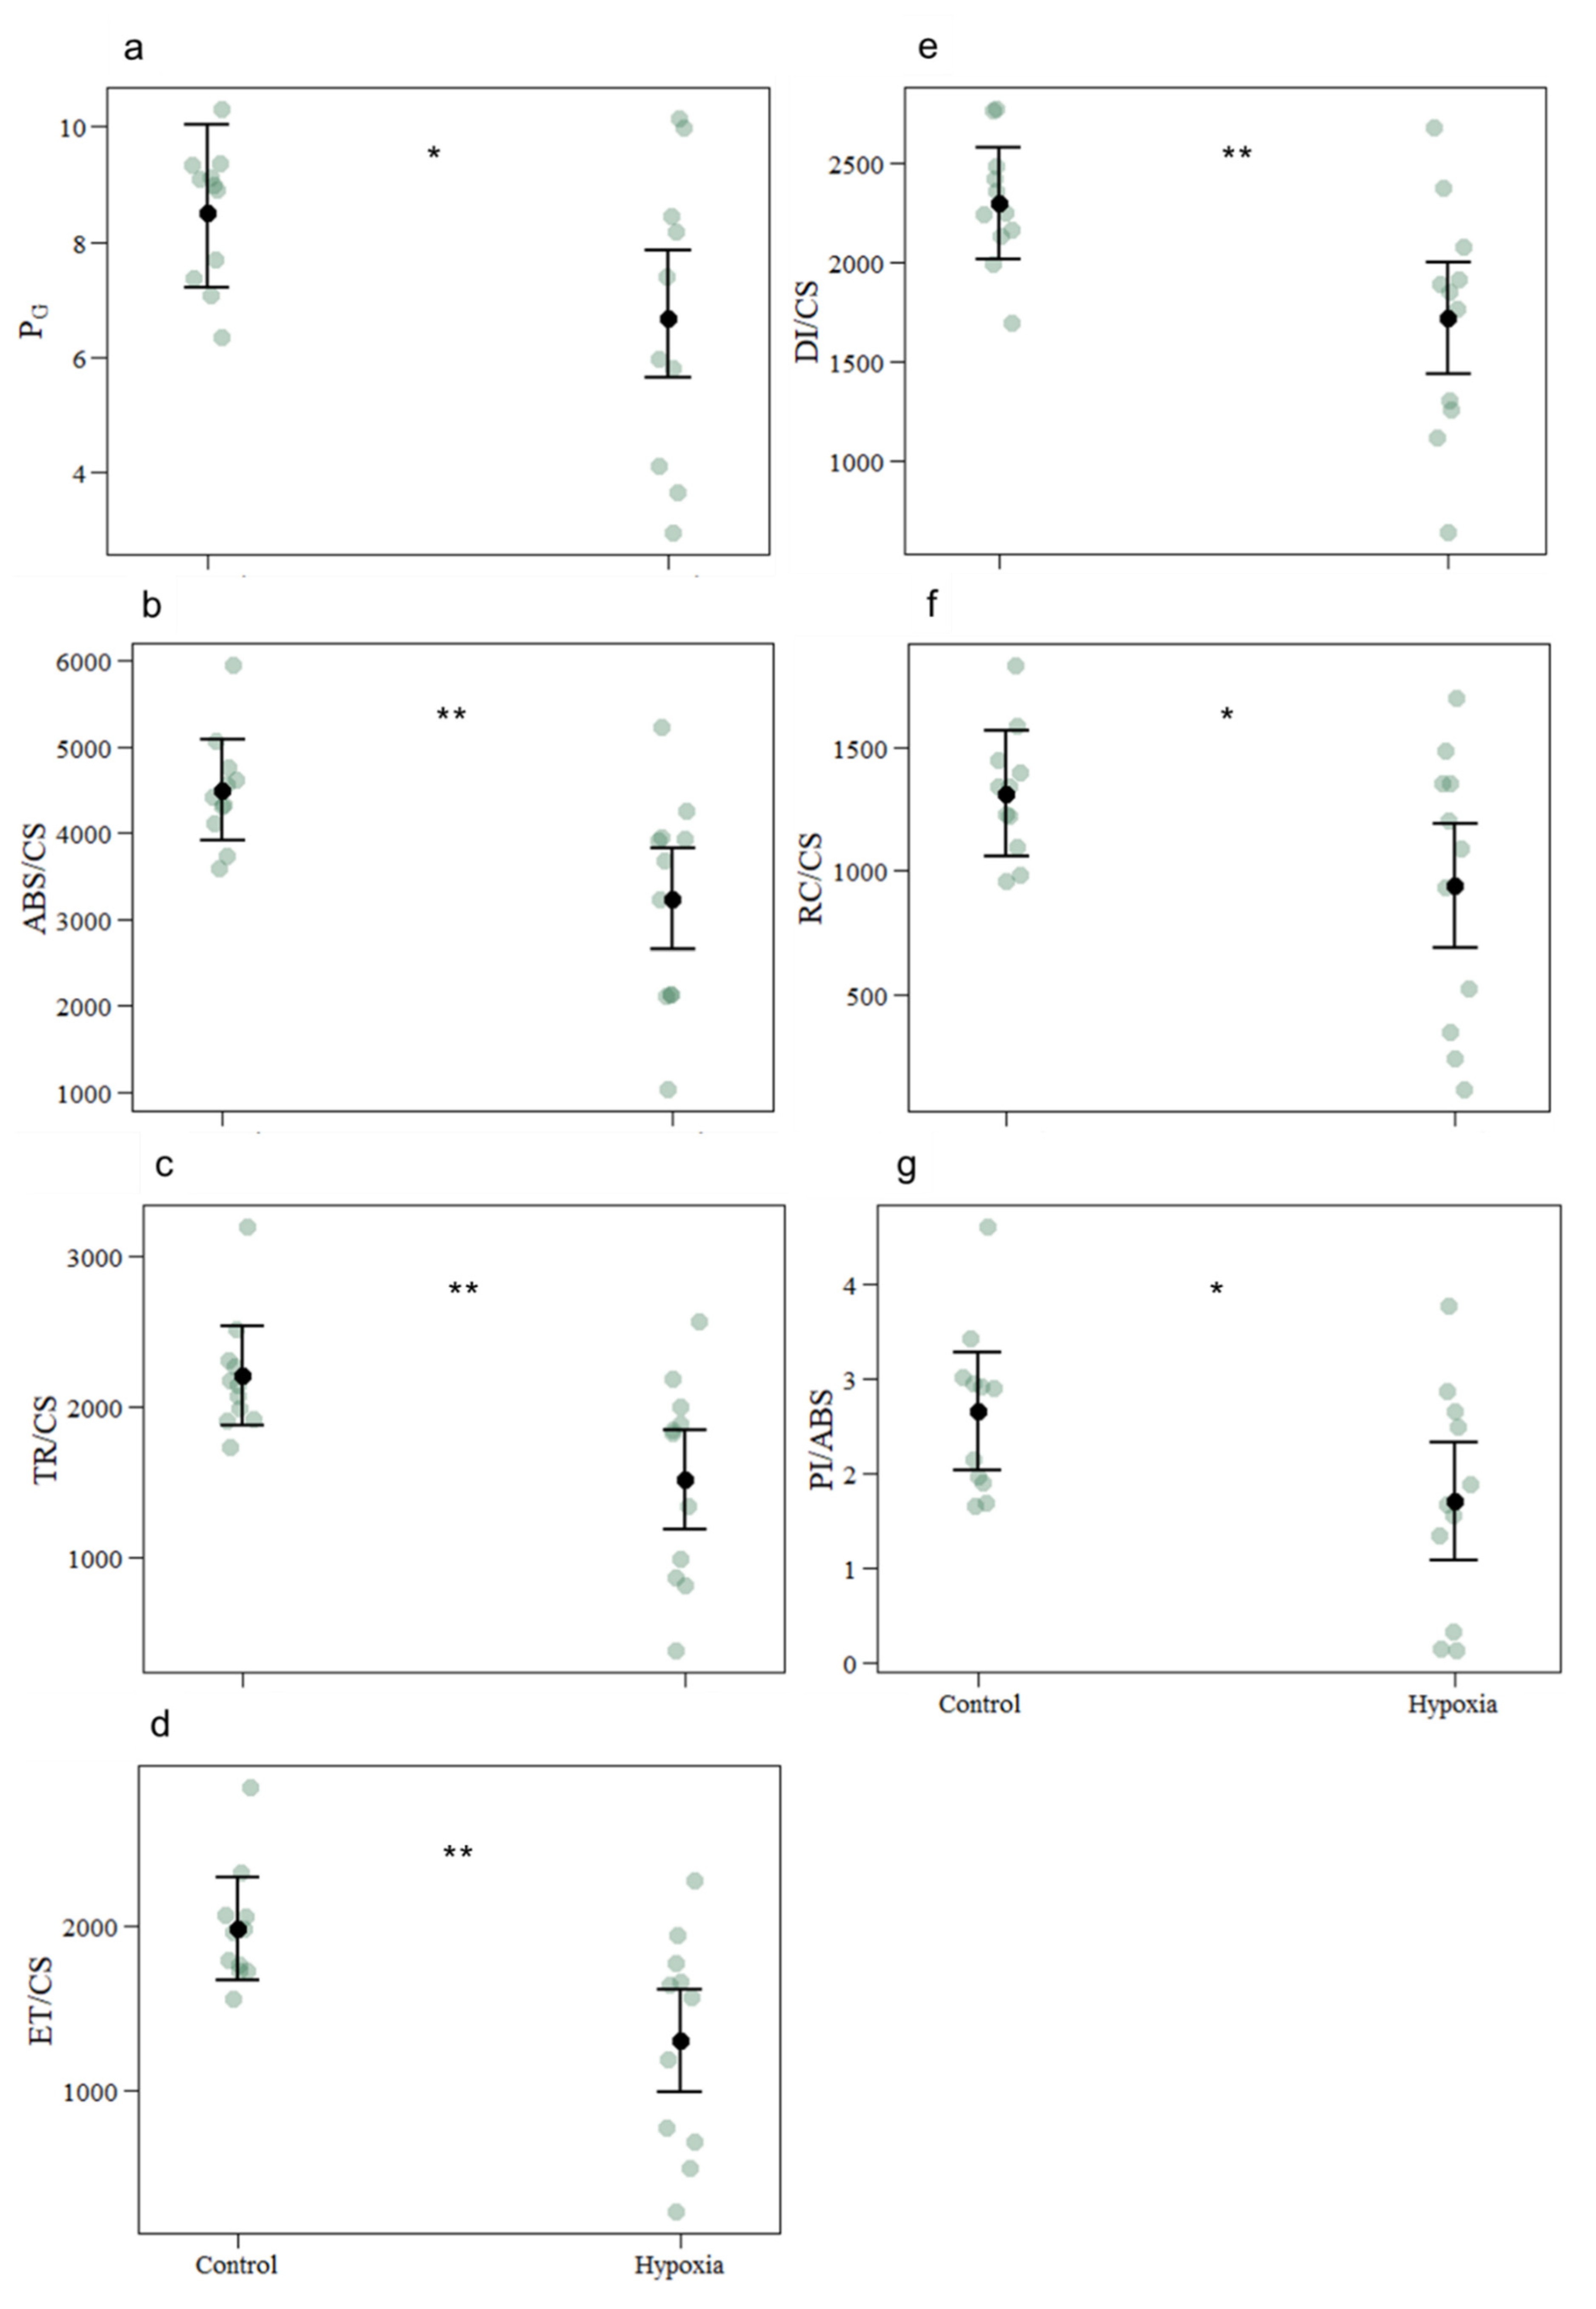
| PG | 8.5090 | 6.6717 | 0.1182 | −0.2433 | −2.058 | 0.040 |
| ABS/CS | 4498.2727 | 3237.8182 | 420.3 | −1260.5 | −2.999 | 0.003 |
| TR/CS | 2201.4657 | 1520.1228 | 236.4 | −681.3 | −2.882 | 0.004 |
| ET/CS | 1982.7497 | 1303.6097 | 223.8 | −679.1 | −3.035 | 0.002 |
| DI/CS | 2296.8070 | 1717.6954 | 201.3 | −579.1 | −2.876 | 0.004 |
| RC/CS | 1311.6541 | 940.8176 | 182.1 | −370.8 | −2.036 | 0.042 |
| RC/ABS | 0.3226 | 0.3094 | 0.0273 | −0.0132 | −0.482 | 0.630 |
| PI/ABS | 2.6528 | 1.7112 | 0.4471 | −0.9416 | −2.106 | 0.035 |
| Pigment composition | ||||||
| Chlorophyll a | 0.0041 | 0.0035 | 0.0004 | −0.0007 | −1.735 | 0.083 |
| Chlorophyll c2 | 3.85 × 10⁻⁵ | 3.2 × 10⁻⁵ | 1.02 × 10⁻⁵ | −6.54 × 10⁻⁶ | −0.640 | 0.522 |
| Pheophytin a | 0.0040 | 0.0043 | 0.0006 | 0.0003 | 0.459 | 0.647 |
| β-carotene | 0.0041 | 0.0037 | 0.0005 | −0.0005 | −1.010 | 0.313 |
| Diadinoxanthin | 1.61 × 10⁻⁴ | 1.29 × 10⁻⁴ | 3.07 × 10⁻⁵ | −3.27 × 10⁻⁵ | −1.065 | 0.287 |
| Diatoxanthin | 1.07 × 10⁻⁴ | 1.41 × 10⁻⁴ | 3.50 × 10⁻⁵ | 3.37 × 10⁻⁵ | 0.963 | 0.336 |
| Peridinin | 1.9686 | 2.3235 | 0.3001 | 0.3549 | 1.183 | 0.237 |
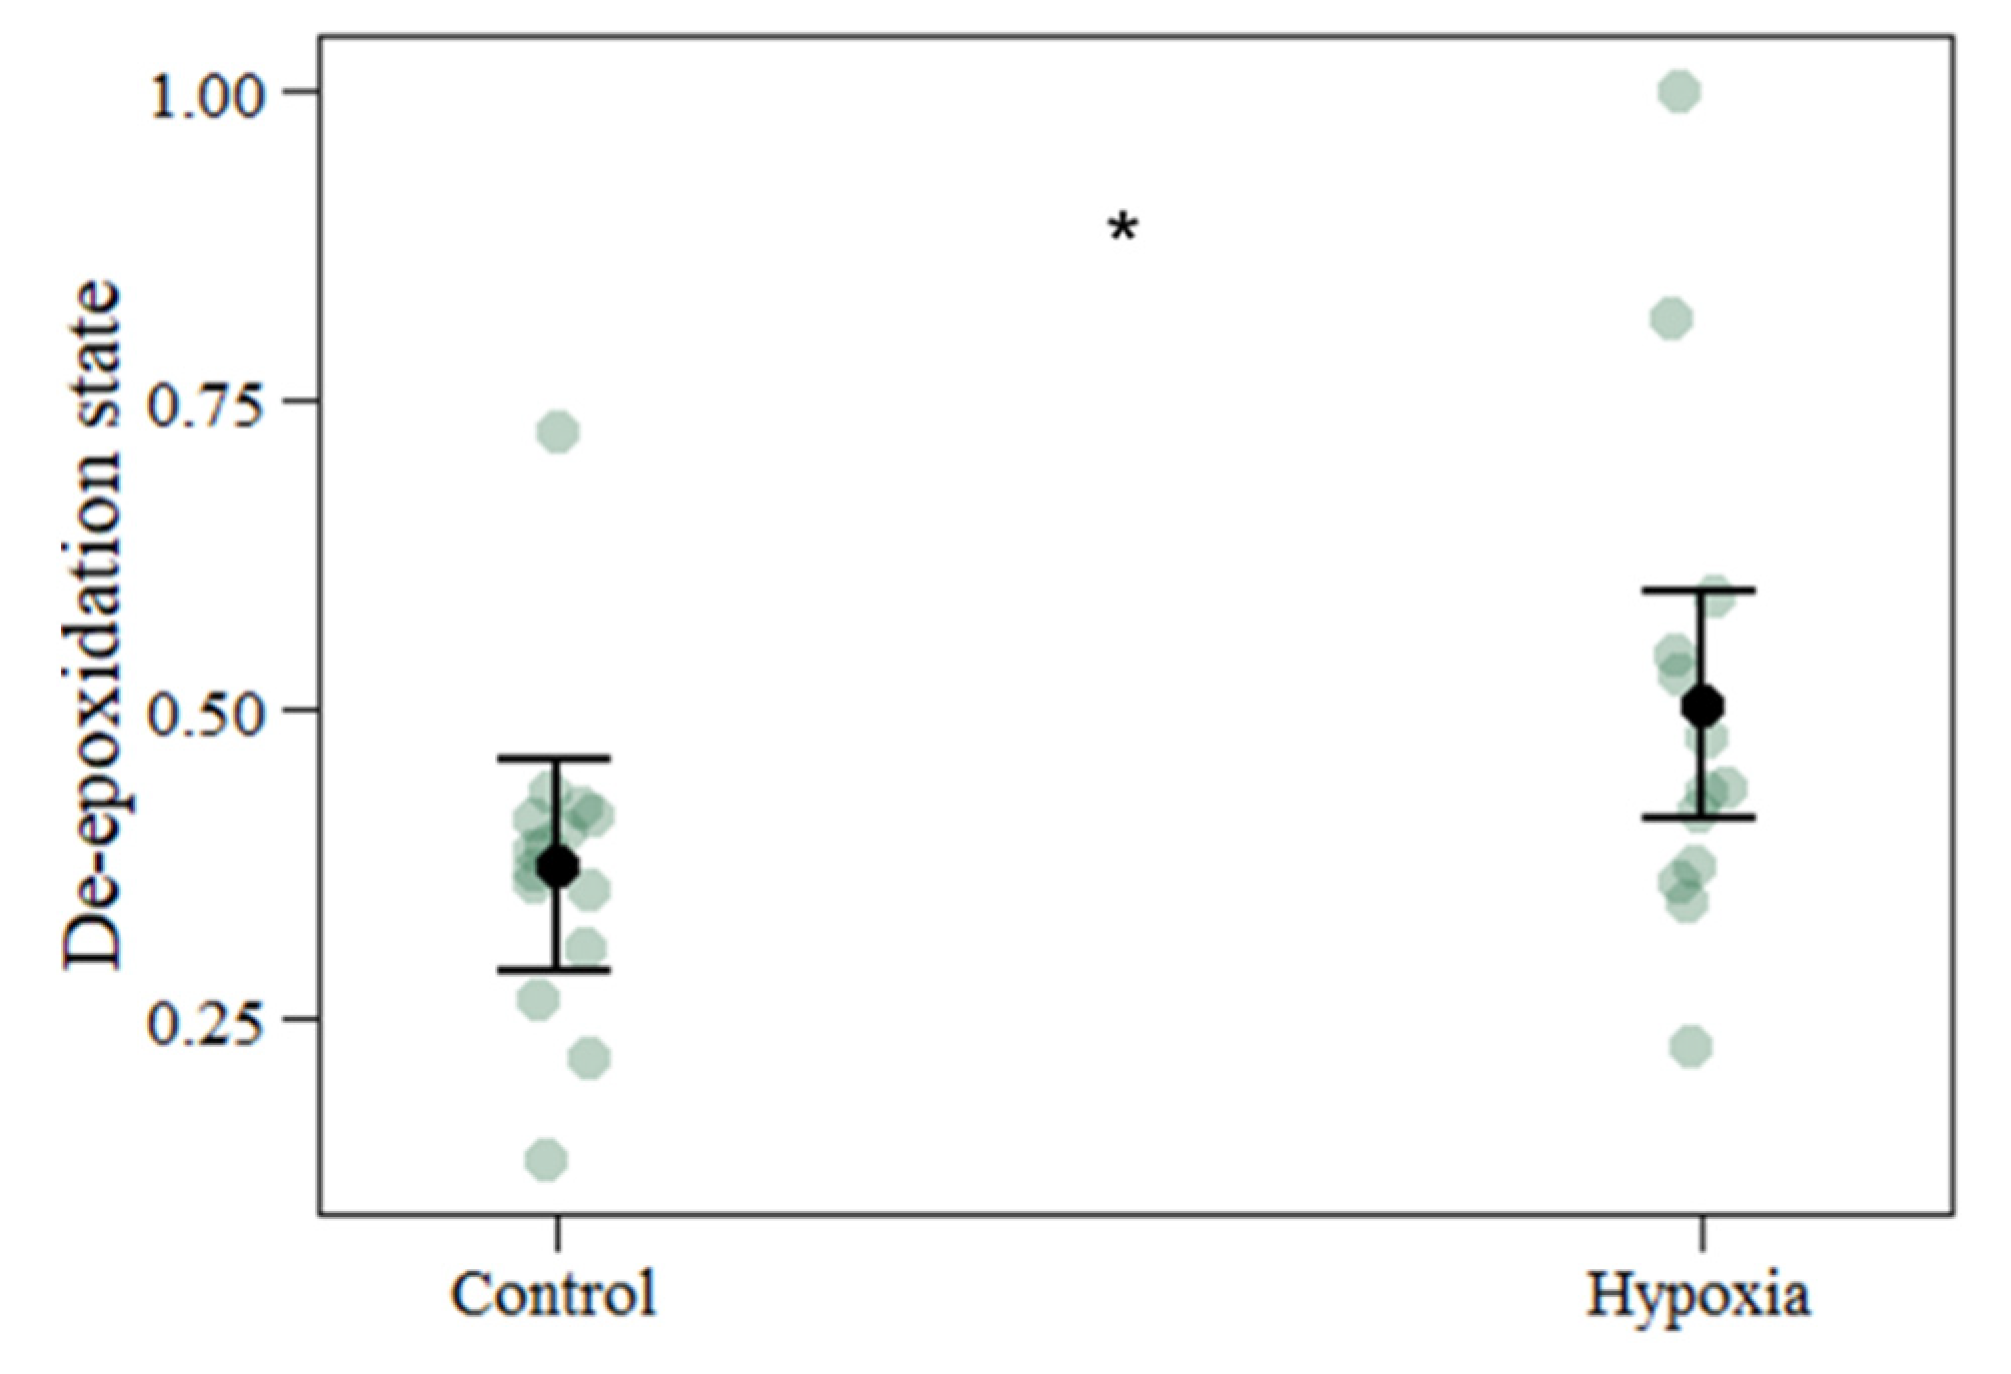
| De-epoxidation state | 0.3721 | 0.5037 | 0.0640 | 0.1316 | 2.057 | 0.039 |
| Oxidative stress | ||||||
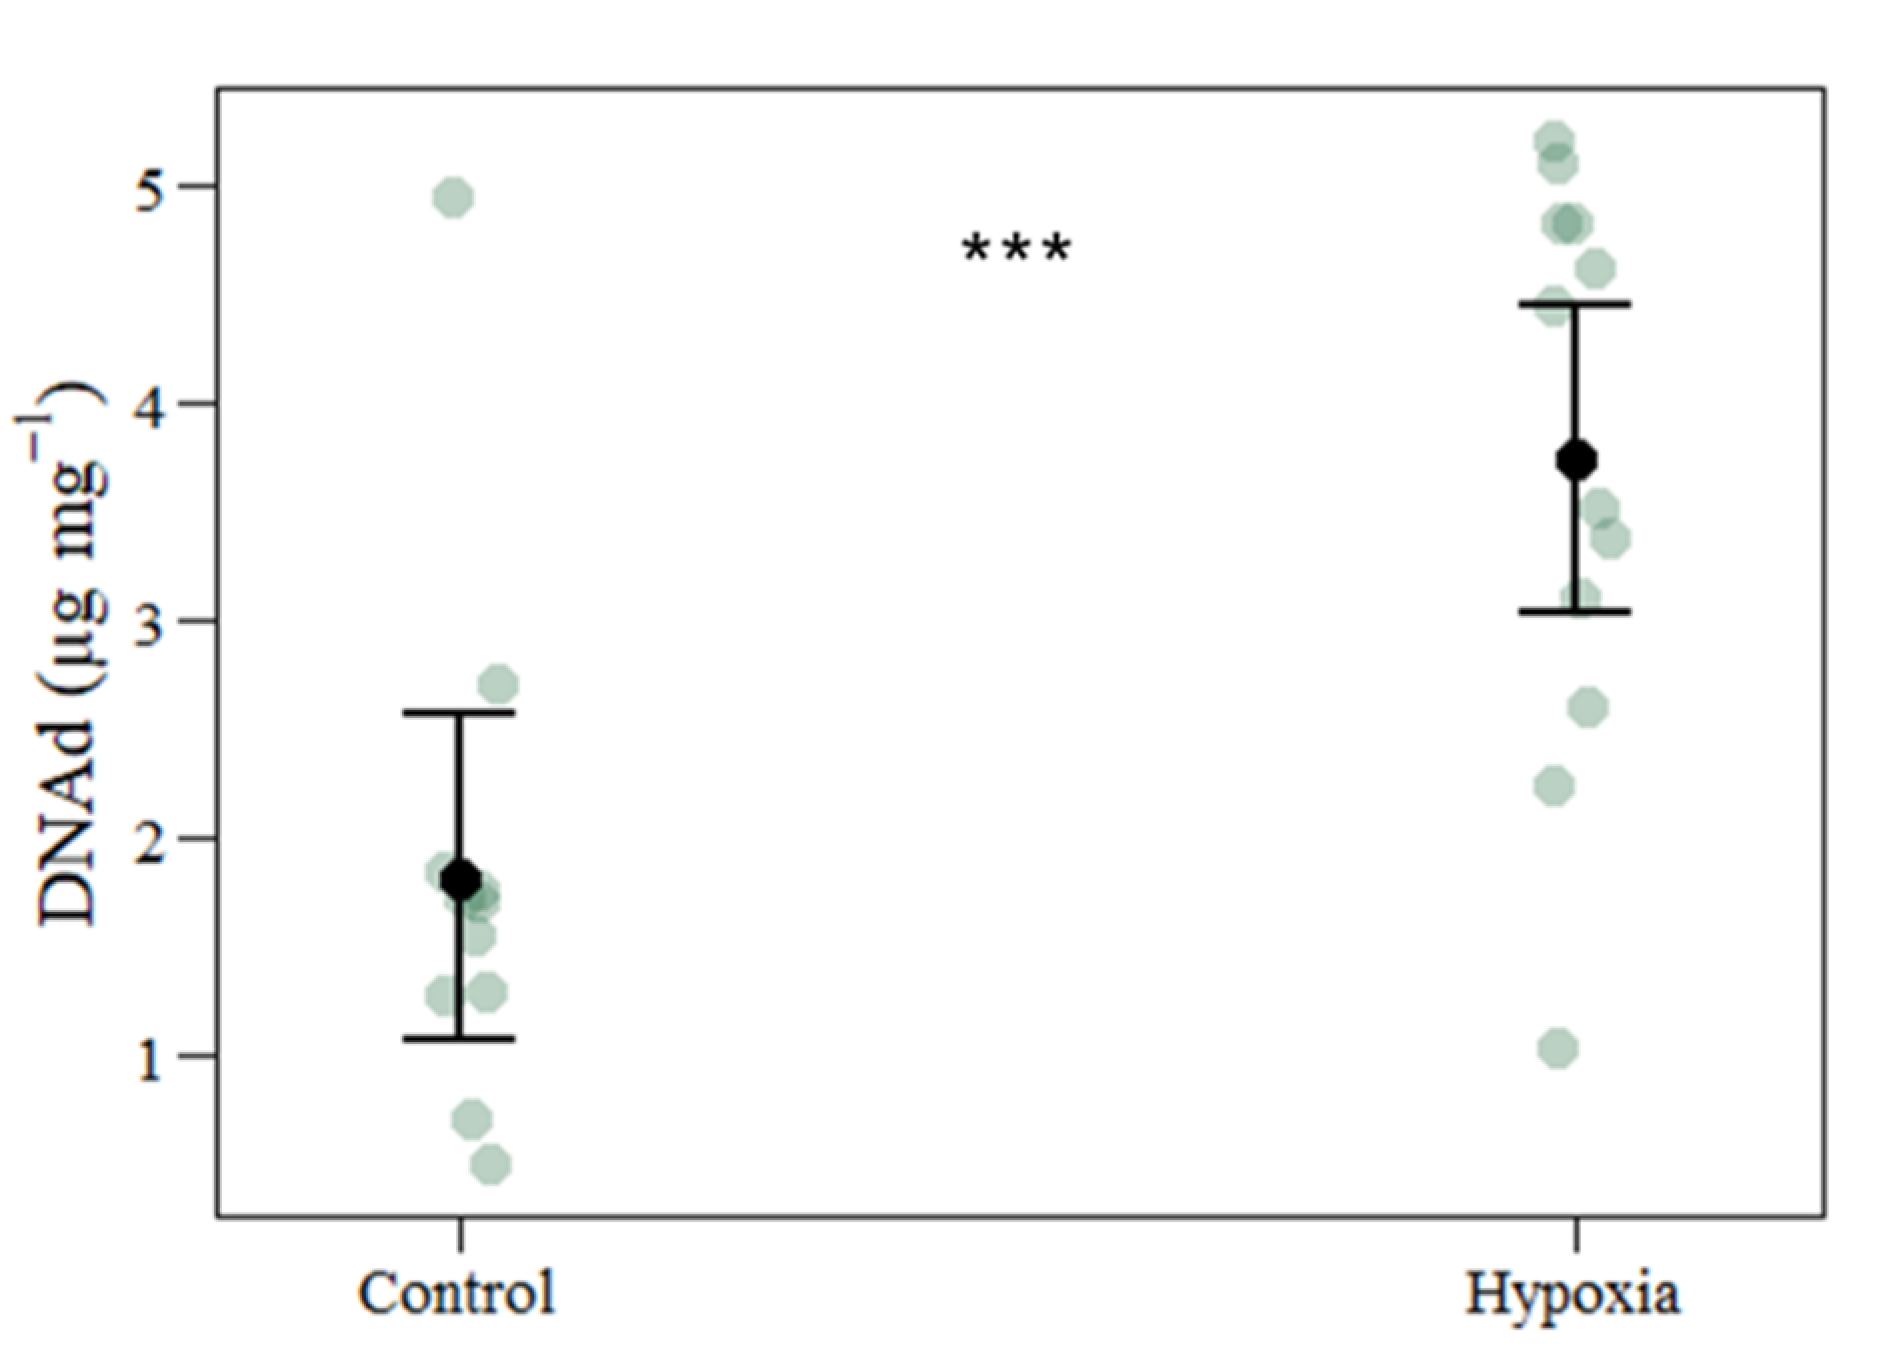
| DNA damage | 1.8168 | 3.7431 | 0.5264 | 1.9263 | 3.660 | 0.001 |
| Lipid peroxidation | 1.8796 | 2.0588 | 0.2884 | 0.1792 | 0.621 | 0.534 |
| Total protein | 2.5062 | 2.7733 | 0.2004 | 0.2672 | 1.333 | 0.183 |
| Catalase | 14.3298 | 18.2601 | 2.882 | 3.93 | 1.364 | 0.173 |
| Superoxide dismutase | 0.5275 | 0.4973 | 0.0466 | −0.0302 | −0.649 | 0.516 |
Publisher’s Note: MDPI stays neutral with regard to jurisdictional claims in published maps and institutional affiliations. |
© 2022 by the authors. Licensee MDPI, Basel, Switzerland. This article is an open access article distributed under the terms and conditions of the Creative Commons Attribution (CC BY) license (https://creativecommons.org/licenses/by/4.0/).
Share and Cite
Deleja, M.; Paula, J.R.; Repolho, T.; Franzitta, M.; Baptista, M.; Lopes, V.; Simão, S.; Fonseca, V.F.; Duarte, B.; Rosa, R. Effects of Hypoxia on Coral Photobiology and Oxidative Stress. Biology 2022, 11, 1068. https://doi.org/10.3390/biology11071068
Deleja M, Paula JR, Repolho T, Franzitta M, Baptista M, Lopes V, Simão S, Fonseca VF, Duarte B, Rosa R. Effects of Hypoxia on Coral Photobiology and Oxidative Stress. Biology. 2022; 11(7):1068. https://doi.org/10.3390/biology11071068
Chicago/Turabian StyleDeleja, Mark, José Ricardo Paula, Tiago Repolho, Marco Franzitta, Miguel Baptista, Vanessa Lopes, Silvia Simão, Vanessa F. Fonseca, Bernardo Duarte, and Rui Rosa. 2022. "Effects of Hypoxia on Coral Photobiology and Oxidative Stress" Biology 11, no. 7: 1068. https://doi.org/10.3390/biology11071068
APA StyleDeleja, M., Paula, J. R., Repolho, T., Franzitta, M., Baptista, M., Lopes, V., Simão, S., Fonseca, V. F., Duarte, B., & Rosa, R. (2022). Effects of Hypoxia on Coral Photobiology and Oxidative Stress. Biology, 11(7), 1068. https://doi.org/10.3390/biology11071068