
Acute Effect of Electromyostimulation Superimposed on Running on Maximal Velocity, Metabolism, and Perceived Exertion


Abstract
:Simple Summary
Abstract
1. Introduction
2. Materials and Methods
2.1. Participants
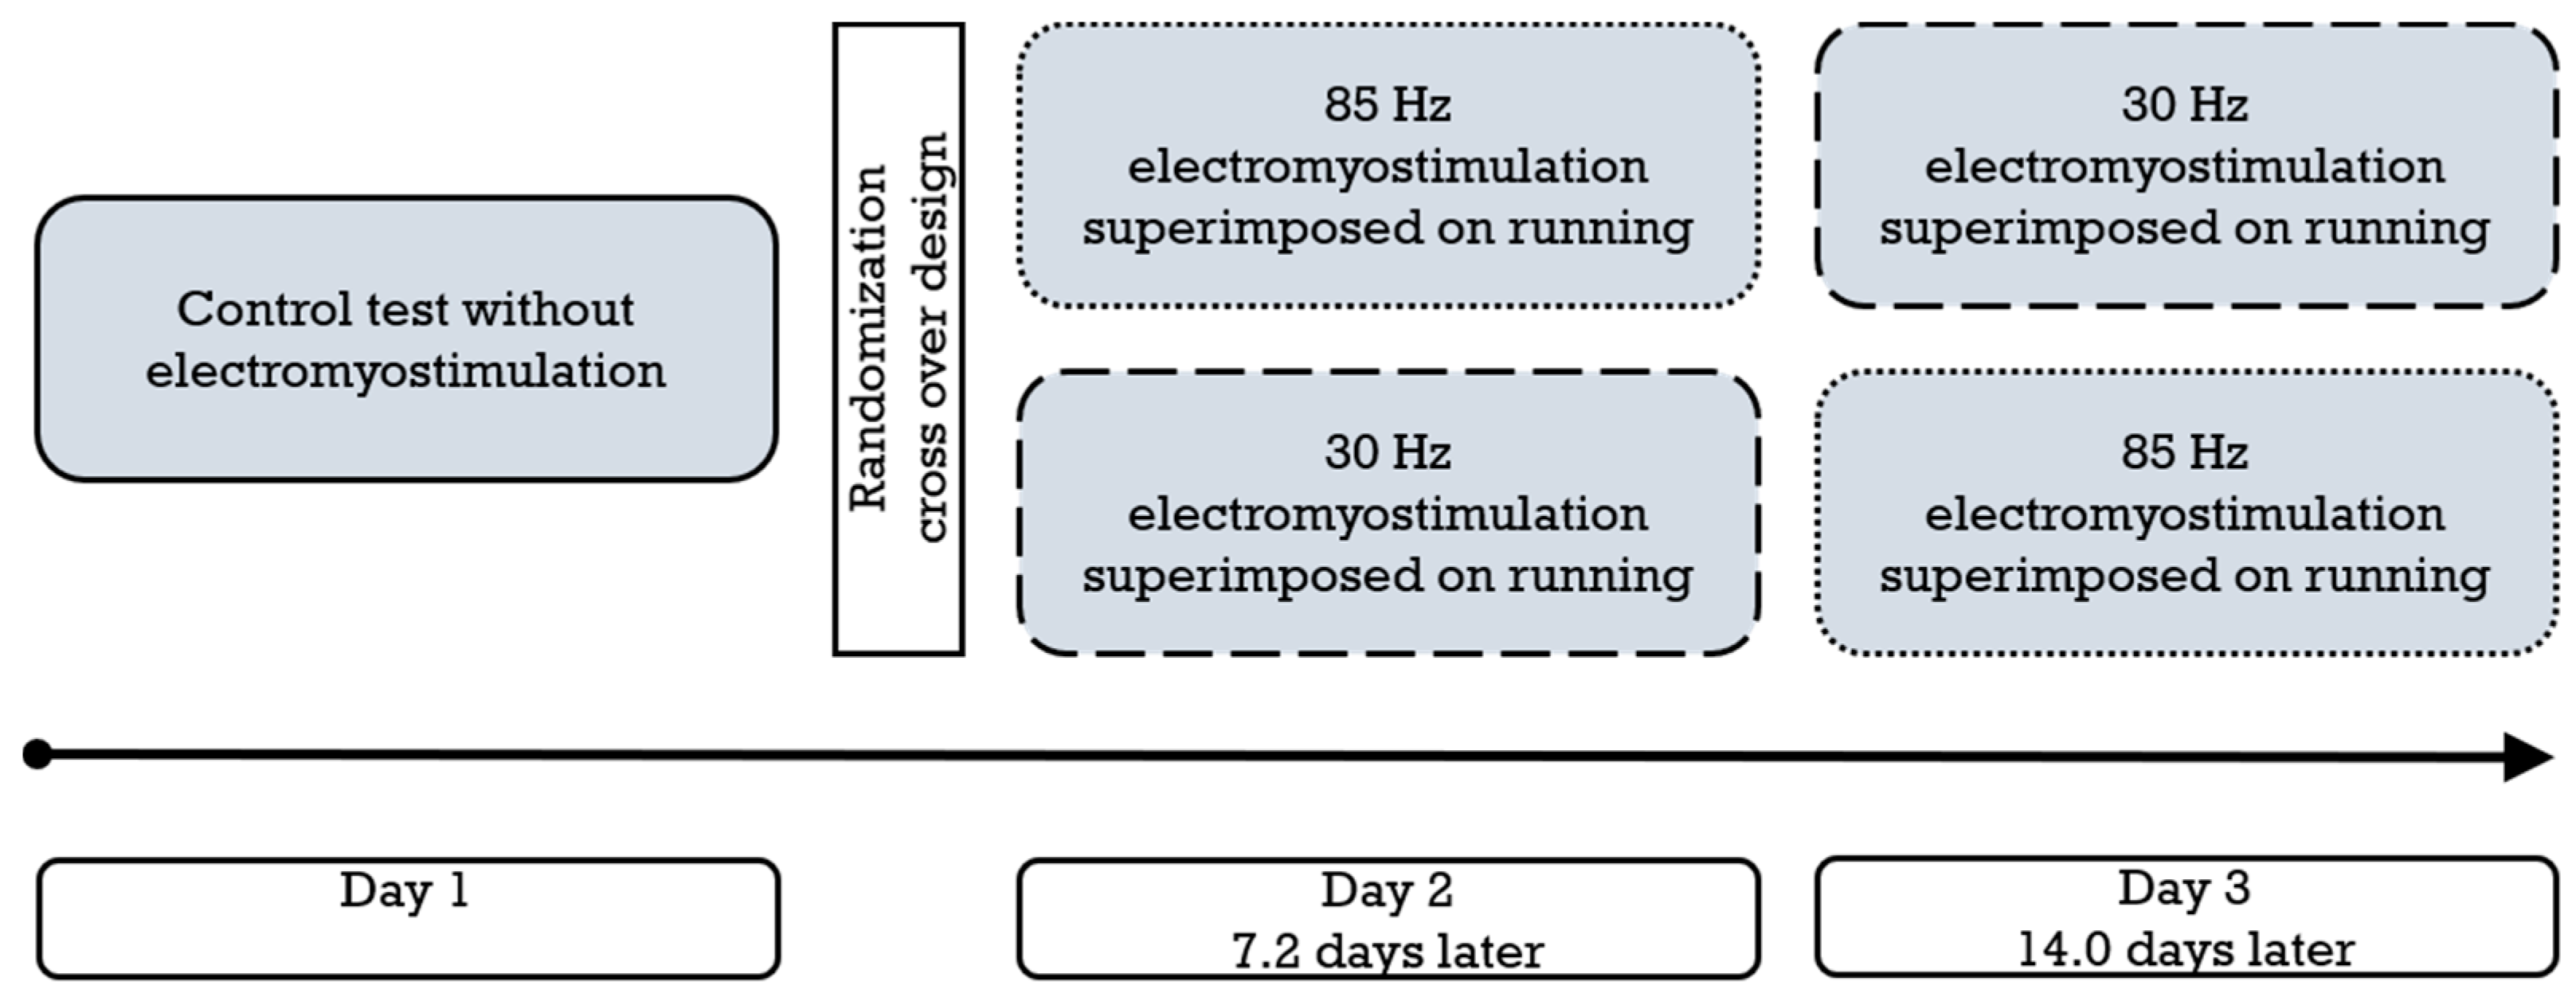
2.2. Study Design and Procedures
2.3. Medical Checkup
2.4. Spiroergometry, Lactate, and Perceived Exertion
2.5. Electromyostimulation
2.6. Target Parameters
2.7. Statistical Analysis
3. Results
3.1. Feasibility
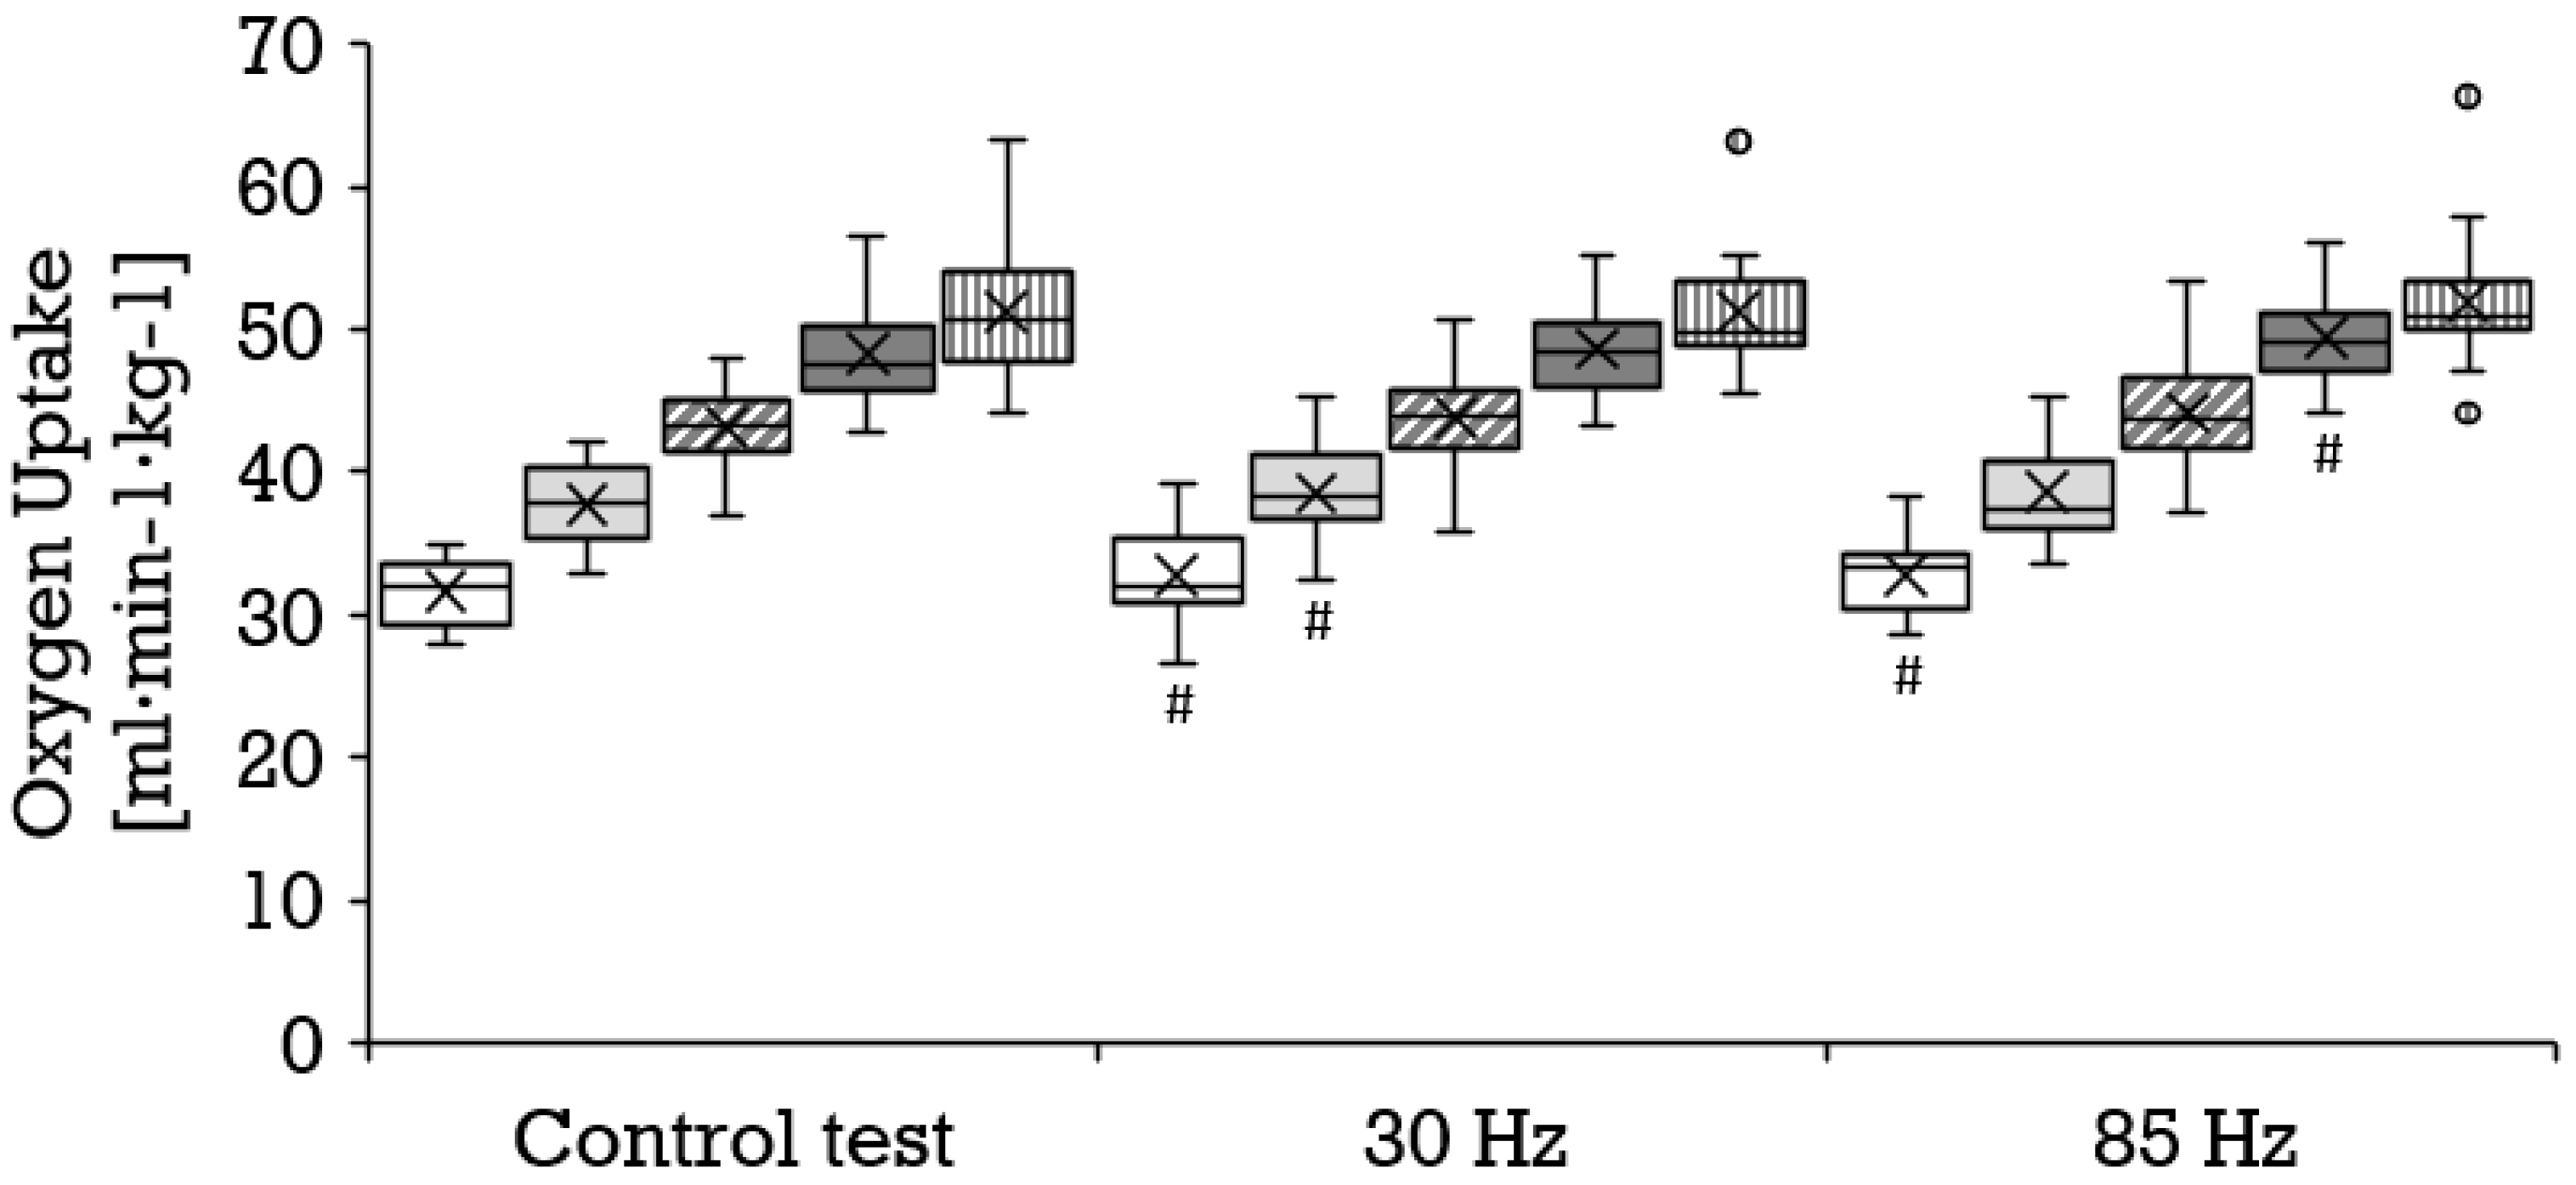
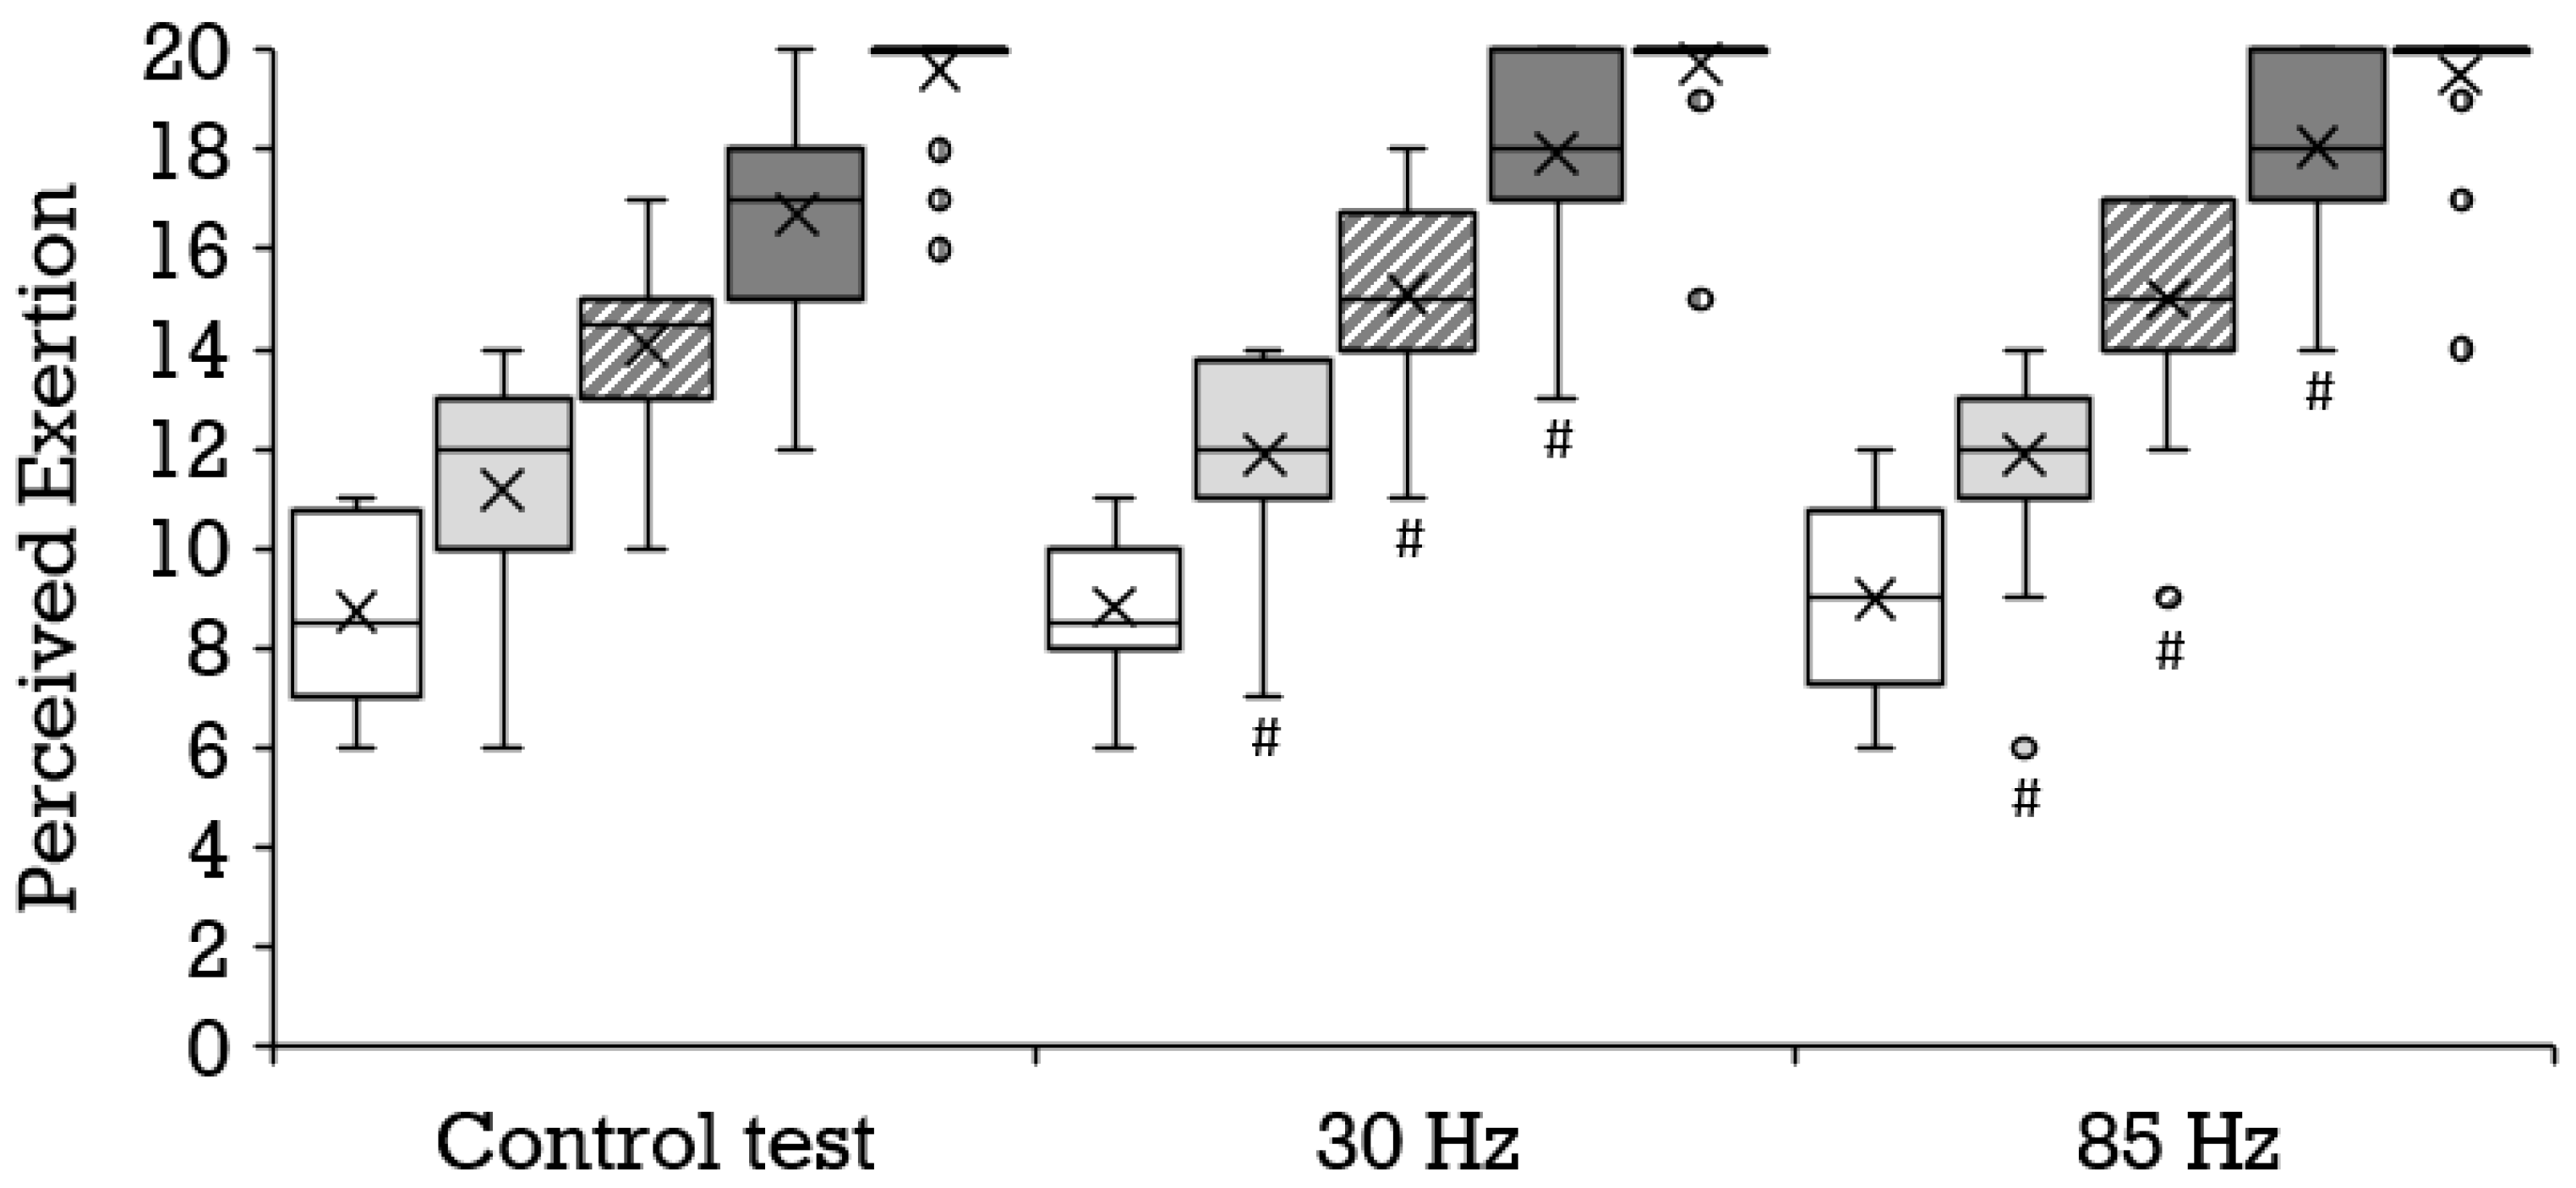
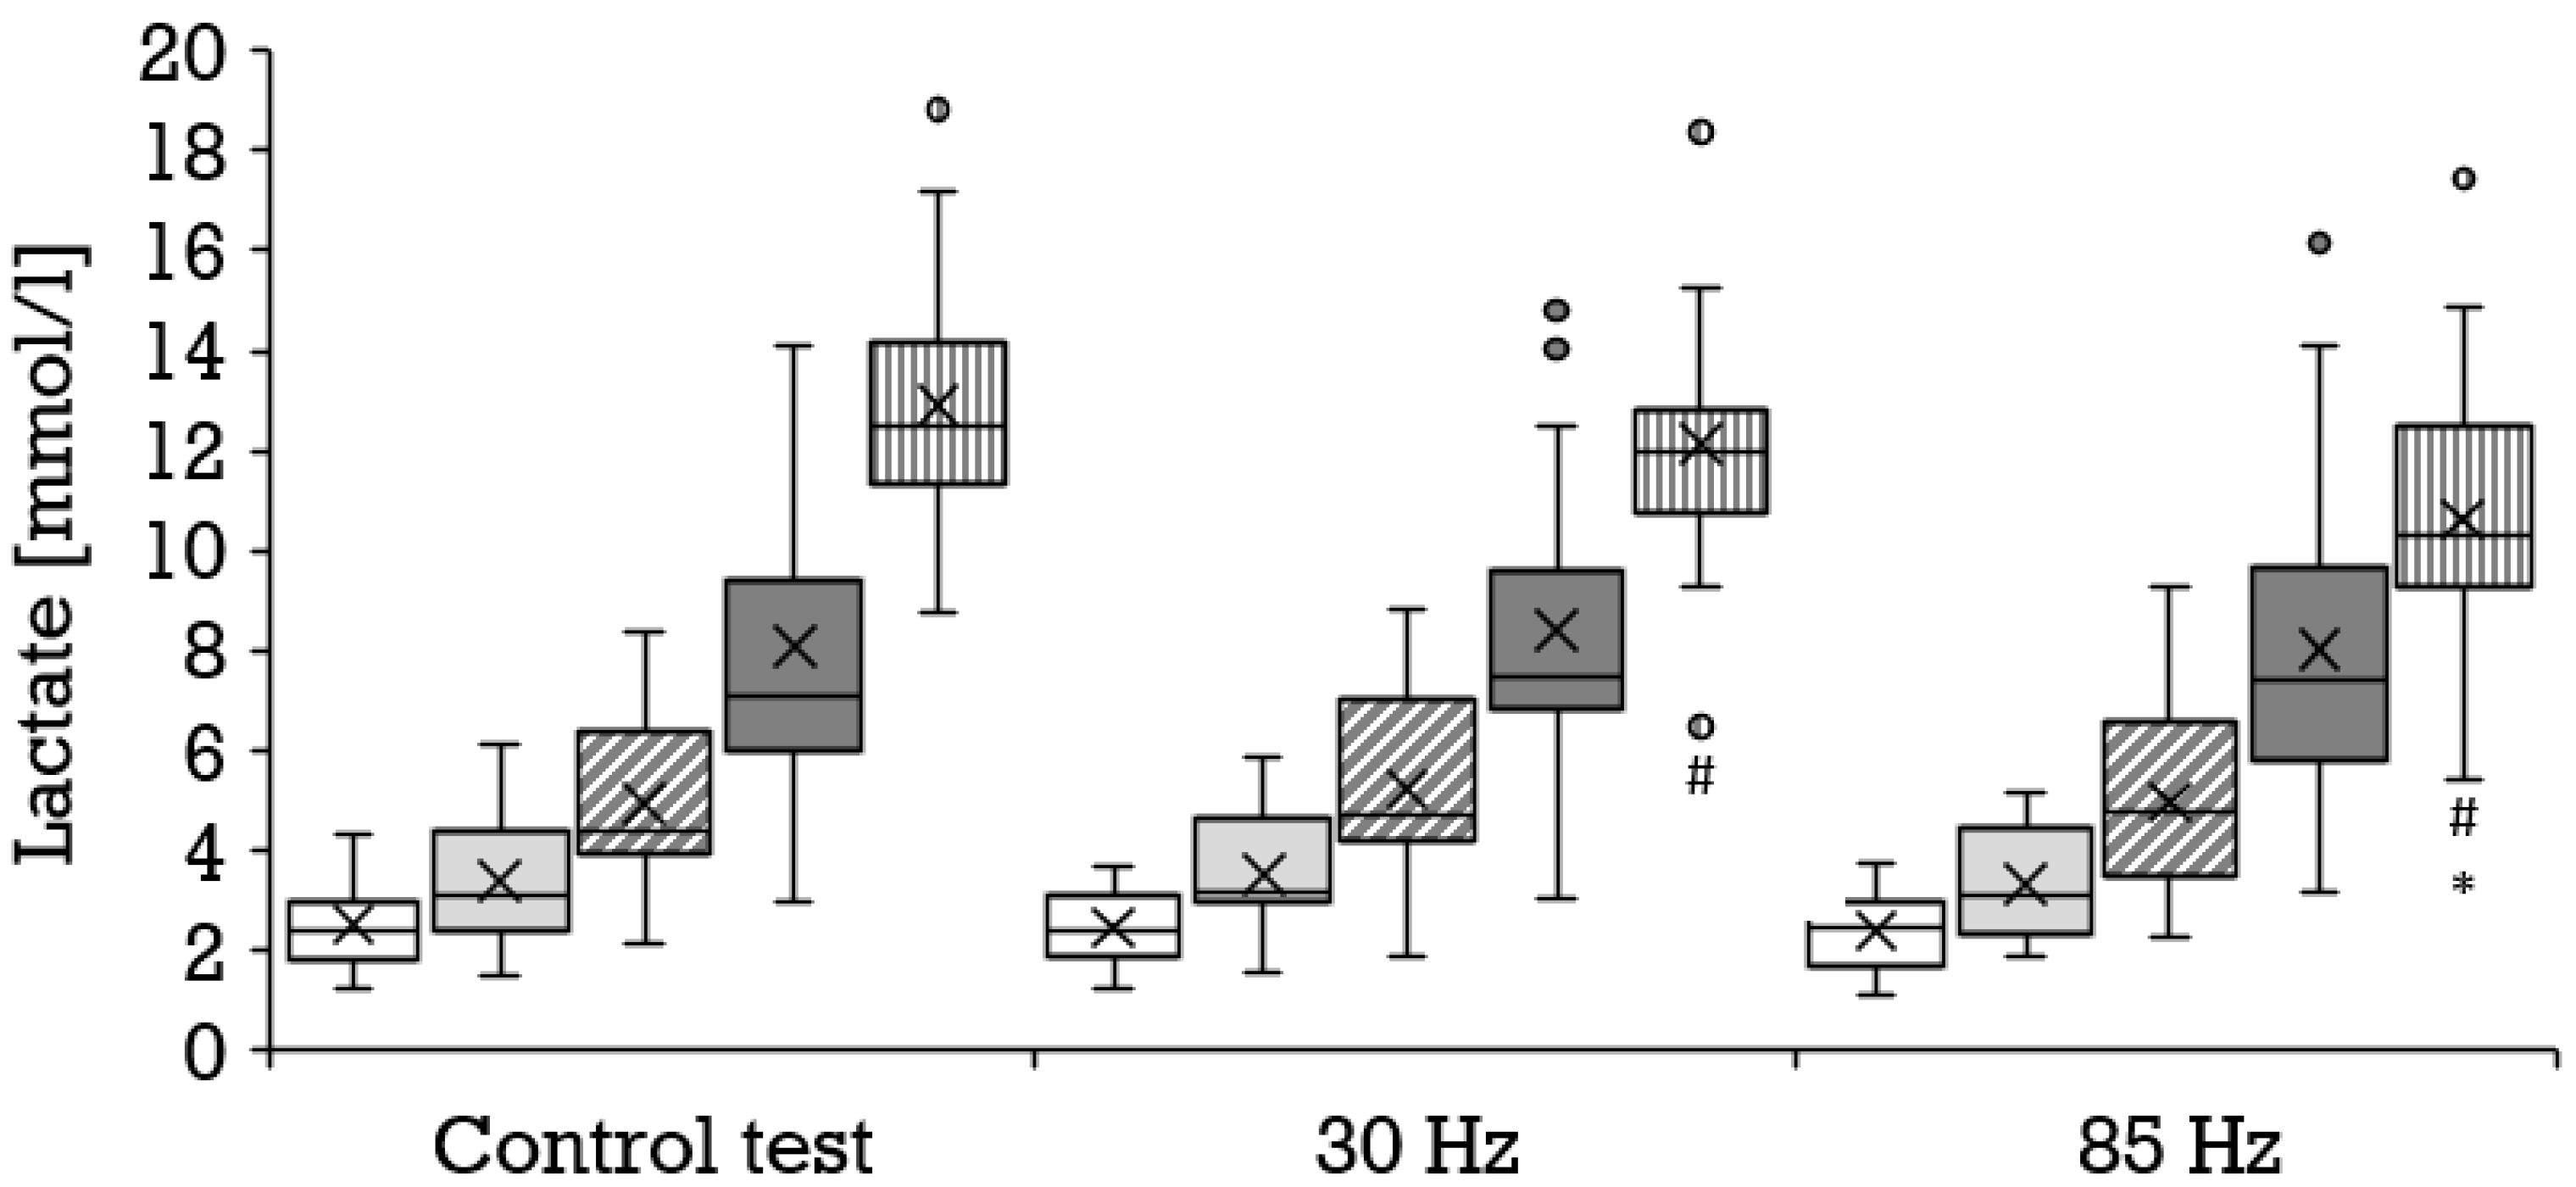
3.2. Stage Outcomes
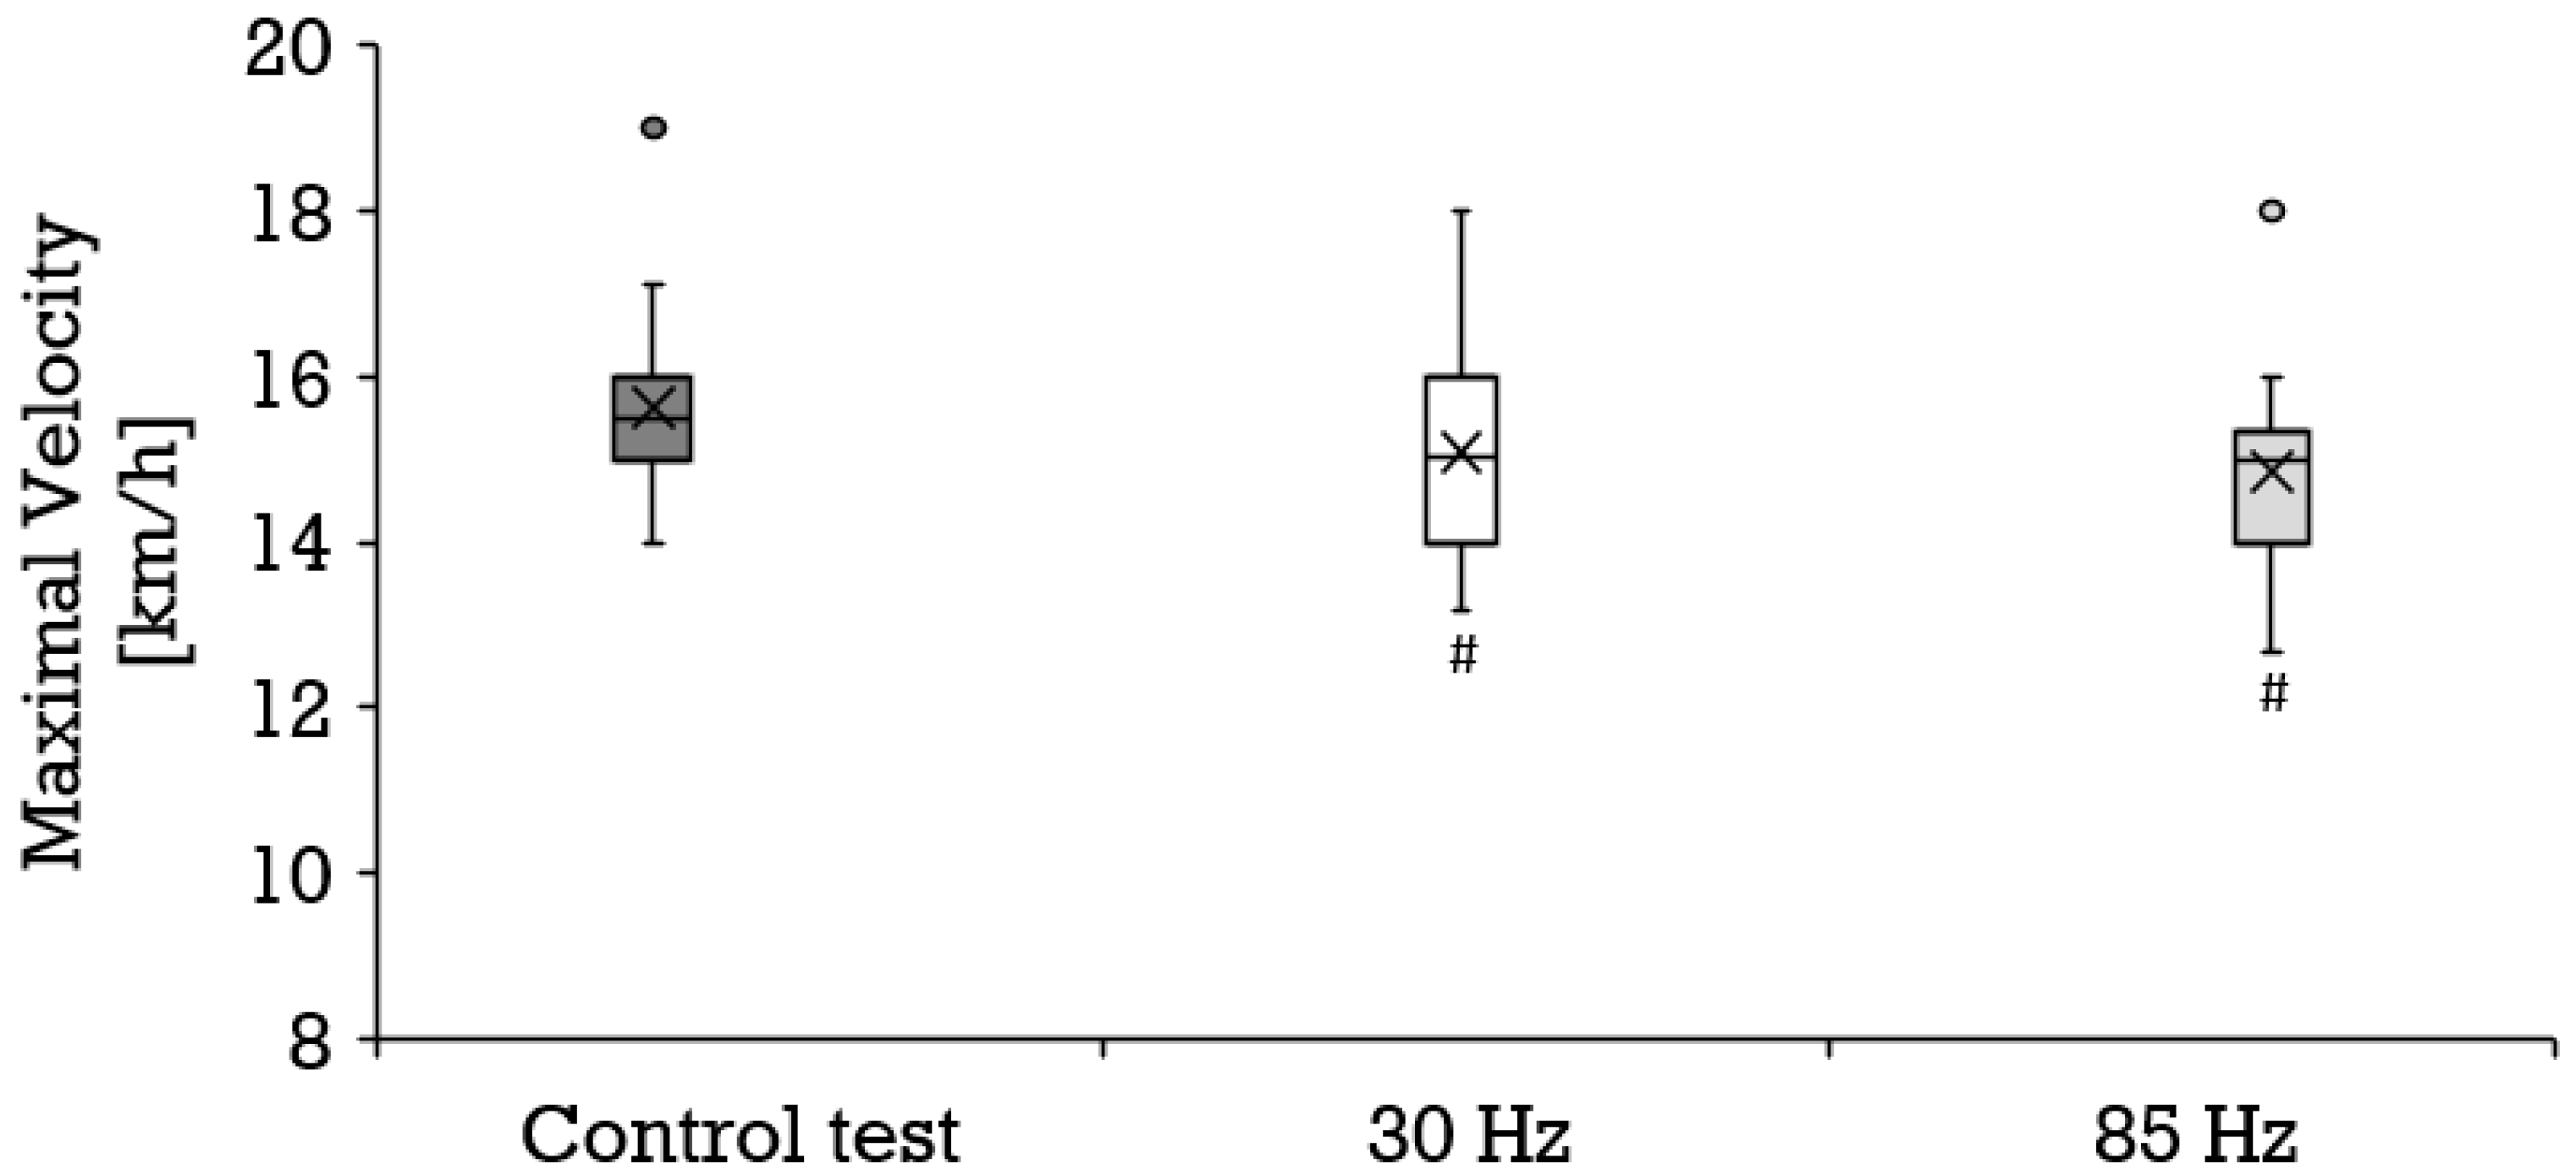
3.3. Maximal Outcome and Recovery
4. Discussion
4.1. Overview
4.2. Maximal Velocity
4.3. Aerobic Metabolism
4.4. Anaerobic Metabolism
4.5. Perceived Exertion
4.6. Limitations
4.7. Perspectives
5. Conclusions
Supplementary Materials
Author Contributions
Funding
Institutional Review Board Statement
Informed Consent Statement
Data Availability Statement
Acknowledgments
Conflicts of Interest
References
- Bickel, C.S.; Gregory, C.M.; Dean, J.C. Motor unit recruitment during neuromuscular electrical stimulation: A critical appraisal. Eur. J. Appl. Physiol. 2011, 111, 2399–2407. [Google Scholar] [CrossRef] [PubMed]
- Maffiuletti, N.A. Physiological and methodological considerations for the use of neuromuscular electrical stimulation. Eur. J. Appl. Physiol. 2010, 110, 223–234. [Google Scholar] [CrossRef] [PubMed]
- Filipovic, A.; Kleinöder, H.; Dörmann, U.; Mester, J. Electromyostimulation—A systematic review of the effects of different electromyostimulation methods on selected strength parameters in trained and elite athletes. J. Strength Cond. Res. 2012, 26, 2600–2614. [Google Scholar] [CrossRef] [PubMed] [Green Version]
- Hortobágyi, T.; Maffiuletti, N.A. Neural adaptations to electrical stimulation strength training. Eur. J. Appl. Physiol. 2011, 111, 2439–2449. [Google Scholar] [CrossRef] [PubMed] [Green Version]
- Watanabe, K.; Yoshida, T.; Ishikawa, T.; Kawade, S.; Moritani, T. Effect of the Combination of Whole-Body Neuromuscular Electrical Stimulation and Voluntary Exercise on Metabolic Responses in Human. Front. Physiol. 2019, 10, 291. [Google Scholar] [CrossRef] [PubMed]
- Wirtz, N.; Wahl, P.; Kleinöder, H.; Wechsler, K.; Achtzehn, S.; Mester, J. Acute metabolic, hormonal, and psychological responses to strength training with superimposed EMS at the beginning and the end of a 6 week training period. J. Musculoskelet. Neuronal Interact. 2015, 15, 325–332. [Google Scholar]
- Evangelista, A.L.; Teixeira, C.V.S.; Barros, B.M.; de Azevedo, J.B.; Paunksnis, M.R.R.; Souza, C.R.; Wadhi, T.; Rica, R.L.; Braz, T.V.; Bocalini, D.S. Does whole-body electrical muscle stimulation combined with strength training promote morphofunctional alterations? Clinics 2019, 74, e1334. [Google Scholar] [CrossRef] [Green Version]
- Kemmler, W.; Von Stengel, S.; Schwarz, J.; Mayhew, J.L. Effect of whole-body electromyostimulation on energy expenditure during exercise. J. Strength Cond. Res. 2012, 26, 240–245. [Google Scholar] [CrossRef] [Green Version]
- Teschler, M.; Wassermann, A.; Weissenfels, A.; Fröhlich, M.; Kohl, M.; Bebenek, M.; von Stengel, S.; Kemmler, W. Short time effect of a single session of intense whole-body electromyostimulation on energy expenditure. A contribution to fat reduction? Appl. Physiol. Nutr. Metab. 2018, 43, 528–530. [Google Scholar] [CrossRef] [Green Version]
- Paillard, T. Combined application of neuromuscular electrical stimulation and voluntary muscular contractions. Sports Med. 2008, 38, 161–177. [Google Scholar] [CrossRef]
- Pano-Rodriguez, A.; Beltran-Garrido, J.V.; Hernández-González, V.; Reverter-Masia, J. Effects of whole-body ELECTROMYOSTIMULATION on health and performance: A systematic review. BMC Complement. Altern. Med. 2019, 19, 87. [Google Scholar] [CrossRef] [PubMed]
- Wahl, P.; Schaerk, J.; Achtzehn, S.; Kleinöder, H.; Bloch, W.; Mester, J. Physiological responses and perceived exertion during cycling with superimposed electromyostimulation. J. Strength Cond. Res. 2012, 26, 2383–2388. [Google Scholar] [CrossRef] [PubMed]
- Masayuki, O.; Matsuse, H.; Takano, Y.; Yamada, S.; Ohshima, H.; Tagawa, Y.; Shiba, N. Oxygen Uptake during Aerobic Cycling Exercise Simultaneously Combined with Neuromuscular Electrical Stimulation of Antagonists. J. Nov. Physiother. 2013, 3, 185. [Google Scholar] [CrossRef] [Green Version]
- Wahl, P.; Hein, M.; Achtzehn, S.; Bloch, W.; Mester, J. Acute metabolic, hormonal and psychological responses to cycling with superimposed electromyostimulation. Eur. J. Appl. Physiol. 2014, 114, 2331–2339. [Google Scholar] [CrossRef] [PubMed]
- Watanabe, K.; Taniguchi, Y.; Moritani, T. Metabolic and cardiovascular responses during voluntary pedaling exercise with electrical muscle stimulation. Eur. J. Appl. Physiol. 2014, 114, 1801–1807. [Google Scholar] [CrossRef] [PubMed]
- Omoto, M.; Matsuse, H.; Hashida, R.; Takano, Y.; Yamada, S.; Ohshima, H.; Tagawa, Y.; Shiba, N. Cycling Exercise with Electrical Stimulation of Antagonist Muscles Increases Plasma Growth Hormone and IL-6. Tohoku J. Exp. Med. 2015, 237, 209–217. [Google Scholar] [CrossRef] [PubMed] [Green Version]
- Wahl, P.; Hein, M.; Achtzehn, S.; Bloch, W.; Mester, J. Acute effects of superimposed electromyostimulation during cycling on myokines and markers of muscle damage. J. Musculoskelet. Neuronal Interact. 2015, 15, 53–59. [Google Scholar]
- Mathes, S.; Lehnen, N.; Link, T.; Bloch, W.; Mester, J.; Wahl, P. Chronic effects of superimposed electromyostimulation during cycling on aerobic and anaerobic capacity. Eur. J. Appl. Physiol. 2017, 117, 881–892. [Google Scholar] [CrossRef]
- Jubeau, M.; Sartorio, A.; Marinone, P.G.; Agosti, F.; Van Hoecke, J.; Nosaka, K.; Maffiuletti, N.A. Comparison between voluntary and stimulated contractions of the quadriceps femoris for growth hormone response and muscle damage. J. Appl. Physiol. 2008, 104, 75–81. [Google Scholar] [CrossRef]
- Hulteen, R.M.; Smith, J.J.; Morgan, P.J.; Barnett, L.M.; Hallal, P.C.; Colyvas, K.; Lubans, D.R. Global participation in sport and leisure-time physical activities: A systematic review and meta-analysis. Prev. Med. 2017, 95, 14–25. [Google Scholar] [CrossRef]
- Marti, B.; Vader, J.P.; Minder, C.E.; Abelin, T. On the epidemiology of running injuries. The 1984 Bern Grand-Prix study. Am. J. Sports Med. 1988, 16, 285–294. [Google Scholar] [CrossRef] [PubMed]
- Kemmler, W.; Teschler, M.; Weissenfels, A.; Froehlich, M.; Kohl, M.; von Stengel, S. Whole-Body Electromyostimulation Versus High Intensity (Resistance Exercise) Training—Impact on Body Composition and Strength. Dtsch. Z. Sportmed. 2015, 66, 321–327. [Google Scholar] [CrossRef]
- Amaro-Gahete, F.J.; De-la-O, A.; Sanchez-Delgado, G.; Robles-Gonzalez, L.; Jurado-Fasoli, L.; Ruiz, J.R.; Gutiérrez, A. Functional Exercise Training and Undulating Periodization Enhances the Effect of Whole-Body Electromyostimulation Training on Running Performance. Front. Physiol. 2018, 9, 720. [Google Scholar] [CrossRef] [PubMed] [Green Version]
- Kasper, K. Sports Training Principles. Curr. Sports Med. Rep. 2019, 18, 95–96. [Google Scholar] [CrossRef]
- Millet, G.P.; Vleck, V.E.; Bentley, D.J. Physiological differences between cycling and running: Lessons from triathletes. Sports Med. 2009, 39, 179–206. [Google Scholar] [CrossRef]
- Roecker, K.; Striegel, H.; Dickhuth, H.H. Heart-rate recommendations: Transfer between running and cycling exercise? Int. J. Sports Med. 2003, 24, 173–178. [Google Scholar] [CrossRef]
- Wonisch, M.; Berent, R.; Klicpera, M.; Laimer, H.; Marko, C.; Pokan, R.; Schmid, P.; Schwann, H. Praxisleitlinien Ergometrie. J. Kardiol. 2008, 15 (Suppl. A), 3–17. [Google Scholar] [CrossRef]
- Kaminsky, L.A.; Arena, R.; Myers, J. Reference Standards for Cardiorespiratory Fitness Measured with Cardiopulmonary Exercise Testing: Data from the Fitness Registry and the Importance of Exercise National Database. Mayo Clin. Proc. 2015, 90, 1515–1523. [Google Scholar] [CrossRef] [Green Version]
- Ferguson, B.S.; Rogatzki, M.J.; Goodwin, M.L.; Kane, D.A.; Rightmire, Z.; Gladden, L.B. Lactate metabolism: Historical context, prior misinterpretations, and current understanding. Eur. J. Appl. Physiol. 2018, 118, 691–728. [Google Scholar] [CrossRef]
- Cairns, S.P.; Lindinger, M.I. Do multiple ionic interactions contribute to skeletal muscle fatigue? J. Physiol. 2008, 586, 4039–4054. [Google Scholar] [CrossRef]
- Banerjee, P.; Clark, A.; Witte, K.; Crowe, L.; Caulfield, B. Electrical stimulation of unloaded muscles causes cardiovascular exercise by increasing oxygen demand. Eur. J. Cardiovasc. Prev. Rehabil. 2005, 12, 503–508. [Google Scholar] [CrossRef] [PubMed]
- Wasserman, K.; Whipp, B.J.; Koyl, S.N.; Beaver, W.L. Anaerobic threshold and respiratory gas exchange during exercise. J. Appl. Physiol. 1973, 35, 236–243. [Google Scholar] [CrossRef] [PubMed]
- Gladden, L.B. Muscle as a consumer of lactate. Med. Sci. Sports Exerc. 2000, 32, 764–771. [Google Scholar] [CrossRef]
- Gladden, L.B. Lactate metabolism: A new paradigm for the third millennium. J. Physiol. 2004, 558, 5–30. [Google Scholar] [CrossRef] [PubMed]
- Beaver, W.L.; Wasserman, K.; Whipp, B.J. A new method for detecting anaerobic threshold by gas exchange. J. Appl. Physiol. 1986, 60, 2020–2027. [Google Scholar] [CrossRef] [PubMed]

| Parameters | Mean ± SD [Min–Max] |
|---|---|
| Age [years] | 25.8 ± 3.1 [19–30] |
| Height [cm] | 184.0 ± 8.0 [170.0–196.0] |
| Body mass [kg] | 79.5 ± 7.2 [65.0–97.0] |
| Body mass index [kg/m2] | 23.5 ± 1.3 [20.5–25.4] |
| Maximum oxygen uptake [ml·min−1·kg−1] | 50.4 ± 5.8 [38.7–63.3] |
| Maximum velocity [km/h] | 15.6 ± 1.1 [14.0–19.0] |
| Maximum lactate [mmol/L] | 13.0 ± 2.4 [8.8–18.8] |
| Maximum respiratory exchange ratio | 1.14 ± 0.05 [1.05–1.22] |
| Maximum perceived exertion via Borg scale | 19.6 ± 1.1 [16–20] |
Publisher’s Note: MDPI stays neutral with regard to jurisdictional claims in published maps and institutional affiliations. |
© 2022 by the authors. Licensee MDPI, Basel, Switzerland. This article is an open access article distributed under the terms and conditions of the Creative Commons Attribution (CC BY) license (https://creativecommons.org/licenses/by/4.0/).
Share and Cite
Stephan, H.; Hagedorn, T.; Wehmeier, U.F.; Tomschi, F.; Hilberg, T. Acute Effect of Electromyostimulation Superimposed on Running on Maximal Velocity, Metabolism, and Perceived Exertion. Biology 2022, 11, 593. https://doi.org/10.3390/biology11040593
Stephan H, Hagedorn T, Wehmeier UF, Tomschi F, Hilberg T. Acute Effect of Electromyostimulation Superimposed on Running on Maximal Velocity, Metabolism, and Perceived Exertion. Biology. 2022; 11(4):593. https://doi.org/10.3390/biology11040593
Chicago/Turabian StyleStephan, Holger, Thorsten Hagedorn, Udo Frank Wehmeier, Fabian Tomschi, and Thomas Hilberg. 2022. "Acute Effect of Electromyostimulation Superimposed on Running on Maximal Velocity, Metabolism, and Perceived Exertion" Biology 11, no. 4: 593. https://doi.org/10.3390/biology11040593
APA StyleStephan, H., Hagedorn, T., Wehmeier, U. F., Tomschi, F., & Hilberg, T. (2022). Acute Effect of Electromyostimulation Superimposed on Running on Maximal Velocity, Metabolism, and Perceived Exertion. Biology, 11(4), 593. https://doi.org/10.3390/biology11040593