Interconversion of Plasma Free Thyroxine Values from Assay Platforms with Different Reference Intervals Using Linear Transformation Methods


Abstract
Simple Summary
Abstract
1. Introduction
2. Materials and Methods
2.1. Study Design and Participants
2.2. Laboratory Measurements
2.3. Mathematical Transformation Methods
- : the reference interval of FT4 that is chosen as the scale to be mapped into
- : the reference interval of FT4 values measured by any specific method (e.g., LC-MS/MS, IA, or ED, etc.)
- : the FT4 value measured with a specific method with the reference interval
- : the converted FT4 value in the chosen scale with reference interval .
2.4. Statistical Analyses
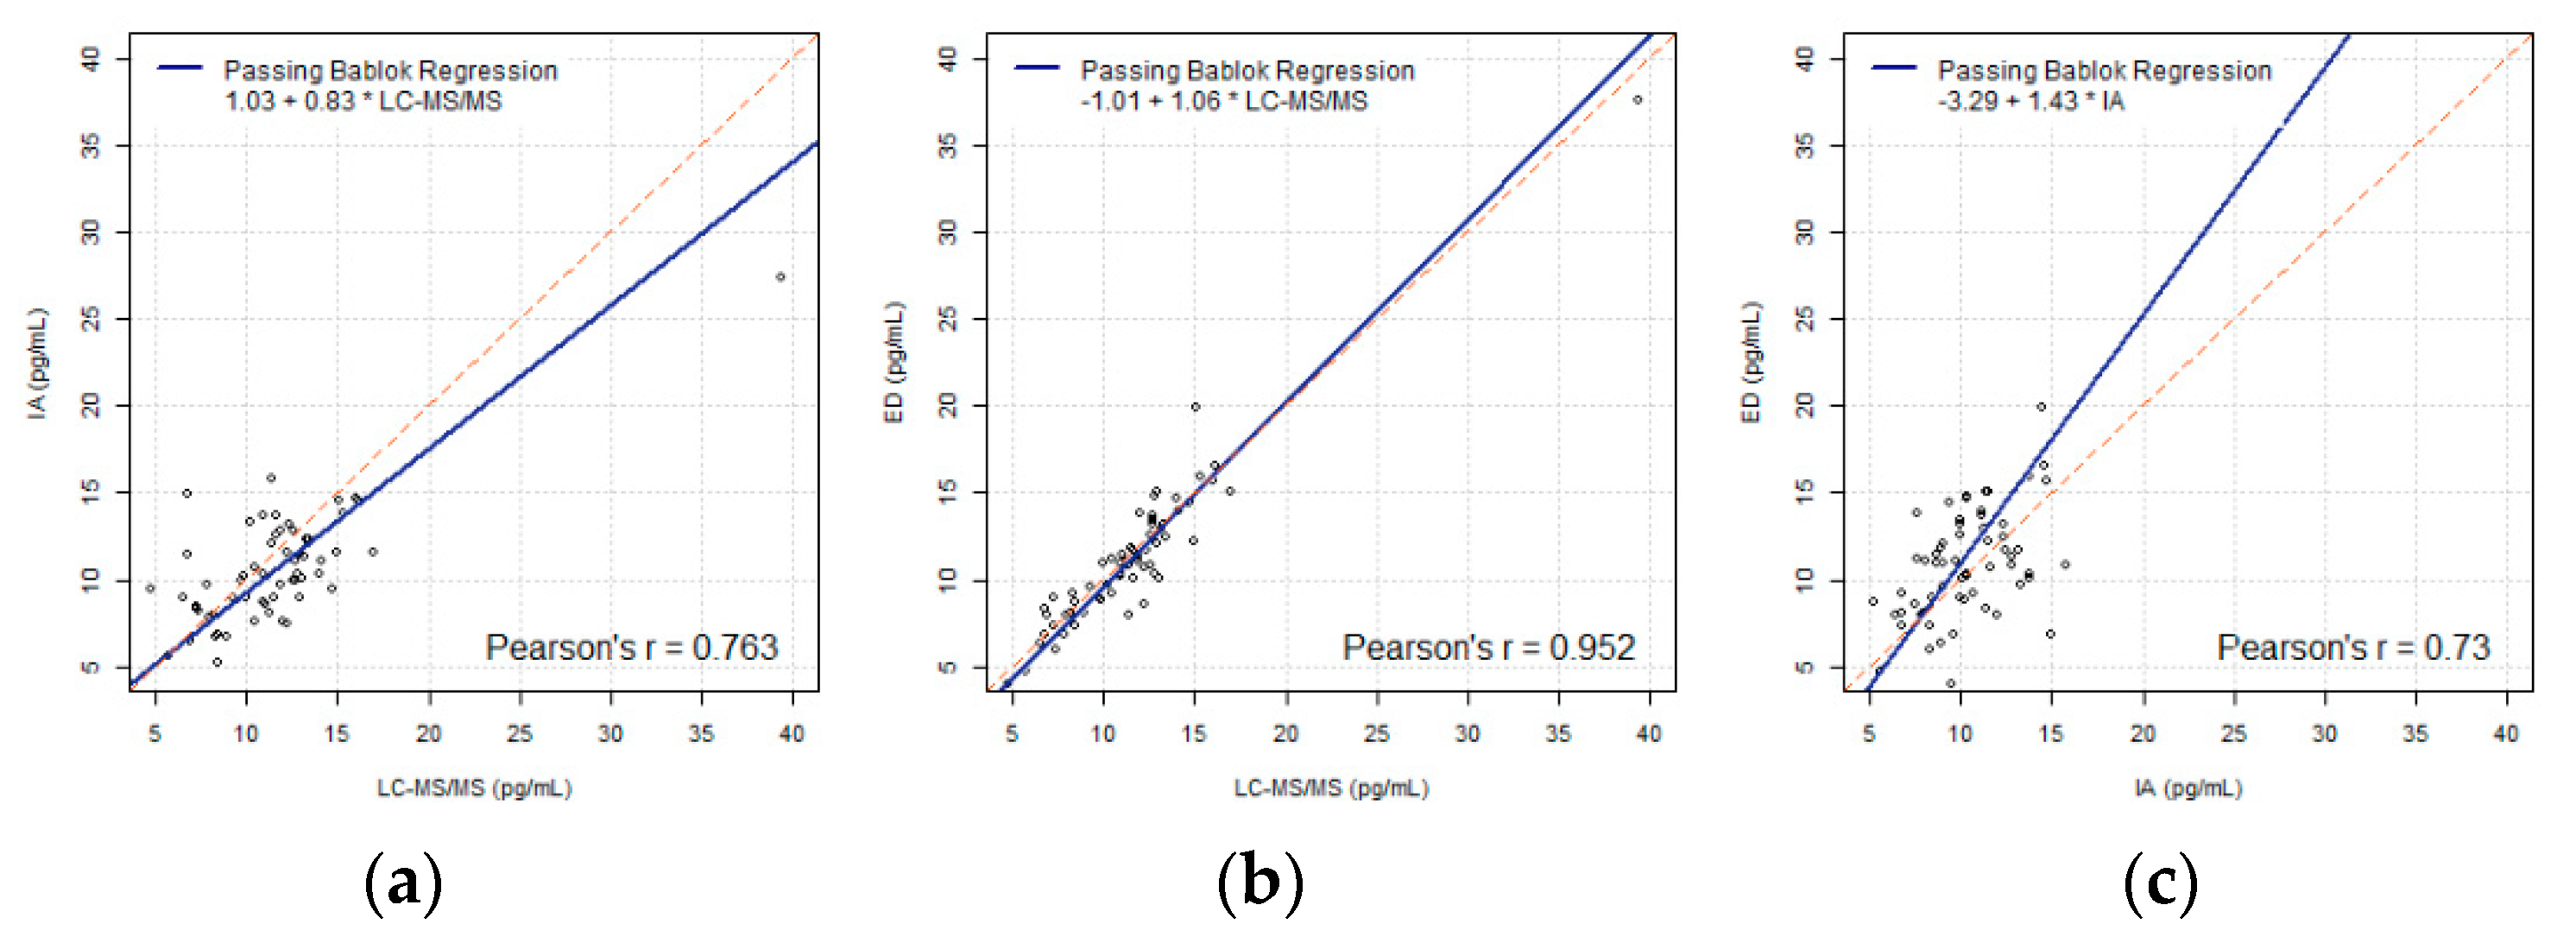
3. Results
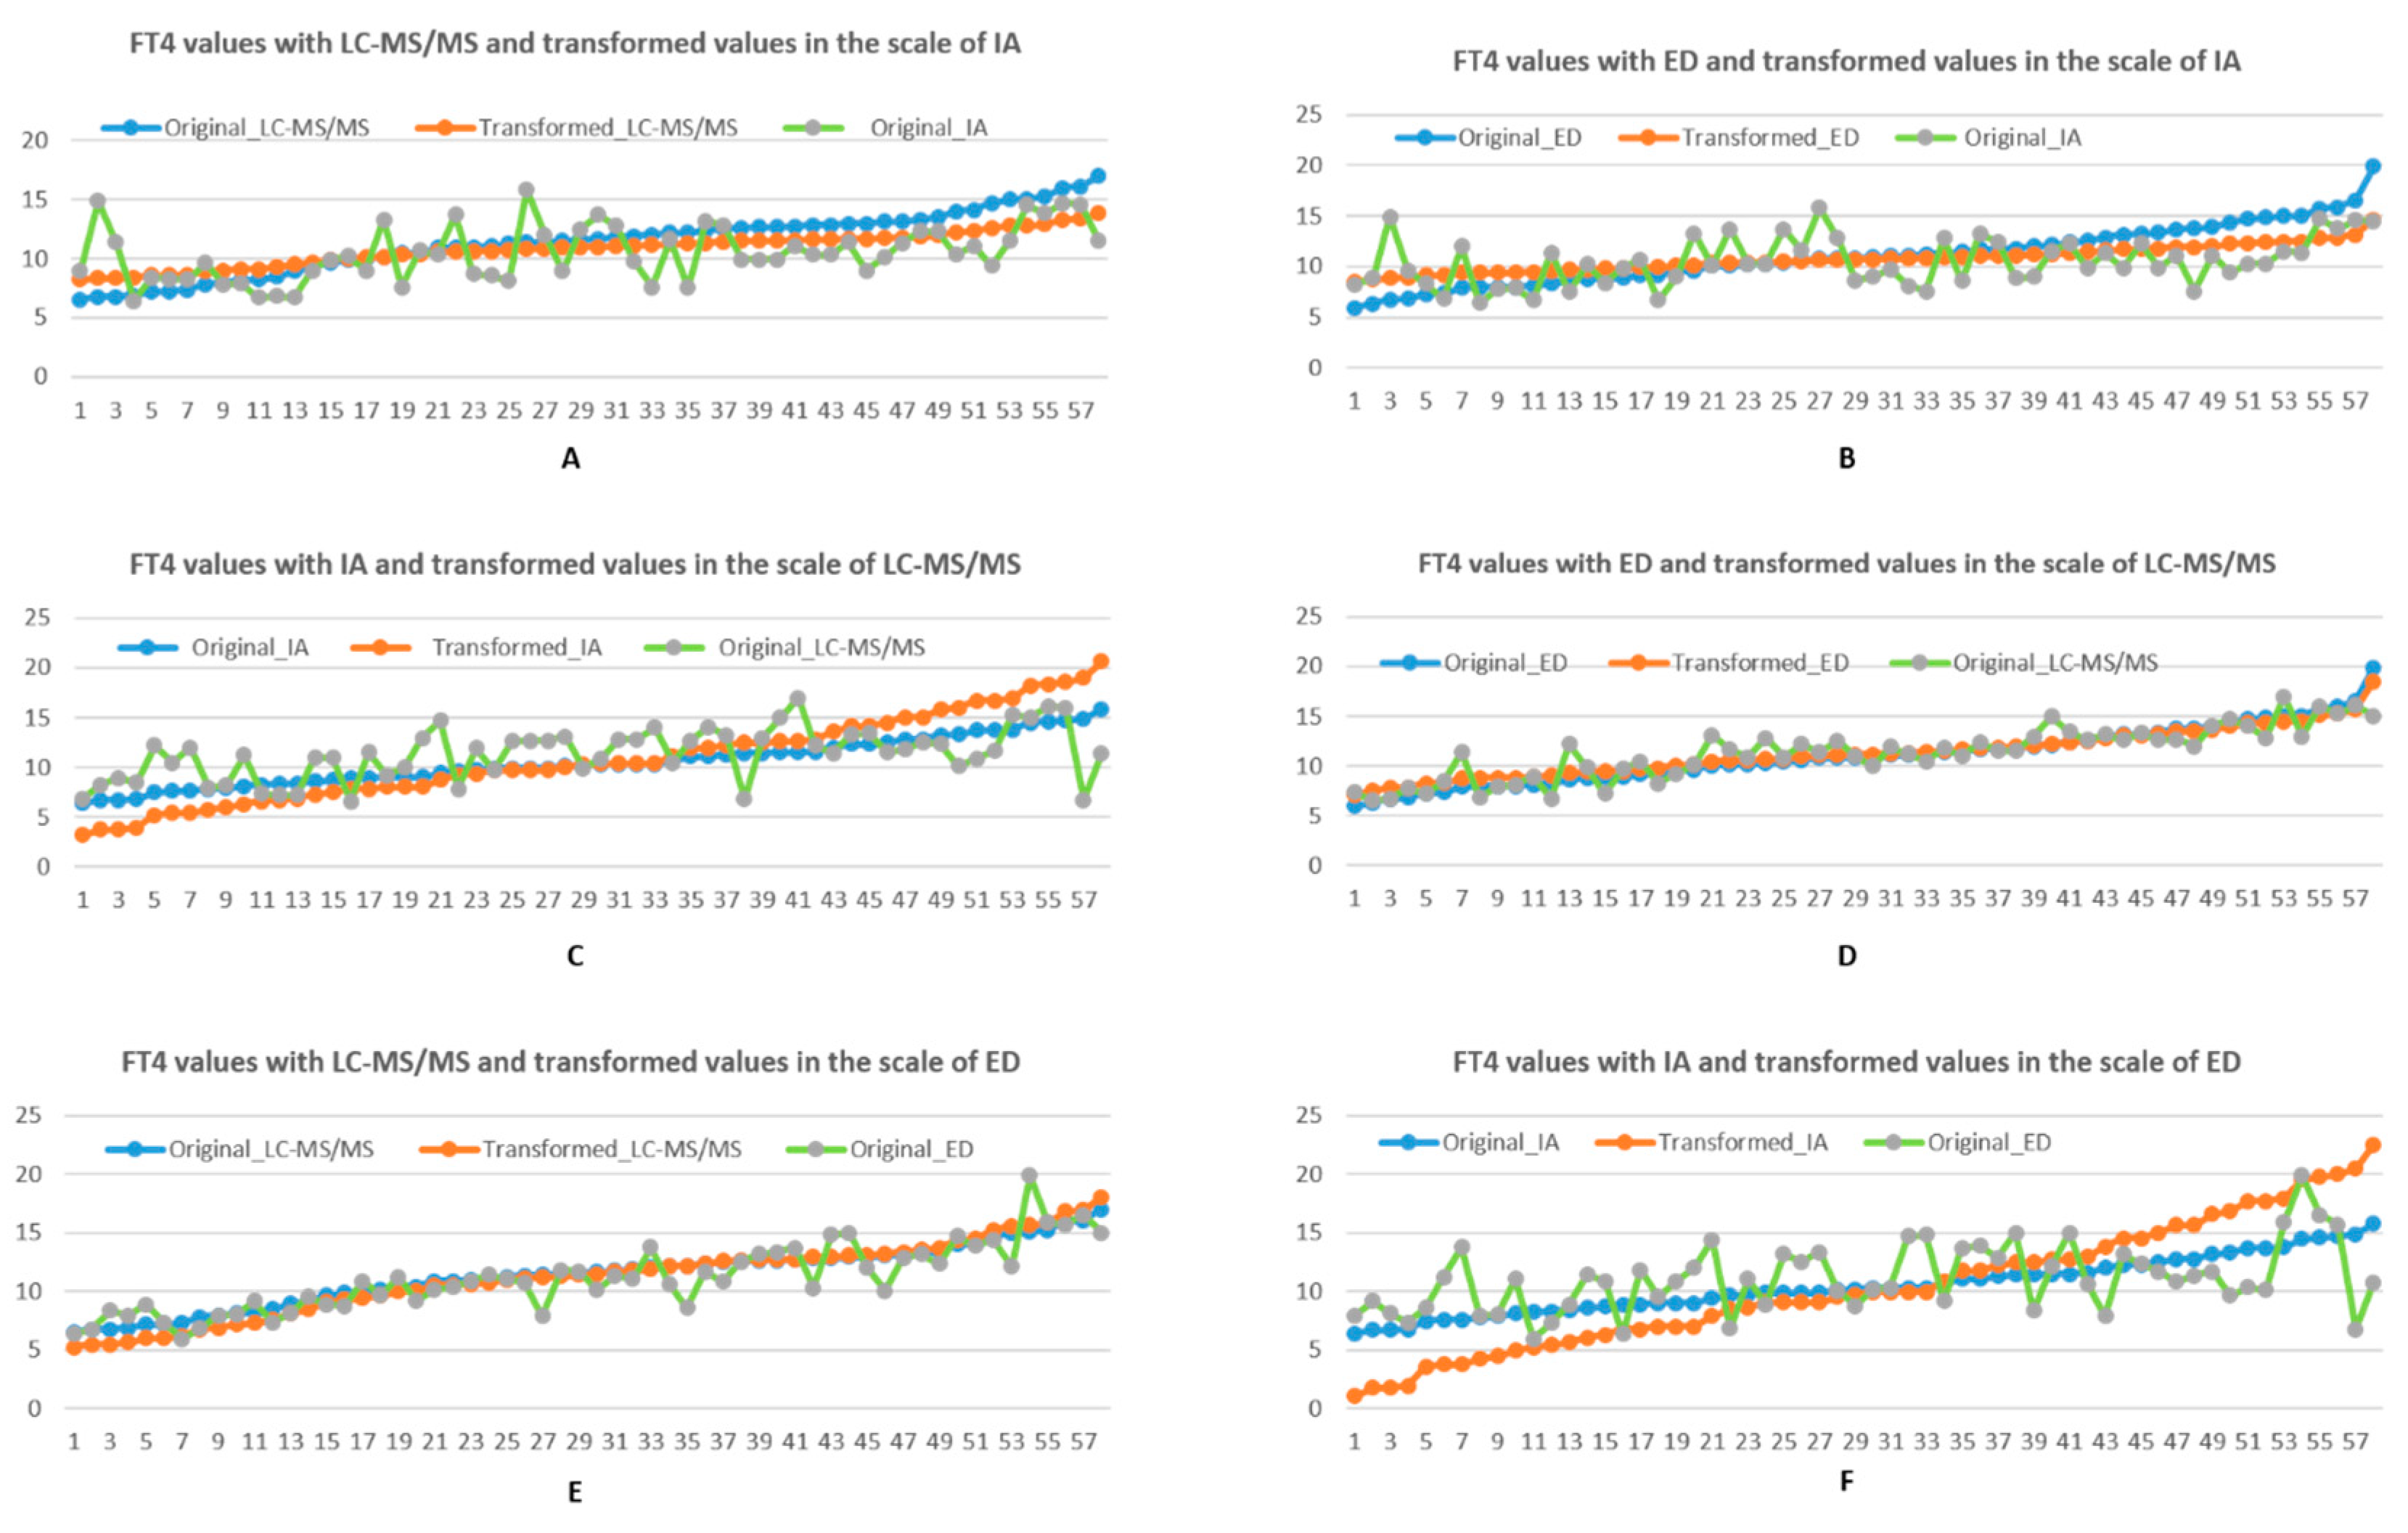
3.1. Numerical Analysis on Transformation
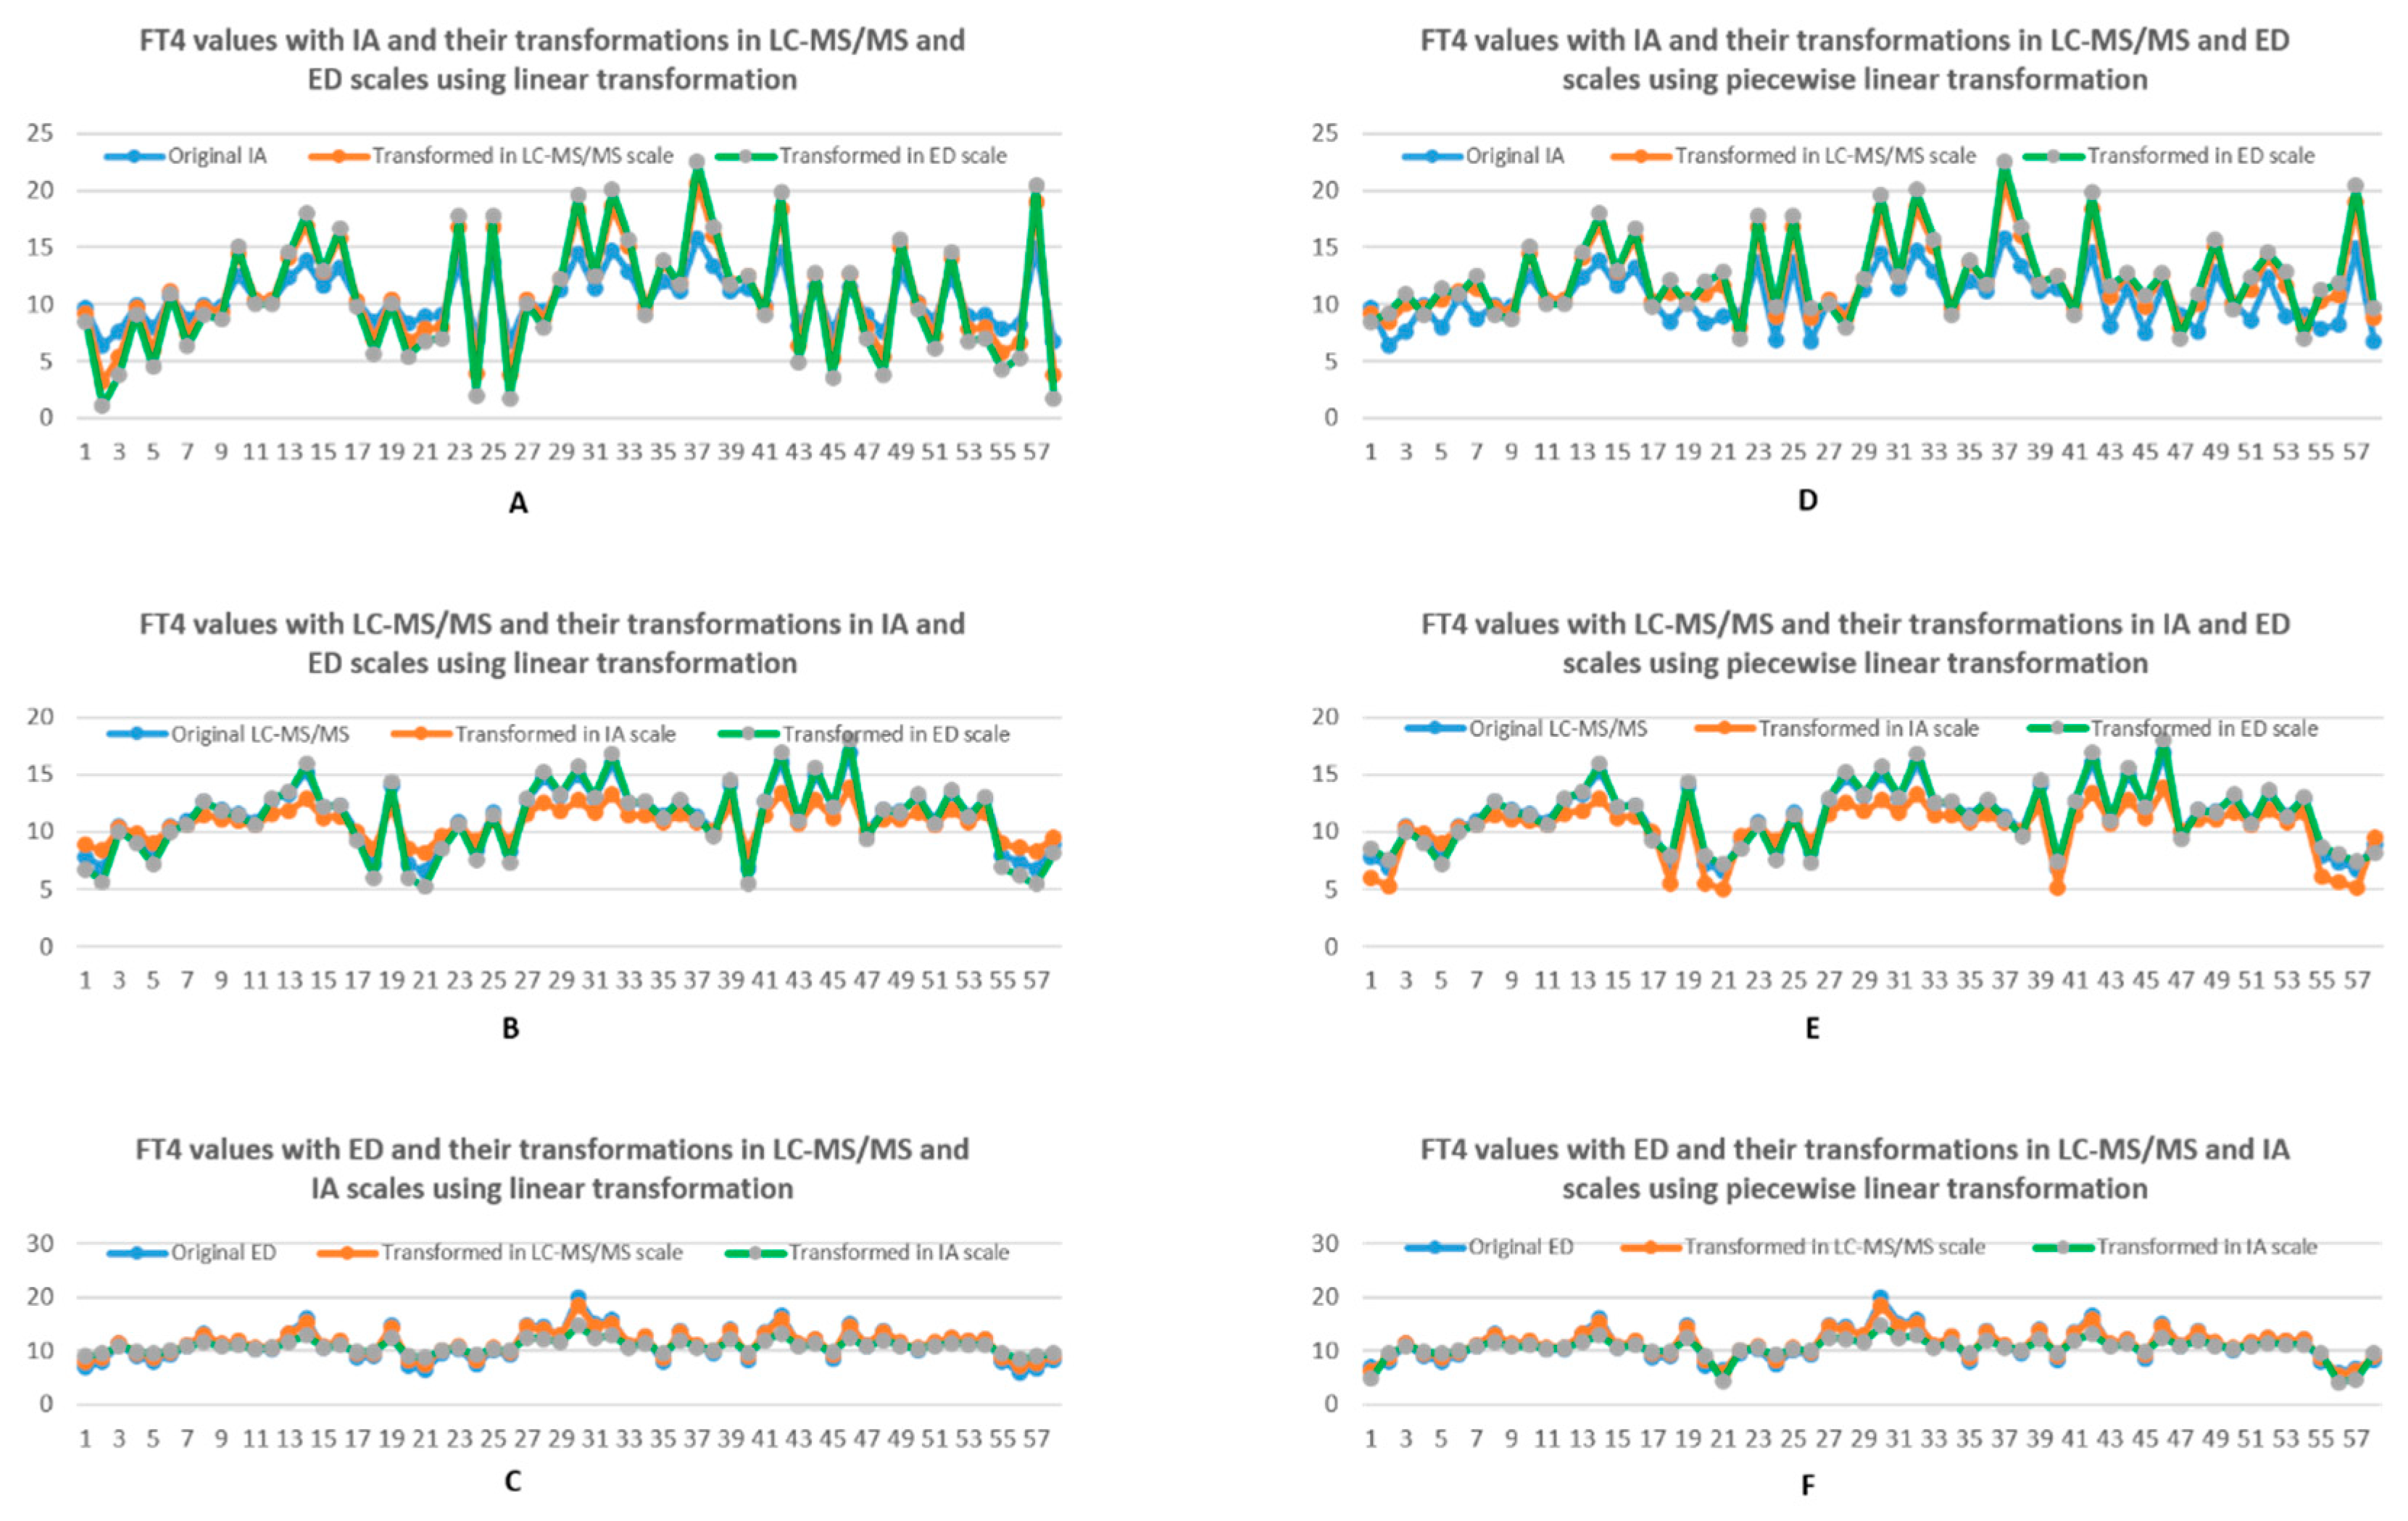
3.1.1. Linear Transformation
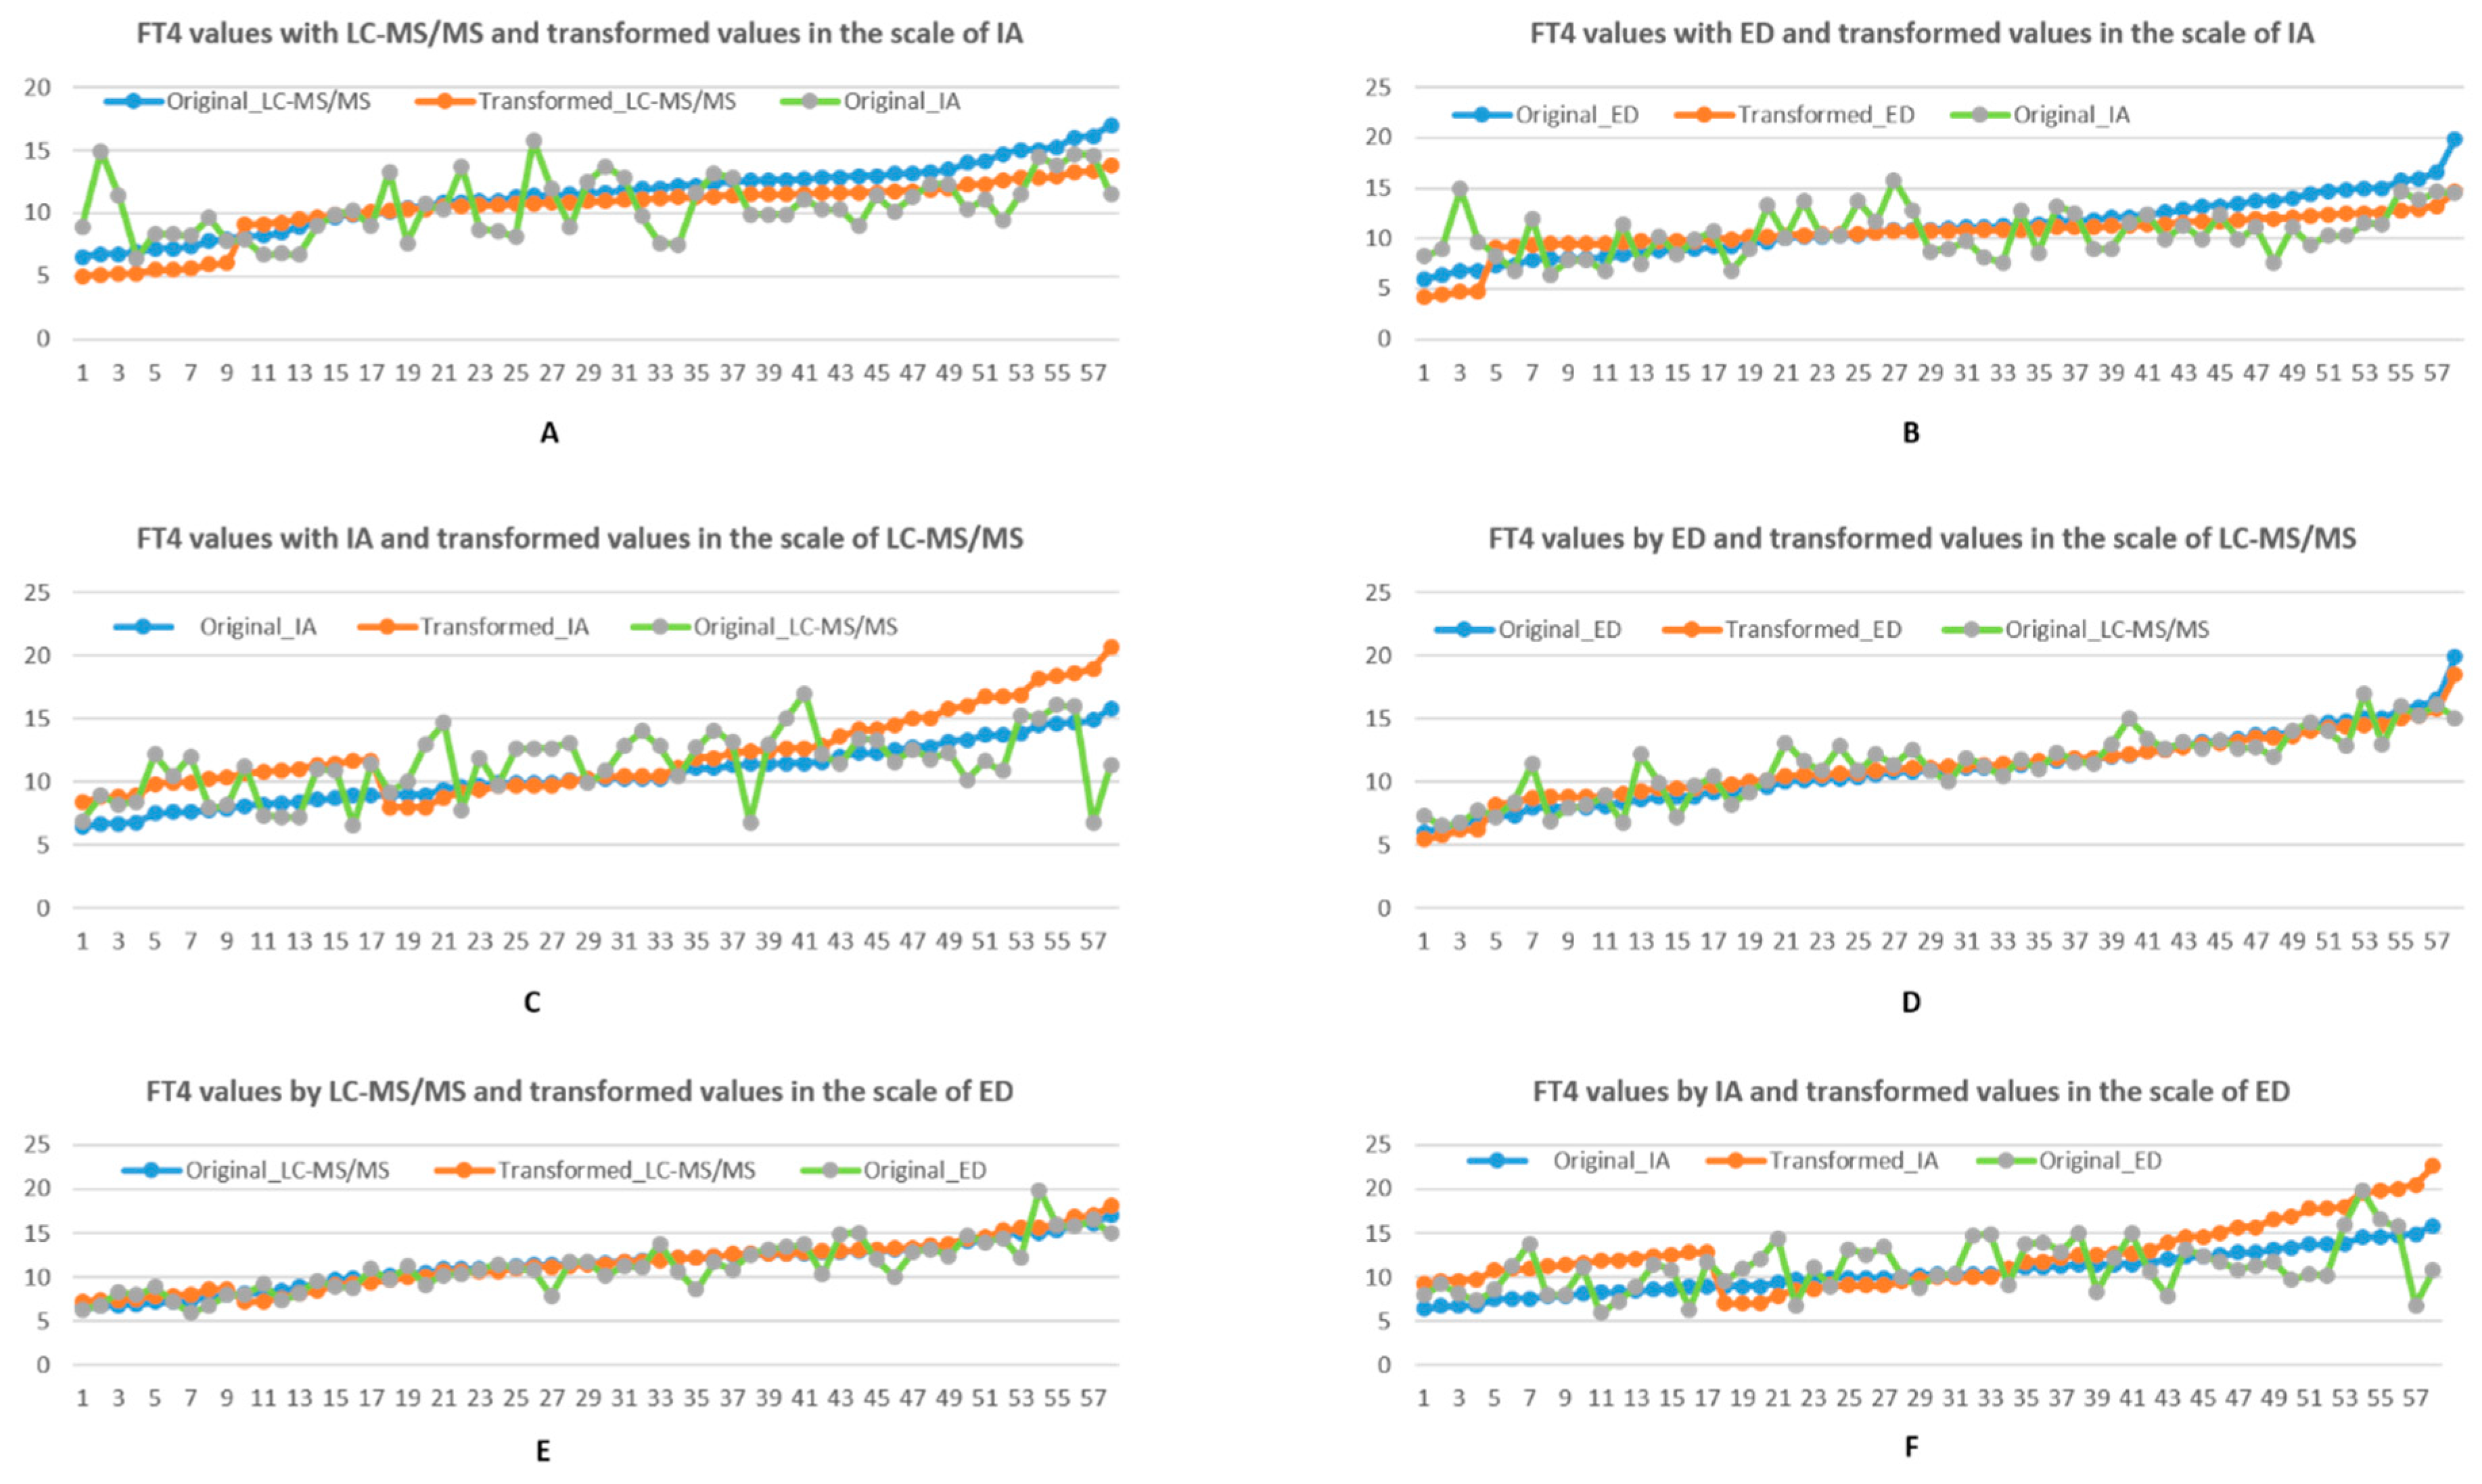
3.1.2. Piecewise Linear Transformation
4. Discussion
(ref range of lab#2: 7.0–19.4)
(ref range of lab#2: 0.4–4.7)
Limitations
5. Conclusions
Author Contributions
Funding
Institutional Review Board Statement
Informed Consent Statement
Data Availability Statement
Acknowledgments
Conflicts of Interest
References
- Mahadevan, S.; Sadacharan, D.; Kannan, S.; Suryanarayanan, A. Does time of sampling or food intake alter thyroid function test? Indian J. Endocrinol. Metab. 2017, 21, 369–372. [Google Scholar] [CrossRef] [PubMed]
- Spencer, C.A. Assay of thyroid hormones and related substances. In Endotext; Feingold, K.R., Anawalt, B., Boyce, A., Chrousos, G., Dungan, K., Grossman, A., Hershman, J.M., Kaltsas, G., Koch, C., Kopp, P., et al., Eds.; MDText.com Inc.: South Dartmouth, MA, USA, 2000. [Google Scholar]
- Fillee, C.; Cumps, J.; Ketelslegers, J.-M. Comparison of three free T4 (FT4) and free T3 (FT3) immunoassays in healthy subjects and patients with thyroid diseases and severe non-thyroidal illnesses. Clin. Lab. 2012, 58, 725–736. [Google Scholar] [PubMed]
- Killeen, A.A.; Long, T.; Souers, R.; Styer, P.; Ventura, C.B.; Klee, G.G. Verifying performance characteristics of quantitative analytical systems. Arch. Pathol. Lab. Med. 2014, 138, 1173–1181. [Google Scholar] [CrossRef] [PubMed]
- Jonklaas, J.; Sathasivam, A.; Wang, H.; Gu, J.; Burman, K.D.; Soldin, S.J. Total and free thyroxine and triiodothyronine: Measurement discrepancies, particularly in inpatients. Clin. Biochem. 2014, 47, 1272–1278. [Google Scholar] [CrossRef][Green Version]
- Park, H.S.; Yoo, J.; Lee, H.; Choi, A.R.; Ryu, J.; Park, K.H.; Oh, E.J. Analytical evaluation of portable and simple FREND fluorescent immunoassay for rapid quantification of thyroid-stimulating hormone and free thyroxine. Clin. Lab. 2016, 62, 2455–2460. [Google Scholar] [CrossRef]
- Soldin, S.J.; Soukhova, N.; Janicic, N.; Jonklaas, J.; Soldin, O.P. The measurement of free thyroxine by isotope dilution tandem mass spectrometry. Clin. Chim. Acta 2005, 358, 113–118. [Google Scholar] [CrossRef] [PubMed]
- Jonklaas, J.; Kahric-Janicic, N.; Soldin, P.O.; Soldin, S.J. Correlations of free thyroid hormones measured by tandem mass spectrometry and immunoassay with thyroid-stimulating hormone across 4 patient populations. Clin. Chem. 2009, 55, 1380–1388. [Google Scholar] [CrossRef]
- Kahric-Janicic, N.; Soldin, S.J.; Soldin, O.P.; West, T.; Gu, J.; Jonklaas, J. Tandem mass spectrometry improves the accuracy of free thyroxine measurements during pregnancy. Thyroid 2007, 17, 303–311. [Google Scholar] [CrossRef]
- Van Den Berg, R.A.; Hoefsloot, H.C.J.; Westerhuis, J.A.; Smilde, A.K.; Van Der Wert, M.J. Centering, scaling, and transformations: Improving the biological information content of metabolomics data. BMC Genom. 2006, 7, 142. [Google Scholar] [CrossRef]
- Finney, R.L.; Demana, F.D.; Waits, B.K.; Kennedy, D. Calculus: A Complete Course; Addison-Wesley: Boston, MA, USA, 2000. [Google Scholar]
- Moore, D.S.; Notz, W.I.; Flinger, M.A. The Basic Practice of Statistics, 6th ed.; W.H. Freeman and Company: New York, NY, USA, 2013. [Google Scholar]
- Nistor, C.; Emneus, J. Immunoassay: Potentials and limitations. Compr. Anal. Chem. 2005, 44, 375–427. [Google Scholar] [CrossRef]
- Hoofnagle, A.N.; Wener, M.H. The fundamental flaws of immunoassays and potential solutions using tandem mass spectrometry. J. Immunol. Methods 2009, 347, 3–11. [Google Scholar] [CrossRef] [PubMed]
- Kazerouni, F.; Amirrasouli, H. Performance characteristics of three automated immunoassays for thyroid hormones. Casp. J. Intern. Med. 2012, 3, 400–404. [Google Scholar] [PubMed]
- Autilio, C.; Morelli, R.; Locantore, P.; Pontecorvi, A.; Zuppi, C.; Carrozza, C. Stimulating TSH receptor autoantibodies immunoassay: Analytical evaluation and clinical performance in Graves’ disease. Ann. Clin. Biochem. 2018, 55, 172–177. [Google Scholar] [CrossRef] [PubMed]
- Reix, N.; Massart, C.; d’Herbomez, M.; Gasser, F.; Heurtault, B.; Agin, A. Thyroid-stimulating hormone and free thyroxine on the ADVIA Centaur immunoassay system: A multicenter assessment of analytical performance. Clin. Biochem. 2013, 46, 1305–1308. [Google Scholar] [CrossRef] [PubMed][Green Version]
- Monneret, D.; Guergour, D.; Vergnaud, S.; Laporte, F.; Faure, P.; Gauchez, A.S. Evaluation of LOCI technology-based thyroid blood tests on the Dimension Vista analyzer. Clin. Biochem. 2013, 46, 1290–1297. [Google Scholar] [CrossRef]
- Thienpont, L.M.; Van Uytfanghe, K.; Van Houcke, S. Standardization activities in the field of thyroid function tests: A status report. Clin. Chem. Lab. Med. 2010, 48, 1577–1583. [Google Scholar] [CrossRef]
- Thienpont, L.M.; van Uytfanghe, K.; van Houcke, S.; Das, B.; Faix, J.D.; MacKenzie, F.; Quinn, F.A.; Rottmann, M.; van den Bruel, A.; IFCC Committee for Standardization of Thyroid Function Tests (C-STFT). A Progress Report of the IFCC Committee for Standardization of Thyroid Function Tests. Eur. Thyroid. J. 2014, 3, 109–116. [Google Scholar] [CrossRef] [PubMed]
- Thienpont, L.M.; Faix, J.D.; Beastall, G. Standardization of FT4 and Harmonization of TSH Measurements—A Request for Input from Endocrinologists and Other Physicians. Endocr. Pract. 2016, 22, 374. [Google Scholar] [CrossRef]
- De Grande, L.A.C.; Goossens, K.; Van Uytfanghe, K.; Das, B.; MacKenzie, F.; Patru, M.M.; Thienpont, L.M.; IFCC Committee for Standardization of Thyroid Function Tests (C-STFT). Monitoring the stability of the standardization status of FT4 and TSH assays by use of daily outpatient medians and flagging frequencies. Clin. Chim. Acta 2017, 467, 8–14. [Google Scholar] [CrossRef]
- Thienpont, L.M.; Van Uytfanghe, K.; De Grande, L.A.C.; Reynders, D.; Das, B.; Faix, J.D.; MacKenzie, F.; Decallonne, B.; Hishinuma, A.; Lapauw, B.; et al. IFCC Committee for Standardization of Thyroid Function Tests (C-STFT). Harmonization of Serum Thyroid-Stimulating Hormone Measurements Paves the Way for the Adoption of a More Uniform Reference Interval. Clin. Chem. 2017, 63, 1248–1260. [Google Scholar] [CrossRef]
- De Grande, L.A.C.; van Uytfanghe, K.; Reynders, D.; Das, B.; Faix, J.D.; MacKenzie, F.; Decallonne, B.; Hishinuma, A.; Lapauw, B.; Taelman, P.; et al. IFCC Committee for Standardization of Thyroid Function Tests (C-STFT). Standardization of Free Thyroxine Measurements Allows the Adoption of a More Uniform Reference Interval. Clin. Chem. 2017, 63, 1642–1652. [Google Scholar] [CrossRef] [PubMed]
- International Federation of Clinical Chemistry; Laboratory Medicine Working Group for Standardization of Thyroid Function Tests; van Houcke, S.K.; van Uytfanghe, K.; Shimizu, E.; Tani, W.; Umemoto, M.; Thienpont, L.M. IFCC international conventional reference procedure for the measurement of free thyroxine in serum. International Federation of Clinical Chemistry and Laboratory Medicine (IFCC) Working Group for Standardization of Thyroid Function Tests (WG-STFT). Clin. Chem. Lab. Med. 2011, 49, 1275–1281. [Google Scholar] [CrossRef] [PubMed]
- Iervasi, G.; Clerico, A. Harmonization of free thyroid hormone tests: A mission impossible? Clin. Chem. Lab. Med. 2011, 49, 43–48. [Google Scholar] [CrossRef] [PubMed]
- Meier, C.A.; Maisey, M.N.; Lowry, A.; Müller, J.; Smith, M.A. Interindividual differences in the pituitary-thyroid axis influence the interpretation of thyroid function tests. Clin. Endocrinol. 1993, 39, 101–107. [Google Scholar] [CrossRef] [PubMed]
- Goede, S.L.; Leow, M.K. Letter to the Editor: The Ultimate Proof of the Log-linear Nature of TSH-Free T4 Relationship by Intraindividual Analysis of a Large Population. J. Clin. Endocrinol. Metab. 2016, 101, L57–L58. [Google Scholar] [CrossRef]
- Van Deventer, H.E.; Mendu, D.R.; Remaley, A.T.; Soldin, S.J. Inverse log-linear relationship between thyroid-stimulating hormone and free thyroxine measured by direct analog immunoassay and tandem mass spectrometry. Clin. Chem. 2011, 57, 122–127. [Google Scholar] [CrossRef]
- Benhadi, N.; Fliers, E.; Visser, T.J.; Reitsma, J.B.; Wiersinga, W.M. Pilot study on the assessment of the setpoint of the hypothalamus-pituitary-thyroid axis in healthy volunteers. Eur. J. Endocrinol. 2010, 162, 323–329. [Google Scholar] [CrossRef]
- Jonklaas, J.; Soldin, S.J. Tandem mass spectrometry as a novel tool for elucidating pituitary-thyroid relationships. Thyroid 2008, 18, 1303–1311. [Google Scholar] [CrossRef]
- Bowerbank, S.L.; Carlin, M.G.; Dean, J.R. A direct comparison of liquid chromatography-mass spectrometry with clinical routine testing immunoassay methods for the detection and quantification of thyroid hormones in blood serum. Anal. Bioanal. Chem. 2019, 411, 2839–2853. [Google Scholar] [CrossRef]


| Method | LC-MS/MS | IA | ED | |||
|---|---|---|---|---|---|---|
| Mean (SD) | 11.55 (4.55) | 10.58 (3.28) | 11.26 (4.57) | |||
| CV | 0.39 | 0.31 | 0.41 | |||
| 95% Reference limit | (2.64, 20.46) | (4.16, 17) | (2.31, 20.22) | |||
| 90% Confidence interval of limits | (1.02, 4.26) | (18.84, 22.09) | (2.99, 5.33) | (15.84, 18.17) | (0.68, 3.94) | (18.59, 21.85) |
| Method | LC-MS/MS | IA | ED |
|---|---|---|---|
| Reference interval | (8, 21) | (9, 16) | (7, 23) |
| Method | LC-MS/MS | ED | ||||
|---|---|---|---|---|---|---|
| Original | New | Change% | Original | New | Change% | |
| Mean | 11.34 | 10.80 | −4.76% | 11.09 | 10.79 | −2.71% |
| SD | 2.61 | 1.41 | −46.08% | 2.88 | 1.26 | −56.19% |
| CV | 0.23 | 0.13 | −43.34% | 0.26 | 0.12 | −55.03% |
| Method | IA | ED | ||||
|---|---|---|---|---|---|---|
| Original | New | Change% | Original | New | Change% | |
| Mean | 10.49 | 10.77 | 2.67% | 11.09 | 11.32 | 2.11% |
| SD | 2.36 | 4.38 | 85.40% | 2.88 | 2.34 | −18.65% |
| CV | 0.22 | 0.41 | 84.66% | 0.26 | 0.21 | −20.42% |
| Method | LC-MS/MS | IA | ||||
|---|---|---|---|---|---|---|
| Original | New | Change% | Original | New | Change% | |
| Mean | 11.34 | 11.11 | −1.99% | 10.49 | 10.41 | −0.77% |
| SD | 2.61 | 3.22 | 23.26% | 2.36 | 5.39 | 128.19% |
| CV | 0.23 | 0.29 | 25.85% | 0.22 | 0.52 | 135.15% |
| Method | LC-MS/MS | ED | ||||
|---|---|---|---|---|---|---|
| Original | New | Change% | Original | New | Change% | |
| Mean | 11.34 | 10.32 | −8.99% | 11.09 | 10.50 | −5.36% |
| SD | 2.61 | 2.34 | −10.41% | 2.88 | 2.00 | −30.62% |
| CV | 0.23 | 0.227 | −1.49% | 0.26 | 0.19 | −26.78% |
| Method | IA | ED | ||||
|---|---|---|---|---|---|---|
| Original | New | Change% | Original | New | Change% | |
| Mean | 10.49 | 12.07 | 15.10% | 11.09 | 11.21 | 1.07% |
| SD | 2.36 | 3.15 | 33.30% | 2.88 | 2.56 | −11.16% |
| CV | 0.22 | 0.26 | 18.43% | 0.26 | 0.23 | −12.21% |
| Method | LC-MS/MS | IA | ||||
|---|---|---|---|---|---|---|
| Original | New | Change% | Original | New | Change% | |
| Mean | 11.34 | 11.41 | 0.58% | 10.49 | 12.44 | 18.59% |
| SD | 2.61 | 2.79 | 6.71% | 2.36 | 3.66 | 55.24% |
| CV | 0.23 | 0.24 | 6.17% | 0.22 | 0.29 | 33.87% |
| Subject S/N | Original IA | LC-MS/MS to IA | ED to IA | Original LC-MS/MS | Original ED |
|---|---|---|---|---|---|
| 2 | 6.40 | 8.40 | 9.42 | 6.89 | 7.97 |
| 58 | 7.80 | 8.97 | 9.42 | 7.94 | 7.97 |
| 59 | 8.24 | 8.64 | 8.55 | 7.33 | 5.96 |
| 22 | 8.30 | 8.57 | 9.12 | 7.21 | 7.29 |
| 20 | 8.40 | 8.56 | 9.82 | 7.19 | 8.88 |
| 23 | 8.90 | 8.22 | 8.71 | 6.55 | 6.35 |
| 1 | 9.65 | 8.90 | 8.92 | 7.81 | 6.82 |
| 52 | 10.10 | 11.75 | 10.34 | 13.10 | 10.07 |
| 42 | 11.40 | 8.34 | 9.59 | 6.77 | 8.35 |
| 60 | 14.90 | 8.32 | 8.90 | 6.75 | 6.77 |
| Subject S/N | Original IA | LC-MS/MS to IA | ED to IA | Original LC-MS/MS | Original ED |
|---|---|---|---|---|---|
| 2 | 6.40 | 5.25 | 9.42 | 6.89 | 7.97 |
| 58 | 7.80 | 6.05 | 9.42 | 7.94 | 7.97 |
| 59 | 8.24 | 5.58 | 4.15 | 7.33 | 5.96 |
| 22 | 8.30 | 5.49 | 9.12 | 7.21 | 7.29 |
| 20 | 8.40 | 5.48 | 9.82 | 7.19 | 8.88 |
| 23 | 8.90 | 4.99 | 4.42 | 6.55 | 6.35 |
| 1 | 9.65 | 5.95 | 4.74 | 7.81 | 6.82 |
| 52 | 10.10 | 11.75 | 10.34 | 13.10 | 10.07 |
| 42 | 11.40 | 5.16 | 9.59 | 6.77 | 8.35 |
| 60 | 14.90 | 5.14 | 4.71 | 6.75 | 6.77 |
Publisher’s Note: MDPI stays neutral with regard to jurisdictional claims in published maps and institutional affiliations. |
© 2021 by the authors. Licensee MDPI, Basel, Switzerland. This article is an open access article distributed under the terms and conditions of the Creative Commons Attribution (CC BY) license (http://creativecommons.org/licenses/by/4.0/).
Share and Cite
Meng, F.; Jonklaas, J.; Leow, M.K.-S. Interconversion of Plasma Free Thyroxine Values from Assay Platforms with Different Reference Intervals Using Linear Transformation Methods. Biology 2021, 10, 45. https://doi.org/10.3390/biology10010045
Meng F, Jonklaas J, Leow MK-S. Interconversion of Plasma Free Thyroxine Values from Assay Platforms with Different Reference Intervals Using Linear Transformation Methods. Biology. 2021; 10(1):45. https://doi.org/10.3390/biology10010045
Chicago/Turabian StyleMeng, Fanwen, Jacqueline Jonklaas, and Melvin Khee-Shing Leow. 2021. "Interconversion of Plasma Free Thyroxine Values from Assay Platforms with Different Reference Intervals Using Linear Transformation Methods" Biology 10, no. 1: 45. https://doi.org/10.3390/biology10010045
APA StyleMeng, F., Jonklaas, J., & Leow, M. K.-S. (2021). Interconversion of Plasma Free Thyroxine Values from Assay Platforms with Different Reference Intervals Using Linear Transformation Methods. Biology, 10(1), 45. https://doi.org/10.3390/biology10010045