Article

Raman Scattering for Anisotropy of Polyacrylonitrile-Based and Pitch-Based Carbon Fibers

1
Polymer Matrix Composites Group, Research Center for Structural Materials, National Institute for Materials Science (NIMS), Tsukuba 305-0047, Japan
2
Department of Aerospace Engineering, Tohoku University, Sendai 980-8579, Japan
*
Author to whom correspondence should be addressed.
Fibers 2025, 13(9), 114; https://doi.org/10.3390/fib13090114
Submission received: 31 May 2025 / Revised: 6 August 2025 / Accepted: 21 August 2025 / Published: 25 August 2025

Abstract

Polyacrylonitrile (PAN)-based and pitch-based carbon fibers exhibit significant anisotropies in the radial and axial directions. Characterizing the anisotropy of the elastic properties of PAN-based and pitch-based carbon fibers is important for carbon fiber research communities. In this present study, the Raman scattering for anisotropy of PAN-based and pitch-based carbon fiber-reinforced plastic (CFRP) samples was investigated. The Raman scattering parameters and ratios in the CFRPs with 0°, 45°, and 90° sections are related to the tensile modulus. These linear trends for the PAN-based and pitch-based CFRPs with 0°, 45°, and 90° sections intersect in the range of 400–700 GPa. The change in Raman scattering parameters and ratios of PAN-based and pitch-based carbon fibers and CFRPs with a 0° section are related to the tensile modulus. These linear trends also intersect in the range of 400–700 GPa. The intensity ratios increased with increase in the angle for each CFRPs. The intensity ratio in an arbitrary angle could be estimated using the rule of mixtures and coordinate transformation equations. The Raman anisotropic nature of PAN-based and pitch-based fibers are identified experimentally and analytically.

1. Introduction

The utilization of polyacrylonitrile (PAN)-based and pitch-based carbon fibers, which exhibit elevated axial stiffness and strength, has been employed to reinforce polymer-matrix materials in advanced composites [1]. Carbon fiber-reinforced plastics (CFRPs) are widely used in aerospace, automotive, energy, and marine industries due to their exceptional strength-to-weight ratio and corrosion resistance [2,3]. For instance, Hamzat et al. [2] provide a comprehensive review of CFRP applications in aircraft, helicopters, drones, wind turbines, and ships, emphasizing their performance under mechanical, thermal, and chemical stress conditions. Seo et al. [4] highlight the growing demand for CFRP components and the need for precise manufacturing techniques to meet the stringent requirements of these industries. To address environmental concerns, recent research has focused on sustainable production and recycling of CFRPs. Innovative closed-loop recycling methods have enabled the reintegration of carbon fibers into new composite materials, promoting circular economy principles [3]. However, these fibers demonstrate substantial anisotropies in radial and axial directions. Additionally, there is a dearth of data concerning the elastic properties of fibers in directions other than the longitudinal and transverse directions, as well as on the relationship between elastic properties and fiber structures. Pitch-based carbon fibers, especially, offer a high modulus and thermal stability, making them suitable for applications requiring dimensional precision and high stiffness, such as aerospace structures, robotics, and precision instruments [5]. Their unique graphitic microstructure also contributes to pronounced anisotropic properties, which are critical for directional mechanical performance and thermal conductivity [5]. A number of studies have been conducted to examine the structure of carbon fibers employing a variety of techniques, including X-ray diffraction (XRD) [6,7] and transmission electron microscopy (TEM) [8,9]. The anisotropy of the elastic properties of carbon fibers has been evaluated by nanoindentation [10,11], ultrasonic spectroscopy (RUS) [12], and radial compression tests of the carbon fibers [13,14]. Additionally, Naito et al. [15] also characterized the anisotropy of the elastic properties of various PAN-based and pitch-based carbon fibers using the nanoindentation test.
Raman spectroscopy is a non-destructive, contactless technique capable of providing localized structural information with high spatial resolution and sensitivity to microstructural variations [16]. It is particularly sensitive to crystallinity, defect density, and molecular orientation, which are critical parameters in assessing the anisotropic nature. Unlike techniques such as XRD or TEM, which often require extensive sample preparation or provide limited surface information, Raman spectroscopy enables rapid, in situ characterization of material surfaces without altering the sample preparation [16]. Raman spectroscopy has been extensively applied in a variety of studies on carbon materials, and its efficacy in characterizing these structures has been proven. Preliminary research on carbon materials indicated that a Raman band at approximately 1600 cm−1 can be associated with the graphite mode (G-band). Another band in polycrystalline line graphite, observed at approximately 1300 cm−1, is attributable to the defect mode (D-band) [17]. The D- and G-bands in Raman spectra are sensitive to the degree of graphitization, defect density, and orientation of sp2 carbon domains. These spectral features are strongly correlated with mechanical properties such as tensile strength and modulus [18]. Brubaker et al. [18] demonstrated that the position and shape of the peak in Raman spectra exhibit robust correlations with mechanical performance across a wide range of PAN-based carbon fibers [18]. The ratio of the intensities of the two bands, ID/IG, is one of the effective ways to evaluate the difference in modulus and anisotropy of PAN-based and pitch-based carbon fibers. Naito et al. [19] also characterized the parameters and ratios related to Raman scattering and stress measurement for the G- and D-bands of various PAN-based and pitch-based carbon fibers. These Raman scattering parameters and ratios include peak values of Raman shifts (RG, RD), full width at half maximum (FWHMG, FWHMD), peak value slopes (|AG|, |AD|), peak value intercepts (BG, BD), intensity ratio (ID/IG), peak value ratio (RD/RG), full width at half maximum ratio (FWHMD/FWHMG), slope ratio (AD/AG), and intercept ratio (BD/BG). These correlations were verified by evaluating PAN-based and pitch-based carbon fibers separately, and these parameters and ratios were correlated to the tensile modulus (E) and the X-ray diffraction structure parameters of interlayer spacing (d002), lattice spacing (d10), and crystalline size (Lc and La). These make Raman spectroscopy particularly suitable for evaluating anisotropy, which is inherently linked to the alignment and ordering of carbon structures. Additionally, Raman spectroscopy allows polarization-dependent measurements [18], enabling the assessment of anisotropy by comparing spectral responses along different fiber orientations. This capability is crucial for understanding the directional dependence of structural properties.
The evaluation of the anisotropy of various PAN-based and pitch-based carbon fibers using Raman spectroscopy and the understanding of the relationship between the Raman scattering parameters and the mechanical/structural properties are important for the design and development of carbon fiber-reinforced composites and structures [20,21]. However, the anisotropy of PAN-based and pitch-based carbon fibers using the Raman spectroscopy and the relationship between the Raman scattering parameters and the mechanical properties are not yet understood.
In this study, Raman scattering was employed to assess the anisotropy of a series of commercially available carbon fibers, including high-strength PAN-based, high-modulus PAN-based, high-modulus pitch-based, and high-ductility pitch-based carbon fibers, along with carbon fiber-reinforced plastic (CFRP) samples. It was found that the X-ray diffraction structure parameters were correlated to the tensile modulus in the previous investigation. Therefore, the relationship between the Raman scattering parameters and the tensile modulus as mechanical properties was evaluated.

2. Materials and Methods

Materials

CFRP prepreg sheets were cured by an autoclave (ACA Series, Ashida Mfg. Co., Ltd., Osaka, Japan) in a laboratory setting to prepare the CFRP samples. The prepreg sheets were trimmed to the requisite dimensions and fiber orientation prior to being placed in the autoclave chamber. CFRP laminates were fabricated using a hand lay-up and vacuum bagging technique (without a bleeder). The curing conditions, layer sequences, and carbon fiber volume fractions of the CFRPs are summarized in Table 1.
The high-strength PAN-based (HS-PAN) (T700SC), high-modulus PAN-based (HM-PAN) (M60JB), high-modulus pitch-based (HM-pitch) (K13D), and high-ductility pitch-based (HD-pitch) (XN05) CFRPs with nominal thicknesses of approximately 14 mm were used. The HS-PAN (T300 and IMS60) and HM-pitch (K13C) CFRPs with nominal thicknesses of approximately 14 mm and the HS-PAN (T800SC) CFRP with a nominal thickness of approximately 1 mm were also tested for comparison purposes. T700SC, M60JB, T300, and T800SC PAN-based carbon fibers were supplied by Toray Industries, Inc., Tokyo, Japan. IMS60 PAN-based carbon fiber was supplied by Teijin Ltd., Tokyo, Japan. K13D and K13C pitch-based carbon fibers were supplied by Mitsubishi Chemical Corp., Tokyo, Japan. XN05 pitch-based carbon fiber was supplied by Nippon Graphite Fiber Corp., Hyogo, Japan. The tensile modulus of PAN-based and pitch-based carbon fibers is summarized in Table 1. T700SC, M60JB, T300, T800SC, and K13C prepregs were supplied by Toray Industries, Inc., Tokyo, Japan. IMS60 prepreg was supplied by Teijin Ltd., Tokyo, Japan. K13D prepreg was supplied by Mitsubishi Chemical Corp., Tokyo, Japan. XN05 prepreg was supplied by Nippon Graphite Fiber Corp., Hyogo, Japan. The fabricated CFRPs were cut into 10 × 10 × 10 (10 × 10 × 1 for T800SC) mm3 pieces using a rotary cutting machine (Refine cutter RCA-234, Refine Tec Ltd., Kanagawa, Japan) at 2500 rpm with an abrasive cutting wheel (GC150NB, Heiwa Technica Co., Ltd., Tokyo, Japan). The CFRP samples were embedded in the epoxy resin and subsequently polished by an automatic polishing machine (Automet 2000, Buhler Ltd., Yokohama, Japan) with TexmetP and polycrystalline diamond suspensions of 9 and 3 μm, followed by a MasterTex and MasterPrep (Al2O3) suspension of 0.05 μm. This process was undertaken to produce cross sections of the carbon fibers for anisotropy Raman spectra measurement testing. The specimens’ surface was polished to clearly define the carbon fibers and resin phases [15]. Two specimens were prepared for all CFRP samples. Figure 1a–e shows the anisotropy Raman spectra measurement samples.
Raman spectra measurement tests were carried out on axial (0°), 45 degree (45°), and cross (90°) sections of each carbon fiber to investigate the anisotropy of the Raman spectra of the carbon fibers in the chamber of a laser Raman spectrometer (NRS-7100. JASCO Corp., Tokyo, Japan). The experimental apparatus utilized a laser excitation wavelength of 532 nm, a diffraction grating of 1800 L/mm, a CCD detector, a long working distance object lens (100×) (spot size of 1 μm), a redactor with an OD of 1, a laser power of less than 3 mW, an exposure time of 60 s, and a neon lamp calibration. Raman spectra were measured over the 1200–1700 cm−1 range. At least twenty specimens were tested at different locations of all carbon fibers.

3. Results and Discussion

3.1. Raman Spectrum

The Raman spectra were obtained from a neon lamp calibration (1712.71 cm−1) and baseline correction. Figure 2a–d shows the Raman spectra of PAN-based and pitch-based carbon fibers and CFRPs with axial (0°), 45 degree (45°), and cross (90°) sections. The G-band peak at 1600 cm−1 and D-band peak at 1300 cm−1 are clearly visible in the PAN-based and pitch-based carbon fibers and CFRPs with 0°, 45°, and 90° sections. In order to correctly describe the parameters, Raman spectra were analyzed using a combination of multi peak fitting functions. Specifically, two or three Lorentzian functions were selected with the intention to fit the G- and D-bands [21,22]. This package of fitting functions is designed to be applicable to the Raman spectra of carbon fibers. These fitting lines are also shown in Figure 2a–d.
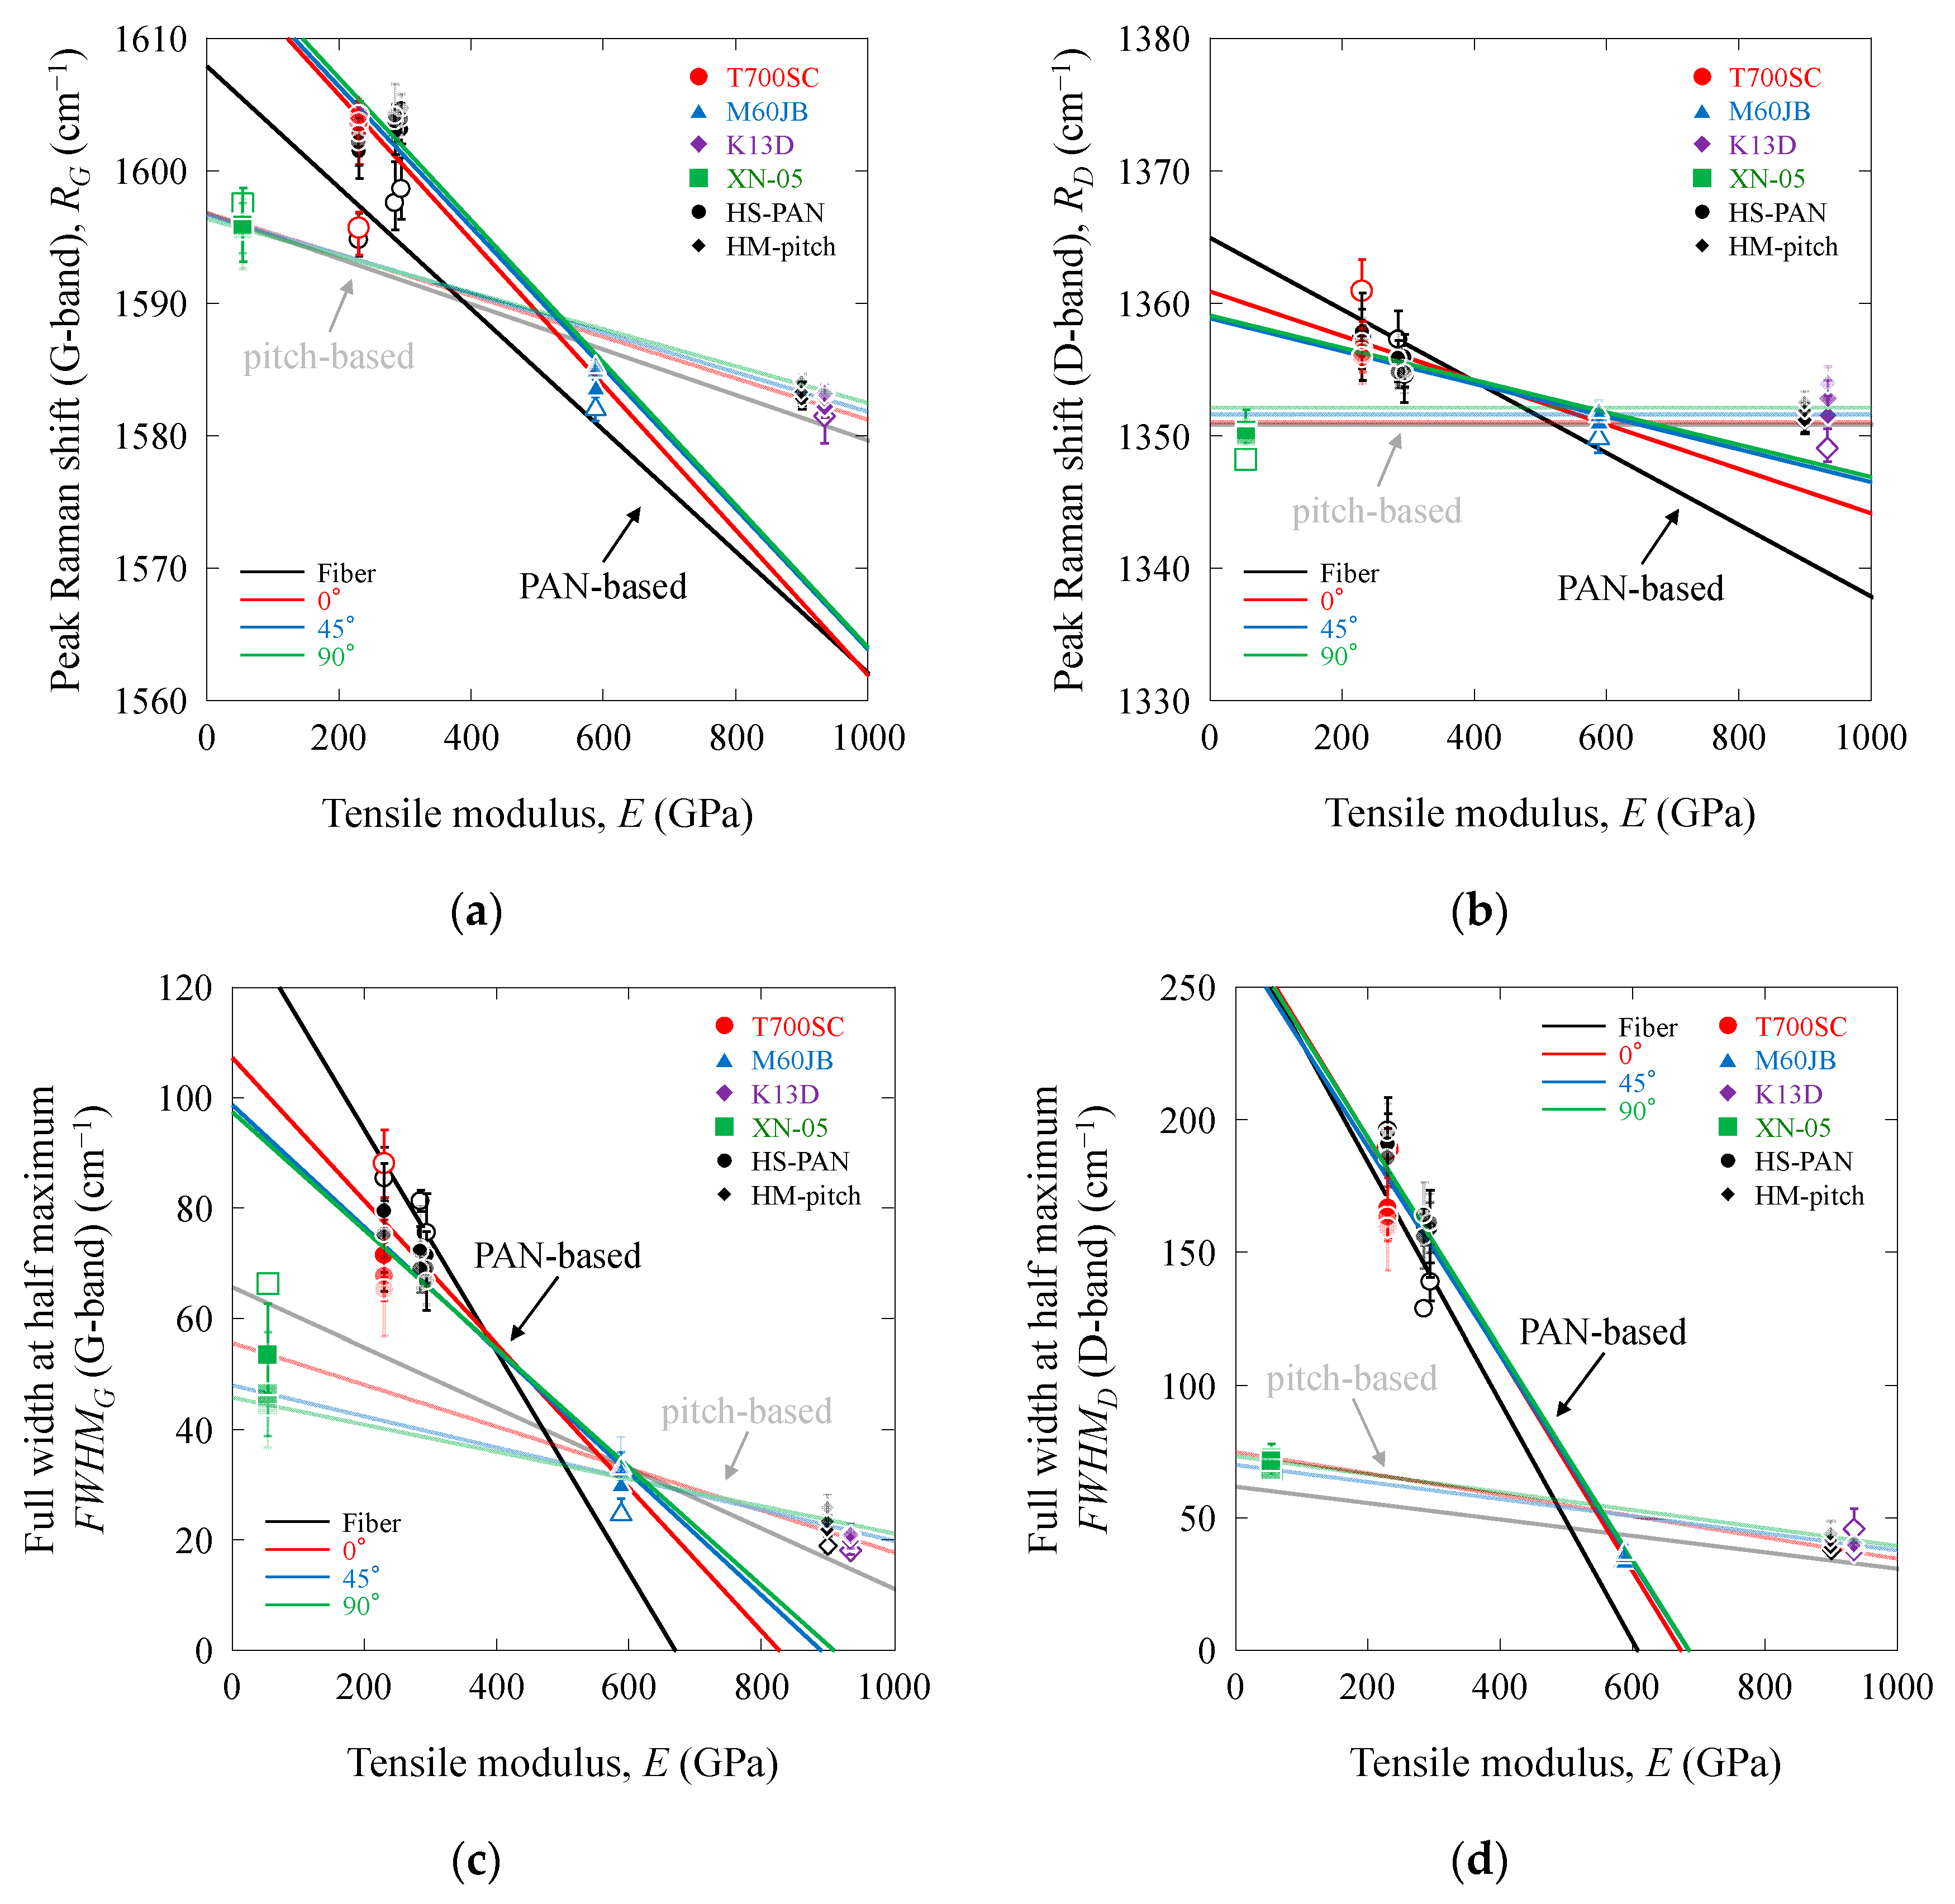
A discernible discrepancy was evident in the peak values of the Raman shifts for the G- (RG) and D-bands (RD). The HM-PAN M60JB and HM-pitch K13D carbon fibers and CFRPs exhibited sharp G- and D-band behaviors, characterized by full widths at half maximum of G (FWHMG) and D-bands (FWHMD), whereas HS-PAN T700SC and HD-pitch XN05 carbon fibers and CFRPs exhibited broader behaviors, characterized by larger FWHMG and FWHMD values. The RG, RD, FWHMG, and FWHMD values are summarized in Table 1. The results for the HS-PAN (T300, T800SC, and IMS60) and HM-pitch (K13C) carbon fibers are also summarized in Table 1. In our previous investigation, linear relationships were observed between the RG, RD, FWHMG, and FWHMD values and E. Similar relations were observed in the PAN-based and pitch-based CFRPs with 0°, 45°, and 90° sections, as shown in Figure 3a–d, and the values of RG, RD, FWHMG, and FWHMD in the CFRPs with 0°, 45°, and 90° sections were also related to the structural parameters from our previous investigation [19].
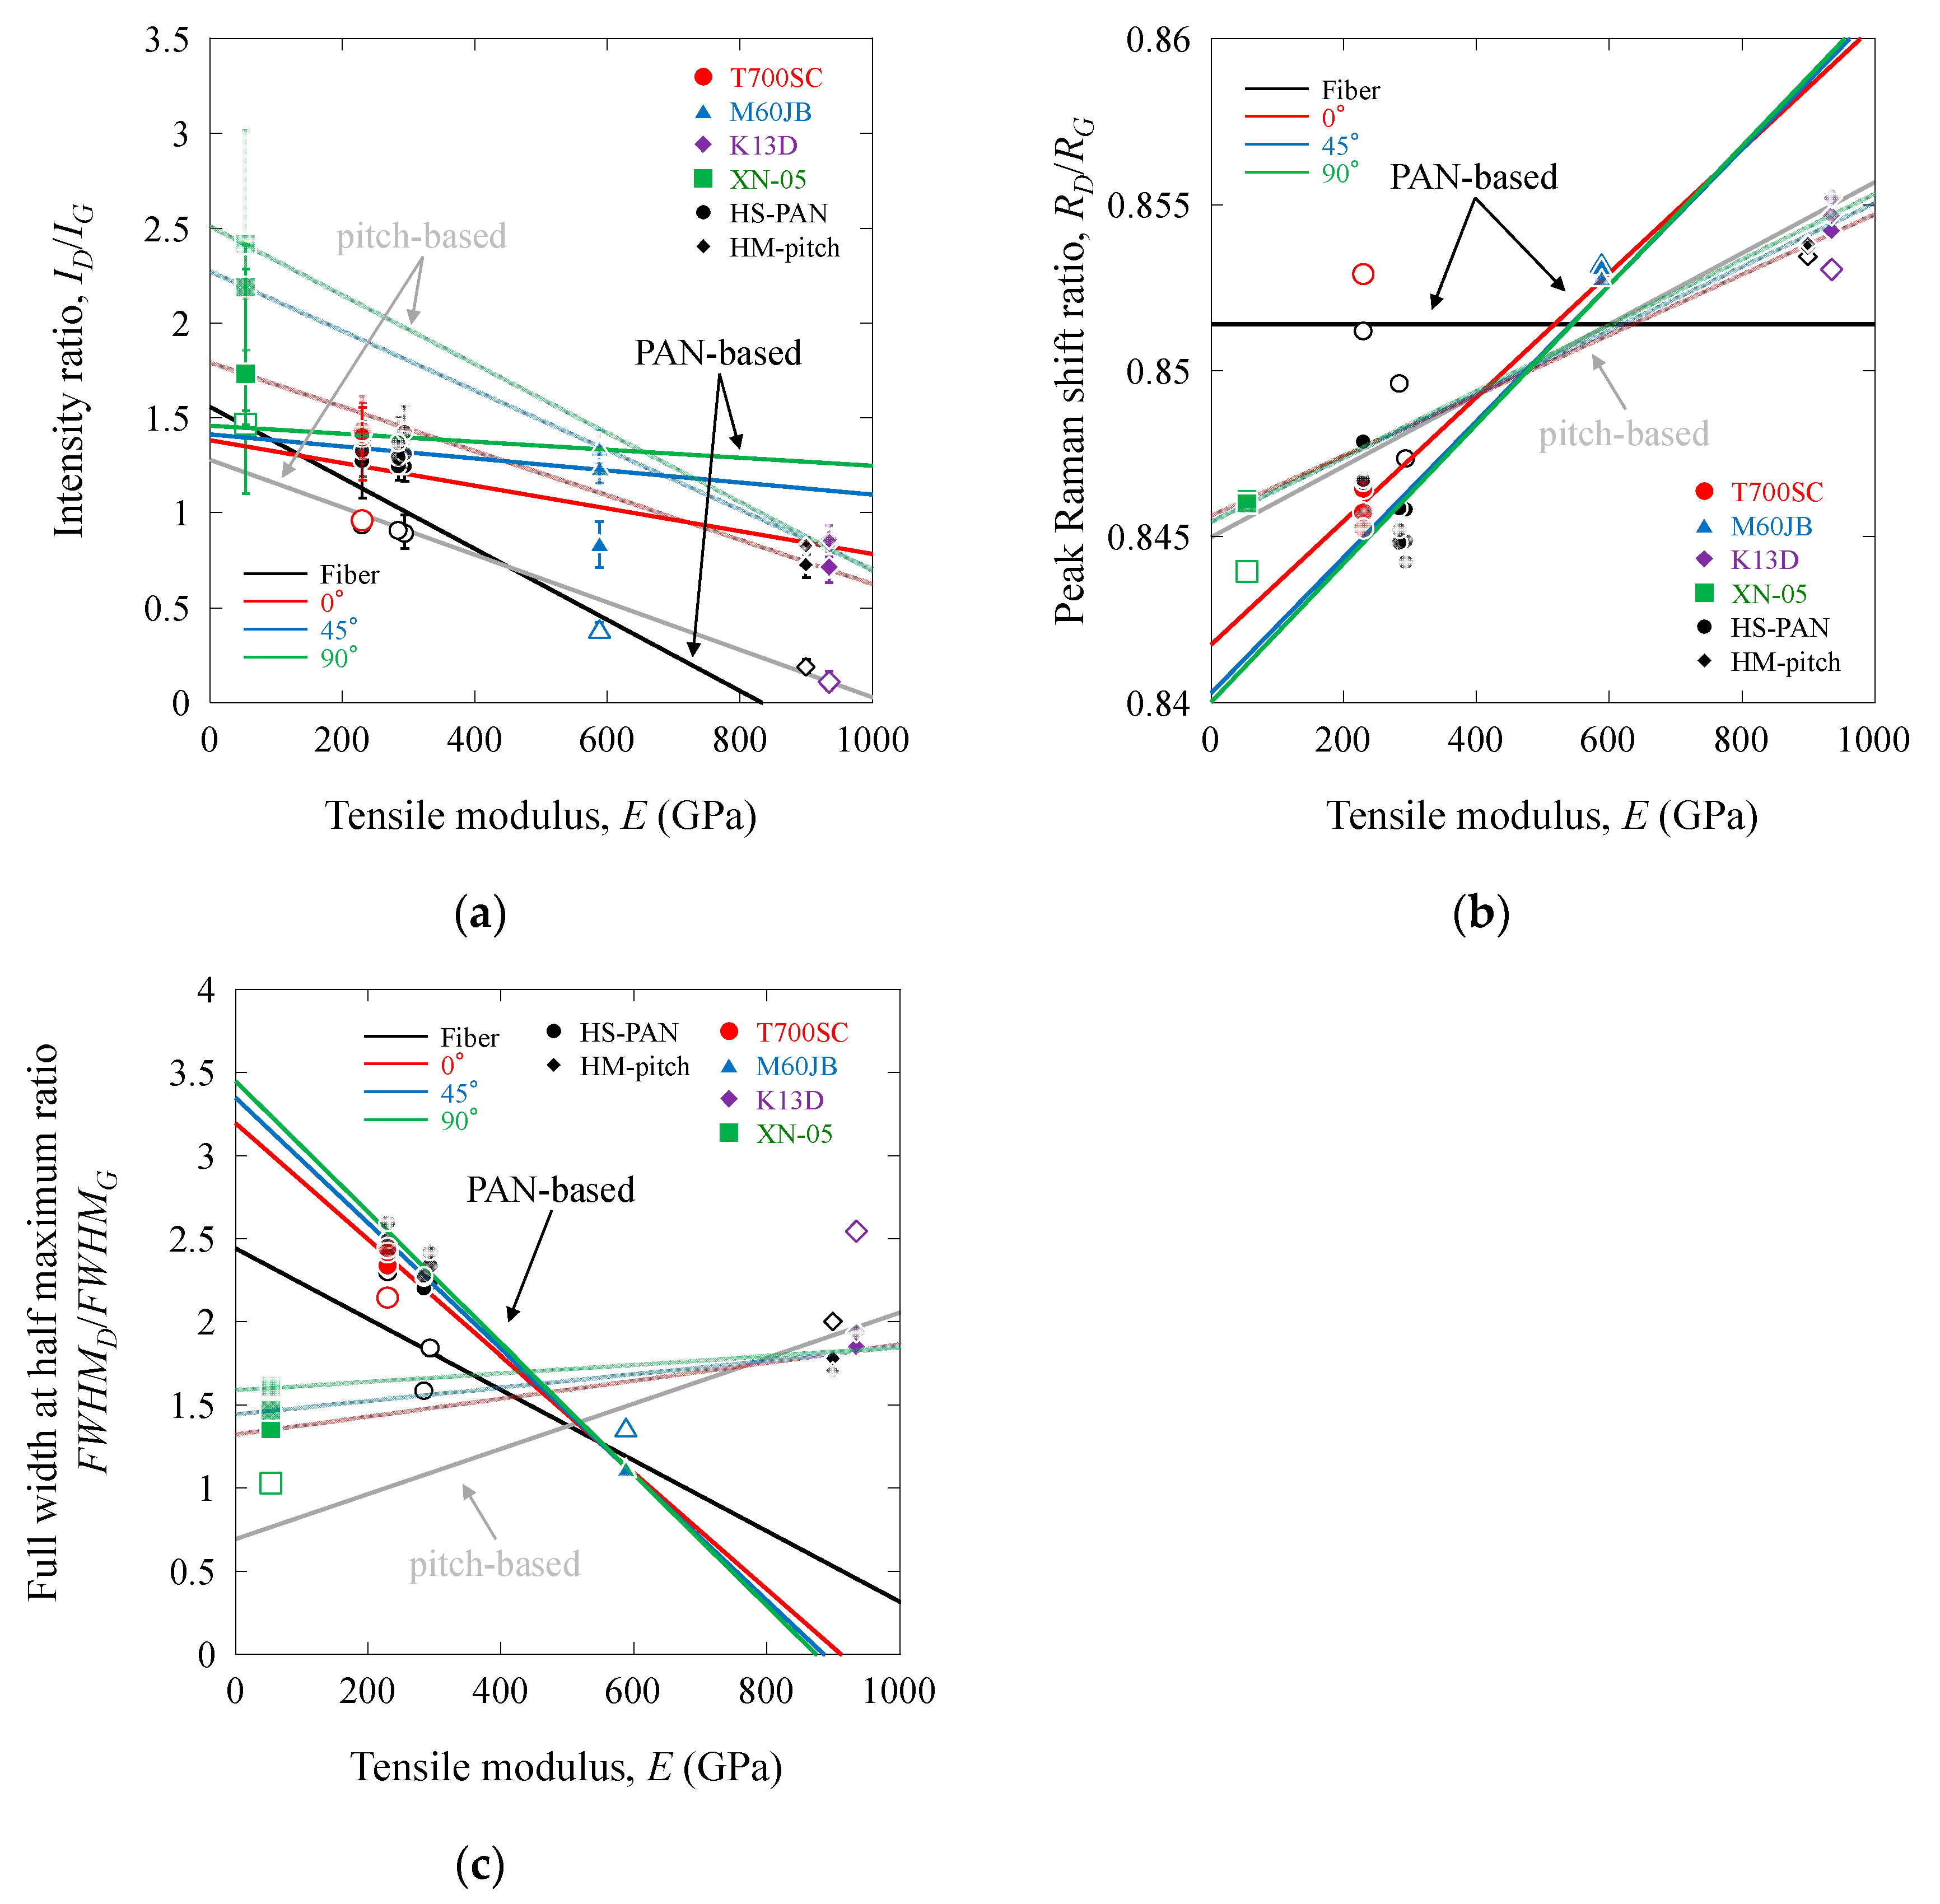
The Raman intensity ratio of the G- and D-bands, ID/IG, is a useful parameter for characterizing carbon fibers [21,22,23,24]. Similarly, the peak Raman shift ratio of the G- and D-bands, RD/RG, and the full width at half maximum ratio for the G- and D-bands, FWHMD/FWHMG, are effective parameters, as indicated in our previous investigation. The values of ID/IG, RD/RG, and FWHMD/FWHMG are summarized in Table 1. The error values were found to be affected not only by the material itself but also by the angle. Similar results were observed in [15]. Furthermore, the error values were affected by the fitting process. Similar results were found in [19]. However, in this study, the coefficients of variation (standard deviations/means) of RD/RG and FWHMD/FWHMG for all samples were less than 0.15% and around 5%, respectively, indicating that the error was quite small. The coefficients of variation (standard deviations/means) of ID/IG were around 10% at most for all samples, indicating that the error was considered small. Figure 4a–c shows the Raman scattering ratios (ID/IG, RD/RG, and FWHMD/FWHMG values) as functions of the tensile modulus, E. The ID/IG values for PAN-based and pitch-based carbon fibers demonstrated a decrease with increasing E. In contrast, the RD/RG and FWHMD/FWHMG values for pitch-based carbon fibers exhibited an increase with increasing E, while those for PAN-based carbon fibers increased (RD/RG) or decreased (FWHMD/FWHMG) with increasing E. Linear relationships were observed between the ID/IG, RD/RG, and FWHMD/FWHMG values and E. Furthermore, the linear trends for the PAN-based and pitch-based carbon fibers intersected within the range of 400–700 GPa. Such ratio evaluation techniques have been employed to assess the efficacy of physical properties and anisotropy [10,11,12,13,14,15,19,25,26].

3.2. Raman Scattering Parameter and Ratio Differences Between Carbon Fibers and CFRPs in Axial (0°) Section

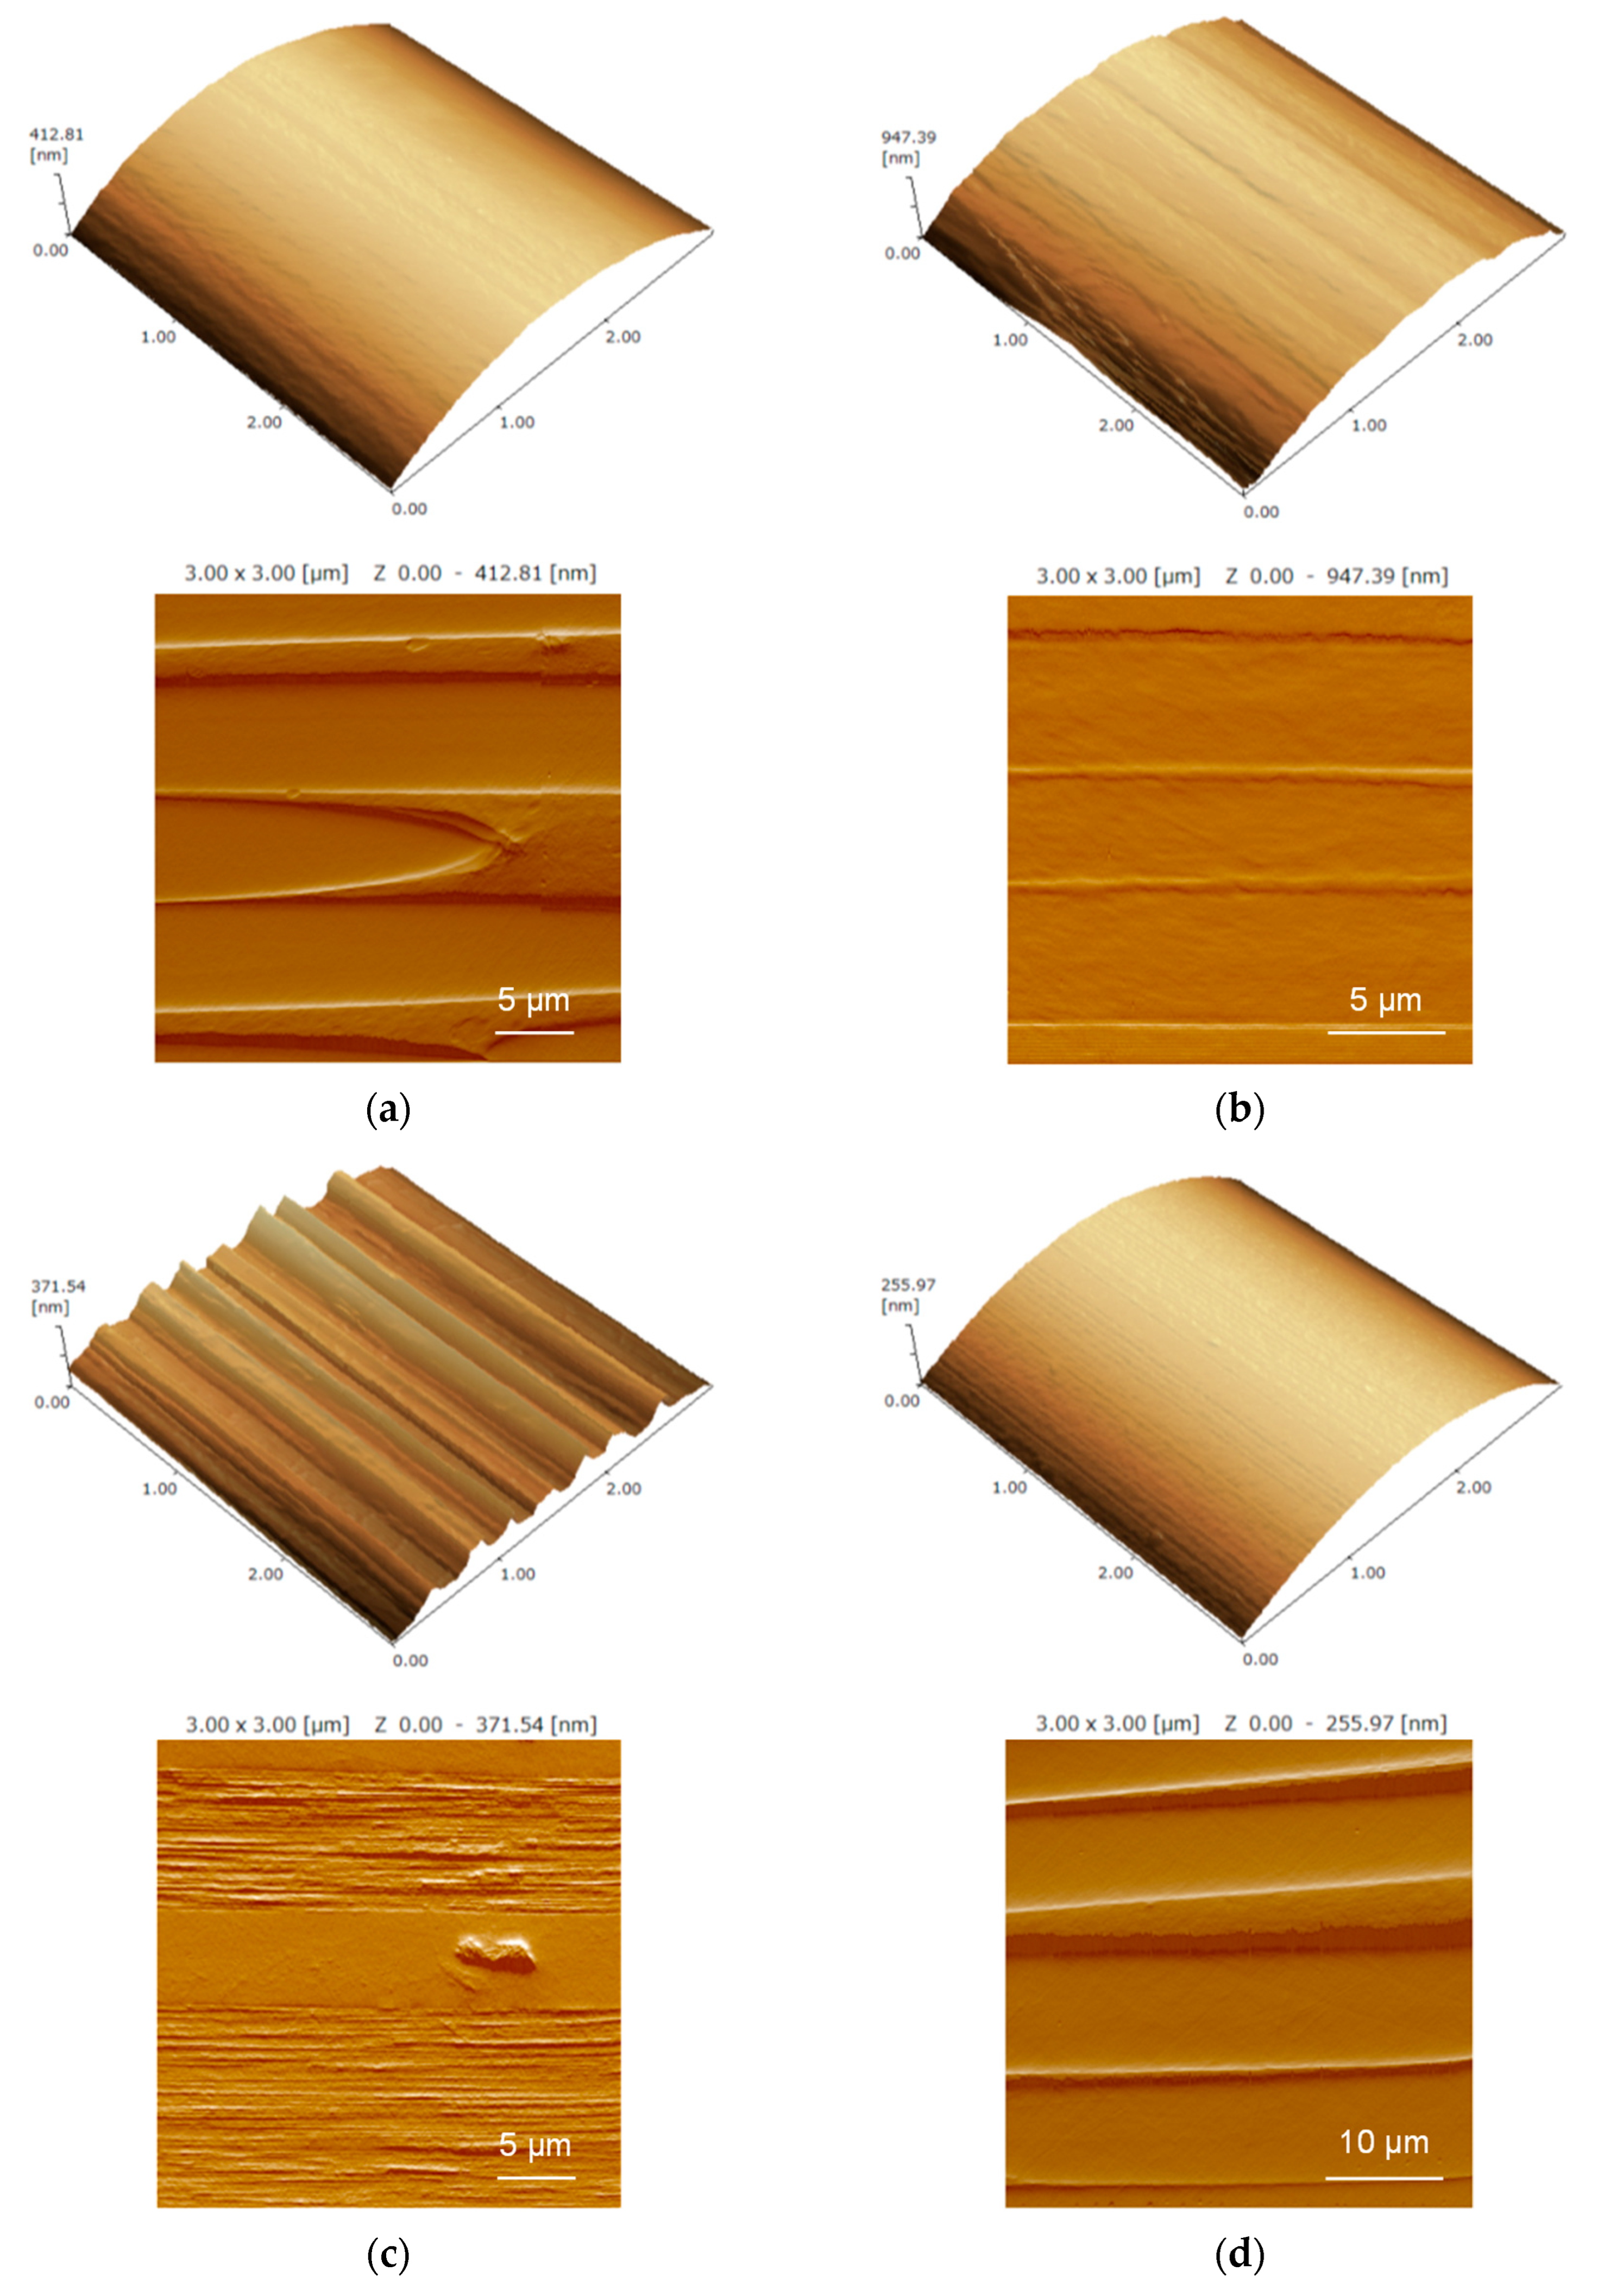
A comparative analysis of the fiber and 0° Raman scattering parameter and ratio can elucidate the axial Raman characteristics, which consider the internal structure. Figure 5a–d shows the scanning probe microscope (SPM) images of the fiber and 0° surfaces. The SPM images of the surface of fibers show that the surface of the HS-PAN (T700SC) and HD-pitch (XN05) fibers are smooth, while the HM-PAN (M60JB) fiber has groove-like features that are parallel to the fiber axis. The HM-pitch (K13D) fiber exhibits rough texture, which is mainly because the fiber possesses a sheet-like structure. The HS-PAN (T700SC) and HD-pitch (XN05) CFRPs with a 0° section have comparatively smoother surfaces, while HM-PAN (M60JB) CFRP has a slightly sheet-like or fibrillar structure that is parallel to the fiber axis. The HM-pitch (K13D) CFRP has a sheet-like structure that is parallel to the fiber axis.
Figure 6a,b and Figure 7a–c show the change in the Raman scattering parameters (RG, RD, FWHMG, and FWHMD) and ratios (ID/IG, RD/RG, and FWHMD/FWHMG) of PAN-based and pitch-based carbon fibers and CFRPs with a 0° section.
The changes in RG and RD were less than 1% and were almost the same value. The change in FWHMG exhibited an increase with an increase in E, whereas that in FWHMD demonstrated a decrease. The change in RD/RG was also less than 1% and were almost the same value. The change in ID/IG exhibited a rapid increase with an increase in E, whereas that in FWHMD/FWHMG demonstrated a decrease. The Raman crystalline ordered or disordered structures were more visible in the 0° section sample. In addition, these linear trends for the PAN-based and pitch-based carbon fibers also intersected in the range of 400–700 GPa.

3.3. Raman Scattering for Anisotropy of Carbon Fibers

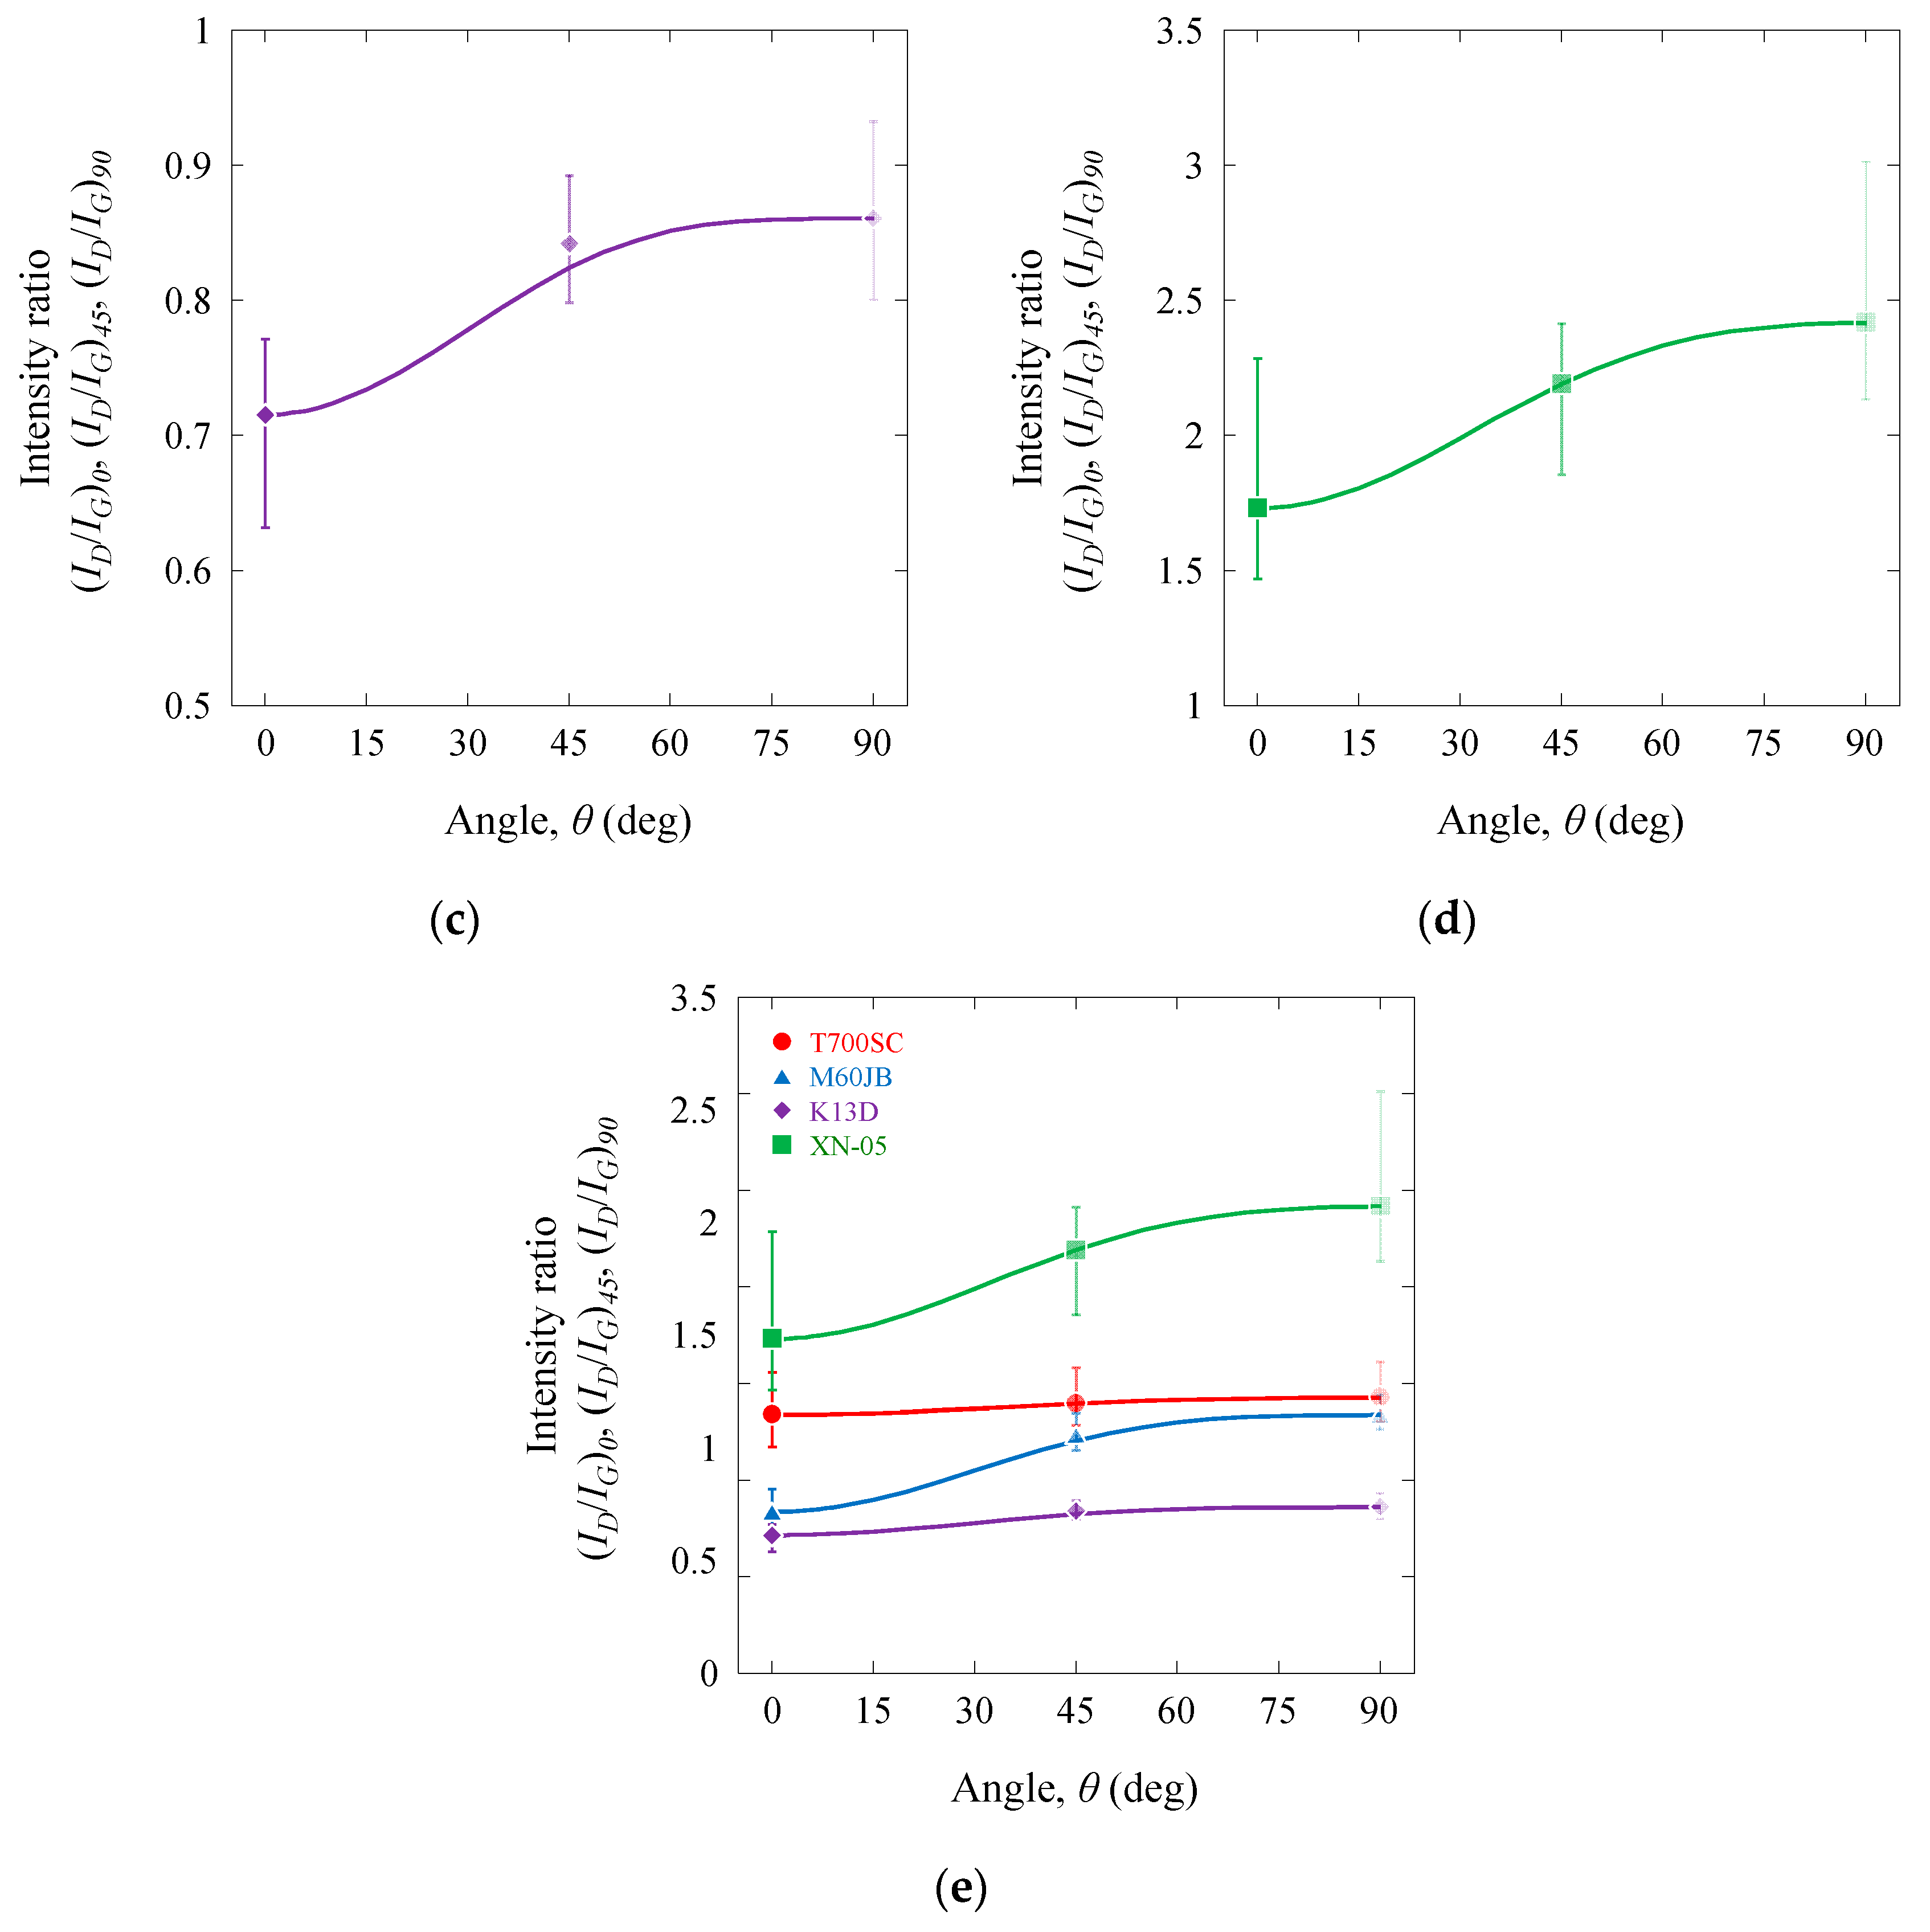
Figure 8a–e shows the intensity ratios ((ID/IG)0, (ID/IG)45, and (ID/IG)90) of PAN-based and pitch-based CFRPs as a function of θ. The error might appear relatively large due to being highlighted. However, in this study, the coefficient of variation in the intensity ratios ((ID/IG)0, (ID/IG)45, and (ID/IG)90) were around 10% at most for all samples, indicating that the error was considered small.
The intensity ratios increased in the order of (ID/IG)0 < (ID/IG)45 < (ID/IG)90 for each carbon fiber, and a linear relationship was found between (ID/IG)0, (ID/IG)45, and (ID/IG)90 and E, as shown in Figure 4a. These intensity ratio values were higher than the (ID/IG)fiber, as also shown in Figure 4a. The T700SC, M60JB, K13D, and XN05 fibers exhibited significant variation coefficients in the 0° direction. Additionally, T300 and K13C fibers also demonstrated the most significant disparities between samples in the 0° direction. The T800SC and IMS60 fibers indicated significant disparities in the 90° direction. Carbon fiber is a material that exhibits high orientation in the longitudinal direction (0° direction) and is sensitive to structural changes. It has been hypothesized that local structural variations were discerned through the application of Raman spectroscopy. In M60JB, K13D, and K13C fibers, which exhibit high orientations and high elastic moduli, the coefficient of variation for individual fibers [19] and in the 0° direction is substantial. Many defects in the carbon fiber are created during the manufacturing process of the precursor material and the subsequent heat treatment. These include fibrillar misalignment, ultra-micro pores, etc. [27,28]. The presence of these defects in the carbon fibers results in higher (ID/IG)0, (ID/IG)45, and (ID/IG)90. Similar results of angle-dependence were observed in the characterizing anisotropy of the elastic properties of carbon fibers, although ID/IG exhibited the opposite trend to the angle [10,11,12,13,14,15].
The intensity ratio, (ID/IG)θ, in an arbitrary angle, θ, was calculated using the following equation (coordinate transformation):
I D I G θ = I D I G 0 cos 4 θ + I D I G 90 sin 4 θ + I D I G A C sin 2 θ cos 2 θ ,
in which θ is the fiber angle from the measurement plane, as shown in Figure 1e. (ID/IG)AC is the intensity ratio in the (axial cross-section) shear direction and is given by.
I D I G A C = 4 I D I G 45 I D I G 0 I D I G 90 ,
The estimated lines obtained from experimental results were also shown in Figure 8a–e. The experimental results were found to agree with the predictions. Raman intensity ratio (ID/IG)θ of PAN-based and pitch-based CFRPs could be estimated from these equations.
The intensity ratios (ID/IG)0 and (ID/IG)90 were calculated using a simple rule of mixtures.
1 I D I G 0 = V O S I D I G O S + 1 V O S I D I G D S ,
I D I G 90 = I D I G O S V O S + I D I G D S 1 V O S ,
in which VOS is the volume fraction of Raman ordered structure. (ID/IG)OS and (ID/IG)DS are the intensity ratios in the Raman ordered and disordered structures. The above correlations were verified by evaluating PAN-based and pitch-based fibers separately. Therefore, (ID/IG)OS and (ID/IG)DS were estimated with PAN-based and pitch-based fibers separately (the structure of XN05 HD-pitch and K13D (also K13C) HM-pitch fibers were quite different; (ID/IG)OS and (ID/IG)DS were estimated with HD-pitch and HM-pitch fibers separately). The estimated (ID/IG)OS and (ID/IG)DS of the PAN-based fiber were 0.119 and 1.419, respectively. (ID/IG)OS and (ID/IG)DS of the HM-pitch fiber were 0.063 and 0.856, and (ID/IG)OS and (ID/IG)DS of the HD-pitch fiber were 1.076 and 3.547. (ID/IG)OS of the HM-pitch fiber was the lowest among other fibers, and (ID/IG)DS of the HD-pitch was the highest among other fibers. The VOS of the fibers are shown in Table 1. The VOS of the HS-PAN and HM-PAN fibers were ≈1% and 6%, respectively. The VOS of the HM-pitch and HD-pitch fibers were ≈1% and 46%. These values strongly depended on the precursor materials of fiber and Raman disordered structure. The Raman intensity ratio (ID/IG)θ of PAN-based and pitch-based CFRPs was also calculated from Equations (1) and (2). The estimated lines were almost same as the above lines obtained from experimental results.
In addition, the intensity ratio (ID/IG)fiber was calculated using the rule of mixtures.
1 I D I G f i b e r = V O S f i b e r I D I G O S + 1 V O S f i b e r I D I G D S
in which VOS(fiber) is the volume fraction of Raman ordered structure in fibers. The VOS(fiber) of fibers were also shown in Table 1. The VOS(fiber) of HS-PAN and HM-PAN fibers were ≈5% and 24%, respectively. The VOS(fiber) of HM-pitch and HD-pitch fibers were 56% and 62%, respectively. The analytical results were found to agree with the experimental results. The Raman anisotropic nature of PAN-based and pitch-based fibers and CFRPs was identified experimentally and analytically.
The anisotropic nature of carbon fibers, arising from their highly oriented graphitic microstructure, plays a critical role in determining mechanical and thermal properties. Understanding and quantifying this anisotropy is essential for optimizing composite performance and design, particularly in load-bearing and directional applications [3]. Raman spectroscopy, among other techniques, has proven effective in evaluating orientation-dependent structural features, which directly influence mechanical behavior. The insights gained from this study can be extended to other fiber precursors such as cellulose, lignin, and polyethylene-based fibers, which are being explored for low-cost and sustainable alternatives to PAN- and pitch-based carbon fibers [5]. Furthermore, the anisotropy analysis framework developed here may be applied to hybrid composites, enabling broader material optimization across diverse engineering applications.

4. Conclusions

Raman scattering for anisotropy was conducted on commercially available high-strength PAN-based, high-modulus PAN-based, high-modulus pitch-based, and high-ductility pitch-based carbon fiber-reinforced plastic (CFRP) samples. The results are briefly summarized as follows:
  • The Raman scattering parameters and ratios in the CFRPs are related to the tensile modulus. These linear trends for the PAN-based and pitch-based CFRPs intersect in the range of 400–700 GPa.
  • The change in Raman scattering parameters and ratios of PAN-based and pitch-based CFRPs are related to the tensile modulus. These linear trends also intersect in the range of 400–700 GPa.
  • The intensity ratio in an arbitrary angle could be estimated using the rule of mixtures and coordinate transformation equations.

Author Contributions

K.N.: Conceptualization, Methodology, Software, Validation, Formal analysis, Investigation, Resources, Data curation, Writing—original draft, Writing—review and editing, Visualization, Supervision. C.N.: Software, Validation, Formal analysis, Investigation, Data curation, Writing—review and editing, Visualization. All authors have read and agreed to the published version of the manuscript.

Funding

This paper is based on results obtained from a future pioneering project commissioned by the New Energy and Industrial Technology Development Organization (NEDO) and innovative science and technology initiative for security projects (JPJ004596) commissioned by the Acquisition, Technology & Logistics Agency (ATLA).

Data Availability Statement

The datasets supporting the conclusions of this article are included within the article.

Conflicts of Interest

The authors declare no potential conflicts of interest with respect to the research, authorship, and/or publication of this article.

References

  1. Chand, S. Review-Carbon fibers for composites. J. Mater. Sci. 2000, 35, 1303–1313. [Google Scholar] [CrossRef]
  2. Hamzat, A.K.; Murad, M.S.; Adediran, I.A.; Asmatulu, E. Fiber-reinforced composites for aerospace, energy, and marine applications: An insight into failure mechanisms under chemical, thermal, oxidative, and mechanical load conditions. Adv. Compos. Hybrid Mater. 2025, 8, 152. [Google Scholar] [CrossRef]
  3. Hannan, A.N.; Seidlitz, H.; Hartung, D.; Kuke, F.; Ambrosio, M.; Müller, M. Sustainability and circular economy in carbon fiber-reinforced plastics. Mater. Circ. Econ. 2024, 6, 26. [Google Scholar] [CrossRef]
  4. Seo, J.; Kim, D.C.; Park, H.; Kang, Y.S.; Park, H.W. Advancements and challenges in the carbon fiber-reinforced polymer (CFRP) trimming process. Int. J. Precis. Eng. Manuf. Green Technol. 2024, 11, 1341–1360. [Google Scholar] [CrossRef]
  5. Liu, H.C.; Zhu, S.; Chang, Y.Z.; Hou, W.J.; Han, G.Y. Pitch-based carbon materials: A review of their structural design, preparation and applications in energy storage. New Carbon Mater. 2023, 38, 459–473. [Google Scholar] [CrossRef]
  6. Shioya, M.; Takaku, A. Characterization of crystallites in carbon fibres by wide-angle X-ray diffraction. J. Appl. Crystallogr. 1989, 22, 222–230. [Google Scholar] [CrossRef]
  7. Takaku, A.; Shioya, M. X-ray measurements and the structure of polyacrylonitrile- and pitch-based carbon fibres. J. Mater. Sci. 1990, 25, 4873–4879. [Google Scholar] [CrossRef]
  8. Guigon, M.; Oberlin, A.; Desarmot, G. Microtexture and structure of some high tensile strength, PAN-base carbon fibres. Fibre Sci. Technol. 1984, 20, 55–72. [Google Scholar] [CrossRef]
  9. Guigon, M.; Oberlin, A.; Desarmot, G. Microtexture and structure of some high-modulus, PAN-base carbon fibres. Fibre Sci. Technol. 1984, 20, 177–198. [Google Scholar] [CrossRef]
  10. Csanádi, T.; Németh, D.; Zhang, C.; Dusza, J. Nanoindentation derived elastic constants of carbon fibres and their nanostructural based predictions. Carbon 2017, 119, 314–325. [Google Scholar] [CrossRef]
  11. Duan, S.; Liu, F.; Pettersson, T.; Creighton, C.; Asp, L.E. Determination of transverse and shear moduli of single carbon fibres. Carbon 2020, 158, 772–782. [Google Scholar] [CrossRef]
  12. Tane, M.; Okuda, H.; Tanaka, F. Nanocomposite microstructures dominating anisotropic elastic modulus in carbon fibers. Acta Mater. 2019, 166, 75–84. [Google Scholar] [CrossRef]
  13. Fujita, K.; Sawada, Y.; Nakanishi, Y. Effect of cross-sectional textures on transverse compressive properties of pitch-based carbon fibers. J. Soc. Mater. Sci. Jpn. 2001, 7, 116–121. [Google Scholar] [CrossRef] [PubMed]
  14. Naito, K.; Tanaka, Y.; Yang, J.M. Transverse compressive properties of polyacrylonitrile (PAN)-based and pitch-based single carbon fibers. Carbon 2017, 118, 168–183. [Google Scholar] [CrossRef]
  15. Shirasu, K.; Goto, K.; Naito, K. Microstructure-elastic property relationships in carbon fibers: A nanoindentation study. Compos. Part B Eng. 2020, 200, 108342. [Google Scholar] [CrossRef]
  16. Roy, D.; Kanojia, S.; Mukhopadhyay, K.; Eswara Prasad, N. Analysis of carbon-based nanomaterials using Raman spectroscopy: Principles and case studies. Bull. Mater. Sci. 2021, 44, 31. [Google Scholar] [CrossRef]
  17. Ferrari, A.C.; Robertson, J. Interpretation of Raman spectra of disordered and amorphous carbon. Phys. Rev. B 2000, 61, 14095. [Google Scholar] [CrossRef]
  18. Brubaker, Z.E.; Langford, J.J.; Kapsimalis, R.J.; Niedziela, J.L. Quantitative analysis of Raman spectral parameters for carbon fibers: Practical considerations and connection to mechanical properties. J. Mater. Sci. 2021, 56, 15087–15121. [Google Scholar] [CrossRef]
  19. Naito, K.; Nagai, C. Raman scattering for tensile testing of polyacrylonitrile-based and pitch-based single carbon fibers. Fibers 2024, 12, 88. [Google Scholar] [CrossRef]
  20. Qian, X.; Wang, X.; Zhong, J.; Zhi, J.; Heng, F.; Zhang, Y.; Son, S. Effect of fiber microstructure studied by Raman spectros-copy upon the mechanical properties of carbon fibers. J. Raman Spectrosc. 2019, 50, 665–673. [Google Scholar] [CrossRef]
  21. Okuda, H.; Young, R.J.; Wolverson, D.; Tanaka, F.; Yamamoto, G.; Okabe, T. Investigating nanostructures in carbon fibres using Raman spectroscopy. Carbon 2018, 130, 178–184. [Google Scholar] [CrossRef]
  22. Melanitis, N.; Tetlow, P.L.; Galiotis, C. Characterization of PAN-based carbon fibres with laser Raman spectroscopy. J. Mater. Sci. 1996, 31, 851–860. [Google Scholar] [CrossRef]
  23. Frank, O.; Tsoukleri, G.; Riaz, I.; Papagelis, K.; Parthenios, J.; Ferrari, A.C.; Geim, A.K.; Novoselov, K.S.; Galiotis, C. Devel-opment of a universal stress sensor for graphene and carbon fibres. Nat. Commun. 2011, 2, 255. [Google Scholar] [CrossRef]
  24. Wang, Y.; Alsmeyer, D.C.; McCreery, R.I. Raman spectroscopy of carbon materials: Structural basis of observed spectra. Chem. Mater. 1990, 2, 557–563. [Google Scholar] [CrossRef]
  25. Goto, K.; Naito, K.; Shirasu, K.; Watanabe, I. Numerical calculation and finite element analysis for anisotropic elastic properties of carbon fibers: Dependence of integration subinterval and mesh size on indentation-derived elastic modulus. SN Appl. Sci. 2022, 4, 291. [Google Scholar] [CrossRef]
  26. Jang, D.; Yoon, H.N.; Seo, J.; Cho, H.J.; Kim, G.M.; Kim, Y.K.; Yang, B. Improved electromagnetic interference shielding performances of carbon nanotube and carbonyl iron powder (CNT@CIP)-embedded polymeric composites. J. Mater. Res. Technol. 2022, 18, 1256–1266. [Google Scholar] [CrossRef]
  27. Johnson, W. The structure of PAN based carbon fibres and relationship to physical properties. In Strong Fibers; Watt, W., Perov, B.V., Eds.; Elsevier: Amsterdam, The Netherlands, 1985; Volume 1, pp. 389–443. [Google Scholar]
  28. Paris, O.; Loidl, D.; Peterlik, H. Texture of PAN- and pitch-based carbon fibers. Carbon 2002, 40, 551–555. [Google Scholar] [CrossRef]
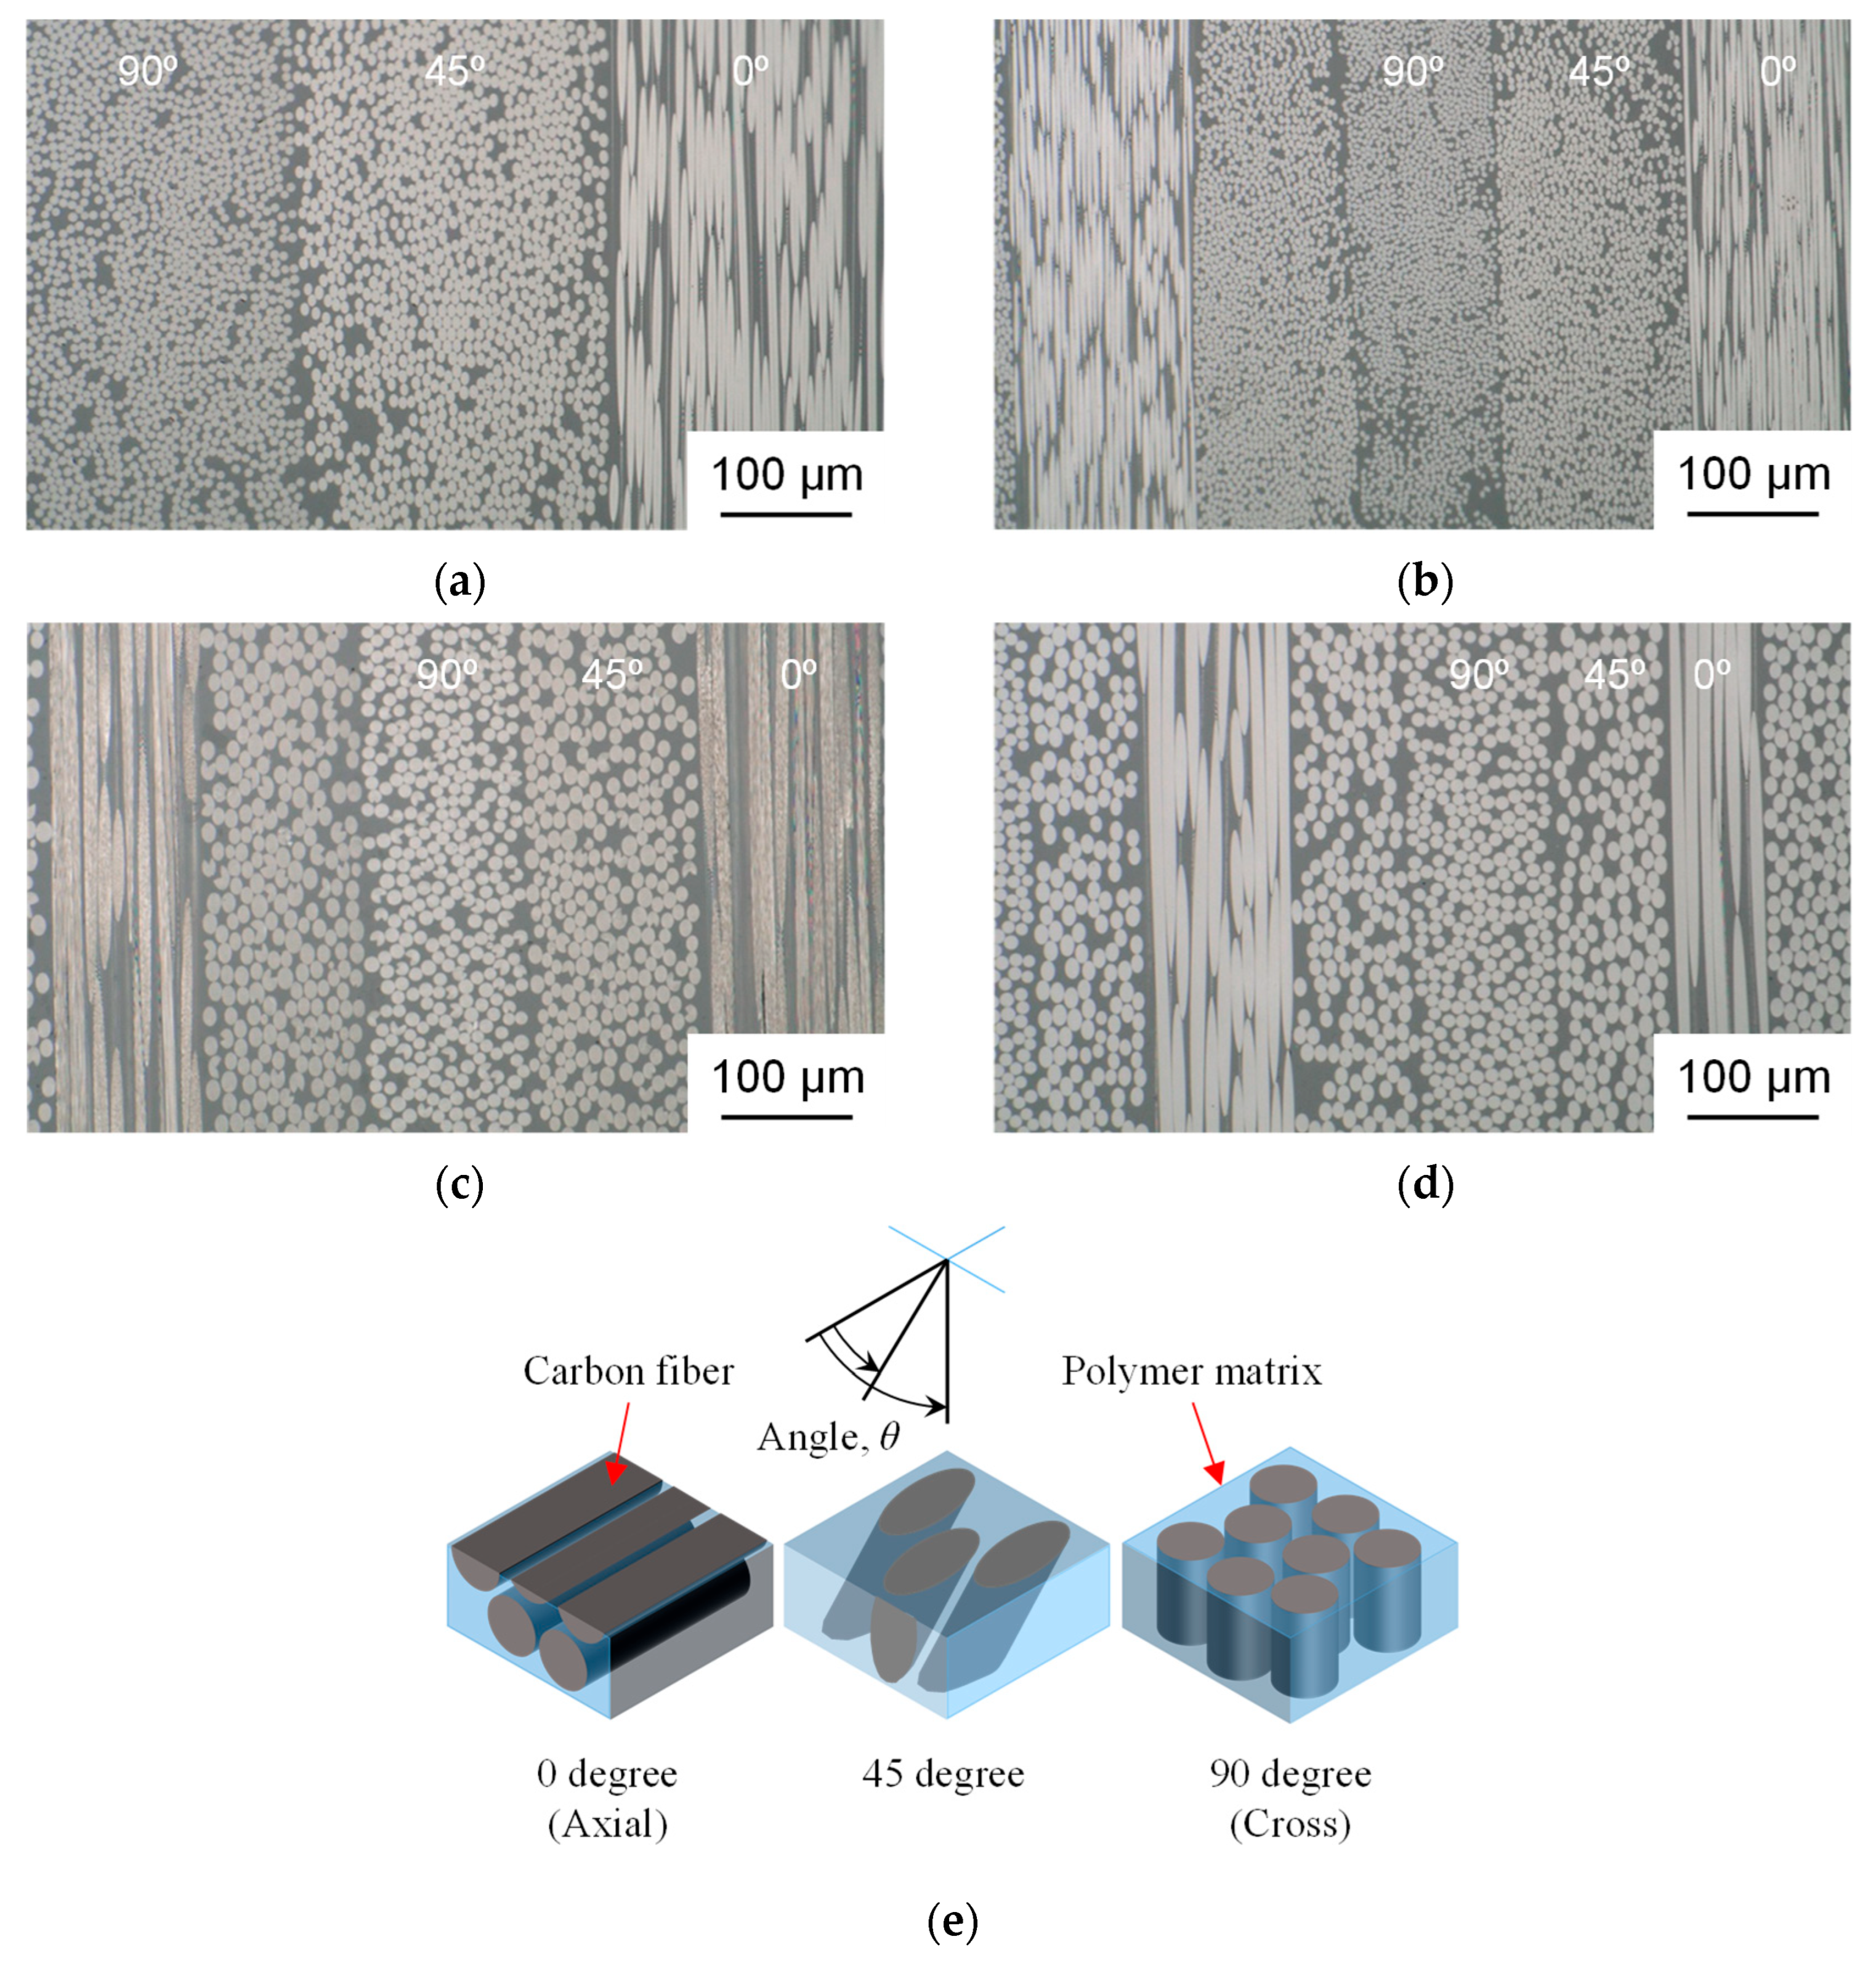
Figure 1. Anisotropy Raman spectra measurement samples: (a) T700SC; (b) M60JB; (c) K13D; (d) XN05; and (e) schematic view.
Fibers 13 00114 g001
Figure 2. Raman spectra of PAN-based and pitch-based carbon fibers [19] and CFRPs with 0°, 45°, and 90° sections. Black lines show single fiber data from previous investigation [19]: (a) T700SC; (b) M60JB; (c) K13D; and (d) XN05.
Fibers 13 00114 g002
Figure 3. Raman scattering parameters as a function of the tensile modulus of PAN-based and pitch-based carbon fibers [19] and CFRPs with 0°, 45°, and 90° sections. Black and gray lines and open symbols show single fiber data from previous investigation [19]: (a) RG vs. E; (b) RD vs. E; (c) FWHMG vs. E; and (d) FWHMD vs. E.
Fibers 13 00114 g003
Figure 4. Raman scattering ratio as a function of tensile modulus of PAN-based and pitch-based carbon fibers [19] and CFRPs with 0°, 45°, and 90° sections. Black and gray lines and open symbols show single fiber data from previous investigation [19]: (a) ID/IG vs. E; (b) RD/RG vs. E; and (c) FWHMD/FWHMG vs. E.
Fibers 13 00114 g004
Figure 5. Scanning probe microscope images of PAN-based and pitch-based carbon fibers and CFRPs with longitudinal section: (a) T700SC; (b) M60JB; (c) K13D; and (d) XN05.
Fibers 13 00114 g005
Figure 6. Change in Raman scattering parameters as a function of tensile modulus of PAN-based and pitch-based carbon fibers and CFRPs with 0°, 45°, and 90° sections: (a) RG, RD vs. E; and (b) FWHMG, FWHMD vs. E.
Fibers 13 00114 g006
Figure 7. Change in Raman scattering ratio as a function of tensile modulus of PAN-based and pitch-based carbon fibers and CFRPs with a 0° section: (a) ID/IG vs. E; (b) RD/RG vs. E; and (c) FWHMD/FWHMG vs. E.
Fibers 13 00114 g007
Figure 8. The intensity ratios ((ID/IG)0, (ID/IG)45, and (ID/IG)90) of PAN-based and pitch-based CFRPs: (a) T700SC; (b) M60JB; (c) K13D; (d) XN05; and (e) summary display.
Fibers 13 00114 g008aFibers 13 00114 g008b
Table 1. Physical and Raman properties of the PAN-based and pitch-based CFRPs.
HS-PANHM-PANHM-PitchHD-PitchHS-PANHM-Pitch
T700SCM60JBK13DXN05T300T800SCIMS60K13C
Curing conditions180 °C 4 h120 °C 4 h
135 °C 2 h
180 °C 4 h180 °C 4 h180 °C 4 h180 °C 4 h180 °C 4 h120 °C 4 h
135 °C 2 h
Layer sequence[0/+45/
90/−45]14
[0/+45/
90/−45]26
[0/+45/
90/−45]26
[0/+45/
90/−45]34
[0/+45/
90/−45]20
[0/+45/
90/−45]s
[0/+45/
90/−45]24
[0/+45/
90/−45]28
Fiber volume fraction, Vf0.5390.5740.5450.5650.4920.5230.5670.542
Tensile modulus of
fiber, Ef (GPa) *1
23058893554230294285900
Peak Raman shift (G-band)
RG (cm−1)
Fiber *2

45°
90°
1595.7 (0.9)
1602.7 (0.9)
1603.6 (0.7)
1604.2 (0.9)
1582.2 (0.6)
1583.7 (0.3)
1585.0 (0.3)
1585.4 (0.3)
1581.5 (0.5)
1582.2 (0.3)
1582.9 (0.3)
1583.2 (0.4)
1597.5 (0.2)
1596.0 (1.5)
1595.9 (1.2)
1595.6 (1.3)
1594.8 (0.9)
1601.5 (1.2)
1602.2 (1.0)
1602.8 (0.8)
1598.6 (1.6)
1603.1 (0.6)
1603.9 (0.5)
1604.7 (0.7)
1597.6 (1.6)
1603.0 (0.7)
1603.7 (0.6)
1604.2 (0.9)
1583.2 (0.4)
1582.8 (0.3)
1583.3 (0.3)
1584.1 (0.3)
Peak Raman shift (D-band)
RD (cm−1)
Fiber *2

45°
90°
1360.9 (1.3)
1356.6 (0.8)
1356.2 (0.9)
1355.9 (0.9)
1350.0 (0.8)
1351.1 (0.2)
1351.7 (0.3)
1352.0 (0.3)
1349.1 (0.8)
1351.5 (0.5)
1352.8 (0.5)
1354.0 (0.7)
1348.2 (0.3)
1350.4 (1.0)
1350.1 (0.4)
1349.9 (0.6)
1357.5 (1.4)
1357.8 (1.4)
1356.4 (1.2)
1357.1 (1.0)
1354.6 (1.1)
1355.9 (1.0)
1355.1 (0.6)
1354.7 (0.6)
1357.3 (1.6)
1355.9 (0.7)
1354.8 (0.7)
1355.8 (1.0)
1351.2 (0.5)
1351.2 (0.4)
1351.9 (0.4)
1352.5 (0.4)
G-band full width at half maximum FWHMG (cm−1)Fiber *2

45°
90°
88.1 (3.4)
71.5 (2.4)
67.7 (2.4)
65.3 (3.1)
25.2 (0.5)
30.2 (0.5)
32.7 (0.8)
33.5 (1.1)
18.0 (0.6)
19.8 (0.9)
21.1 (0.9)
20.8 (1.0)
66.4 (0.5)
53.6 (4.3)
46.5 (4.4)
44.4 (4.6)
85.3 (3.8)
79.4 (4.4)
74.7 (3.1)
75.3 (2.6)
75.5 (4.0)
71.4 (3.2)
69.0 (1.4)
66.7 (2.3)
81.3 (1.2)
72.6 (1.6)
69.0 (1.7)
72.1 (4.1)
19.0 (0.8)
21.9 (0.5)
23.3 (0.5)
25.8 (1.3)
D-band full width at half maximum FWHMD (cm−1)Fiber *2

45°
90°
188.7 (3.8)
166.8 (5.7)
163.2 (6.0)
159.2 (7.7)
34.4 (0.6)
34.0 (0.5)
36.4 (0.8)
37.4 (1.0)
45.9 (4.2)
36.8 (1.1)
39.0 (1.0)
40.3 (1.1)
68.1 (0.5)
72.5 (2.9)
68.2 (1.0)
71.4 (2.7)
196.0 (4.3)
190.9 (10.6)
185.5 (5.6)
195.0 (7.5)
138.9 (4.8)
158.9 (7.1)
161.2 (4.3)
161.1 (4.0)
128.8 (1.3)
159.5 (3.8)
155.9 (5.2)
164.0 (6.4)
37.9 (1.0)
38.9 (0.8)
41.5 (0.8)
44.1 (1.4)
Peak Raman shift ratio
RD/RG
Fiber *2

45°
90°
0.853
0.846
0.846
0.845
0.853
0.853
0.853
0.853
0.853
0.854
0.855
0.855
0.844
0.846
0.846
0.846
0.851
0.848
0.847
0.847
0.847
0.846
0.845
0.844
0.850
0.846
0.845
0.845
0.853
0.854
0.854
0.854
Full width at
half maximum ratio
FWHMD/FWHMG
Fiber *2

45°
90°
2.142
2.333
2.411
2.439
1.367
1.127
1.113
1.116
2.545
1.859
1.849
1.936
1.027
1.354
1.466
1.610
2.297
2.403
2.485
2.590
1.838
2.224
2.335
2.414
1.585
2.197
2.259
2.274
1.999
1.777
1.781
1.707
Intensity
ratio
ID/IG
Fiber *2

45°
90°
0.959 (0.032)
1.339 (0.108)
1.394 (0.077)
1.427 (0.076)
0.390 (0.018)
0.836 (0.056)
1.235 (0.037)
1.338 (0.040)
0.106 (0.029)
0.715 (0.043)
0.842 (0.024)
0.861 (0.037)
1.467 (0.109)
1.731 (0.242)
2.191 (0.146)
2.418 (0.233)
0.934 (0.023)
1.272 (0.100)
1.325 (0.078)
1.405 (0.049)
0.888 (0.046)
1.244 (0.055)
1.311 (0.042)
1.422 (0.071)
0.905 (0.016)
1.246 (0.033)
1.292 (0.051)
1.367 (0.081)
0.187 (0.016)
0.728 (0.034)
0.820 (0.015)
0.829 (0.014)
Volume fractionVOS (%)
VOS(fiber) (%)
0.537
4.37
6.36
24.1
1.55
55.8
45.7
61.7
1.05
4.74
1.27
5.45
1.29
5.19
1.40
28.3
*1 Producer’s data sheet T700SC, M60JB, T300, and T800SC: catalog for TORAYCA, Toray Industries, Inc. (Toray), high performance carbon fiber Torayca in Japanese. 2004. K13D and K13C: catalog for Carbon Fiber Tow (Continuous Fiber), Mitsubishi Chemical Corp., DIALEAD. 2022. XN-05: catalog for GRANOC Yarn, Nippon Graphite Fiber Corp. (NGF), technical data XN and XNL. *2 Single fiber data from previous investigation [19]. ( ) indicate standard deviations.
Disclaimer/Publisher’s Note: The statements, opinions and data contained in all publications are solely those of the individual author(s) and contributor(s) and not of MDPI and/or the editor(s). MDPI and/or the editor(s) disclaim responsibility for any injury to people or property resulting from any ideas, methods, instructions or products referred to in the content.