Article

Copper-Decorated Catalytic Carbon/Ceramic Hollow Fibers for NO Reduction: Enhanced Performance via Tangential Flow Reactor Design and Process Intensification

by
George V. Theodorakopoulos
1,*,
Sergios K. Papageorgiou
1,
Fotios K. Katsaros
1,
Konstantinos G. Beltsios
2,* and
George Em. Romanos
1
1
Institute of Nanoscience and Nanotechnology, National Center for Scientific Research “Demokritos”, 15341 Agia Paraskevi, Athens, Greece
2
School of Chemical Engineering, National Technical University of Athens, Zografou Campus, 9 Iroon Polytechniou Street, 15772 Zografou, Athens, Greece
*
Authors to whom correspondence should be addressed.
Fibers 2025, 13(9), 112; https://doi.org/10.3390/fib13090112
Submission received: 23 May 2025 / Revised: 17 August 2025 / Accepted: 20 August 2025 / Published: 22 August 2025

Abstract

In this study, high-yield biopolymer/ceramic hollow fibers were fabricated via a facile, modified polyol process in a spinneret setup, enabling the controlled adsorption of Cu2+ ions. Post sintering transformed these into catalytic copper-decorated carbon/ceramic (alumina) composite hollow fibers, with alginate serving as both a metal ion binder and a copper nanoparticle stabilizer. The resulting hollow fibers featured porous walls with a high surface area and were densely decorated with copper nanoparticles. Their structural and morphological characteristics were analyzed, and their NO reduction performance was assessed in a continuous flow configuration, where the gas stream passed through both the shell and lumen sides of a fiber bundle in a tangential flow mode. This study also examined the stability, longevity and regeneration potential of the catalytic fibers, including the mechanisms of deactivation and reactivation. Carbon content was found to be decisive for catalytic performance. High-carbon fibers exhibited a light-off temperature of 250 °C, maintained about 90% N2 selectivity and sustained a consistently high NO reduction efficiency for over 300 h, even without reducing gases like CO. In contrast, low-carbon fibers displayed a higher light-off temperature of 350 °C and a reduced catalytic efficiency. The results indicate that carbon enhances both activity and selectivity, counterbalancing deactivation effects. Owing to their scalability, durability and effectiveness, these catalytic fibers and their corresponding bundle-type reactor configuration represent a promising technology for advanced NO abatement.

1. Introduction

In this study, copper-decorated carbon/ceramic composite hollow fibers (HFs) were synthesized based on a modified polyol process and integrated into a tubular reactor for the abatement of nitrogen oxide (NOx) pollutants. NOx are among the most significant air pollutants, formed during combustion processes in power plants and vehicle engines due to the reaction between nitrogen and oxygen in the injected air [1,2,3,4,5,6,7,8,9,10]. Various strategies have been employed to mitigate NO emissions, including non-selective catalytic reduction (NSCR) using hydrocarbons or NH3 and selective catalytic reduction (SCR) with hydrocarbons [2,7,8,9,10,11,12,13,14,15,16]. However, direct catalytic decomposition (2NO → N2 + O2) [2,7,17,18,19] is considered the most promising approach, as it eliminates the need for external reductants such as hydrocarbons, ammonia or urea [3]. Despite its advantages, direct NO decomposition remains a challenging research area due to the complexity of catalyst development [20]. Several catalysts have demonstrated activity in this process, including perovskite oxides, Cu-ZSM-5 zeolites [2,8,11,14], metal-doped Co3O4, Ba/MgO, Cu-doped Ba3Y4O9, Ag/La0.6Ce0.4CoO3, Mo2C and Mo2C/Al2O3, Ln2Sn2O7 (Ln = Y, La, Nd, Sm, Gd) and La2-xLn’xSn2O7 (Ln’ = Nd, Sm) stannate pyrochlore oxides and Pd/Al2O3 [2,3,4,5,9,18,19,21,22,23].
Additionally, numerous studies highlight the role of carbon in NO abatement, particularly through metallic nanoparticles supported on nanostructured carbon-based materials. These carbonaceous materials, including activated carbons, carbon fibers, carbon nanotubes (CNTs), have been shown to enhance NO sorption capacity, further contributing to effective NO reduction [24,25]. Activated carbons have been widely utilized as catalysts in after treatment technologies for the abatement of NOx [26,27]. They can function as a NOx reductant, catalyst or catalyst support, either with or without an external reducing agent. The adsorption of NO onto activated carbon is enhanced by surface functional groups [28]. For example, the introduction of epoxy and other oxygen-containing functional groups onto activated carbon has been shown to significantly increase NO adsorption [28,29]. CNTs are known to exhibit a superior resistance to oxidation compared with other carbon-based materials, making them promising supports for hydrocarbon selective catalytic reduction (HC-SCR) catalysts [1,30,31,32]. CNTs offer better oxidation resistance than activated carbon supports, such as those used in Pt/activated carbon catalysts [30], due to their unique electronic and structural properties. In NOx conversion, CNTs can improve oxygen desorption, which is a critical step in preventing catalyst deactivation caused by surface oxygen saturation, while also enhancing N2 selectivity [1]. The oxidation process positively impacts NO reduction efficiency, as the carbon support aids in the desorption of oxygen from metal particles, acting as a reducing agent in the process. Graphene (GR) is a novel carbon nanomaterial with outstanding properties, including a high theoretical surface area, excellent electron mobility and structural flexibility [33]. When combined with TiO2, GR acts as a composite support, enhancing SCR performance through synergistic effects [33]. Additionally, nitrogen-doped carbon xerogels serve as efficient catalysts for NO oxidation at room temperature [34]. Pyridine and pyrrole groups promote NO to NO2 conversion, whereas oxygen complexes on the xerogel surface hinder oxidation, influencing the overall catalytic activity.
In this work, the tubular reactor bearing the synthesized copper-decorated carbon/ceramic composite hollow fibers operated in tangential flow mode, utilizing both the lumen and shell surfaces of each fiber to enhance catalytic performance and maximize space–time–yield. This design introduces a novel approach by enabling continuous flow parallel to the membrane surface, which significantly enhances mass transfer and minimizes fouling and pressure build-up, limitations that commonly hinder conventional fixed-bed reactors. Unlike fixed-bed systems that rely on passive diffusion and are prone to clogging, the tangential flow configuration allows for more efficient substrate delivery and product removal, thereby supporting sustained catalytic activity. Consequently, it surpasses conventional fixed-bed reactors and tubular or disk membranes, which are typically limited to flow-through operation. While flow-through reactors provide intensive and efficient reactant–catalyst contact and a short pore residence time, leading to high selectivity and catalytic activity [35,36], our approach aims to further optimize the process. To intensify catalytic conversion, the developed composite HFs were assembled into bundles within a protective tubular housing. This novel bundle configuration offers significant advantages, including a higher surface area-to-volume ratio, improved heat and/or mass transfer, a reduced pressure drop, and efficient phase contacting. By arranging the fibers in a dense hexagonal arrangement inside the reactor, we effectively utilized both catalytic active surfaces (lumen and shell) for exhaust gas treatment. This innovative design increases the aspect ratio of the catalytic converter, allowing for a more compact structure without sacrificing performance. The resulting bundle achieves an exceptional area-to-volume ratio (500–9000 m2/m3), reducing reactor volume, and significantly lowering manufacturing costs while maintaining a high catalytic efficiency [37,38,39].
Furthermore, the catalytic HFs demonstrate remarkable thermal, chemical and mechanical stability, making them suitable for operation in high-temperature and chemically harsh environments. The bundling of these fibers, along with the precise control over their thickness, enhances mechanical strength and simplifies the reactor assembly, ensuring durability and ease of integration into industrial applications. An additional advantage lies in the porous structure of the HFs, which provides an extended internal surface area for stabilizing catalytic nanoparticles. The presence of pores also allows for flexible reactor configurations. For instance, by restricting the flow of exhaust gases through the annular space between the fibers (shell side), the catalytic converter can be adapted into a membrane reactor. In this configuration, exhaust gases are forced to permeate through the fiber pores, opening novel operational possibilities. This approach enables process intensification by allowing different types of reactions to occur in separate compartments (oxidative reactions on the external surface and reducing reactions on the internal surface) by selectively decorating each side with specific catalysts. Though ceramic HFs are inherently robust in harsh conditions, their long-term stability under real-world operating conditions must be thoroughly evaluated. This study, therefore, subjected the developed HFs to catalytic testing under dynamic thermal conditions, simulating temperature fluctuations. Their endurance was assessed over extended periods, using various gas compositions and flow rates to ensure sustained performance and resilience against thermal shocks.

2. Materials and Methods

2.1. Materials

All reagents were of analytical grade and used after no further purification. Sodium alginate (SA) was provided by Sigma-Aldrich Chemie GmbH (Buchs, Switzerland) and α-aluminum oxide (α-Al2O3) was sourced from Baikowski (Poisy, France). Glutaraldehyde and tetramethylammonium hydroxide (TMAOH) were obtained from Acros Organics (Geel, Belgium), while Cu(NO3)2·3H2O and ethanol were provided by Merck KGaA (Darmstadt, Germany).

2.2. Composite Hollow Fiber Preparation

The full procedure for preparing polymeric precursors of the catalytic carbon/ceramic HFs is described in our previous work [40]. Briefly, asymmetric HFs were produced via a cross-linking, wet phase inversion process in a lab-scale spinning setup, using a 30% (w/v) α-Al2O3 aqueous solution without an air gap. The dope slurry was then formulated by adding TMAOH as a surfactant and SA at a 1:5 ratio relative to alumina, using an SA concentration of 6% (w/v). A coagulation bath, also serving as the bore liquid, was prepared using a mixture of ethanol, glutaraldehyde and 5 N HCl (90.16% v/v, 8% v/v and 1.84% v/v, respectively). The spun HFs were cut into a length of about 1.5 m and kept overnight in a stainless-steel bath containing the same mixture to ensure complete gelation. To obtain HFs decorated with copper nanoparticles, 15 cm long fibers were immersed in a 4% (w/v) copper nitrate solution prepared in an EtOH/GA mixture with an EtOH-to-GA volume ratio of 0.92. They were then dried under ambient air conditions while stretched in a custom-made setup overnight to ensure they remained completely straight.
Two batches of 20 composite carbon/ceramic HFs were ultimately prepared by pyrolyzing the dried fibers. The fibers were arranged in a hexagonal close-packed formation inside a 20 cm long quartz tube with a 10 mm external diameter. Pyrolysis was conducted in the 15 cm isothermal zone of a Carbolite CTF tubular furnace (Carbolite Furnaces, Sheffield, UK) with a Eurotherm controller, under a continuous flow of high-purity gas at 150 mL/min. The first batch (HF800) underwent thermal treatment under a nitrogen atmosphere at 800 °C, while the second batch (HF1300) was treated under argon at 1300 °C. Both processes followed the same heating and cooling rates of 5 °C/min and 2 °C/min, respectively, with a 2 h soaking time.

2.3. Characterization Techniques

The pore structural properties of the produced composite HFs were assessed using liquid nitrogen adsorption–desorption isotherms at 77 K using an automated volumetric system (AUTOSORB-1 Quantachrome Instruments, Boynton Beach, FL, USA). Before measurement, the samples were degassed overnight at 250 °C under high vacuum using a turbomolecular pump. The specific surface area (SBET) was determined using the Brunauer–Emmett–Teller (BET) method. The surface morphology of the HFs was characterized using a Jeol JSM-7401F Field Emission Scanning Electron Microscope (Tokyo, Japan). The system was equipped with gentle beam mode (up to 2.0 kV), allowing for sample observation without the need for sputtering. This technology helps reduce charging effects and enhances resolution, signal-to-noise ratio and beam brightness. Structural characterization of the fresh and spent (post catalytic run) HFs was performed via wide-angle X-ray scattering (WAXS) experiments using the Nano-inXider combined Small and Wide-Angle X-ray Scattering System (Xenocs, Grenoble, France). Thermogravimetric analysis was conducted from room temperature to 800 °C using a Setaram Setsys Evolution 18 Thermogravimetric/Differential Thermal Analyzer (KEP Technologies, Mougins, France). The temperature program included a 30 min dwell at the maximum temperature and an isothermal step at 120 °C for 20 min. The analysis was performed under air flow with a heating rate of 10 °C/min to monitor the carbonization process and assess thermal stability.

2.4. Catalytic Experiments

The performance of the prepared composite HFs for NO reduction was evaluated in the tangential flow mode, with both the feed and effluent streams of the reactor analyzed in sequence using a Hewlett Packard 5890 Series II Gas Chromatograph (HP, Palo Alto, CA, USA). Prior to assembling the reactor cell with the main catalytic testing apparatus, the fibers were secured using two pieces of glass wool, which also served as gas distributors. The catalytic performance was assessed at high space velocities (62,700 h−1 and 84,000 h−1), with the gas mixture flowing over both the shell and lumen surfaces of each fiber bundle at total flow rates of 36.3 mL/min and 48.5 mL/min, respectively. Electronic mass flow controllers (Brooks 5850Ε, Brooks Instrument, Hatfield, PA, USA) regulated the flow rate of each gas stream, while a heating mantle, controlled by a PID automatic temperature controller, maintained the operation temperature. To monitor temperatures, a fast-responding thermocouple was mounted on the outer surface of the quartz tube to track the wall temperature of the reactor, while a second thermocouple was inserted into the tube, with its tip positioned at the center of the fiber bundle to measure the temperature of the catalytic HFs. Gas analysis was performed every 30 min using the gas chromatograph equipped with a six-port gas sampling valve and both thermal conductivity (TCD) and flame ionization (FID) detectors in series. A 30-feet packed column (HayeSep D 80/100 mesh, 1/8” stainless steel) facilitated the separation of target gases within 15 min, with an additional 15 min allocated for cooling the chromatograph oven in preparation for the next analysis. The temperature was dynamically adjusted, and the catalytic activity was primarily assessed by determining NO conversion, as well as/along with the selectivity for N2 and N2O in the presence or absence of CO and oxygen in the feed gas. The following equations were used to calculate these parameters:
C O   c o n v e r s i o n ( % ) = C O f e e d C O e f f l u e n t C O f e e d
N O   c o n v e r s i o n ( % ) = N O f e e d N O e f f l u e n t N O f e e d
N 2 O   s e l e c t i v i t y ( ) = N 2 O e f f l u e n t N O f e e d N O e f f l u e n t
N 2   s e l e c t i v i t y = 2 × N 2 o u t l e t N O f e e d N O e f f l u e n t
C O 2 , c a l c u l a t e d % = C O c o n s u m e d + C O 2 f e e d C O f e e d C O e f f l u e n t + C O 2 f e e d
All gas concentrations are expressed in %v/v and water vapor was excluded from the gas streams to prevent complex effects arising from the water–gas shift reaction and hydrocarbon reforming. A typical feed composition of simulated exhaust gas consisted of 0.5% v/v H2, 1% v/v CO, 0.6% v/v NO, 6.5%vol v/v CO2, 0.033% v/v C3H8 and 0.06% v/v C3H6, with the balance being He. The temperature range studied for this composition was from 250 to 450 °C. Additionally, experiments were conducted both without CO and with varying amounts of O2 (1000 ppm and 40,000 ppm) introduced in the gas stream to investigate the effect of oxygen on the catalytic NO reduction by CO.

3. Results

3.1. Morphological and Textural Characterization

Figure 1 presents a comprehensive morphological analysis of the polymeric precursor HF. In Figure 1a, the cross-section reveals a well defined hollow cylindrical structure with a wall thickness of approximately 230 μm and an outer diameter reaching up to 1400 μm. This uniform geometry suggests successful fabrication, which likely contributes to good mechanical stability and structural integrity during further processing. Figure 1b displays a relatively smooth outer wall surface, whereas Figure 1c highlights a porous, granular texture indicating the presence of embedded ceramic particles and possible copper nanoparticle clusters distributed within the alginate matrix. Figure 1d focuses on the middle region of the shell surface, where both micro- and nano-scale porosity are observed, confirming the effective incorporation of functional nanoparticles.
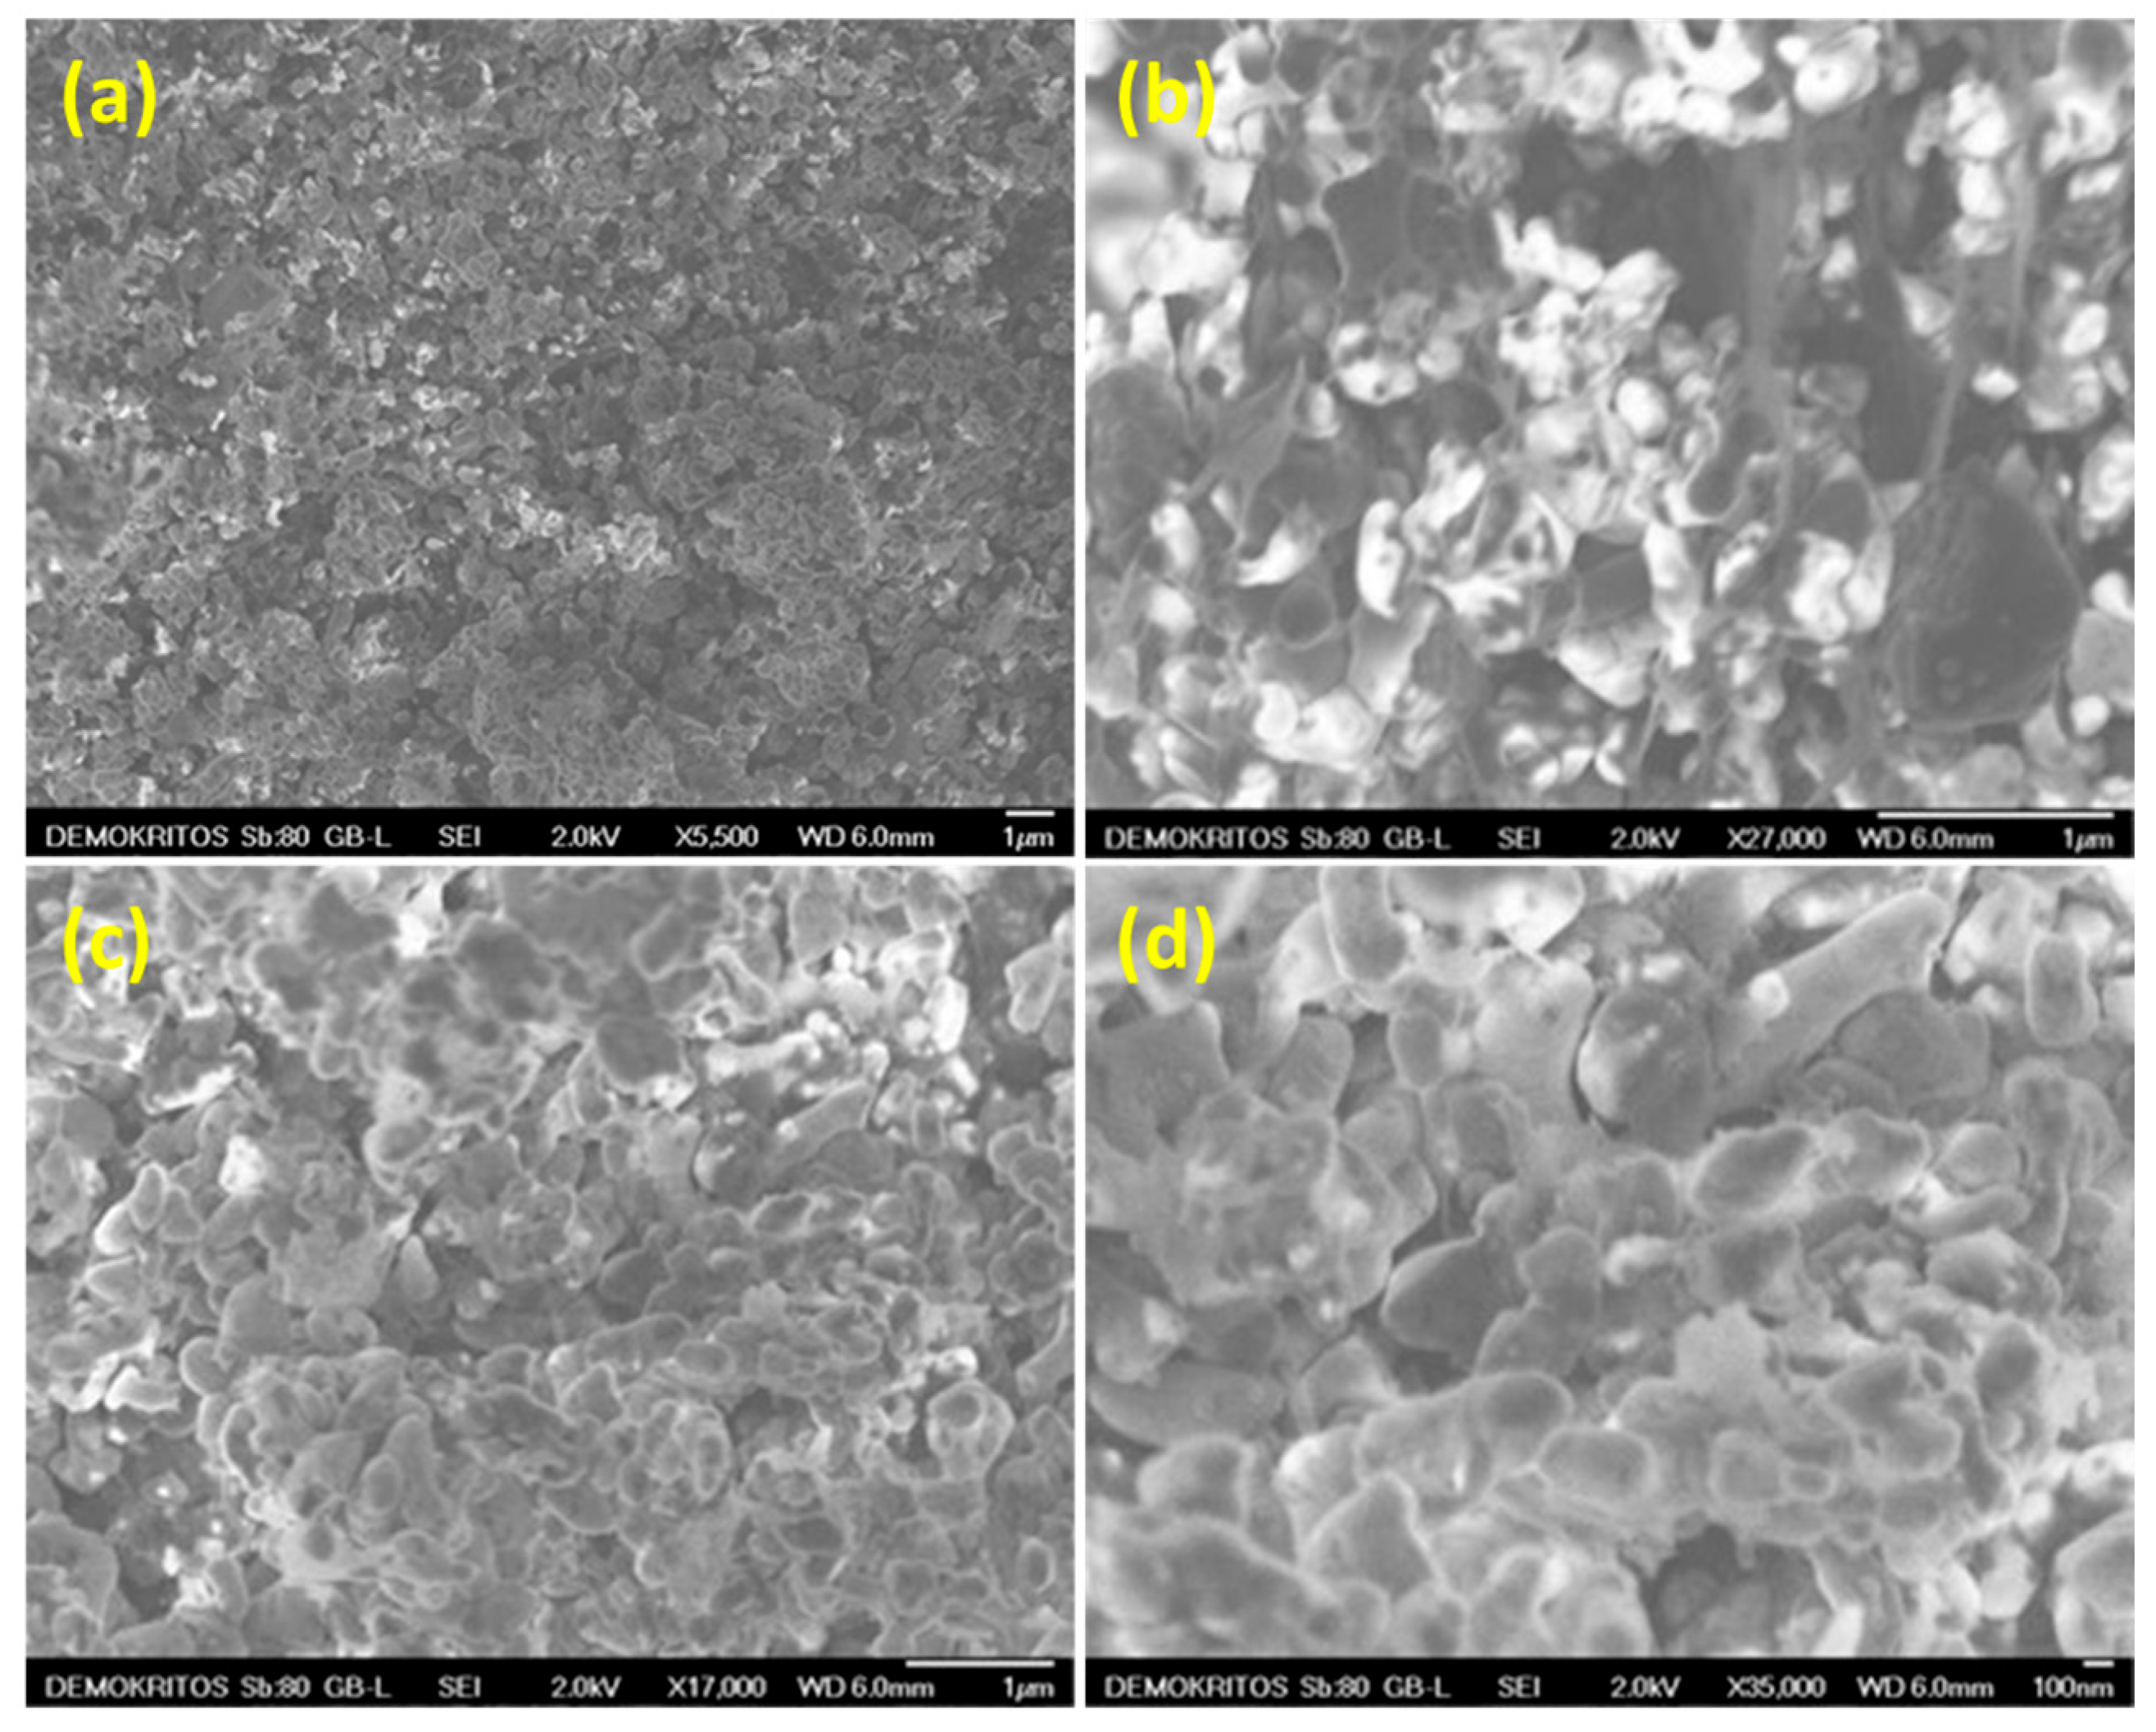
Figure 2 highlights significant morphological changes in the HF800 sample when compared with the precursor HF. In Figure 2a, the wall surface appears more compact and granular, suggesting partial sintering and structural consolidation because of the high-temperature pyrolysis. This densification indicates that the material has undergone a thermal transformation, forming a more rigid and interconnected framework. The presence of fine particles and reduced porosity further enhances its mechanical stability. Figure 2b, which presents the inner surface of the side wall, reveals a textured and densely packed surface composed of irregular particles. This appearance is likely due to the redistribution of ceramic and copper nanoparticles during pyrolysis. The observed microstructure points to the development of a potentially catalytically active surface, where the closely packed granules and limited voids contribute to improved thermal resistance and structural integrity. Figure 2c,d, obtained from the lower part of the wall, display a combination of morphologies, with compact regions alternating with areas of preserved microporosity. This structural diversity helps retain pathways for mass transport while simultaneously reinforcing the overall framework. Thus, the SEM analysis confirms that HF800 possesses a stable structure with partial porosity and finely detailed morphology, making it a promising candidate for catalytic applications.
On the other hand, the SEM analysis of HF1300 reveals extensive morphological transformations and pronounced structural densification compared with the fibers treated at a lower temperature (HF800). Figure 3a illustrates a compact and dense side wall with minimal visible porosity, suggesting a high degree of sintering. The smooth, fused surface indicates the extensive decomposition of the organic matrix and the substantial coalescence of alumina and copper nanoparticles. In Figure 3b, the high-magnification view of the upper wall surface shows tightly packed grains with angular, sharp edges and low intergranular spacing, which are characteristic features of a thermally stabilized structure. Figure 3c highlights a rough, crystallized outer texture formed by aggregated particles, likely due to the formation of copper–ceramic composites through high-temperature diffusion. Figure 3d,e similarly display well sintered granular features in the middle wall, suggesting uniform heat distribution across the fiber. While this densification enhances mechanical strength and thermal resistance, the corresponding reduction in surface porosity may impact and lower catalytic activity. Figure 3f–h further confirm the presence of a compact external wall with low porosity. The microstructure appears highly compact with a reduced pore size and minimal interparticle voids. This high level of densification contributes to the exceptional mechanical durability, thermal stability, and overall structural integrity of HF1300.
Overall, the comparison between HF800 and HF1300 emphasizes the significant impact of thermal treatment on structural fiber morphology and material properties. HF800 maintains a moderately porous and granular structure, featuring interconnected particles along with visible micro- and nano-scale voids. This partial porosity suggests an effective balance between structural integrity and surface area retention. In this case, moderate sintering facilitates the formation of a stable matrix without entirely sacrificing the porous architecture to support catalytic functionality. In contrast, HF1300 undergoes a much more intense thermal treatment leading to extensive densification, grain fusion and sintering. The resulting microstructure is highly compact, with a significantly reduced pore volume, tightly fused grains, and a smoother overall texture. These changes enhance mechanical strength and thermal stability. However, they also reduce the surface area, which could potentially limit its performance in catalytic processes.
The textural properties of both fresh and spent HF800 and HF1300 samples were evaluated using liquid N2 porosimetry at 77 K with the results summarized in Table 1. The BET surface areas of the fresh HF800 and HF1300 samples show notable differences, with the HF800 sample exhibiting a higher surface area (8.4 m2/g) compared with HF1300 (4.5 m2/g). These differences can be attributed to the distinct pyrolysis conditions applied to each sample. As inferred, the carbon content plays a crucial role in the development of porosity by promoting the formation of pores during the pyrolysis process. HF800, pyrolyzed under a nitrogen atmosphere at 800 °C, facilitates the formation of a carbon network of extended porosity resulting in a higher surface area. In contrast, HF1300, pyrolyzed at 1300 °C under an argon atmosphere, undergoes carbon graphitization leading to a more compact and denser structure and a reduction in surface area. The use of argon at higher temperatures also stabilizes the alumina and copper nanoparticles, which may limit the formation of additional pores, thereby contributing to the lower BET surface area observed in HF1300 compared with HF800. Thus, the pyrolysis conditions exert a significant influence on the final surface properties of the developed HFs.
Following the catalytic runs, the SBET of both samples increased, though to different extents. The HF800 sample exhibited a significant increase in surface area, rising from 8.4 m2/g to 15.8 m2/g, whereas HF1300 demonstrated a more modest one, from 4.5 m2/g to 5.7 m2/g. This pronounced increase observed for HF800 suggests that the catalytic process likely facilitated the formation of additional pores or the removal of carbonaceous material, thereby creating more surface area available for adsorption. Although this increase in surface area might seem counterintuitive, given that catalyst deactivation is typically linked to pore blockage and surface area loss, it can be explained by the nature of the carbon matrix in HF800. Owing to its higher carbon content, HF800 is more susceptible to oxidative processes during the catalytic reaction. A significant fraction of this carbon is oxidized to CO2 via interactions with reactive oxygen adsorbed atoms, leading to the loss of initial pore volume and accounting for the notable reduction in total pore volume (TPV) (from 0.196 to 0.093 mL/g). However, the more recalcitrant carbon that remains on the material during catalytic testing may undergo partial oxidation that introduces oxygen-containing surface groups. Additionally, etching by adsorbed oxygen atoms may generate new, smaller pores or nano-scale surface features within the remaining carbon structure. These newly formed micropores or increased surface roughness likely explain the observed increase in SBET in HF 800, despite the concurrent reduction in TPV and porosity. On the other hand, the more limited increase for HF1300 could be attributed to the higher degree of graphitization and pore stabilization achieved at the higher pyrolysis temperature. This results in a more rigid and less reactive carbon structure, reducing the potential for further structural modifications during the catalytic process. The TPV and porosity values further highlight the differences between the two samples and their respective conditions. For the fresh samples, HF800 exhibited a higher TPV (0.196 mL/g) compared with HF1300 (0.140 mL/g), which aligns with the observed surface area trends. Following the catalytic runs, both samples demonstrated a reduction in TPV, with HF800 decreasing to 0.093 mL/g and HF1300 to 0.088 mL/g. This decrease suggests that the catalytic process may have led to partial pore blocking or the sintering of smaller pores. Similarly, the porosity values for both samples decreased after the catalytic runs, with HF800 showing a reduction from 43.6% to 38.5% and HF1300 from 26.8% to 25.9%. The reduction in porosity indicates a loss of pore volume, potentially due to the accumulation of reaction byproducts or structural collapse during the catalytic NO reduction process. Nonetheless, in HF800, these losses are counterbalanced by the development of new microporosity or surface roughening, which more than compensate for the reduction in larger pore volume, resulting in an overall increase in SBET.

3.2. Thermogravimetric and EDX Analysis

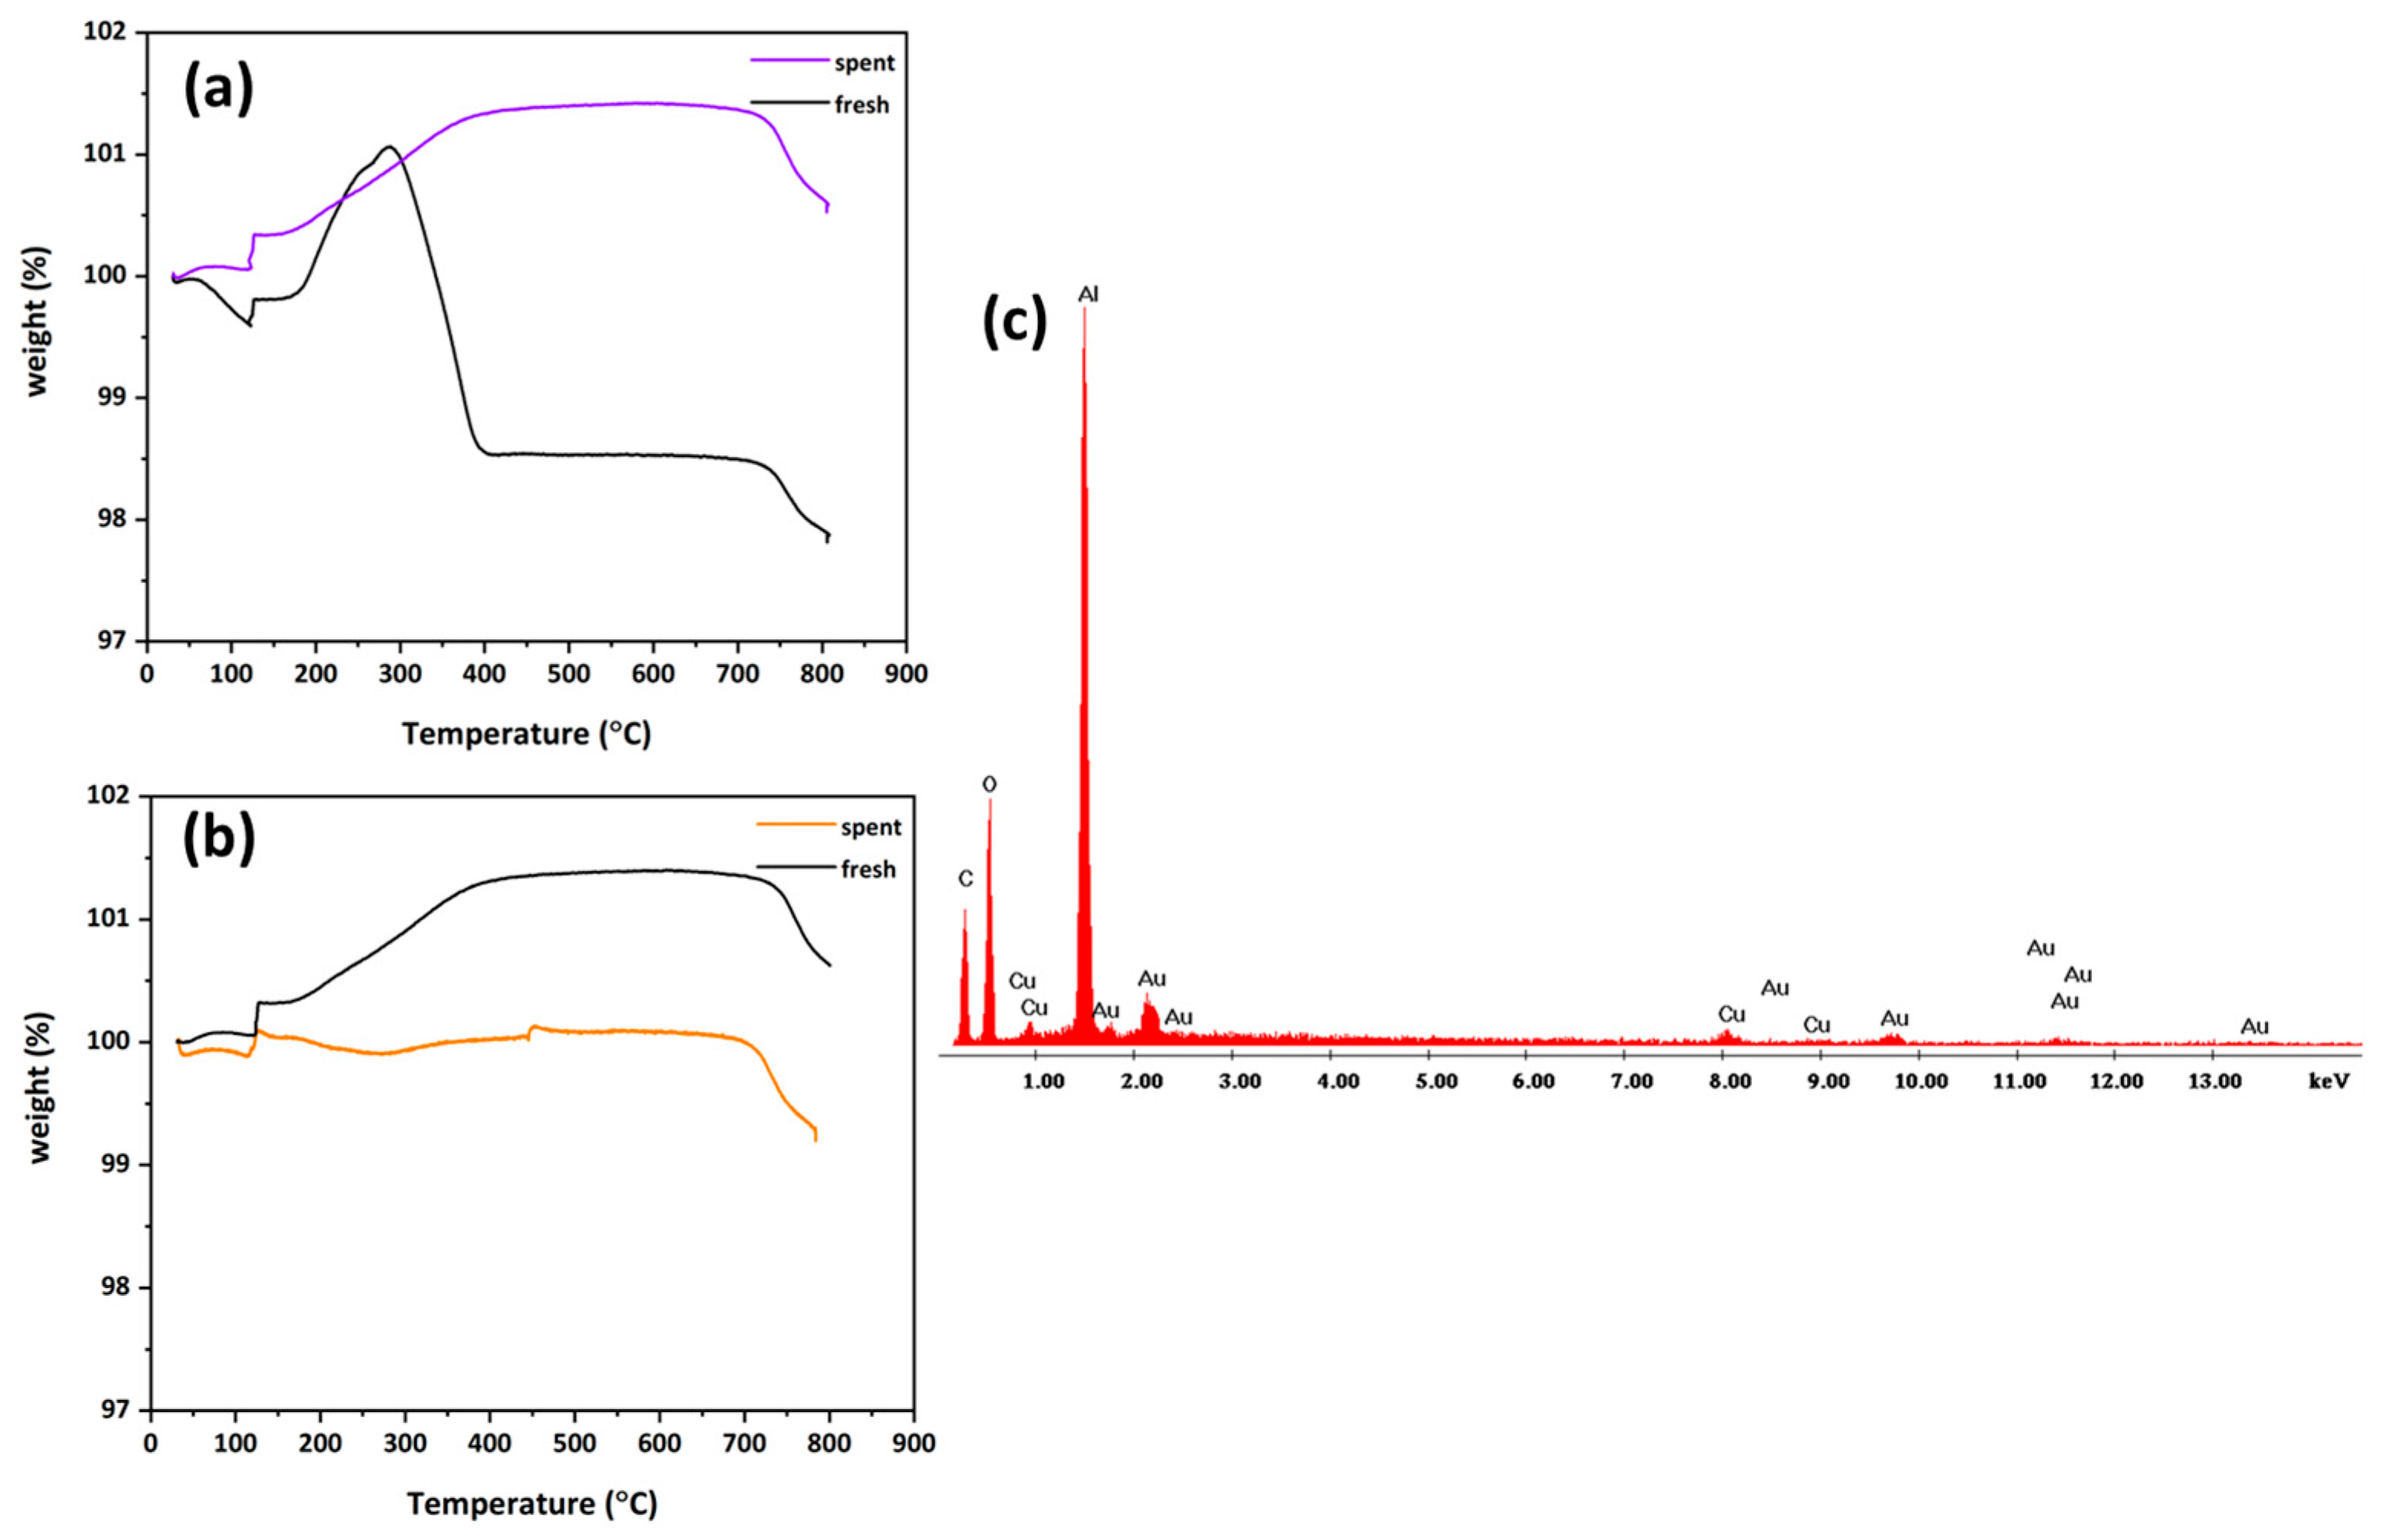
The fresh HF800 sample remains relatively stable up to 400 °C, exhibiting a mass loss of approximately 1.5%. Between 400 °C and 800 °C, it undergoes an additional mass reduction of about 0.73%, resulting in a total mass loss of 2.13% during the oxidation process, as determined by thermogravimetric analysis (Figure 4a). This mass loss is attributed to the carbon content and appears to involve two distinct carbon phases. An increase in mass uptake to 101.06%, observed around 290 °C under air flow, was attributed to oxidative processes, corresponding to an estimated oxygen uptake of 1.06 wt.%, as determined by the same analytical method. Based on the assumption that the molar ratio of Cu/O is 1:1, the corresponding copper content was calculated to be 4.21%.
The TGA profile of the spent HF800 sample exhibits a clear mass increase starting around 100 °C and continuing beyond 350 °C. This weight gain is attributed to oxidative processes, primarily the reoxidation of reduced copper species formed during catalytic operation, confirming the presence of metallic copper that becomes oxidized under air flow. In contrast, the fresh sample displays a significant mass loss between 400 and 800 °C, associated with the combustion of carbonaceous residues. The absence of such a decrease in the spent sample indicates that the carbon content has been substantially depleted during catalytic use. Any carbon detected post reaction likely originates from the initial material and reflects the fraction that underwent oxidation. Beyond 350 °C, the spent sample remains thermally stable without major decomposition. The lack of carbon-related mass loss and the observed oxidation-induced mass gain indicate significant composition changes, including copper oxidation and carbon depletion, revealing important insights into catalyst transformation, deactivation and regeneration potential.
The TGA profile (Figure 4b) of the HF1300 fresh sample provides a detailed assessment of its thermal and chemical stability. An initial, slight increase in weight is observed at temperatures below 150 °C, which is unusual and likely results from the adsorption of atmospheric oxygen onto reactive copper or carbon sites. This behavior is typical of materials containing finely dispersed copper or carbonaceous phases that can chemisorb gases at low temperatures.
As the temperature increases further, a clear weight gain is observed starting near 130 °C, reaching a maximum of approximately 101.4% at 660 °C, followed by a slight drop. This gain under air flow is attributed to the oxidation of residual reduced copper species, such as Cu0 or Cu+, during the thermal treatment. These species readily oxidize to CuO or Cu2O in air, contributing to the observed mass increase, along with the potential oxidation of remaining carbonaceous residues from precursor formulation.
Moreover, the sample exhibits excellent thermal stability, with no significant weight loss detected up to approximately 700 °C. This stability is attributed to the development of a highly graphitized and structurally robust carbon matrix during pyrolysis at 1300 °C, which offers strong resistance to oxidation and thermal degradation. As the temperature rises toward 750 to 800 °C, the TGA curve begins to show a gradual weight decrease. This change is likely associated with the onset of carbon oxidation, where the carbon phase starts to combust in the presence of air, resulting in mass loss. The alumina component within the composite may contribute to delaying this oxidation by serving as a thermal barrier or by enhancing the stability of the carbon network.
A comparison with the TGA profile of the spent HF1300 sample (Figure 4b) highlights key differences resulting from structural and chemical evolution during NO reduction catalysis. Unlike the fresh sample, the spent one displays only a minimal weight gain and then a steady weight loss beginning near 700 °C, ultimately reaching about 99.2%. This behavior suggests that redox-active copper species like Cu0 or other oxidizable intermediates were already consumed or passivated during the catalytic reaction. The final weight loss is likely due to decomposition of surface-bound nitrogen-containing residues, such as nitrates or nitrites formed during NO reduction. These differences between the fresh and spent TGA curves reflect transformations in the copper component. In the fresh material, copper remains in a reduced or reactive state due to the inert high-temperature treatment, making it responsive to reoxidation during TGA in air. In the spent sample, however, copper may have agglomerated, sintered or become embedded within the alumina matrix, leading to a reduction in redox reactivity. This interpretation is supported by the more gradual weight profile of the spent sample. These findings demonstrate that the HF1300 sample has outstanding thermal durability and is well suited for use in high-temperature applications such as catalysis in chemically reactive environments.
Overall, while HF1300 exhibits greater thermal stability and resistance to oxidation due to its highly graphitized carbon matrix and stabilized copper species, HF800, despite its lower thermal durability, demonstrates superior catalytic performance in NO reduction. The TGA profile of HF800 highlights its more reactive carbon phases and readily accessible copper sites, which are essential for its enhanced NO reduction, as discussed in the following sections, illustrating the balance between structural stability and catalytic activity.
The elemental composition obtained through EDX analysis (Figure 4c) further confirmed the presence of copper in the HF1300 sample after catalytic testing. The EDX results indicate an average copper content of 4.58% by weight.

3.3. WAXS Analysis

The WAXS patterns of the HF800 (fresh and spent) and HF1300 (spent) samples reveal distinct differences in crystalline phase composition and peak intensities that reflect structural and compositional changes during catalytic NO reduction (Figure 5).
In the fresh HF800 sample, sharp reflections at approximately 2θ = 25.8°, 35.4°, 38.1°, 52.8° and 57.7° correspond to crystalline α-Al2O3, confirming a highly ordered and stable ceramic backbone. Copper, introduced as the active phase, likely exists initially as Cu0 and/or Cu2O/CuO depending on the preparation redox conditions. The absence of clear carbon peaks was expected, as amorphous or poorly crystalline carbon produces only broad, low-intensity humps (20–30°) that are easily overshadowed by stronger copper oxide and alumina reflections.
After the catalytic runs, the spent HF800 exhibited new CuO reflections and increased intensities for both CuO and metallic Cu peaks, indicating the further crystallization or growth of these phases during NO reduction. These changes suggest particle growth and the possible redistribution of copper species, which can alter dispersion and catalytic performance. The Al2O3 reflections remained sharp, confirming the structural stability of the ceramic support.
Compared with spent HF800, the spent HF1300 displayed sharper and more intense Al2O3 reflections, indicating greater crystallinity due to the higher pyrolysis conditions. For the copper phases, CuO peaks generally decreased in intensity, broadened and some reflections disappeared, suggesting the partial reduction or structural reorganization of the oxide. Metallic copper exhibited mixed behavior, with one peak increasing in intensity while another decreases, consistent with particle growth or redistribution. Cu2O peaks increased in intensity, indicating the stabilization or formation of this oxide under the reaction conditions. These changes suggest that high-temperature treatment likely promotes phase redistribution, sintering and crystallite growth, which can influence copper dispersion and, consequently, catalytic performance. Overall, these WAXS results highlight the interplay between preparation temperature, copper phase composition and structural stability during catalytic operation.

3.4. Catalytic Performance

3.4.1. Impact of Carbon Content on the NO Reduction Efficiency by CO

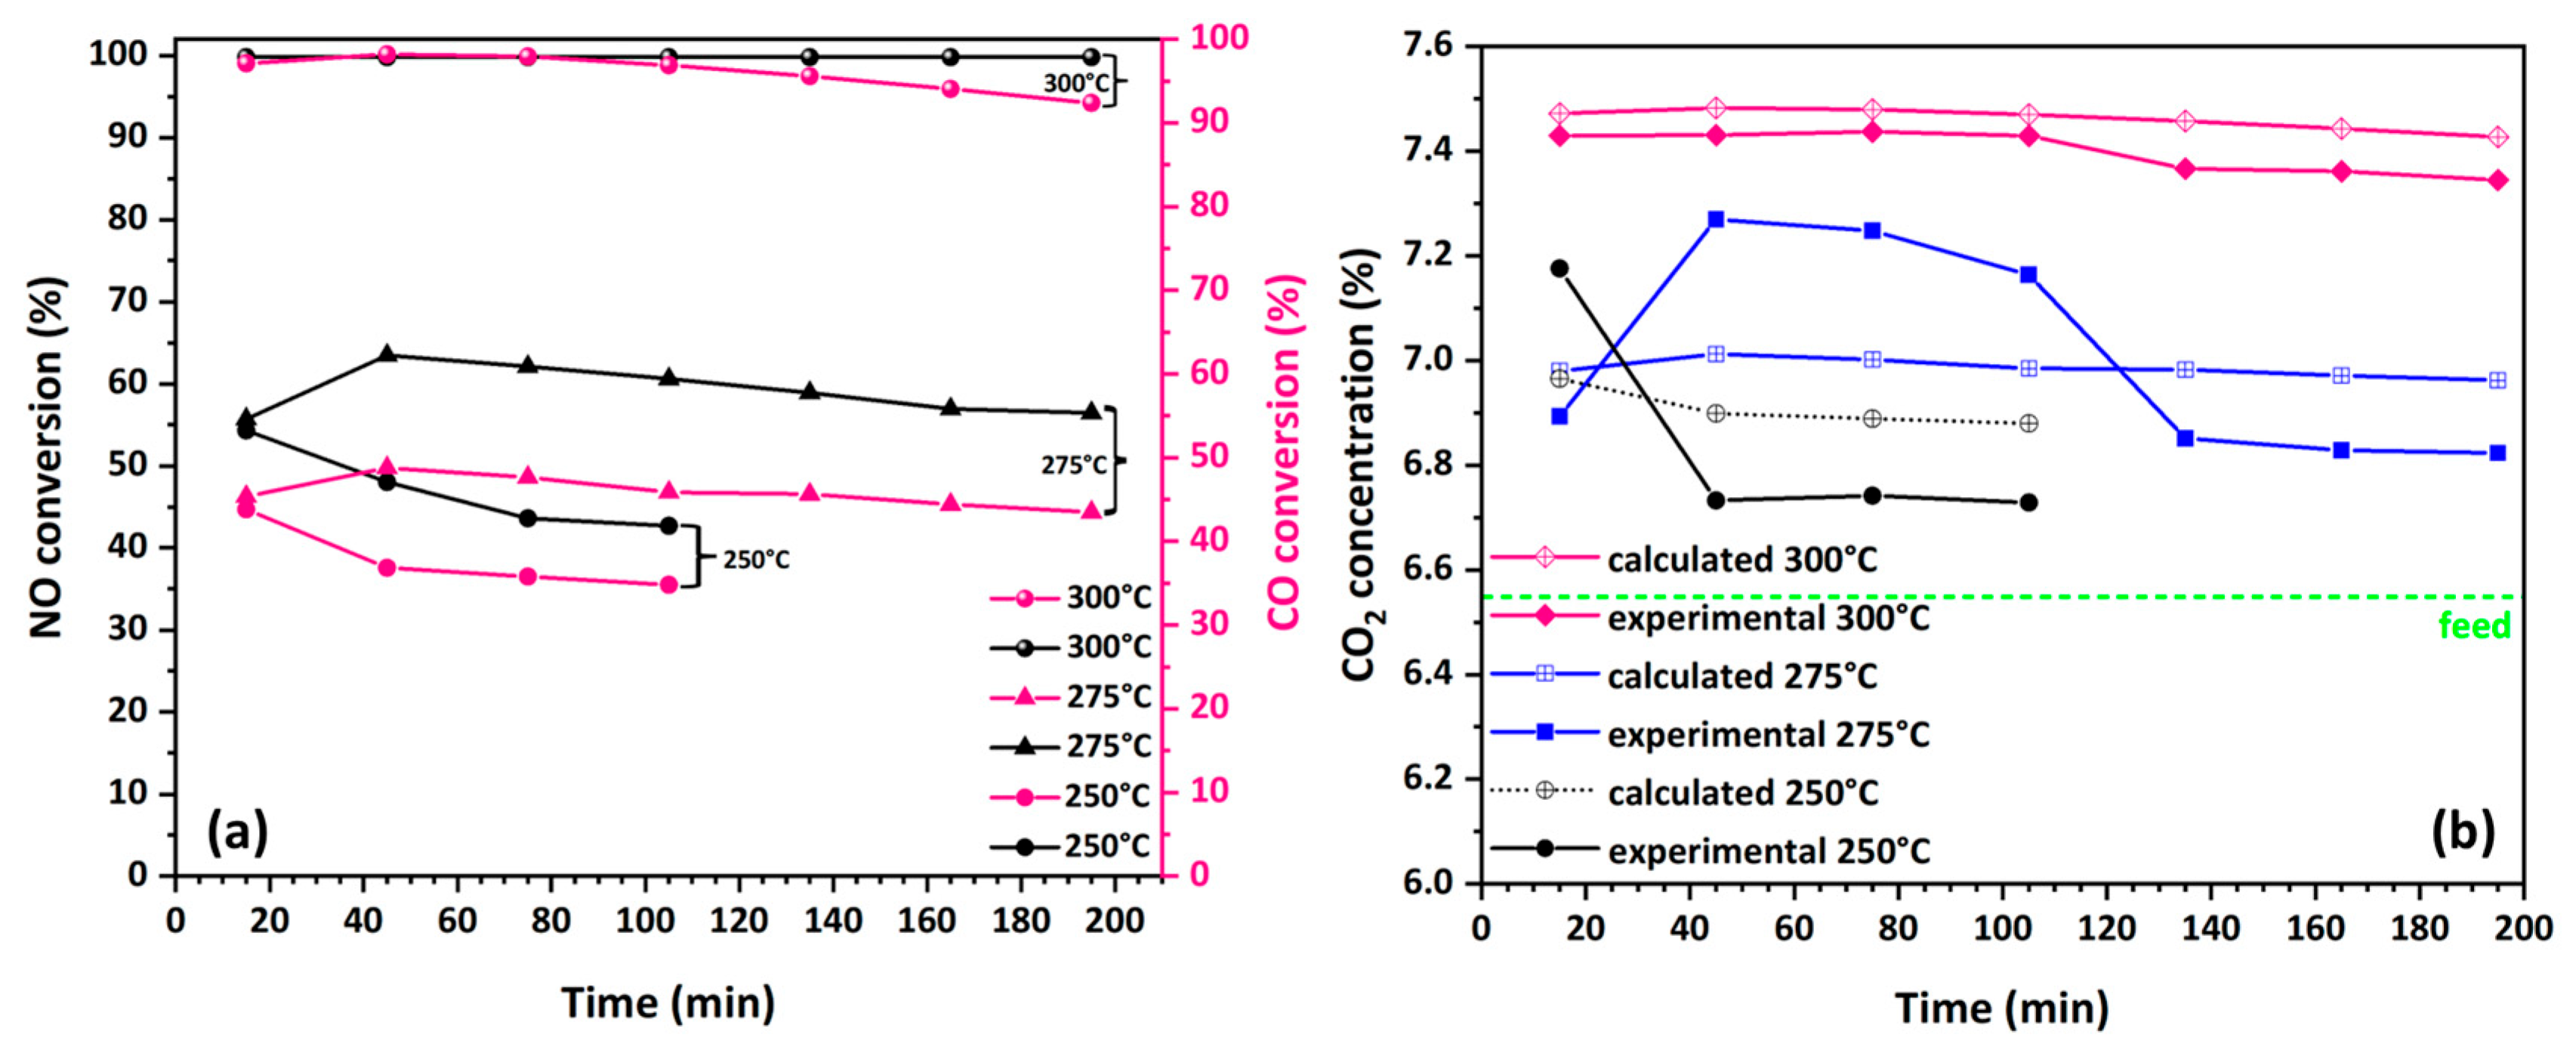
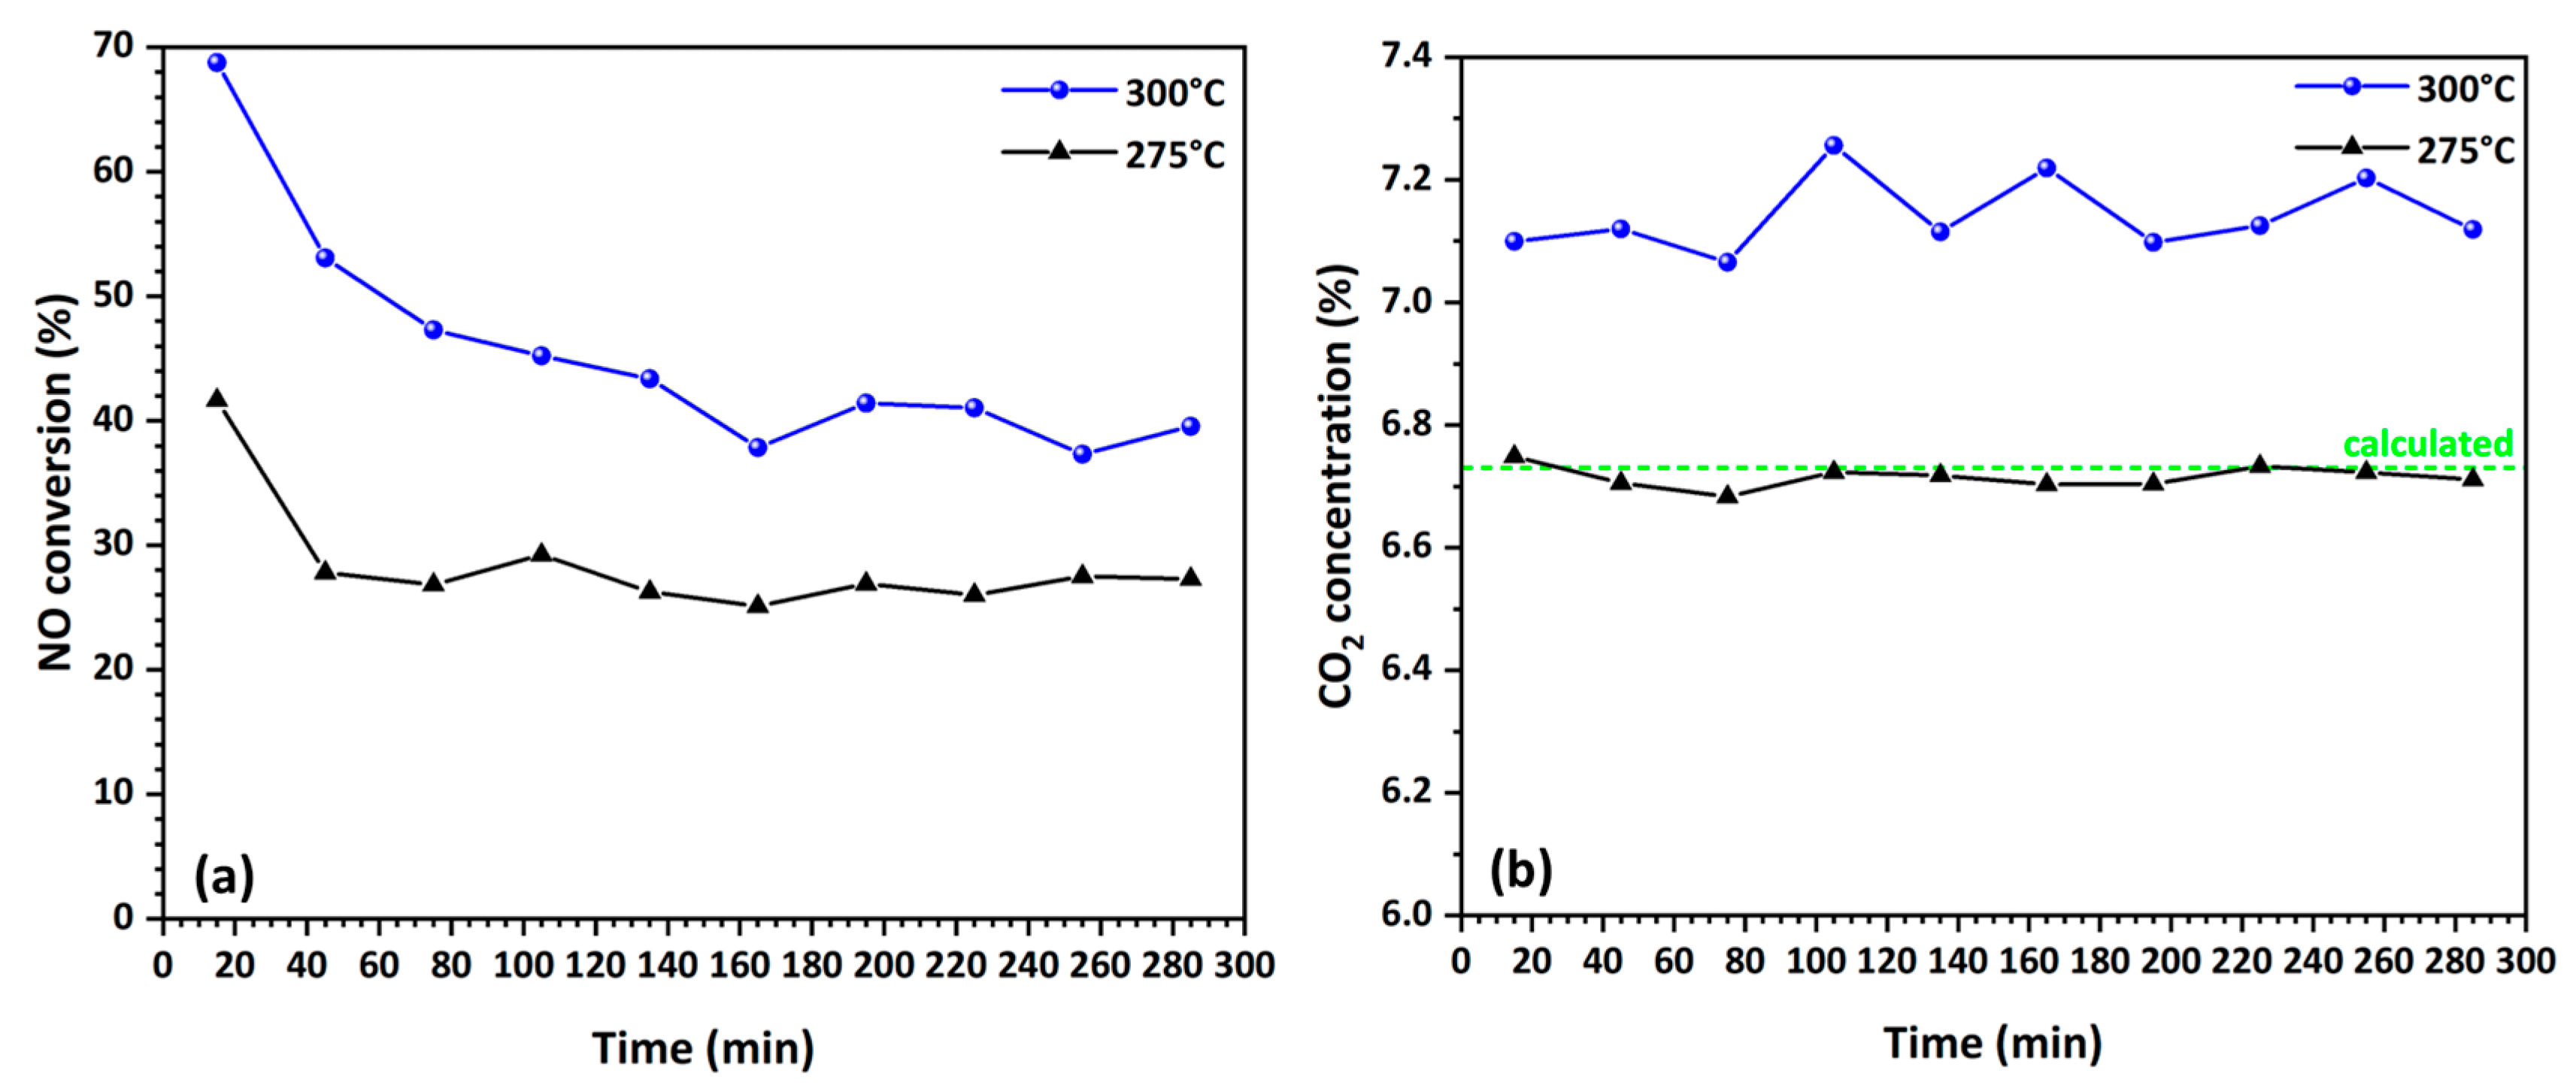
HF800 demonstrated high activity in NO reduction in the presence of CO. The fresh sample achieved 100% conversion at 300 °C with a light-off temperature of 250 °C (Figure 6a). This indicates that CO readily participates in the NO reduction mechanism, suggesting that the valence state of the copper sites responsible for the catalytic activity of HF800 is primarily Cu0. This was further supported by our previous work [41], which revealed the presence of small amounts of CuO and a significant amount of metallic copper. It is important to note that the role of CO in NO reduction over copper catalysts has been extensively studied and generally found to be negligible when copper is in the divalent oxidation state and when oxygen is present in the gas stream. The reasons for this are that CO coordinates weakly and in a different manner with Cu2+ compared with Cu+ and Cu0 [42] and oxygen poisons the activity even at low concentrations [43,44] due to the high selectivity of oxygen for oxidizing CO rather than CO oxidizing NO. Based on the results of Figure 6, it can be deduced that, regardless of the temperature, all catalytic experiments exhibit a phase of transient conditions. These transient conditions lasted for approximately 50 min, followed by a period of steady-state conditions. In Figure 6b, the percentage of CO2 expected in the reactor’s exhaust stream is presented, assuming that all the converted CO was oxidized to CO2, and compared to the experimental data.
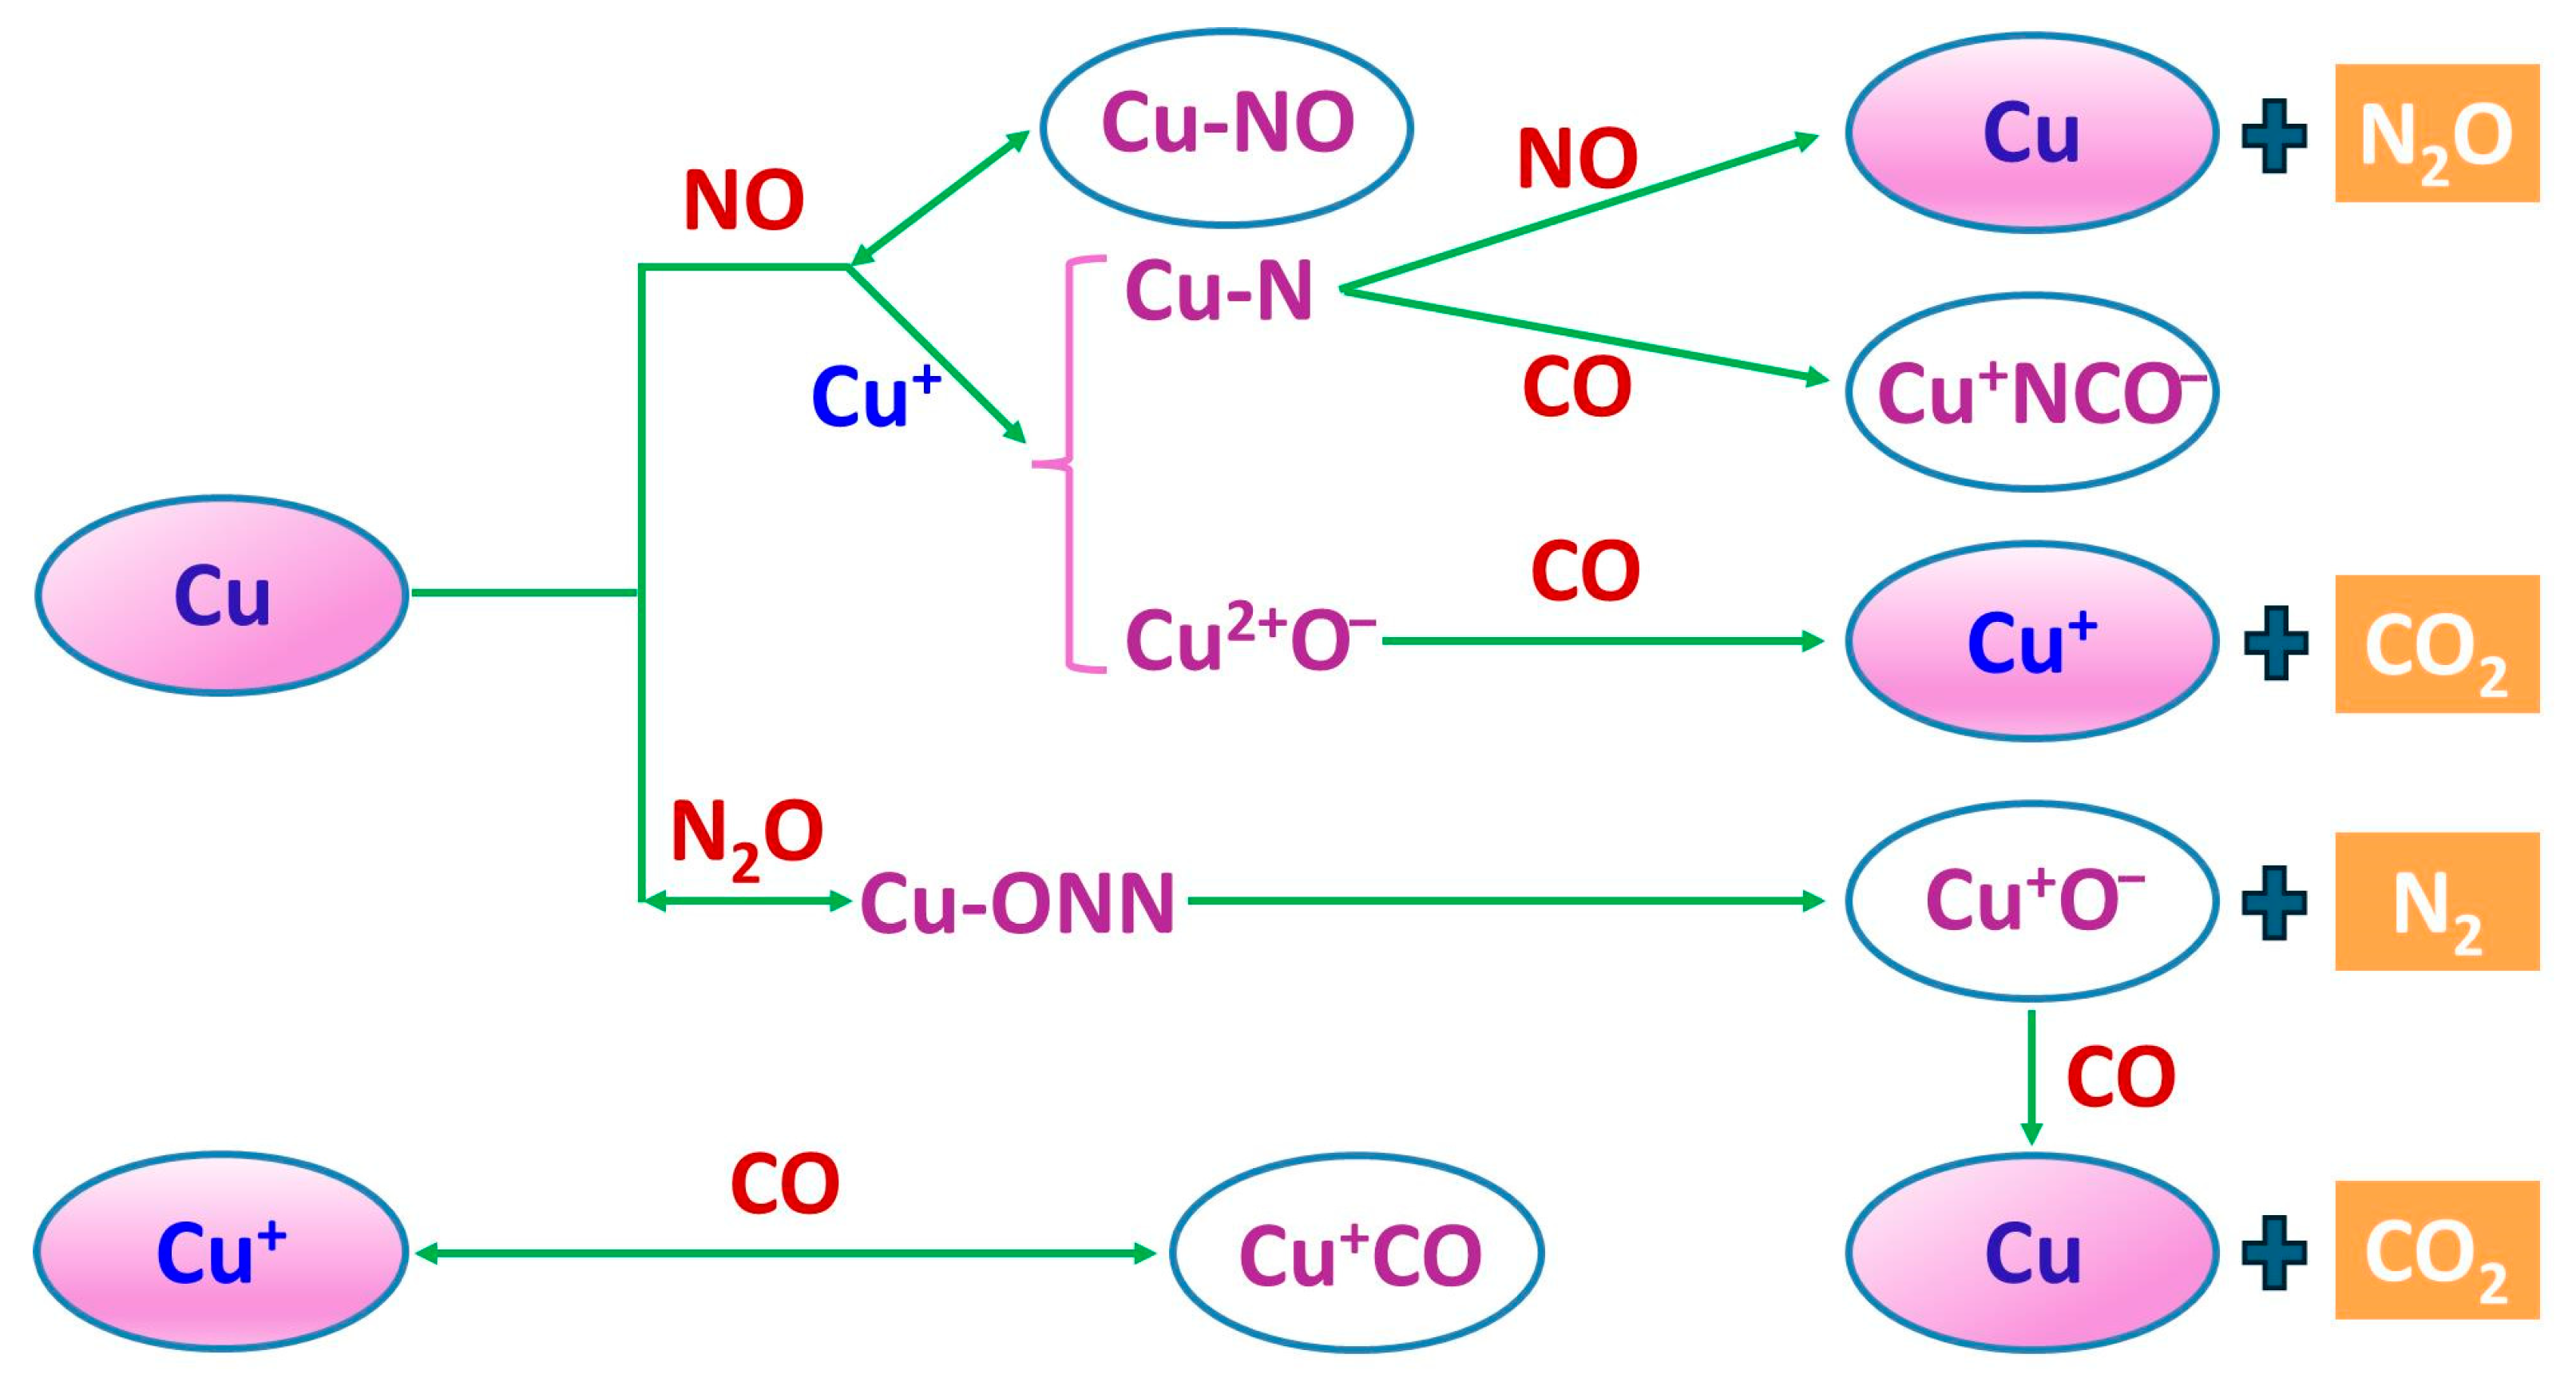
It can be observed that during the transient phase, the experimentally measured CO2 content matches or exceeds the amount expected from CO conversion. However, at a later stage, during the stationary phase, the CO2 concentration decreases to levels significantly lower than expected. To explain this, the mechanistic details of NO reduction by CO, as proposed by London and Bell [45], were considered. These details are widely accepted by various authors with only minor differences. The overall mechanism can be outlined in the following nine elementary steps and schematically depicted in Figure 7:
C u + N O C u - N O
C u + N O + C u + C u - N + C u 2 + O
C u - N + N O C u + N 2 O
C u + + C O C u + C O
C u + N 2 O C u - O N N
C u - O N N C u + O + N 2
C u 2 + O + C O C u + + C O 2
C u + O + C O C u + C O 2
C u - N + C O C u + N C O
The reaction follows a redox mechanism in which NO dissociatively coordinates with reduced copper ions, forming N and oxygen adatoms. These oxygen adatoms are then captured from CO (either adsorbed or in the gas phase) to form CO2 or, in some cases, carbonate species [46]. It appears that in our experiments, during the stationary phase, the reaction mechanism also involves the formation of isocyanate species on copper sites (Equation (14)). These isocyanate species cannot serve as intermediates in the conversion of NO to N2 and thus inhibit the reaction [47], as they remain attached to the copper surface. Thus, although CO is consumed, this consumption does not correlate with the expected CO2 production during the stationary phase.
Additionally, as shown in Figure 6b, the carbon decorating the aluminum oxide particles acts synergistically with the desorption and capture of oxygen adatoms during the transient stage of the reaction mechanism. This is reflected by the CO2 levels that exceed those expected from CO oxidation alone. The catalytic experiments performed on HF800 in the absence of CO further confirm the involvement of the deposited carbon in the abstraction of oxygen adatoms, which is notably enhanced at 300 °C (Figure 8). Furthermore, the absence of a decline in CO2 elution during the transient stage confirms the previously mentioned inhibition of NO reduction in the presence of CO, which is linked to the formation of isocyanates.
The positive impact of the co-deposited carbon is further demonstrated by comparing the NO reduction performance of both samples. A shift in the light-off temperature from 250 °C to 350 °C is observed for the low-carbon-content fibers (Figure 9a). Additionally, the NO conversion efficiency at 300 °C and during the stationary phase is only 2% for the low-carbon-content fibers, while the higher carbon-content fibers achieve complete (100%) conversion. Furthermore, as shown in Figure 9b, the low-carbon-content fibers (HF1300) show no significant contribution of the co-deposited carbon in the abstraction of oxygen adatoms, even at temperatures well above 300 °C. In contrast, the HF800 fibers exhibit a 0.4% increase in CO2 content in the gas stream exiting the reactor, highlighting the contribution of the co-deposited carbon (Figure 8b).
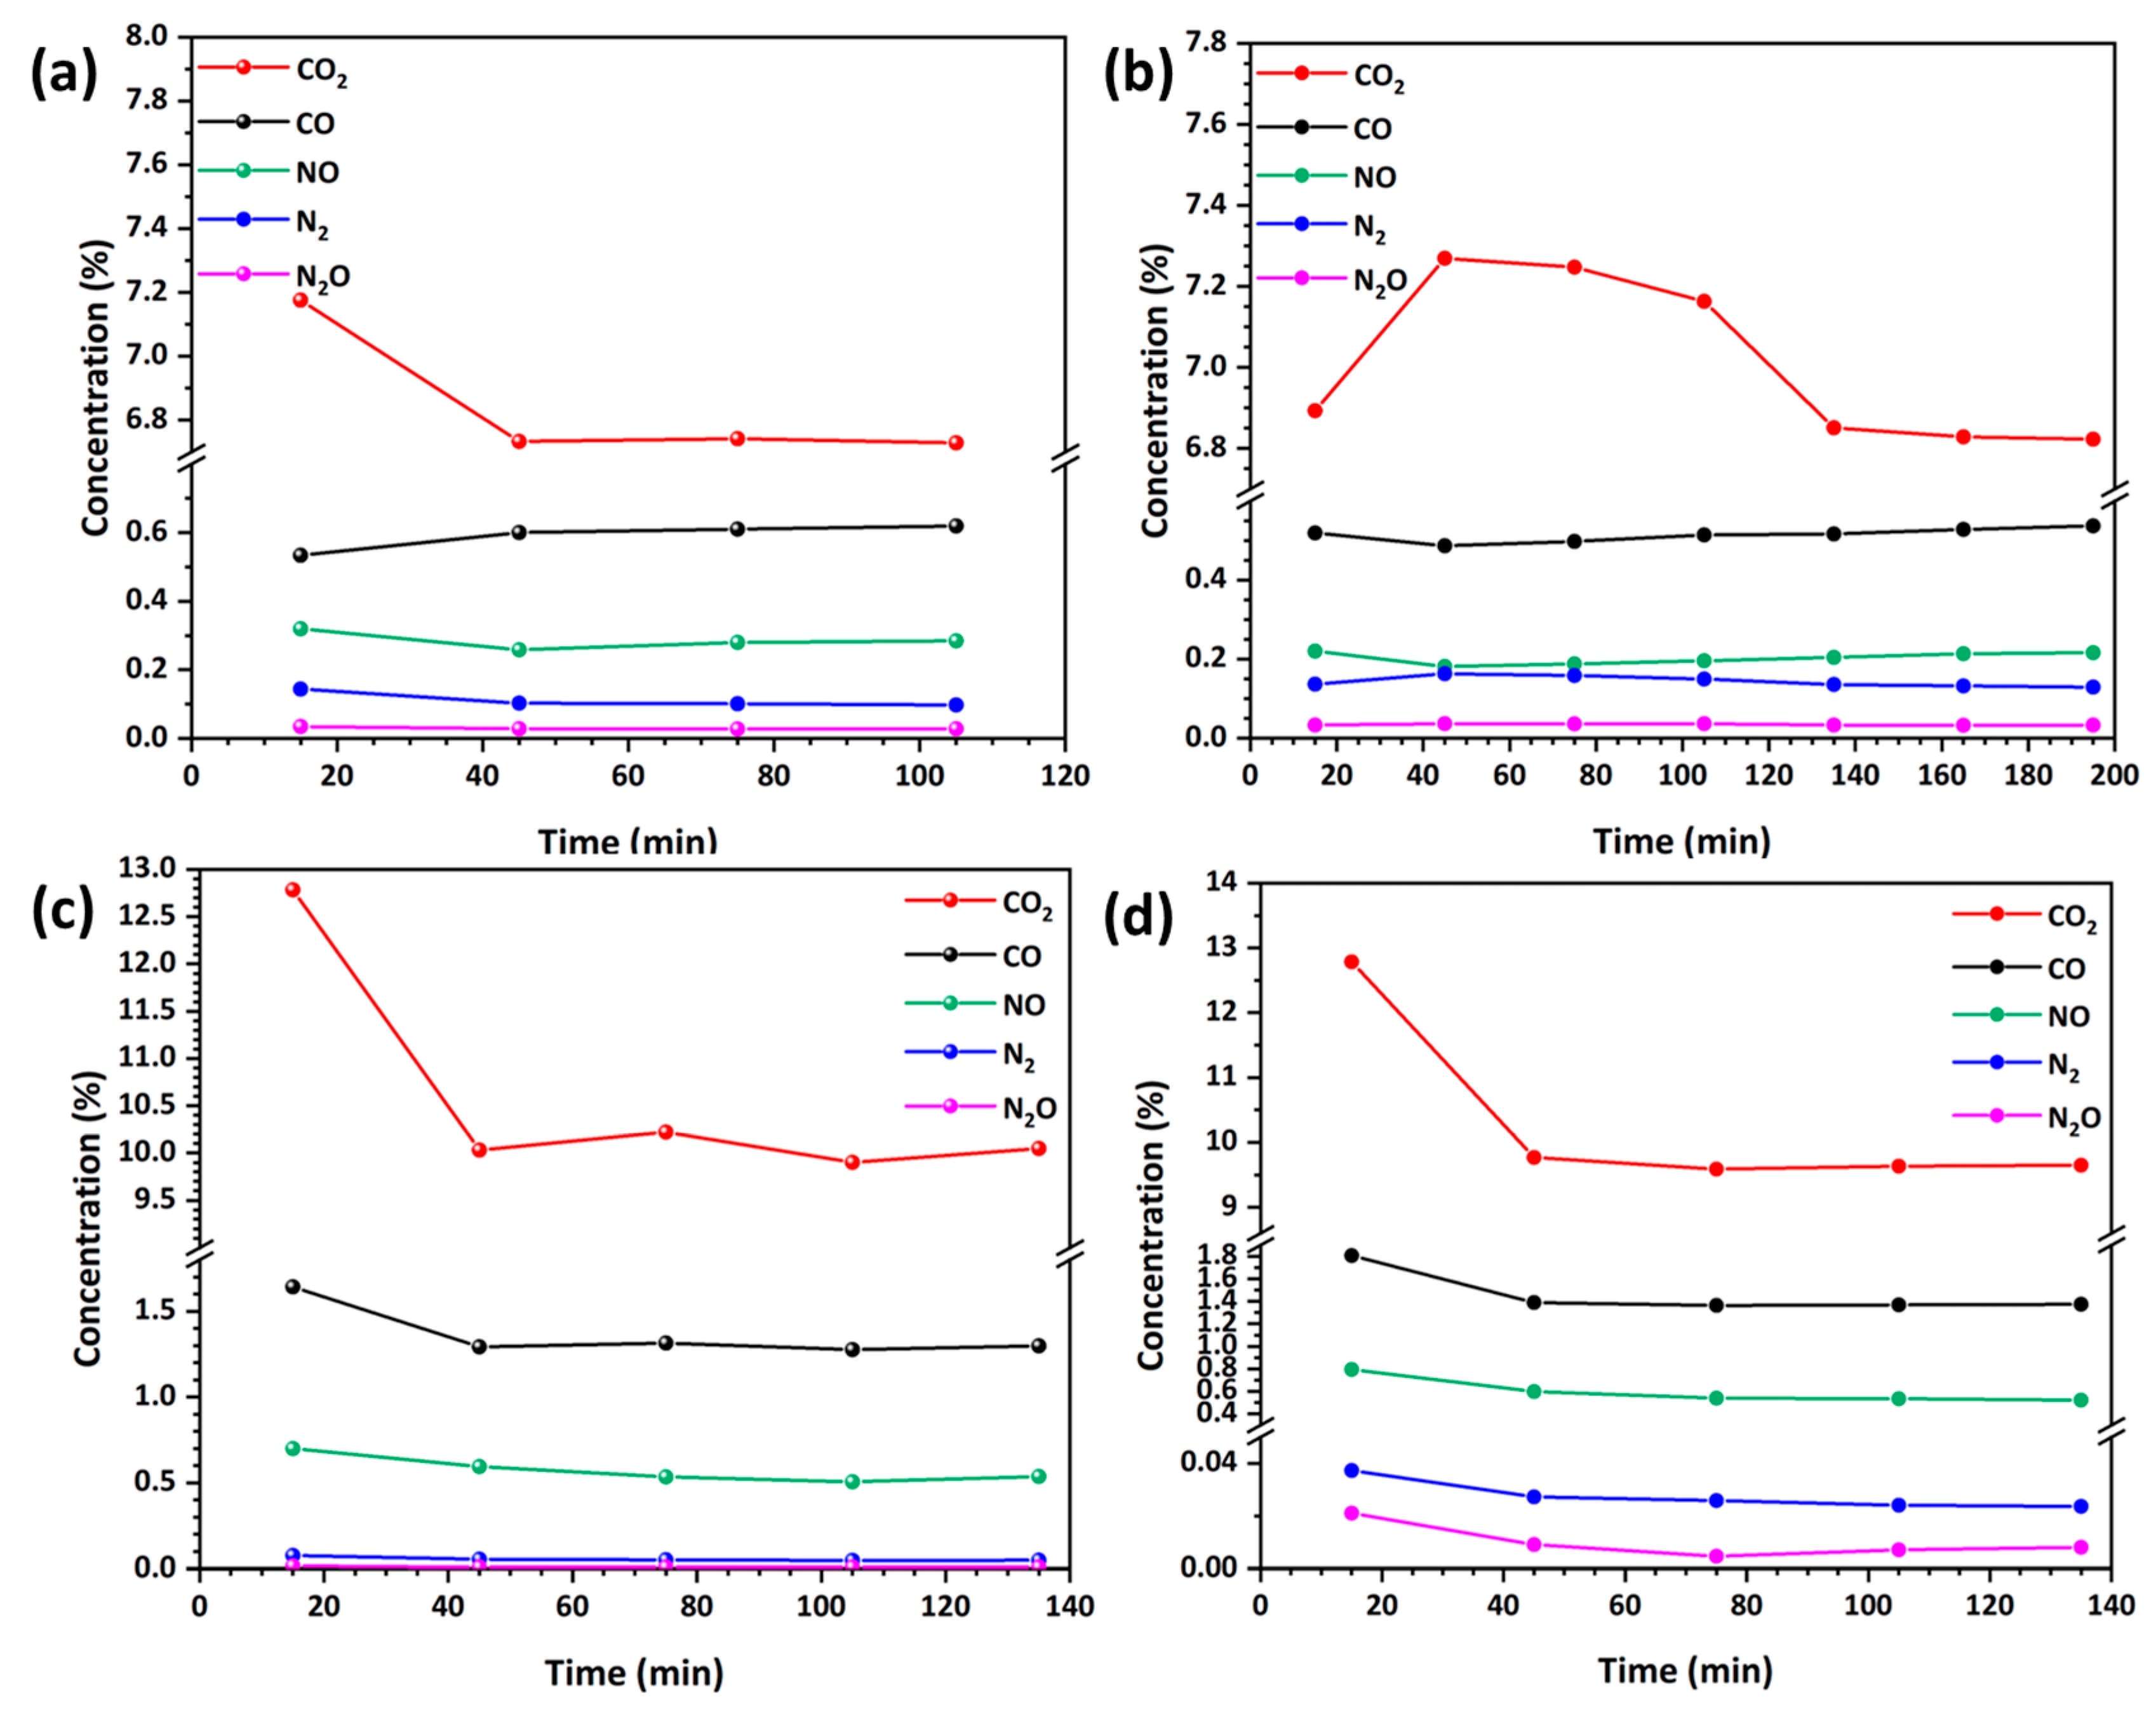
Additionally, by analyzing the transient response curves, conclusions were derived regarding the processes occurring on the surface of the studied catalytic HFs, along with the NO reduction mechanism with CO. Figure 10 displays the response curves for the reactants NO and CO and the products N2, CO2, and N2O on the catalytic fibers HF800 at a temperature of 300 °C and a flow rate corresponding to a space velocity of 62,700 h−1 (low flow). It is important to note that the response curves in Figure 10a correspond to a catalytic experiment conducted with a fresh sample, while those in Figure 10b represent a catalytic experiment performed after the sample had been exposed to the stream for 64 h.
Throughout this period, the fibers underwent successive NO reduction tests, each lasting 8 h, followed by a 10 h regeneration phase in a stream containing 0.033% v/v C3H8, 0.06% v/v C3H6, 0.5% v/v H2, 1.00% v/v CO and 6.5% v/v CO2 with He as the balance. The corresponding response curves from an experiment conducted at a higher flow rate (space velocity 84,000 h−1, high flow) are shown in Figure 10c. In all cases, the response curves for NO at 300 °C displayed a momentous response, indicating a brief transient phase with a high NO reduction rate that quickly declined to a steady-state condition. In contrast, the response for CO exhibited an overshoot response, characterized by an enhanced oxidation rate as the system transitioned from transient to steady-state conditions. The momentous response suggests that the rate-limiting step is the surface reaction or reactant adsorption, whereas the overshoot response implies that the limiting factor involves the simultaneous adsorption of the reactant or the regeneration of active sites.
As shown in Figure 11a,b, the NO response at 250 and 275 °C exhibits overshoot behavior, indicating that the rate-limiting step is the regeneration of active centers. Consequently, as the temperature rises, sample HF800, which has a higher carbon-content, undergoes a shift in the NO reduction mechanism, from being limited by the regeneration of active sites to being controlled by surface reactions. In contrast, for the low-carbon-content fibers (HF1300), the NO reduction mechanism remains surface reaction-controlled across the entire examined temperature range from 300 to 450 °C (Figure 11c,d).
In addition to influencing different reaction mechanisms and enhancing NO reduction by abstracting oxygen adsorbed atoms, the higher carbon-content provides additional benefits by ensuring the presence of alumina and carbon on the composite HFs, which facilitates the availability of both Cu2+ and Cu0 on their surface. Studies have demonstrated that the efficiency of copper catalysts in redox reactions is primarily governed by the formation of Cu2+/Cu+ and Cu+/Cu0 redox couples [48]. Additionally, while Cu2+ and Cu0 serve as active sites for NO adsorption, only Cu0 is involved in CO adsorption [49]. In the case of HF800 fibers, which contain higher amounts of carbon and Cu0, surface reduction is unnecessary, allowing the reaction to initiate immediately. This suggests that the carbon phase and its content play a dual role: promoting the formation of active sites for NO reduction with CO and determining the nature of the copper phase. The experimental findings confirm a strong correlation between Cu0 content and carbon-content, aligning with the activity ranking of HF800 and HF1300 fibers. Furthermore, it is important to note that a higher carbon-content can contribute to smaller particle sizes, the improved dispersion of copper and copper oxide and prevents the formation of bulk-like copper aluminate phases, which are inactive in NO reduction.

3.4.2. Stability and Selectivity of Catalytic Fibers in NO Reduction by CO

Stability tests demonstrated the improved performance of fibers with a higher carbon-content. The results, recorded under both low- and high-flow conditions and across a temperature range of 250 °C to 450 °C, are shown in Figure 12. The stability evaluation was conducted through a series of catalytic NO reduction tests, each running for 8–10 h, followed by a 10 h regeneration phase using the same gas stream without NO. A sudden rise in NO conversion efficiency marks the points where the catalytic experiment resumed.
Among the various benefits of high-carbon-content fibers, such as their low light-off temperature, improved catalytic performance and extended catalytic activity, the most notable is their ability to maintain N2 selectivity at a high level, around 90%. In the low-flow experiments, the NO conversion efficiency of HF800 fibers at 300 °C decreased from 100% to 57% after 70 h, while the N2 and N2O selectivity remained stable at 89% and 11%, respectively. In comparison, fresh HF1300 fibers initially reached a NO conversion efficiency of 70% at 350 °C, but after 40 h of operation, their conversion dropped to 15% at 450 °C and N2 selectivity decreased from 90% to 39%.
These results suggest that different mechanisms contribute to the degradation of catalytic activity on the developed fibers. As mentioned earlier, the primary mechanism behind the decline in the catalytic activity of HF800 fibers is the formation of stable isocyanate species on copper sites (Equation (14)). This results in the consumption of some catalytically active sites, causing the performance to decrease and stabilize at about 60%. Furthermore, the consistent NO conversion efficiency of 60% observed over multiple catalytic cycles implies that during the intermediate regeneration phases with the simulated gas mixture, some of the isocyanates are desorbed from the active sites, allowing the partial recovery of catalytic activity. For HF1300 fibers, there is a continuous decline in both catalytic NO conversion performance and N2 selectivity. As outlined in Section 3.4.1, the formation of N2O (Equation (8)) and, afterwards, Cu-ONN species (Equation (10)) via adsorption are intermediate steps leading to N2 production. Though N2 production steadily decreases, N2O production stabilizes at 10–12%, indicating that the adsorption of N2O on reduced copper sites via its oxygen end [50] occurs at a similar rate as in HF1300 fibers. To conclude, the slow conversion of N2O to N2 in HF1300 fibers appears to be due to the slow rate of reaction 11. It has been previously observed that the N2O conversion to N2 via elementary stages 8, 10 and 11 is more efficient at higher temperatures and longer space times [45,51]. The results for HF800 fibers (Figure 12a,b) support this trend, demonstrating improved N2 selectivity at higher temperatures and lower flow rates. In contrast, the results for HF1300 fibers exhibit the opposite trend, implying that N2O binds more strongly to the copper sites in HF1300 fibers compared with HF800 fibers (Figure 12c,d).

3.4.3. The Role of Oxygen

When comparing the performance of HF800 fibers in a gas stream containing 1000 ppm of oxygen (Figure 13b) to the results from catalytic tests without oxygen (Figure 12a,b) and without CO (Figure 13a), it is evident that the small amount of oxygen positively influenced the overall catalytic activity. At 275 °C and 300 °C, the fibers achieved a NO conversion up to 76% and 60%, respectively, though in the O2 absence, these values were 63% and 38% (Figure 12a). Furthermore, N2 selectivity at 300 °C remained stable at 90% under both low- and high-flow conditions.
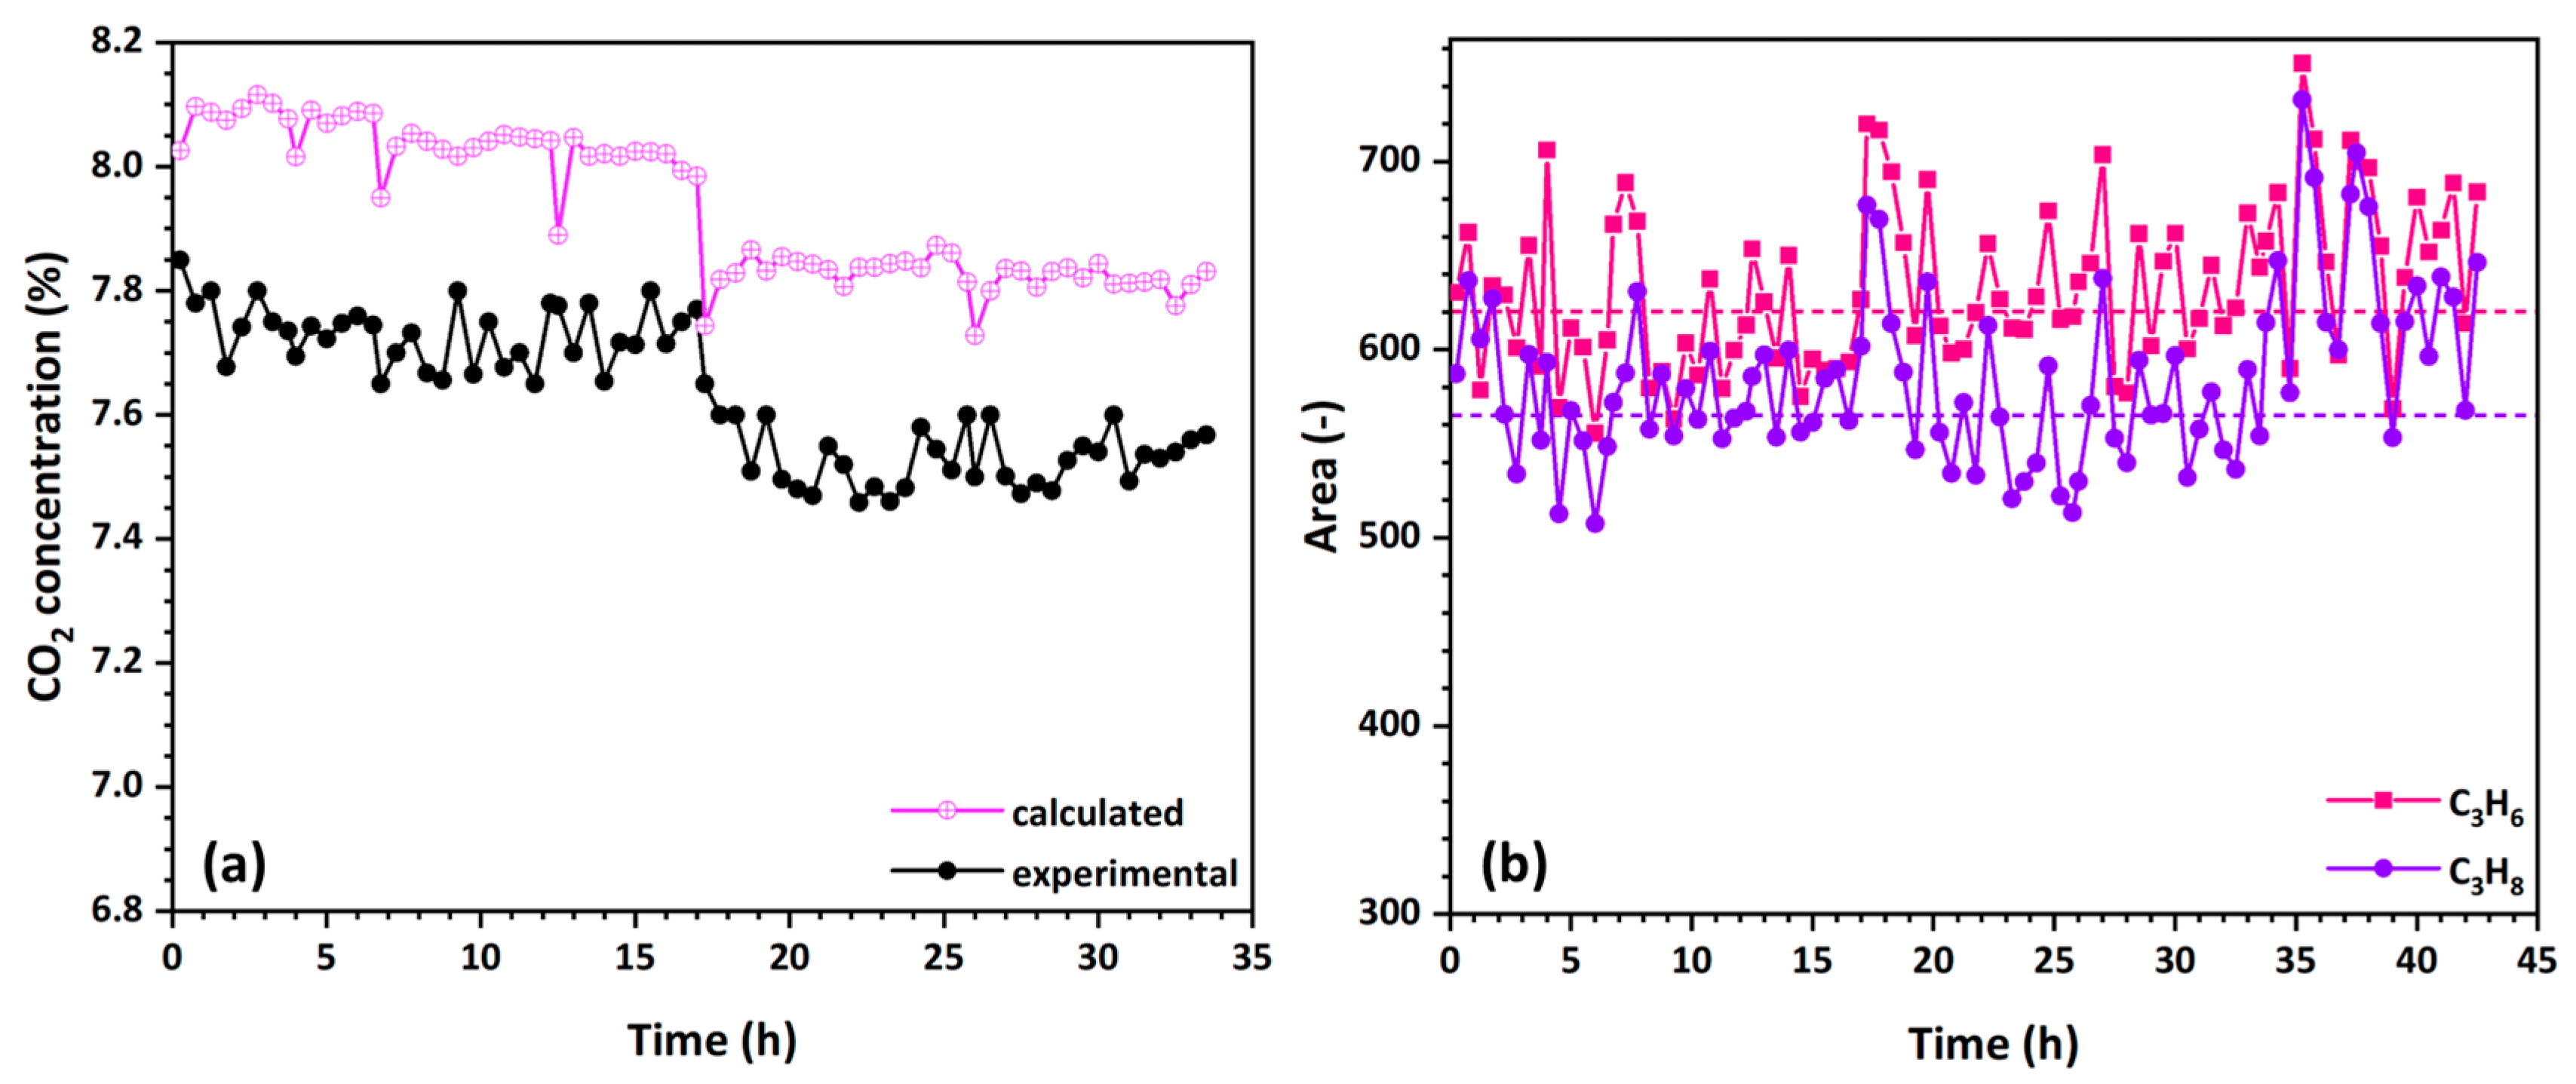
Previous studies have explored the various approaches in which oxygen benefits the reaction mechanism, including its role in limiting dealumination in zeolites [52], increasing the sticking probability of NO adsorption [53] and eliminating carbon deposits that poison active sites [54], thereby preventing the reduction of Cu2+ to inactive metallic copper [55]. In our case, oxygen, along with the trace amounts of hydrocarbons and hydrogen in the gas stream, helps maintain an optimal valence state (Cu+) and coordination of the active copper sites [56]. As shown by WAXS analysis, the copper in the starting materials is primarily in the Cu2+ and Cu0 states. Nevertheless, for copper catalysts involved in redox reactions, the activity depends on the formation of redox couples like Cu2+/Cu+ or Cu+/Cu0. Hence, the oxidation of metallic copper to Cu+ in the presence of oxygen plays a crucial role, promoting a synergistic interaction between the copper sites and facilitating efficient electron transfer between them. The results shown in Figure 14 also suggest that oxygen is primarily consumed in the formation of active copper sites.
As shown in Figure 14a, throughout the entire catalytic tests (both transient and steady-state conditions) the experimentally measured CO2 concentration at the reactor exhaust is lower than the value calculated from CO conversion. If oxygen was consumed to oxidize deposited carbon or the small HC content in the stream, the experimental curve would exceed the calculated one. Additionally, Figure 14b demonstrates that there was no measurable consumption of C3H6 and C3H8 throughout the catalytic run. Furthermore, the stability of the NO conversion efficiency at 275 °C in the presence of oxygen (Figure 13b), compared with the continuous decline in the experiment without oxygen (Figure 12a), further suggests that oxygen supports the formation of more active sites thus addressing the catalyst deactivation caused by isocyanate formation.
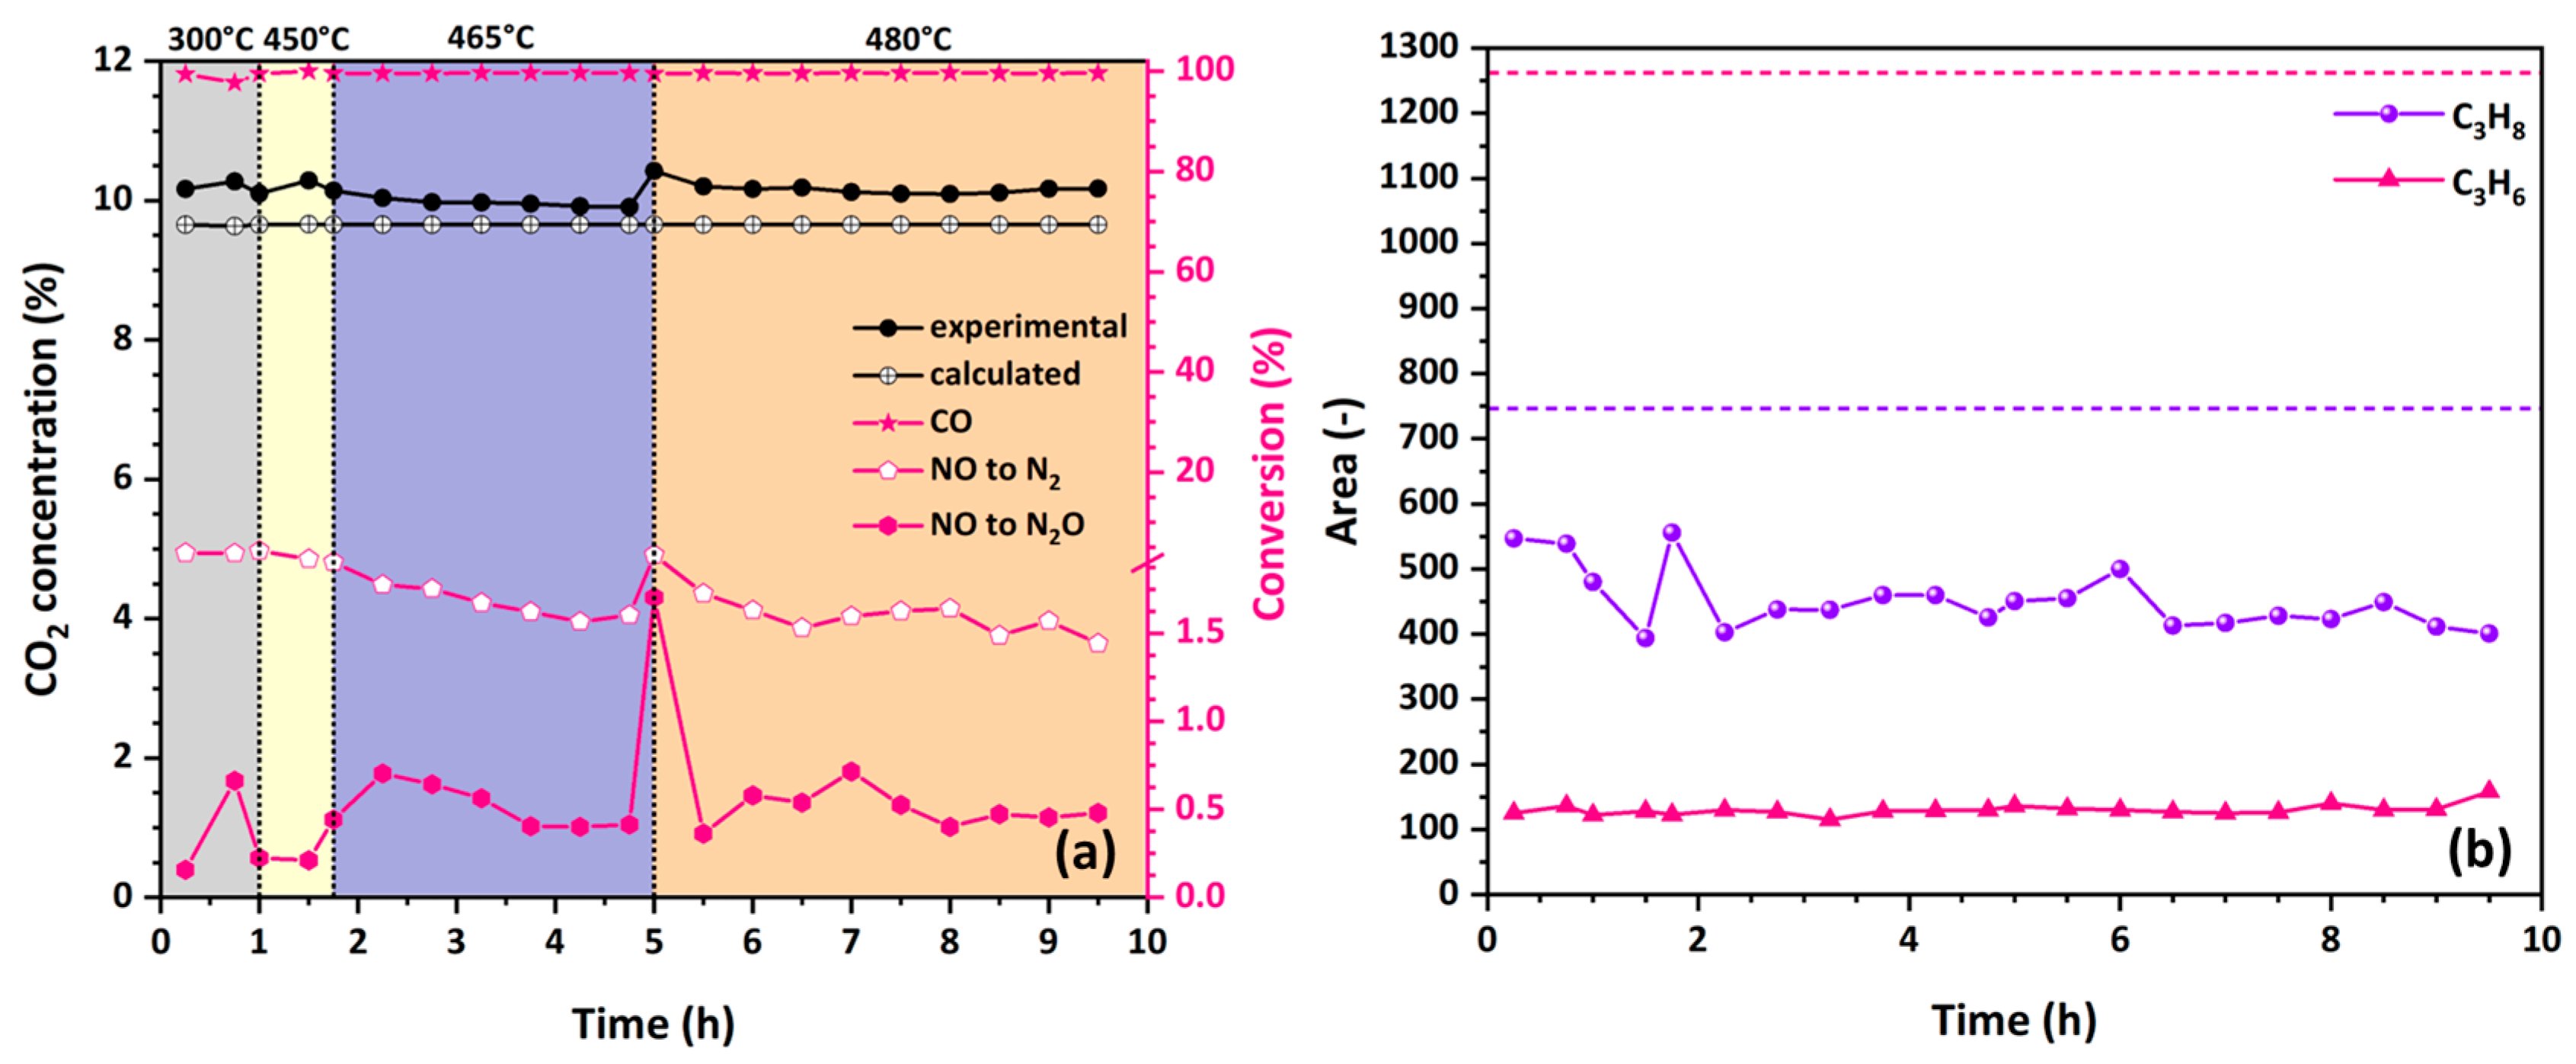
While moderate oxygen levels clearly enhance catalyst activity by stabilizing active copper sites and preventing deactivation, excessive oxygen concentrations can shift the reaction pathway toward NO oxidation to NO2, reducing N2 selectivity. High oxygen availability can also promote CO oxidation and hydrocarbon combustion, diverting reactants from NO reduction. This trade-off becomes evident in the HF1300 fiber experiment conducted under high-flow conditions with 40,000 ppm of oxygen in the gas stream, where the fibers achieved complete (100%) CO conversion, whereas most of the NO was oxidized to NO2. Conversely, the fibers also retained some of their reducing activity (Figure 15a) with a small portion of NO being converted to N2 and N2O (2% and 0.5%, respectively). The results indicated that the reducing activity and N2 selectivity were higher in the lower temperature range up to 300 °C but began to significantly decline above 450 °C.
The CO2 concentration in the gas stream exiting the catalytic reactor exceeded the value calculated from CO conversion, suggesting that, in addition to contributing to the oxidation of NO and CO, oxygen also promoted the conversion of small amounts of hydrocarbons present in the stream (Figure 15b). It likely also oxidized part of the carbon decorating the fibers.

3.4.4. Regeneration Efficiency

The highly active HF800 fibers underwent regeneration processes using helium and hydrogen at 300 °C. In the first case, a pure helium stream of 50 mL/min was applied for three consecutive days at 300 °C and in the second case, a gas mixture of 10% H2 in He was used under the same temperature, flow conditions and duration. Immediately following regeneration, the fibers were tested in catalytic NO reduction by CO at 300 °C and under low-flow conditions. The resulting performances were compared with that of the fresh fibers and they are illustrated in Figure 16.
It is evident that He regeneration can partially remove adsorbed species from the copper catalytic sites, particularly isocyanates, which are the primary cause of catalytic efficiency degradation. As observed in Figure 16a, the best NO conversion performance for the He-regenerated fibers occurred early during the transient stage, reaching 65%, whereas the performance of the fresh fibers under steady-state conditions was 48%. Notably, after He regeneration, the fiber performance decreased to the same level (48%), implying that the same catalytic copper sites were reoccupied and that the material did not experience further degradation. Additionally, the CO conversion efficiency of the He-regenerated fibers followed a similar trend to their NO conversion efficiency (Figure 16a), suggesting competition between CO and NO for the same adsorption sites. This explains the momentous-type response for CO, where the rate-limiting step is the simultaneous adsorption of reagents or the regeneration of active sites. The performance was significantly improved after regeneration with H2. The NO conversion efficiency of the H2-regenerated fibers during the transient stage remained higher than that achieved with the fresh and He-regenerated samples. This suggests that, in addition to facilitating the desorption of species responsible for deactivating copper sites, the reducing nature of H2 enhances the speciation of the copper sites, promoting higher activity. By using low oxygen concentrations, we were able to control in situ the valence state of copper (converting Cu0 to Cu+), thereby creating an optimal distribution of redox couples, which resulted in a consistently higher performance compared with the fibers tested without O2. In contrast, with H2 regeneration, part of the Cu2+ was converted to Cu+, optimizing the relative population of copper sites with different valence state ex situ. As a result, higher activity was observed only during the transient stage of the catalytic tests.
It is also worth noting that N2 selectivity is primarily influenced by the valence state and distribution of copper sites, rather than by the loss of active sites caused by the permanent adsorption of intermediate species. This is apparent from the fact that the N2 selectivity did not improve after He regeneration, while a substantial improvement and recovery of initial performance were achieved after H2 regeneration (Figure 16b).
Regarding CO2 evolution during the catalytic runs (Figure 16c), it is clear that for the H2-regenerated fibers, the experimental CO2 values remain higher than the calculated ones for a much longer period compared with both the fresh and the He-regenerated fibers. The decline in CO2 evolution, relative to the expected values based on CO conversion, is linked to the permanent attachment of CO to the active sites, leading to the formation of isocyanates. Thus, it can be concluded that the effect of H2 regeneration on the copper valence state results in copper sites with a weaker binding capacity for isocyanates.

4. Conclusions

In this study, two batches of composite carbon/ceramic hollow fibers decorated with copper nanoparticles were developed using alginate, a sustainable biopolymer, as the precursor. The fibers were fabricated through a facile cross-linking wet phase inversion process, followed by pyrolytic treatment. The influence of the pyrolytic conditions, including the surrounding environment and the final pyrolysis temperature, was investigated to elucidate the role of carbon in NO conversion performance. Their morphological and textural properties were strongly influenced by the pyrolysis conditions, particularly the carbon content. HF800, with a higher carbon content, exhibited a greater surface area and porosity, enhancing its catalytic performance in NO reduction by CO. It achieved complete NO conversion at lower temperatures, while HF1300 required higher temperatures. Co-deposited carbon facilitated oxygen adatom abstraction and influenced the reaction mechanisms, with HF800 displaying temperature-dependent shifts. Carbon also promoted the formation of well dispersed small copper nanoparticles, stabilizing them and determining the ratio of divalent to metallic copper, thereby indirectly enhancing catalytic activity.
Stability tests revealed that HF800 maintained superior NO conversion and N2 selectivity over time, with partial regeneration despite deactivation by isocyanate species. In contrast, HF1300 suffered irreversible deactivation likely due to strong N2O adsorption on copper sites. Oxygen played a crucial role in maintaining copper’s optimal valence state, enhancing NO conversion while mitigating catalyst deactivation. At low concentrations, it regulated the valence state of copper, facilitating transient Cu2+/Cu+ and Cu+/Cu0 redox couples, while at higher levels, it reinforced oxidative activity. However, the fibers exhibited slight reducing activity, which was pronounced at lower temperatures.
Finally, regeneration tests confirmed HF800′s superior recovery, with helium removing adsorbed species and hydrogen effectively restoring catalytic activity by not only eliminating isocyanate species but also controlling the relative ratio of copper redox states. These findings demonstrate that high-carbon-content fibers exhibit superior catalytic performance and enhanced regeneration potential, making them promising candidates for NO reduction applications.

Author Contributions

Conceptualization, F.K.K. and G.E.R.; methodology, G.V.T., S.K.P. and K.G.B.; validation, G.V.T., S.K.P. and K.G.B.; formal analysis, G.V.T. and G.E.R.; investigation, G.V.T. and S.K.P.; resources, F.K.K. and G.E.R.; data curation, G.V.T., F.K.K. and G.E.R.; writing—original draft preparation, G.V.T. and G.E.R.; writing—review and editing, S.K.P., F.K.K. and K.G.B.; visualization, G.V.T.; supervision, K.G.B. and G.E.R. All authors have read and agreed to the published version of the manuscript.

Funding

This research received no external funding.

Data Availability Statement

Data available on request from the authors.

Conflicts of Interest

The authors declare no conflicts of interest.

References

  1. Vermisoglou, E.C.; Romanos, G.E.; Karanikolos, G.N.; Kanellopoulos, N.K. Catalytic NOx removal by single-wall carbon nanotube-supported Rh nanoparticles. J. Hazard. Mater. 2011, 194, 144–155. [Google Scholar] [CrossRef]
  2. Wei, Y.; Yang, W.; Caro, J.; Wang, H. Dense ceramic oxygen permeable membranes and catalytic membrane reactors. Chem. Eng. J. 2013, 220, 185–203. [Google Scholar] [CrossRef]
  3. Fang, S.; Takagaki, A.; Watanabe, M.; Ishihara, T. The direct decomposition of NO into N2 and O2 over copper doped Ba3Y4O9. Catal. Sci. Technol. 2020, 10, 2513–2522. [Google Scholar] [CrossRef]
  4. Wang, J.; Ji, S.; Yang, J.; Zhu, Q.; Li, S. Mo2C and Mo2C/Al2O3 catalysts for NO direct decomposition. Catal. Commun. 2005, 6, 389–393. [Google Scholar] [CrossRef]
  5. Xie, P.; Ji, W.; Li, Y.; Zhang, C. NO direct decomposition: Progress, challenges and opportunities. Catal. Sci. Technol. 2021, 11, 374–391. [Google Scholar] [CrossRef]
  6. Tomašić, V. Application of the monoliths in DeNOx catalysis. Catal. Today 2007, 119, 106–113. [Google Scholar] [CrossRef]
  7. Roy, S.; Hegde, M.S.; Madras, G. Catalysis for NOx abatement. Appl. Energy 2009, 86, 2283–2297. [Google Scholar] [CrossRef]
  8. Izquierdo, R.; Rodríguez, L.J.; Añez, R.; Sierraalta, A. Direct catalytic decomposition of NO with Cu–ZSM-5: A DFT–ONIOM study. J. Mol. Catal. A Chem. 2011, 348, 55–62. [Google Scholar] [CrossRef]
  9. Karásková, K.; Pacultová, K.; Bilková, T.; Fridrichová, D.; Koštejn, M.; Peikertová, P.; Stelmachowski, P.; Kukula, P.; Obalová, L. Effect of zinc on the structure and activity of the cobalt oxide catalysts for NO decomposition. Catalysts 2023, 13, 18. [Google Scholar] [CrossRef]
  10. Skalska, K.; Miller, J.S.; Ledakowicz, S. Trends in NOx abatement: A review. Sci. Total Environ. 2010, 408, 3976–3989. [Google Scholar] [CrossRef]
  11. De Rosa, M.; Campa, M.C.; Pietrogiacomi, D.; Marpurgo, S. A DFT study on Cu-ZSM-5 as a catalyst for NO decomposition: Possible activity of a Cu(I) pair located at the T3 tetrahedral sites. Mol. Catal. 2024, 559, 114083. [Google Scholar] [CrossRef]
  12. Houel, V.; James, D.; Millington, P.; Pollington, S.; Poulston, S.; Rajaram, R.; Torbati, R. A comparison of the activity and deactivation of Ag/Al2O3 and Cu/ZSM-5 for HC-SCR under simulated diesel exhaust emission conditions. J. Catal. 2005, 230, 150–157. [Google Scholar] [CrossRef]
  13. Burch, R.; Breen, J.P.; Meunier, F.C. A review of the selective reduction of NOx with hydrocarbons under lean-burn conditions with non-zeolitic oxide and platinum group metal catalysts. App. Catal. B Environ. 2002, 39, 283–303. [Google Scholar] [CrossRef]
  14. Liu, M.; Zhao, Y.; Zhao, H.; Li, X.; Ma, Y.; Yong, X.; Chen, H.; Li, Y. The promotion effect of nickel and lanthanum on Cu-ZSM-5 catalyst in NO direct decomposition. Catal. Today 2019, 327, 203–209. [Google Scholar] [CrossRef]
  15. Patel, A.; Shukla, P.; Chen, J.; Rufford, T.E.; Wang, S.; Rudolph, V.; Zhu, Z. Structural sensitivity of mesoporous alumina for copper catalyst loading used for NO reduction in presence of CO. Chem. Eng. Res. Des. 2015, 101, 27–43. [Google Scholar] [CrossRef]
  16. Rico, M.J.O.; Moreno-Tost, R.; Jiménez-López, A.; Rodríguez-Castellón, E.; Pereñíguez, R.; Caballero, A.; Holgado, J.P. Study of nanoporous catalysts in the selective catalytic reduction of NOx. Catal. Today 2010, 158, 78–88. [Google Scholar] [CrossRef]
  17. Zhu, H.; Shen, M.; Gao, F.; Kong, Y.; Dong, L.; Chen, Y.; Jian, C.; Liu, Z. A study of CuO/CeO2/Al–Zr–O in “NO + CO”. Catal. Commun. 2004, 5, 453–456. [Google Scholar] [CrossRef]
  18. Tsujimoto, S.; Nishimura, C.; Masui, T.; Imanaka, N. Direct decomposition of nitrogen monoxide on (Ho, Zr, Pr)2O3+δ catalysts. Catal. Commun. 2014, 43, 84–87. [Google Scholar] [CrossRef]
  19. Iwakuni, H.; Shinmyou, Y.; Yano, H.; Matsumoto, H.; Ishihara, T. Direct decomposition of NO into N2 and O2 on BaMnO3-based perovskite oxides. Appl. Catal. B Environ. 2007, 74, 299–306. [Google Scholar] [CrossRef]
  20. Haneda, M.; Kintaichi, Y.; Nakamura, I.; Fujitani, T.; Hamada, H. Comprehensive study combining surface science and real catalyst for NO direct decomposition. Chem. Commun. 2002, 2816–2817. [Google Scholar] [CrossRef] [PubMed]
  21. Teraoka, Y.; Torigoshi, K.-I.; Yamaguchi, H.; Ikeda, T.; Kagawa, S. Direct decomposition of nitric oxide over stannate pyrochlore oxides: Relationship between solid-state chemistry and catalytic activity. J. Mol. Catal. A Chem. 2000, 155, 73–80. [Google Scholar] [CrossRef]
  22. Masui, T.; Uejima, S.; Tsujimoto, S.; Imanaka, N. Direct decomposition of NO into N2 and O2 over C-Type Cubic Y2O3-Tb4O7-ZrO2. Mat. Sci. Appl. 2012, 3, 733–738. [Google Scholar]
  23. Cónsul, J.M.D.; Peralta, C.A.; Benvenutti, E.V.; Ruiz, J.A.C.; Pastore, H.O.; Baibich, I.M. Direct decomposition of nitric oxide on alumina-modified amorphous and mesoporous silica-supported palladium catalysts. J. Mol. Catal. A Chem. 2006, 246, 33–38. [Google Scholar] [CrossRef]
  24. Gómez-García, M.A.; Pitchon, V.; Kiennemann, A. Pollution by nitrogen oxides: An approach to NOx abatement by using sorbing catalytic materials. Environ. Int. 2005, 31, 445–467. [Google Scholar] [CrossRef]
  25. Ramalho, P.S.F.; Soares, O.S.G.P.; Figueiredo, J.L.; Pereira, M.F.R. Catalytic reduction of NO over copper supported on activated carbon. Catal. Today 2023, 418, 114044. [Google Scholar] [CrossRef]
  26. Niu, J.; Zhang, H.; Li, L.; Guo, Y. Cost-effective activated carbon (AC) production from partial substitution of coal with red mud (RM) as additive for SO2 and NOx abatement at low temperature. Fuel 2021, 293, 120448. [Google Scholar] [CrossRef]
  27. Li, Z.; Yang, X.; Song, Q. Deactivation of activated carbon during low-temperature NO adsorption-regeneration cycles. Sep. Purif. Technol. 2025, 377, 134380. [Google Scholar] [CrossRef]
  28. Sharif, H.M.A.; Li, T.; Mahmood, N.; Ahmad, M.; Xu, J.; Mahmood, A.; Djellabi, R.; Yang, B. Thermally activated epoxy-functionalized carbon as an electrocatalyst for efficient NOx reduction. Carbon 2021, 182, 516–524. [Google Scholar] [CrossRef]
  29. Wan, J.; Xu, W.; Zhang, X.; Jia, X.; Zhang, C. Study and application of nitric-acid-modified activated carbon fiber on nitrogen oxide adsorption performance. Processes 2025, 13, 760. [Google Scholar] [CrossRef]
  30. Santillan-Jimenez, E.; Miljković-Kocić, V.; Crocker, M.; Wilson, K. Carbon nanotube-supported metal catalysts for NOx reduction using hydrocarbon reductants. Part: 1 catalyst preparation, characterization and NOx reduction characteristics. Appl. Catal. B Environ. 2011, 102, 1–8. [Google Scholar] [CrossRef]
  31. Li, Q.; Yang, H.; Qiu, F.; Zhang, X. Promotional effects of carbon nanotubes on V2O5/TiO2 for NOx removal. J. Hazard. Mater. 2011, 192, 915–921. [Google Scholar] [CrossRef]
  32. Dasireddy, V.D.B.C.; Likozar, B. Selective catalytic reduction of NOx by CO over bimetallic transition metals supported by multi-walled carbon nanotubes (MWCNT). Chem. Eng. J. 2017, 326, 886–900. [Google Scholar] [CrossRef]
  33. Lu, X.; Song, C.; Jia, S.; Tong, Z.; Tang, X.; Teng, Y. Low-temperature selective catalytic reduction of NOx with NH3 over cerium and manganese oxides supported on TiO2–graphene. Chem. Eng. J. 2015, 260, 776–784. [Google Scholar] [CrossRef]
  34. Sousa, J.P.S.; Pereira, M.F.R.; Figueiredo, J.L. NO oxidation over nitrogen doped carbon xerogels. Appl. Catal. B Environ. 2012, 125, 398–408. [Google Scholar] [CrossRef]
  35. García-García, F.R.; Li, K. New catalytic reactors prepared from symmetric and asymmetric ceramic hollow fibres. Appl. Catal. A Gen. 2013, 456, 1–10. [Google Scholar] [CrossRef]
  36. Yakoumis, I.; Theodorakopoulos, G.; Papageorgiou, S.K.; Romanos, G.; Veziri, C.; Panias, D. Tubular C/Cu decorated γ-alumina membranes for NO abatement. J. Membr. Sci. 2016, 515, 134–143. [Google Scholar] [CrossRef]
  37. Tan, X.; Li, K. Inorganic hollow fibre membranes in catalytic processing. Curr. Opin. Chem. Eng. 2011, 1, 69–76. [Google Scholar] [CrossRef]
  38. García-Vázquez, M.; Marín, P.; Ordóñez, S.; Li, K.; Tan, J.; Zhang, G.; García-García, F.R. Scaling up a hollow fibre reactor: A study on non-PGM hollow fibre after-treatments for methane emission control under extreme conditions. J. Environ. Chem. Eng. 2021, 9, 106880. [Google Scholar] [CrossRef]
  39. Wang, H.; Tablet, C.; Schiestel, T.; Werth, S.; Caro, J. Partial oxidation of methane to syngas in a perovskite hollow fiber membrane reactor. Catal. Commun. 2006, 7, 907–912. [Google Scholar] [CrossRef]
  40. Theodorakopoulos, G.V.; Romanos, G.E.; Katsaros, F.K.; Papageorgiou, S.K.; Kontos, A.G.; Spyrou, K.; Beazi-Katsioti, M.; Falaras, P. Structuring efficient photocatalysts into bespoke fiber shaped systems for applied water treatment. Chemosphere 2021, 277, 130253. [Google Scholar] [CrossRef]
  41. Theodorakopoulos, G.V.; Papageorgiou, S.K.; Katsaros, F.K.; Romanos, G.E.; Beazi-Katsioti, M. Investigation of MO adsorption kinetics and photocatalytic degradation utilizing hollow fibers of Cu-CuO/TiO2 nanocomposite. Materials 2024, 17, 4663. [Google Scholar] [CrossRef] [PubMed]
  42. Hartmann, H.; Boddenberg, B. Copper exchanged zeolites studied with 13C and 129Xe NMR of adsorbed carbon monoxide and xenon. Stud. Surf. Sci. Catal. 1994, 84, 509–517. [Google Scholar] [CrossRef]
  43. Halasz, I.; Brenner, A.; Shelef, M.; Ng, K.Y.S. Decomposition of nitric oxide and its reduction by CO over superconducting and related cuprate catalysts. Catal. Lett. 1991, 11, 327–334. [Google Scholar] [CrossRef]
  44. Shelef, M.; Gandhi, H.S. Ammonia formation in catalytic reduction of nitric oxide by molecular hydrogen. I. Base metal oxide catalysts. Ind. Eng. Chem. Prod. Res. Dev. 1972, 11, 2–11. [Google Scholar] [CrossRef]
  45. London, J.W.; Bell, A.T. A simultaneous infrared and kinetic study of the reduction of nitric oxide by carbon monoxide over copper oxide. J. Catal. 1973, 31, 96–109. [Google Scholar] [CrossRef]
  46. Buccuzzi, F.; Guglielminotti, E.; Martra, G.; Cerrato, G. Nitric oxide reduction by CO on Cu/TiO2 catalysts. J. Catal. 1994, 146, 449–459. [Google Scholar] [CrossRef]
  47. Rewick, R.T.; Wise, H. Reduction of nitric oxide by carbon monoxide on copper catalysts. J. Catal. 1975, 40, 301–311. [Google Scholar] [CrossRef]
  48. Tsoncheva, T.; Nickolov, R.; Mehandjiev, D. Effect of chromium on copper containing activated carbon catalysts for methanol decomposition. React. Kinet. Catal. Lett. 2001, 72, 383–390. [Google Scholar] [CrossRef]
  49. Li, D.; Yu, Q.; Li, S.-S.; Wan, H.-Q.; Liu, L.-J.; Qi, L.; Liu, B.; Gao, F.; Dong, L.; Chen, Y. The remarkable enhancement of CO-pretreated CuO-Mn2O3/γ-Al2O3 supported catalyst for the reduction of NO with CO: The formation of surface synergetic oxygen vacancy. Chem. Eur. J. 2011, 17, 5668–5679. [Google Scholar] [CrossRef]
  50. Zecchina, A.; Cerruti, L.; Borrello, E. An infrared study of nitrous oxide adsorption on α-chromia. J. Catal. 1972, 25, 55–64. [Google Scholar] [CrossRef]
  51. Selef, M.; Otto, K. Appearance of N2O in the catalytic reduction of NO by CO. J. Catal. 1968, 10, 408–412. [Google Scholar] [CrossRef]
  52. Petunchi, J.O.; Hall, W.K. Effects of selective reduction of nitric oxide on zeolite structure. Appl. Catal. B Environ. 1994, 3, 239–257. [Google Scholar] [CrossRef]
  53. Ansell, G.P.; Diwell, A.F.; Golunski, S.E.; Hayes, J.W.; Rajaram, R.R.; Truex, T.J.; Walker, A.P. Mechanism of the lean NOx reaction over Cu/ZSM-5. Appl. Catal. B Environ. 1993, 2, 81–100. [Google Scholar] [CrossRef]
  54. Lukyanov, D.B.; Sill, G.; Ditri, J.L.; Hall, W.K. Comparison of catalyzed and homogeneous reactions of hydrocarbons for selective catalytic reduction (SCR) of NOx. J. Catal. 1995, 153, 265–274. [Google Scholar] [CrossRef]
  55. Ditri, J.L.; Sachtler, W.M.H. Reduction of NO over impregnated Cu/ZSM-5 in the presence of O2. Catal. Lett. 1992, 15, 289–295. [Google Scholar] [CrossRef]
  56. Kucherov, A.V.; Kucherova, T.N.; Slinkin, A.A. Alkane oxidation on isolated Cu2+ ions in zeolitic matrix: A relation between catalytic activity and Cu2+-site local topography. Catal. Lett. 1991, 10, 289–296. [Google Scholar] [CrossRef]
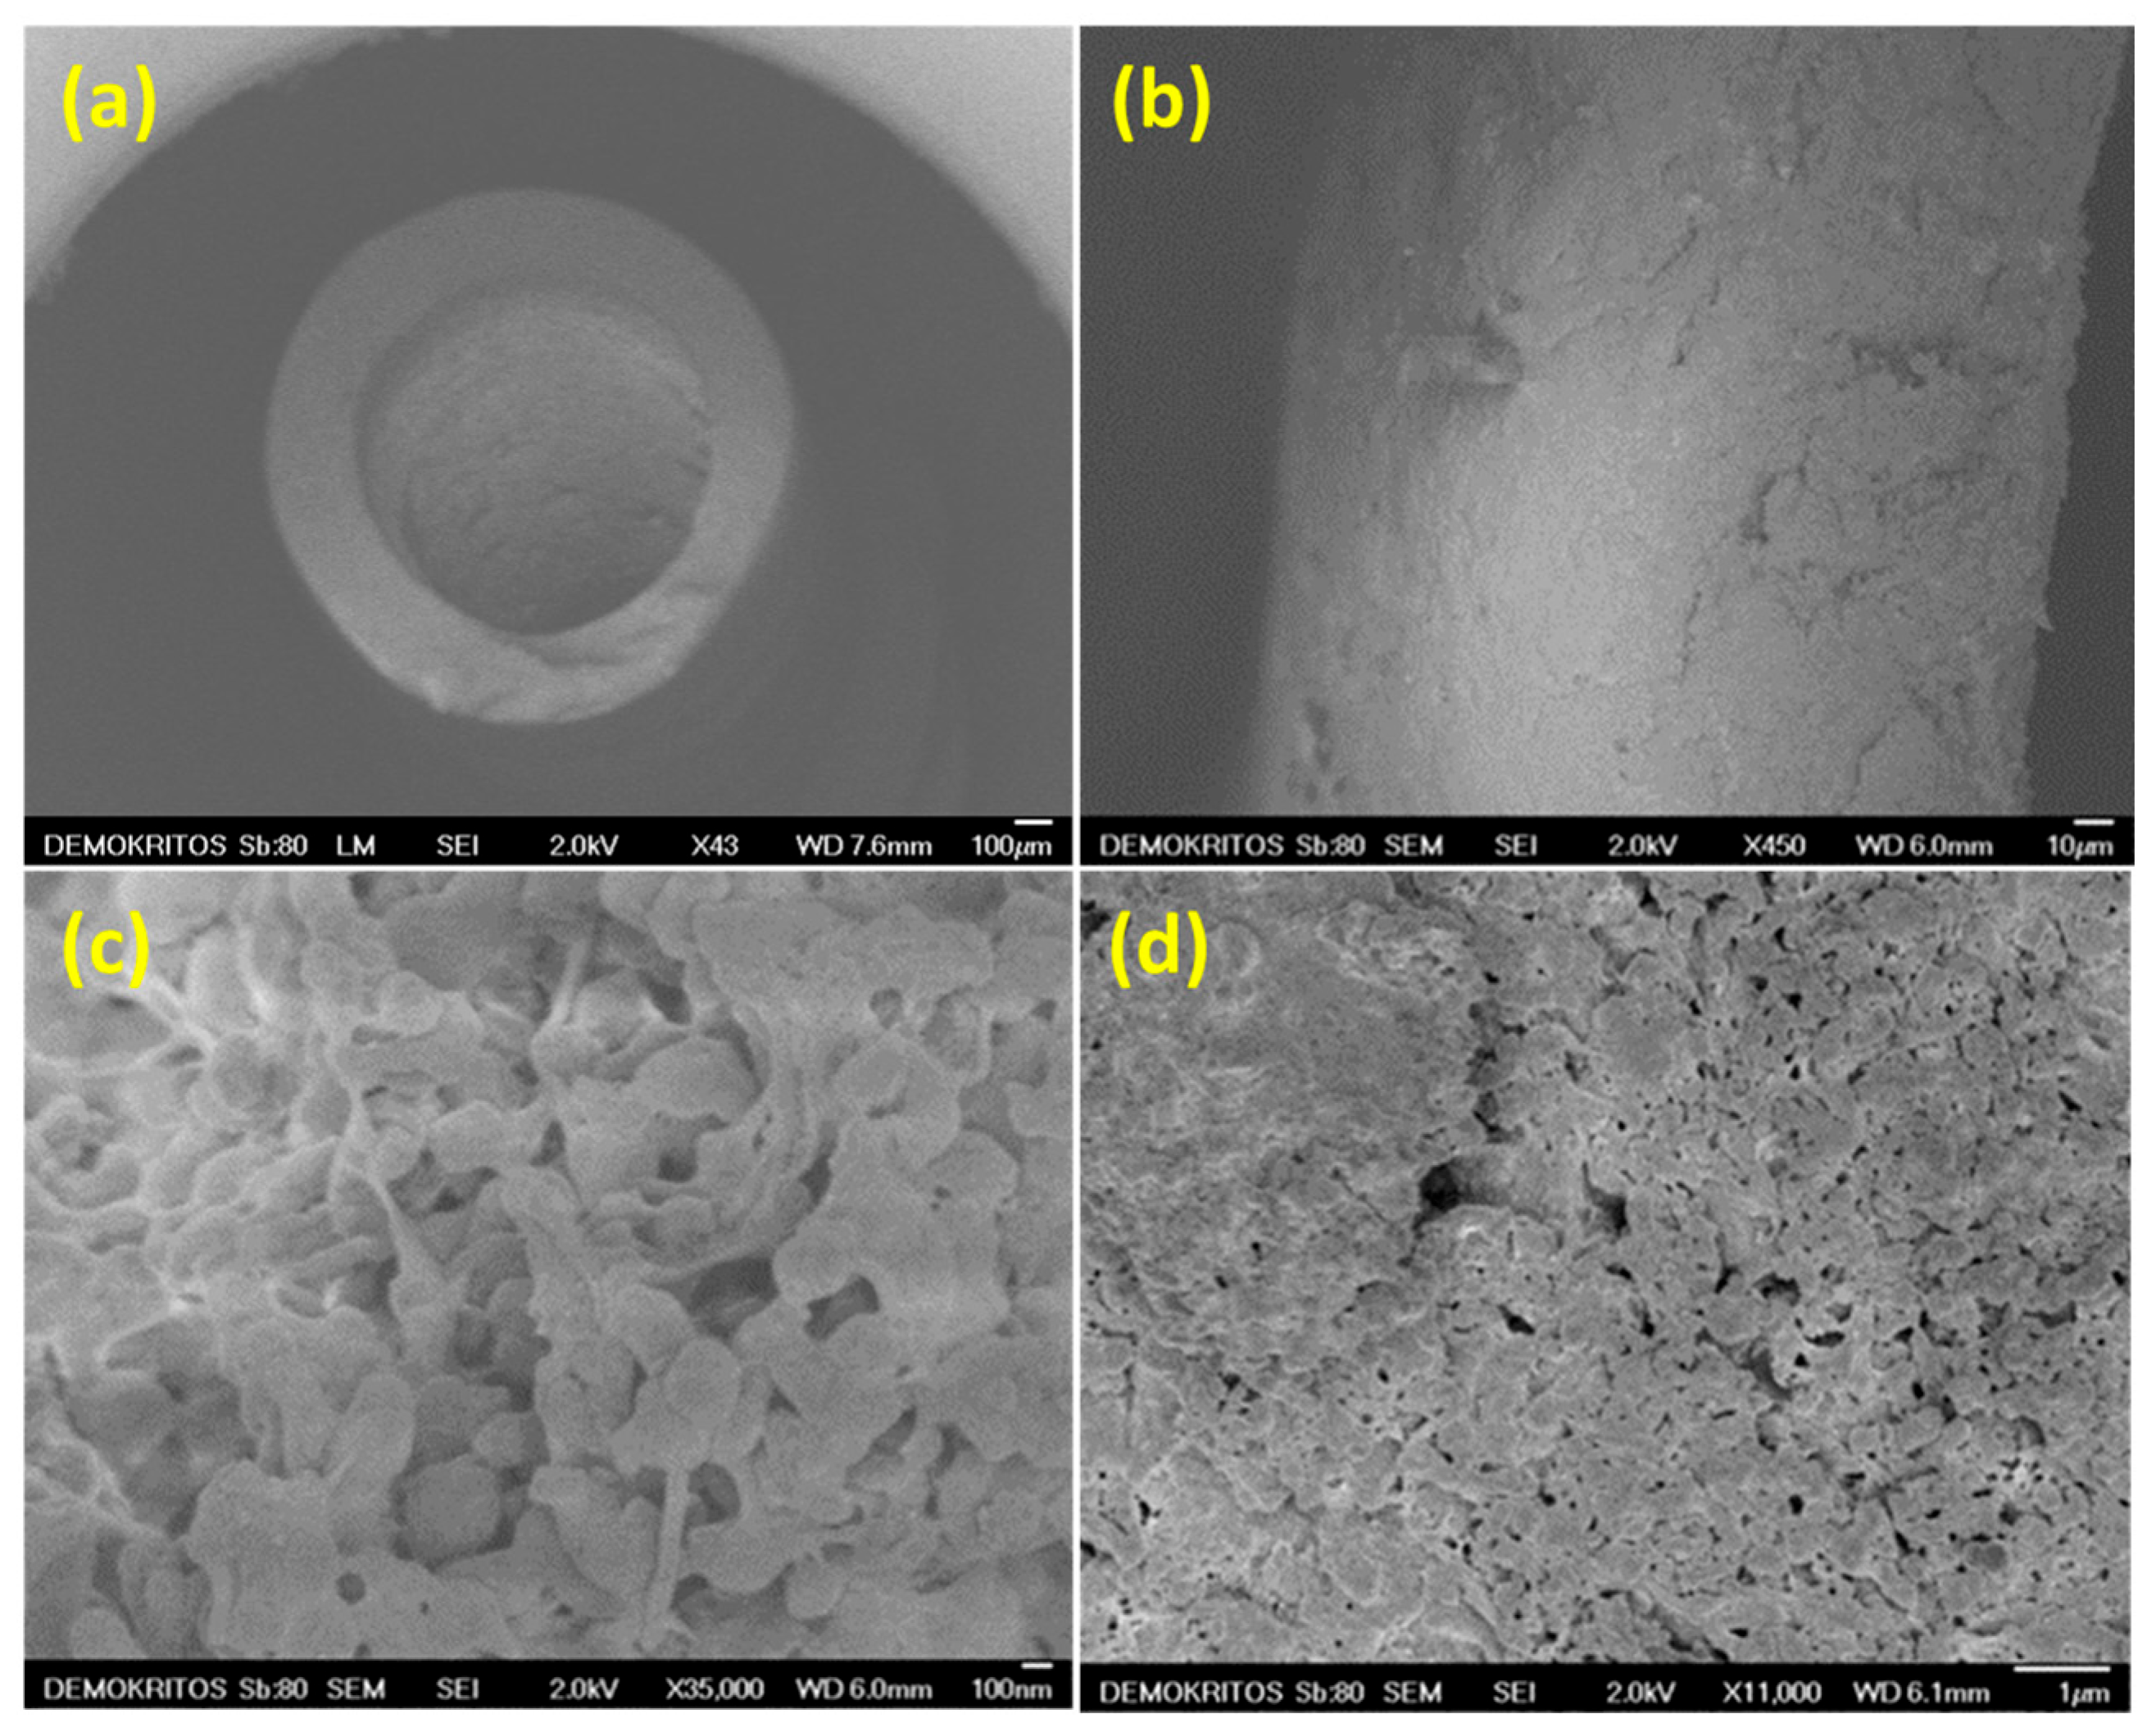
Figure 1. SEM images of the polymeric precursor HF: (a) cross-section; (b) wall structure; (c) outer sidewall surface; (d) middle region of the shell surface.
Fibers 13 00112 g001
Figure 2. SEM images of the HF800 sample: (a) wall surface; (b) inner surface of the side wall; (c,d) down wall surface.
Fibers 13 00112 g002
Figure 3. SEM images of the HF1300 sample: (a) side wall; (b) higher magnification of the upper wall surface; (c) outer wall surface; (d,e) middle region of the side wall; (f) upper region of the wall; (g,h) higher magnifications of the external surface of the upper wall.
Fibers 13 00112 g003
Figure 4. TGA plots of the fresh and spent: (a) HF800 and (b) HF1300 samples; (c) EDX spectrum of the HF1300 sample following catalytic testing.
Fibers 13 00112 g004
Figure 5. WAXS patterns of fresh and spent HF800, along with spent HF1300 samples.
Fibers 13 00112 g005
Figure 6. (a) Performance of fresh HF800 during the initial phase of the catalytic run; (b) CO2 concentration in the gas stream exiting the reactor.
Fibers 13 00112 g006
Figure 7. Schematic diagram of the reaction mechanism.
Fibers 13 00112 g007
Figure 8. (a) Performance of the fresh HF800 fibers during the initial stage of the catalytic run in the absence of CO; (b) calculated and experimental CO2 concentration at the reactor outlet in the absence of CO, with the calculated concentration matching the CO2 content in the reactor feed.
Fibers 13 00112 g008
Figure 9. (a) Performance of the fresh HF1300 fibers during the initial stage of the catalytic run; (b) calculated and experimental CO2 concentration in the gas stream exiting the reactor.
Fibers 13 00112 g009
Figure 10. Reactant and product concentrations at the reactor outlet for (a) fresh HF800 fibers at low flow; (b) HF800 fibers at low flow after 64 h on stream; (c) HF800 fibers at high flow after 68 h on stream.
Fibers 13 00112 g010
Figure 11. Short time response of reactant and product concentrations at the reactor outlet for fresh samples: (a) HF800 at 250 °C; (b) HF800 at 275 °C; (c) HF1300 at 300 °C; (d) HF1300 at 450 °C.
Fibers 13 00112 g011
Figure 12. Extended catalytic tests at various temperatures under low-flow and high-flow conditions, respectively, for (a,b) HF800 and (c,d) HF1300 fibers. Vertical dotted lines separate intervals corresponding to different reaction temperatures.
Fibers 13 00112 g012
Figure 13. Extended catalytic test of HF800 fibers: (a) without CO; (b) with 1000 ppm of O2 in the gas stream. Vertical dotted lines separate intervals corresponding to different reaction temperatures and flow conditions.
Fibers 13 00112 g013
Figure 14. (a) Calculated vs. experimentally measured CO2 concentration at the reactor outlet in the presence of O2; (b) chromatographic areas of C3H6 and C3H8 in the reactor exhaust compared with the feed gas analysis.
Fibers 13 00112 g014
Figure 15. (a) Performance of HF1300 fibers in a gas stream with 40,000 ppm O2; (b) chromatographic analysis of C3H6 and C3H8 showing significant reductions in their concentrations in the reactor effluent.
Fibers 13 00112 g015
Figure 16. (a) NO and CO conversion efficiencies of He- and H2-regenerated fibers versus fresh fibers. (b) N2 and N2O selectivities. (c) Calculated and experimental CO2 concentrations at the reactor exhaust for fresh, He- and H2-regenerated fibers. The circle, square and star symbols correspond to fresh, He- and H2-regenerated fibers, respectively.
Fibers 13 00112 g016
Table 1. Pore characteristics of samples.
SampleConditionTPV 1SBETPorosity εdmean 2
(mL/g)(m2/g)(%)(nm)
HF800fresh0.1968.443.692.7
spent0.09315.826.823.5
HF1300fresh0.1404.538.5124.4
spent0.0885.725.962.4
1 Total pore volume at 0.99. 2 Mean pore size dmean calculated as 4000xTPV/SBET. The standard deviation of the SBET and TPV is ±5% for both parameters.
Disclaimer/Publisher’s Note: The statements, opinions and data contained in all publications are solely those of the individual author(s) and contributor(s) and not of MDPI and/or the editor(s). MDPI and/or the editor(s) disclaim responsibility for any injury to people or property resulting from any ideas, methods, instructions or products referred to in the content.