Article

The Significance of Multi-Size Carbon Fibers on the Mechanical and Fracture Characteristics of Fiber Reinforced Cement Composites

by
Mohammed Abdellatef
1,
Daniel Heras Murcia
2,
Joshua Hogancamp
1,
Edward Matteo
1,
John Stormont
2 and
Mahmoud M. Reda Taha
2,*
1
Sandia National Laboratories, Albuquerque, NM 87123, USA
2
Department of Civil, Construction & Environmental Engineering, University of New Mexico, Albuquerque, NM 87131, USA
*
Author to whom correspondence should be addressed.
Fibers 2022, 10(8), 65; https://doi.org/10.3390/fib10080065
Submission received: 15 April 2022 / Revised: 12 July 2022 / Accepted: 20 July 2022 / Published: 28 July 2022
(This article belongs to the Collection Feature Papers in Fibers)

Abstract

:
One of the main challenges of using a high fiber volume content in a cement composite is the narrow margin of fiber volume content beyond which fibers can cause an adverse effect on the mechanical properties. In this paper, the significance of fiber size distribution and fiber volume content of different proportions of chopped and milled carbon microfibers are investigated. The mixes’ flowability showed improvement with altering the fiber size distribution despite having a high fiber content. Uniaxial compression cylinders and unnotched and notched beams were cast and then tested at 7 and 28 days of age. It was found that the compressive strength is significantly affected by fiber size distribution more than fiber volume content. On the other hand, the modulus of rupture and fracture toughness are proportional to the fiber volume content with little effect of fiber size distribution. Finally, neither high fiber volume content nor altered fiber size distribution significantly affected the elastic modulus of the fiber cement composites.

1. Introduction

The quasi-brittle nature of cementitious composite materials leads to cracking under service conditions, which produces deterioration in the matrix and can result in corrosion of the reinforcement. Carbon nanofibers have been used to enhance the properties of cementitious composites [1,2,3]. One way to control crack size is by incorporating short fibers inside the matrix. Successful uses of several types of fibers, including steel, polyvinyl alcohol, polypropylene, and carbon fibers, have been reported in the literature [4,5,6,7,8,9,10]. Fibers showed the ability to reduce the crack size, proportionally to the fiber diameter [11], and improve durability. Fibers were also able to improve the mechanical properties of the cementitious composites with minimum effect on compressive strength [12,13], but significant improvement in tensile and flexural strengths, and fracture toughness [14,15].
Several researchers investigated the effect of carbon nanofibers, carbon microfibers, and carbon nanotubes on the mechanical properties of cementitious composites. For carbon nanofibers and carbon nanotubes, it was observed that small concentrations of up to about 0.3% by weight of cement improve both compressive and tensile strength, density, and hardness of the cementitious composite [16,17,18,19,20,21,22,23,24]. In comparison, concentrations higher than those mentioned above would have a negligible or negative effect on the mechanical properties, and specifically on the compressive strength [21,25,26]. This negative effect of relatively high quantities of fibers was primarily attributed to the challenge in achieving good dispersion of the high volume fibers in the cement matrix [27,28,29]. This leads to mixtures with low flowability that entrap air leading to poor mechanical properties. Researchers showed that such an effect could be mitigated by incorporating small particles, such as silica fume, along with superplasticizers [30]. It has also been hypothesized that, for high fiber volume content, there is a direct effect between matrix compactness, and its evolution with time, and the performance of the fiber reinforced cement composites. This is due to the increase of fiber-matrix friction energy dissipation exceeding fiber plasticization energy dissipation [31,32].
Researchers reported entanglement of fibers in hairball-like structures to be one primary challenge while mixing large volumes of fibers in cement [2,20,25,33,34,35,36]. It was hypothesized that two interacting effects take place and result in a negative impact on mechanical and fracture characteristics of cementitious composites reinforced with entangled fibers. The first is the creation of internal flaws within the clumps of fibers where the cement paste cannot flow to fill. This results in potentially creating voids or points for crack initiation. The second is the inherent weakness of the cementitious matrix’s unreinforced regions due to the fibers’ uneven distribution, which facilitates crack propagation [2]. To break this tangled structure, several methods have been recommended for fiber dispersion, such as sonication in an aqueous solution (e.g., superplasticizer) [20,25,33,34,35,36], mechanical dispersion of fibers within cementitious particles [1,2], and growing and synthesizing the carbon nanofibers and carbon nanotubes on cement particles [30,37,38,39,40,41].
The efficiency of fiber dispersion was also found to correlate with the particle size distribution of the cement particles used [42,43], since fibers cannot occupy the same space as cement grains causing geometrical clustering [2], which in turn dictate the maximum efficiency of dispersion that could be achieved [2,42]. However, such findings gave new insight into approaching the dispersion problem and motivated researchers to investigate the relation between fiber size distribution and cement particle distribution. Researchers suggested using microfine cement to improve the efficiency of fiber dispersion in cementitious composites [2].
For single crack failure under tension, the energy criteria would uniquely govern the response. For carbon microfibers, the maximum fracture energy for the same fiber content could be obtained by using fiber with a length equal to the critical length l c for the same fiber content [3]. However, multiple other factors also compete to achieve higher fracture energy, such as fiber content [44]. The critical length l c is defined as the length at which the fiber would experience pullout with possible gradual debonding. There is also a minimum bond length needed to prevent catastrophic bond failure l p , which is estimated to be 5% to 10% of l c [45].
The design for an experimental investigative program that would highlight the effect of including different types of fibers and/or nanotubes is also a challenging task. Since the spectrum to be studied is infinite, including parameters such as fiber total volume and ratio of different type of fibers, other sets of constraints must be applied. Some researchers fixed the total fiber volume [45,46,47], while others opted to achieve some form of fiber content maximization with dispersion [20,23,48,49].
Recent literature [1,47] indicates limited research work investigating hybrid carbon fibers in cement matrix. It also shows the little research that relates macro mechanical and fracture properties of fiber cement composites to variable fiber compositions. Yao et al. [50] investigated a hybrid use of carbon, steel, and polypropylene fibers at a low fiber volume content of 0.50%. The fibers had different geometrical and mechanical properties. It was observed that, for the same fiber volume content, the mechanical properties such as compressive strength, splitting strength, modulus of rupture, and flexural toughness are dependent on the composition of the fiber. Metaxa et al. [48] investigated the use of hybrid carbon nanofibers (4.80% by cement weight) and polyvinyl alcohol microfibers (5.40% by cement weight). It was observed that the carbon nanofibers had a high impact on mechanical properties such as modulus or rupture, elastic modulus, and fracture toughness. In comparison, polyvinyl alcohol microfibers had a high impact on post-peak response and ductility. Hammed et al. [51] investigated the use of hybrid amorphous metal (6.21% by cement weight) and carbon steel fibers (6.21% by cement weight) in uniaxial tension specimens. It was observed that hybrid fiber specimens exhibited resistance to both micro and macro cracking mechanisms, which improved the mechanical resistance compared with specimens with each fiber type used separately. Stynoski et al. [23] studied the effect of silica additives on fracture properties. The mixes investigated had hybrid carbon nanotubes (0.05% fiber content) and carbon fibers (0.25% fiber content). Mechanical properties such as flexural strength and modulus of elasticity, along with fracture toughness showed correlation to the composition of fibers. Shu et al. [45] investigated the use of hybrid micro carbon fibers and macro carbon fibers. The specimens tested had 2.00% fiber content of each type separately, 1.00% of each type combined, and 2.00% of each type combined. The tested specimens did not show a significant difference in compressive strength, but the hybrid-fiber mixes improved the fracture resistance.
This paper explores the significance of fiber size distribution to improve the fracture and mechanical and fracture properties of fiber-reinforced cementitious composites. Chopped Carbon Microfibers (CCMF), with 7.2 μm diameter and lengths of 3 and 6 mm, and Milled Carbon Microfibers (MCMF), with 7.2 μm diameter and length of 150 and 200 μm, were used with different fiber volume content to introduce multi-size fibers in the cementitious matrix. The fresh mixes were designed first by investigating the effect of fiber volume content and fiber size distribution on the cement composites’ flowability. This allowed down selecting a few mixtures with similar fiber volume fraction, with different fiber size distribution, then increasing the fiber volume fraction until achieving a similar flowability. The mixes selected were then examined in terms of mechanical behavior. Compressive strength, elastic modulus, modulus of rupture, and fracture toughness were evaluated. All tests were performed at 7 and 28 days of age.

2. Experimental Program
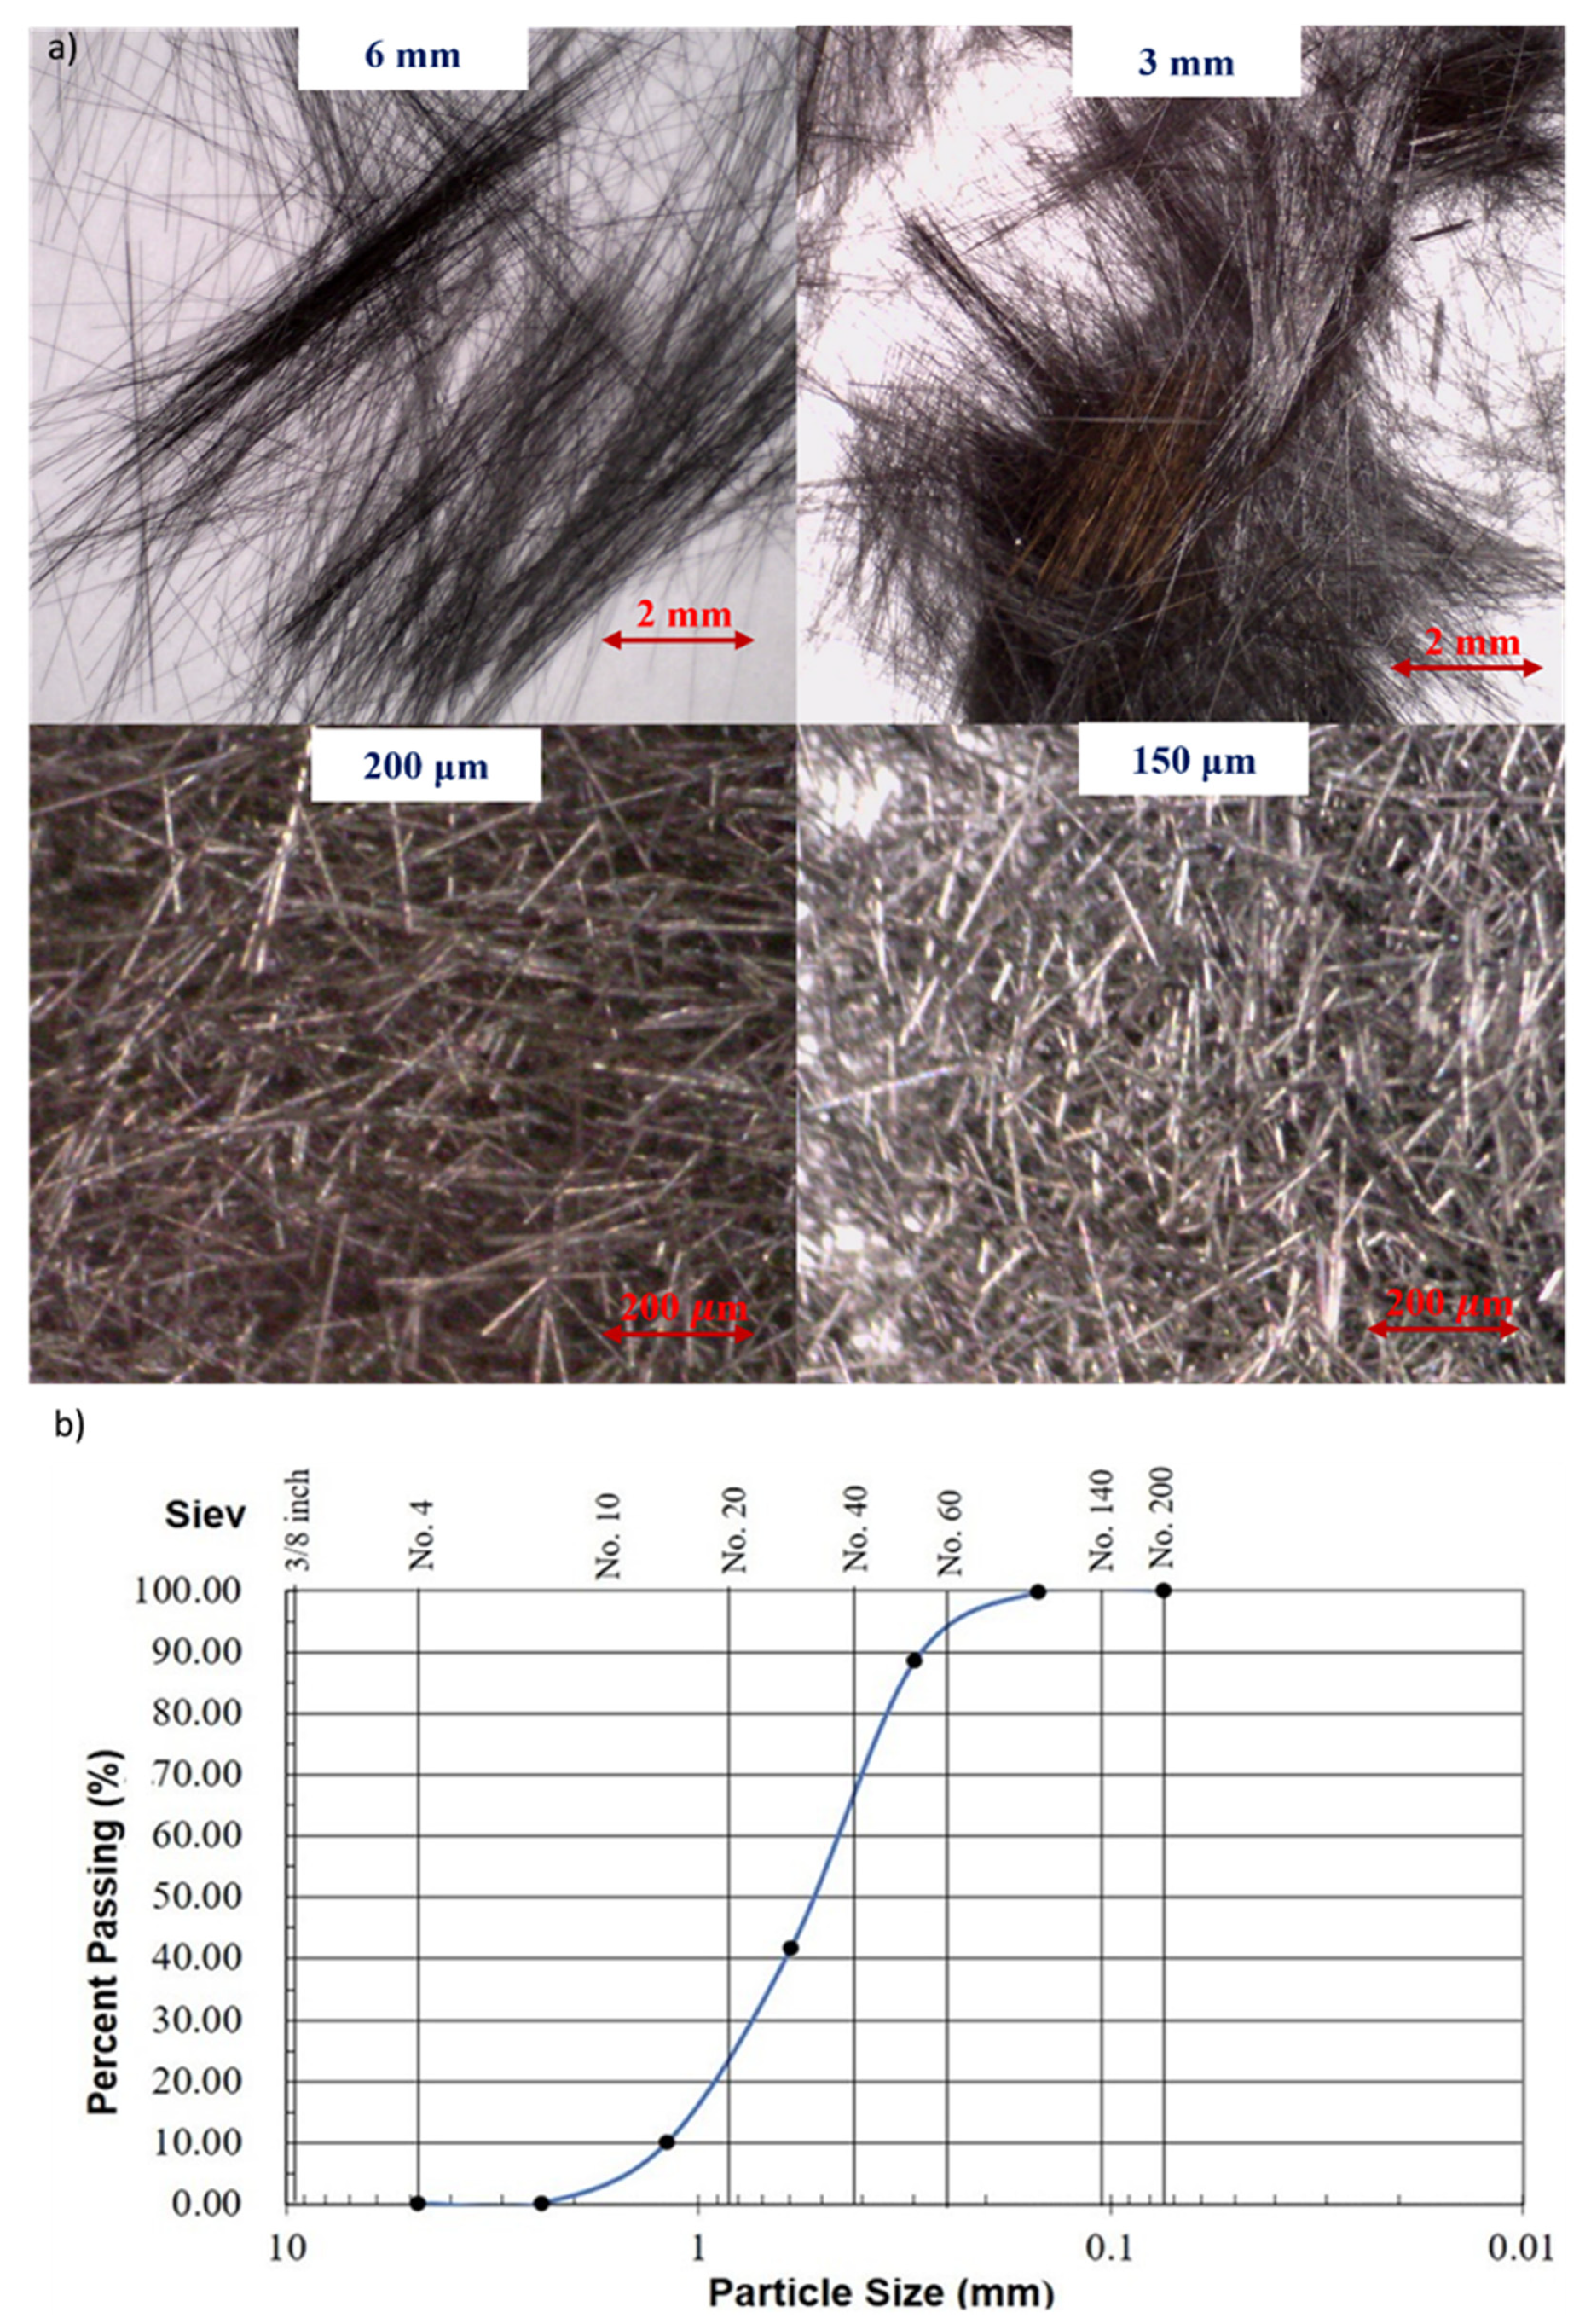
2.1. Materials

Six cementitious composite mixes were designed with different fiber volume content and size distribution. The water/cement ratio of 0.275, silica/cement ratio of 0.1, sand/cement ratio of 1.0, and superplasticizer/cement ratio of 1.75%, were all fixed for the different cementitious mixtures with different fiber volume contents. The carbon fibers (Zoltek, St. Louis, MO, USA) used are Chopped Carbon Microfibers (CCMF), with df = 7.2 μm diameter, 3 mm and 6 mm length, 416.7 and 833.3 aspect ratios, and Milled Carbon Microfibers (MCMF), with df = 7.2 μm diameter, length of 150 μm and 200 μm, and 20.8 and 27.8 aspect ratios, as shown in Figure 1a. Both fibers have a tensile strength of σ u = 7137 MPa and elastic modulus is 242 GPa as reported by the manufacturer [2]. The critical fiber length can be estimated as l c = σ u d f 2 τ a v , where τ a v is the average interface shear strength estimated as τ a v = 0.2 ( f c ) 0.7 [3]. For a compressive strength ranging from 50–70 MPa, and the carbon microfibers used, l c was estimated to be in the range of 6.0 to 8.5 mm [3]. This means that some of the CCMF with 3.0- and 6.0-mm length might observe fiber rupture rather than fiber debonding.
For the initial set of mixtures, fiber volume contents of 0%, 2%, 5%, 8%, and 10% of cement weight were considered. Typically, the fiber volume fraction does not exceed 10% [15,52]. For each of those contents, the following ratios of CCMF to MCMF were tested for flowability: 1:0, 4:1, 2:1, 1:1, 1:2, 1:4, and 0:1. The nomenclature given to those initial mixing ratios is I10, I41, I21, I11, I12, I14, and I01, respectively, where I denotes initial hybrid mixes, and the two numbers denote the chopped (CCMF) to milled (MCMF) fiber ratio (e.g., for either CCMF or MCMF, the fiber volume content was always evenly split between both lengths (3 mm and 6 mm for CCMF and the 150 μm and 200 μm for MCMF).
To obtain the final matrix for mechanical testing, an initial set of cementitious mixtures incorporating carbon fibers was tested for flowability as described in Section 2.3.
The final six mixes considered are presented in Table 1. The six mixes have: water/cement ratio of 0.275, silica/cement ratio of 0.1, sand/cement ratio of 1.0, and superplasticizer/cement ratio of 1.75%, and different carbon fiber volume contents. The cement used is Portland cement Type I/II. The silica fume is Rheomac SF 100 (BASF group, Tifton, GA, USA). The particle size distribution of the sand is depicted in Figure 1b. The reference mix, denoted (R), did not include any fibers. The chopped mix (CH2) had 1.0% of cement’s weight from each chopped fiber type. The milled mix (ML2) had 1.0% of cement weight from each milled fiber type. The milled mix (ML8) had 4.0% of cement weight from each milled fiber type. The hybrid mix (H2) had half the combined content from CH2 and ML2. Finally, the hybrid mix (H5) had half the combined content from CH2 and ML8.

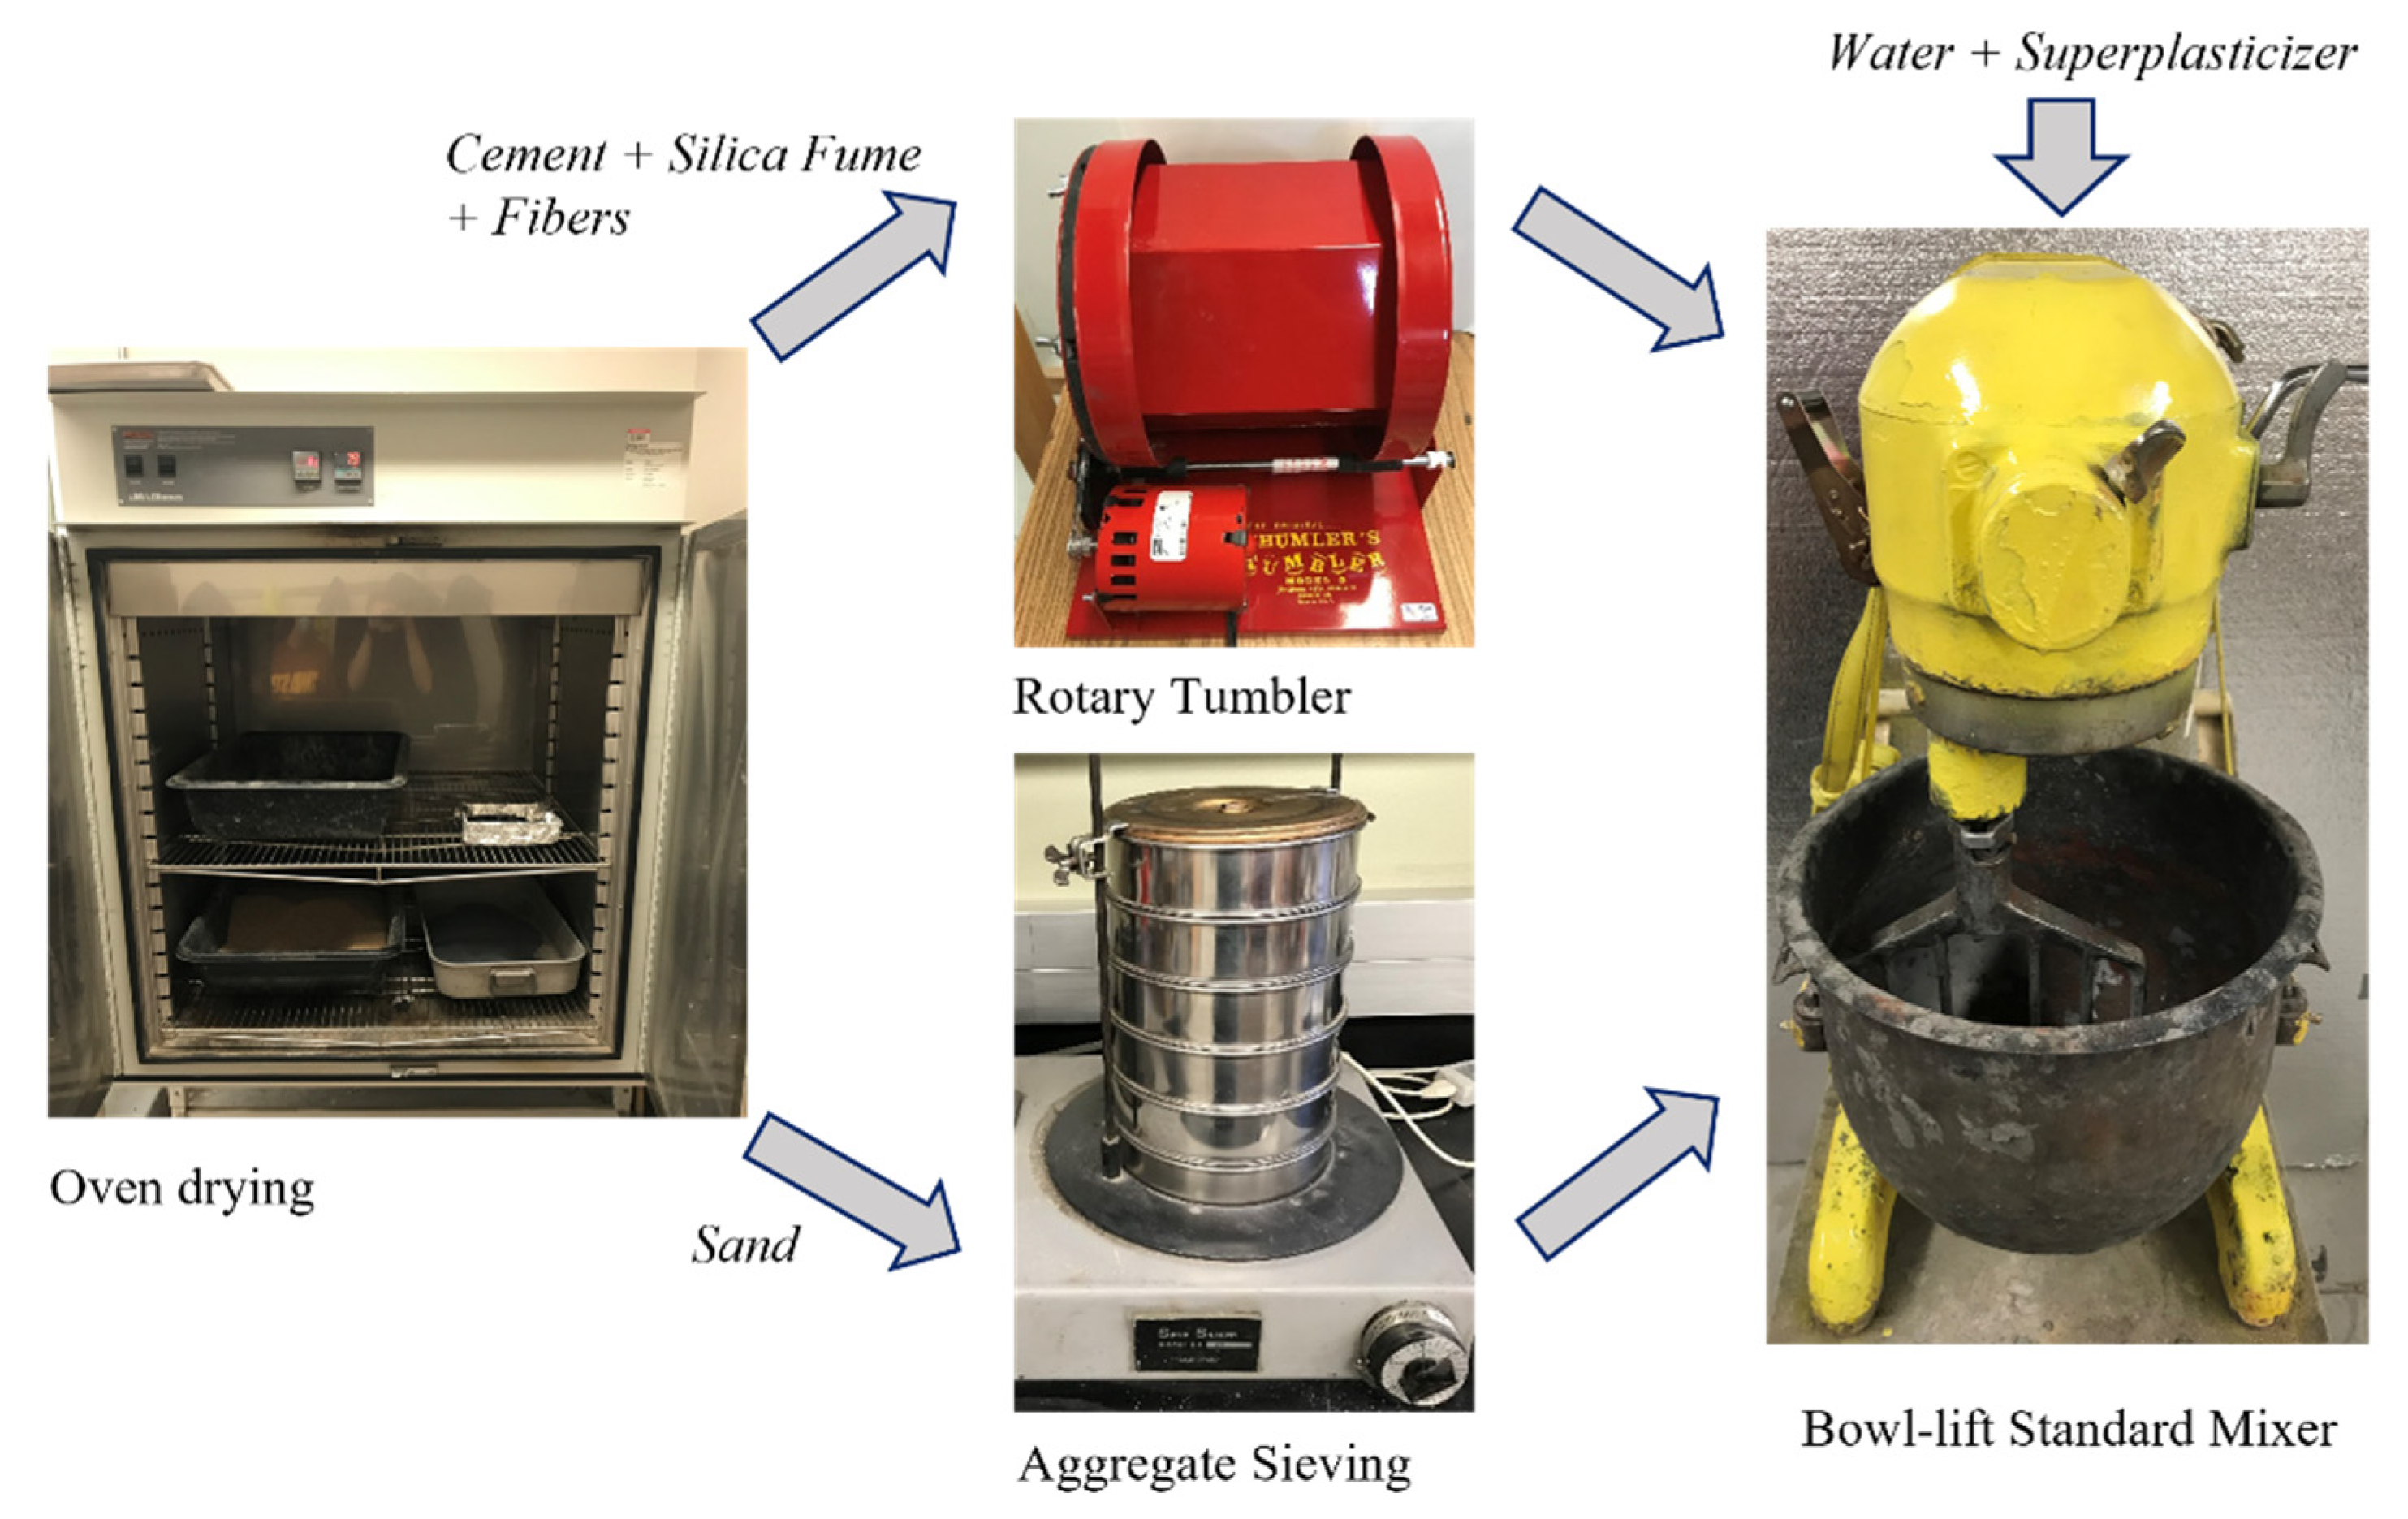
2.2. Mixing Protocol

To achieve dispersion of the multi-size carbon fibers inside the cementitious mix, the fibers were mixed with the fine cementitious particles (cement and silica fume) in a rotary tumbler for 30 min, following the recommendations by Hogancamp and Grasley [2]. For the first cycle of mixing, the water and superplasticizer were added to the cementitious materials, and fibers were then mixed for 1 min. The sand was then added to the mix for four additional minutes, as illustrated in Figure 2. After mixing, the flowability test was performed, according to ASTM C1437-13 [53].
For each of the final mixes, all specimens were then cured in a standard curing room at 100% relative humidity and 22 °C until testing dates at 7 and 28 days of age. Uniaxial compression cylinders of 50.8 by 101.6 mm (diameter and length, respectively) and notched and unnotched prisms of 25 mm by 25 mm by 300 mm (width, depth, and length) for three-point bending were cast.

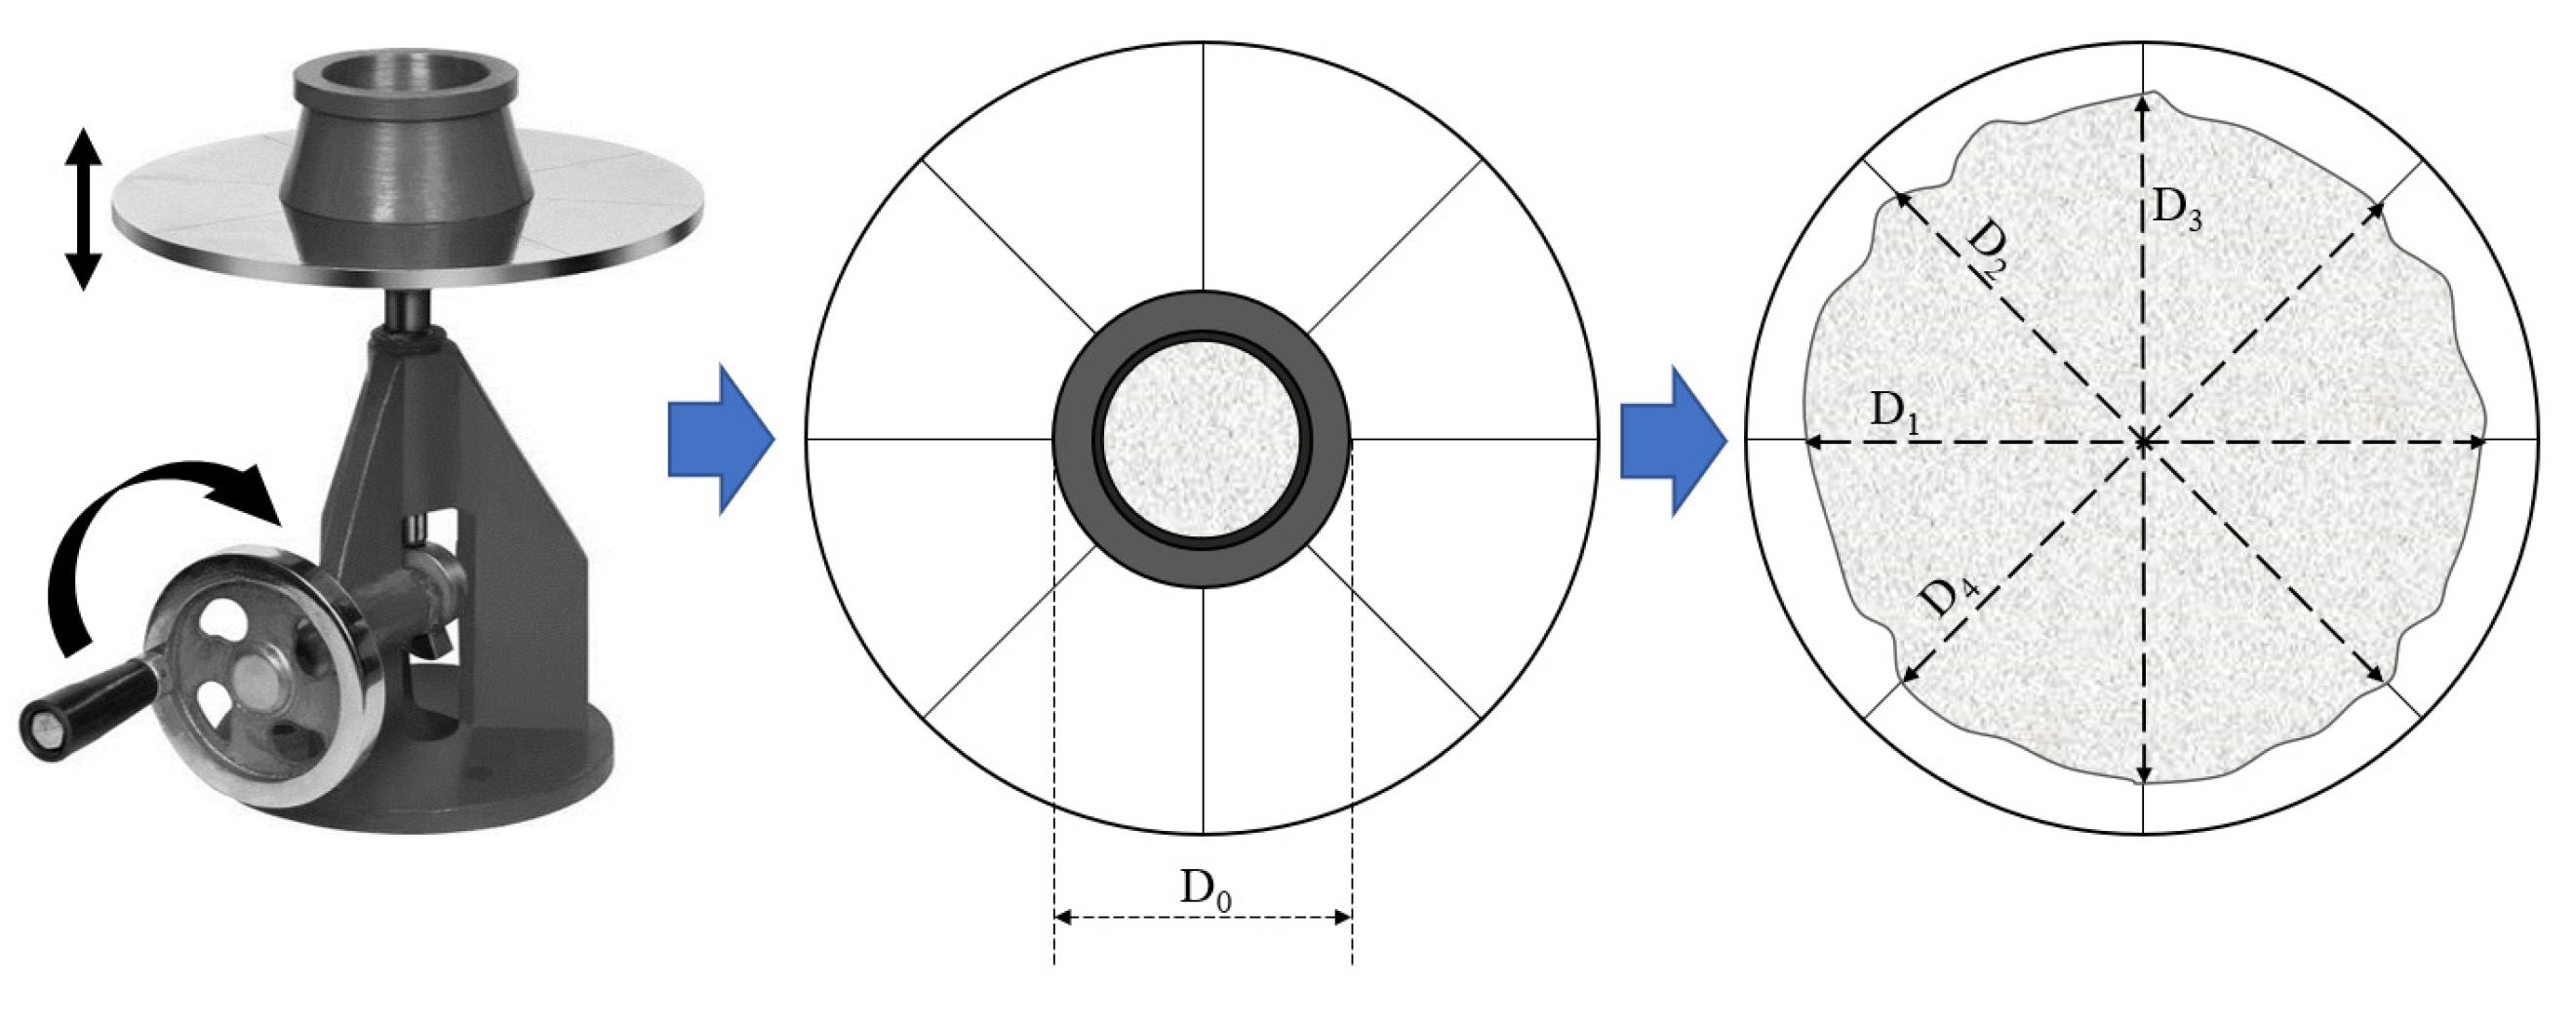
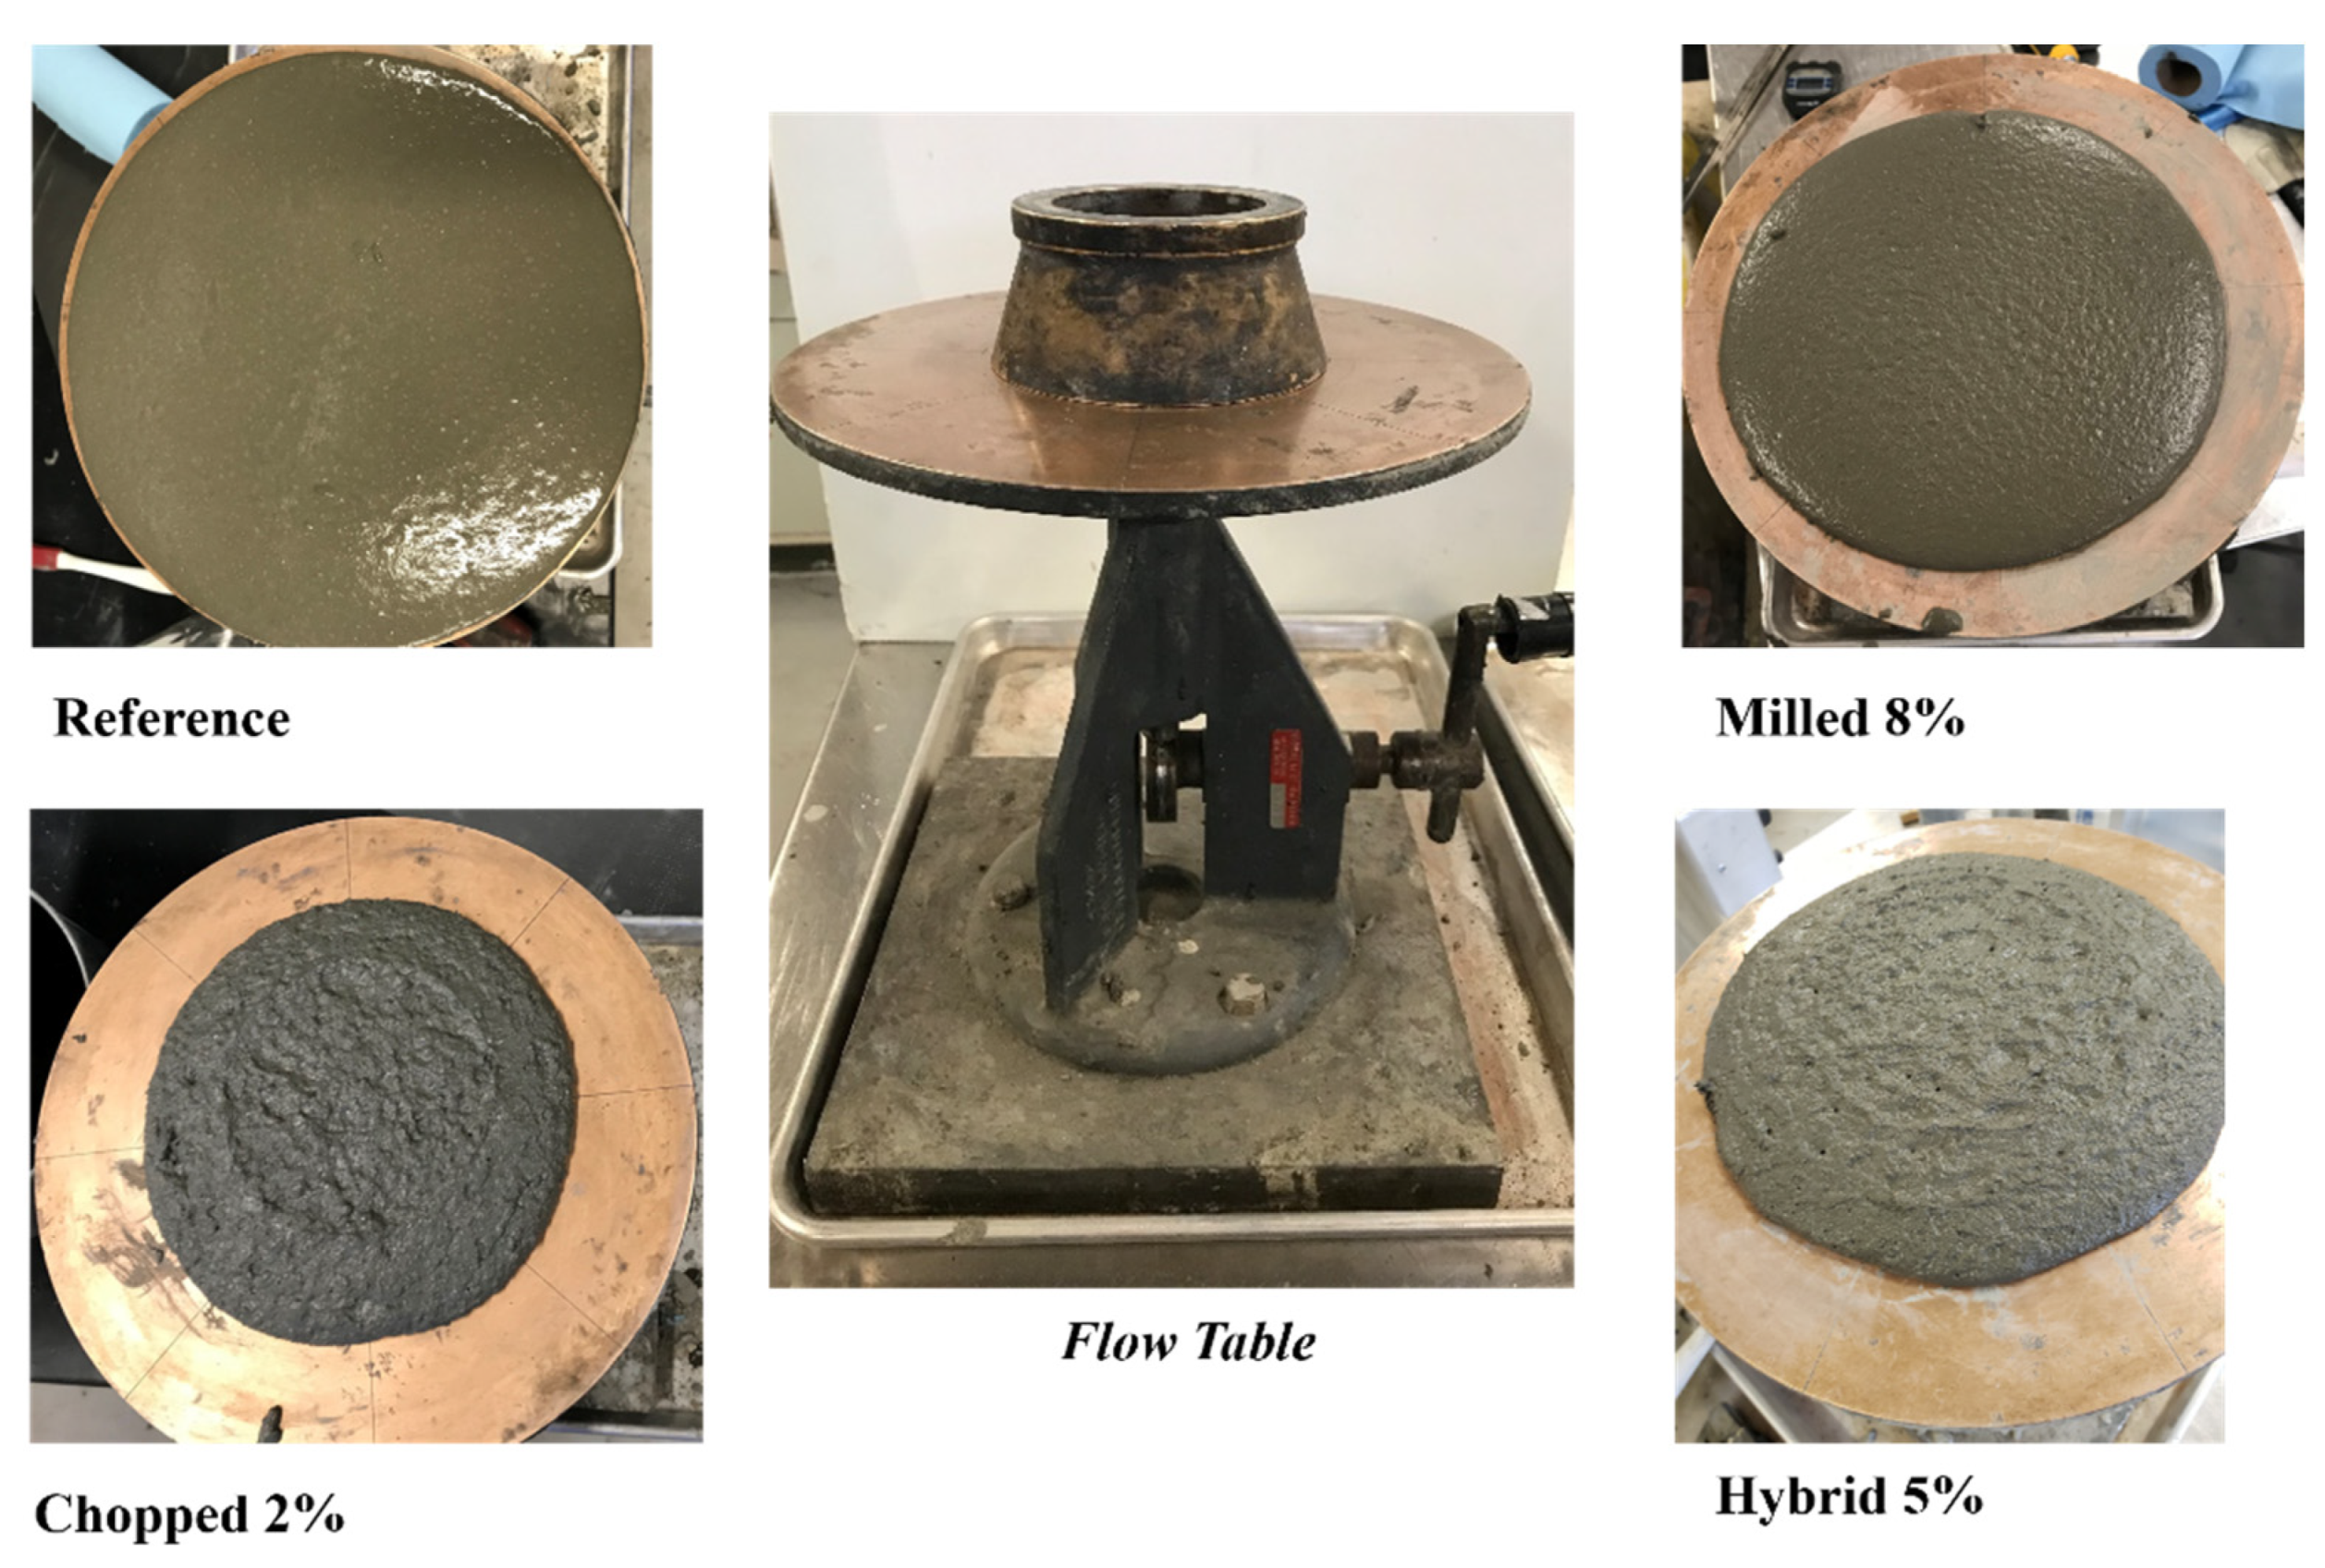
2.3. Flowability Test

Immediately after mixing, the flowability test was performed according to ASTM C1437-13 [53]. A 50 mm high cone with a variable diameter of 70 mm (top) to 100 mm (bottom) was placed at the center of the flow table, as shown in Figure 3. Then, it was filled with two layers of fresh concrete which are 25 mm each. Each layer was tamped 20 times after placement with a standard rod. The cone was then lifted slowly, and the flow table was dropped 25 times within 15 s. After that, the cement composite cone’s change in diameter was measured four times along the prespecified location on the flow table. The flowability is defined as the average increase of the four measured diameters (D1, D2, D3, and D4), expressed as a percentage of the original base diameter (D0) as shown in Figure 3.
By defining an acceptable flowability limit of 80%, six final mixes were down selected for mechanical testing, as will be explained below. The 80% limit for flowability has been recommended by other researchers to ensure good workability of cement mixtures and harden properties [54,55]. Flowability observations for each mix are presented in the Results and Discussion section.

2.4. Uniaxial Compression Test

For each mix, five cylinders of 50.8 mm diameter and 101.6 mm height were tested for compressive strength at 7 and 28 days of age. The tested cylinders were capped with sulfur as per ASTM C1231/C1231M-15 [56]. The testing was performed on the Tinius Olsen machine with a 4.45 N resolution and ±1778 kN range at a rate of 1 mm/min [57].

2.5. Modulus of Rupture Test

For each mix, five unnotched prisms of 25 mm × 25 mm × 300 mm were tested in three-point bending to determine the modulus of rupture (MoR) and the elastic modulus E U N for each of the six mixes at 7 and 28 days of age. Each prism’s loading span was 150 mm with a symmetric double cantilever to counter the effect of self-weight [58,59]. Two linear variable differential transformers (LVDTs) were mounted on the reference frame, as shown in Figure 4, at a distance 10 mm from the prism center to record vertical deformations. The loading rate was 0.05 mm/min on the MTS Bionix Servohydraulic Machine (MTS, Eden Prairie, MN, USA), with 1 N resolution and ±25 kN range. The MoR was calculated based on the peak load of each unnotched specimen. The elastic modulus E U N was calculated using Equation (1) [60,61]. To improve elastic modulus evaluation accuracy, linear regression is performed up to 45–50% of the peak load, as depicted in Equation (1):
E U N = 1 b d δ e U N [ 0.9745 × P e U N l 3 4 d 2 + 13 15 × 3 ( 1 + ν ) P e U N l 4 ]
where δ e U N is the displacement at a defined elastic limit of the unnotched specimen, P e U N load at defined elastic limit of the unnotched specimen, ν indicates Poisson’s ratio, b is specimen width, d is specimen depth, and l is the loading span.

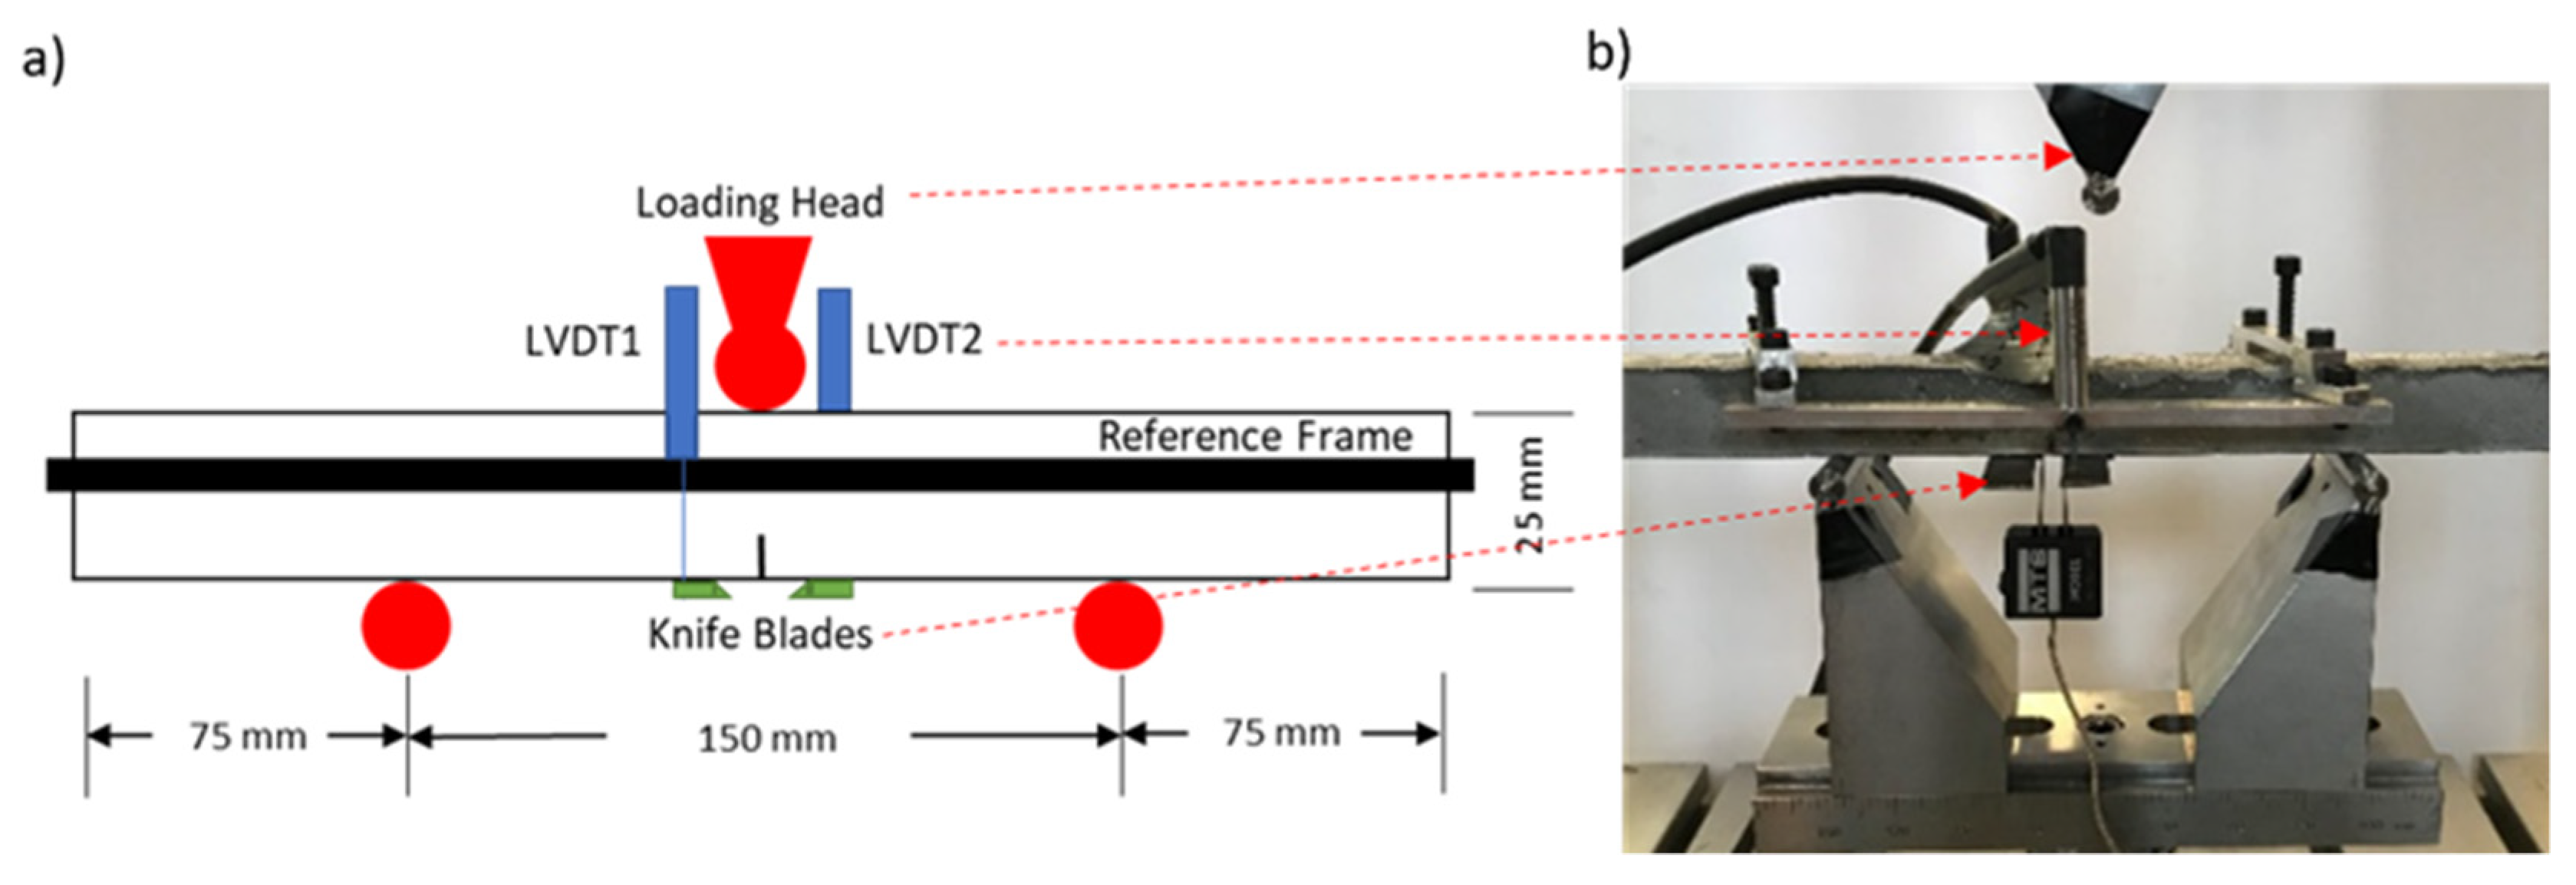
2.6. Fracture Toughness Test

For each mix, five notched prisms of 25 mm × 25 mm × 300 mm were tested in three-point bending. The fracture toughness test setup of the notched beams is shown in Figure 4. Each prism’s loading span was 150 mm, with a symmetric double cantilever to counter the self-weight effect on crack propagation [58,59]. The prisms were notched midspan with a precision saw to create a notch of 8 mm nominal depth and 0.3 mm width. Two knife blades were attached before testing around the crack to measure the crack mouth opening displacement (CMOD) using a clip gage. Two LVDTs were mounted on the reference frame, as shown in Figure 4, at a distance 10 mm from the prism center to record vertical deformations. The prisms were loaded at a displacement rate of 0.05 mm/min. The fracture toughness properties were evaluated using the quasi-brittle elastic crack approach, as described by [61]. The critical stress intensity factor K I C , the critical elastic energy release rate G I C and the critical plastic energy release rate represented by the critical J-integral J I C are defined as:
K I C = g 1 ( α ) σ c π a c ,   α = a / d
g 1 ( α ) = 1.122 1.4 α + 7.33 α 2 13.08 α 3 + 14 α 4
G I C = K I C 2 ( 1 ν 2 ) E U N
J I C = 2 H c b ( A N A U N )
where A N is the area under load displacement of notched specimen up to the peak load of that specimen, A U N is the area under load displacement of an unnotched specimen up to the peak load of a similar unnotched specimen, b is specimen width, d is specimen depth, H c = d a c is the critical ligament depth, ν indicates Poisson’s ratio, E U N is the elastic modulus of the unnotched sample, σ c is the critical stress of notched prism, a is the crack depth, d is the total beam depth, α is the notch-to-depth ratio, α c is the critical notch-to-depth ratio, and a c is the critical crack depth. The critical crack depth is estimated by equating the elastic modulus of the notched beam ( E e l a s t i c ) with the elastic modulus of an equivalent notched beam E c r i t i c a l in which the notch depth equals the critical crack depth:
E e l a s t i c = 1 b d δ e [ 0.9745 × P e l 3 4 d 2 + 13 15 × 3 ( 1 + ν ) P e l 4 + 13 15 × 9 P e l 2 2 d F ( α ) ]
E c r i t i c a l = 1 b d δ c [ 0.9745 × P c l 3 4 d 2 + 13 15 × 3 ( 1 + ν ) P c l 4 + 13 15 × 9 P c l 2 2 d F ( α c ) ]
where δ e is the displacement at a defined elastic limit of the notched specimen, δ c is the displacement at peak load of the notched specimen, P e load at a defined elastic limit of the notched specimen, P c the peak load of the notched specimen, and l is the loading span. The function F ( α ) is defined as:
F ( α ) = 0 α α g ( α ) 2 d α
g ( α ) = g 1 ( α ) π
For each specimen, the critical stress intensity factor K I C was calculated separately, then the average elastic modulus that was from the unnotched specimens was used to evaluate the fracture toughness parameters G I C and J I C as described above. Furthermore, the fracture energy Gf was evaluated by integrating the area under the Load-CMOD [62,63,64] calculated as:
G f = 1 b ( d a ) 0 δ c P ( δ ) d δ
where δ c is the critical CMOD displacement evaluated at a load level of 95% of the peak load.

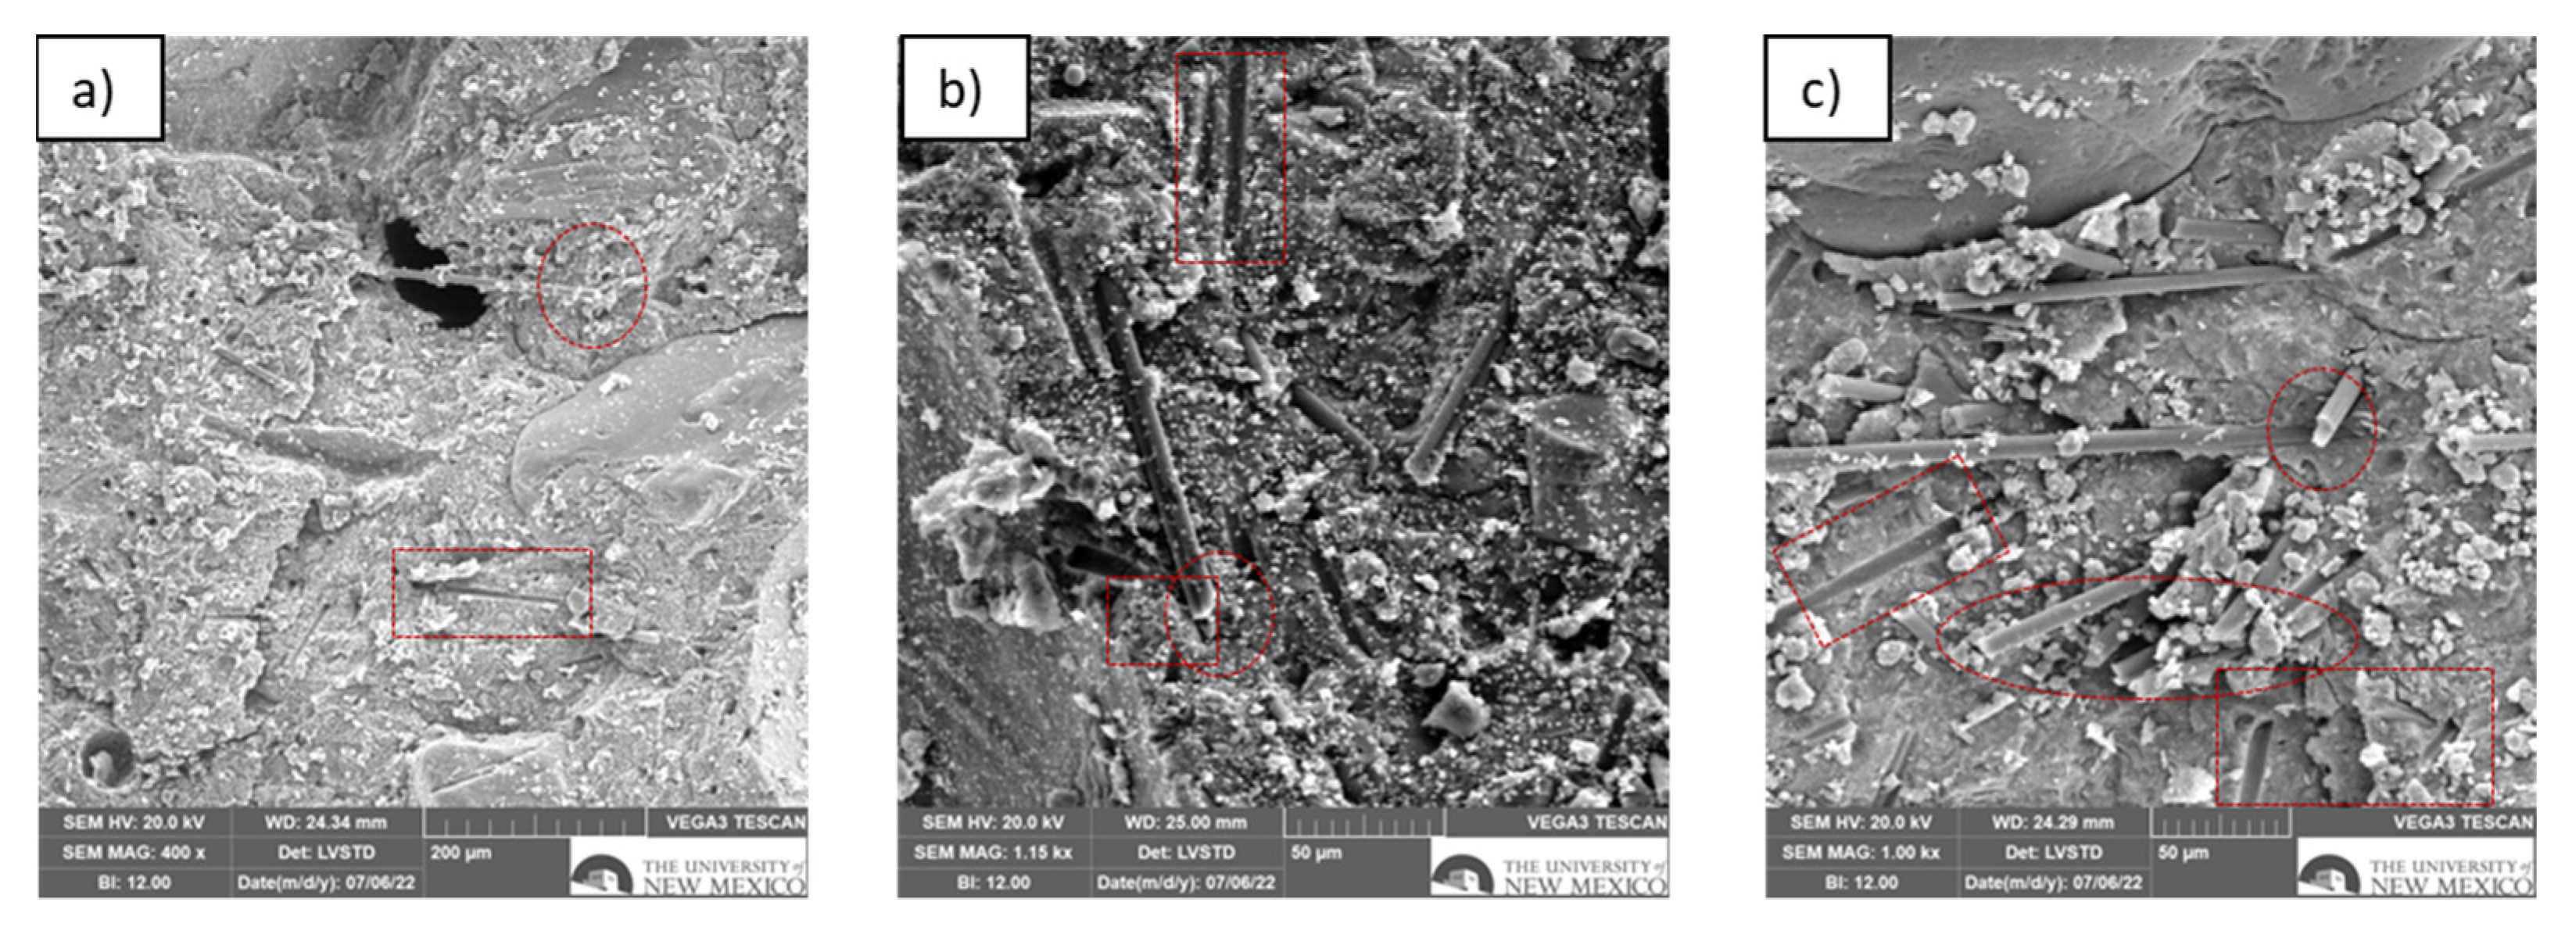
2.7. Scanning Electron Microscopy (SEM)

In addition to flowability and mechanical testing, Scanning Electron Microscope (SEM) was utilized to investigate the microscale fracture pattern of each fiber type. Several samples were taken from the fracture plane after mechanical testing from chopped mixes (CH2), milled mixes (M2), and hybrid mixes (H2). The fracture surfaces of the specimens were examined by using a VEGA3 thermionic emission SEM system by TESCAN (Brno, Czech Republic). To enhance conductivity, the specimens were sputter-coated with gold/palladium (Au/Pd). The electron beam energy used for all readings was 20 keV. The magnification was varying from 400× to 1150× depending on the features to be observed.

3. Results and Discussion
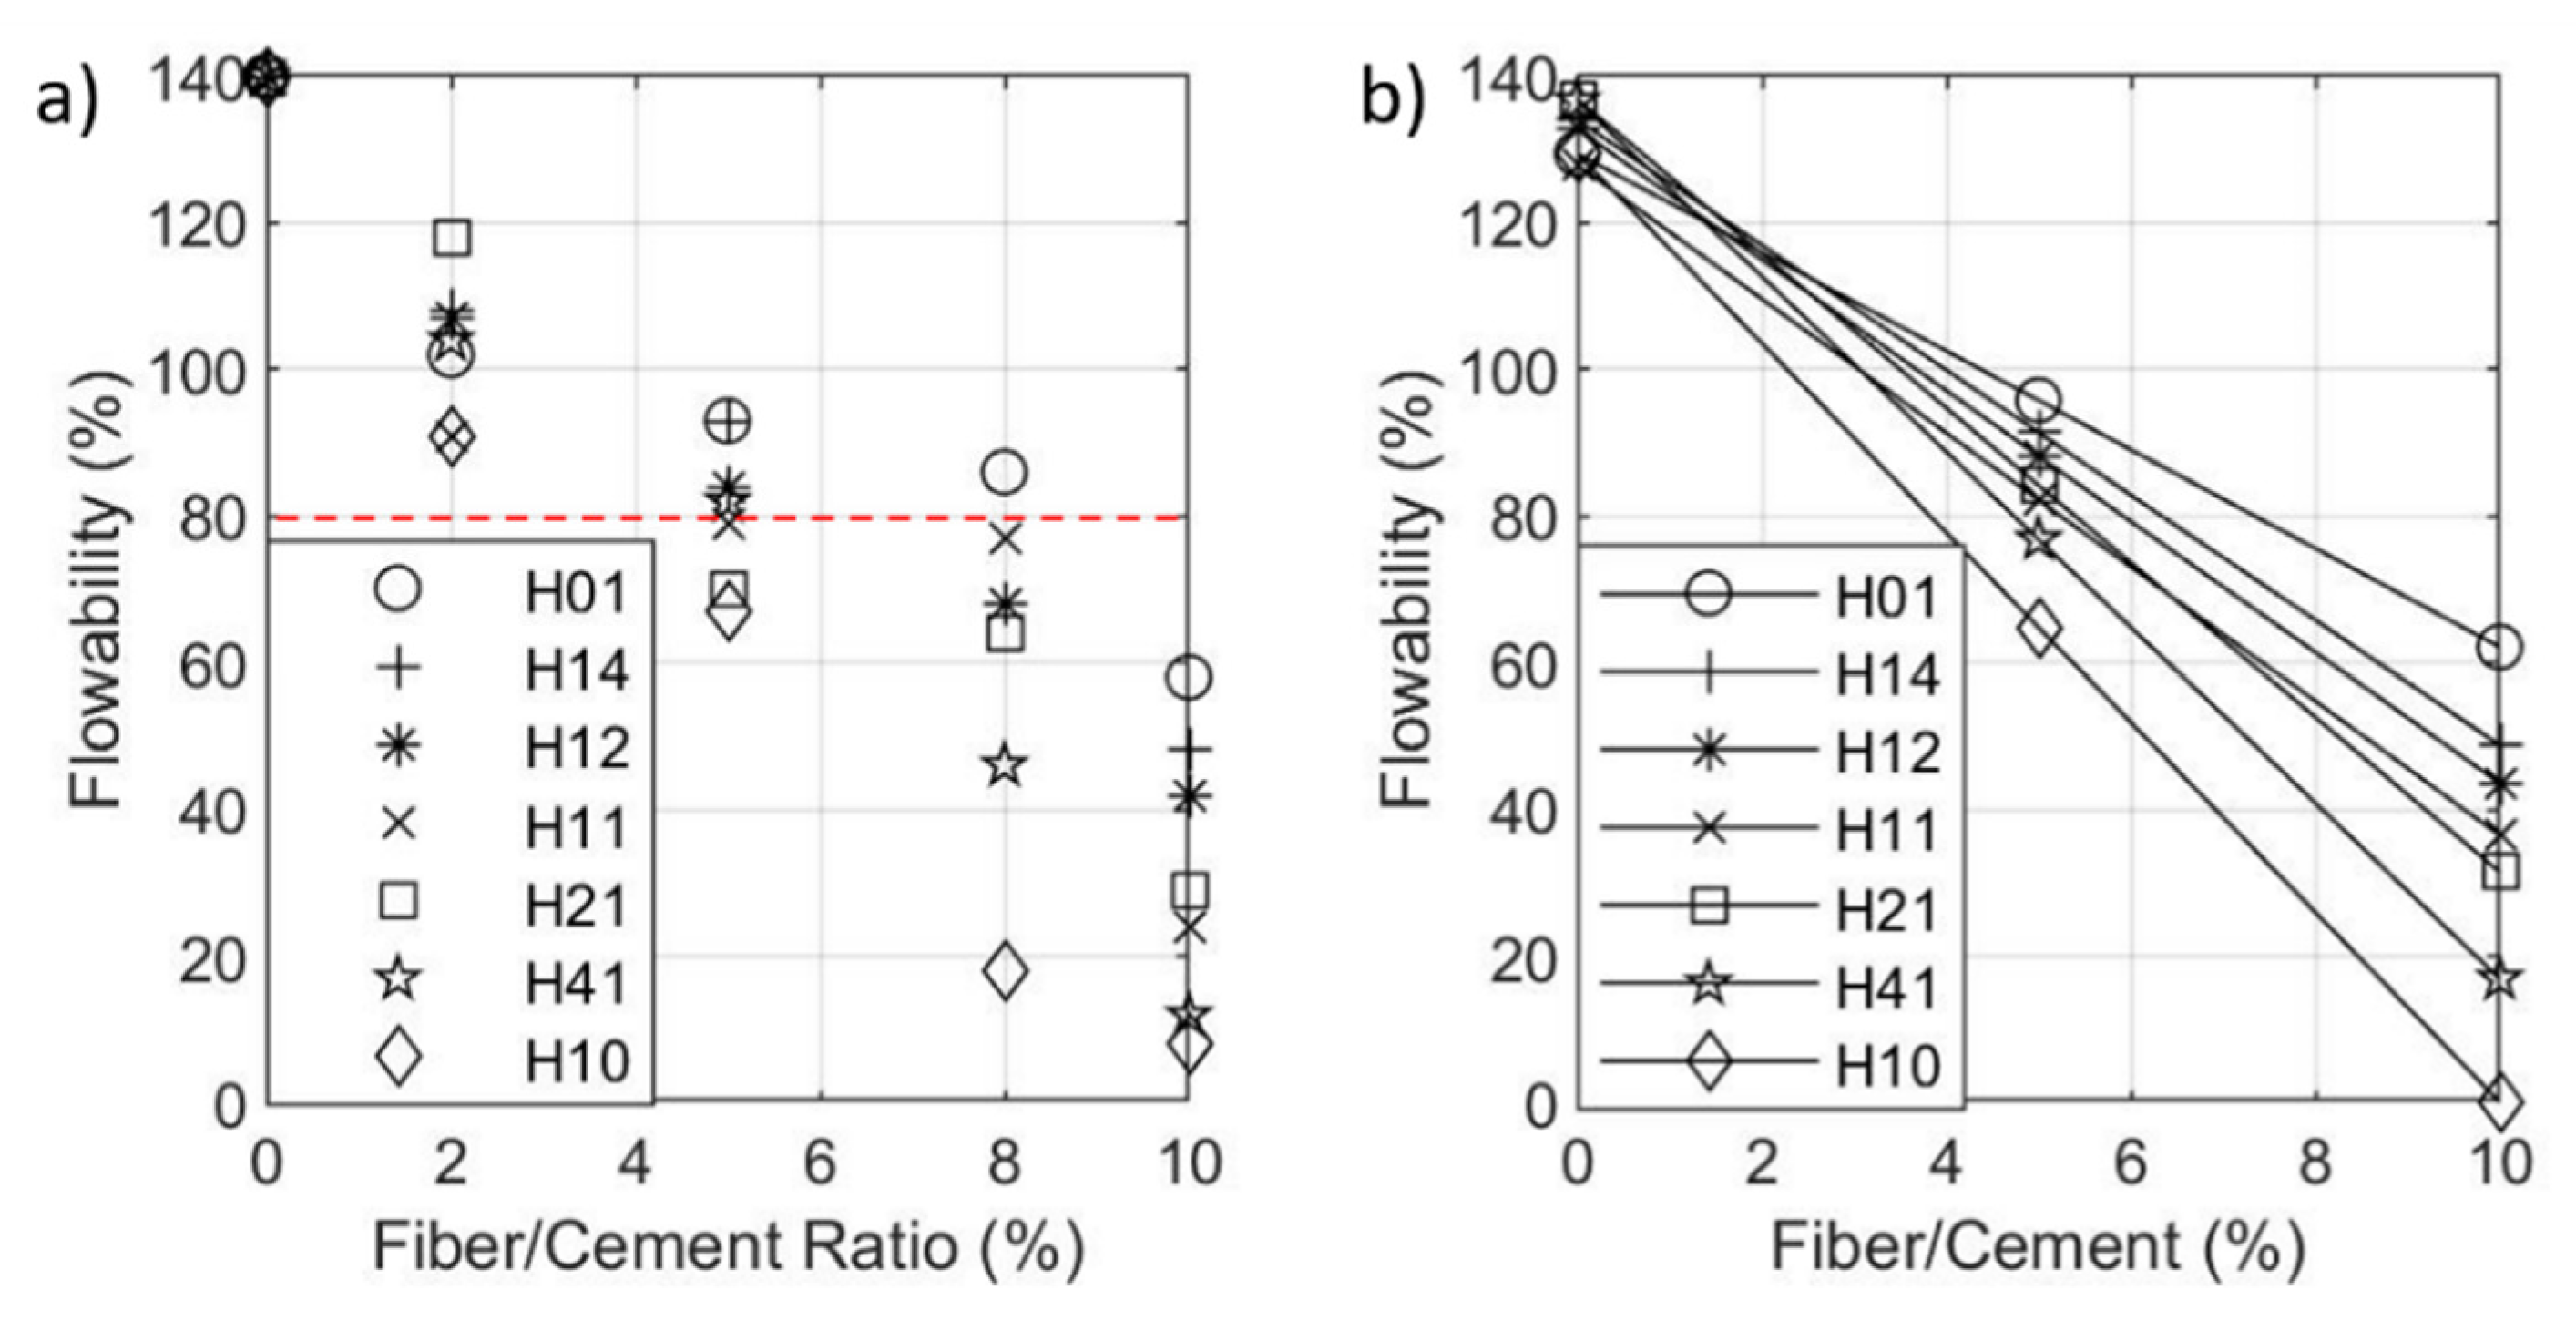
3.1. Flowability

The main criteria of fresh mix design for all considered mixes were to exceed a flowability of 80%, such that it would be acceptable for casting in practical applications. Examples of flowability tests are shown in Figure 5. The full matrix of results is presented in Figure 6a for the initial test matrix considered. As to be expected, the increase in fiber volume content has an inverse proportion relationship to the cementitious mix flowability. In fact, the relationship between fiber/cement ratio and flowability has a linear relationship. The CCMF/MCMF ratio dedicates the slope of this relationship. The higher this ratio, as shown in Figure 6b, the steeper the slope. This implies the highest flowability for a certain fiber volume content is achievable with a higher ratio of MCMF/CCMF. Based on the chosen flowability criteria, a reference mix with no fiber volume content, a mix with 2% chopped fiber volume content, mixes with 2% and 8% milled fiber volume content, and mixes with 2% and 5% hybrid fiber volume content of the 1:4 CCMF/MCMF ratio were considered for mechanical testing.
For the reference mix, the flowability achieved was 140%, which was the highest among all mixes since it has no fibers. The chopped mix (CH2) achieved a 91% flowability, which is still above the predefined limit, due to the presence of 2% chopped fiber volume content of the cement weight. The milled mix (ML2) achieved flowability of 102%, which is higher than the chopped mix with the same fiber volume content. The milled mix (ML8) achieved the lowest flowability of 86%, which was expected due to the high milled fiber volume content of 8% of the cement weight. However, it should be noted that, despite the milled mix (ML8) having four times fiber volume content than the chopped mix (CH2), the flowability of both are relatively close, with only 4% difference in flowability. The hybrid mix (H2) achieved flowability of 108%, which is in the same range as the milled mix (ML2). Finally, the hybrid mix (H5) achieved the highest flowability among the fiber mixes of 93%, despite having 5% content of mixed fiber by cement weight. This can be attributed to the limited effect of the MCMF on cement flowability compared with CCMF.

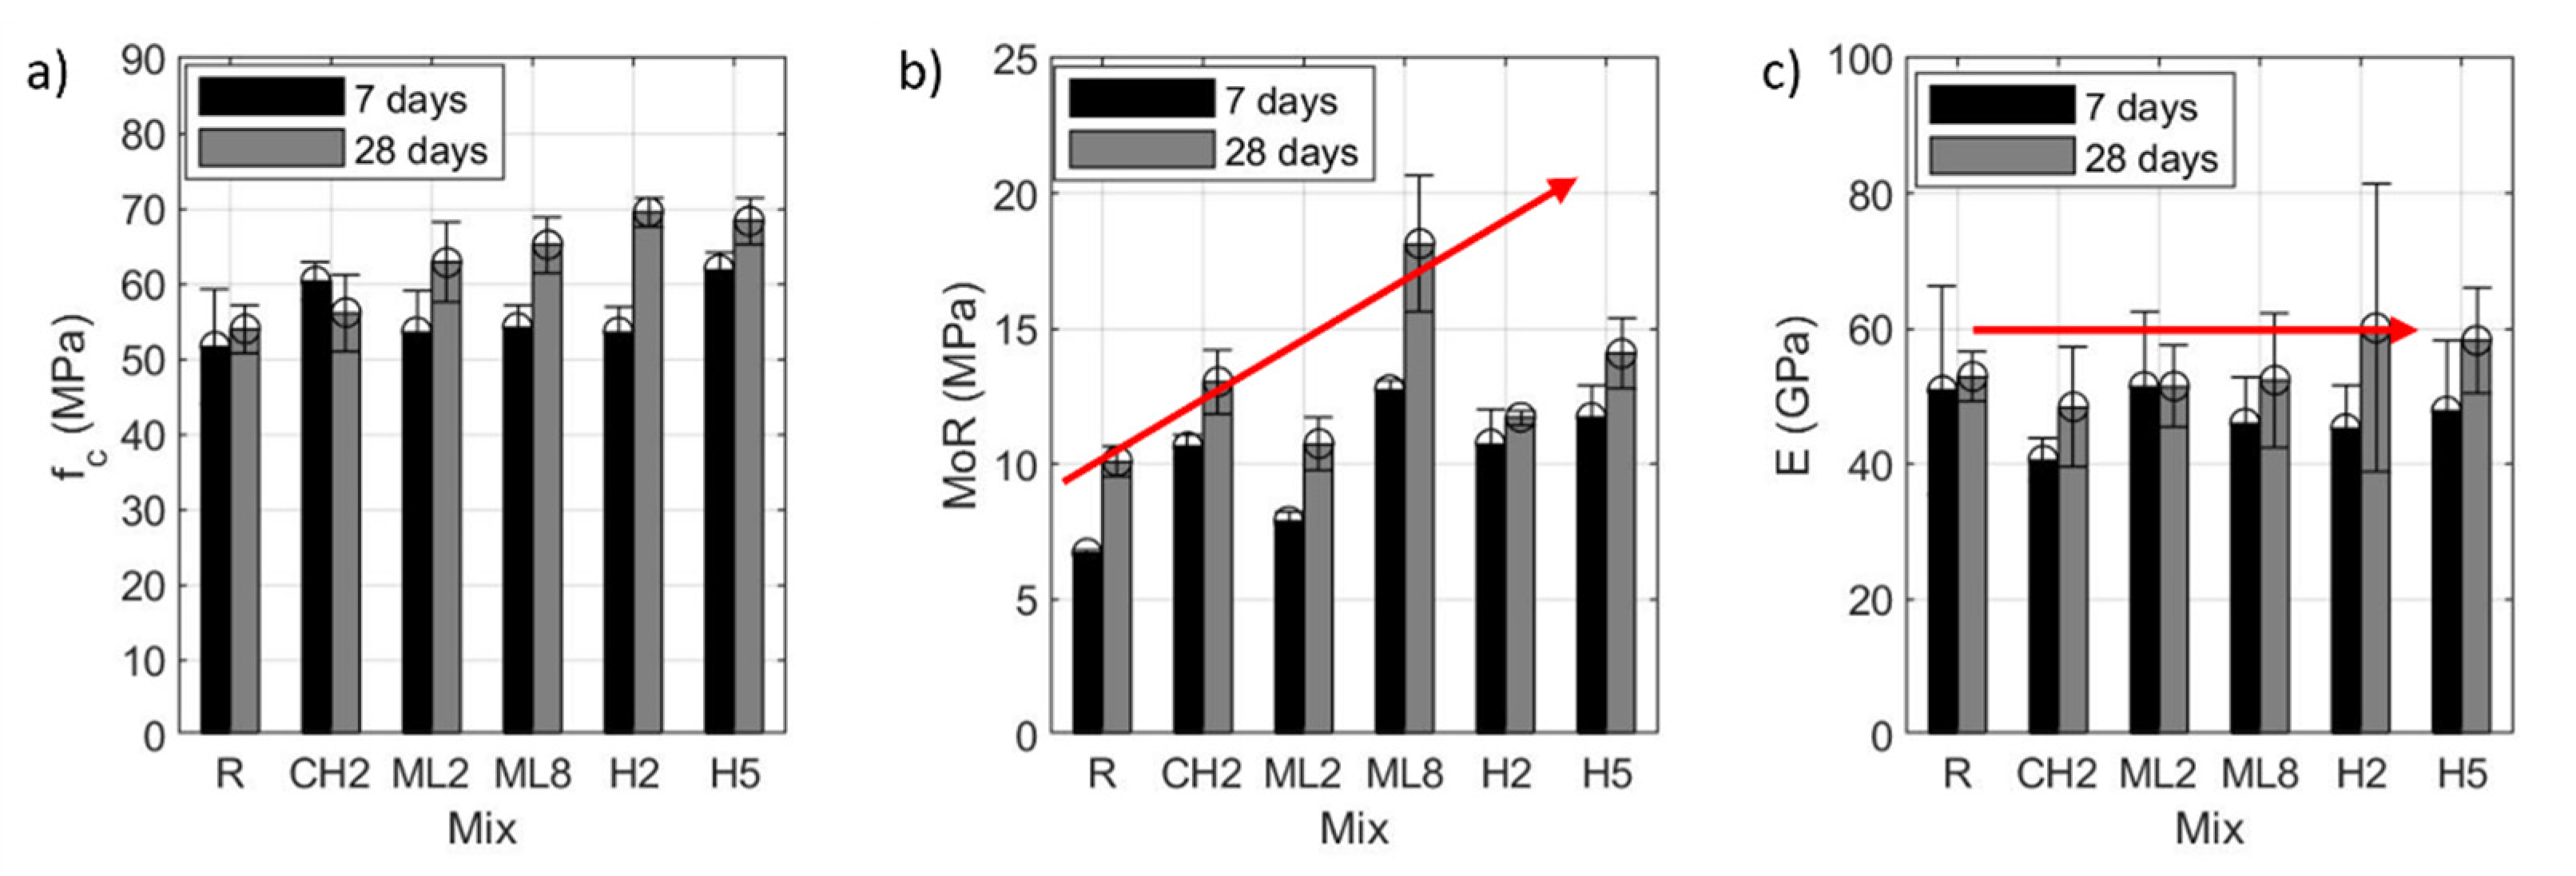
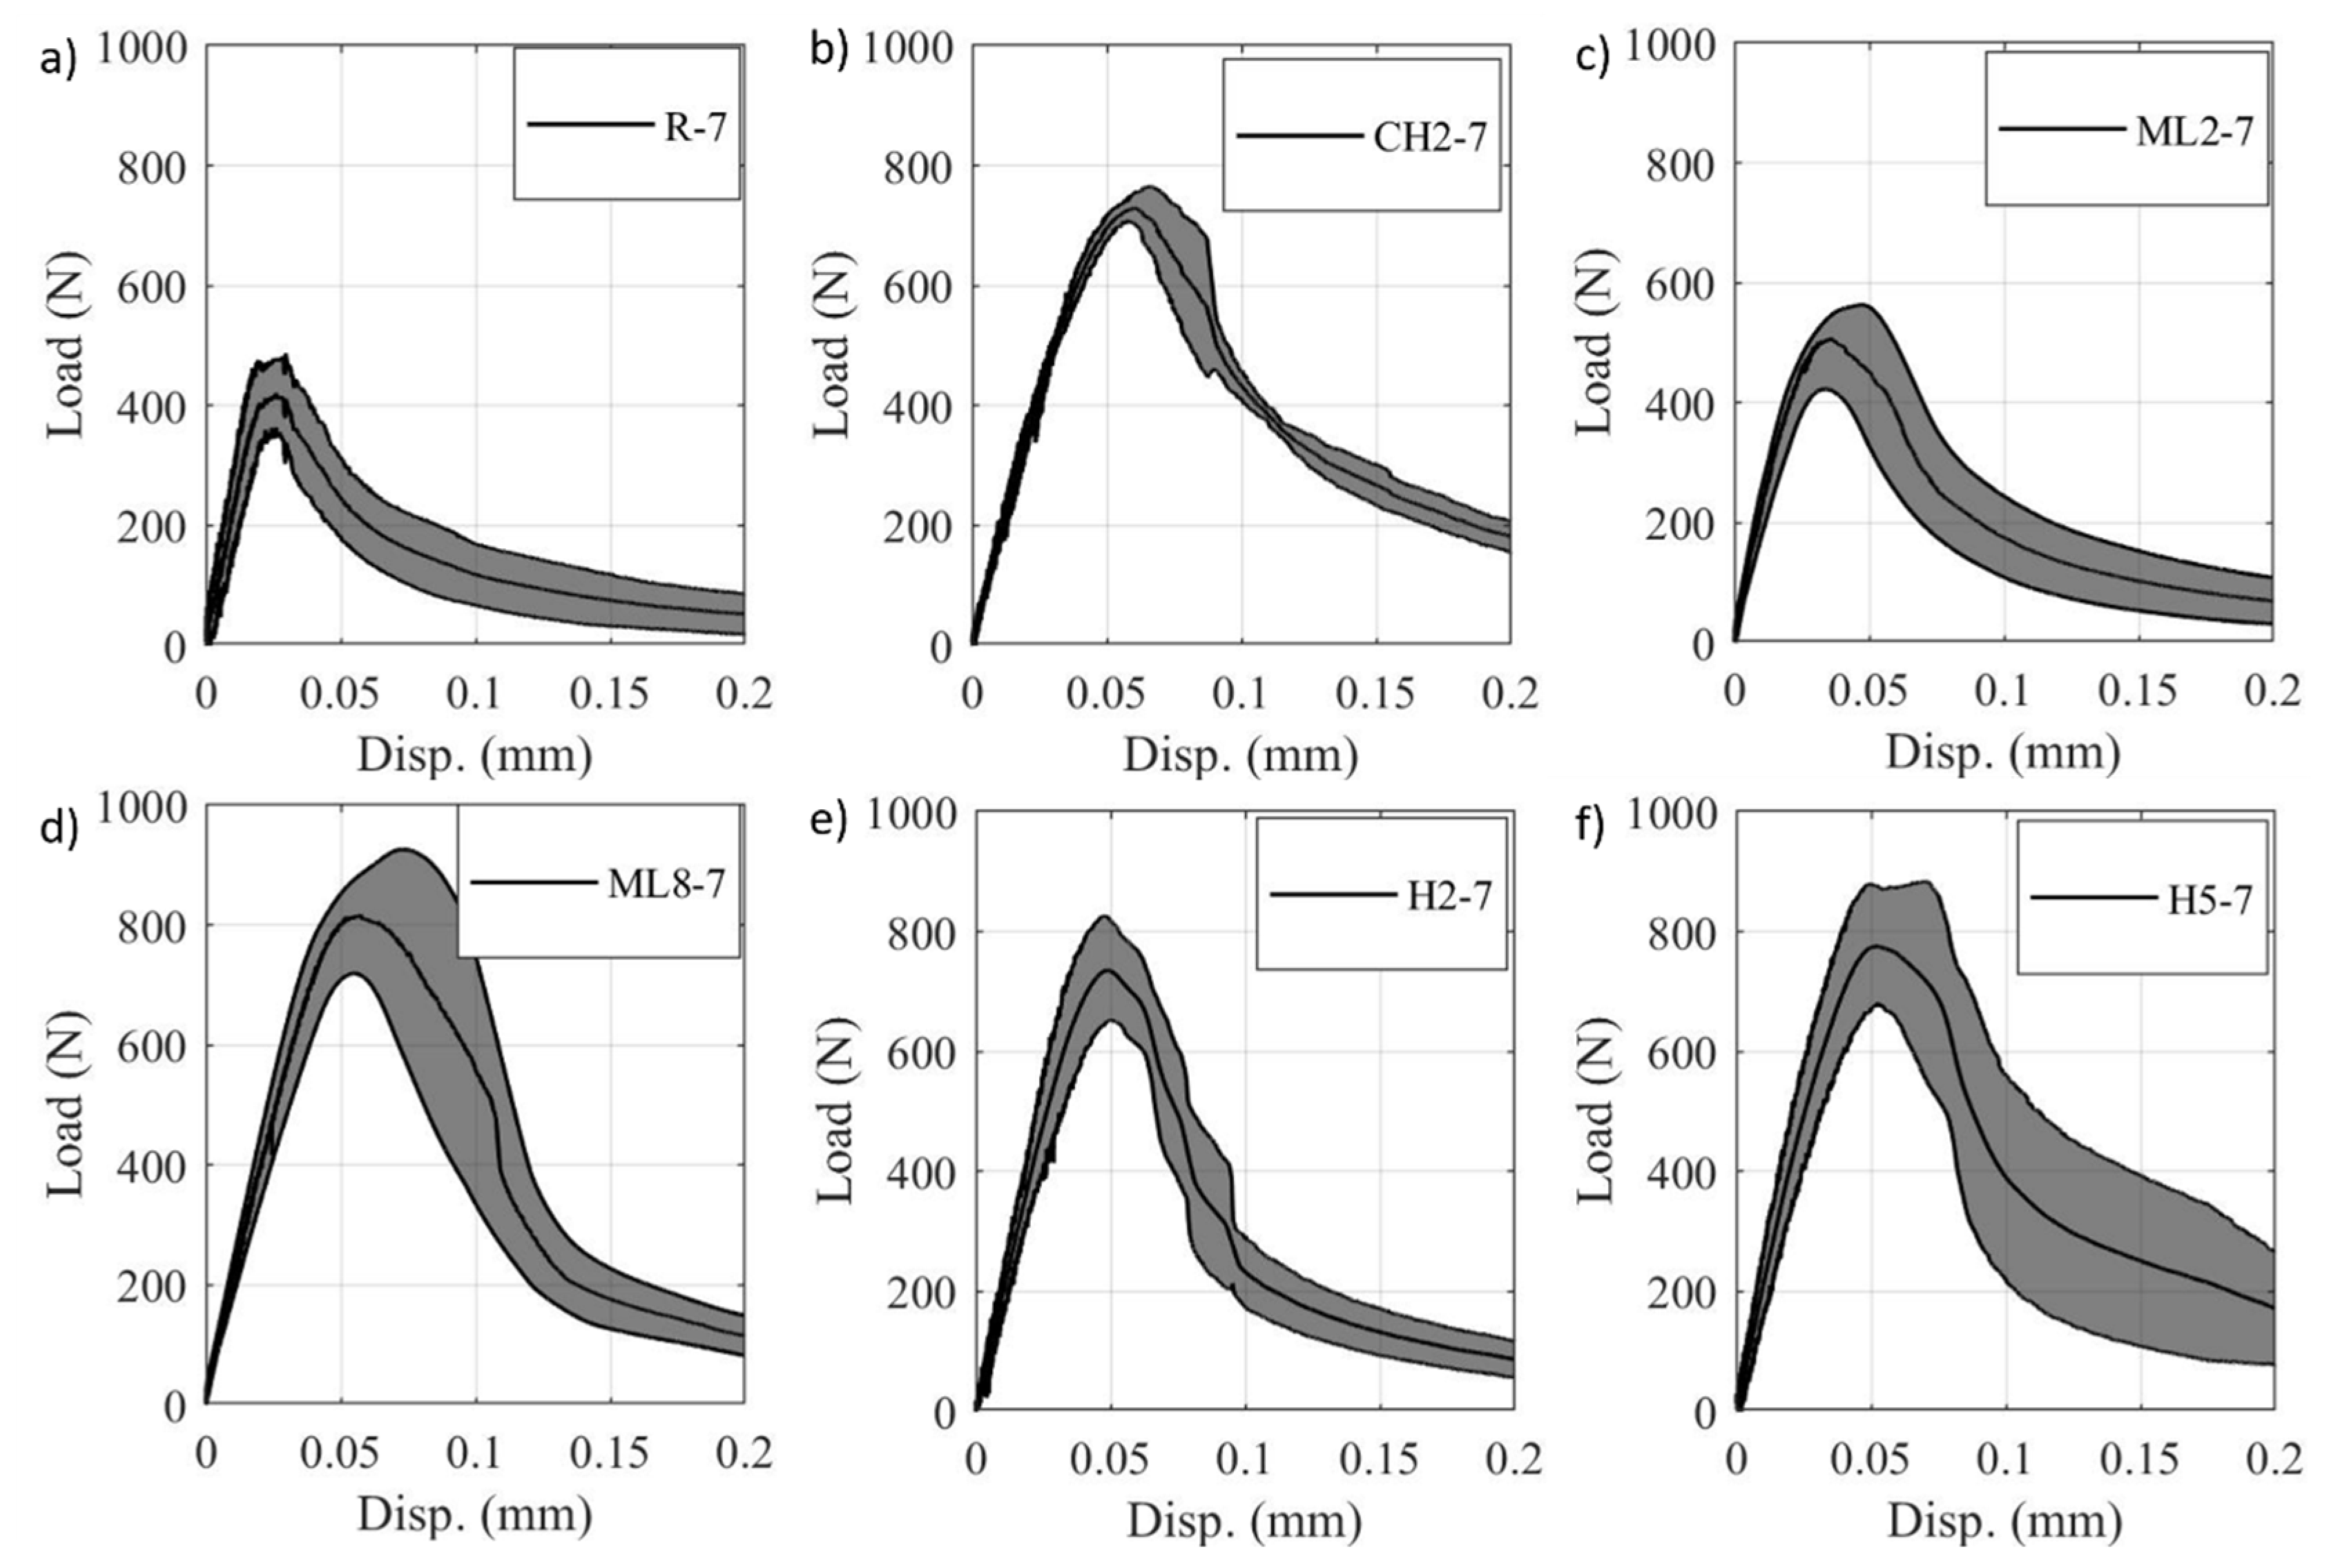
3.2. Mechanical Properties

While considering the mechanical and fracture response of materials, two criteria govern the response: the stress and the energy criteria. The stress criterion can be defined by the ratio of local tensile stress developed on crack surfaces and tip to the material’s cohesive strength. The energy criterion can be defined by the energy required for an incremental extension of the crack [3]. The inherit heterogeneity in concrete causes a complex response to predict via those criteria when tested for uniaxial compression. In cementitious composites, the cracks are typically initiated from bond cracks between the cementitious matrix and filler aggregate particles [65,66], then propagate mainly through the cementitious matrix. The propagation process itself is dependent on the state of stress on the crack surface and tip [66,67,68]. Finally, the compression failure is not associated with a single crack failure, but multiple. A higher fiber content and longer fiber length could assist with crack propagation via bridging, while not significantly impacting crack initiation at different locations due to bond cracks. On the other hand, smaller fibers could control crack initiation, yet not have a significant impact on crack propagation. In both cases, the efficiency of dispersion will also affect both theorized responses.
The mean compressive strength, and its standard deviation, was evaluated for each mix at seven days based on the strength of five cylinders, as shown in Figure 7a. At 95% confidence, we examined the statistical significance of the results. Both the milled mixes (ML2) and (ML8) and the hybrid mix (CH2) compressive strength were not significantly higher from the reference mix, while both the chopped (CH2) and hybrid (H5) mixes were significantly higher than the reference mix, yet not statistically different from each other. A similar analysis was performed at 28 days. In this case, as shown in Figure 7a, the compressive strength of the chopped mix (CH2) was not significantly higher than the reference mix, while both milled mixes (ML2) and (ML8) and both hybrid mixes (H2) and (H5) were significantly higher than the reference mix, yet not statistically different from each other. Despite the hybrid mixes not having the highest fiber volume content, they showed a consistently higher compressive strength than the milled and chopped mixes. This effect of fiber size distribution here might be attributed to the ability of the hybrid fibers mix to control both crack initiation, due to the presence of milled fibers, and crack propagation via bridging, due to the presence of chopped fibers. It is also important to note that there is not a statistical significance in the difference in compressive strength between 7 and 28 days, specifically when comparing the reference and CH2 mixes. However, mixes with microfibers tend to have a higher compressive strength than mixes without microfibers. This could be attributed to the ability of the microfiber to act as micro-packing particles, improving the packing density of the fiber reinforced cement composite and thus leading to improved compressive strength [69,70,71]. Finally, this result is consistent with the research reported in literature [50,72,73,74,75] that showed a positive effect of hybrid fiber composition on compressive strength. However, Shu et al. [45] did not observe a significant effect in a narrow range of hybrid fiber composition on the mechanical behavior of fiber cement composites. It seems that a wide range of sizes in hybrid fibers is necessary to enable significant improvement of mechanical behavior in fiber cement composites compared with cement composites reinforced with unisize fibers.
The mean modulus of rupture and its standard deviation, shown in Figure 7b, was evaluated for each mix at seven days based on the peak load of unnotched specimens, represented as mean responses in Figure 8. All fiber mixes had a significantly higher modulus of rupture than the reference mix. Two observations can be made. First, the modulus of rupture is dependent on fiber size distribution for the same fiber content. The milled mix (ML2) showed the lowest modulus of rupture, followed by the hybrid mix (H2), then the chopped mixes (CH2). Second, the increase in modulus of rupture is proportional to the total fiber volume content since the milled mix (ML8) with 8% content of fiber was higher than milled mix (ML2) with 2% content of fiber. The hybrid mix (H5) with 5% content of fiber was also higher than the milled mix (H2) with 2% content of fiber. A similar analysis was performed for each mix at 28 days, shown in Figure 7b, based on the peak load of unnotched bending specimens represented as mean responses in Figure 9. Similar to the behavior at seven days, all fiber mixes had a significantly higher modulus of rupture than the reference mix. Similarly, it is observed again that the modulus of rupture is proportional to the total fiber volume content and also dependent on fiber size distribution in the mix. The effect of fiber size distribution in this case is represented as the average fiber length in the matrix, which relates to the fiber critical length. Finally, this result is consistent with the research of [50,51,72,73,76,77,78,79,80] showed also the positive effect of hybrid fiber composition on improving modulus of rupture, splitting strength, and tensile strength.
The mean elastic modulus and its standard deviation, shown in Figure 7c, were evaluated for each mix at seven days based on the slope of the linear elastic region of the unnotched three-point bending response, represented as mean responses in Figure 8. The elastic modulus of all mixes containing fiber did not have a statistically significant difference from the reference mix. Similar observations by other researchers were reported in the literature [47,81]. The fiber size distribution and content also did not show any statistical effect on the elastic modulus. This might be attributed to the significantly small volume fraction of the fibers. An estimate of the elastic modulus of using composite theory would show that a much higher fiber volume fraction would be necessary to result in an observable change in the elastic modulus [52]. A similar analysis was performed for each mix at 28 days, shown in Figure 7c, based on the slope of the linear elastic region of unnotched three-point bending response, represented as mean responses in Figure 9. Similar to what was observed at seven days, there was no statistically significant difference in the elastic modulus despite the fiber volume content or fiber size distribution changes.

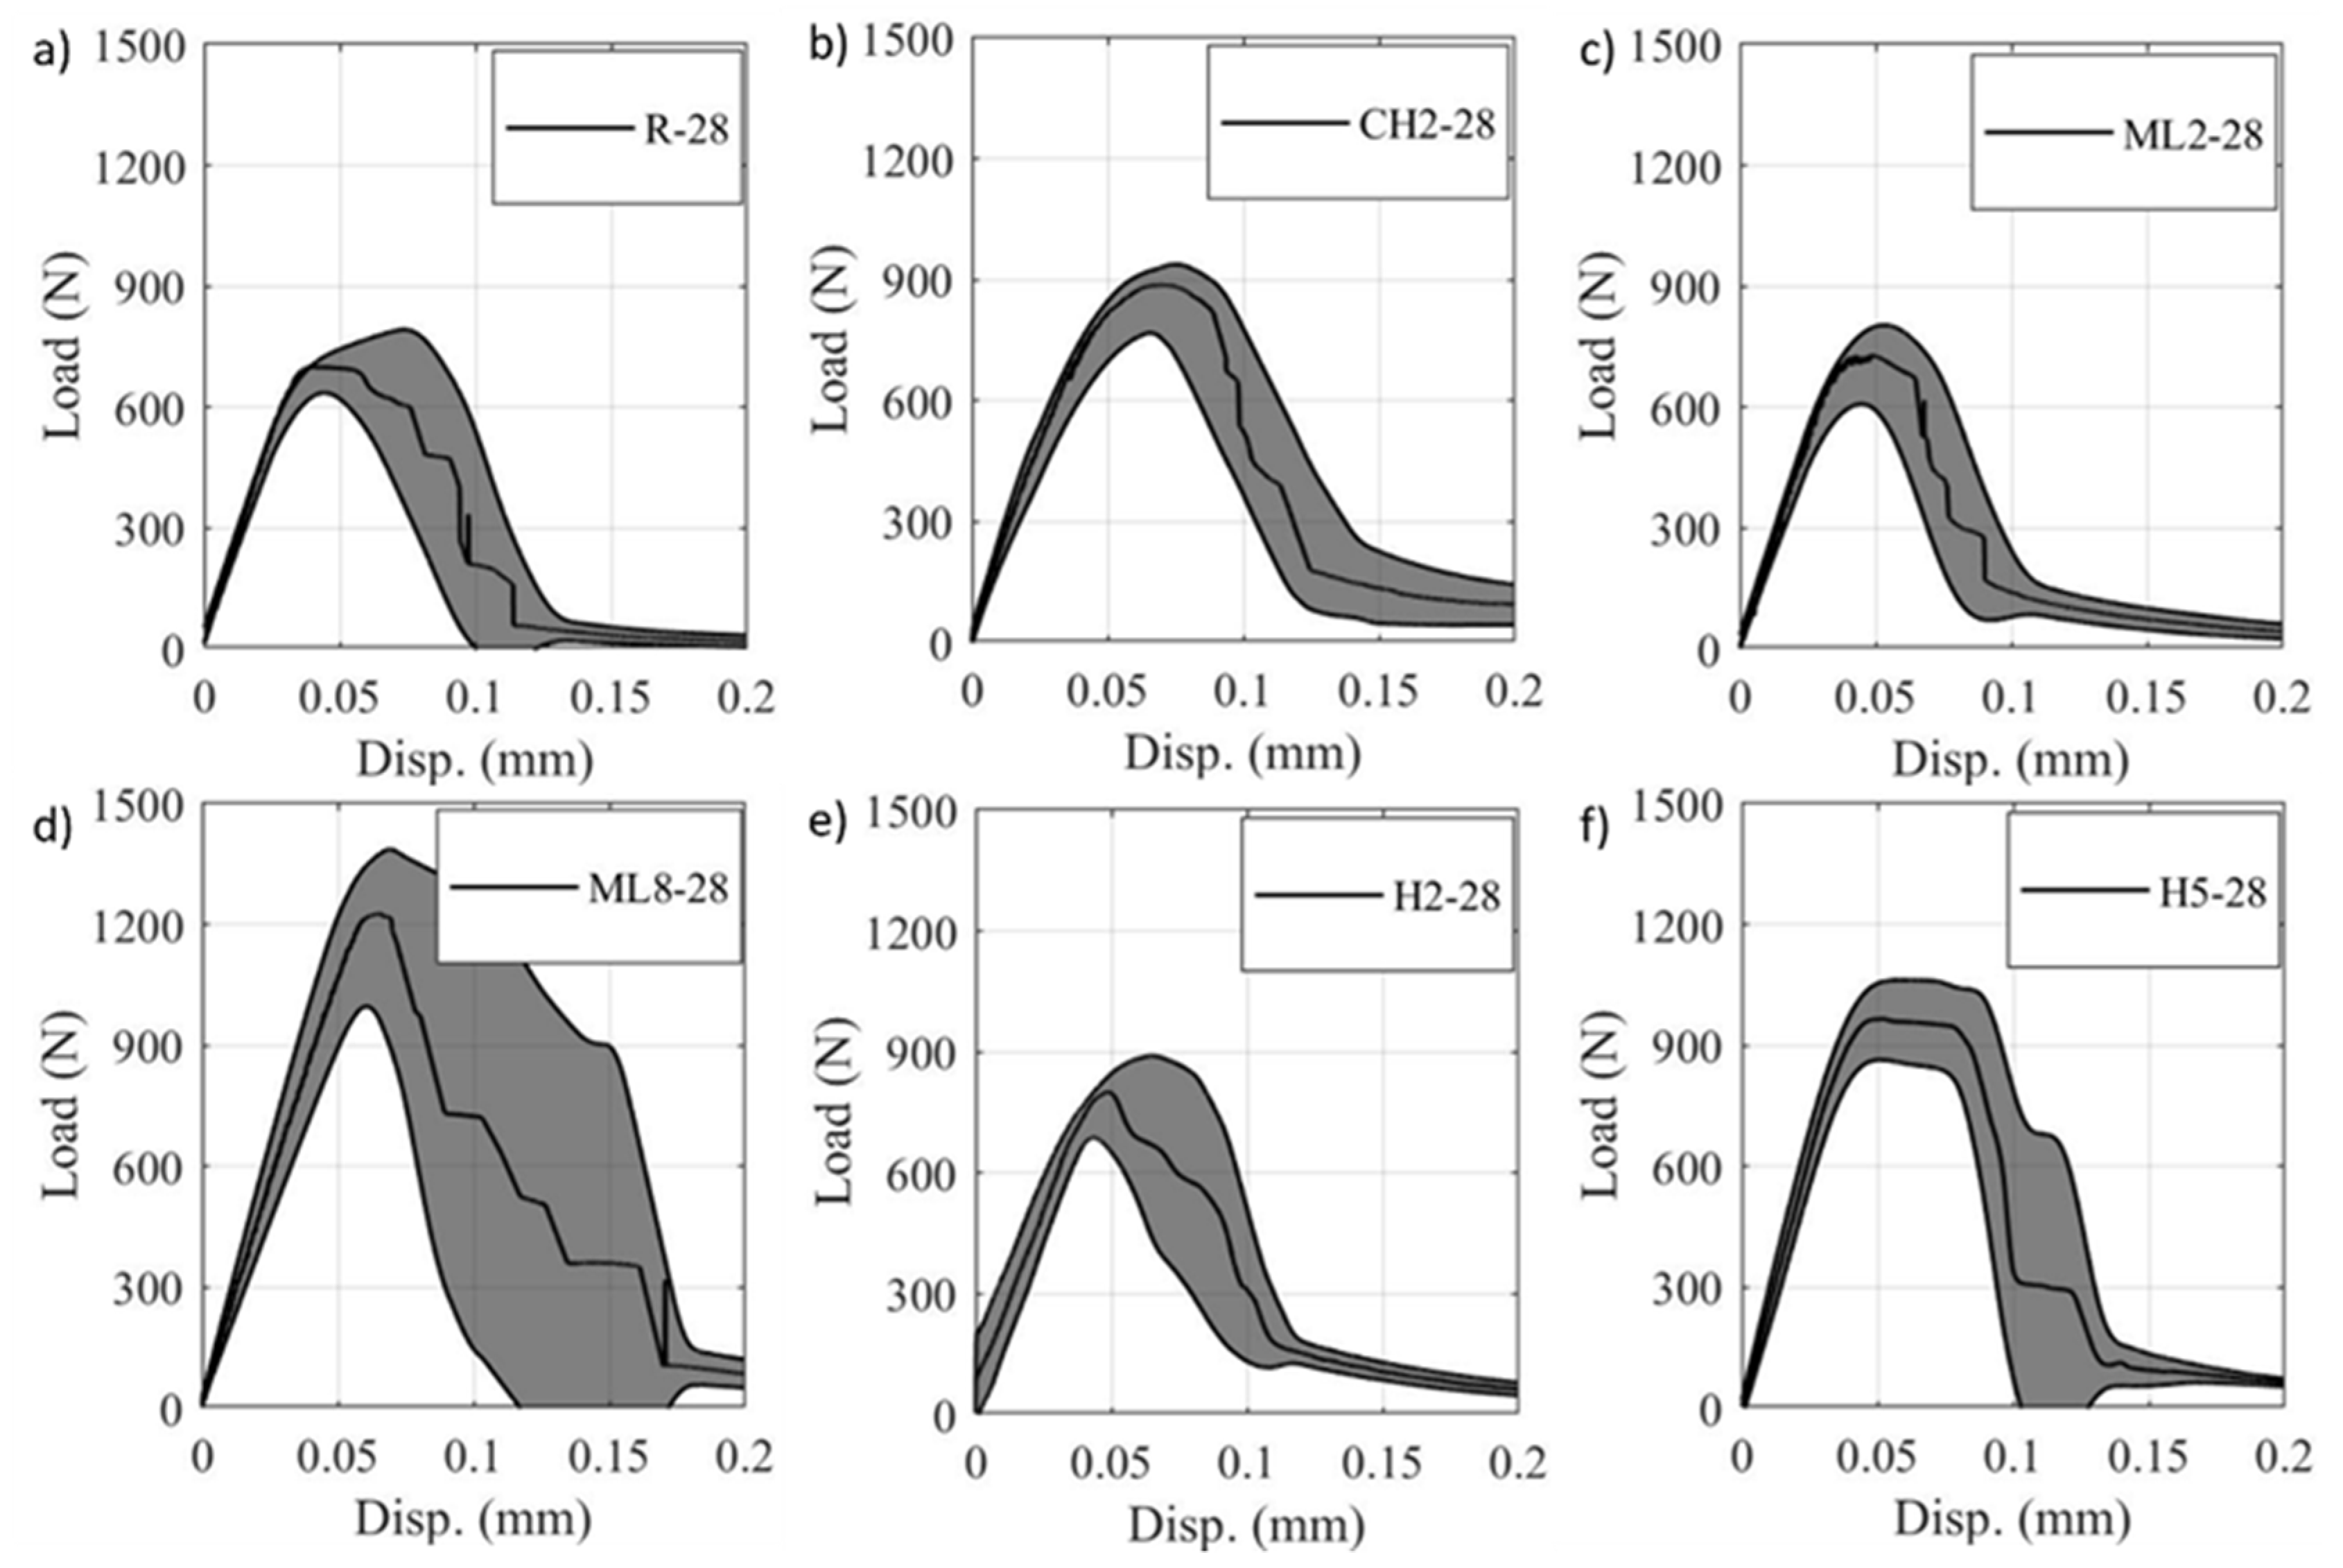
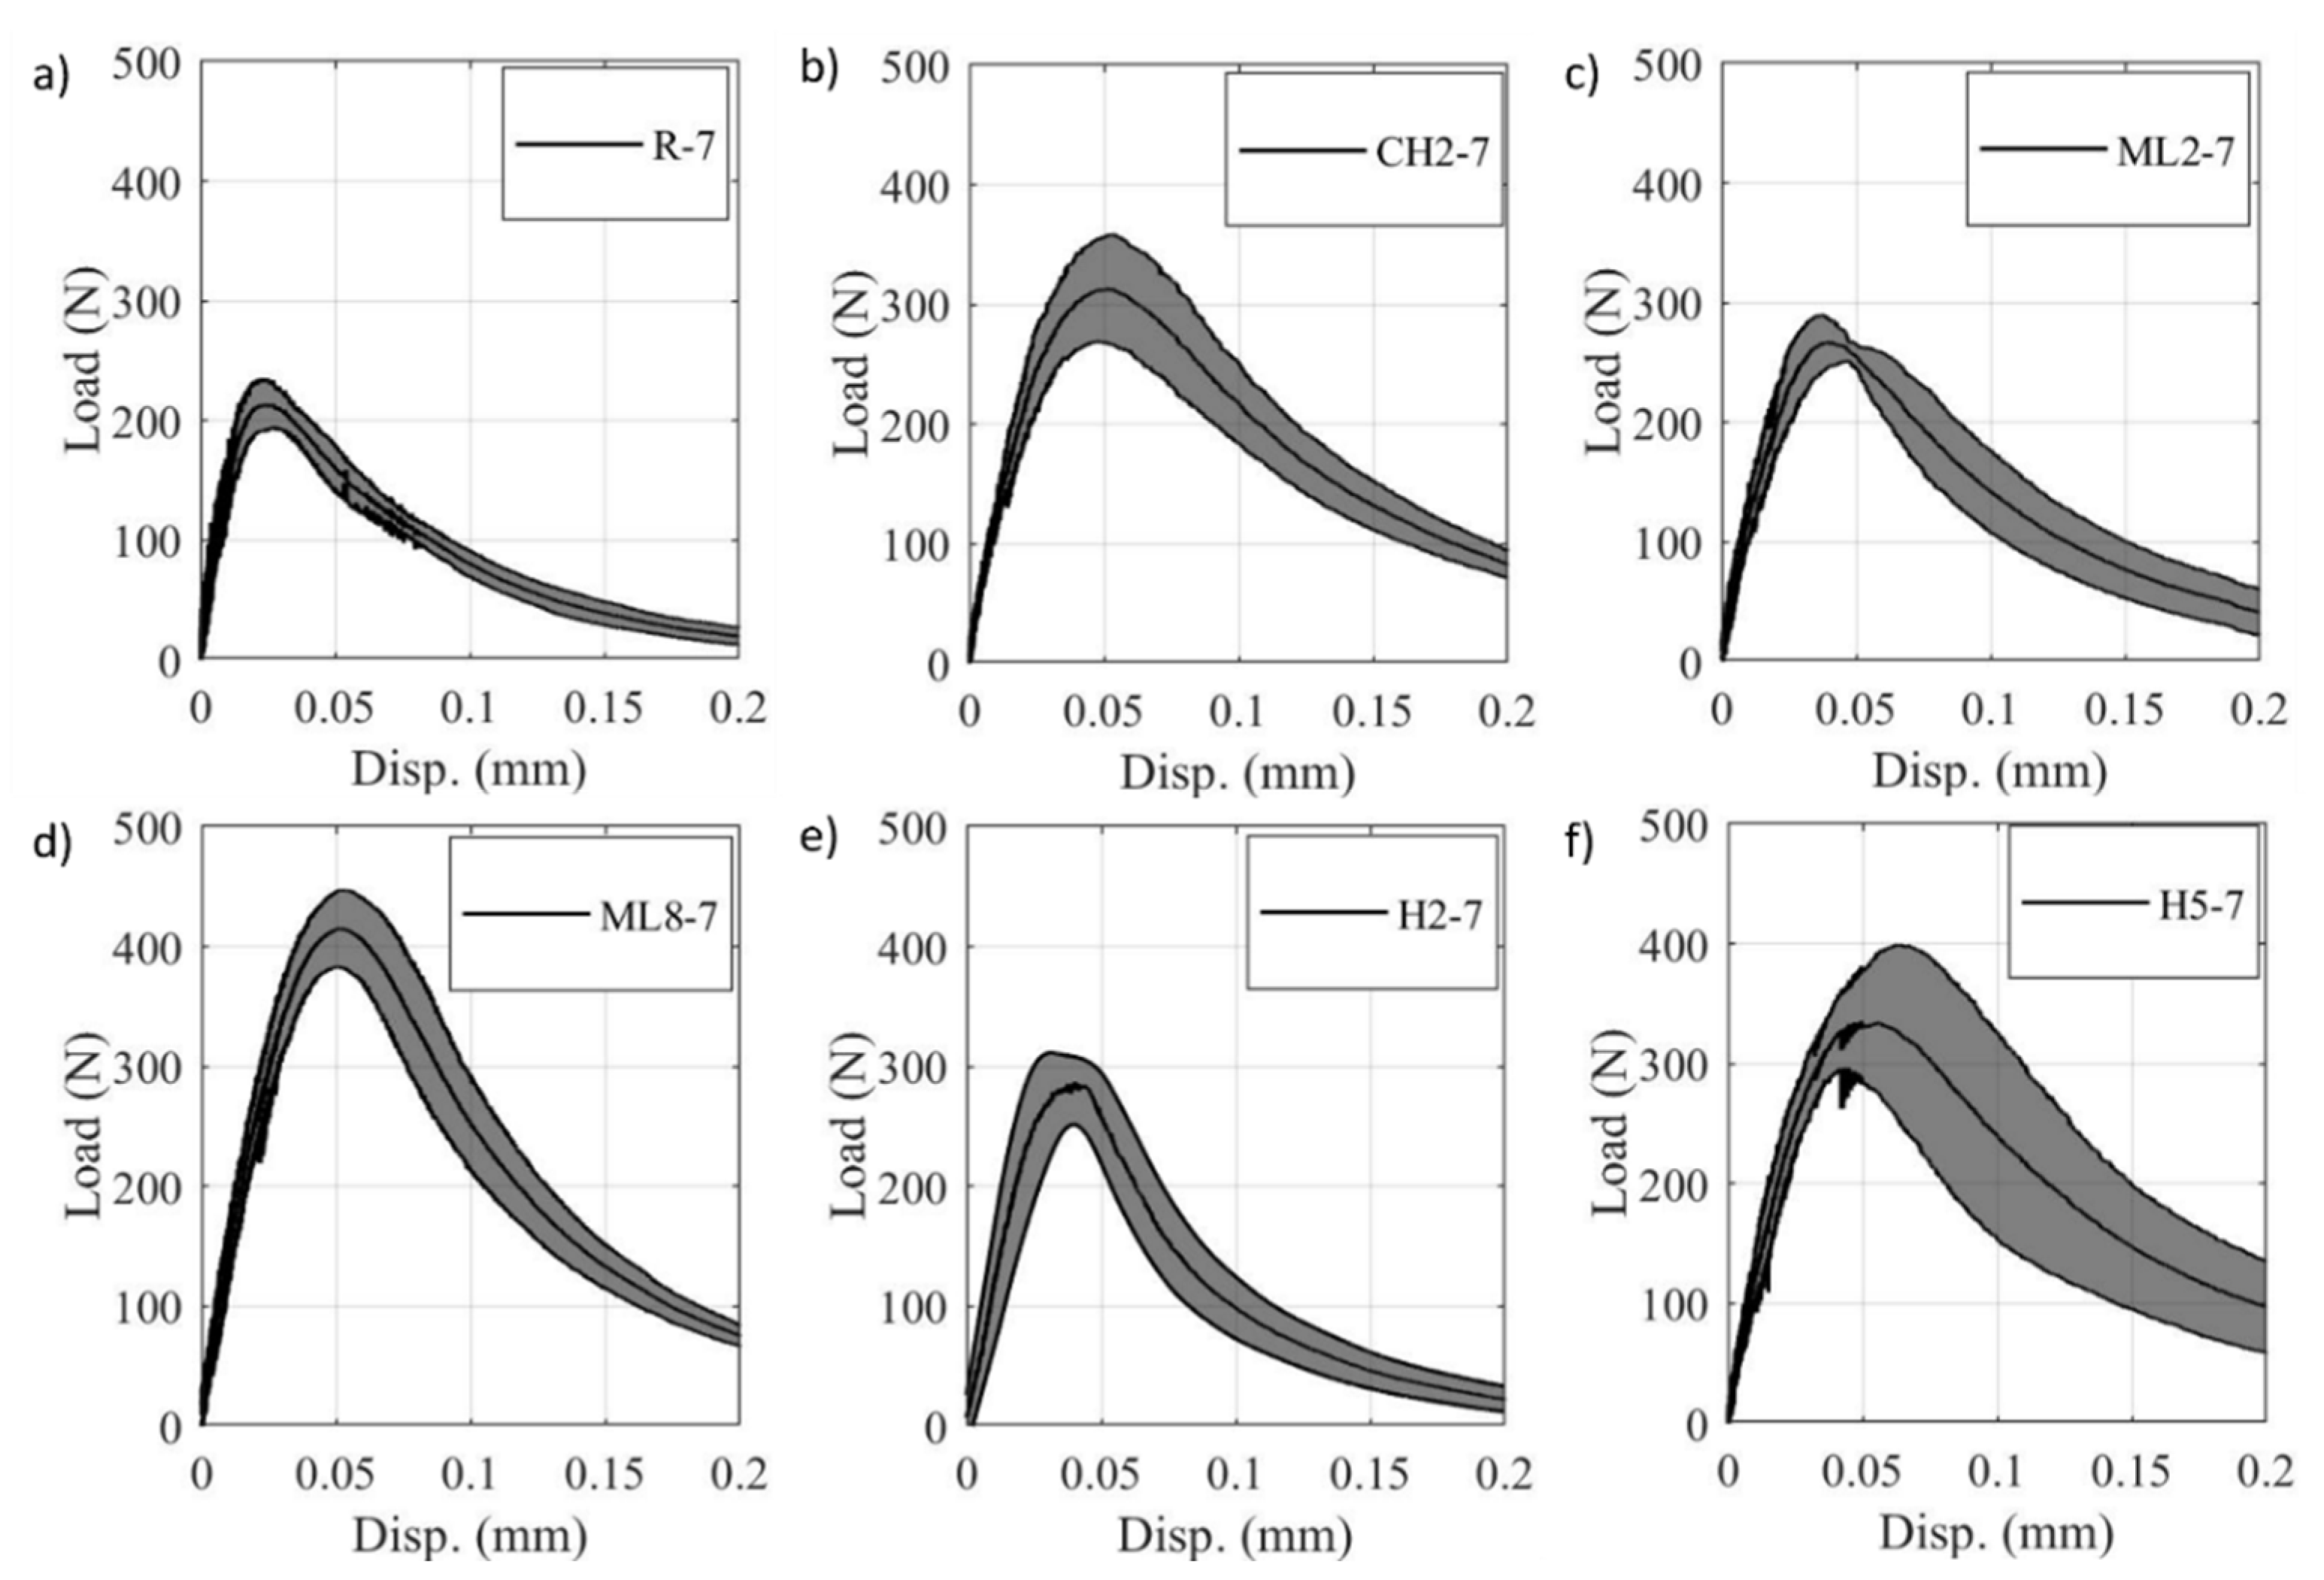
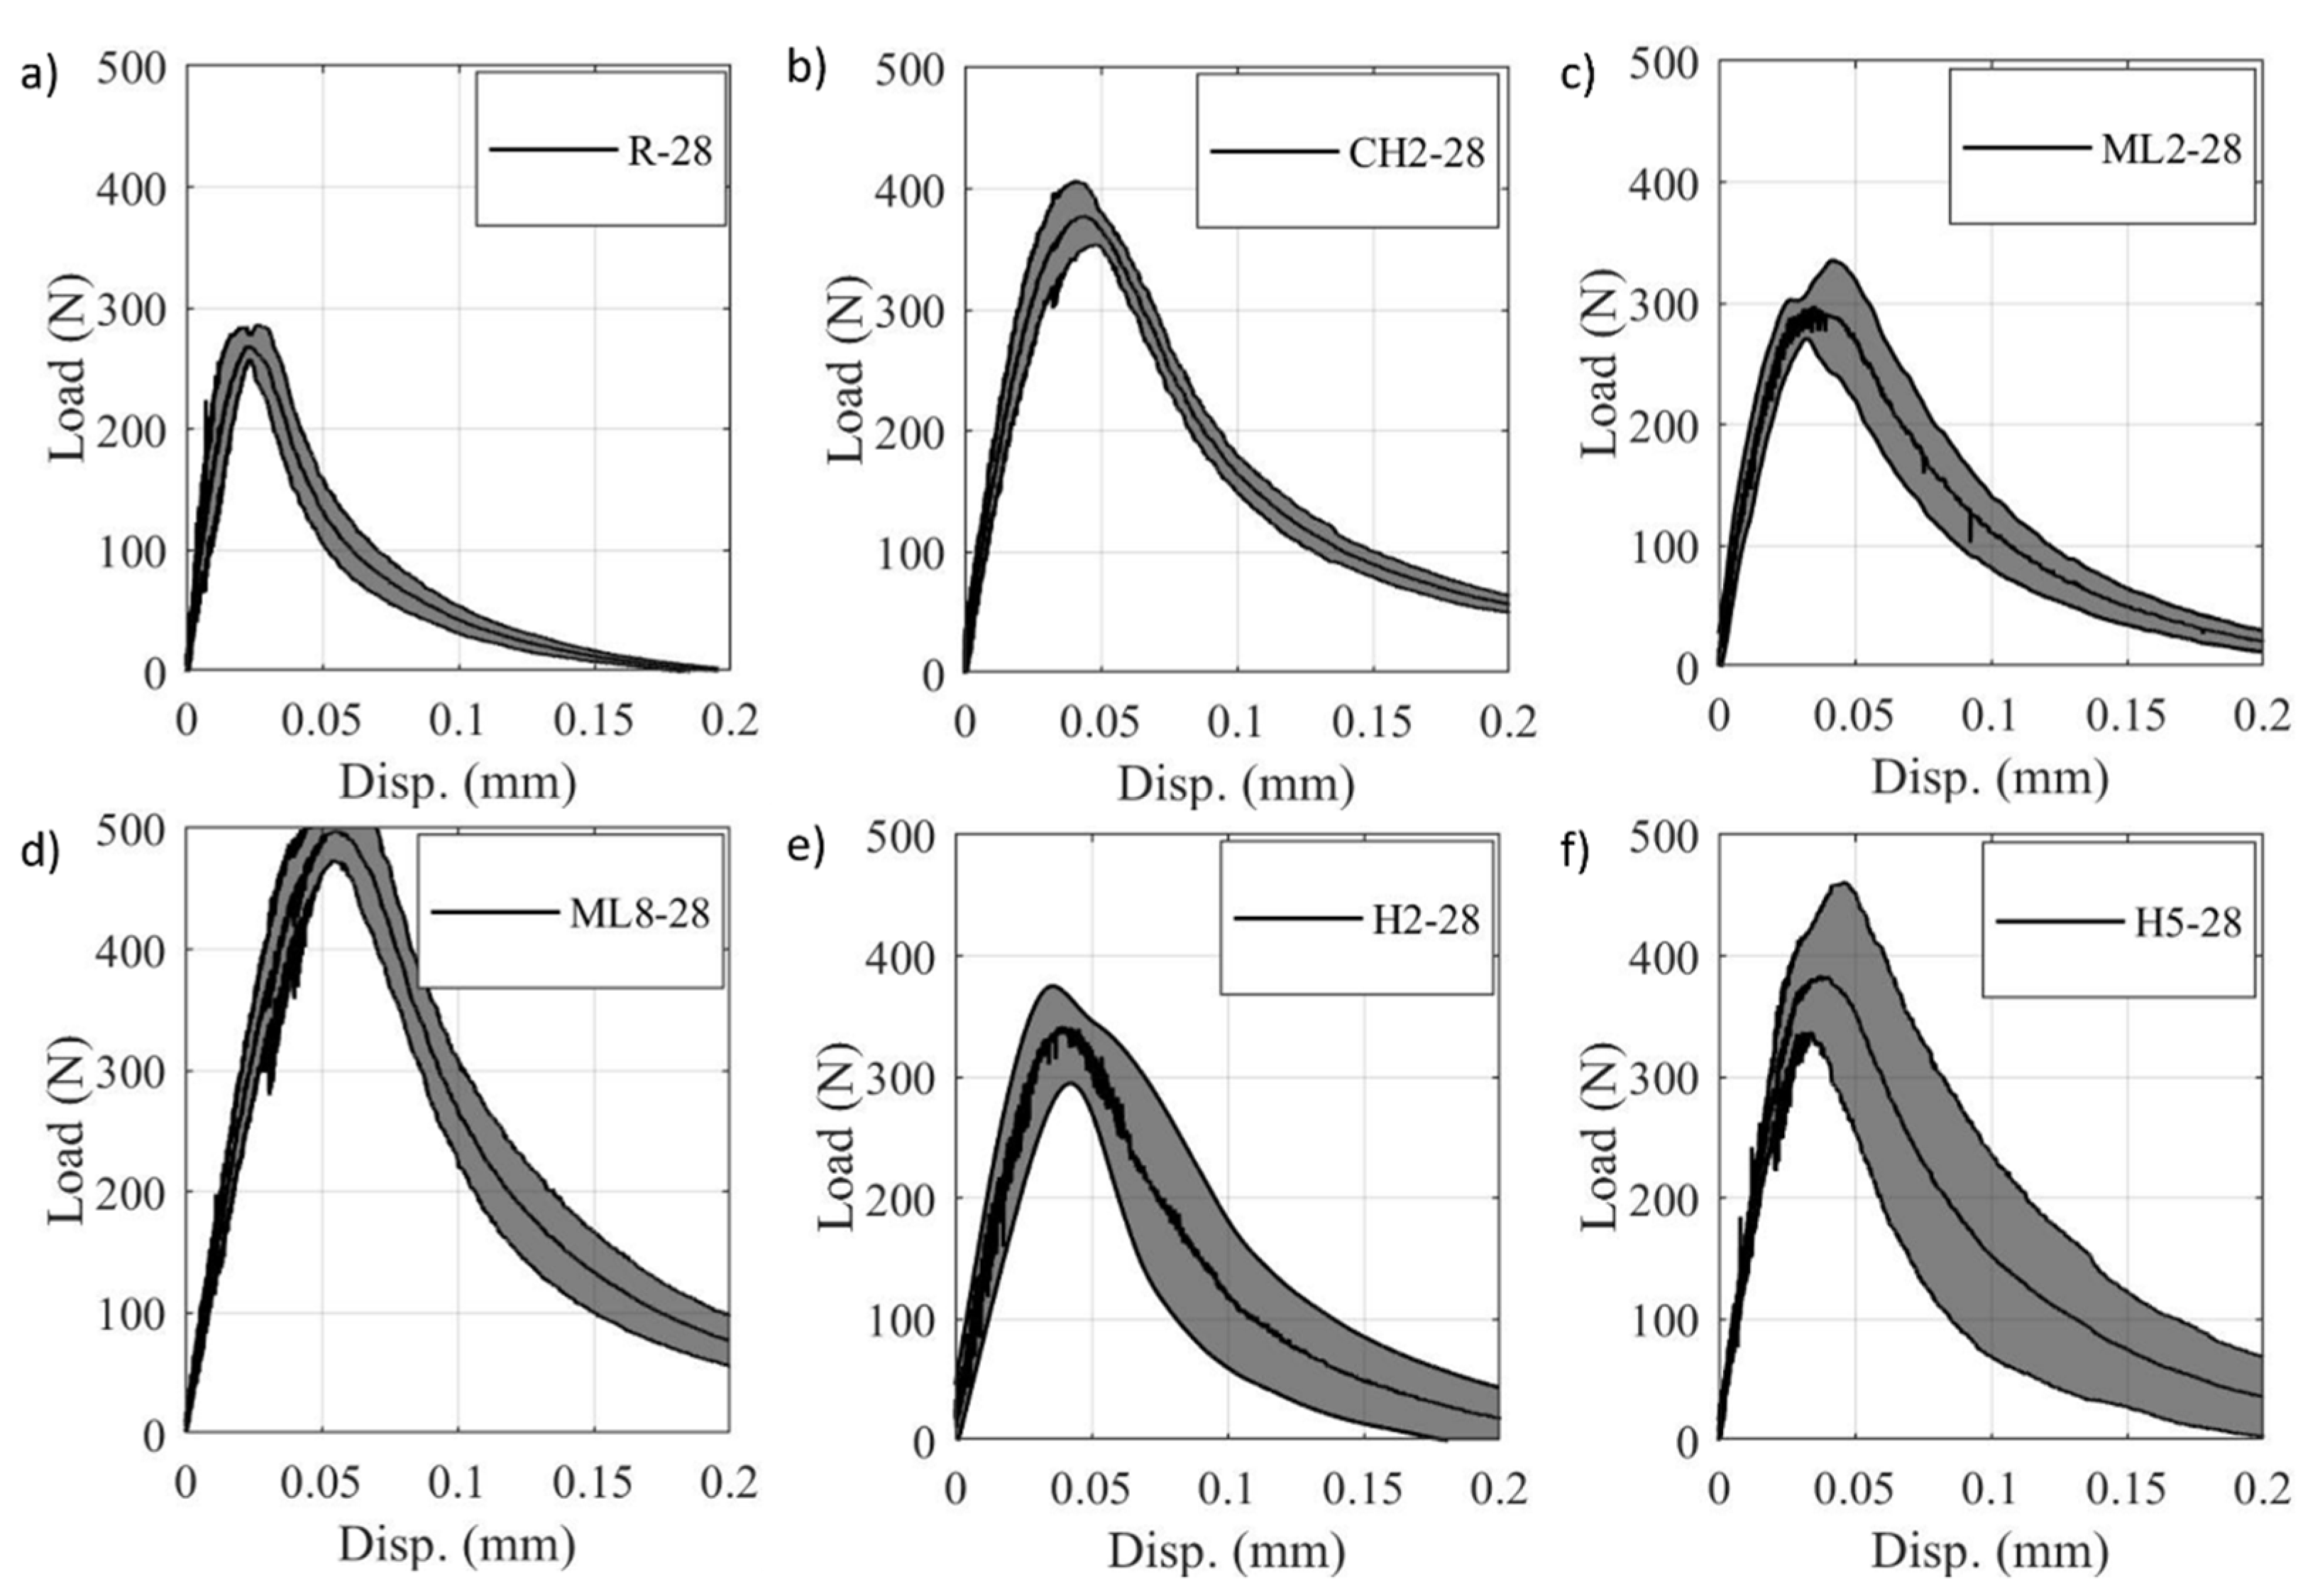
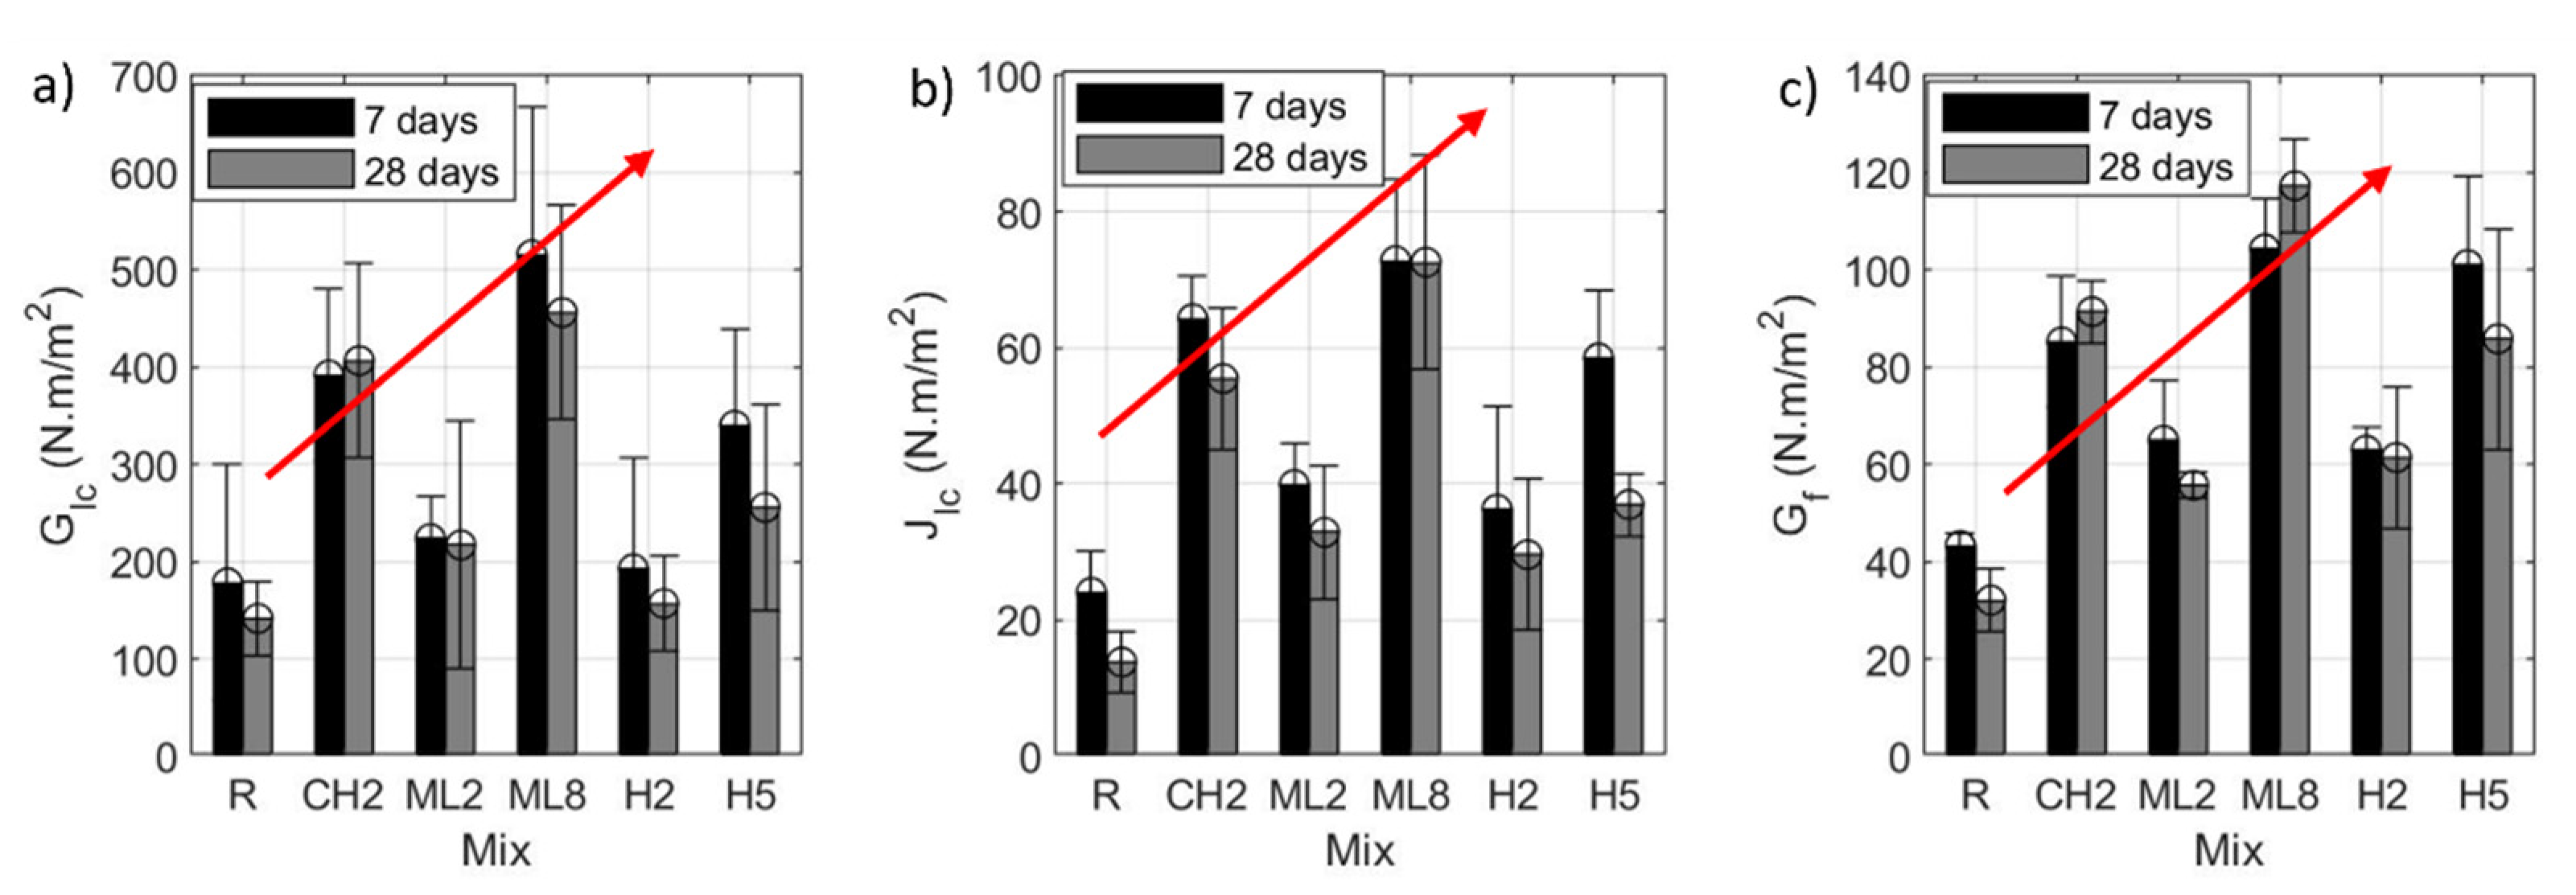
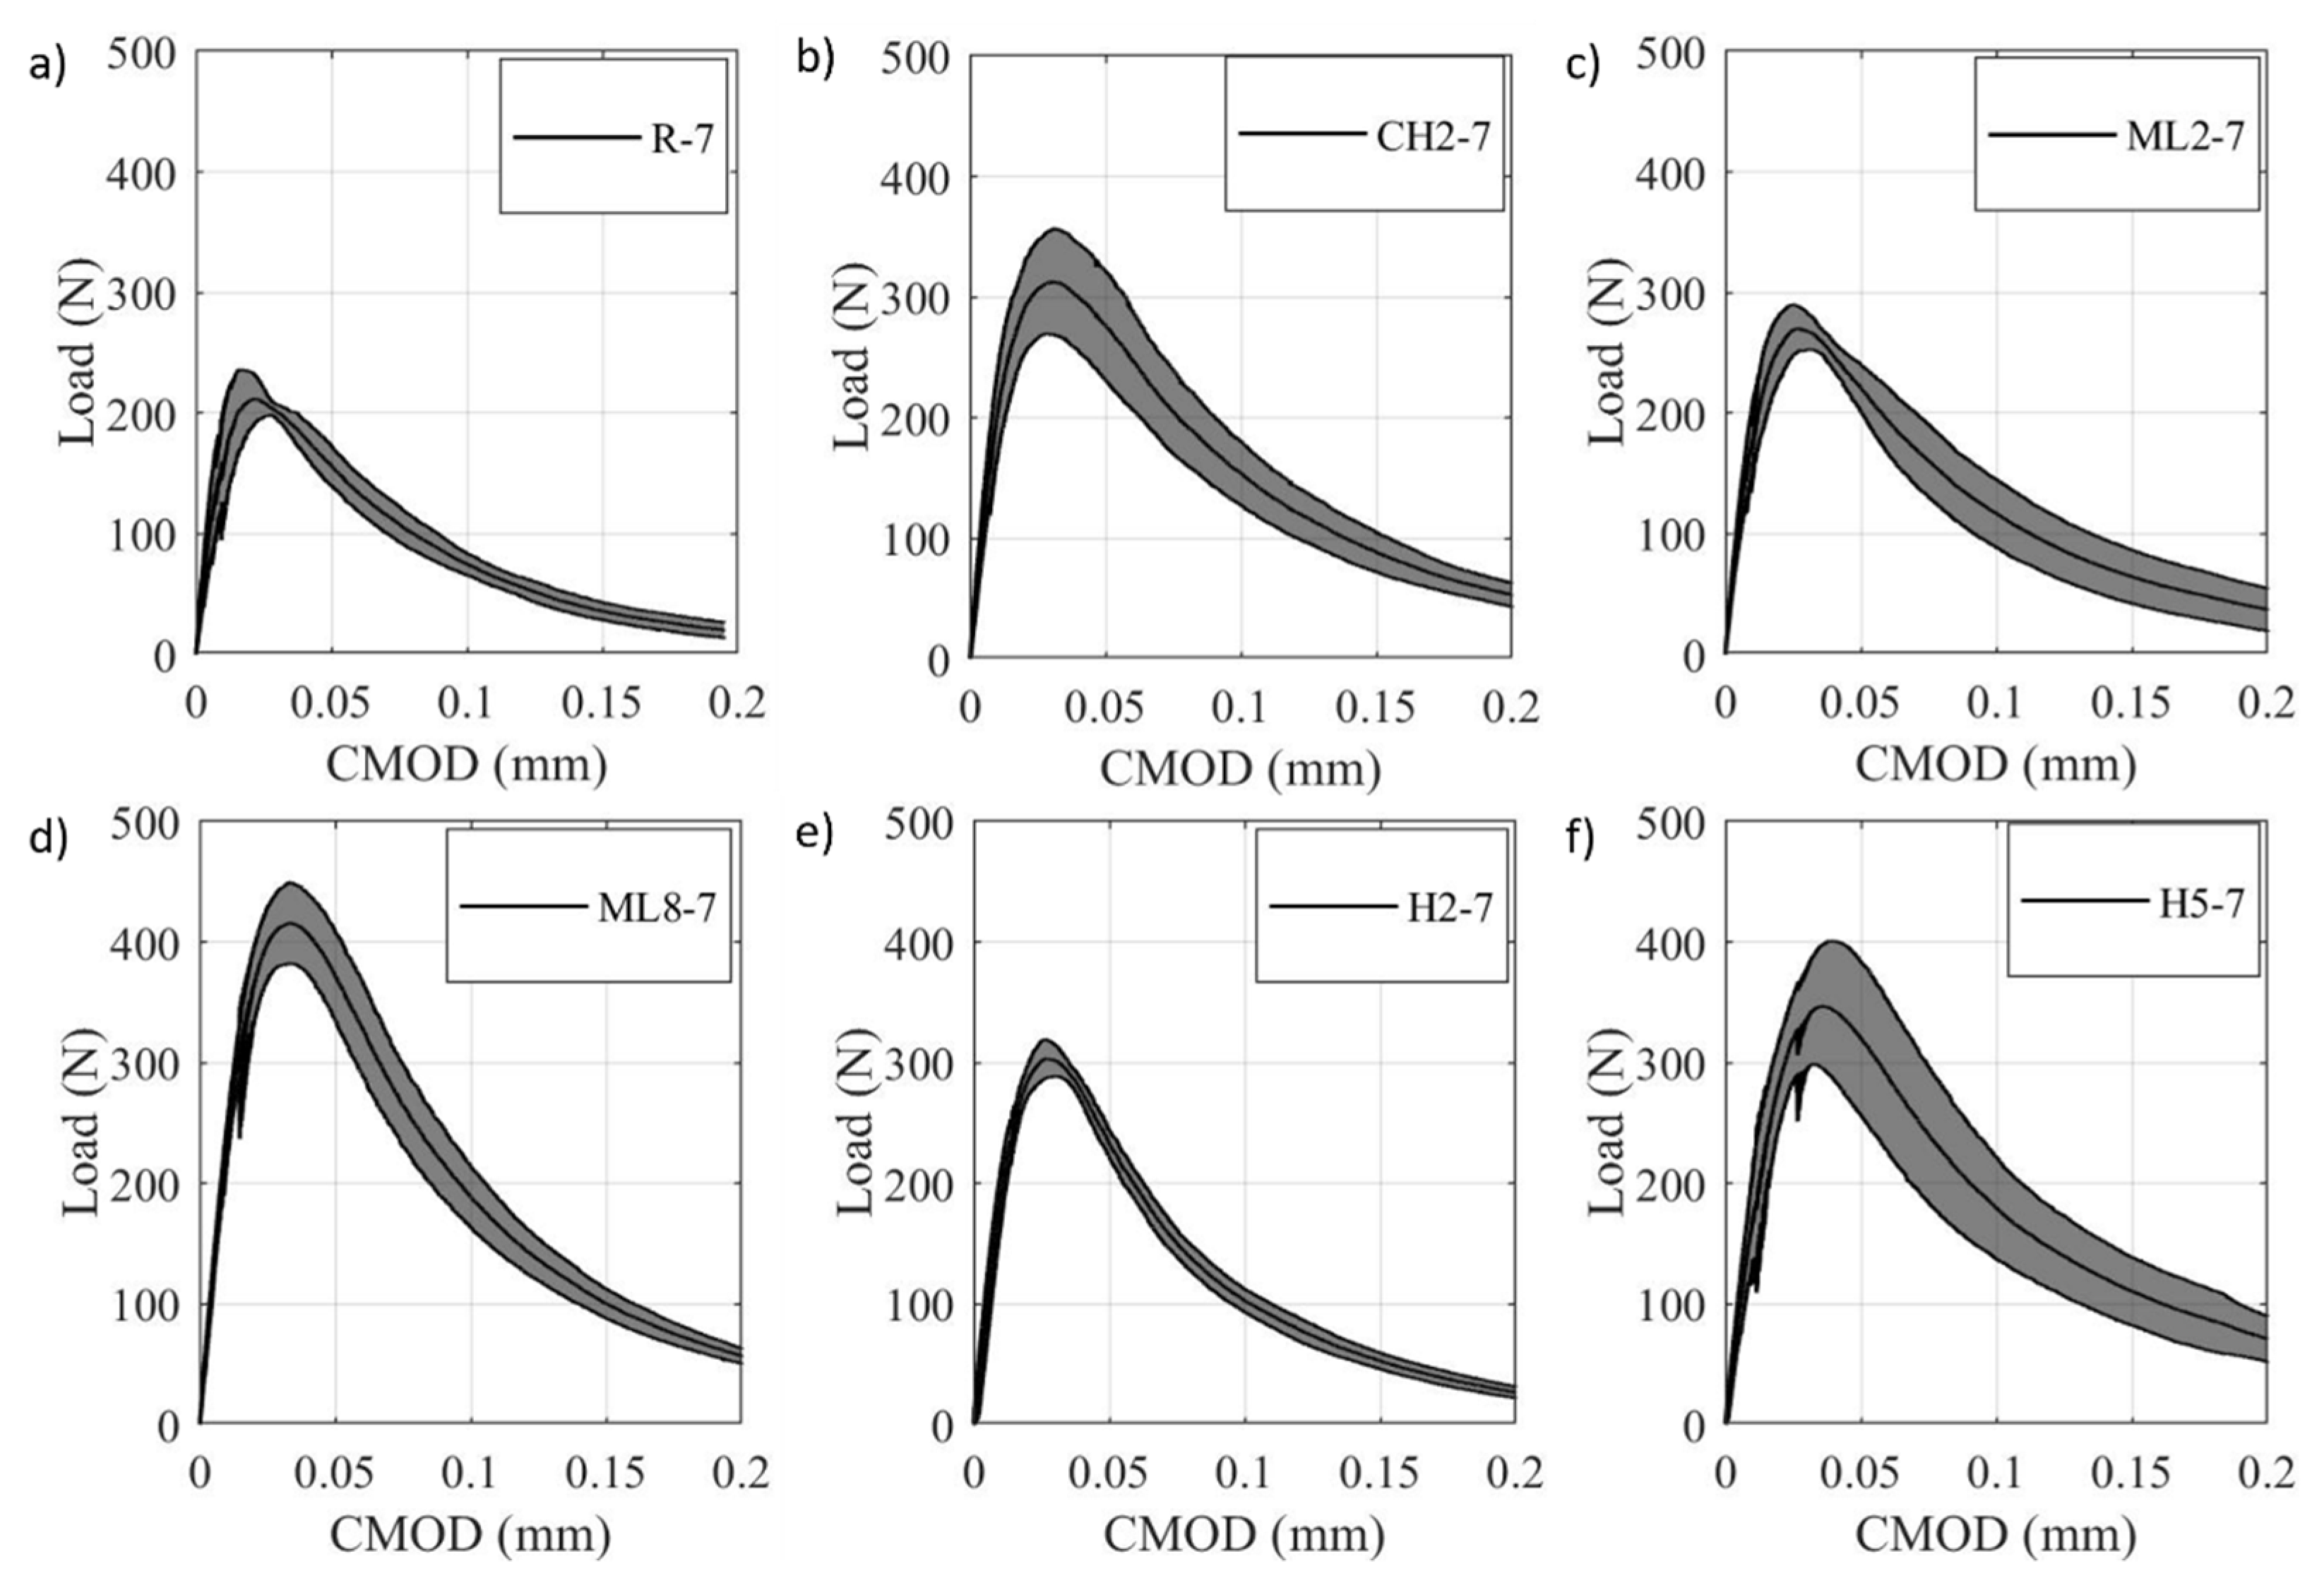
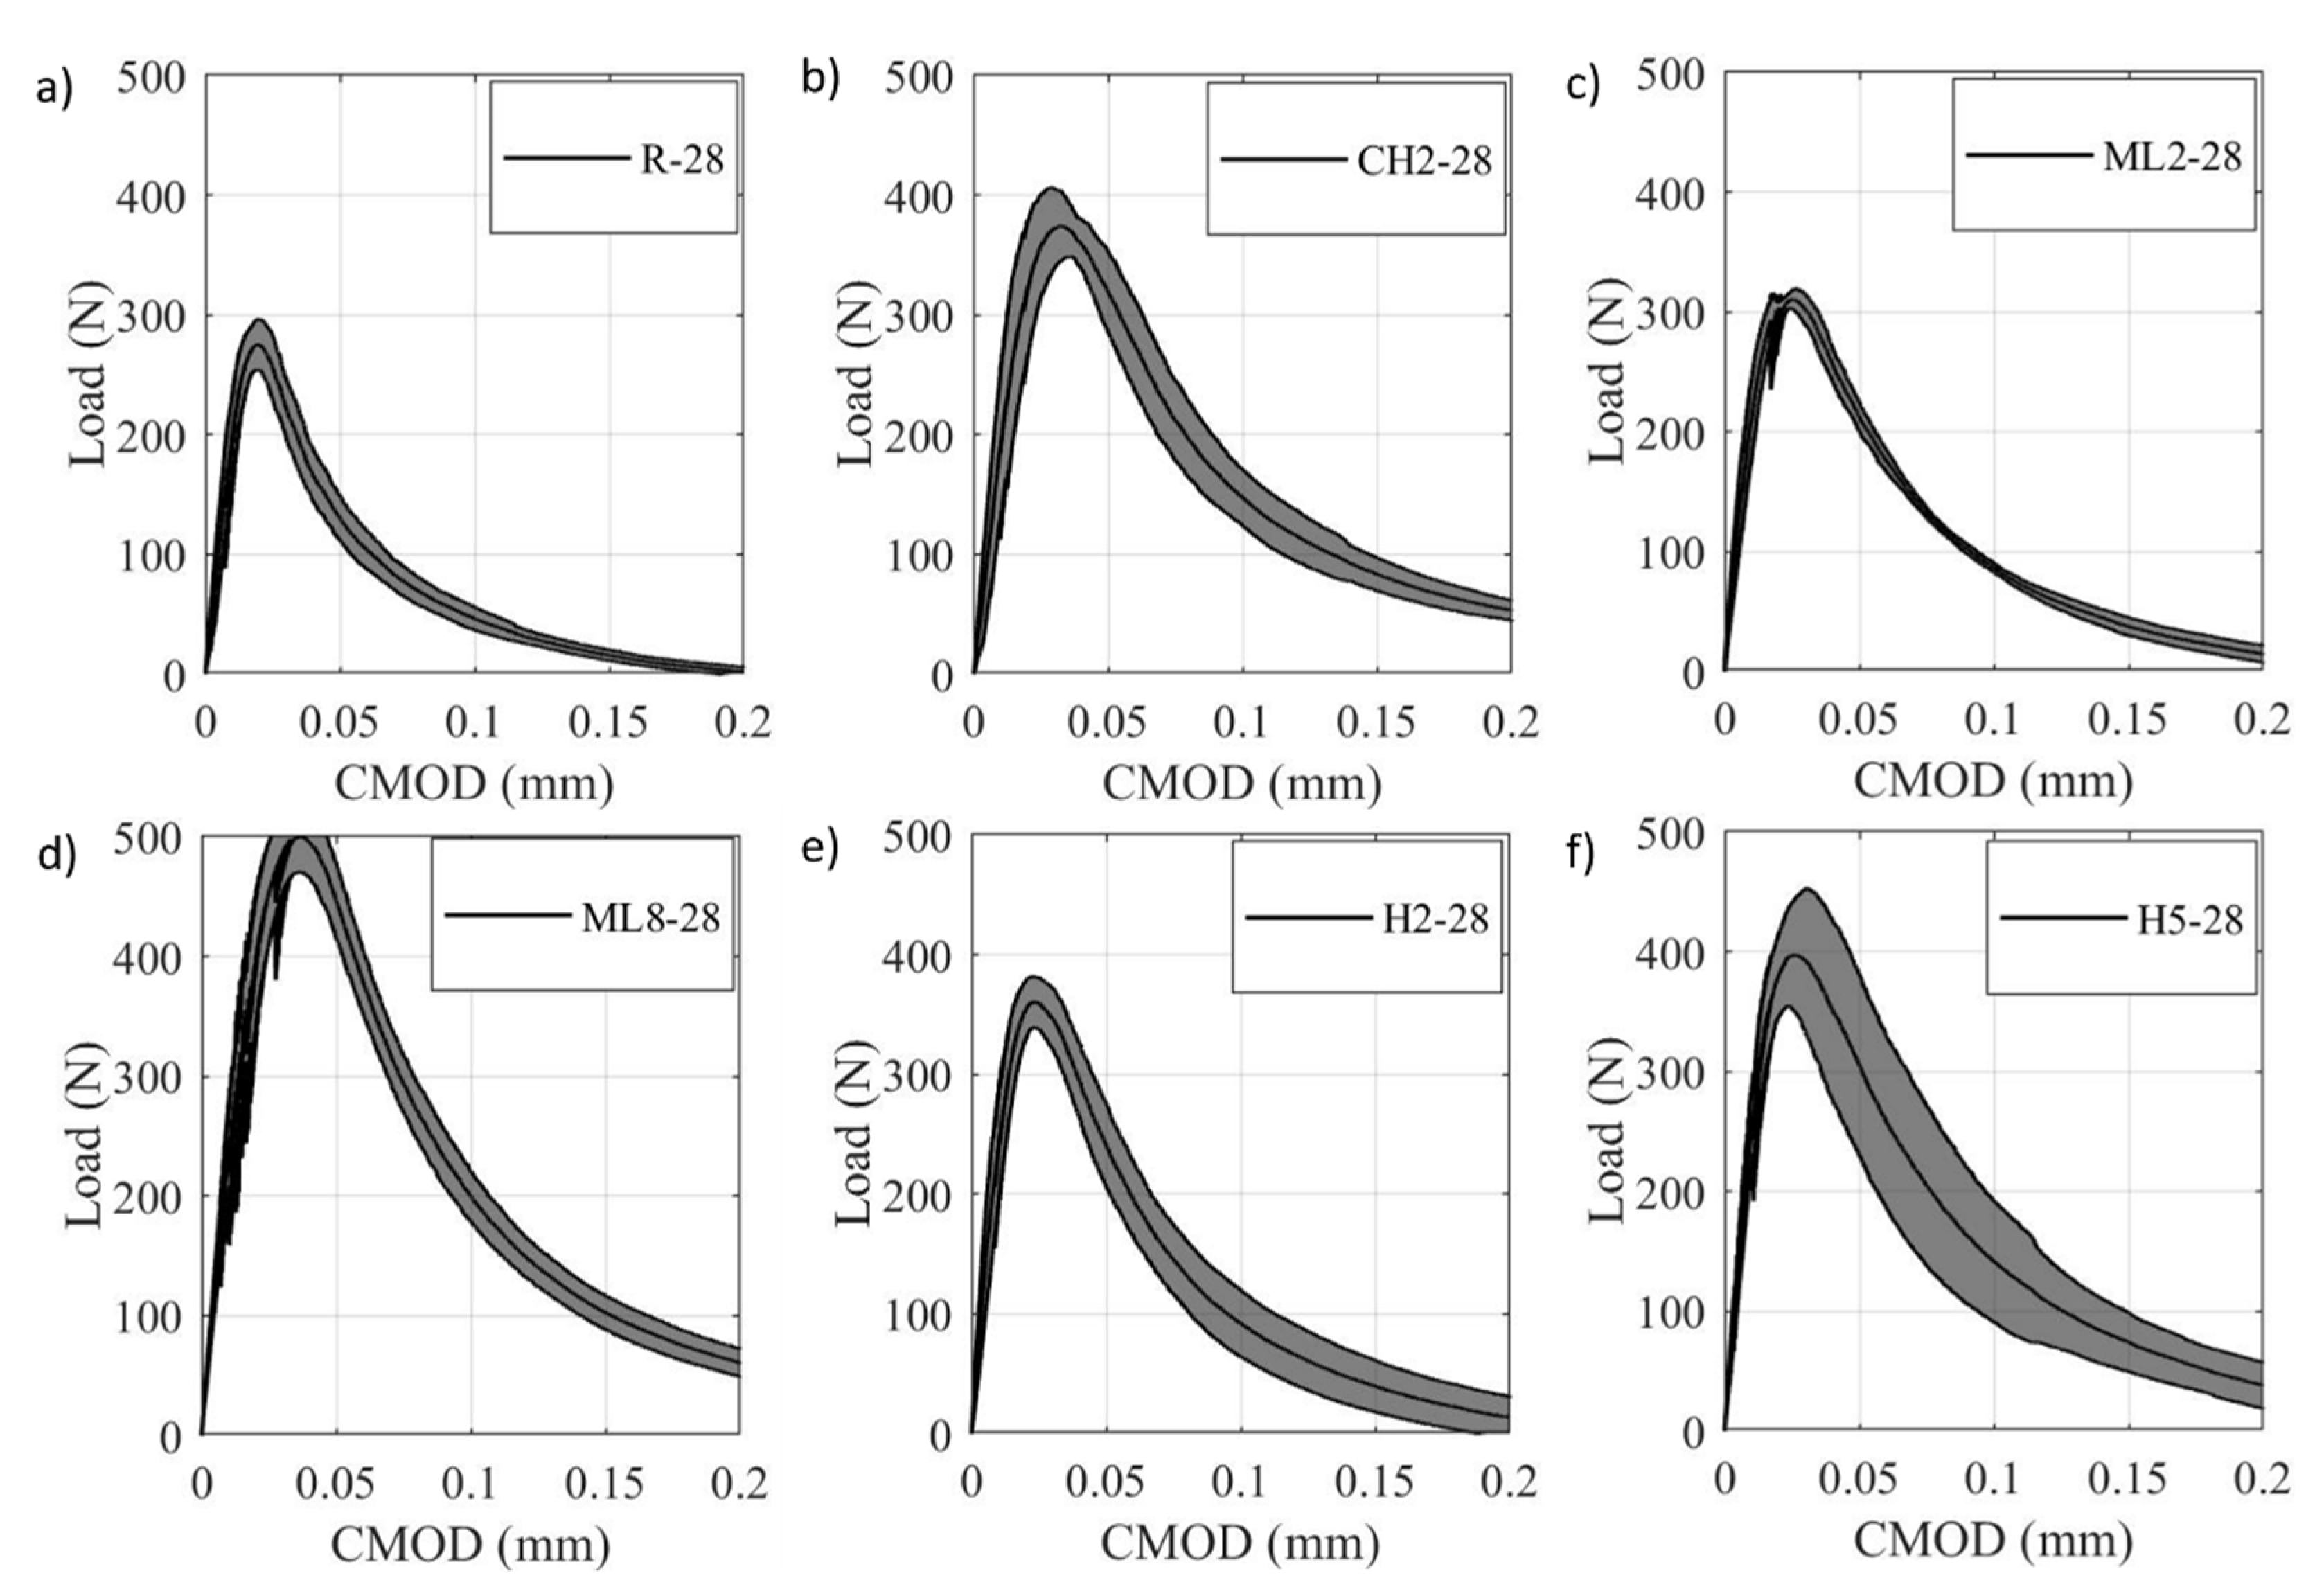
3.3. Fracture Properties

Based on the results of notched bending tests, represented as mean load–displacement in Figure 10 and Figure 11, and load-CMOD in Figure 12 and Figure 13, the fracture properties of each mix were calculated. The mean and standard deviation of the linear elastic fracture toughness G I C at seven days are shown in Figure 13a, based on the mean notched bending responses in Figure 10. Despite the fiber volume content, all fiber mixes had significantly higher G I C than the reference mix. Similar to the modulus of rupture response, it is also observed that the increase in G I C is proportional to both fiber size distribution and the total fiber volume content. The chopped mix (CH2) had higher fracture toughness than both the milled mix (ML2) and hybrid mix (H2). The fracture toughness of the milled mix (ML8) was higher than that of the milled mix (ML2). Similarly, fracture toughness of the hybrid mix (H5) was higher than that of the hybrid mix (H2). A similar analysis for each mix at 28 days, shown in Figure 14a, based on the mean notched bending responses in Figure 11. Similar to the behavior at seven days, all fiber mixes have significantly higher G I C than the reference mix. It could also be observed once again that the G I C was proportional to the fiber volume content and fiber size distribution. A reduction in GIC was observed at 28 days of age compared with GIC at seven days of age. Similar observations showing a decrease of G I C with time were reported for Ultra High Performance Concrete (UHPC) [64].
The critical J-integral J I C representing the elastic-plastic fracture toughness is based on the mean response of notched specimens and unnotched specimens. The mean values of J I C at seven days, are shown in Figure 14b, is also proportional to the fiber volume content and fiber size distribution. The chopped mix (CH2) has the highest J I C than the milled mix (ML2) and the hybrid mix (H2). The milled mix (ML8) has the highest J I C than the milled mix (ML2), and the hybrid mix (H5) has the highest J I C than the hybrid mix (H2).
Similarly, at 28 days, the mean J I C was also proportional to the fiber volume content and fiber size distribution. It is also observed that the reduction of J I C with time as shown in Figure 14b is similar to the response of G I C . Mean fracture energies Gf at both 7 and 28 days are shown in Figure 14c; it could be observed that Gf is proportional to the total content of fiber, and fiber size distribution in the mix. The difference in fiber volume content is typically masking the effect of fiber size distribution on fracture energy. In the case of constant fiber volume, the maximum fracture energy would occur at the mix with fiber length equal to the critical fiber length [3,44]. The reduction with time in Gf could also be observed for each respective mix. Similar to the modulus of rupture, the effect of fiber size distribution in this case could be represented as the average fiber length in the matrix, which relates to the fiber critical length.
It is evident based on the presented results that the distribution itself of fiber volume content should be studied, with mixes that have the same fiber content and several size distributions. This is consistent with earlier work showing a general effect of hybrid fiber distribution to improve fracture properties [23,45,48,50,74,75,77,80,82,83,84]. The presented work showed the possible effect at a limited number of fiber size distributions. The expansion in studying a wider range of distributions will facilitate decoupling the effect of the fiber size distribution from fiber volume content. It will also explain in more detail the variant effects of fiber size distribution between tension and compression behavior.
The aforementioned results could be additionally tied to the SEM images taken from chopped, milled, and hybrid mixes. As shown in Figure 15, it is apparent that both chopped and milled fibers existed at the fracture surface. This would indicate the functionality of both chopped and milled fibers in controlling crack initiation and propagation, respectively. The SEM analysis showed how the size of the microcracks in the fracture surface is similar for all the analyzed specimens. The distribution of the fibers throughout the specimen was uniform. The observations at a microstructural level showed the presence of calcium silica hydrates (CSH), calcium hydrates (CH), and traces of ettringite for all specimens. Regarding the microscale fracture pattern, it can be observed how two fiber fracture modes coexist, the first mode being fiber tensile rupture (marked in Figure 15 with circles), and the second mode being fiber pull-out (marked in Figure 15 with rectangles). It is important to note that fiber pull-out failure mode would result in a higher energy consumption than fiber rupture, thus improving fracture toughness while fiber rupture would increase the tensile/flexural strength [3]. This phenomenon can also be observed from a quantitative mechanical perspective in Figure 14. The specimen with high fracture toughness is ML8, which is a specimen with a high content of short fibers in which the fiber pull-out mode is more predominantly observed. Furthermore, the fiber reinforced cement composite mix (CH2) is the one achieving high flexural capacity and was the specimen where fiber rupture mode was the most predominant fracture mode observed using the SEM.

4. Conclusions

The effect of carbon fiber size distribution was investigated by considering six different mixes with different carbon fiber volume content and size distributions. This testing matrix was reduced from a larger flowability testing matrix of fiber volume content up to 10% and CCMF/MCMF ratios of 1:0, 4:1, 2:1, 1:1, 1:2, 1:4, and 0:1, while considering a flowability limit of 80%. Test results showed that the use of fiber volume content with wider size distribution significantly improves the mix’s flowability. While the milled mixes had the highest flowability, the hybrid ones allowed for utilizing a high content of chopped fibers with acceptable flowability.
The presence of fiber size distributions across different scales improves the compressive strength response. The hybrid mixes investigated showed the highest compressive strength at both testing times despite not having the highest fiber volume content. This reflects the complex concrete behavior of both crack initiation and propagation under uniaxial compression. On the other hand, the modulus of rupture was proportional to the fiber volume content, yet also depends on fiber size distribution. The modulus of elasticity did not show a significant relationship to neither the fiber volume content nor distribution. The critical energy release G I C , critical J-integral J I C , and fracture energy Gf were also proportional to both fiber volume content and fiber size distribution, with the first masking the latter. This could be explained as those fracture properties reflect a single crack Mode I failure.
Microfiber reinforced cementitious composites’ mechanical and fracture properties are dependent on different factors related to microfiber size and distribution. The compressive strength can be improved by introducing fiber size distribution. The modulus of elasticity is minimally affected by fiber volume content. The modulus of rupture and fracture energy metrics is strongly dependent on fiber volume content, with some effect of the fiber size distribution. Decoupling the effects of fiber content and distribution on the aforementioned properties requires further investigation.

Author Contributions

Conceptualization, E.M., J.S. and M.M.R.T.; methodology, E.M., J.S. and M.M.R.T.; software, M.A.; validation, M.A. and D.H.M.; formal analysis, M.A. and D.H.M.; investigation, M.A., D.H.M., J.S. and M.M.R.T.; resources, E.M. and M.M.R.T.; data curation, M.A. and D.H.M.; writing—original draft preparation, M.A.; writing—review and editing, D.H.M., J.H., E.M., J.S. and M.M.R.T.; visualization, M.M.R.T.; supervision, M.M.R.T.; project administration, M.M.R.T.; funding acquisition, M.M.R.T. All authors have read and agreed to the published version of the manuscript.

Funding

This research was funded by Sandia National Laboratories, Albuquerque, New Mexico, USA.

Institutional Review Board Statement

Not applicable.

Informed Consent Statement

Not applicable.

Acknowledgments

The authors would like to acknowledge the financial support from Sandia National Laboratories. The authors also acknowledge the generous support of the Dana C. Wood Endowment at the University of New Mexico. Sandia National Laboratories is a multi-mission laboratory managed and operated by National Technology and Engineering Solutions of Sandia, LLC, a wholly owned subsidiary of Honeywell International, Inc., for the U.S. Department of Energy’s National Nuclear Security Administration under Contract DE-NA-0003525. This paper describes objective technical results and analysis. Any subjective views or opinions that might be expressed in the paper do not necessarily represent the views of the U.S. Department of Energy or the United States Government.

Conflicts of Interest

The authors declare no conflict of interest.

References

  1. Shi, T.; Li, Z.; Guo, J.; Gong, H.; Gu, C. Research progress on CNTs/CNFs-modified cement-based composites—A review. Constr. Build. Mater. 2019, 202, 290–307. [Google Scholar] [CrossRef]
  2. Hogancamp, J.; Grasley, Z. The use of microfine cement to enhance the efficacy of carbon nanofibers with respect to drying shrinkage crack resistance of portland cement mortars. Cem. Concr. Compos. 2017, 83, 405–414. [Google Scholar] [CrossRef]
  3. Taha, M.M.R.; Shrive, N.G. Enhancing Fracture Toughness of High-Performance Carbon Fiber Cement Composites. ACI Mater. J. 2001, 98, 168–178. [Google Scholar] [CrossRef]
  4. Cao, J.; Chung, D. Improving the dispersion of steel fibers in cement mortar by the addition of silane. Cem. Concr. Res. 2001, 31, 309–311. [Google Scholar] [CrossRef]
  5. Chung, D. Comparison of submicron-diameter carbon filaments and conventional carbon fibers as fillers in composite materials. Carbon N. Y. 2001, 39, 1119–1125. [Google Scholar] [CrossRef]
  6. Lok, T.S.; Xiao, J.R. Flexural Strength Assessment of Steel Fiber Reinforced Concrete. J. Mater. Civ. Eng. 1999, 11, 188–196. [Google Scholar] [CrossRef]
  7. Saccani, A.; Manzi, S.; Lancellotti, I.; Lipparini, L. Composites obtained by recycling carbon fibre/epoxy composite wastes in building materials. Constr. Build. Mater. 2019, 204, 296–302. [Google Scholar] [CrossRef]
  8. Petersen; Link, R.; Eren, O.; Marar, K.; Çelik, T. Effects of Silica Fume and Steel Fibers on Some Mechanical Properties of High-Strength Fiber-Reinforced Concrete. J. Test. Eval. 1999, 27, 380. [Google Scholar] [CrossRef] [Green Version]
  9. Rieger, C.; Van Mier, J.G. Pullout of microfibers from hardened cement paste. In Advances in Cement-Based Materials; CRC Press: Boca Raton, FL, USA, 2009; pp. 67–73. [Google Scholar]
  10. Zheng, Z.; Feldman, D. Synthetic fibre-reinforced concrete. Prog. Polym. Sci. 1995, 20, 185–210. [Google Scholar] [CrossRef]
  11. Aveston, J.; Kelly, A. Theory of multiple fracture of fibrous composites. J. Mater. Sci. 1973, 8, 352–362. [Google Scholar] [CrossRef]
  12. Morris, A.; Garrett, G. A comparative study of the static and fatigue behaviour of plain and steel fibre reinforced mortar in compression and direct tension. Int. J. Cem. Compos. Light. Concr. 1981, 3, 73–91. [Google Scholar] [CrossRef]
  13. Jhatial, A.A.; Sohu, S.; Bhatti, N.-U.; Lakhiar, M.T.; Oad, R. Effect of steel fibres on the compressive and flexural strength of concrete. Int. J. Adv. Appl. Sci. 2018, 5, 16–21. [Google Scholar] [CrossRef]
  14. Barr, B.; Asghari, A.; Hughes, T. Tensile strength and toughness of FRC materials. Int. J. Cem. Compos. Light. Concr. 1988, 10, 101–107. [Google Scholar] [CrossRef]
  15. Hogancamp, J.R. The Use of Microfine Cement to Enhance the Efficacy of Carbon Nanofibers and Microfibers in Portland Cement Mortars. Ph.D. Thesis, Texas A&M University, College Station, TX, USA, 2017. [Google Scholar]
  16. Tyson, B.M.; Abu Al-Rub, R.K.; Yazdanbakhsh, A.; Grasley, Z. Carbon Nanotubes and Carbon Nanofibers for Enhancing the Mechanical Properties of Nanocomposite Cementitious Materials. J. Mater. Civ. Eng. 2011, 23, 1028–1035. [Google Scholar] [CrossRef]
  17. Metaxa, Z.S.; Konsta-Gdoutos, M.S.; Shah, S.P. Carbon nanofiber cementitious composites: Effect of debulking procedure on dispersion and reinforcing efficiency. Cem. Concr. Compos. 2013, 36, 25–32. [Google Scholar] [CrossRef]
  18. Yazdanbakhsh, A.; Grasley, Z.; Tyson, B.; Abu Al-Rub, R. Challenges and Benefits of Utilizing Carbon Nanofilaments in Cementitious Materials. J. Nanomater. 2012, 2012, 371927. [Google Scholar] [CrossRef] [Green Version]
  19. Nasibulina, L.I.; Anoshkin, I.V.; Nasibulin, A.; Cwirzen, A.; Penttala, V.; Kauppinen, E. Effect of Carbon Nanotube Aqueous Dispersion Quality on Mechanical Properties of Cement Composite. J. Nanomater. 2012, 2012, 169262. [Google Scholar] [CrossRef] [Green Version]
  20. Sbia, L.A.; Peyvandi, A.A.; Soroushian, P.; Lu, J.; Balachandra, A.M. Enhancement of Ultrahigh Performance Concrete Material Properties with Carbon Nanofiber. Adv. Civ. Eng. 2014, 2014, 854729. [Google Scholar] [CrossRef]
  21. Konsta-Gdoutos, M.S.; Metaxa, Z.S.; Shah, S.P. Multi-scale mechanical and fracture characteristics and early-age strain capacity of high performance carbon nanotube/cement nanocomposites. Cem. Concr. Compos. 2010, 32, 110–115. [Google Scholar] [CrossRef]
  22. Metaxa, Z.S.; Seo, J.-W.T.; Konsta-Gdoutos, M.S.; Hersam, M.C.; Shah, S.P. Highly concentrated carbon nanotube admixture for nano-fiber reinforced cementitious materials. Cem. Concr. Compos. 2012, 34, 612–617. [Google Scholar] [CrossRef]
  23. Stynoski, P.; Mondal, P.; Marsh, C. Effects of silica additives on fracture properties of carbon nanotube and carbon fiber reinforced Portland cement mortar. Cem. Concr. Compos. 2015, 55, 232–240. [Google Scholar] [CrossRef]
  24. Zaheer, M.M.; Jafri, M.S.; Sharma, R. Effect of diameter of MWCNT reinforcements on the mechanical properties of cement composites. Adv. Concr. Constr. 2019, 8, 207–215. [Google Scholar] [CrossRef]
  25. Gdoutos, E.E.; Konsta-Gdoutos, M.S.; Danoglidis, P.A.; Shah, S.P. Advanced cement based nanocomposites reinforced with MWCNTs and CNFs. Front. Struct. Civ. Eng. 2016, 10, 142–149. [Google Scholar] [CrossRef]
  26. Musso, S.; Tulliani, J.-M.; Ferro, G.; Tagliaferro, A. Influence of carbon nanotubes structure on the mechanical behavior of cement composites. Compos. Sci. Technol. 2009, 69, 1985–1990. [Google Scholar] [CrossRef]
  27. Yazdanbakhsh, A.; Grasley, Z.; Tyson, B.; Abu Al-Rub, R.K. Distribution of Carbon Nanofibers and Nanotubes in Cementitious Composites. Transp. Res. Rec. J. Transp. Res. Board 2010, 2142, 89–95. [Google Scholar] [CrossRef] [Green Version]
  28. Brown, L.; Sanchez, F. Influence of carbon nanofiber clustering on the chemo-mechanical behavior of cement pastes. Cem. Concr. Compos. 2016, 65, 101–109. [Google Scholar] [CrossRef] [Green Version]
  29. Stephens, C.; Brown, L.; Sanchez, F. Quantification of the re-agglomeration of carbon nanofiber aqueous dispersion in cement pastes and effect on the early age flexural response. Carbon 2016, 107, 482–500. [Google Scholar] [CrossRef] [Green Version]
  30. Yazdanbakhsh, A.; Grasley, Z. Utilization of Silica Fume to Stabilize the Dispersion of Carbon Nanofilaments in Cement Paste. J. Mater. Civ. Eng. 2014, 26, 1–5. [Google Scholar] [CrossRef]
  31. Rossi, P. Influence of fibre geometry and matrix maturity on the mechanical performance of ultra high-performance cement-based composites. Cem. Concr. Compos. 2013, 37, 246–248. [Google Scholar] [CrossRef]
  32. Khandelwal, S.; Rhee, K.Y. Recent advances in basalt-fiber-reinforced composites: Tailoring the fiber-matrix interface. Compos. Part B Eng. 2020, 192, 108011. [Google Scholar] [CrossRef]
  33. Abu Al-Rub, R.; Tyson, B.M.; Yazdanbakhsh, A.; Grasley, Z. Mechanical Properties of Nanocomposite Cement Incorporating Surface-Treated and Untreated Carbon Nanotubes and Carbon Nanofibers. J. Nanomech. Micromech. 2012, 2, 1–6. [Google Scholar] [CrossRef] [Green Version]
  34. Sanchez, F.; Zhang, L.; Ince, C. Multi-scale Performance and Durability of Carbon Nanofiber/Cement Composites. Nanotechnol. Constr. 2009, 3, 345–350. [Google Scholar] [CrossRef]
  35. Sbia, L.A.; Peyvandi, A.A.; Soroushian, P.; Balachandra, A.M. Optimization of ultra-high-performance concrete with nano- and micro-scale reinforcement. Cogent Eng. 2014, 1, 990673. [Google Scholar] [CrossRef]
  36. Finegan, I.C.; Tibbetts, G.G.; Glasgow, D.G.; Ting, J.-M.; Lake, M.L. Surface treatments for improving the mechanical properties of carbon nanofiber/thermoplastic composites. J. Mater. Sci. 2003, 38, 3485–3490. [Google Scholar] [CrossRef]
  37. Nasibulin, A.G.; Shandakov, S.D.; Nasibulina, L.I.; Cwirzen, A.; Mudimela, P.R.; Habermehl-Cwirzen, K.; Grishin, D.A.; Gavrilov, Y.V.; Malm, J.E.M.; Tapper, U.; et al. A novel cement-based hybrid material. New J. Phys. 2009, 11, 023013. [Google Scholar] [CrossRef]
  38. Nasibulin, A.; Koltsova, T.; Nasibulina, L.I.; Anoshkin, I.V.; Semencha, A.; Tolochko, O.V.; Kauppinen, E.I. A Novel Approach For Nanocarbon Composite Preparation. MRS Proc. 2012, 1454, 279–286. [Google Scholar] [CrossRef]
  39. Nasibulina, L.I.; Anoshkin, I.V.; Shandakov, S.D.; Nasibulin, A.G.; Cwirzen, A.; Mudimela, P.R.; Habermehl-Cwirzen, K.; Malm, J.E.M.; Koltsova, T.S.; Tian, Y.; et al. Direct Synthesis of Carbon Nanofibers on Cement Particles. Transp. Res. Rec. J. Transp. Res. Board 2010, 2142, 96–101. [Google Scholar] [CrossRef] [Green Version]
  40. Šmilauer, V.; Hlaváček, P.; Padevět, P. Micromechanical Analysis of Cement Paste with Carbon Nanotubes. Acta Polytech. 2012, 52, 22–28. [Google Scholar] [CrossRef]
  41. Thostenson, E.T.; Li, W.Z.; Wang, D.Z.; Ren, Z.F.; Chou, T.W. Carbon nanotube/carbon fiber hybrid multiscale composites. J. Appl. Phys. 2002, 91, 6034–6037. [Google Scholar] [CrossRef]
  42. Yazdanbakhsh, A.; Grasley, Z. The theoretical maximum achievable dispersion of nanoinclusions in cement paste. Cem. Concr. Res. 2012, 42, 798–804. [Google Scholar] [CrossRef]
  43. Yazdanbakhsh, A.; Grasley, Z.; Tyson, B.; Abu Al-Rub, R.K. Dispersion quantification of inclusions in composites. Compos. Part A Appl. Sci. Manuf. 2011, 42, 75–83. [Google Scholar] [CrossRef]
  44. Piggott, M.R. Theoretical estimation of fracture toughness of fibrous composites. J. Mater. Sci. 1970, 5, 669–675. [Google Scholar] [CrossRef]
  45. Shu, X.; Graham, R.K.; Huang, B.; Burdette, E.G. Hybrid effects of carbon fibers on mechanical properties of Portland cement mortar. Mater. Des. 2015, 65, 1222–1228. [Google Scholar] [CrossRef]
  46. Ahmed, H.; Bogas, J.A.; Guedes, M. Mechanical Behavior and Transport Properties of Cementitious Composites Reinforced with Carbon Nanotubes. J. Mater. Civ. Eng. 2018, 30, 1–14. [Google Scholar] [CrossRef]
  47. Pakravan, H.R.; Latifi, M.; Jamshidi, M. Hybrid short fiber reinforcement system in concrete: A review. Constr. Build. Mater. 2017, 142, 280–294. [Google Scholar] [CrossRef]
  48. Metaxa, Z.S.; Konsta-Gdoutos, M.S.; Shah, S.P. Mechanical Properties and Nanostructure of Cement-Based Materials Reinforced with Carbon Nanofibers and Polyvinyl Alcohol (PVA) Microfibers. ACI Spec. Publ. 2010, 270, 115–124. [Google Scholar] [CrossRef]
  49. Bashir, M.T.; Muhammad, S.; Butt, M.J.; Alzara, M.; El-Kady, M.S. Aspect ratio effect of multi-walled carbon nanotubes and carbon fibers on high-performance cement mortar matrices. Innov. Infrastruct. Solut. 2020, 5, 1–11. [Google Scholar] [CrossRef]
  50. Yao, W.; Li, J.; Wu, K. Mechanical properties of hybrid fiber-reinforced concrete at low fiber volume fraction. Cem. Concr. Res. 2003, 33, 27–30. [Google Scholar] [CrossRef]
  51. Hameed, R.; Turatsinze, A.; Duprat, F.; Sellier, A. A study on the reinforced fibrous concrete elements subjected to uniaxial tensile loading. KSCE J. Civ. Eng. 2010, 14, 547–556. [Google Scholar] [CrossRef]
  52. Bentur, A.; Mindess, S. Fibre Reinforced Cementitious Composites; CRC Press: Boca Raton, FL, USA, 2006. [Google Scholar] [CrossRef]
  53. C1437-13; Standard Test Method for Flow of Hydraulic Cement Mortar. ASTM: West Conshohocken, PA, USA, 2013.
  54. Senff, L.; Labrincha, J.A.; Ferreira, V.M.; Hotza, D.; Repette, W.L. Effect of nano-silica on rheology and fresh properties of cement pastes and mortars. Constr. Build. Mater. 2009, 23, 2487–2491. [Google Scholar] [CrossRef]
  55. Felekoglu, B.; Tosun-Felekoglu, K.; Ranade, R.; Zhang, Q.; Li, V.C. Influence of matrix flowability, fiber mixing procedure, and curing conditions on the mechanical performance of HTPP-ECC. Compos. Part B Eng. 2014, 60, 359–370. [Google Scholar] [CrossRef]
  56. C1231/C1231M-15; Use of Unbonded Caps in Determination of Compressive Strength of Hardened Cylindrical Concrete Specimens. ASTM: West Conshohocken, PA, USA, 2015.
  57. C39/C39M-20; Standard Test Method for Compressive Strength of Cylindrical Concrete Specimens. ASTM: West Conshohocken, PA, USA, 2013.
  58. Douba, A.E.; Emiroğlu, M.; Tarefder, R.A.; Kandil, U.F.; Taha, M.R. Use of Carbon Nanotubes to Improve Fracture Toughness of Polymer Concrete. Transp. Res. Rec. J. Transp. Res. Board 2017, 2612, 96–103. [Google Scholar] [CrossRef]
  59. Douba, A.E. Mechanical Characterization of Polymer Concrete with Nanomaterials; The University of New Mexico: Albuquerque, NM, USA, 2017. [Google Scholar]
  60. C1609/C1609M-19a; Standard Test Method for Flexural Performance of Fiber-Reinforced Concrete (Using Beam With Third-Point Loading). ASTM: West Conshohocken, PA, USA, 2020.
  61. Taha, M.R.; Xiao, X.; Yi, J.; Shrive, N.G. Evaluation of flexural fracture toughness for quasi-brittle structural materials using a simple test method. Can. J. Civ. Eng. 2002, 29, 567–575. [Google Scholar] [CrossRef]
  62. Bažant, Z.P. Analysis of Work-of-Fracture Method for Measuring Fracture Energy of Concrete. J. Eng. Mech. 1996, 122, 138–144. [Google Scholar] [CrossRef] [Green Version]
  63. Bažant, Z.P. Concrete fracture models: Testing and practice. Eng. Fract. Mech. 2002, 69, 165–205. [Google Scholar] [CrossRef]
  64. Gettu, A.; Garcia-A’lvarez, R.; Aguado, V.O. Effect of aging on the fracture characteristics and brittleness of a high-strength concrete. Cem. Concr. Res. 1998, 28, 349–355. [Google Scholar] [CrossRef]
  65. Shrive, N.G.; El-Rahman, M. Understanding the cause of cracking in concrete: A diagnostic aid. Concr. Int. 1985, 7, 39–44. [Google Scholar]
  66. Hsu, T.T.; Slate, F.O.; Sturman, G.M.; Winter, G. Microcracking of plain concrete and the shape of the stress-strain curve. J. Proc. 1963, 60, 209–224. [Google Scholar]
  67. Wang, E.; Shrive, N. Brittle fracture in compression: Mechanisms, models and criteria. Eng. Fract. Mech. 1995, 52, 1107–1126. [Google Scholar] [CrossRef]
  68. Cusatis, G.; Bažant, Z.P.; Cedolin, L. Confinement-shear lattice CSL model for fracture propagation in concrete. Comput. Methods Appl. Mech. Eng. 2006, 195, 7154–7171. [Google Scholar] [CrossRef]
  69. Xu, S.; Liu, J.; Li, Q. Mechanical properties and microstructure of multi-walled carbon nanotube-reinforced cement paste. Constr. Build. Mater. 2015, 76, 16–23. [Google Scholar] [CrossRef]
  70. Hawreen, A.; Bogas, J.; Dias, A.P.S. On the mechanical and shrinkage behavior of cement mortars reinforced with carbon nanotubes. Constr. Build. Mater. 2018, 168, 459–470. [Google Scholar] [CrossRef]
  71. Gupta, S.; Kua, H.W. Carbonaceous micro-filler for cement: Effect of particle size and dosage of biochar on fresh and hardened properties of cement mortar. Sci. Total Environ. 2019, 662, 952–962. [Google Scholar] [CrossRef]
  72. Sharma, A.; Reddy, G.; Varshney, L.; Bharathkumar, H.; Vaze, K.; Ghosh, A.; Kushwaha, H.; Krishnamoorthy, T. Experimental investigations on mechanical and radiation shielding properties of hybrid lead–steel fiber reinforced concrete. Nucl. Eng. Des. 2009, 239, 1180–1185. [Google Scholar] [CrossRef]
  73. Glavind, M.; Aarre, T. High-Strength Concrete with Increased Fracture-Toughness. MRS Online Proc. Libr. Arch. 1990, 211, 39–46. [Google Scholar] [CrossRef]
  74. Dawood, E.; Ramli, M. High strength characteristics of cement mortar reinforced with hybrid fibres. Constr. Build. Mater. 2011, 25, 2240–2247. [Google Scholar] [CrossRef]
  75. Hsie, M.; Tu, C.; Song, P. Mechanical properties of polypropylene hybrid fiber-reinforced concrete. Mater. Sci. Eng. A 2008, 494, 153–157. [Google Scholar] [CrossRef]
  76. Park, S.H.; Kim, D.J.; Ryu, G.S.; Koh, K.T. Tensile behavior of Ultra High Performance Hybrid Fiber Reinforced Concrete. Cem. Concr. Compos. 2012, 34, 172–184. [Google Scholar] [CrossRef]
  77. Banthia, N.; Sappakittipakorn, M. Toughness enhancement in steel fiber reinforced concrete through fiber hybridization. Cem. Concr. Res. 2007, 37, 1366–1372. [Google Scholar] [CrossRef]
  78. Lawler, J.S.; Zampini, D.; Shah, S.P. Microfiber and Macrofiber Hybrid Fiber-Reinforced Concrete. J. Mater. Civ. Eng. 2005, 17, 595–604. [Google Scholar] [CrossRef]
  79. Kang, S.-T.; Choi, J.-I.; Koh, K.-T.; Lee, K.S.; Lee, B.Y. Hybrid effects of steel fiber and microfiber on the tensile behavior of ultra-high performance concrete. Compos. Struct. 2016, 145, 37–42. [Google Scholar] [CrossRef]
  80. Rashiddadash, P.; Ramezanianpour, A.A.; Mahdikhani, M. Experimental investigation on flexural toughness of hybrid fiber reinforced concrete (HFRC) containing metakaolin and pumice. Constr. Build. Mater. 2014, 51, 313–320. [Google Scholar] [CrossRef]
  81. Zhao, Z.; Qi, T.; Zhou, W.; Hui, D.; Xiao, C.; Qi, J.; Zheng, Z. A review on the properties, reinforcing effects, and commercialization of nanomaterials for cement-based materials. Nanotechnol. Rev. 2020, 9, 303–322. [Google Scholar] [CrossRef]
  82. Feldman, D.; Zheng, Z. Synthetic Fibres for Fibre Concrete Composites. MRS Online Proc. Libr. Arch. 1993, 305, 123–128. [Google Scholar] [CrossRef]
  83. Singh, S.P.; Singh, A.P.; Bajaj, V. Strength and flexural toughness of concrete reinforced with steel-polypropylene hybrid fibres. Asian J. Civ. Eng. 2010, 11, 495–507. [Google Scholar]
  84. Zhang, C.; Cao, M. Fiber synergy in multi-scale fiber-reinforced cementitious composites. J. Reinf. Plast. Compos. 2013, 33, 862–874. [Google Scholar] [CrossRef]
Figure 1. (a) Light microscopic images of CCMFs and MCMFs, and (b) particle size distribution of the fine aggregate.
Fibers 10 00065 g001
Figure 2. Mixing protocol schematic.
Fibers 10 00065 g002
Figure 3. Schematic representation of the flowability test.
Fibers 10 00065 g003
Figure 4. (a) Schematic and (b) testing setup of three-point bending fracture test.
Fibers 10 00065 g004
Figure 5. Sample of flow table testing and measurements.
Fibers 10 00065 g005
Figure 6. (a) Flowability of different fiber/cement ratios and fiber mixing ratios, and (b) linear regression for flowability at different mixing ratios with fiber content.
Fibers 10 00065 g006
Figure 7. (a) Compressive strength, (b) modulus of rupture, and (c) modulus of elasticity for the reference and carbon fiber reinforced cementitious composite mixes at 7 and 28 days of age.
Fibers 10 00065 g007
Figure 8. Comparison of unnotched beam bending mean and variance response for the (a) reference and carbon fiber reinforced cementitious composite mixes ((b) CH2, (c) ML2, (d) ML8, (e) H2, and (f) H5) at seven days of age. Each graph represents the mean of five tested samples.
Fibers 10 00065 g008
Figure 9. Comparison of unnotched beam bending mean and variance response for the (a) reference and carbon fiber reinforced cementitious composite mixes ((b) CH2, (c) ML2, (d) ML8, (e) H2, and (f) H5) at 28 days of age. Each graph represents the mean of five tested samples.
Fibers 10 00065 g009
Figure 10. Comparison of notched bending response for the mean and variance (a) reference and carbon fiber reinforced cementitious composite mixes ((b) CH2, (c) ML2, (d) ML8, (e) H2, and (f) H5) at seven days of age. Each graph represents the mean of five tested samples.
Fibers 10 00065 g010
Figure 11. Comparison of notched bending mean and variance response for the (a) reference and carbon fiber reinforced cementitious composite mixes ((b) CH2, (c) ML2, (d) ML8, (e) H2, and (f) H5) at 28 days of age. Each graph represents the mean of five tested samples.
Fibers 10 00065 g011
Figure 12. Comparison of CMOD mean and variance response for the (a) reference and carbon fiber reinforced cementitious composite mixes ((b) CH2, (c) ML2, (d) ML8, (e) H2, and (f) H5) at seven days of age. Each graph represents the mean of five tested samples.
Fibers 10 00065 g012
Figure 13. Comparison of CMOD mean and variance response for the (a) reference and carbon fiber reinforced cementitious composite mixes ((b) CH2, (c) ML2, (d) ML8, (e) H2, and (f) H5) at 28 days of age. Each graph represents the mean of five tested samples.
Fibers 10 00065 g013
Figure 14. Comparison of fracture toughness represented by (a) critical energy release rate GIC, (b) plastic energy release rate JIC, and (c) fracture toughness Gf for the reference and carbon fiber reinforced cementitious composite mixes at 7 and 28 days of age.
Fibers 10 00065 g014
Figure 15. SEM images of sample (a) chopped (CH2), (b) milled (M2), and (c) hybrid mix (H2). Circular marks indicate signs of fiber rupture. Rectangular marks indicate signs of fiber pull-out.
Fibers 10 00065 g015
Table 1. Concrete mix design (kg/m3).
ComponentReference (R)Chopped 2% (CH2)Milled 2% (ML2)Milled 8% (ML8)Hybrid 2% (H2)Hybrid 5% (H5)
Cement 934.2
Silica Fume 93.4
Sand 934.2
Water 256.9
Superplasticizer 16.3
CCMF (% wt. cement)L = 3 mm-1.0--0.20.5
L = 6 mm-1.0--0.20.5
MCMF (% wt. cement)L = 150 μm--1.04.00.82.0
L = 200 μm --1.04.00.82.0
Publisher’s Note: MDPI stays neutral with regard to jurisdictional claims in published maps and institutional affiliations.

