Article

The Mechanical Response of Epoxy–Sisal Composites Considering Fiber Anisotropy: A Computational and Experimental Study

1
Center for Thermo-Mechanics and Failure of Materials, Mechanical Engineering Department, Shamoon Collage of Engineering, Be’er-Sheva 84100, Israel
2
Materials Science Department, Nuclear Research Center Negev (NRCN), Be’er-Sheva 84190, Israel
*
Author to whom correspondence should be addressed.
Fibers 2022, 10(5), 43; https://doi.org/10.3390/fib10050043
Submission received: 19 April 2022 / Revised: 12 May 2022 / Accepted: 13 May 2022 / Published: 15 May 2022

Abstract

:
Natural-fiber-reinforced composites are seen as a good alternative to traditional synthetic-fiber composites. However, to successfully implement these materials in engineering applications, along with these materials demonstrating satisfactory load-bearing capacity, it is necessary to provide engineers with effective material properties, as well as calculation methods that take into account the distinctive features of natural fibers. This study investigated the effective elastic properties and strength of materials composed of unidirectional sisal fibers within a thermosetting polymer matrix, containing 20%, 40% and 60% fiber-volume fraction. Experiments with axial and off-axis loads in conjunction with finite-element modeling were utilized to determine the effective mechanical response of the composites. Analytical and numerical models were considered, using both isotropic- and anisotropic-fiber approaches. It is shown that only by taking into account the sisal-fiber anisotropy can the experimental results of the off-axis experiments be reproduced. The influence of sisal-fiber transverse modulus on the overall mechanical response is a function of the sisal-fiber volume fraction. It has been shown that the longitudinal specific strength of sisal-fiber-reinforced composites is comparable to classical aluminum alloys or steel. Thus, this environmentally friendly composite can be considered as an alternative in some engineering applications, such as reinforcement in concrete composites.

1. Introduction

Concerns about the environmental situation, namely pollution and wasteful use of fossil fuels, have generated a great demand for the development of new environmentally friendly materials. Natural-fiber-based composite materials provide a compelling alternative to traditional composites and gain growing popularity in many fields of engineering, notably in the automotive industry [1,2]. Automotive manufacturers use biocomposites based on natural fibers in parts such as door panels, seat backs, ceiling panels, and interior fittings. In addition to being biodegradable and recyclable, natural fibers contribute to an overall reduction in vehicle weight, resulting in lower fuel consumption and air pollution [3]. Fast-growing annual crops, such as flax, sisal, jute, hemp and kenaf are generally the most popular natural fibers for these applications [4].
Relative to other natural fibers, sisal fibers are among the strongest, making them suitable for reinforcing composites in engineering applications. In civil engineering, along with synthetic textiles, sisal is considered as an alternative reinforcement for classic reinforced concrete [5,6,7]. Sisal fibers are extracted from the leaves of the Agave sisalana plant, native to Central America, but also found in parts of Africa, Southeast Asia, South America and the Mediterranean. A particular advantage of sisal fiber is its resistance to salt water [4].
The properties of sisal fiber have been studied by many researchers; however, the characteristics of the fiber appearing in the literature vary considerably. For example, according to various studies [8,9,10,11,12,13,14,15], the average longitudinal modulus of elasticity is in the range from 19 GPa to 40 GPa; the average tensile strength is in the range of 400 MPa to 675 MPa. Chand et al. [8] studied leaf fibers of different ages, from 3 to 9 years. It was demonstrated that the fiber tensile strength increases by more than 100 MPa with the age of the leaf. Inacio et al. [9] studied the dependence of strength on the diameter of sisal fibers (0.04–0.4 mm); they indicate that the smaller the diameter, the stronger the fiber. While the properties of sisal fibers in the longitudinal direction have been extensively studied, studies on the properties in the transverse direction are scarce. Some researchers have studied the anisotropy of sisal fiber [15,16,17]; in a study by Thomason et al. [17] the transverse modulus of the fibers is 13.7 times lower than the longitudinal modulus.
The behavior of sisal-fiber-reinforced composites (SFRC) has also been investigated. Oksman et al. [11] obtained an effective elastic modulus of about 20 GPa and an effective tensile strength of 210 MPa for a sisal–epoxy composite with 46% volume of fibers. The sisal–epoxy resin composites of Yan et al. [14] reached an effective tensile strength of 180 MPa and an effective elastic modulus of 15 GPa with a fiber weight fraction of about 46%. Zuccarello et al. [15] also investigated an epoxy–sisal composite system with various fiber contents. Their effective tensile strengths along the fibers significantly exceeded those of the above-mentioned researchers: at 40% volume fraction, 300 MPa was measured; and at volume fraction of 70%, the strength was one and a half times higher than values obtained by Gonzalez-Murillo and Ansell [18] for similar fractions of sisal fibers. The strength under transverse tensile load decreased from about 20 MPa to about 5.5 MPa, corresponding to a change in the volume fraction from 20% to 70%, demonstrating that while the longitudinal strength increases with the increase in fiber-volume fraction, the transverse strength decreases. Bisanda and Ansell [19] reported an effective flexural modulus for unidirectional (UD) sisal–epoxy composites of 16 GPa and effective flexural strength of 266 MPa at 40% volume of fibers.
Natural fibers are known for poor adhesion to the matrix. There are many different chemical [20,21,22,23,24], physical [25] and radioactive [26] treatments that have been applied to sisal fibers to enhance the interface strength between fiber and matrix. In most cases, treatment did not result in improved mechanical properties, or the difference was insignificant. In a recent study by Zuccarello et al. [15] it was shown that transverse failure of such composites is the result of internal rupture of the sisal fiber rather than the debonding between fiber and matrix. This fact explains the insignificant effect of the treatments on the overall composite effective transverse strength.
Another important aspect associated with polymer composites based on natural fibers is their sensitivity to moisture and thermal absorption. In recent years, research has been carried out to improve these hygrothermal characteristics [27,28,29].
Determining the effective properties of composites is a key issue in applied engineering structural analysis. However, obtaining engineering constants experimentally is a laborious and expensive process. Therefore, the prediction of these constants is of particular importance, especially given the wide range of fiber composites. Many researchers proposed the prediction of the effective stiffness properties based on semiempirical analytical [30,31,32,33,34,35] or numerical [36] micromechanical models. Potluri et al. [37] compared the properties of composites with UD natural fibers, which were obtained from some of the above-cited analytical models, experiments and finite-element analysis (FEA). The results show that all analytical and numerical models are similar in predicting the longitudinal effective elastic modulus and the in-plane effective Poisson’s ratio, but significant discrepancies in the transverse parameters were observed. A similar comparison of micromechanical models was carried out by Rao et al. [38] for composites with chopped sisal fibers. Pantano and Zuccarello [39] developed a numerical model, which approximates the fiber form with a sinusoidal shape, to evaluate the influence of the waviness on the stiffness of a biocomposite. Finite-element approaches have been used by several researchers [18,40,41,42,43,44] to investigate mechanical properties of composites containing sisal fibers.
Notwithstanding various experimental and computational studies in the literature, there is still no sufficient information for engineers to plan structural elements from SFRC. This is especially the case when the sisal-fiber anisotropy is to be considered. Therefore, the overall goal of this study is to investigate the effective properties of UD composite materials with sisal fibers, using computational analysis incorporating fiber anisotropy and validated by experiments. In this study, micromechanical computational models, based on the representative volume element (RVE) approach, are utilized to calculate the effective elastic properties of SFRC composites and determine the influence of fiber anisotropy on the effective properties. Since the data on sisal fiber as well as composites containing UD sisal fiber are not identical, additional experiments have been performed to obtain the properties of both sisal fiber and composites containing it for different fiber-volume fractions.
Following this introduction, in Section 2, details of the experimental, analytical and numerical methods for studying SFRC mechanical response are given. Section 3 presents the experimental and computational results, while discussion of the study findings and practical implications is provided in Section 4. Conclusions are given in Section 5.

2. Materials and Methods

The composite materials investigated in this study are comprised of two constituents: sisal fibers and a thermoset polymer. The sisal fibers were obtained from Agave sisalana plants growing wild in the Negev region of Israel. The fibers were extracted by a simple mechanical method [45]. The fibers were subject to thorough cleaning without any chemical treatment. Epoxy resin manufactured by Resin Research Inc. (Tucson, AZ, USA) [46] was taken as a polymer matrix. To obtain the longitudinal mechanical properties of the fibers, the samples were made in the form of bundles with one, two and three times the number of the fibers. To determine the characteristics of the polymer, samples were made with the dimensions recommended for type I in the ASTM D638-14 standard [47]. To investigate the mechanical response of the SFRC, samples were made in accordance with the standard ASTM D3039/D3039M [48] for axial and off-axial load.

2.1. SFRC Fabrication Process

The hand layup method was used for the manufacturing of the composites. As a first step, the sisal fibers were accurately aligned into thin layers so that the thickness of the layer was equal to the diameter of the fiber (Figure 1). The layers of the fibers were manually impregnated with resin, stacked in multilayer UD composites, and brought to full cure in room-temperature conditions. The SFRC samples were prepared containing 20%, 40% and 60% fiber-volume fractions ( V f ), calculated based on the apparent density of 1.2 × 10 3 kg/m3. The apparent density was estimated from the data in the literature, given the presence of lumens [11,13,14]. Two types of tensile specimens were prepared. The first type had the fibers aligned in the loading direction (axial loading) and the second type had the fibers oriented in a 45° to the loading direction (off-axis loading) as seen in Figure 2. The dimensions for the first specimen type were 250/16.5/1.2 mm3 and for the second specimen type—200/20/2 mm3. Samples with a longitudinal fiber orientation consist of 4, 6 and 8 layers; samples with a 45° fiber orientation include 6, 9 and 12 layers for fiber-volume fractions of 20%, 40% and 60%, respectively.

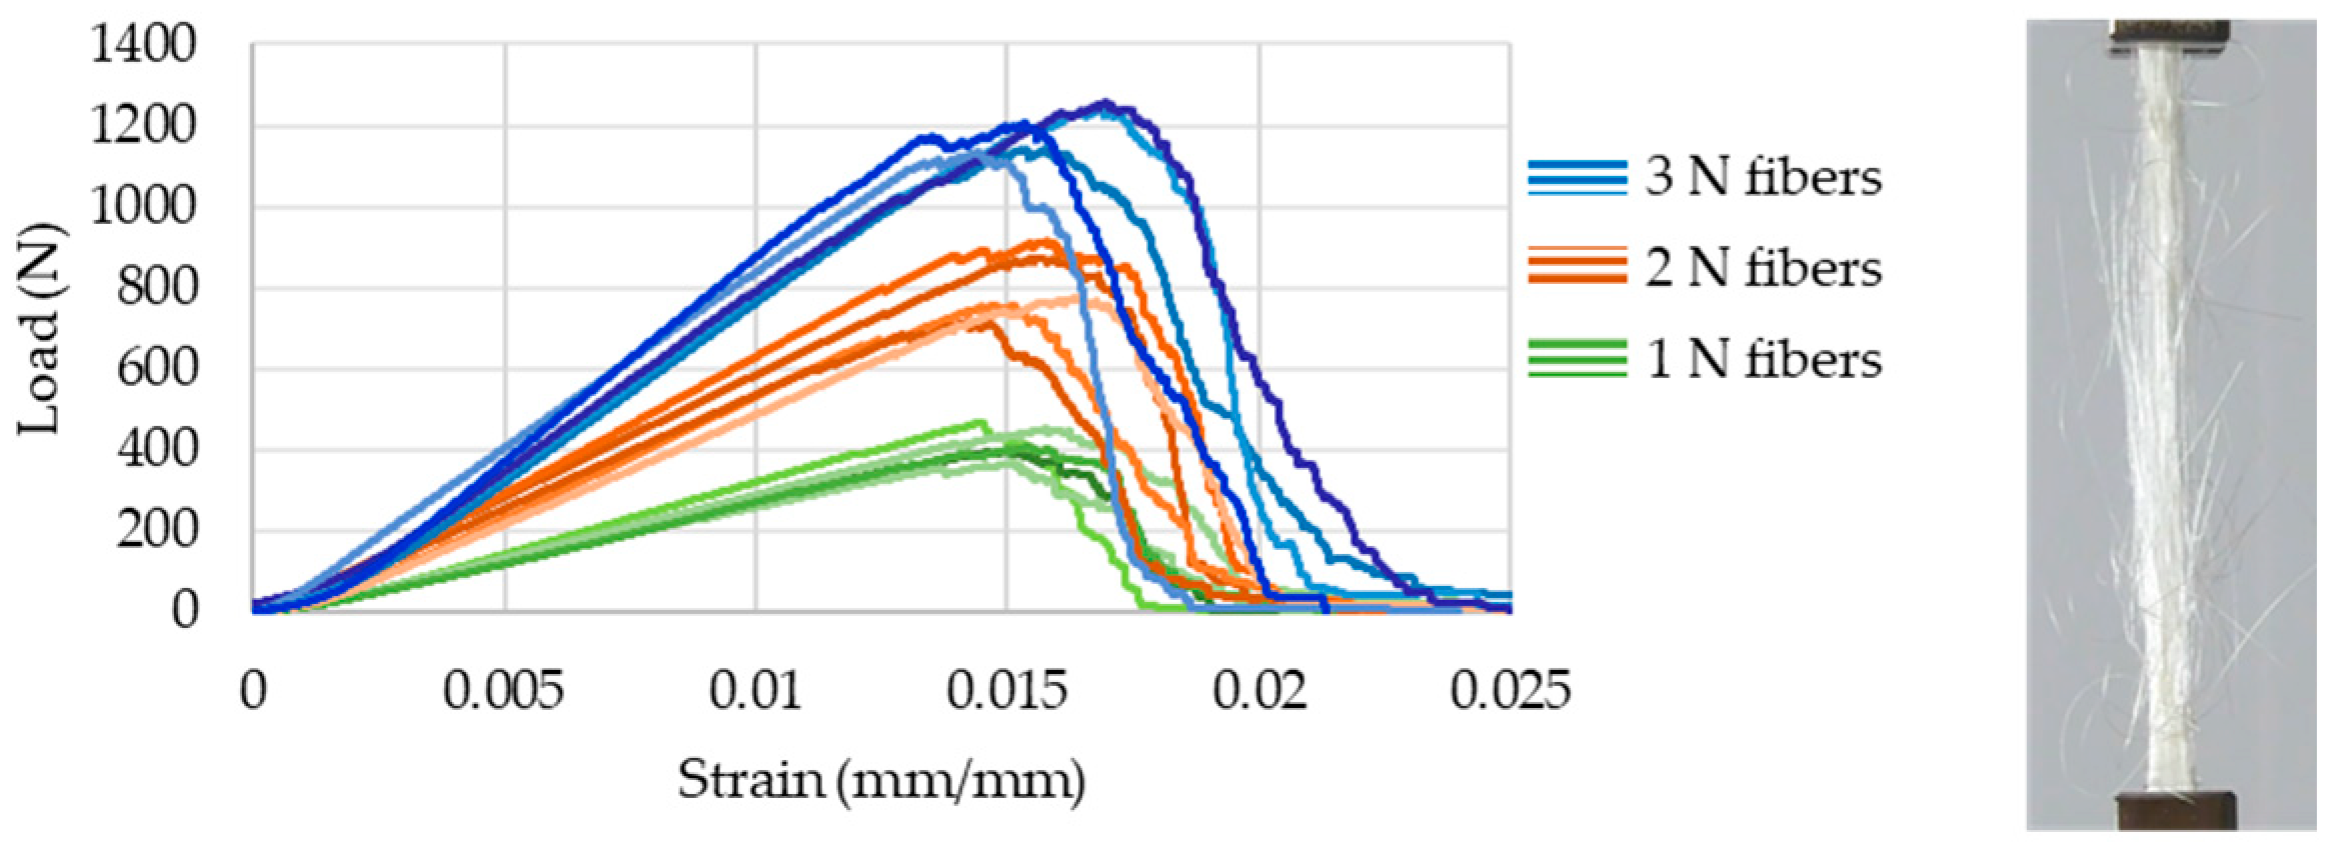
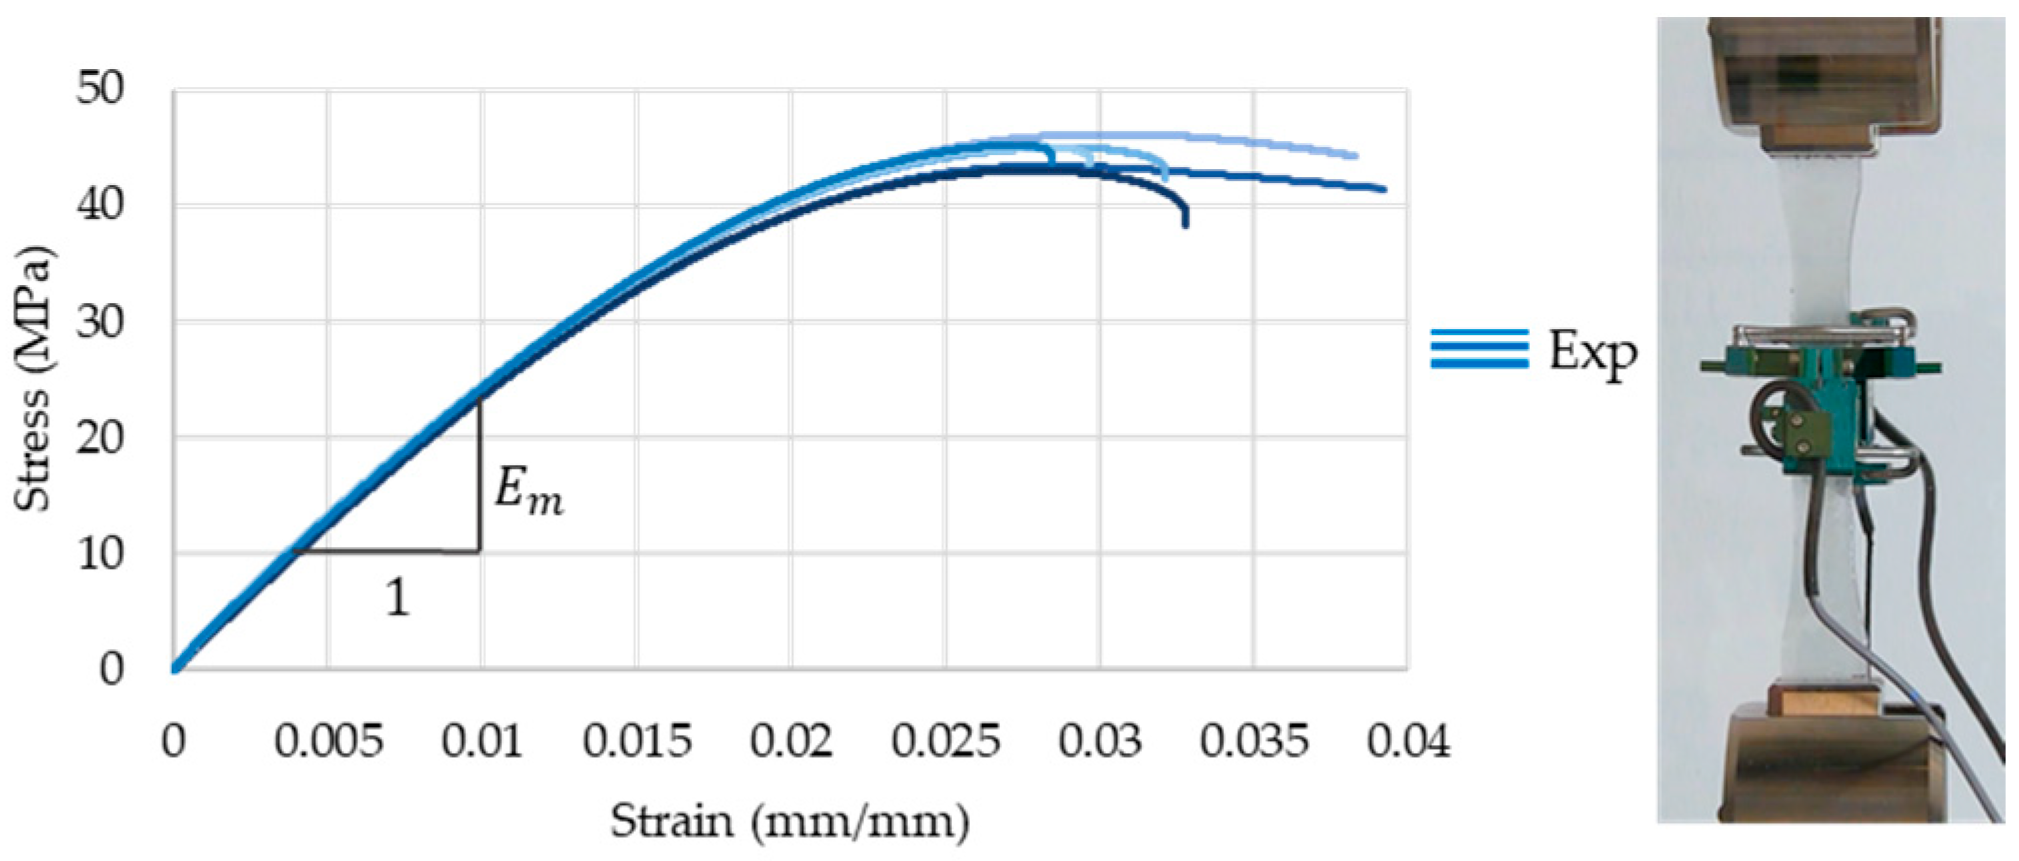
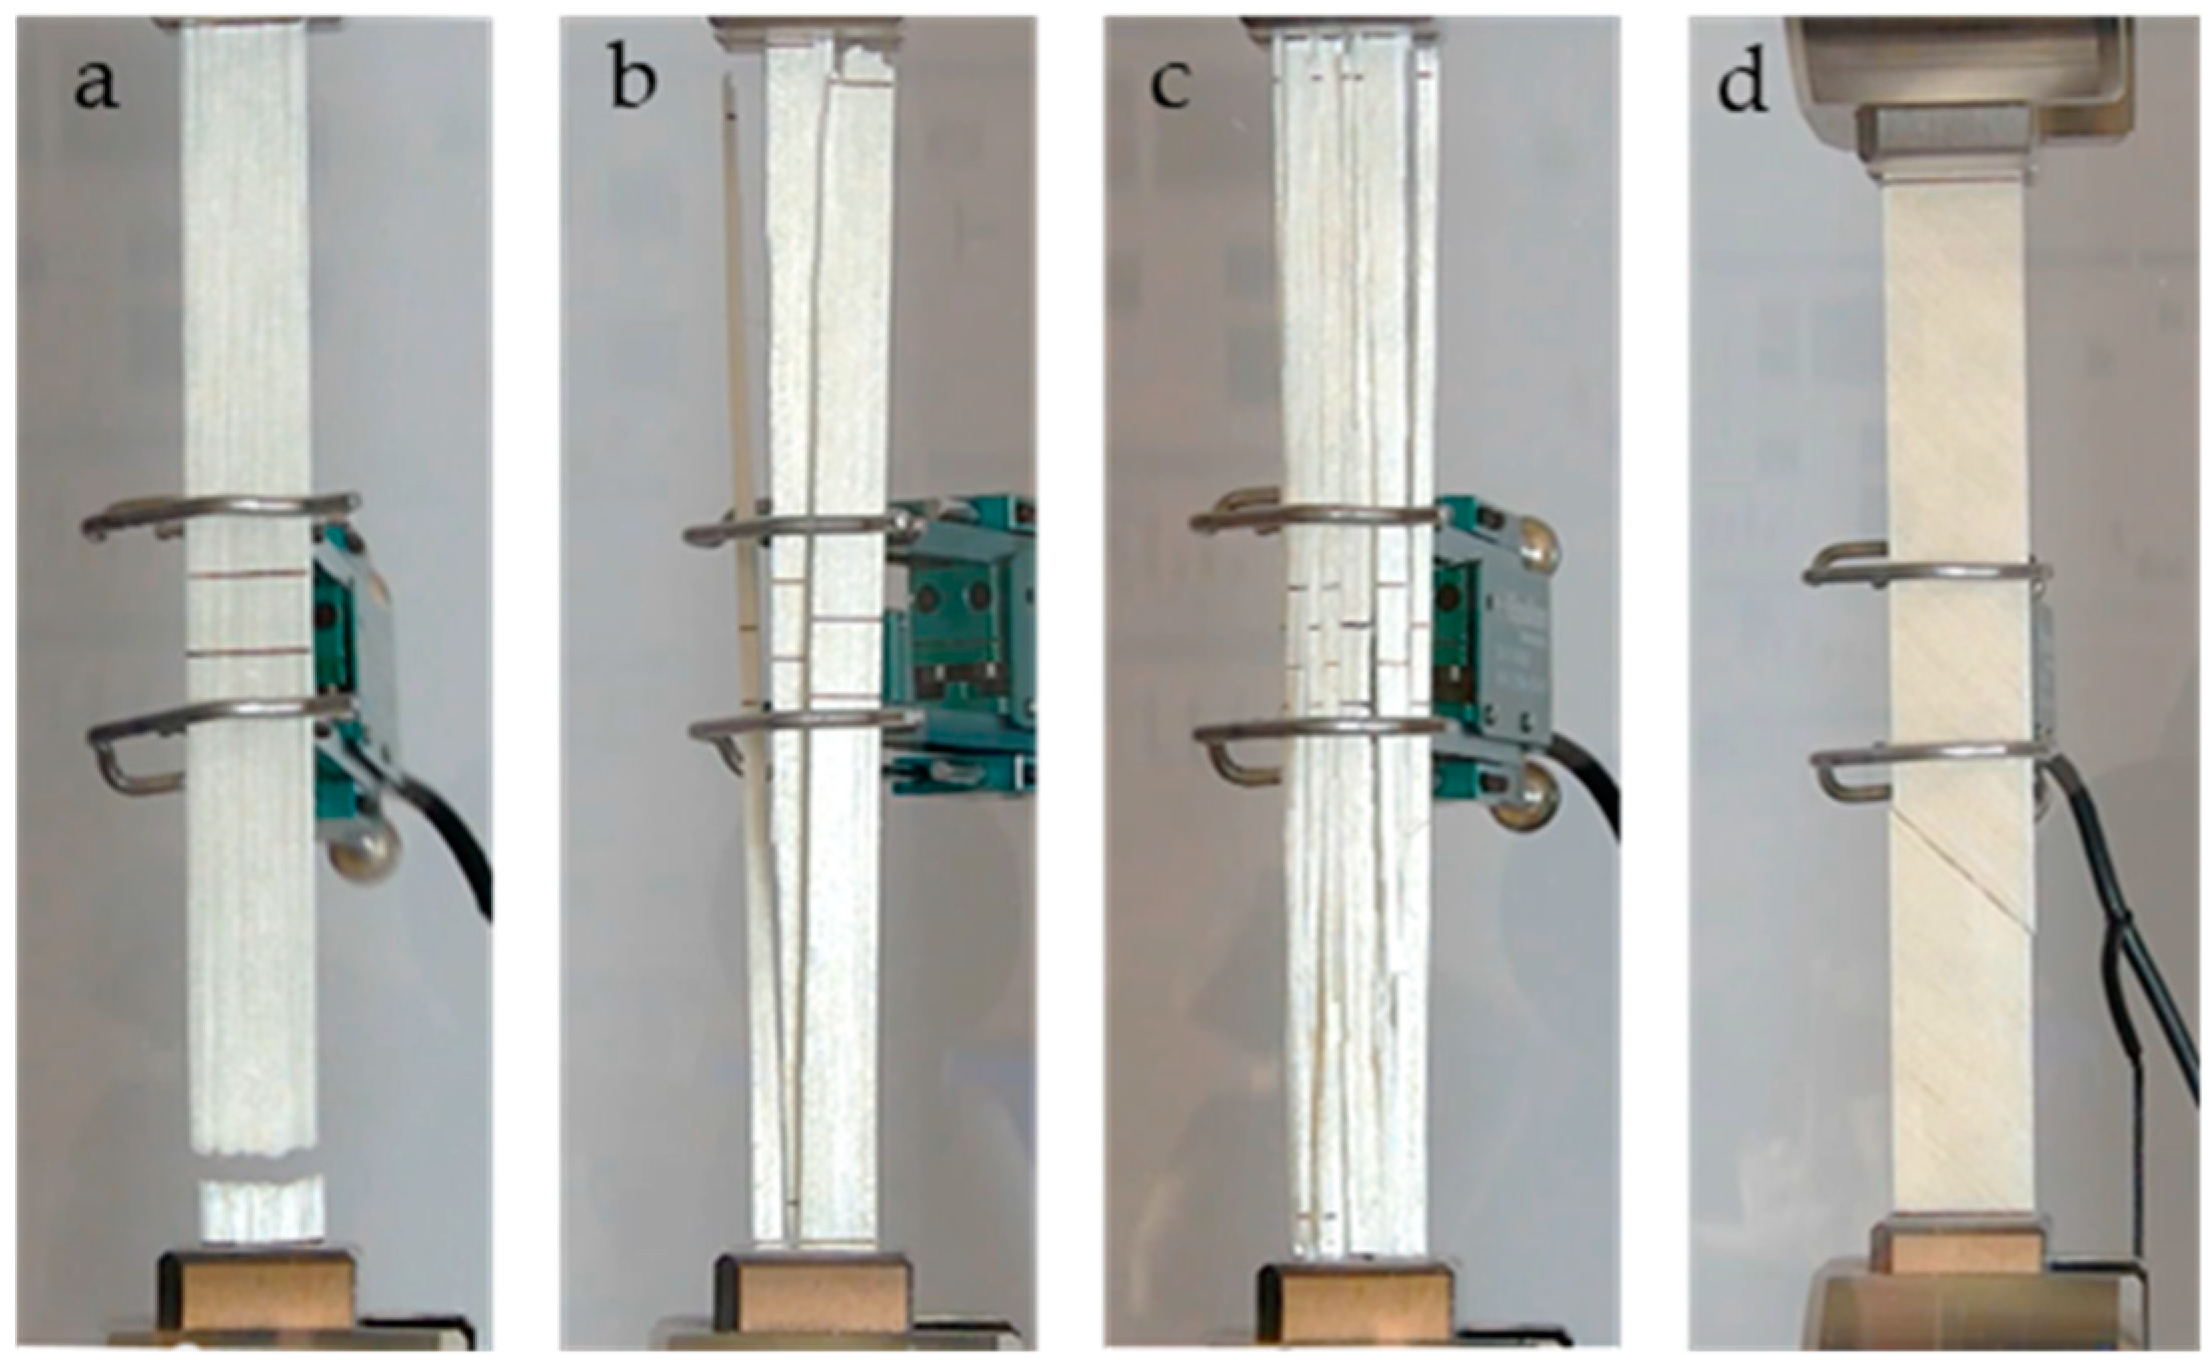
2.2. Mechanical Loading Experiments

Tests for measuring the fiber properties, epoxy properties and the effective properties of the SFRC were carried out on a Shimadzu Autograph AGS-X testing machine [49] with load capacity from 1 kN to 10 kN, giving display force accuracy within ±0.5%. The testing system includes an external sensor amplifier ESA-CU200 and material data-processing software TRAPEZIUM X. Strain measurements were carried out with axial and transverse extensometers, products of Epsilon technology corp. (Jackson, WY, USA) [50]. A schematic description of tensile testing for fiber bundles, SFRC specimens with axial load, SFRC specimens with 45° off-axis load and for polymer matrix specimens is shown in Figure 2.

2.3. Analytical and Numerical Determination of SFRC Effective Properties

UD composites are considered to be transverse isotropic with symmetry about the axis along the fiber. The fiber direction (longitudinal direction) is defined as the local 1-direction of a lamina, the 2-direction is the transverse direction of the ply, and the 3-direction represents the out-of-plane direction. A transversely isotropic material is described by five independent constants: longitudinal modulus E 11 , transvers modulus E 22 , Poisson’s ratio ν 12 , in-plane and out-of-plane shear modulus G 12 and G 23 , respectively. To determine the effective properties of the SFRC composites, two approaches are considered: the fiber is taken as an isotropic and as an anisotropic elastic material.
In accordance with both approaches, numerical micromechanical models utilizing the RVE [36] are used. For this, unit cell models were developed in the FEA software ABAQUS [51]. The Abaqus/Standard [52] analysis of static linear perturbations is carried out with applied unit strain in the x, y, z directions and unit shear strain along the fiber direction. Because the model is periodic, symmetry boundary conditions apply to planes that are not subject to displacement (Figure 3a–c). In the case of shear deformation, the plane transverse to the fiber is not a plane of symmetry; coupling-constraint boundary conditions are set for these surfaces (Figure 3d,e). The numerical models use an element type of C3D8R (8-node linear block, reduced integration) [53].
The macrostresses are derived by averaging the stress tensor over the volume of the RVE [53]:
σ ¯ α = C α β ε ¯ β
where:
C α β = σ ¯ α = 1 V V σ α ( x , y , z )   d V   with   ε ¯ β = 1
The effective properties of the lamina are calculated from the stiffness matrix C α β using the following formulas:
E 11 = C 11 2 C 12 2 C 22 + C 23 E 22 = ( C 11 ( C 22 + C 23 ) 2 C 12 2 ) C 22 + C 23 C 11 C 22 C 12 2 ν 12 = C 22 C 22 + C 23 ν 23 = C 11 C 23 C 12 2 C 11 C 22 C 12 2 G 12 = C 66 G 23 = C 44 = 1 2 ( C 22 C 23 ) = E 2 2 ( 1 + ν 23 )
To verify the results computed using the RVE methodology, a comparison to an analytical solution was performed similar to standard solution-verification methods [54]. The two analytical models used are: Periodic Microstructure Model (PMM) for an isotropic fiber by Luciano and Barbero [55,56] and the closed form expression of the Mori–Tanaka theory (MTT) [57] by Abaimov et al. [58] for an anisotropic fiber. Details regarding the two analytical models are given in Appendix A and Appendix B.

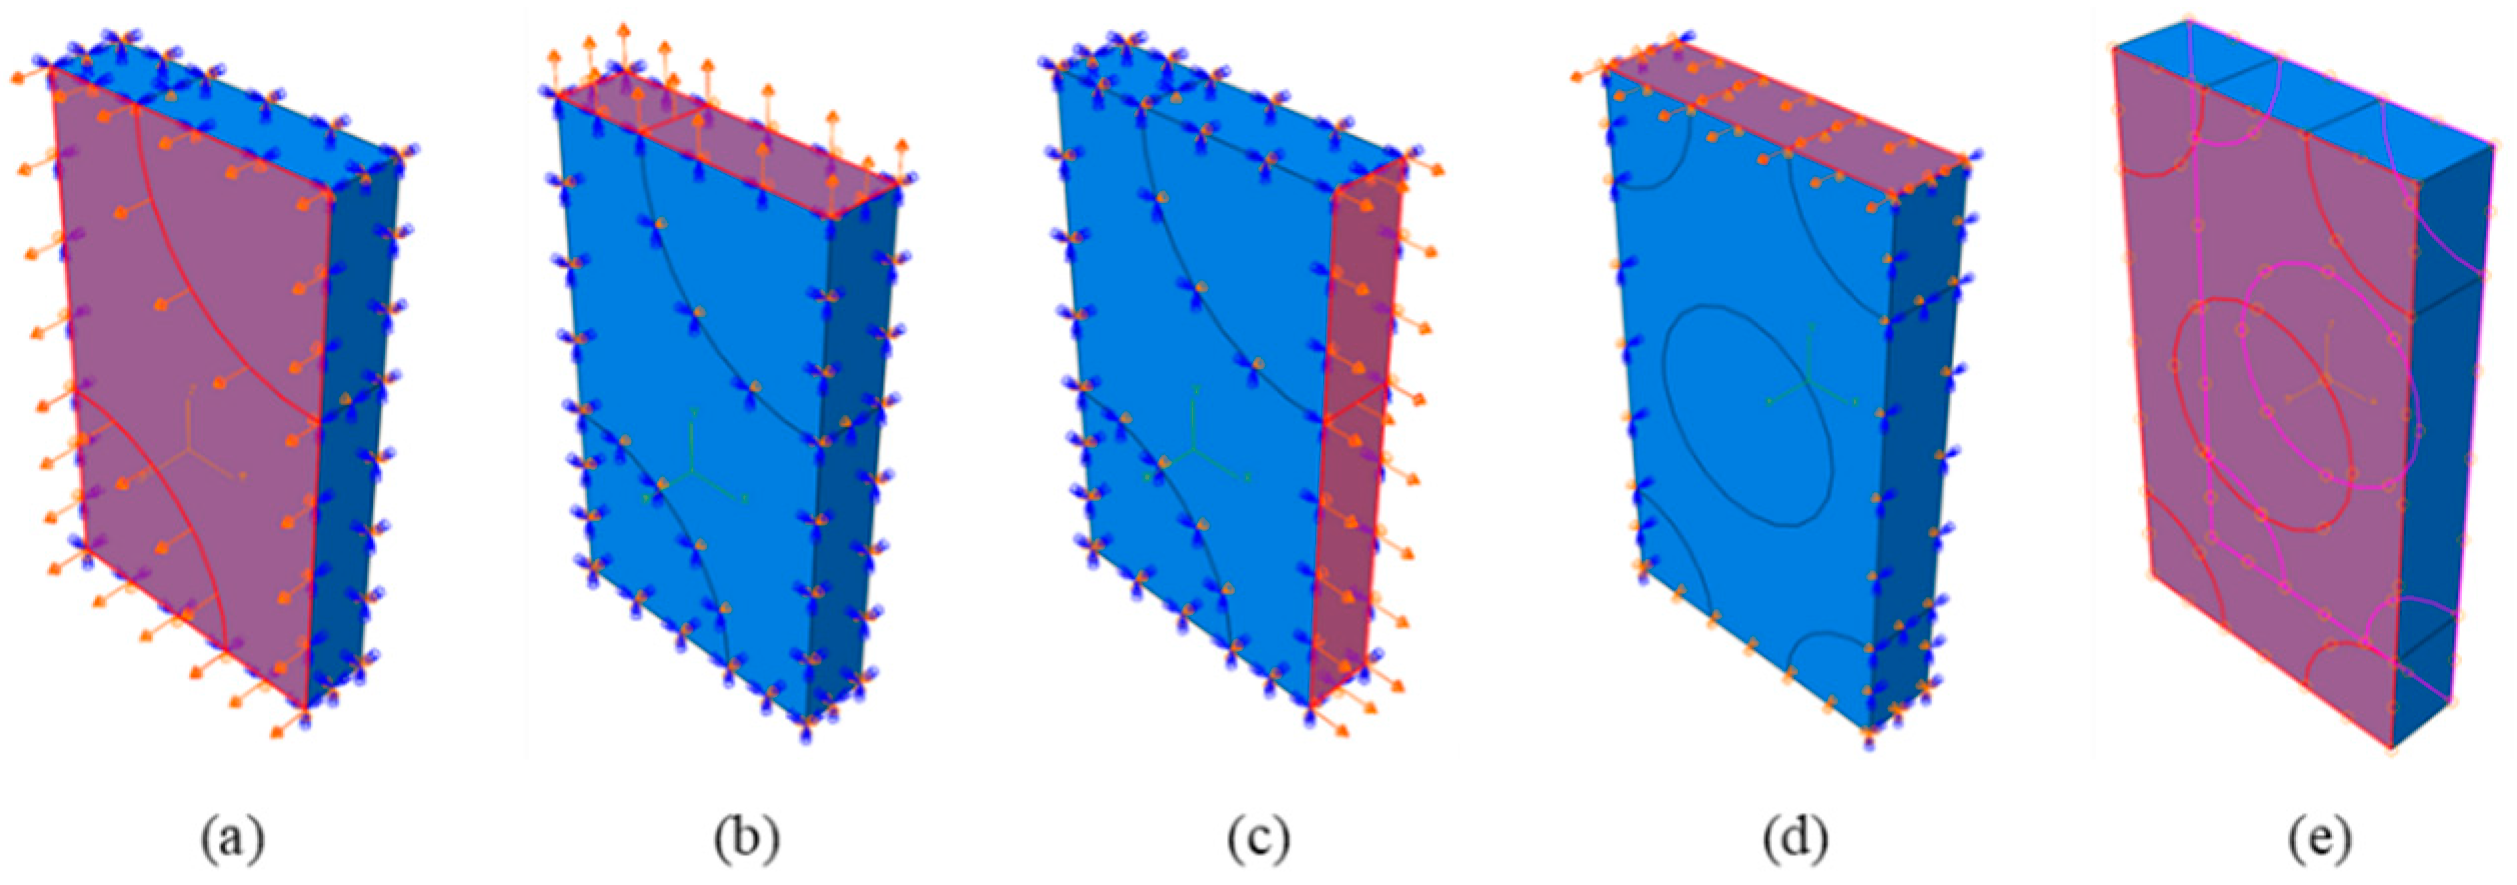
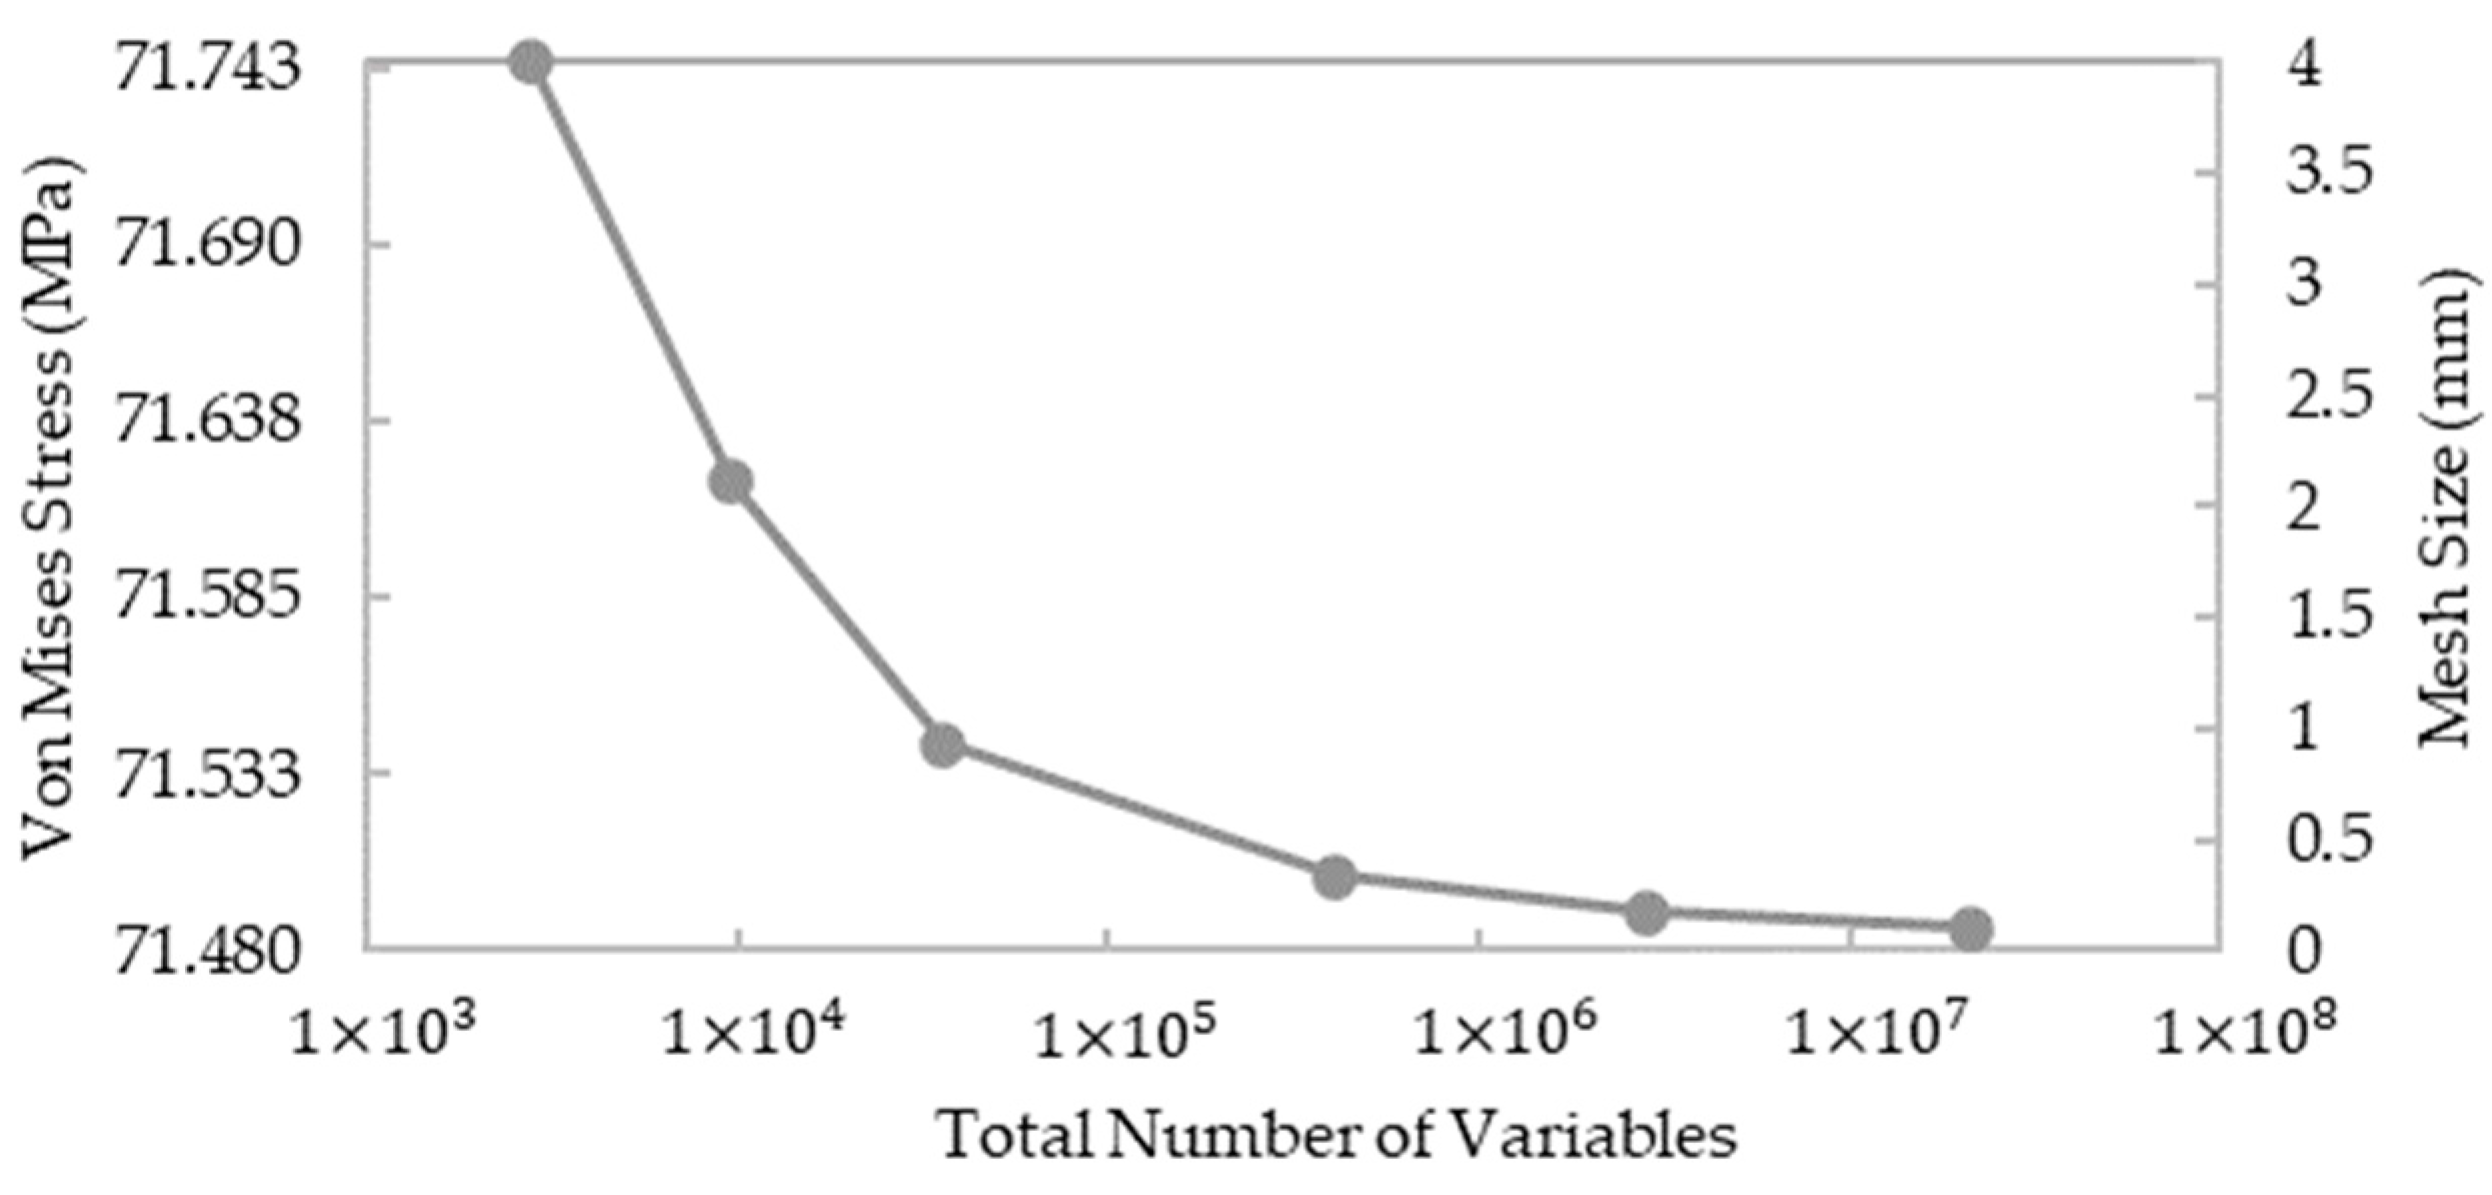
2.4. Finite Element Modeling of SFRC Mechanical Response

To examine the validity of the obtained effective parameters of the SFRC laminate, modeling of the SFRC tensile experiments is carried out for each fiber-volume fraction with the corresponding effective elastic parameters, calculated assuming either the isotropic or anisotropic approaches. Geometric models are built in accordance with the dimensions of the experimental samples, an SC8R-type shell element with a size of 0.4 mm is used. Convergence tests were conducted in order to check the influence of the mesh size on the computed results, as discussed in Appendix C. For each model, the corresponding parameters are entered in the table of lamina settings available in ABAQUS [52]. Layup orientation is defined as 0° and 45°, respectively, to the direction of the fiber in the experimental tests. The boundary conditions are defined as fixed at the bottom with a displacement-boundary condition at the top (griped ends are not deformed). An analysis is performed in Abaqus/Standard using an implicit time-integration scheme. In Figure 4, the SFRC specimen model geometry, boundary conditions and mesh are shown.

3. Results

3.1. Sisal-Fiber Mechanical Properties

A total of 15 tensile tests were performed on different sisal-fiber bundles: five for each bundle group, which contained different quantitative content of the fibers. During the loading, at first the fibers were stretched, then some of the fibers began to break before the load reached the maximum measured value; the bulk of the fibers broke after this in the strain range of 1.5–2%, and only some of the fibers reached a strain of 2.5% (Figure 5). The critical value of the load increased with an increase in the number of fibers: the 44, 88 and 132 g specimen bundles, on average, withstood 419, 807 and 1197 N, respectively. Thus, with an increase in the number of fibers, the load-bearing capacity also grew close to a linear relationship. In general, the longitudinal elastic modulus varied from 22.5 GPa to 29.6 GPa; it is worth noting that the difference between the maximum and minimum values for each test group decreased with an increase in the number of fibers. The standard deviation of the elastic modulus decreased from 2.4 GPa to 1.5 GPa with a threefold increase in the number of fibers. Nevertheless, the average value of the elastic modulus for each group was almost the same and close to 25 GPa, which corresponds to the obtained value of the modulus of elasticity in the study of Oksman et al [11].

3.2. Matrix Mechanical Properties

The tensile behavior of the epoxy resin is nonlinear and corresponds to the typical behavior of plastics. The average value of tensile strength at yield point is σ m = 44.6   MPa at a strain of 2.8%. The modulus of elasticity was measured at the initial segment of the curve, which is close to linear, as shown in Figure 6. The obtained modulus of elasticity is E m = 2.3   GPa ; the Poisson’s ratio is ν m = 0.4 .

3.3. SFRC Mechanical Properties

SFRC tensile tests with axial load were performed on three series of samples with fiber-volume fractions of 20%, 40% and 60%. At least five samples were tested for each fiber-volume fraction. For the 20% fiber-volume fraction, the typical fracture mode is close in shape to that of a homogeneous material—an almost straight line perpendicular to the load direction (Figure 7a). For a 60% fiber-volume fraction, the fracture takes the form of vertical stripes parallel to the fiber direction (Figure 7c). For a 40% fiber-volume fraction-a combined vertical and horizontal mixed mode or a diagonal failure mode is observed (Figure 7b). According to the test results, the effective modulus of elasticity for the SFRC with 20%, 40% and 60% fiber-volume fractions are 6.2 ± 0.55 GPa, 11.2 ± 0.48 GPa and 13.8 ± 0.96 GPa respectively; the effective tensile strength values are 118.8 ± 8.69 MPa, 211.4 ± 11.30 MPa and 251.8 ± 18.98 MPa, respectively (Figure 8). The strain at failure for all composite compositions is 1.8% ± 0.14%, which is in the range of strain at break of the fibers, given in Section 3.1.
The tensile tests under off-axis loading were performed at an angle of 45° relative to the fiber in the SFRC specimens with fiber-volume fractions of 20%, 40% and 60%. All tested samples, regardless of the percentage of fiber content, had the same fracture form—a diagonal line at 45° along the fiber (Figure 7d). The effective modulus of elasticity for the SFRC with 20%, 40% and 60% fiber-volume fractions and the fiber direction in 45° to the load are 2.5 ± 0.29 GPa, 2.3 ± 0.30 GPa and 2.1 ± 0.20 GPa, respectively; the effective tensile strengths of the SFRC are 13.2 ± 1.5 MPa, 10.8 ± 1.7 MPa and 7.1 ± 1.8 MPa, respectively (Figure 9). It is important to note that the effective tensile strength is small (much smaller than the critical stress for the matrix); the low fiber-matrix bonding strength, as well as low transverse strength of the fiber itself, can be the cause of the observed fracture.

3.4. Estimation of Effective SFRC Mechanical Properties from RVE Computations

All numerical and analytical predictions of the effective properties of the lamina are based on the following assumptions:
  • fibers are uniformly distributed throughout the matrix,
  • the fibers and the matrix are perfectly bonded,
  • the matrix is free of voids.
A total of twelve computational models for the various volume fractions, assuming the fiber is either an isotropic or an anisotropic material, are built to define the laminate constants. The input parameters of the fiber and the matrix, obtained from the above experiments and partially supplemented from the literature [15,17], are presented in Table 1. The dimensions of the RVE models are calculated from the ratio of fiber volume to matrix volume, according to the hexagonal array configuration [36], based on the average sisal fiber diameter of 200   μ m , taken from the literature [9].
Calculation of the components of the stiffness matrix is carried out according to Equation (2), based on the output data at an element integration point of the stresses in different directions (S11, S22, S33, S12, S13, S23 in ABAQUS) and local volume (IVOL in ABAQUS). The effective properties of the lamina are calculated based on the obtained components of the stiffness matrix according to Equation (3). For illustration, the output of the stresses for fiber defined as isotropic is shown in Figure 10, and as anisotropic is shown in Figure 11, for fiber-volume fractions of 20%, 40% and 60% in both cases. The stresses in the direction of the unit strains (Section 2.3) are shown. The transverse stiffness of an isotropic fiber is higher than the stiffness of the matrix, while the transverse stiffness of an anisotropic fiber is less than the stiffness of the matrix; accordingly, there is a difference in the stress distribution in the RVE models.
The computed effective properties of the SFRC using the numerical RVE approach (Equations (2) and (3)) with either isotropic or anisotropic fibers are given in Table 2.
For verification of the RVE methodology, the relative error δ between the computed values from the RVE and the values obtained using two analytical models PMM [55,56] (Equations (A1)–(A22)) and MTT [58] (Equations (A23)–(A30)) (Table 2) was calculated using the following expression:
δ = f R V E f A N A f A N A × 100 %
The maximal relative error between numerical and analytical computations was δ = 3.453 % for the isotropic case (PMM [55,56]) and δ = 0.056 % for the anisotropic case (MTT [58]).

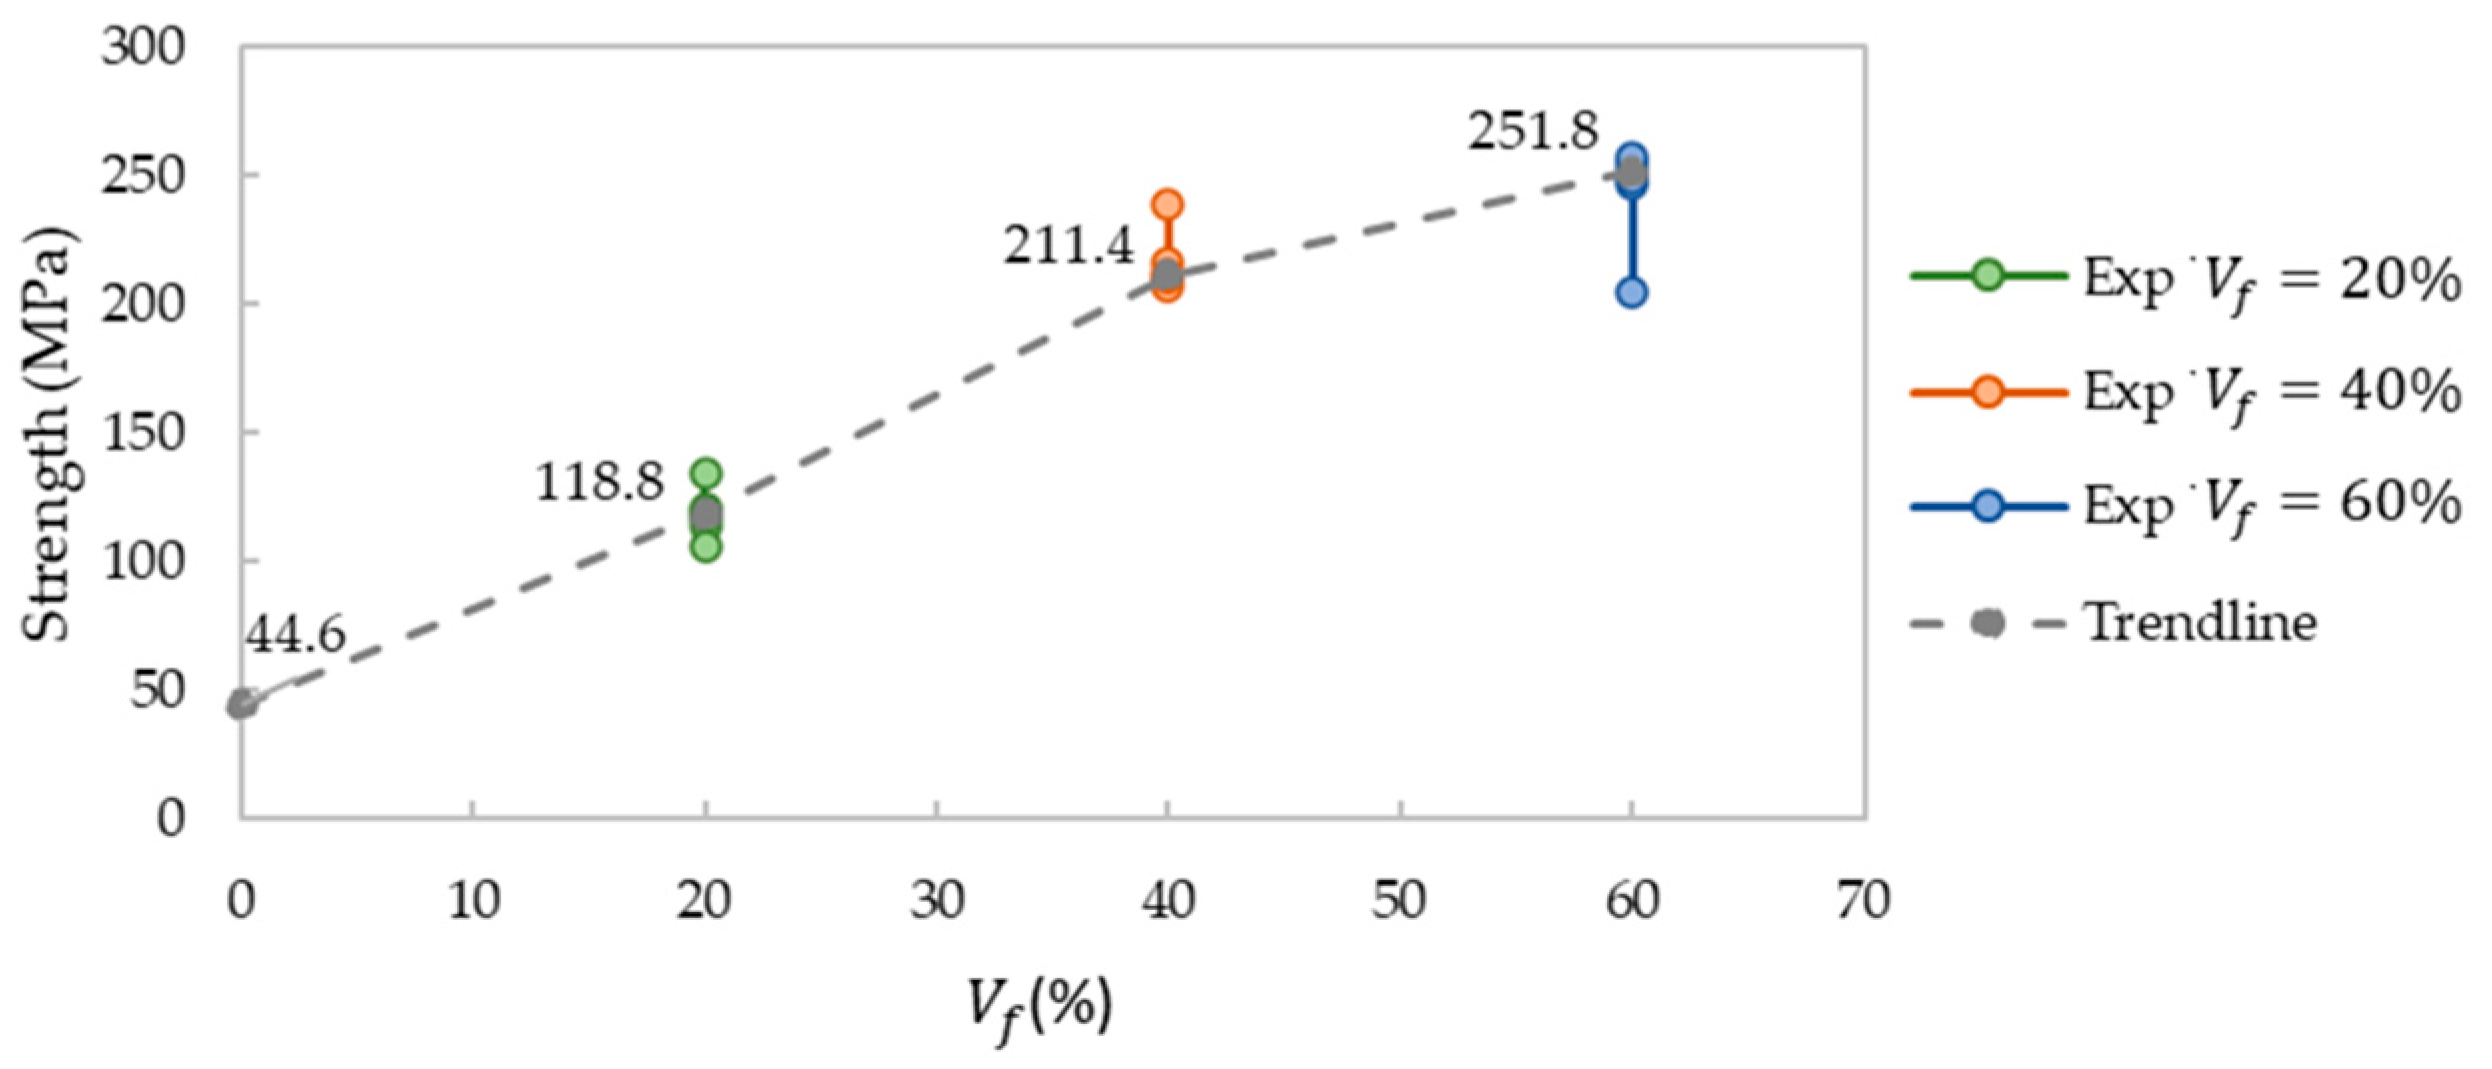
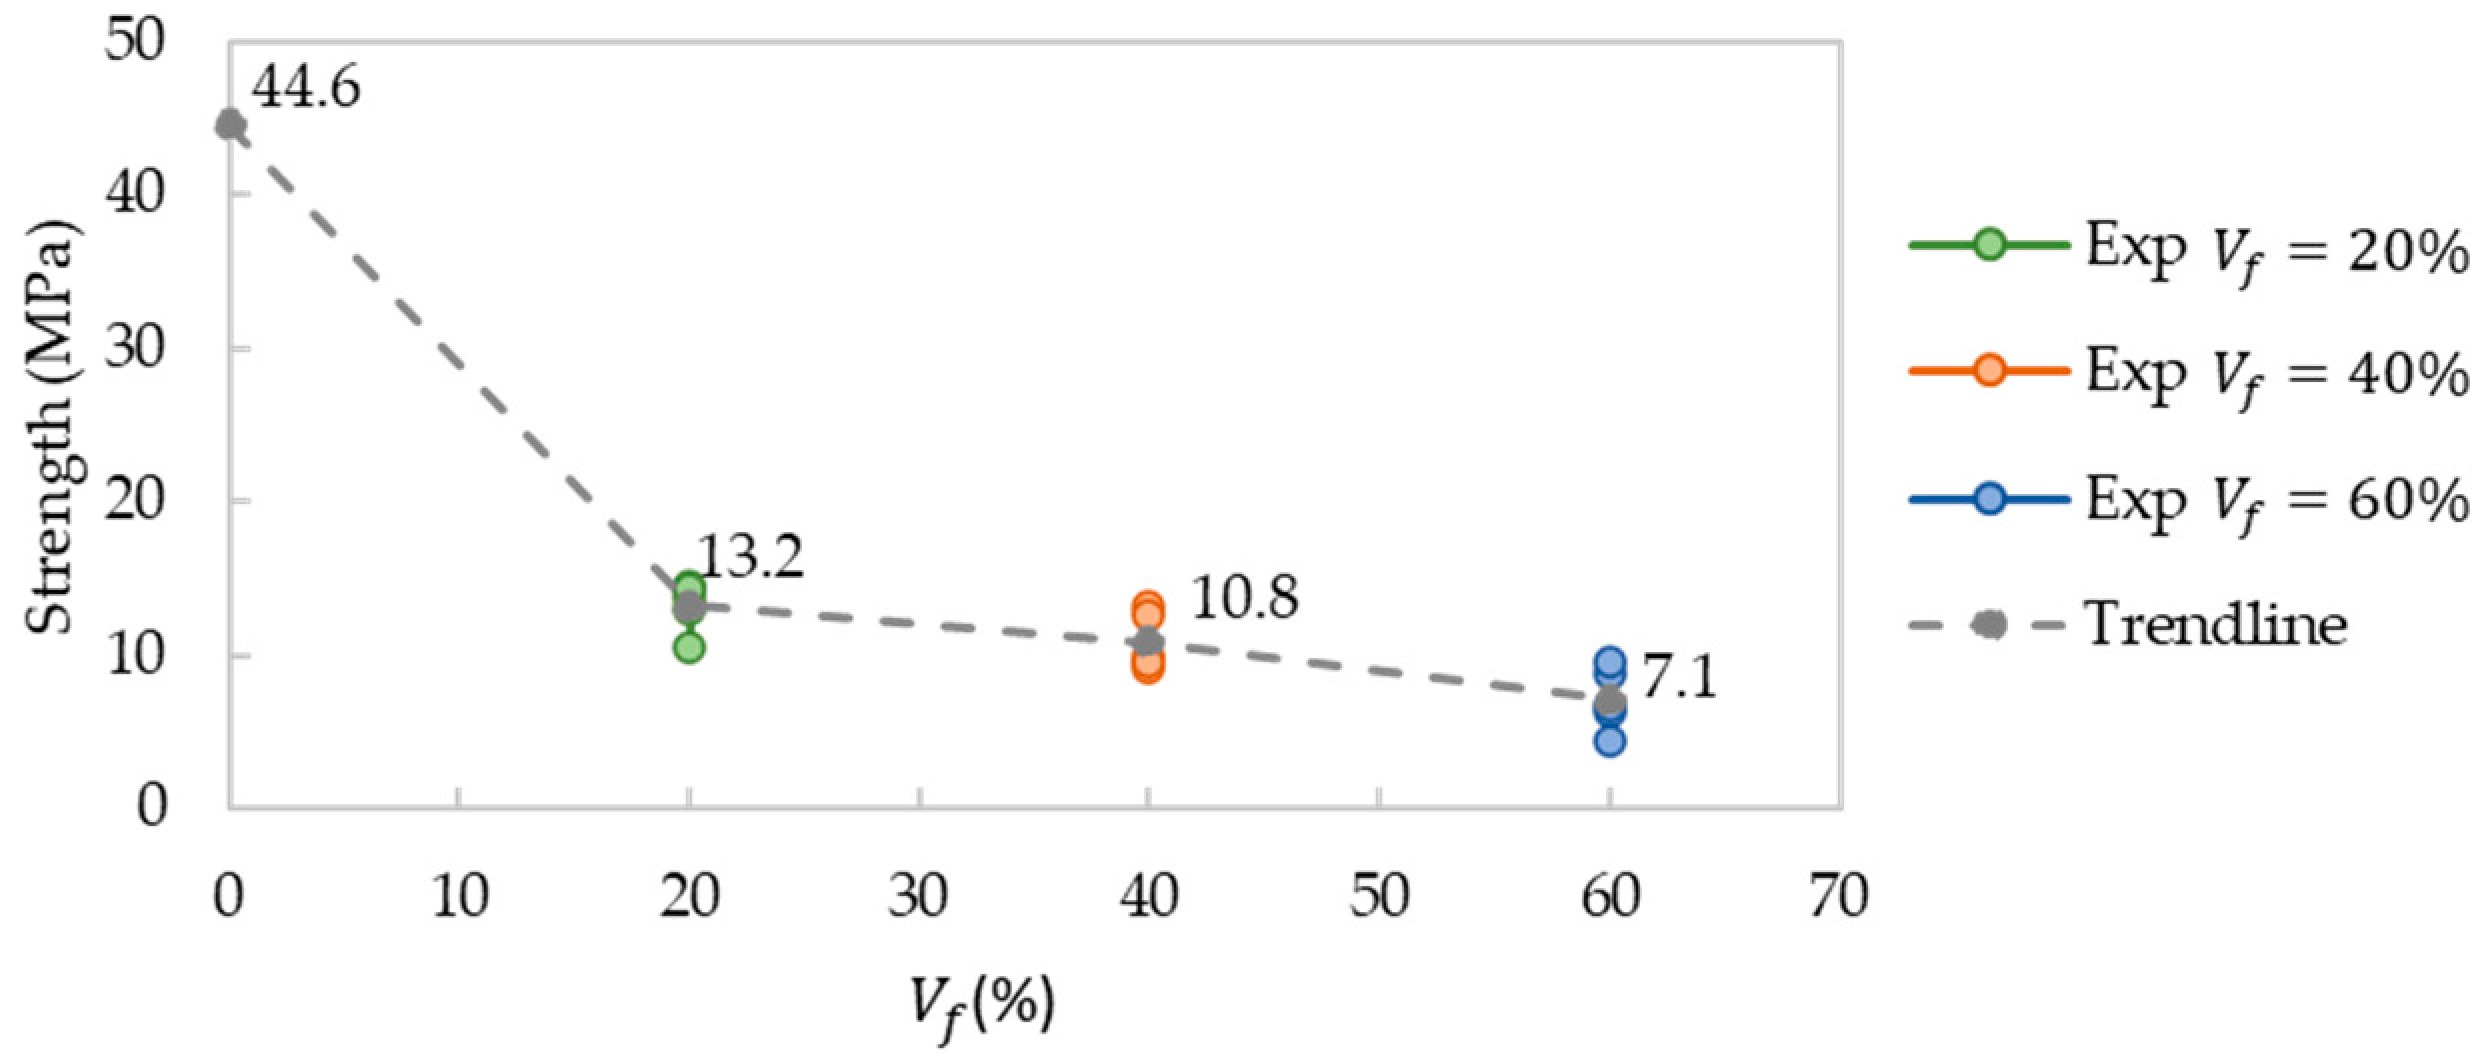
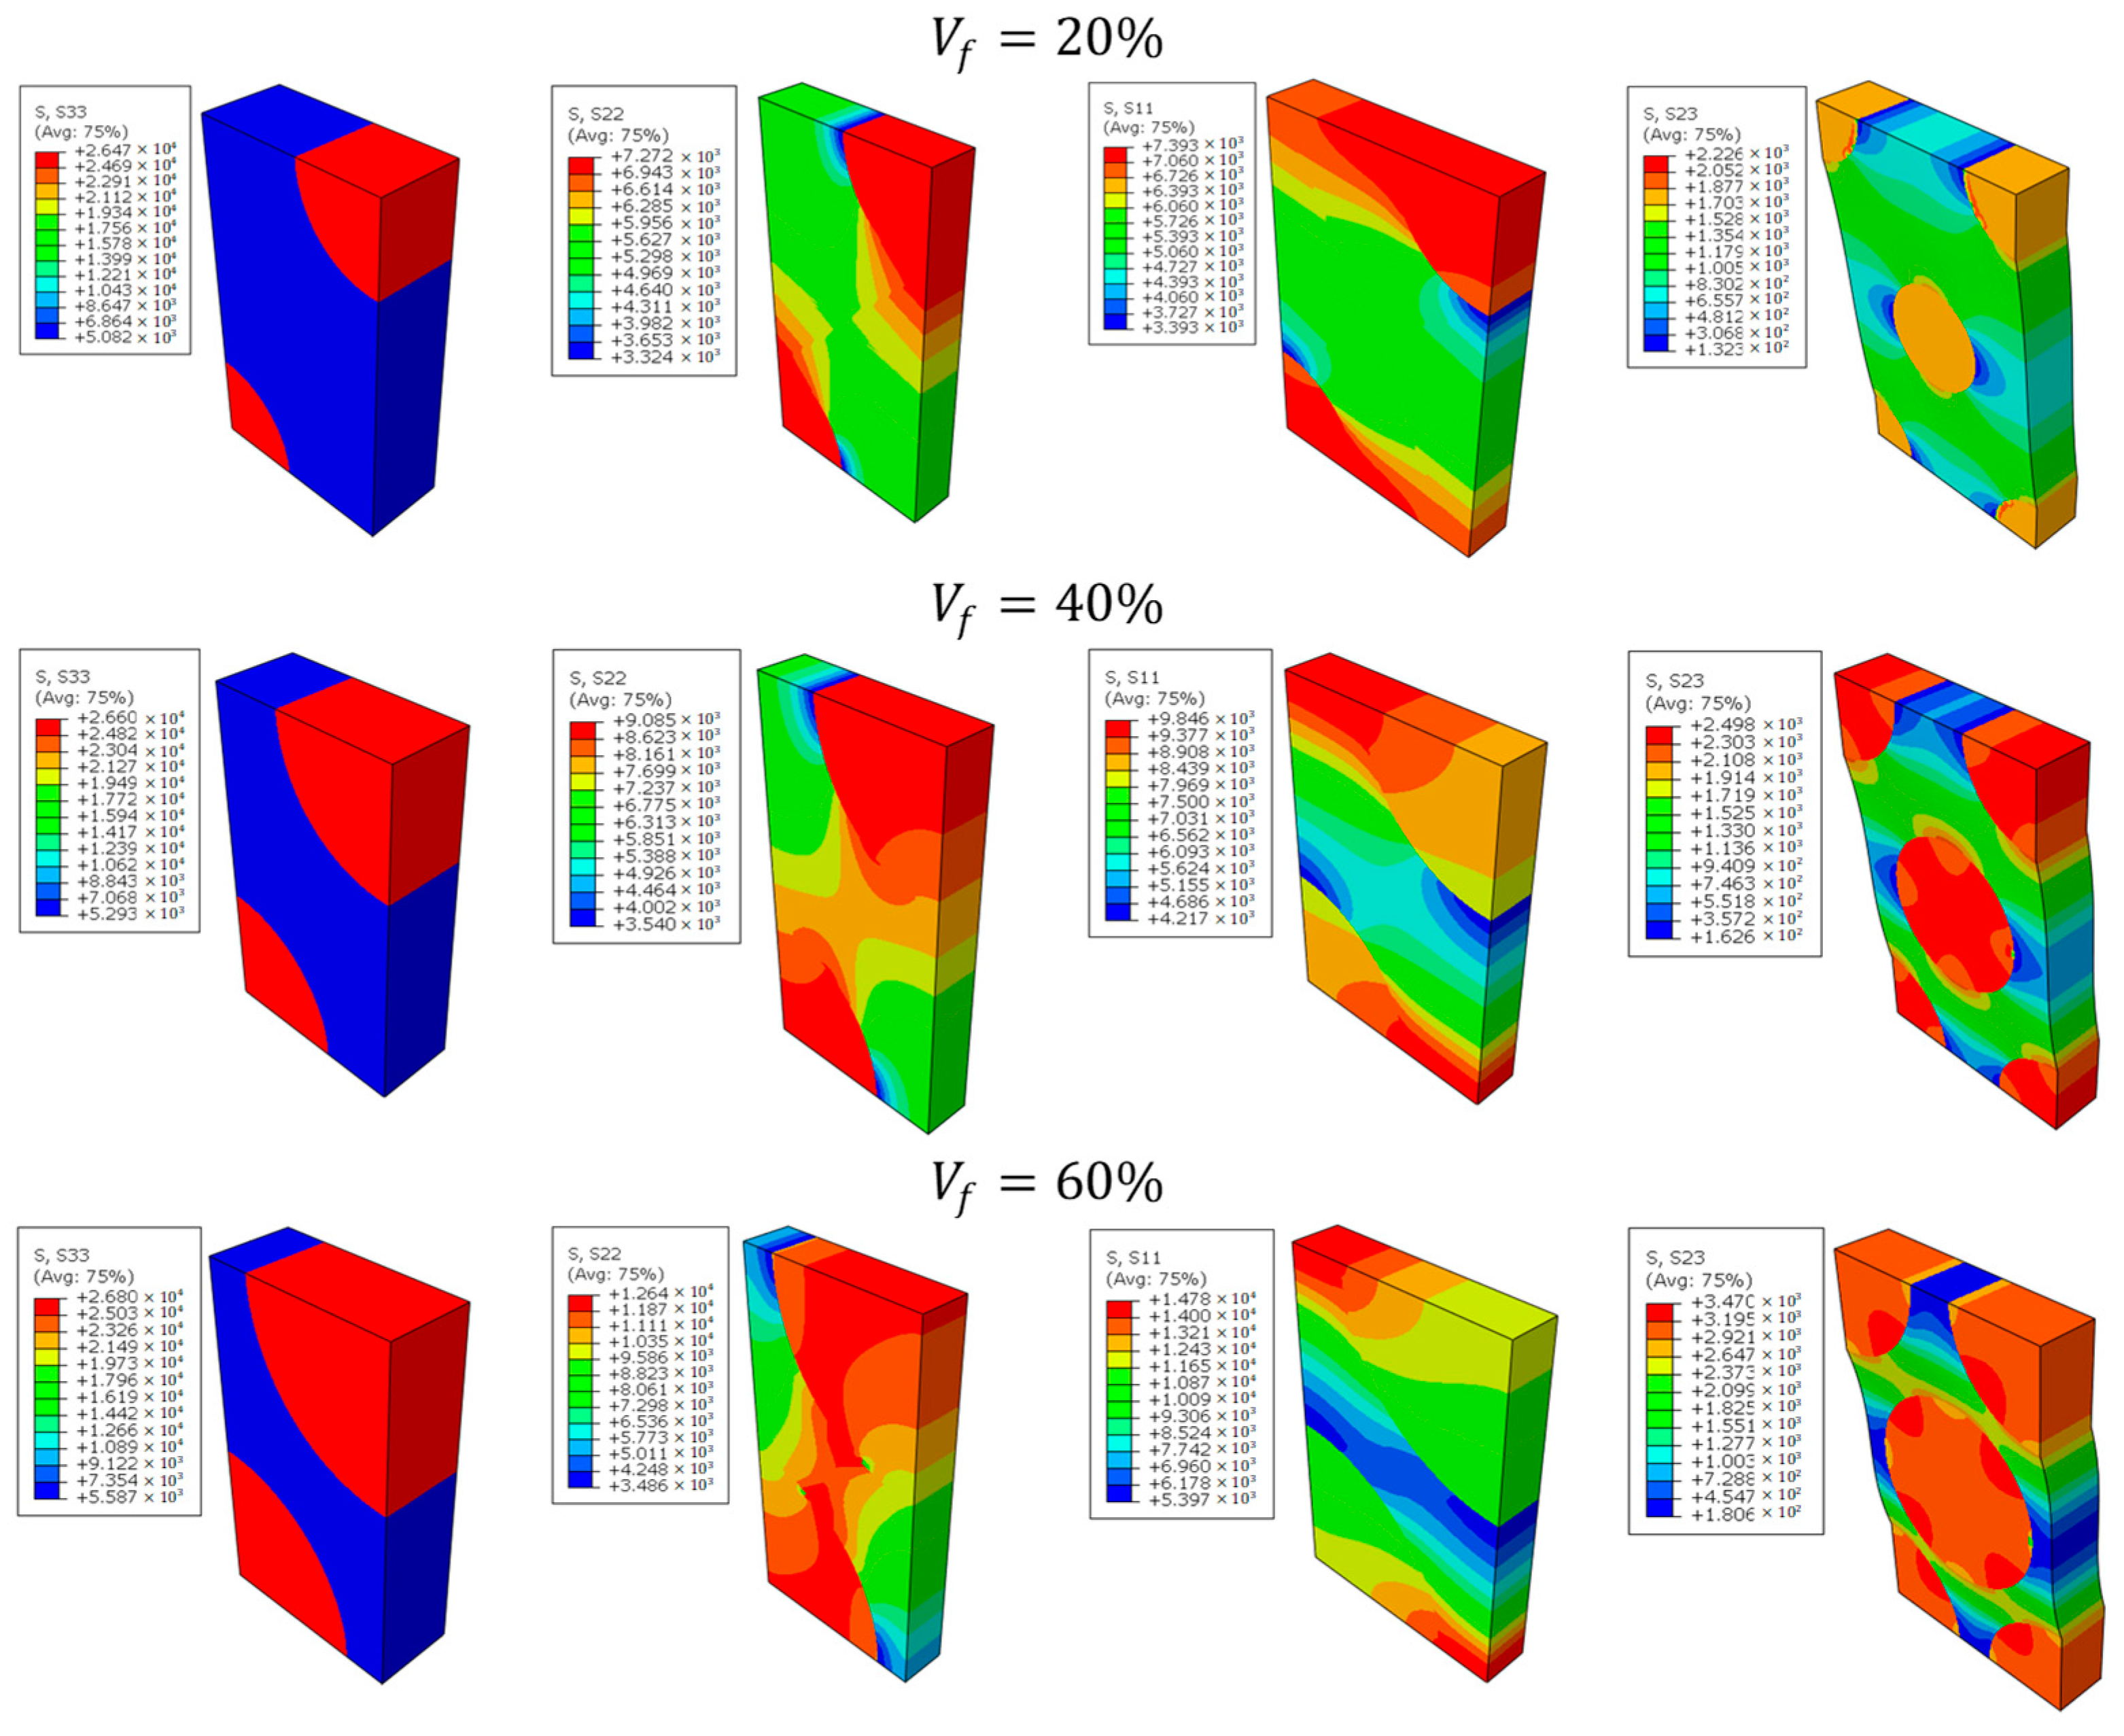
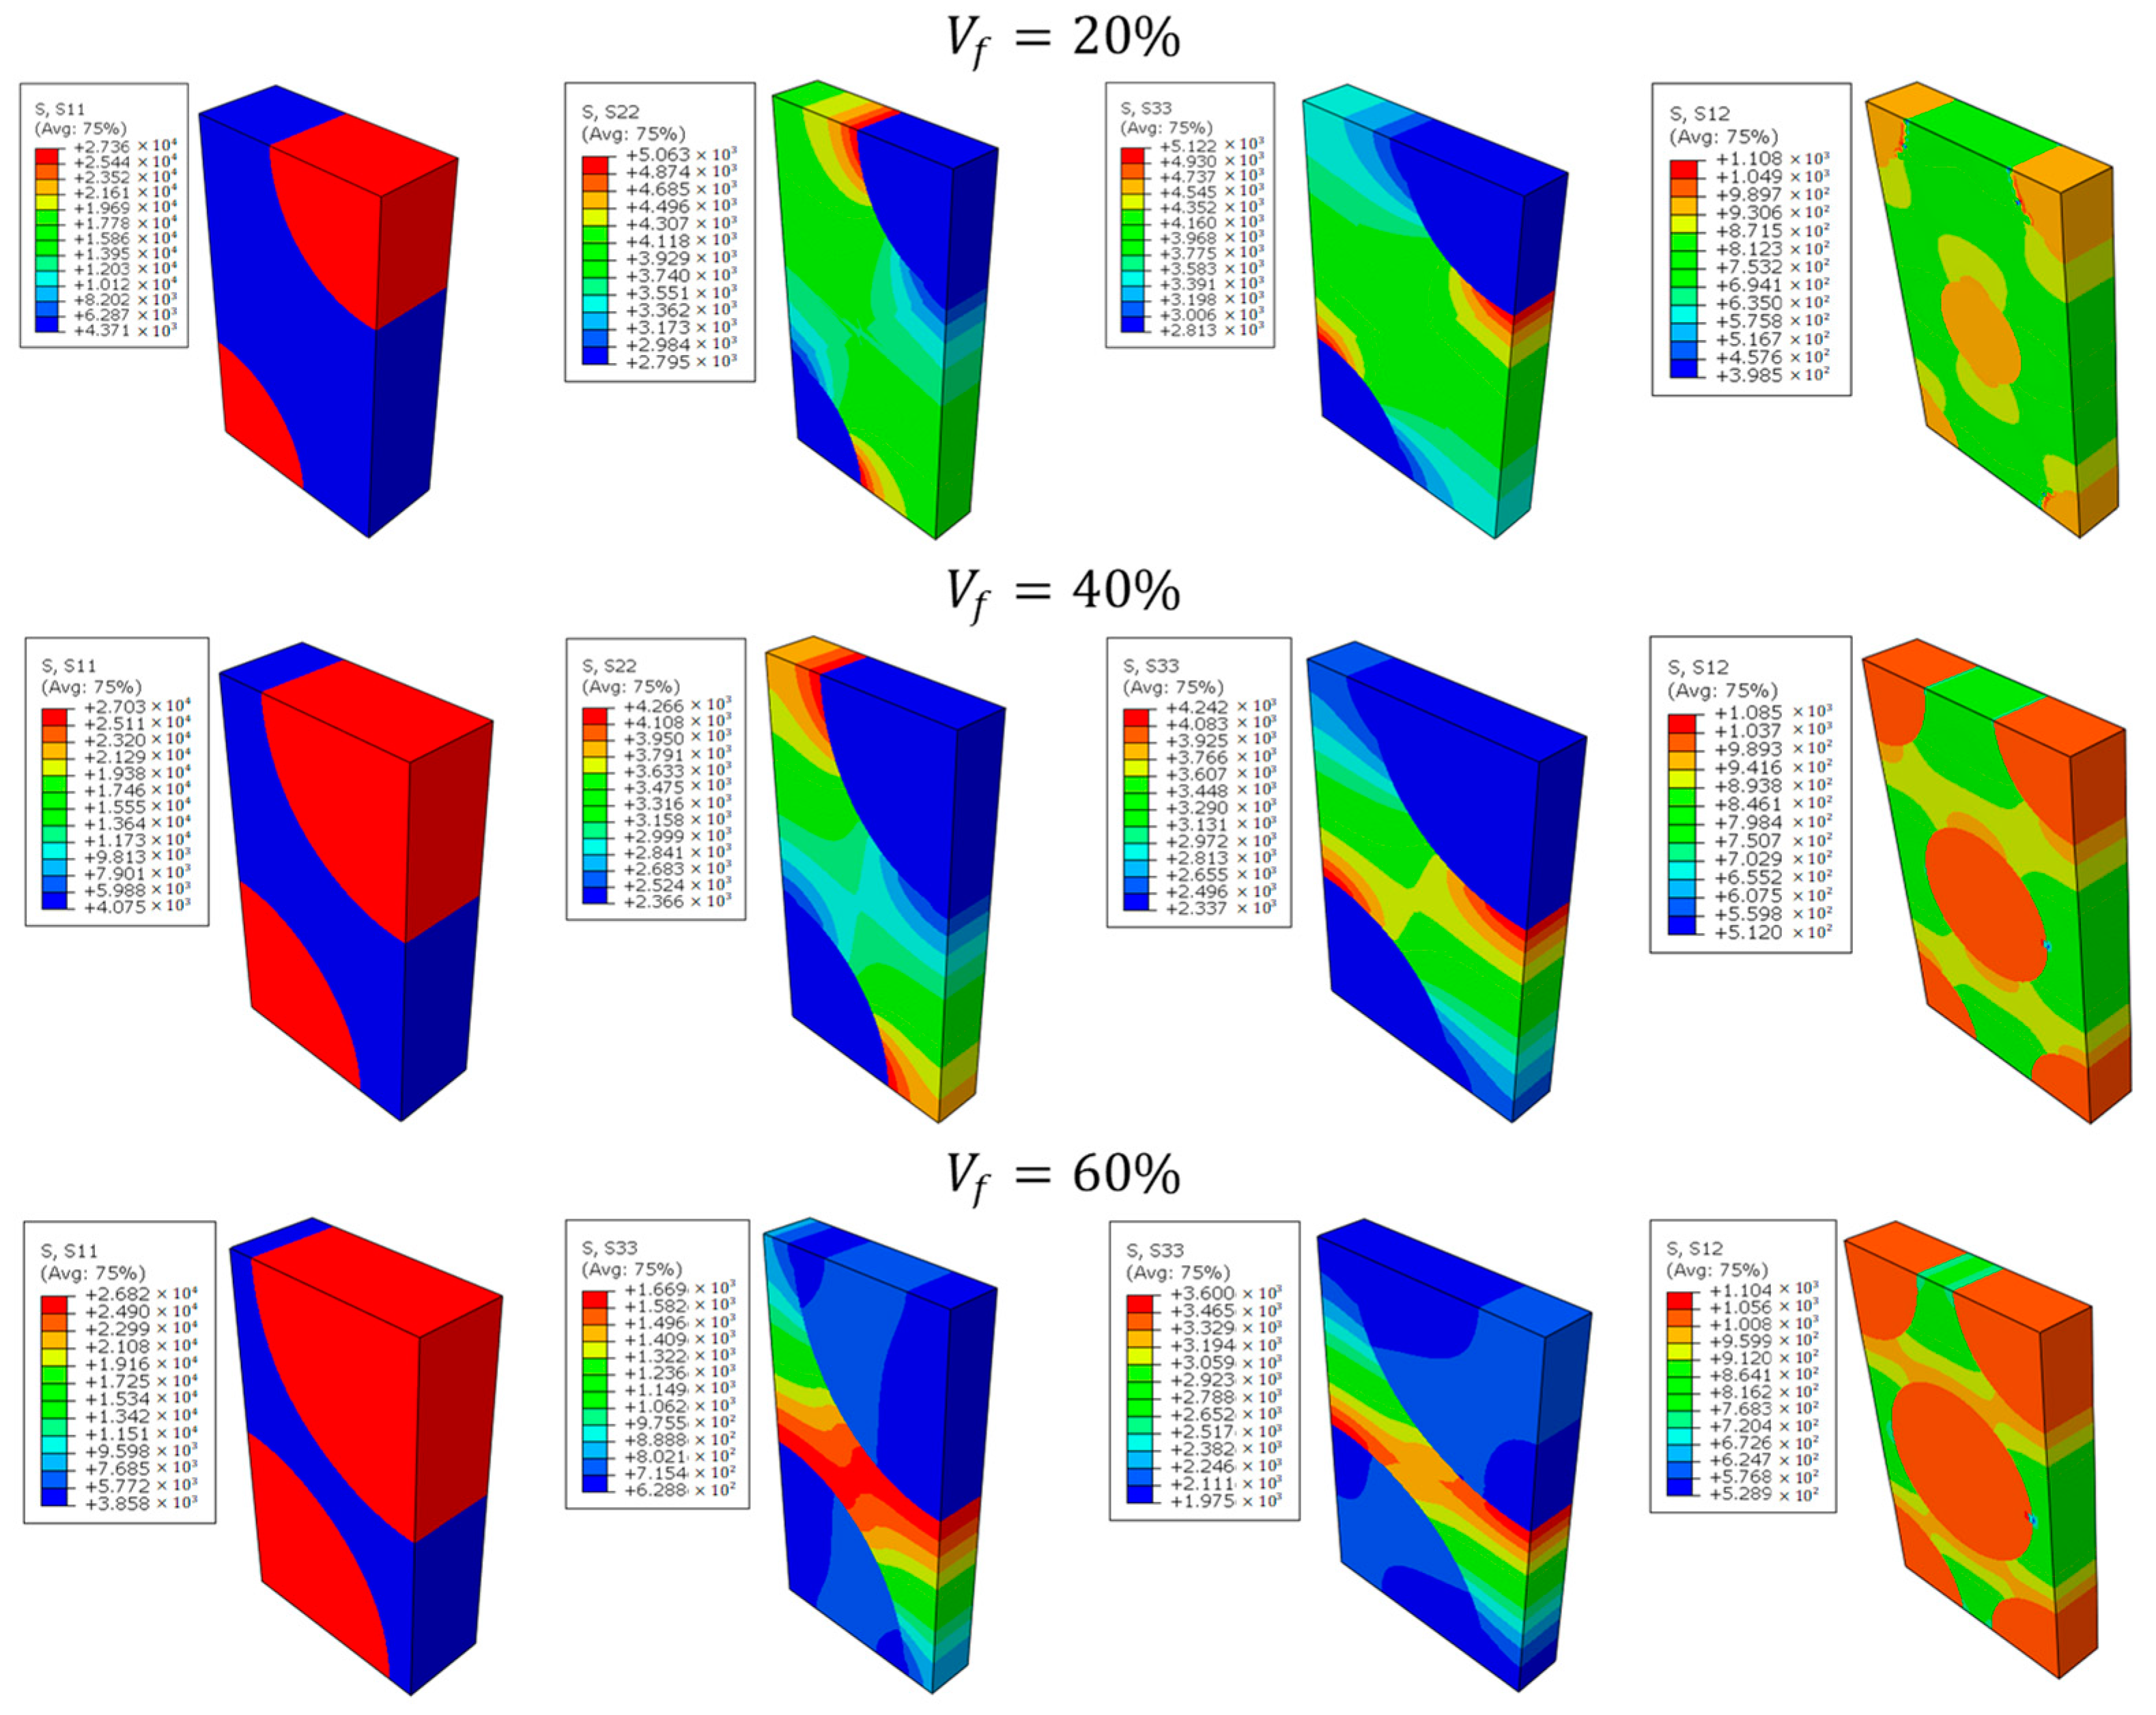
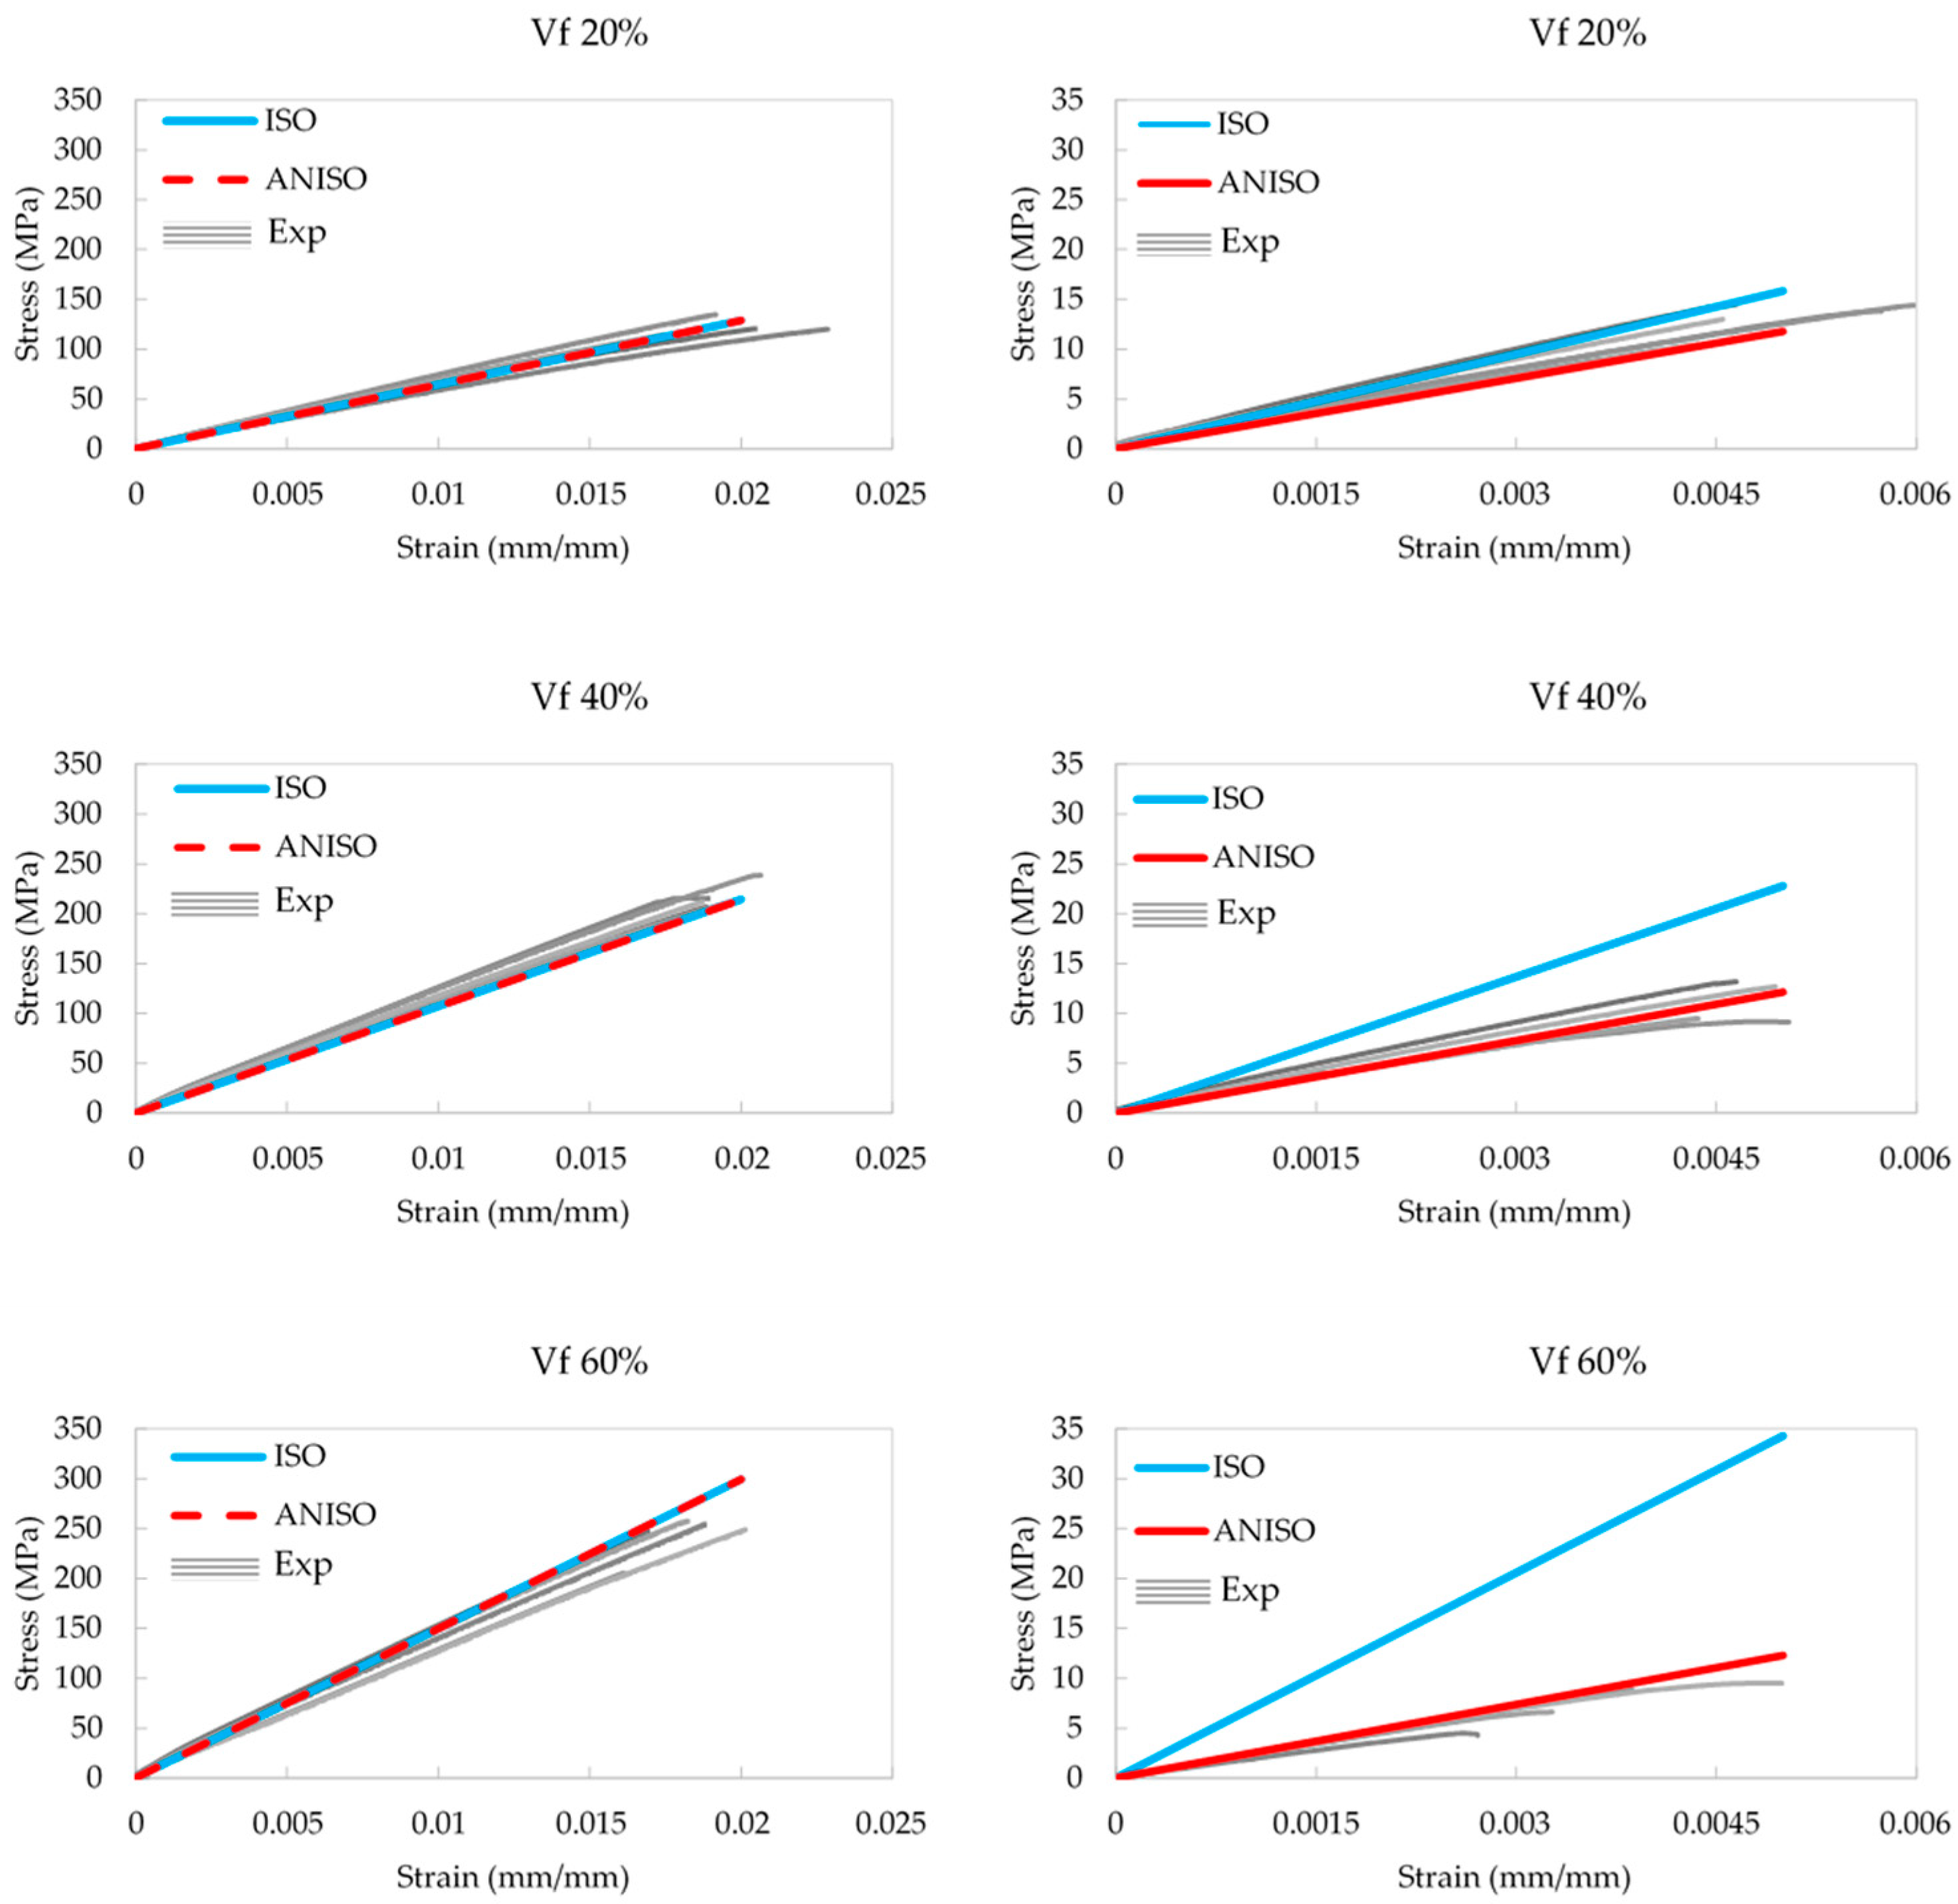
3.5. Measured and Simulate Effective Mechanical Response of SFRC

The effective parameters of composites, obtained in Section 3.2, are introduced into numerical models of the tensile tests, built in the ABAQUS software, according to the description in Section 2.4. The analysis is carried out on 12 models: 6 for axial and 6 for off-axial loading, for different fiber-volume fractions of 20%, 40% and 60%. The results of the analysis are shown in relation to the corresponding experiments in Figure 12: for axial load in the left column and for off-axis loading at 45° to the fiber orientation in the right column.

4. Discussion

When addressing the applicability of natural fiber composites as engineering load-bearing components, two of the main engineering properties are of interest: the specific strength and the specific modulus. These are defined as the ratio between effective strength and density and effective modulus and the density respectively. Both the effective modulus (Table 2) and the effective strength (Figure 8) of the SFRC in the fiber direction increases with an increase in the volume fraction of the fibers. This results in specific strength values of 105–216 [10−3 MPa/(kg/m3)] and specific modulus values of 5.5–11.9 [10−3 GPa/(kg/m3)] for composites obtained in this study. The values for the specific strength of the sisal–epoxy composites in the fiber direction are comparable to the specific strengths of classical engineering materials such as aluminum alloys and steel, which have specific strengths of 51–229 [10−3 MPa/(kg/m3)] and 43–269 [10−3 MPa/(kg/m3)], respectively. With regard to the specific modulus, the sisal–epoxy composites are lacking in effective stiffness compared to classical alloys with specific modulus of 24–25 [10−3 GPa/(kg/m3)] for aluminum alloys and 26–27 [10−3 GPa/(kg/m3)] for steels. As is known from the literature [59], in terms of effective fracture toughness (2.19–5.54 MPa m1/2), sisal-epoxy composites are also inferior to metals. Nevertheless, the high longitudinal specific strength, which can surpass several aluminum and steel alloys, makes SFRC a very good candidate for some engineering applications, such as those in which the sisal–epoxy composite is itself used as a reinforcement [7]. It should also be noted that for the sisal–epoxy composite to be applicable as a structural component, a standard laminate structure should be utilized in which different UD sisal–epoxy laminae are stacked in different orientations. This is required for a general-purpose component, as it was demonstrated in this study that the strength of the SFRC decreases significantly under off-axis loading (Figure 9). Such a drastic decrease in the off-axis strength of a single lamina can be caused both by a weak bonding between the fiber and the matrix and/or by low transverse strength of the sisal fibers; both reasons can also explain the decrease in strength with increasing fiber-volume fraction.

4.1. The Influence of Fiber Anisotropy on the Mechanical Response

The effective longitudinal modulus of elasticity is largely a function of the modulus of elasticity of the fiber, and as one would expect, it increases with increasing fiber-volume fraction. However, the transverse modulus of the sisal fiber is much lower, and even lower than the modulus of the matrix; as a result, with an increase in the volume fraction of the fiber, the effective transverse modulus of elasticity of the composite decreases. Both longitudinal and transverse modules must be considered by designers when planning SFRC structures. In this study, a numerical analysis was carried out, validated by experiments, for the correct determination of engineering constants for a given material.
As seen in Figure 12 in the left column, in the case of axial loading in the fiber direction, both isotropic and anisotropic fiber computational approaches give identical results which match the experimental curves. However, a significant difference between the parameters of the two approaches is observed when simulating tensile tests of materials with a fiber direction of 45° as seen in Figure 12, right column. It is not possible to reproduce the observed effective mechanical response for the off-axis-oriented fibers under the assumption of fiber isotropy. Since well-established models for the prediction of effective properties of composites with man-made fibers assume the fibers are isotropic, they cannot describe well sisal-fiber composites due to their highly anisotropic structure. The greater the volume fraction of fibers in the composite, the greater the difference between simulation and experiments for the off-axis case. The simulations with elasticity parameters obtained considering the anisotropy of the fibers give a good approximation to the experimental results for both the axially and off-axis-oriented fiber layout. Moreover, as can be seen from Figure 12, the parameters of the sisal fiber, partially identified in this work and partially taken from the literature, produce computed values that match the experimental results well.

4.2. The Influence of Fiber-Volume Fraction on the Mechanical Response

In general, sisal fibers, as well as UD sisal–epoxy composites, exhibit linear elastic behavior up to failure (Figure 5 and Figure 12). During the experiments on the composites, characteristic forms of failure were noted, a transverse crack path at low fiber-volume fractions and longitudinal cracks at high fiber-volume fractions. With that, the observed linearity of the load-bearing capacity of the fiber bundles does not represent the effective strength of the composite. Analyzing the average strengths of SFRC, at 20% and 40% the values increase in proportion to the fiber volume fraction, but at 60% the increase is noticeably lower (Figure 8). Presumably, at high fiber-volume fractions, a significant variation in sisal fiber diameters and strengths (which is less typical for synthetic fibers) causes shear stresses leading to matrix fracture and splitting along the fibers, and thus reducing the strength of the composite.
The current study has several limitations which need to be addressed. Firstly, it was assumed that a perfect bonding exists between the sisal fibers and the matrix. This assumption may be justified for the initial stages of loading, but may not be accurate close to the composite load-bearing capacity or in the case of off-axis loading. Secondly, although the micromechanical modeling approach provided effective properties that are in agreement with the tensile experiments, the exact microstructure of the sisal fiber was not specifically addressed in the micromechanical RVE analysis. It is known that the sisal fiber has a porous structure. This specific structure may influence the effective response under different loading modes which incorporate significant shear stresses. Future work will take into account both of these important aspects.

5. Conclusions

Environmentally friendly composite materials reinforced with natural sisal fibers were the subject of research in this work. Sisal fibers extracted from the Agave sisalana plant, grown in the Negev region of Israel, were initially characterized by mechanical testing. Then, sisal–epoxy composite specimens with different sisal-fiber compositions were fabricated. Tensile experiments were conducted in which the SFRC specimens were loaded in the axial direction or off-axis with respect to the sisal-fiber direction. The study utilized both analytical and micromechanically based numerical approaches to estimate the effective properties of the composite from values of the individual constituents (i.e., sisal fiber and epoxy resin). Next, the effective properties calculated using the different analytical and numerical methods were incorporated in finite-element simulations of the tensile tests on the SFRC specimens. Using the simulations, it was demonstrated that sisal-fiber anisotropy cannot be overlooked and must be incorporated in any mechanical analysis of the SFRC. Only by considering the anisotropy of the sisal fiber can the mechanical response, obtained in the off-axis experiments, be reproduced in the computations. The influence of sisal-fiber transverse modulus on the overall mechanical response is a function of the sisal-fiber volume fraction. Based on this study, it is possible to obtain engineering constants for UD SFRC materials with other fiber-volume fractions without additional experimentation. It has been shown that the longitudinal specific strength of SFRC is comparable to classical aluminum alloys or steel. Thus, this environmentally friendly composite can be considered as an alternative in some engineering applications, such as reinforcement in concrete composites.

Author Contributions

Conceptualization, O.S., N.T. and E.P.; methodology, N.T. and E.P.; formal analysis, O.S.; resources, N.T. and E.P.; writing—original draft preparation, O.S.; writing—review and editing, O.S., N.T. and E.P.; supervision, N.T. and E.P.; funding acquisition, N.T. and E.P. All authors have read and agreed to the published version of the manuscript.

Funding

This research was funded by IAEC, grant number 5100044897 and The APC was also funded by grant number 5100044897.

Institutional Review Board Statement

Not applicable.

Informed Consent Statement

Not applicable.

Data Availability Statement

The data presented in this study are available on request from the corresponding author.

Acknowledgments

The authors would like to thank to Jacob Broner for assistance with cutting of the tensile specimens.

Conflicts of Interest

The authors declare no conflict of interest.

Appendix A

In the Periodic Microstructure Model (PMM) [55,56], the transversely isotropic effective properties of lamina are given by the following formulas:
E 11 = C 11 * 2 C 12 * 2 C 22 * + C 23 *
E 22 = ( 2 C 11 * C 22 * + 2 C 11 * C 23 * 4 C 12 * 2 ) ( C 22 * C 23 * + 2 C 44 * ) 3 C 11 * C 22 * + C 11 * C 23 * + 2 C 11 * C 44 * 4 C 12 * 2
G 12 = G 13 = C 66 *
ν 12 = ν 13 = C 12 * C 22 * + C 23 *
ν 23 = C 11 * C 22 * + 3 C 11 * C 23 * 2 C 11 * C 44 * 4 C 12 * 2 3 C 11 * C 22 * + C 11 * C 23 * + 2 C 11 * C 44 * 4 C 12 * 2
G 23 = E 22 2 ( 1 + ν 23 )
where the stiffness tensor having six coefficients is given by
C 11 * = λ m + 2 μ m V f D [ S 3 2 μ m 2 2 S 6 S 3 μ m 2 g a S 3 μ m c + S 6 2 S 7 2 μ m 2 g 2 + a S 6 + b S 7 μ m g c + a 2 b 2 4 c 2 ]
C 12 * = λ m + V f D b [ S 3 2 c μ m S 6 S 7 2 c μ m g a + b 4 c 2 ]
C 22 * = λ m + 2 μ m V f D [ a S 3 2 μ m c + a S 6 2 μ m g c + a 2 b 2 4 c 2 ]
C 23 * = λ m + V f D [ a S 7 2 μ m g c b a + b 2 4 c 2 ]
C 44 * = μ m V f [ 2 S 3 μ m + 1 ( μ m μ f ) + 4 S 7 μ m ( 2 2 ν m ) ] 1
C 66 * = μ m V f [ S 3 μ m + 1 ( μ m μ f ) ] 1
where
D = a S 3 2 2 μ m 2 c a S 6 S 3 μ m 2 g c + a ( S 6 2 S 7 2 ) 2 μ m 2 g 2 c + S 3 ( b 2 a 2 ) 2 μ m c 2 + S 6 ( a 2 b 2 ) + S 7 ( a b + b 2 ) 2 μ m g c 2 + ( a 3 2 b 3 3 a b 2 ) 8 c 3
a = μ f μ m 2   μ f   ν m + 2 μ m   ν f
b = μ m   ν m + μ f   ν f + 2 μ m   ν m   ν f 2   μ f   ν m   ν f
c = ( μ m μ f   ) ( μ f μ m + μ f   ν f μ m   ν m + 2 μ m   ν f 2 μ f   ν m + 2 μ m   ν m   ν f 2   μ f   ν m   ν f   )
g = ( 2 2 ν m )
The subscripts m and f refer to matrix and fiber, respectively. The Lamé constants of both materials are obtained in terms of the elastic modulus E , the Poisson’s ratio ν , and the shear modulus G :
λ m = E m ν m ( 1 + ν m ) ( 1 2 ν m ) ,   μ m = G m = E m 2 ( 1 + ν m )
λ f = E f ν f ( 1 + ν f ) ( 1 2 ν f ) ,   μ f = G f = E f 2 ( 1 + ν f )
For a composite reinforced by long cylindrical fibers, periodically arranged in a square array, the constants S3, S6, S7 are given as follows:
S 3 = 0.49247 0.47603 V f 0.02748 V f 2
S 6 = 0.36844 0.14944 V f 0.27152 V f 2
S 7 = 0.12346 0.32035 V f + 0.23517 V f 2

Appendix B

In the Mori–Tanaka theory (MTT) prediction [58] the transversely isotropic effective properties of lamina are given by the following formulas:
E 11 e f f = V f E f , 11 + ( 1 V f ) E m + 2 V f ( 1 V f ) Z 1 e f f ( ν f , 12 ν m ) 2
E 22 e f f = E 33 e f f = E 11 e f f 1 ν m 2 1 1 ν m 2 + 2 V f E 11 e f f Z 2 e f f ( 1 + ν f , 23 E f , 22 E m ( 1 + ν m ) ) + V f Z 1 e f f E f , 11 E m ( 1 + ν m E m 2 E f , 11 + 1 ν f , 23 E f , 22 )
ν 12 e f f = ν 13 e f f = ν m + 2 V f Z 1 e f f E m ( ν f , 12 ν m ) ( 1 ν m 2 )
ν 23 e f f = 1 E 11 e f f E 22 e f f ( + 2 V f 1 V f E f , 11 E m ( 1 ν m 2 ) × ( 1 2 Z 1 e f f ( V f E f , 11 ( 1 ν m 2 ) + ( 1 V f ) E m ( 1 ν f .12 2 ) ) E f , 11 E m ) E f , 11 E m ( 1 + ν m ) )
G 12 e f f = G 13 e f f E m 2 ( 1 V f ) ( 1 + ν m ) × ( 1 + V f 4 V f ( 1 + V f + 2 ( 1 V f ) G f , 12 E m ( 1 + ν m ) ) 1 )
G 23 e f f = E m 2 ( 1 + ν m ) + V f ( 1 V f 8 ( 1 ν m 2 ) + 1 E m G f , 23 2 ( 1 + ν m ) ) 1
where
Z 1 e f f = ( 2 ( 1 V f ) ν f .12 2 E f , 11 + ( 1 V f ) ( 1 ν f , 23 ) E f , 22 + ( 1 + ν m ) ( 1 + V f ( 1 2 ν m ) ) E m ) 1
Z 2 e f f = E f , 22 ( 3 + V f 4 ν m ) ( 1 + ν m ) + ( 1 V f ) E m ( 1 + ν f , 23 )

Appendix C

In this section, the results of the mesh-sensitivity tests are provided. The convergence procedure [54] was conducted on a rectangular model with dimensions 150/16/1.2 mm, with material parameters corresponding to 40% fiber-volume fraction model and with axial load. Both local stress values and global strain energy values were examined in the verification process. The model was discretized into elements of the type of continuum shell (SC8R) with different sizes and was subject to deformation of 1 mm in tension. The results of the analysis are displayed graphically on Figure A1 and Figure A2. The chosen mesh size for the analysis is 0.4 mm, since the next reduction in cell size results in a rather small change (0.016%). Further refinement of the mesh will have little effect on the final solution, but can significantly increase the processing time.
Figure A1. Mesh convergence for local stress values.
Fibers 10 00043 g0a1
Figure A2. Mesh convergence for global strain energy value.
Fibers 10 00043 g0a2

References

  1. Pickering, K.L.; Aruan Efendy, M.G.; Le, T.M. A review of recent developments in natural fibre composites and their mechanical performance. Compos. A Appl. Sci. Manuf. 2016, 83, 98–112. [Google Scholar] [CrossRef] [Green Version]
  2. Wambua, P.; Ivens, J.; Verpoest, I. Natural fibres: Can they replace glass in fibre reinforced plastics? Compos. Sci. Technol. 2003, 63, 1259–1264. [Google Scholar] [CrossRef]
  3. Holbery, J.; Houston, D. Natural-fiber-reinforced polymer composites in automotive applications. JOM 2006, 58, 80–86. [Google Scholar] [CrossRef]
  4. Ashby, M.F. Materials and the Environment, 2nd ed.; Butterworth-Heinemann: Oxford, UK, 2012; pp. 336–338. [Google Scholar] [CrossRef]
  5. Silva, F.D.A.; Mobasher, B.; Filho, R.T. Cracking mechanisms in durable sisal fiber reinforced cement composites. Cem. Concr. Compos. 2009, 31, 721–730. [Google Scholar] [CrossRef]
  6. Silva, F.A.; Zhu, D.; Mobasher, B.; Toledo Filho, R.D. Impact behavior of sisal fiber cement composites under flexural load. ACI Mater. J. 2011, 108, 168. [Google Scholar]
  7. Ahmad, H.; Fan, M. Interfacial properties and structural performance of resin-coated natural fibre rebars within cementitious matrices. Cem. Concr. Compos. 2018, 87, 44–52. [Google Scholar] [CrossRef]
  8. Chand, N.; Hashmi, S.A.R. Mechanical properties of sisal fibre at elevated temperatures. J. Mater. Sci. 1993, 28, 6724–6728. [Google Scholar] [CrossRef]
  9. Inacio, W.; Lopes, F.; Monteiro, S. Diameter dependence of tensile strength by Weibull analysis: Part III. Rev. Mater. 2010, 15, 124–130. [Google Scholar] [CrossRef] [Green Version]
  10. Mukherjee, P.S.; Satyanarayana, K.G. Structure and properties of some vegetable fibres. J. Mater. Sci. 1984, 19, 3925–3934. [Google Scholar] [CrossRef]
  11. Oksman, K.; Wallström, L.; Berglund, L.A.; Filho, R.D.T. Morphology and mechanical properties of unidirectional sisal-epoxy composites. J. Appl. Polym. Sci. 2002, 84, 2358–2365. [Google Scholar] [CrossRef]
  12. Silva, F.D.A.; Chawla, N.; Filho, R.D.T. Tensile behavior of high performance natural (sisal) fibers. Compos. Sci. Technol. 2008, 68, 3438–3443. [Google Scholar] [CrossRef]
  13. Fidelis, M.E.A.; Pereira, T.V.C.; Gomes, O.F.M.; Silva, F.A.; Filho, R.D.T. The effect of fiber morphology on the tensile strength of natural fibers. J. Mater. Res. Technol. 2013, 2, 149–157. [Google Scholar] [CrossRef] [Green Version]
  14. Li, Y.; Ma, H.; Shen, Y.; Li, Q.; Zheng, Z. Effects of resin inside fiber lumen on the mechanical properties of sisal fiber reinforced composites. Compos. Sci. Technol. 2015, 108, 32–40. [Google Scholar] [CrossRef]
  15. Zuccarello, B.; Militello, C.; Bongiorno, F. Influence of the anisotropy of sisal fibers on the mechanical properties of high performance unidirectional biocomposite lamina and micromechanical models. Compos. Part A Appl. Sci. Manuf. 2021, 143, 106320. [Google Scholar] [CrossRef]
  16. Ntenga, R.; Béakou, A.; Atéba, J.A.; Ohandja, L.A. Estimation of the elastic anisotropy of sisal fibres by an inverse method. J. Mater. Sci. 2008, 43, 6206–6213. [Google Scholar] [CrossRef]
  17. Thomason, J.; Yang, L.; Gentles, F. Characterisation of the Anisotropic Thermoelastic Properties of Natural Fibres for Composite Reinforcement. Fibers 2017, 5, 36. [Google Scholar] [CrossRef] [Green Version]
  18. Gonzalez-Murillo, C.; Ansell, M. Co-cured in-line joints for natural fibre composites. Compos. Sci. Technol. 2010, 70, 442–449. [Google Scholar] [CrossRef]
  19. Bisanda, E.; Ansell, M. The effect of silane treatment on the mechanical and physical properties of sisal-epoxy composites. Compos. Sci. Technol. 1991, 41, 165–178. [Google Scholar] [CrossRef]
  20. Chand, N.; Verma, S.; Khazanchi, A.C. SEM and strength characteristics of acetylated sisal fibre. J. Mater. Sci. Lett. 1989, 8, 1307–1309. [Google Scholar] [CrossRef]
  21. Bisanda, E.T.N. The Effect of Alkali Treatment on the Adhesion Characteristics of Sisal Fibres. Appl. Compos. Mater. 2000, 7, 331–339. [Google Scholar] [CrossRef]
  22. Mwaikambo, L.Y.; Ansell, M.P. Mechanical properties of alkali treated plant fibres and their potential as reinforcement materials II. Sisal fibres. J. Mater. Sci. 2006, 41, 2497–2508. [Google Scholar] [CrossRef]
  23. Pimenta, M.T.B.; Carvalho, A.J.F.; Vilaseca, F.; Gironès, J.; López, J.P.; Mutjé, P.; Curvelo, A.A.S.; Pujol, P.M. Soda-Treated Sisal/Polypropylene Composites. J. Polym. Environ. 2008, 16, 35–39. [Google Scholar] [CrossRef]
  24. Khan, N.; Bisoyi, D.K.; Shuckla, J.; Sahoo, R. Structural aspects of alkali treated sisal fiber—A SAXS investigation. Fibers Polym. 2011, 12, 765–770. [Google Scholar] [CrossRef]
  25. Kalia, S.; Vashistha, S. Surface Modification of Sisal Fibers (Agave sisalana) Using Bacterial Cellulase and Methyl Methacrylate. J. Polym. Environ. 2011, 20, 142–151. [Google Scholar] [CrossRef]
  26. De Castro, B.D.; Silva, K.M.M.N.; Maziero, R.; De Faria, P.E.; Silva-Caldeira, P.P.; Rubio, J.C.C. Influence of Gamma Radiation Treatment on the Mechanical Properties of Sisal Fibers to Use into Composite Materials. Fibers Polym. 2020, 21, 1816–1823. [Google Scholar] [CrossRef]
  27. Verma, A.; Gaur, A.; Singh, V.K. Mechanical Properties and Microstructure of Starch and Sisal Fiber Biocomposite Modified with Epoxy Resin. Mater. Perform. Charact. 2017, 6, 500–520. [Google Scholar] [CrossRef]
  28. Verma, A.; Singh, C.; Singh, V.; Jain, N. Fabrication and characterization of chitosan-coated sisal fiber—Phytagel modified soy protein-based green composite. J. Compos. Mater. 2019, 53, 2481–2504. [Google Scholar] [CrossRef]
  29. Verma, A.; Singh, V.K. Mechanical, Microstructural and Thermal Characterization of Epoxy-Based Human Hair–Reinforced Composites. J. Test. Eval. 2018, 47, 1193–1215. [Google Scholar] [CrossRef]
  30. Reuss, A. Berechnung der Fließgrenze von Mischkristallen auf Grund der Plastizitätsbedingung für Einkristalle. ZAMM 1929, 9, 49–58. [Google Scholar] [CrossRef]
  31. Voigt, W. Ueber die Beziehung zwischen den beiden Elasticitätsconstanten isotroper Körper. Ann. Phys. 1889, 274, 573–587. [Google Scholar] [CrossRef] [Green Version]
  32. Halpin, J.C.; Kardos, J.L. The Halpin-Tsai Equations: A Review. Polym. Eng. Sci. 1976, 16, 344–352. [Google Scholar] [CrossRef]
  33. Chamis, C.C. Simplified Composite Micromechanics for Predicting Microstresses. J. Reinf. Plast. Compos. 1987, 6, 268–289. [Google Scholar] [CrossRef]
  34. Hashin, Z.; Rosen, B.W. The Elastic Moduli of Fiber-Reinforced Materials. J. Appl. Mech. 1964, 31, 223–232. [Google Scholar] [CrossRef]
  35. Rangaraj, S.S.; Bhaduri, S.B. A modified rule-of-mixtures for prediction of tensile strengths of unidirectional fibre-reinforced composite materials. J. Mater. Sci. 1994, 29, 2795–2800. [Google Scholar] [CrossRef]
  36. Sun, C.; Vaidya, R. Prediction of composite properties from a representative volume element. Compos. Sci. Technol. 1996, 56, 171–179. [Google Scholar] [CrossRef]
  37. Potluri, R.; Diwakar, V.; Venkatesh, K.; Reddy, B.S. Analytical Model Application for Prediction of Mechanical Properties of Natural Fiber Reinforced Composites. Mater. Today Proc. 2018, 5, 5809–5818. [Google Scholar] [CrossRef]
  38. Rao, S.; Jayaraman, K.; Bhattacharyya, D. Micro and macro analysis of sisal fibre composites hollow core sandwich panels. Compos. B. Eng. 2012, 43, 2738–2745. [Google Scholar] [CrossRef]
  39. Pantano, A.; Zuccarello, B. Numerical model for the characterization of biocomposites reinforced by sisal fibres. Procedia Struct. Integr. 2018, 8, 517–525. [Google Scholar] [CrossRef]
  40. Glouia, Y.; Chaabouni, Y.; El Oudiani, A.; Maatoug, I.; Msahli, S. Finite element analysis of mechanical response of cellulosic fiber-reinforced composites. Int. J. Adv. Manuf. 2019, 103, 4671–4680. [Google Scholar] [CrossRef]
  41. Balasubramanian, K.; Rajeswari, N.; Vaidheeswaran, K. Analysis of mechanical properties of natural fibre composites by experimental with FEA. Mater. Today Proc. 2020, 28, 1149–1153. [Google Scholar] [CrossRef]
  42. Bernard, S.S.; Suresh, G.; Srinivasan, T.; Srinivasan, S.; Kaarmugilan, N.; Naveed, L.M.; Kiranmouli, N.; Mahalakshmi, C. Analyzing the mechanical behaviour of sisal fiber reinforced IPN matrix. Mater. Today Proc. 2020, 45, 569–572. [Google Scholar] [CrossRef]
  43. Li, Q.; Li, Y.; Zhang, Z.; Zhou, L. Multi-layer interfacial fatigue and interlaminar fracture behaviors for sisal fiber reinforced composites with nano- and macro-scale analysis. Compos. Part A Appl. Sci. Manuf. 2020, 135, 105911. [Google Scholar] [CrossRef]
  44. Li, Q.; Li, Y.; Zhang, Z.; Zhang, Z.; Zhou, L. Quantitative investigations on multi-layer interface debonding behaviors for sisal fiber reinforced composites using acoustic emission and finite element method. Compos. Part B Eng. 2020, 196, 108128. [Google Scholar] [CrossRef]
  45. Potluri, R. Natural Fiber-Based Hybrid Bio-composites: Processing, Characterization, and Applications. In Green Composites: Processing, Characterisation and Applications; Muthu, S.S., Ed.; Springer Nature Singapore Pte Ltd.: Singapore, 2019; pp. 1–45. [Google Scholar] [CrossRef]
  46. Resin Research. Technical Data Sheet Kwik Kick Epoxy 2:1 System. Available online: https://resinresearch.net/wp-content/uploads/2022/02/Kwik-Kick-TDS_V2.1.pdf (accessed on 1 May 2022).
  47. ASTM D638-14; Standard Test Method for Tensile Properties of Plastics. ASTM International: West Conshohocken, PA, USA, 2017. [CrossRef]
  48. ASTM D3039/D3039M; Standard Test Method for Tensile Properties of Polymer Matrix Composite Materials. ASTM International: West Conshohocken, PA, USA, 2014. [CrossRef]
  49. Autograph AGS-X Series, Shimadzu. Available online: https://www.shimadzu.com/an/products/materials-testing/uni-ttm/autograph-ags-x-series/index.html (accessed on 23 September 2021).
  50. Epsilon Technology Product Line, Epsilon Technology Corp. WY USA. Available online: https://www.epsilontech.com/extensometers-overview/ (accessed on 23 September 2021).
  51. ABAQUS/CAE 2021, © Dassault Systems Simulia Corp.: Johnston, RI, USA, 2020.
  52. Abaqus Documentation, Simulia. Available online: https://abaqus-docs.mit.edu/2017/English/SIMACAEEXCRefMap/simaexc-c-docproc.htm (accessed on 1 May 2022).
  53. Barbero, E.J. Finite Element Analysis of Composite Materials Using Abaqus; CRC Press: Boca Raton, FL, USA, 2013; pp. 215–246. [Google Scholar]
  54. Szabó, B.; Babuška, I. Introduction to Finite Element Analysis: Formulation, Verification and Validation; John Wiley & Sons: Hoboken, NJ, USA, 2011; pp. 1–14. [Google Scholar]
  55. Luciano, R.; Barbero, E. Formulas for the stiffness of composites with periodic microstructure. Int. J. Solids Struct. 1994, 31, 2933–2944. [Google Scholar] [CrossRef]
  56. Barbero, E.; Luciano, R. Micromechanical formulas for the relaxation tensor of linear viscoelastic composites with transversely isotropic fibers. Int. J. Solids Struct. 1995, 32, 1859–1872. [Google Scholar] [CrossRef]
  57. Mori, T.; Tanaka, K. Average stress in matrix and average elastic energy of materials with misfitting inclusions. Acta Met. 1973, 21, 571–574. [Google Scholar] [CrossRef]
  58. Abaimov, S.G.; Khudyakova, A.A.; Lomov, S.V. On the closed form expression of the Mori–Tanaka theory prediction for the engineering constants of a unidirectional fiber-reinforced ply. Compos. Struct. 2016, 142, 1–6. [Google Scholar] [CrossRef]
  59. Betelie, A.A.; Megera, Y.T.; Redda, D.T.; Sinclair, A. Experimental investigation of fracture toughness for treated sisal epoxy composite. AIMS Mater. Sci. 2018, 5, 93–104. [Google Scholar] [CrossRef]
Figure 1. Sisal raw fiber (a), single layer of aligned fibers before resin impregnation (b).
Fibers 10 00043 g001
Figure 2. Schematic description of tensile tests for different specimens (dimensions in mm).
Fibers 10 00043 g002
Figure 3. Boundary conditions for unit cell: unit strain in the fiber direction (a), unit strain in the transverse directions (b,c), unit shear strain along the fiber direction (d,e).
Fibers 10 00043 g003
Figure 4. FEA model: geometry (a), 0° fiber orientation (b), boundary conditions (c,d), meshing (e).
Fibers 10 00043 g004
Figure 5. Superposition of all fiber tensile test results (left) with set amount (green), double amount (orange) and triple amount (blue) of fibers and the experiment itself (right).
Fibers 10 00043 g005
Figure 6. Epoxy tensile tests: stress–strain curves (left) and the experiment setup (right).
Fibers 10 00043 g006
Figure 7. Tensile failure SFRC with axial load for V f = 20% (a), V f = 40% (b), V f = 60% (c) and with off-axis load (d).
Fibers 10 00043 g007
Figure 8. Effective tensile strength of SFRC in axial load, depending on volume fraction.
Fibers 10 00043 g008
Figure 9. Effective tensile strength of SFRC with load direction of 45°, depending on volume fraction.
Fibers 10 00043 g009
Figure 10. The stresses in RVE models with isotropic fiber approach for different volume fractions (in MPa).
Fibers 10 00043 g010
Figure 11. The stresses in RVE models with anisotropic fiber approach for different volume fractions (in MPa).
Fibers 10 00043 g011
Figure 12. Experimental (gray) and numerical (blue and red) results of SFRC tensile tests: with axial load (left column) and off-axis load (right column).
Fibers 10 00043 g012
Table 1. Parameters of sisal fiber (index f) and epoxy matrix (index m) for effective properties calculation.
ρ f [ g c m 3 ]   E f 1   [ GPa ] E f 2 [ GPa ] ν f 12 ν f 23 G f 12 [ GPa ] ρ m [ g c m 3 ] E m [ GPa ] ν m
1.2251.60.60.21.11.12.30.4
Table 2. Calculated effective properties of SFRC using the numerical RVE models and analytical PMM and MTT models with fibers as isotropic (ISO) and as anisotropic (ANISO).
V f Approach E 11 [ GPa ] E 22 [ GPa ] ν 12 ν 23 G 12 [ GPa ] G 23 [ GPa ]
20%ISO (PMM)6.8613.4520.3550.5251.1621.132
ANISO (MTT)6.8532.3230.4290.4750.8710.788
ISO (RVE)6.8583.4330.3550.5261.1591.125
ANISO (RVE)6.8512.3220.4280.4750.8700.787
40%ISO (PMM)11.4115.0240.3130.5061.6791.668
ANISO (MTT)11.4002.1520.4620.4240.9230.755
ISO (RVE)11.4074.8880.3130.5171.6731.616
ANISO (RVE)11.3992.1510.4620.4240.9220.755
60%ISO (PMM)15.9507.5750.2730.4542.5662.605
ANISO (MTT)15.9421.9620.5010.3540.9780.724
ISO (RVE)15.9447.5620.2730.4522.5542.602
ANISO (RVE)15.9381.9610.5000.3540.9770.724
Publisher’s Note: MDPI stays neutral with regard to jurisdictional claims in published maps and institutional affiliations.

