Article

Effect of Deposition Pressure on the Microstructure and Optical Band Gap of Molybdenum Disulfide Films Prepared by Magnetron Sputtering

1
College of Science, Guilin University of Technology, Guilin 541004, China
2
School of Physics and Electronics, Central South University, Changsha 410083, China
*
Author to whom correspondence should be addressed.
Coatings 2019, 9(9), 570; https://doi.org/10.3390/coatings9090570
Submission received: 23 July 2019 / Revised: 26 August 2019 / Accepted: 4 September 2019 / Published: 6 September 2019

Abstract

:
MoS2 films were prepared via magnetron sputtering under different deposition pressures, and the effects of deposition pressure on the crystal structure, surface morphology, and optical properties of the resulting films were investigated. The results show that the crystallinity of the films first increases and then decreases with increasing pressure. The surface of the films prepared by magnetron sputtering is dense and uniform with few defects. The deposition pressure affects the grain size, surface morphology, and optical band gap of the films. The films deposited at a deposition pressure of 1 Pa revealed remarkable crystallinity, a 30.35 nm grain size, and a 1.67 eV optical band gap. Given the large electronegativity difference between MoS2 molecules and weak van der Waals forces between layers, the MoS2 films are prone to defects at different deposition pressures, causing the exciton energy near defects to decrease and the modulation of the surrounding band.

1. Introduction

Advances in technology have increased the demand for various materials, and optoelectronic materials with adjustable band gaps and high stability have become research hotspots [1,2,3]. MoS2 materials, with alterable band gaps and excellent physicochemical stability, have attracted considerable research interest [4,5,6,7,8,9,10]. MoS2 is a transition metal disulfide with large global reserves and high stability that has long been used as a solid lubricant in various fields [11,12,13]. Rapid developments in optoelectronic devices have focused on the optical performance of MoS2 [14,15,16,17,18,19].
MoS2 exhibits a hexagonal-layered structure in which Mo and S are covalently bonded and layers of S–Mo–S are connected by weak van der Waals forces; this structure enables control of the optical band gap of MoS2 [20,21,22,23]. First-principles calculations have been used to determine the crystal band structure of MoS2, and band gaps of 1.2–1.8 eV have been identified [24,25,26,27]. MoS2 films may be prepared using magnetron sputtering and chemical vapor deposition, among other methods, and optical band gaps in the range of 1.2 to 1.9 eV have been produced [20,28,29,30]. The photoluminescence (PL) band gap characteristics of MoS2 films have also been studied [31,32,33,34]. However, although the optical properties of MoS2 have been extensively reported, the mechanism through which crystal structure changes, caused by the pressure parameters of magnetron sputtering, remains unknown. Thus, further exploration of the preparation technology and performance of MoS2 films is necessary.
In this study, MoS2 films were prepared under different sputtering pressures, and the structural and optical properties of the resulting films were tested. The chemical composition and microstructure of the films were analyzed, and the relationship between the structure and morphology of the films and their optical band gap was assessed. Variations in optical band gap with pressure were evaluated.

2. Experimental Details

2.1. Preparation of MoS2 Films

MoS2 films were deposited onto silicon (100) and quartz substrates by magnetron sputtering using argon (purity 99.999%) as the sputtering gas. The magnetron was operated with a radio-frequency power (Prf) supply. The substrates were ultrasonically cleaned in acetone and ethanol solution for 15 min, rinsed with deionized water, dried using a heater, and then placed in a substrate holder for film deposition. The sputtering chamber was evacuated to 9.9 × 10⁻⁴ Pa, and the MoS2 films were deposited at pressures of 0.8, 1.0, 1.2, or 1.4 Pa using a high-purity MoS2 target (diameter, 5 cm.; purity, 99.99%). Prior to sputtering, impurities on the surface of the target were etched off using plasma Ar+ ions. During sputtering, the films were deposited at room temperature, the radio-frequency power was 300 W, the total gas flow was fixed to 30 sccm, and all samples were deposited for 5 min.

2.2. Characterization of MoS2 Films

The structure of the deposited films was examined by X-ray diffraction (XRD; X’Pert PRO, PANalytical B.V, Almelo, Netherlands) with CuKα radiation at 0.154 nm. X-ray photoelectron spectroscopy (XPS; Escalab, Waltham, MA, USA) was used to characterize the chemical composition and bonding of the films. The thickness of the films was characterized by scanning electron microscopy (SEM; SU5000, Hitachi, Tokyo, Japan). The surface morphology and roughness of the films were determined by atomic force microscopy (AFM; Nitegra Prima SPM, NT-MDT Spectrum Instruments, Moscow, Russia). The PL spectrum of the films was obtained using a fluorescence spectrophotometer (F-4600, Hitachi). The transmittance of the films was measured using a UV spectrophotometer (UV-visible (UV-Vis); TU-1800, Shimadzu, Kyoto, Japan) at room temperature in a dry environment.

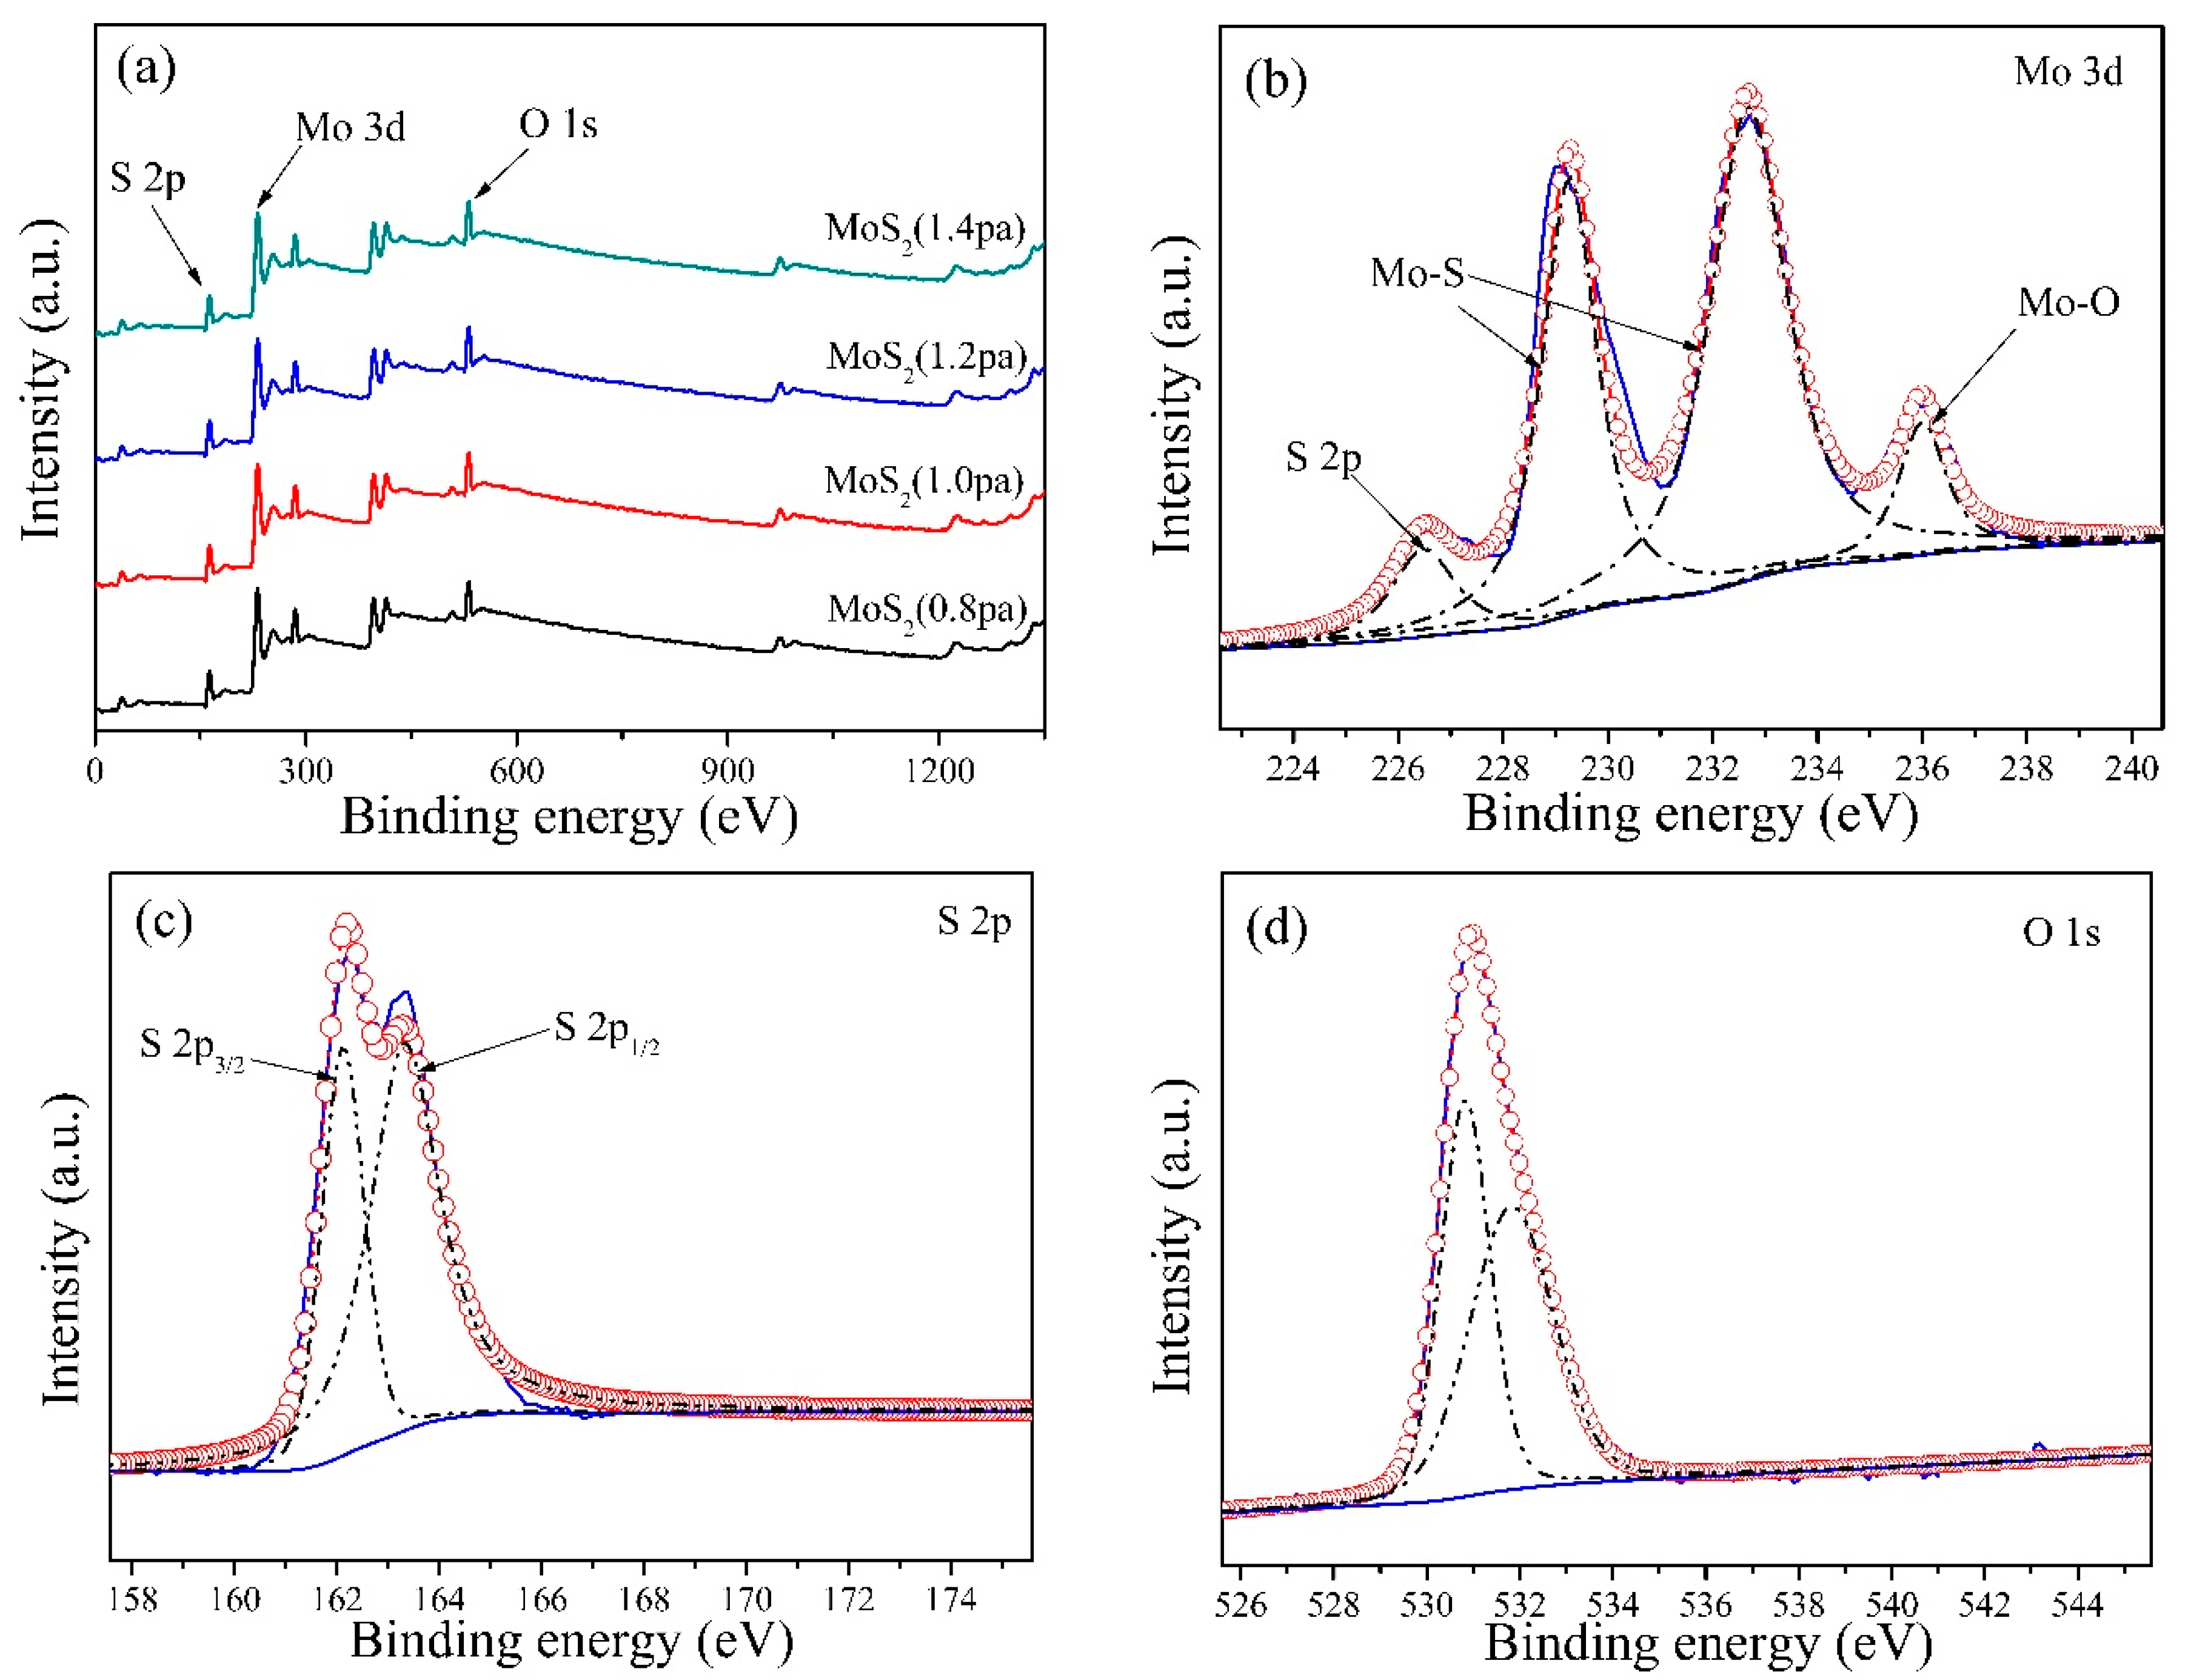
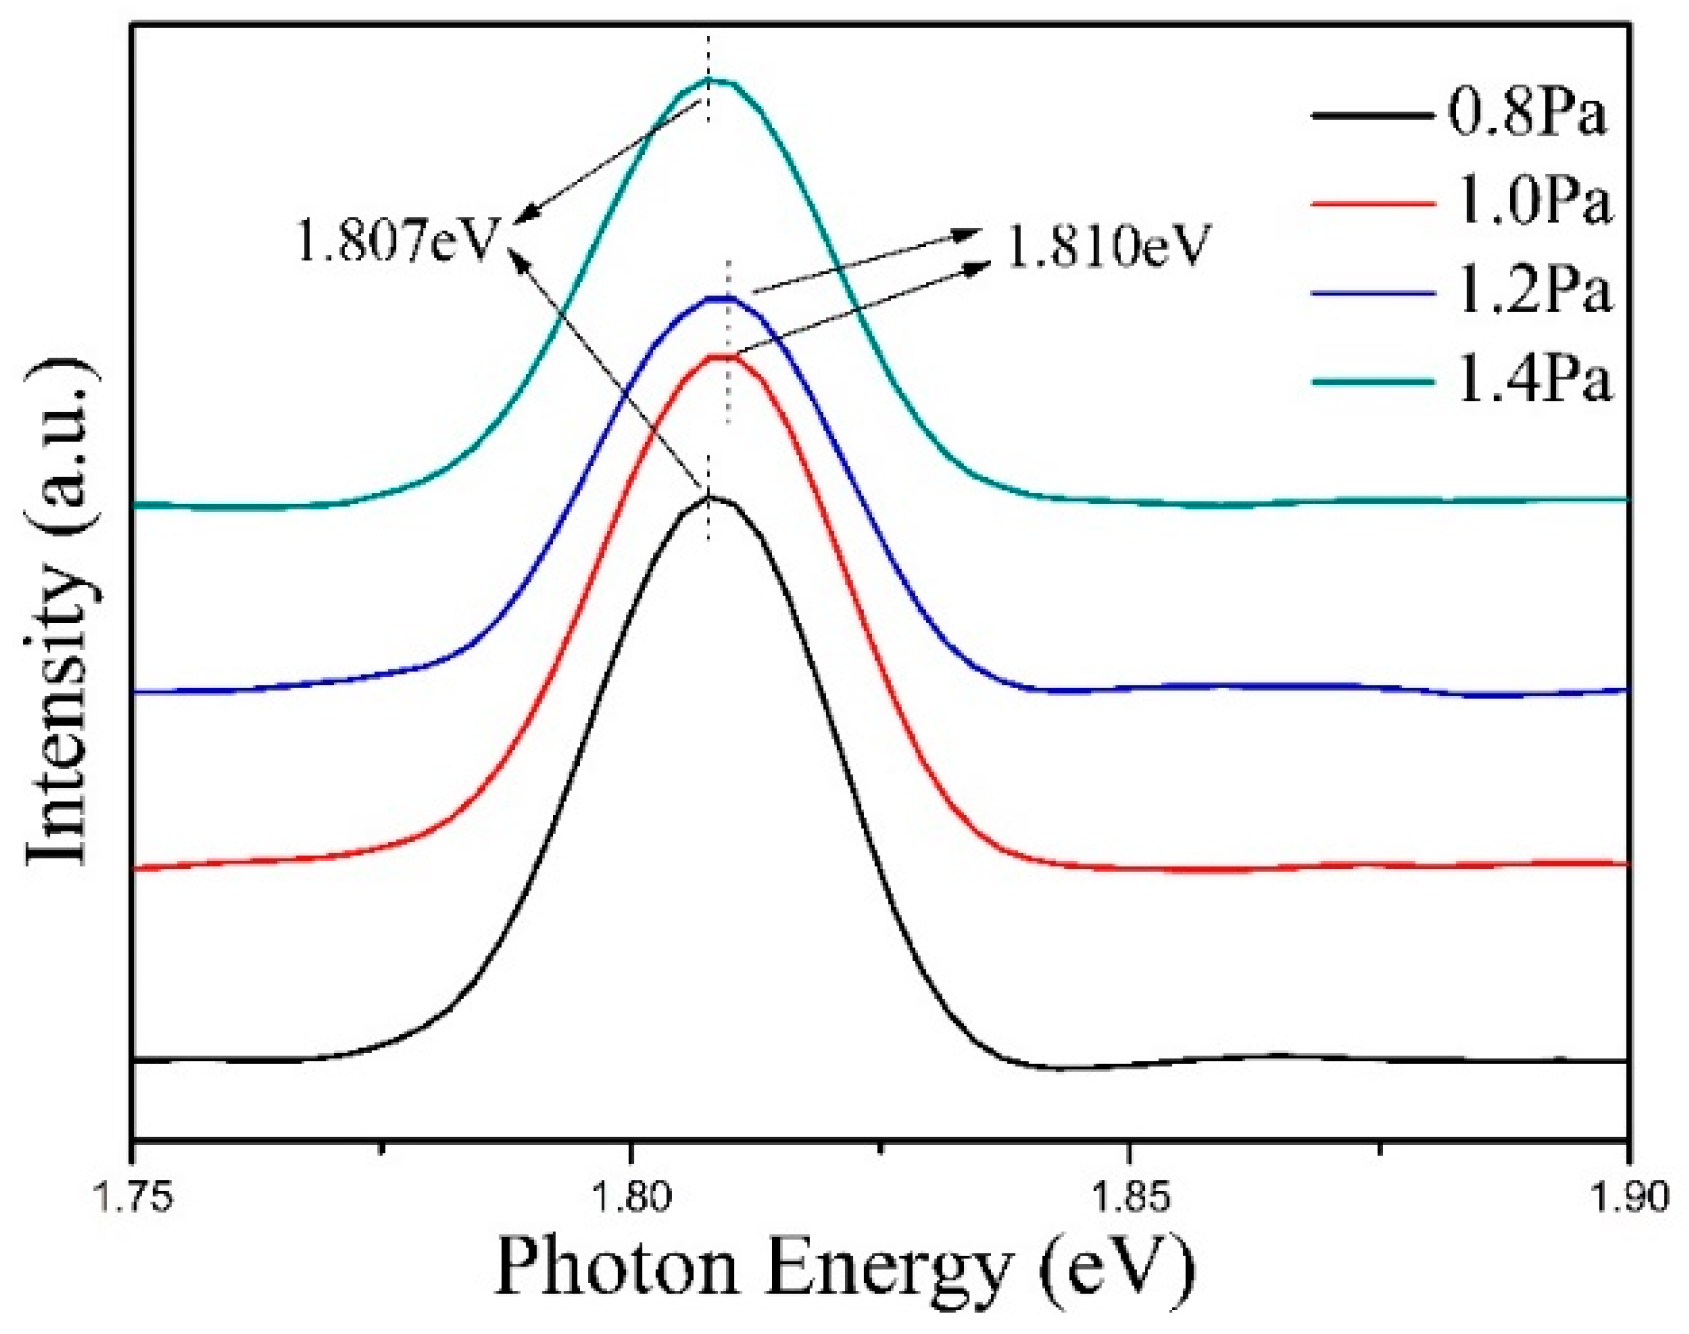
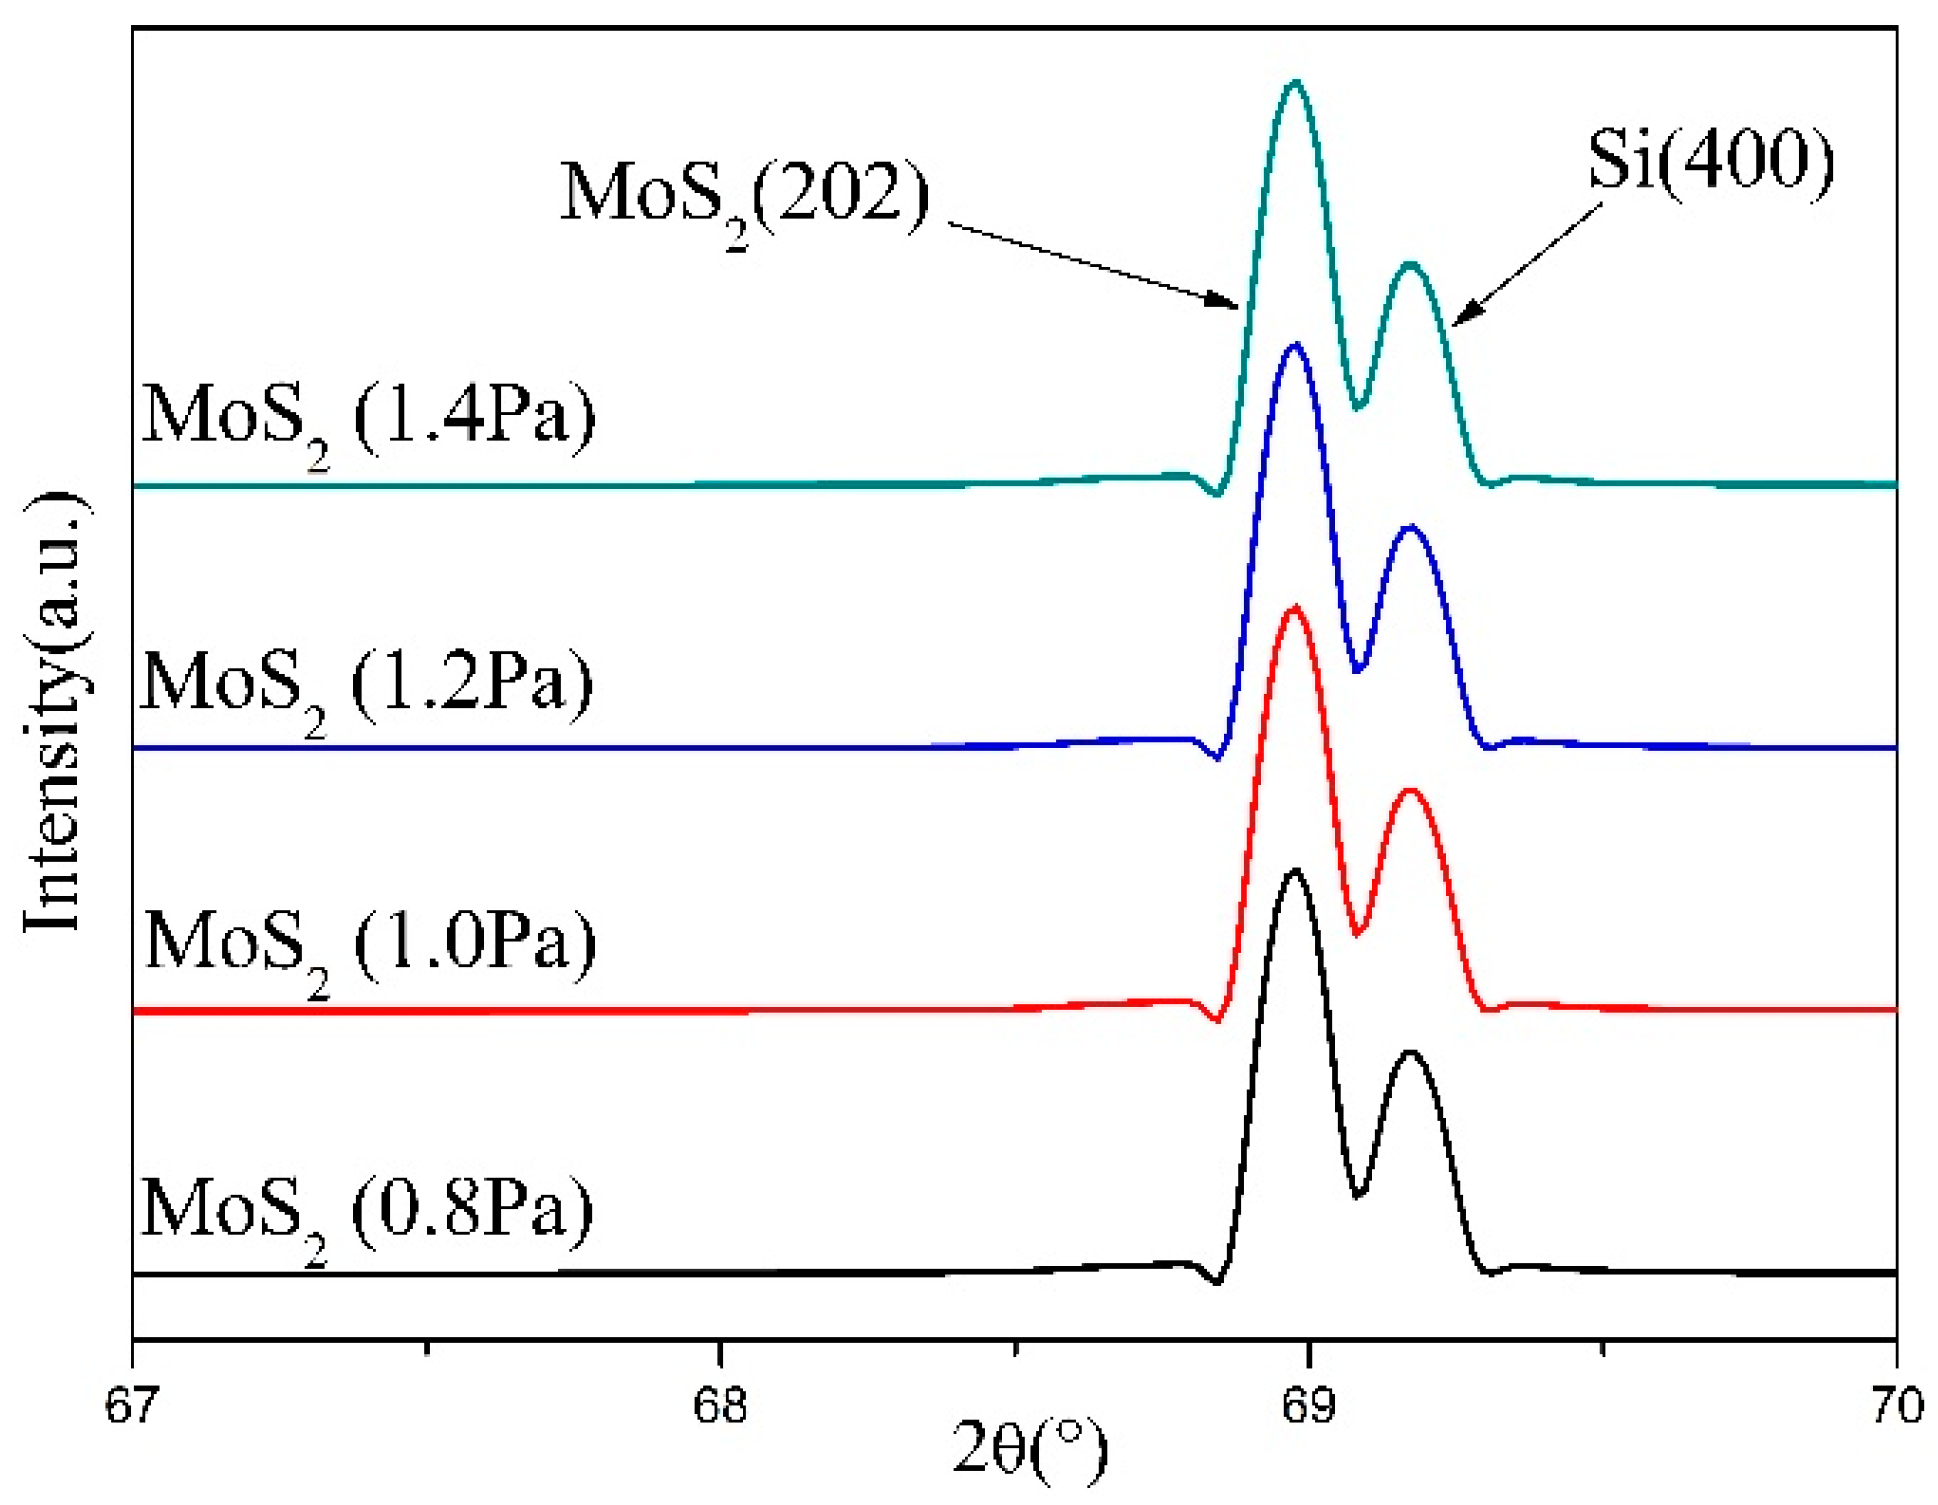
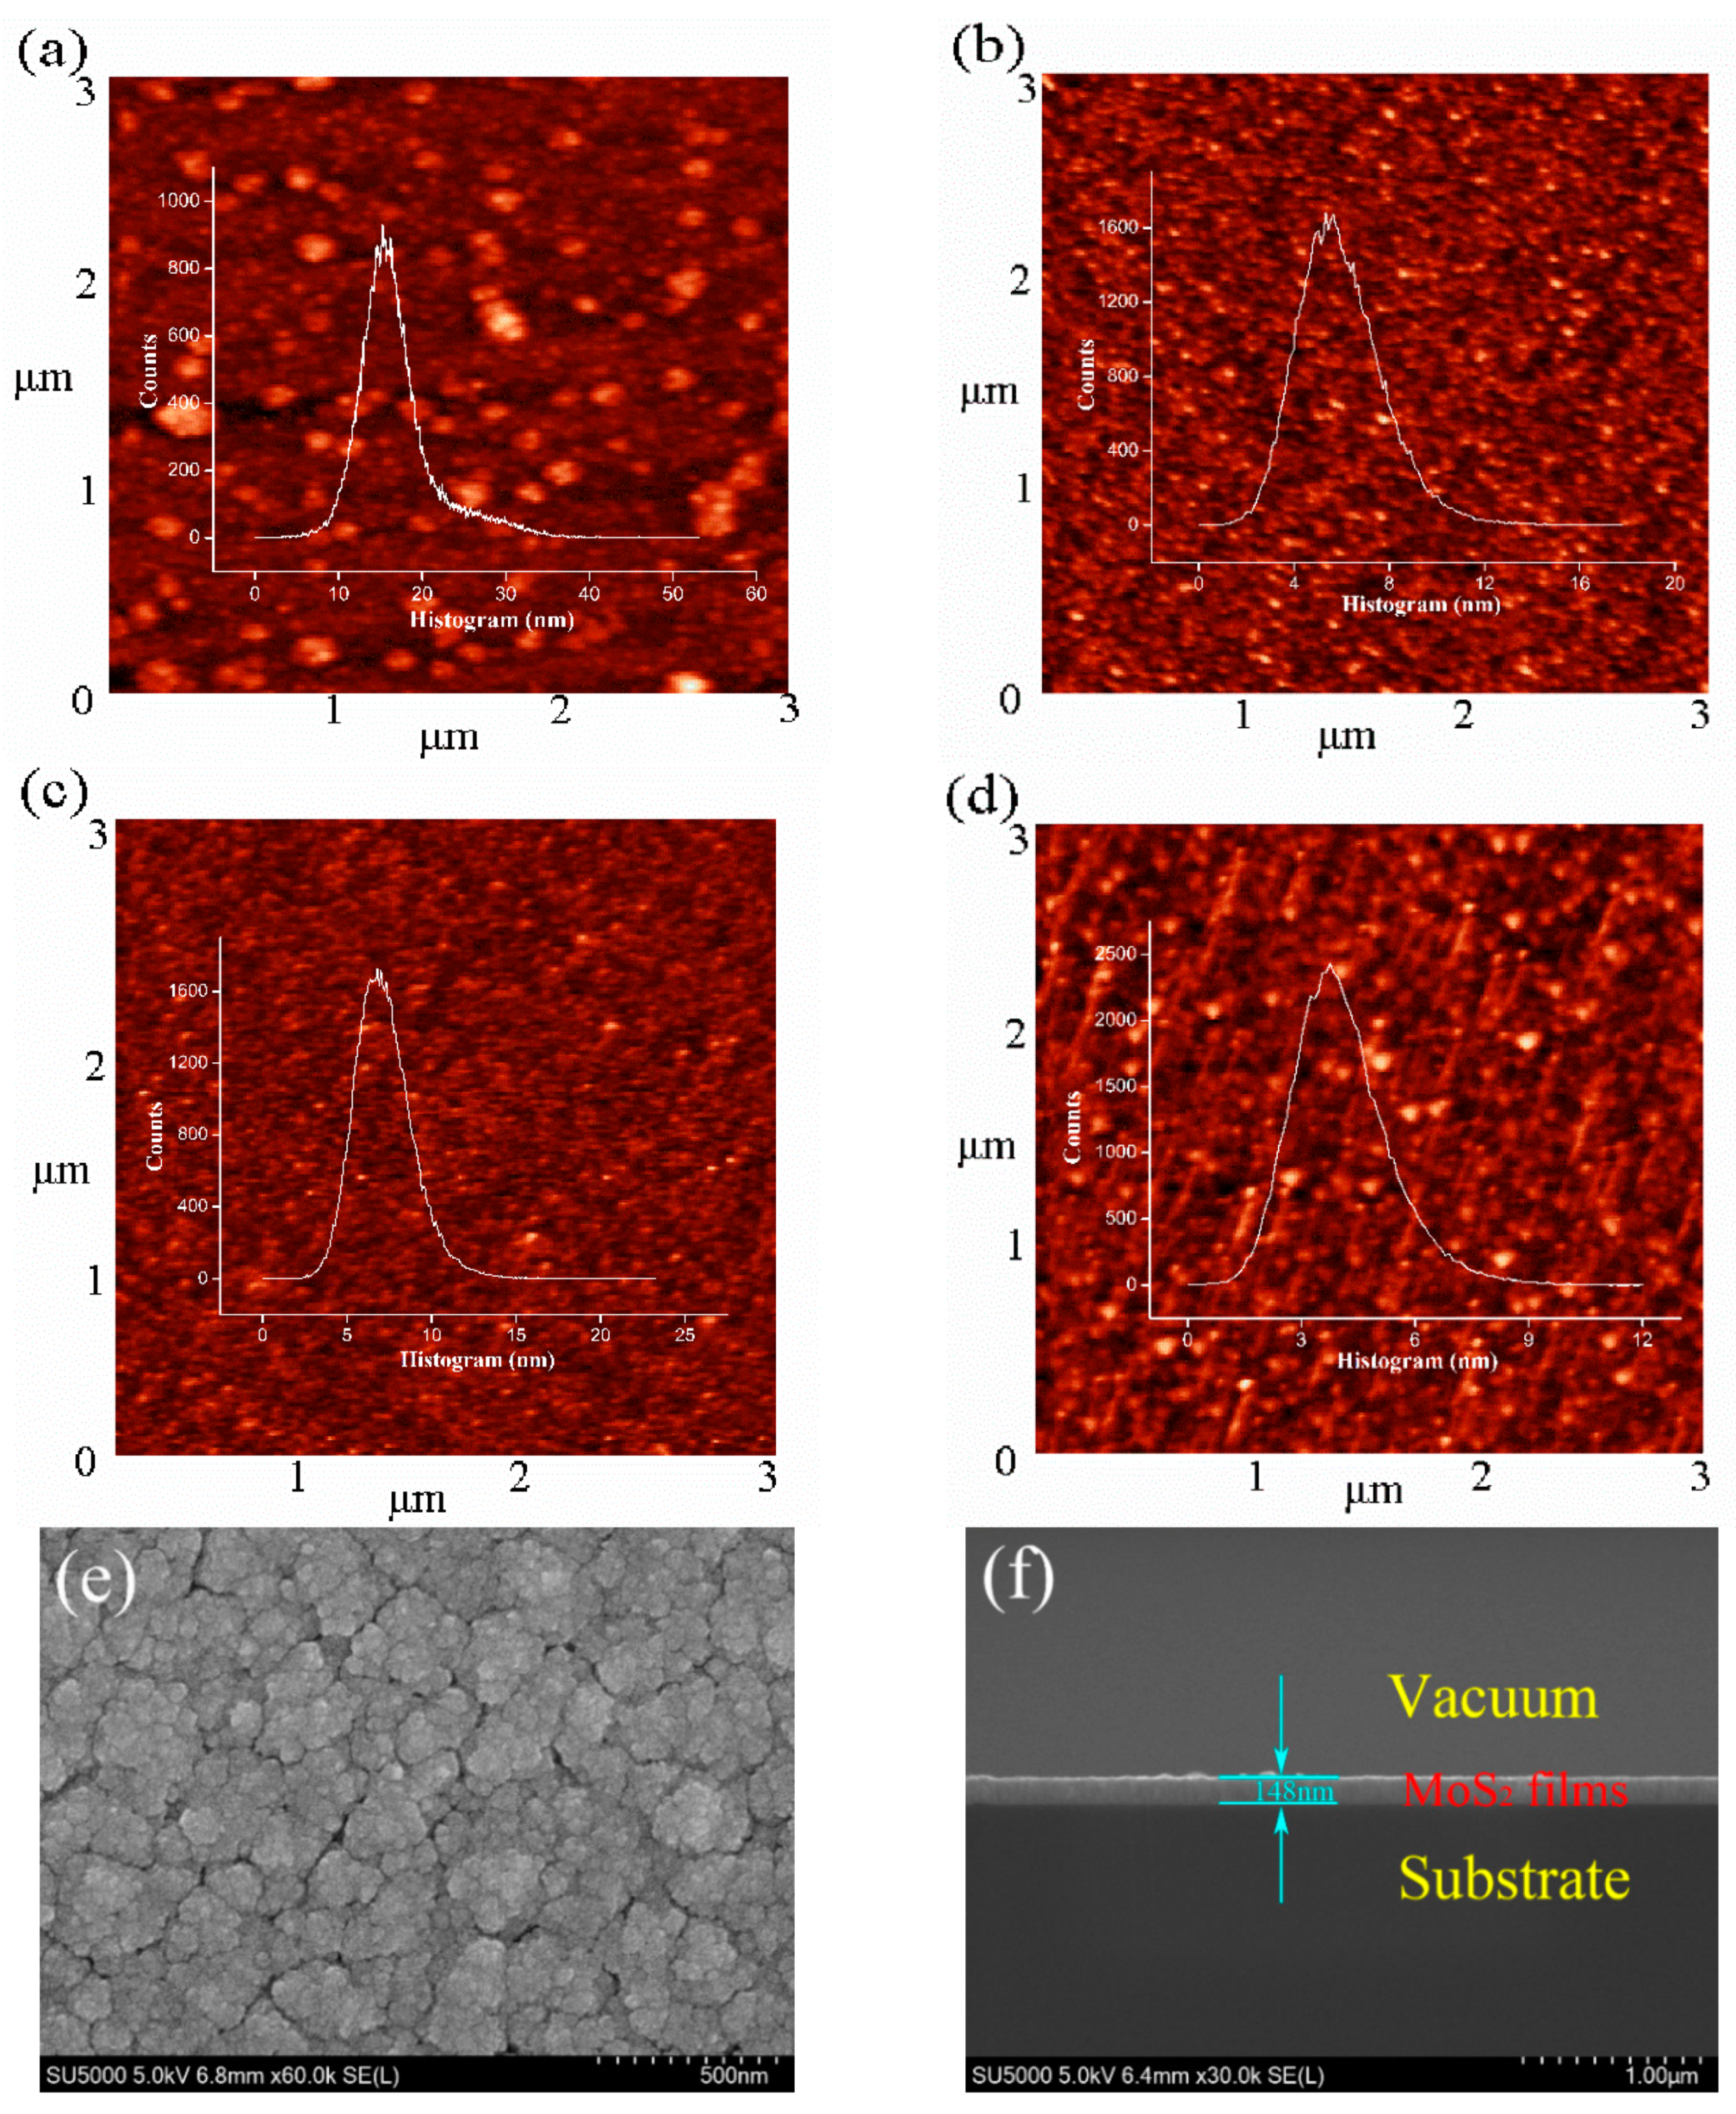
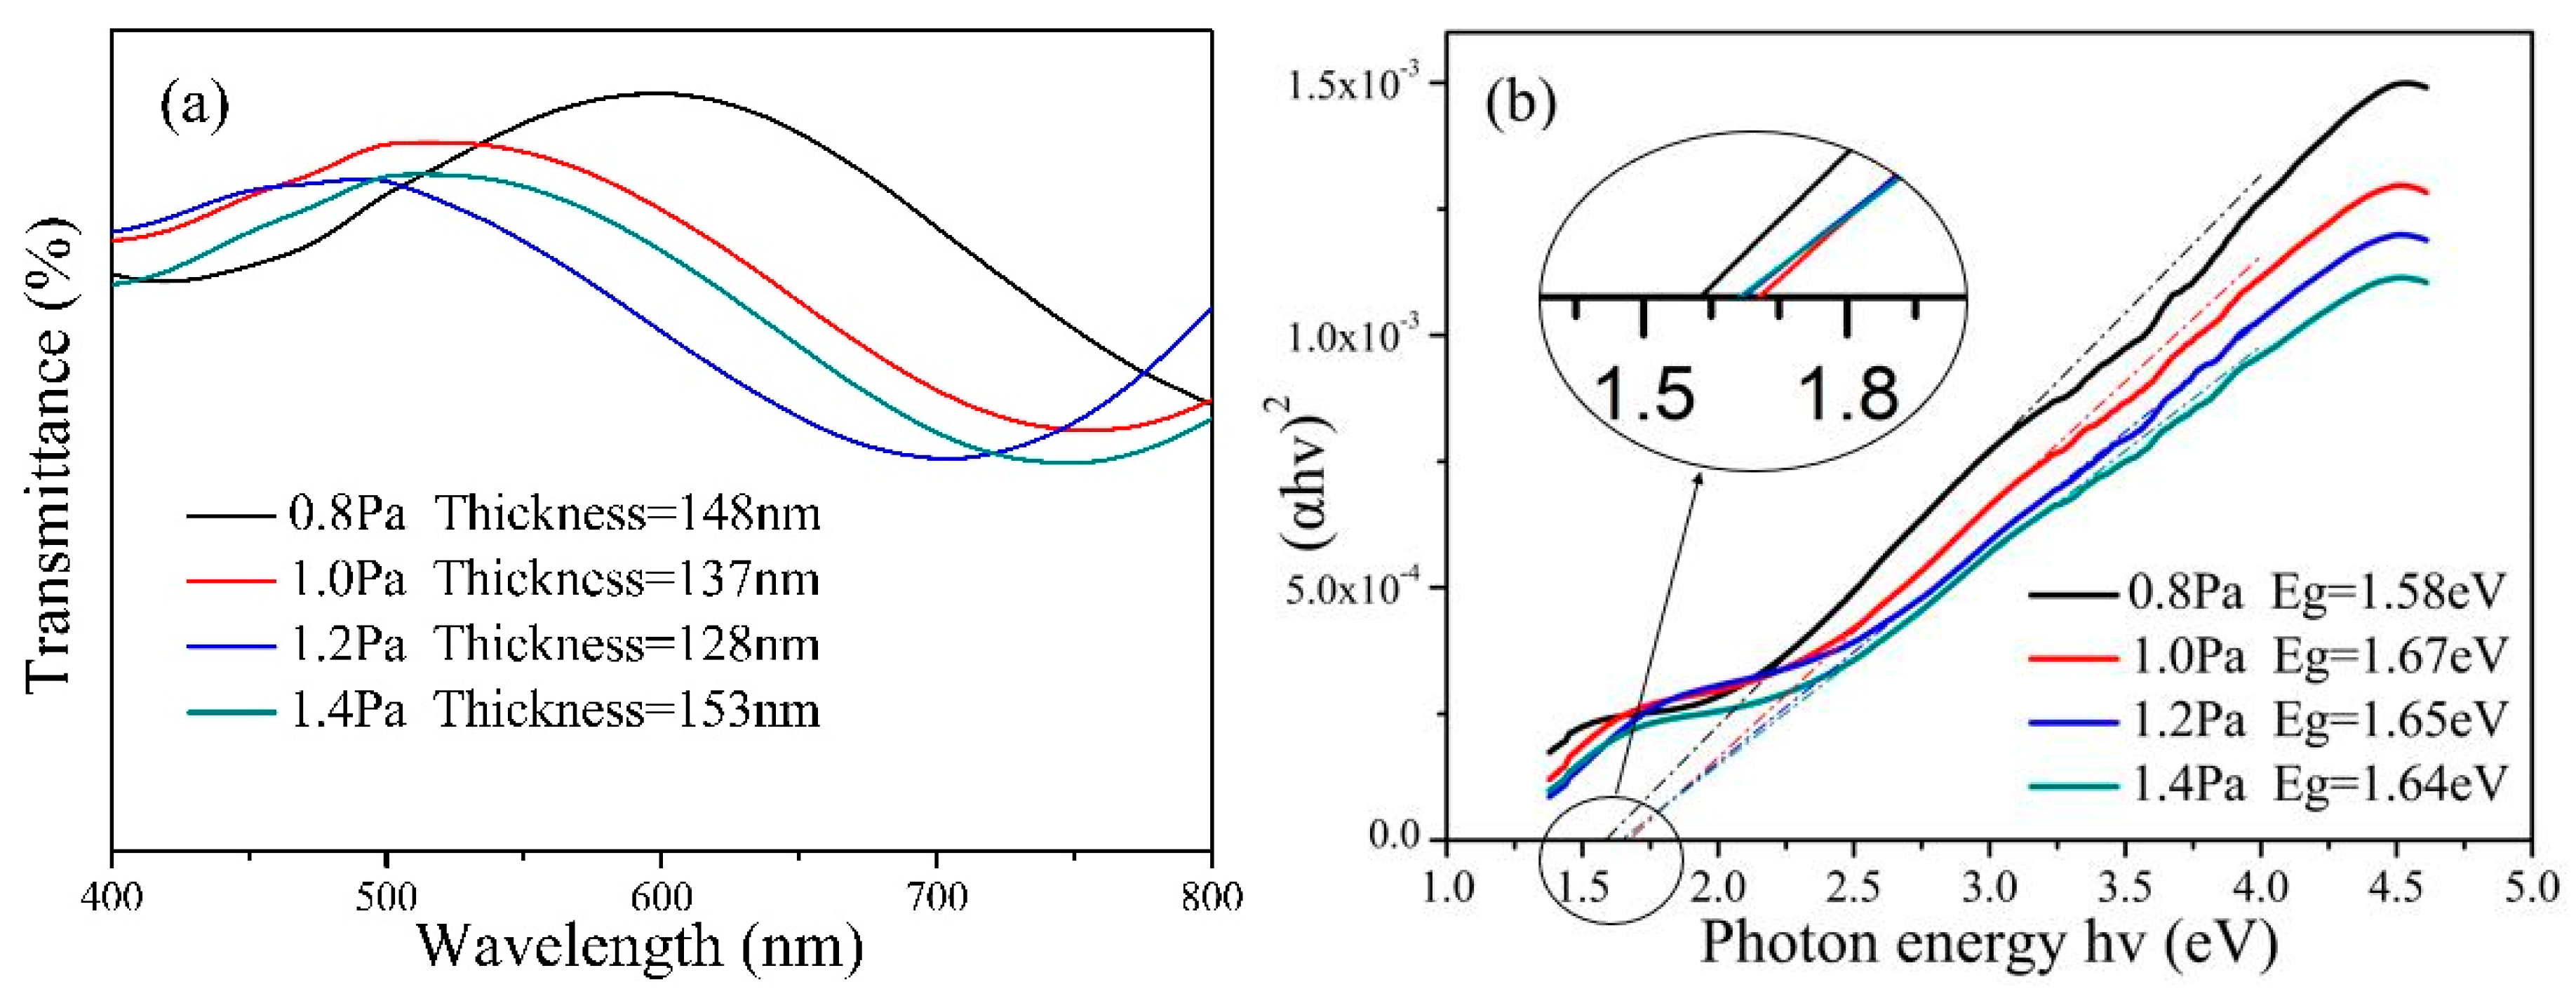
3. Results and Discussion

The XRD spectra of MoS2 films prepared on the silicon substrate are shown in Figure 1; here, two peaks at 69.4° and 69.6° were found. The peak at 69.6° reflects the peak position of the (400) crystal plane of the silicon substrate (Joint Committee on Powder Diffraction Standards (JCPDS) card number: 01-0791), whereas that at 69.4° corresponds to the (202) crystal plane of MoS2 (JCPDS card number: 89-2905). Figure 1 shows that the crystallinity of MoS2 films first increases and then decreases with increasing pressure. At a deposition pressure of 1 Pa, the maximum peak intensity and smallest half width were observed, indicating that the film crystal is the best. This finding may be related to the MoS2 molecules only being deposited on the surface of the substrate at low pressure, and the bond between film and substrate is loose. At higher pressures, the mean free path of ions bombarding the substrate is reduced, which etches the film surface and results in poor film crystallization. Thus, MoS2 films with good crystallization and dense bonding without etching are formed at 1 Pa. The crystallinity of a film directly reflects the presence of defects, which is the fundamental reason behind the change in optical band gap with pressure.
To investigate the grain growth and crystal structure of the MoS2 films, we analyzed the peak half width of the (202) plane of MoS2 on the basis of Bragg’s equation (Equation (1)), the cubic system distance in Equation (2), and Scherrer’s equation (Equation (3)), which can be used to calculate the interplanar spacing (d), lattice constant (a), and average grain size (D) [35], respectively:
d = n λ 2 sin θ
d = a / h 2 + k 2 + l 2
D = k λ / β cos θ
where n = 1; λ is the X-ray wavelength; θ is the diffraction angle; h, k, and l are crystal plane indices; k is the Scherrer constant (0.89); and β is the full width at half maxima [35,36,37,38]. Table 1 shows the interplanar spacing, lattice constant, and average grain size of the MoS2 film samples prepared at different deposition pressures. The grain sizes of the MoS2 crystals considerably differ and gradually increase with increasing pressure. When the pressure is low (e.g., 0.8 Pa), the nucleation rate and number of crystal grains are large; thus, the crystal grains that are formed are relatively small. As pressure increases, the growth rate of the crystal also increases, and the crystal grains grow. The size of the grains directly affects the surface topography and thickness of the films, ultimately modulating the optical band gap of the samples.
Figure 2a–d shows the two-dimensional AFM images of the MoS2 films. Combining findings with the average roughness of the films provided in Table 2, remarkable differences in the surface morphology of the films at different deposition pressures were observed [39]. The surface roughness of the MoS2 films changes with increasing deposition pressure, but the overall trend decreases; thus, increasing pressure smoothens the film surface. When the pressure is low (e.g., 0.8 Pa), the number of crystal nuclei per unit volume is large, and the bonding between crystal grains is not dense, resulting in high surface roughness. As the pressure increases, voids are reduced to increase the compactness and uniformity of the films, to smooth the surfaces, and lower the roughness [40]. The surface morphology of the MoS2 films directly affects the diffuse scattering, absorption, and transmission of incident light, which are key to their different optical band gaps.
SEM images of MoS2 films (Figure 2e,f) show that the films prepared by magnetron sputtering have a smooth surface, uniform particle size, and obscure pores. Table 2 reveals that the thickness of the MoS2 films first decreases and then increases with increasing deposition pressure. When the deposition pressure is low (e.g., 0.8 Pa), the between-grain stacking distance is large and thick films are formed. As the pressure increases (to not more than 1.2 Pa), the films become denser and their thickness decreases. When the pressure continues to increase to 1.4 Pa, the grain size acts on the film thickness, so that the thickness of the films is the largest. The thickness of the films affects the transmission and absorption of incident light, thereby changing their transmittance.
Figure 3a shows the XPS survey spectra of the MoS2 films prepared by different deposition pressures. All four samples displayed peaks at the same positions, and all samples were composed of three elements: Mo, S and O. The O element is attributed to the residual atmosphere in the vacuum chamber during sputtering and oxidation of the sample during subsequent testing [41]. Figure 3b shows four peaks appearing at 225, 228, 232, and 235 eV in the Mo 3d spectrum; these peaks correspond to S 2s, MoS2, and MoO3, respectively [42]. The high-intensity peaks of Mo 3d3/2 at 228 eV and Mo 3d5/2 at 232 eV are consistent with previous research [43,44,45,46]. Figure 3c shows the high-intensity peaks of the S 2s spectrum at 164 and 163 eV, which correspond to the orbital peaks of S 2p1/2 and S 2p3/2, respectively, and are consistent with the reported peak positions of MoS2 crystals [46,47,48]. Figure 3d shows the seam fitting of O in the MoS2 films. Mo 3d has a relatively high oxidation state (Mo6+) at 235 eV, which indicates that Mo4+ is oxidized to Mo6+ during deposition; the presence of the secondary phase MoO3 in the MoS2 films may also be observed. However, compared with the MoO3 impurity, MoS2 is present at a higher content in the deposited film [43]. MoO3, as an impurity, has a certain influence on the optical band gap of the MoS2 films, but trace impurities do not play a decisive role in the performance of these films. Oxidation is also inevitable during the production and testing of the films. Thus, the optical band gap of the MoS2 films may be solely attributed to their properties.
The PL of MoS2 films prepared at different deposition pressures was evaluated using a fluorescence spectrophotometer, and the intrinsic PL band gap of MoS2 films was obtained on the basis of the position of the luminescence peak. As shown in Figure 4, the PL band gap of the MoS2 film samples prepared at different deposition pressures is in the range of 1.807 to 1.81 eV [47]. As the deposition pressure increases, the PL band gap of MoS2 films first increases and then decreases, and the main peak of PL spectrum shifts toward blue. This finding indicates that the film thickness first decreases and then increases [49], consistent with the change in film thickness observed by SEM. At a deposition pressure of 1 Pa, the film exhibits good crystallization, consistent with the XRD characterization results.
The transmitted spectra of MoS2 films prepared on quartz are shown in Figure 5a. The spectra change with the deposition pressure, and the film thickness is displayed. The transmittance from ultraviolet to green light is relatively low. As the MoS2 films are relatively thick, their transmittance is relatively low. Significantly increased transmittance occurs as the deposition pressure increases, which may be attributed to the increased deposition pressures smoothing the surface of the films and reducing their thickness. These changes decrease the diffuse reflection of incident light and affect the transmittance of the films. At a deposition pressure of 1.2 Pa, the films exhibit low surface roughness and thickness. Scattering and absorption of incident light by the films are also low. Therefore, the transmittance of the MoS2 films is relatively low. The change in transmittance indirectly reflects the difference in optical band gap of the films.
The optical band gap (Eg) of the films was calculated from the UV transmission spectrum by using the Tauc model. Eg is calculated as follows:
( h v ) 2 = B ( h v E g )
= ln [ 100 / T ] / d
In Equation (4), B is constant values, hν is the optical energy and the absorption coefficient is calculated by the Equation (5), where T is the transmittance and d is the films thickness [37,40]. Figure 5b shows the relationship between the ( h v ) 2 and h v of the MoS2 films. Eg is obtained by extrapolation. Notable differences in optical band gaps were observed in films prepared at different deposition pressures. As the deposition pressure increases, the optical band gap of the MoS2 films first increases and then decreases. At 1.0 Pa, the film produces a relatively large Eg = 1.67 eV; this result is 0.14 eV lower than the PL band gap because PL is generated by the high-energy defects in the films. Changes in the optical band gap of the MoS2 films may be attributed to several factors. For example, changes in deposition pressure cause changes in the crystallinity and surface morphology of the films and, in turn, directly change their optical band gap. At low deposition pressure (e.g., 0.8 Pa), the films are characterized by low energy, poor crystallization, and numerous defects, resulting in a small optical band gap. As the sputtering pressure increases, the crystallinity of the films gradually increases and the defects decrease. The crystallinity of the MoS2 films is relatively good at 1.0 Pa; thus, the optical band gap of these films is relatively high. As pressure continues to increase, the optical band gap of the films decreases because the mean free path of ions bombarding the substrate reduces under high pressure, which exerts an etching effect on the surface of the films, an increase in their surface defects, and a reduction in their optical band gap. Taking the results together, magnetron sputtering must be conducted at high deposition pressure to prepare MoS2 films with a small optical band gap and high crystallinity.

4. Conclusions

In this study, MoS2 films deposited at different pressures were prepared on silicon and quartz wafer substrates by magnetron sputtering. Microstructural studies showed that the diffraction peak intensity of the MoS2 (202) crystal plane first increases and then decreases with increasing deposition pressure. At 1 Pa, the MoS2 films are densely bonded and good crystallization was observed. As the deposition pressure increases, the grain size of the MoS2 films increases and peaks at 31.5 nm at 1.4 Pa. The increased deposition pressure reduces the surface roughness of the films. The deposition pressure considerably influences the thickness of the MoS2 films. As the deposition pressure increases, the film thickness decreases and then increases. At 1.2 Pa, the film thickness is 128 nm. The large difference in electronegativity between the MoS2 molecules and weak van der Waals forces between the layers promote film defects under different deposition pressures, which is the root cause of changes in band gap. The electronegativity difference is affected by several factors, including film size, thickness, and surface roughness, and the optical band gap of the MoS2 films first increases and then decreases with increasing deposition pressure. The optical band gaps of the MoS2 films are in the range of 1.58 to 1.67 eV, and the optical band gap at 1 Pa is relatively large at approximately 1.67 eV. In general, a deposition pressure of 1.0 Pa is the optimum pressure for magnetron sputtering to prepare MoS2 films with large optical band gaps.

Author Contributions

Writing—original draft preparation, C.G.; supervision, J.X.; investigation, L.Z.; writing—review and editing, Z.W. and S.M.

Funding

The authors are grateful to the Innovation Project of Guangxi Graduate Education, China (Grants No. YCSW2019160).

Conflicts of Interest

The authors declare no conflicts of interests with regard to the publication of this paper.

References

  1. Shi, E.; Gao, Y.; Finkenauer, B.P.; Coffey, A.H.; Dou, L.T. Two-dimensional halide perovskite nanomaterials and heterostructures. Chem. Soc. Rev. 2018, 47, 6046–6072. [Google Scholar] [CrossRef] [PubMed]
  2. Wang, G.; Chernikov, A.; Glazov, M.M.; Heinz, T.F.; Marie, X.; Amand, T.; Urbaszek, B. Colloquium: Excitons in atomically thin transition metal dichalcogenides. Rev. Mod. Phys. 2018, 90, 021001. [Google Scholar] [CrossRef]
  3. Zhang, X.; Lai, Z.; Ma, Q.; Zhang, H. Novel structured transition metal dichalcogenide nanosheets. Chem. Soc. Rev. 2018, 47, 3301–3338. [Google Scholar] [CrossRef] [PubMed]
  4. Hu, Z.; Wu, Z.; Han, C.; He, J.; Ni, Z.H.; Chen, W. Two-dimensional transition metal dichalcogenides: Interface and defect engineering. Chem. Soc. Rev. 2018, 47, 3100–3128. [Google Scholar] [CrossRef] [PubMed]
  5. Govindasamy, M.; Chen, S.M.; Mani, V.; Devasenathipathy, R.; Umamaheswari, R.; Santhanaraj, K.J.; Sathiyan, A. Molybdenum disulfide nanosheets coated multiwalled carbon nanotubes composite for highly sensitive determination of chloramphenicol in food samples milk, honey and powdered milk. J. Colloid Interface Sci. 2017, 485, 129–136. [Google Scholar] [CrossRef] [PubMed]
  6. Zhang, H.; Zhou, W.; Liu, Q.; Yang, Z.X.; Pan, J.L.; Ouyang, F.P.; Xu, H. Transport properties and device-design of Z-shaped MoS2 nanoribbon planar junctions. Phys. E 2017, 92, 143–147. [Google Scholar] [CrossRef]
  7. Chen, Q.; Wang, W.; Peeters, F.M. Magneto-polarons in monolayer transition-metal dichalcogenides. J. Appl. Phys. 2018, 123, 214303. [Google Scholar] [CrossRef]
  8. Joshi, N.; Hayasaka, T.; Liu, Y.M.; Liu, H.L.; Oliveira, O.N.; Lin, L.W. A review on chemiresistive room temperature gas sensors based on metal oxide nanostructures, graphene and 2D transition metal dichalcogenides. Microchim. Acta 2018, 185, 16. [Google Scholar] [CrossRef]
  9. Shi, L.; Zhao, T.S. Recent advances in inorganic 2D materials and their applications in lithium and sodium batteries. J. Mater. Chem. 2017, 5, 3735–3758. [Google Scholar] [CrossRef]
  10. Qi, M.; Xiao, J.R.; Gong, C.Y. Thermal annealing effects on the electrophysical characteristics of sputtered MoS2 thin films by Hall effect measurements. Semicond. Sci. Technol. 2019, 34, 9. [Google Scholar] [CrossRef]
  11. Choi, J.; Mun, J.; Wang, M.C.; Ashraf, A.; Kang, S.W.; Nam, S. Hierarchical, dual-scale structures of atomically thin MoS2 for tunable wetting. Nano Lett. 2017, 17, 1756–1761. [Google Scholar] [CrossRef] [PubMed]
  12. Gunda, R.K.; Narala, S.K.R. Evaluation of friction and wear characteristics of electrostatic solid lubricant at different sliding conditions. Surf. Coat. Technol. 2017, 332, 341–350. [Google Scholar] [CrossRef]
  13. Chen, B.; Meng, Y.; Sha, J.; Zhong, C.; Hua, W.B.; Zhao, N.Q. Preparation of MoS2/TiO2 based nanocomposites for photocatalysis and rechargeable batteries: Progress, challenges, and perspective. Nanoscale 2017, 10, 34–68. [Google Scholar] [CrossRef]
  14. Song, X.; Liu, X.; Yu, D.; Huo, C.X.; Ji, J.P.; Li, X.M.; Zhang, S.L.; Zou, Y.S.; Zhu, G.Y.; Wang, Y.J.; et al. Boosting two-dimensional MoS2/CsPbBr3 photodetectors via enhanced light absorbance and interfacial carrier separation. ACS Appl. Mater. Interfaces. 2018, 10, 2801–2809. [Google Scholar] [CrossRef] [PubMed]
  15. Wu, K.; Chen, B.; Zhang, X.; Zhang, S.F.; Guo, C.S.; Li, C.; Xiao, P.S.; Wang, J.; Zhou, L.J.; Zou, W.W.; et al. High-performance mode-locked and Q-switched fiber lasers based on novel 2D materials of topological insulators, transition metal dichalcogenides and black phosphorus: Review and perspective. Opt. Commun. 2018, 406, 214–229. [Google Scholar] [CrossRef]
  16. Chen, Q.; Li, L.L.; Peeters, F.M. Magnetic field dependence of electronic properties of MoS2 quantum dots with different edges. Phys. Rev. 2018, 97, 085437. [Google Scholar] [CrossRef]
  17. Guo, J.; Jiang, J.; Yang, B. Low-voltage electric-double-layer MoS2 transistor gated via water solution. Solid-State Electron. 2018, 150, 8–15. [Google Scholar] [CrossRef]
  18. Guo, J.; Xie, D.; Yang, B.; Jiang, J. Low-Power logic computing realized in a single electric-double-layer MoS2 transistor gated with polymer electrolyte. Solid-State Electron. 2018, 144, 1–6. [Google Scholar] [CrossRef]
  19. Chen, Q.; Li, L.L.; Peeters, F.M. Inner and outer ring states of MoS2 quantum rings: Energy spectrum, charge and spin currents. J. Appl. Phys. 2019, 125, 244303. [Google Scholar] [CrossRef]
  20. Zhang, Y.; Zeng, W.; Li, Y. The hydrothermal synthesis of 3D hierarchical porous MoS2 microspheres assembled by nanosheets with excellent gas sensing properties. J. Alloy. Compd. 2018, 749, 355–362. [Google Scholar] [CrossRef]
  21. Windom, B.C.; Sawyer, W.G.; Hahn, D.W. A Raman spectroscopic study of MoS2 and MoO3: Applications to tribological systems. Tribol. Lett. 2011, 42, 301–310. [Google Scholar] [CrossRef]
  22. Shi, J.; Wu, D.; Zheng, X.; Xie, D.D.; Song, F.; Zhang, X.A.; Jiang, J.; Yuan, X.M.; Gao, Y.L.; Huang, H. From MoO2@MoS2 core-shell nanorods to MoS2 nanobelts. Phys. Status Solidi B 2018, 255, 1800254. [Google Scholar] [CrossRef]
  23. Liu, Y.; Peng, X.S. Recent advances of supercapacitors based on two-dimensional materials. Appl. Mater. Today 2017, 8, 104–115. [Google Scholar] [CrossRef]
  24. Mak, K.F.; Lee, C.; Hone, J.; Shan, J.; Heinz, T.F. Atomically thin MoS2: A new direct-gap semiconductor. Phys. Rev. Lett. 2010, 105, 136805. [Google Scholar] [CrossRef] [PubMed]
  25. Radisavljevic, B.; Radenovic, A.; Brivio, J.; Giacometti, V.; Kis, A. Single-layer MoS2 transistors. Nat. Nanotechnol. 2011, 6, 147–150. [Google Scholar] [CrossRef] [PubMed]
  26. Oyedele, A.D.; Yang, S.; Liang, L.; Puretzky, A.A.; Wang, K.; Zheng, J.J.; Yu, P.; Pudasaini, P.R.; Ghosh, A.W.; Liu, Z. PdSe2: Pentagonal two-dimensional layers with high air stability for electronics. J. Am. Chem. Soc. 2017, 139, 14090–14097. [Google Scholar] [CrossRef] [PubMed]
  27. Zou, H.; Zeng, Q.; Peng, M.; Zhou, W.Z.; Dai, X.Y.; Ouyang, F.P. Electronic structures and optical properties of P and Cl atoms adsorbed/substitutionally doped monolayer MoS2. Solid State Commun. 2018, 280, 6–12. [Google Scholar] [CrossRef]
  28. Late, D.J.; Huang, Y.K.; Liu, B.; Acharya, J.; Shirodkar, S.N.; Luo, J.J.; Yan, A.M.; Charles, D.; Waghmare, U.V.; Dravid, V.P.; et al. Sensing behavior of atomically thin-layered MoS2 transistors. ACS Nano 2013, 7, 4879–4891. [Google Scholar] [CrossRef] [PubMed]
  29. Ji, Q.; Zhang, Y.; Zhang, Y.; Liu, Z.F. Chemical vapour deposition of group-VIB metal dichalcogenide monolayers: Engineered substrates from amorphous to single crystalline. Chem. Soc. Rev. 2015, 44, 2587–2602. [Google Scholar] [CrossRef] [PubMed]
  30. Lv, R.; Robinson, J.A.; Schaak, R.E.; Sun, D.; Sun, Y.F.; Mallouk, T.E.; Terrones, M. Transition metal dichalcogenides and beyond: Synthesis, properties, and applications of single- and few-layer nanosheets. Acc. Chem. Res. 2015, 48, 56–64. [Google Scholar] [CrossRef]
  31. Splendiani, A.; Sun, L.; Zhang, Y.; Li, T.S.; Kim, J.; Chim, C.Y.; Galli, G.; Wang, F. Emerging photoluminescence in monolayer MoS2. Nano Lett. 2010, 10, 1271–1275. [Google Scholar] [CrossRef] [PubMed]
  32. Eda, G.; Yamaguchi, H.; Voiry, D.; Fujita, T.; Chen, M.W.; Chhowalla, M. Photoluminescence from chemically exfoliated MoS2. Nano Lett. 2011, 11, 5111–5116. [Google Scholar] [CrossRef] [PubMed]
  33. Cadiz, F.; Courtade, E.; Robert, C.; Wang, G.; Shen, Y.; Cai, H.; Taniguchi, T.; Watanabe, K.; Carrere, H.; Lagarde, D.; et al. Excitonic linewidth approaching the homogeneous limit in MoS2-based van der waals heterostructures. Phys. Rev. X 2017, 7, 021026. [Google Scholar] [CrossRef]
  34. Nan, H.; Wang, Z.; Wang, W.; Liang, Z.; Lu, Y.; Chen, Q.; He, D.W.; Tan, P.H.; Miao, F.; Wang, X.R.; et al. Strong photoluminescence enhancement of MoS2 through defect engineering and oxygen bonding. ACS Nano 2014, 8, 5738–5745. [Google Scholar] [CrossRef] [PubMed]
  35. Wang, S.; Wang, Z.; Qin, J.; Wang, W.D.; Li, W.Y.; He, D.W. Nanocrystalline MoS2 through directional growth along the (002) crystal plane under high pressure. Mater. Chem. Phys. 2011, 130, 170–174. [Google Scholar] [CrossRef]
  36. Bel Haj Mohamed, N.; Haouari, M.; Zaaboub, Z.; Hassen, F.; Maaref, H.; Ben Ouada, H. Effect of surface on the optical structure and thermal properties of organically capped CdS nanoparticles. J. Phys. Chem. Solids 2014, 75, 936–944. [Google Scholar] [CrossRef]
  37. Xiao, J.; Qi, M.; Gong, C.; Wang, Z.Y.; Jiang, A.H.; Ma, J.F.; Cheng, Y. Crystal structure and optical properties of silver-doped copper nitride films (Cu3N: Ag) prepared by magnetron sputtering. J. Phys. D 2018, 51, 055305. [Google Scholar] [CrossRef]
  38. Hassan, A.; Irfan, M.; Jiang, Y. Quantum confinement effect and size-dependent photoluminescence in laser ablated ultra-thin GZO films. Mater. Lett. 2018, 210, 358–362. [Google Scholar] [CrossRef]
  39. Li, X.; Wang, T.; Jiang, F.; Liu, J.; Liu, P.; Liu, G.Q.; Xu, J.K.; Liu, C.C.; Jiang, Q.L. Optimizing thermoelectric performance of MoS2 films by spontaneous noble metal nanoparticles decoration. J. Alloy. Compd. 2019, 781, 744–750. [Google Scholar] [CrossRef]
  40. Pradhan, G.; Sharma, A.K. Temperature controlled 1T/2H phase ratio modulation in mono- and a few layered MoS2 films. Appl. Surf. Sci. 2019, 479, 1236–1245. [Google Scholar] [CrossRef]
  41. Matsuura, K.; Ohashi, T.; Muneta, I.; Ishihara, S.; Kakushima, K.; Tsutsui, K.; Ogura, A.; Wakabayashi, H. Low-carrier-density sputtered MoS2 film by vapor-phase sulfurization. J. Electron. Mater. 2018, 47, 3497–3501. [Google Scholar] [CrossRef]
  42. Zhuang, W.; Li, H.; Li, W.; Fan, X.Q.; He, J.F.; Cai, Z.B.; Fu, W.; Zhang, G.G.; Wan, S.H.; Zhu, M.H. Probing fretting performance of DLC and MoS2 films under fluid lubrication. Appl. Surf. Sci. 2019, 478, 661–679. [Google Scholar] [CrossRef]
  43. Amin, R.; Hossain, M.A.; Zakaria, Y. Interfacial kinetics and ionic diffusivity of the electrodeposited MoS2 film. Acs Appl. Mater. Interfaces 2018, 10, 13509–13518. [Google Scholar] [CrossRef] [PubMed]
  44. Sarma, S.; Ray, S.C. Trigonal (1T) and hexagonal (2H) mixed phases MoS2 thin films. Appl. Surf. Sci. 2019, 474, 227–231. [Google Scholar] [CrossRef]
  45. Kim, H.; Park, T.; Park, S.; Leem, M.; Ahn, W.; Lee, H.; Lee, C.; Lee, E.; Jeong, S.J.; Park, S.; et al. Ultrathin monolithic HfO2 formed by Hf-seeded atomic layer deposition on MoS2: Film characteristics and its transistor application. Thin Solid Film. 2019, 673, 112–118. [Google Scholar] [CrossRef]
  46. Jiang, Q.; Sun, L.; Bi, J.; Liang, S.J.; Li, L.Y.; Yu, Y.; Wu, L. MoS2 quantum dots-modified covalent triazine-based frameworks for enhanced photocatalytic hydrogen evolution. ChemSusChem. 2018, 11, 1108–1113. [Google Scholar] [CrossRef]
  47. Wang, W.; Chen, X.; Zeng, X.; Wu, S.X.; Zeng, Y.; Hu, Y.S.; Xu, S.; Zhou, G.T.; Cui, H.X. Investigation of the growth process of continuous monolayer MoS2 films prepared by chemical vapor deposition. J. Electron. Mater. 2018, 47, 5509–5517. [Google Scholar] [CrossRef]
  48. Kathiravan, D.; Huang, B.R.; Saravanan, A.; Prasannan, A.; Hong, P.D. Highly enhanced hydrogen sensing properties of sericin-induced exfoliated MoS2 nanosheets at room temperature. Sens. Actuators B 2019, 279, 138–147. [Google Scholar] [CrossRef]
  49. Chen, F.; Wang, T.; Wang, L.; Su, W.T. Two-step fabrication of large-scale MoS2 hollow flakes. CrystEngComm 2018, 20, 5619–5624. [Google Scholar] [CrossRef]
Figure 1. XRD patterns of the MoS2 films deposited at different pressures.
Coatings 09 00570 g001
Figure 2. Two-dimensional (2D) atomic force microscopy (AFM) images of the MoS2 films at (a) 0.8 Pa, (b) 1.0 Pa, (c) 1.2 Pa, and (d) 1.4 Pa. SEM images of the MoS2 films at 1.0 Pa: (e) surface morphology and (f) cross-sections.
Coatings 09 00570 g002
Figure 3. XPS spectra of the MoS2 films: (a) measured spectra, (b) Mo 3d core energy level spectrum, (c) S 2p core energy level spectrum, and (d) O 1s core energy level spectrum.
Coatings 09 00570 g003
Figure 4. Photoluminescence spectra of the MoS2 films deposited at different pressures.
Coatings 09 00570 g004
Figure 5. (a) Transmittance spectra of the MoS2 films. (b) Relationship between ( h v ) 2 and h v of the MoS2 films.
Coatings 09 00570 g005
Table 1. Interplanar spacings, lattice constants, and grain sizes of MoS2 films deposited by different pressures: d, interplanar spacing; a, lattice constant; and D, average grain size.
Crystal ParameterPressure
0.8 Pa1.0 Pa1.2 Pa1.4 Pa
a (nm)3.8513.8283.8293.828
d (nm)1.3621.3541.3541.353
D (nm)22.80430.35328.78231.499
Table 2. Roughness and thickness of the MoS2 films deposited at different pressures.
Sample ParameterPressure
0.8 Pa1.0 Pa1.2 Pa1.4 Pa
Roughness (nm)16.835.967.214.08
Thickness (nm)148137128153

