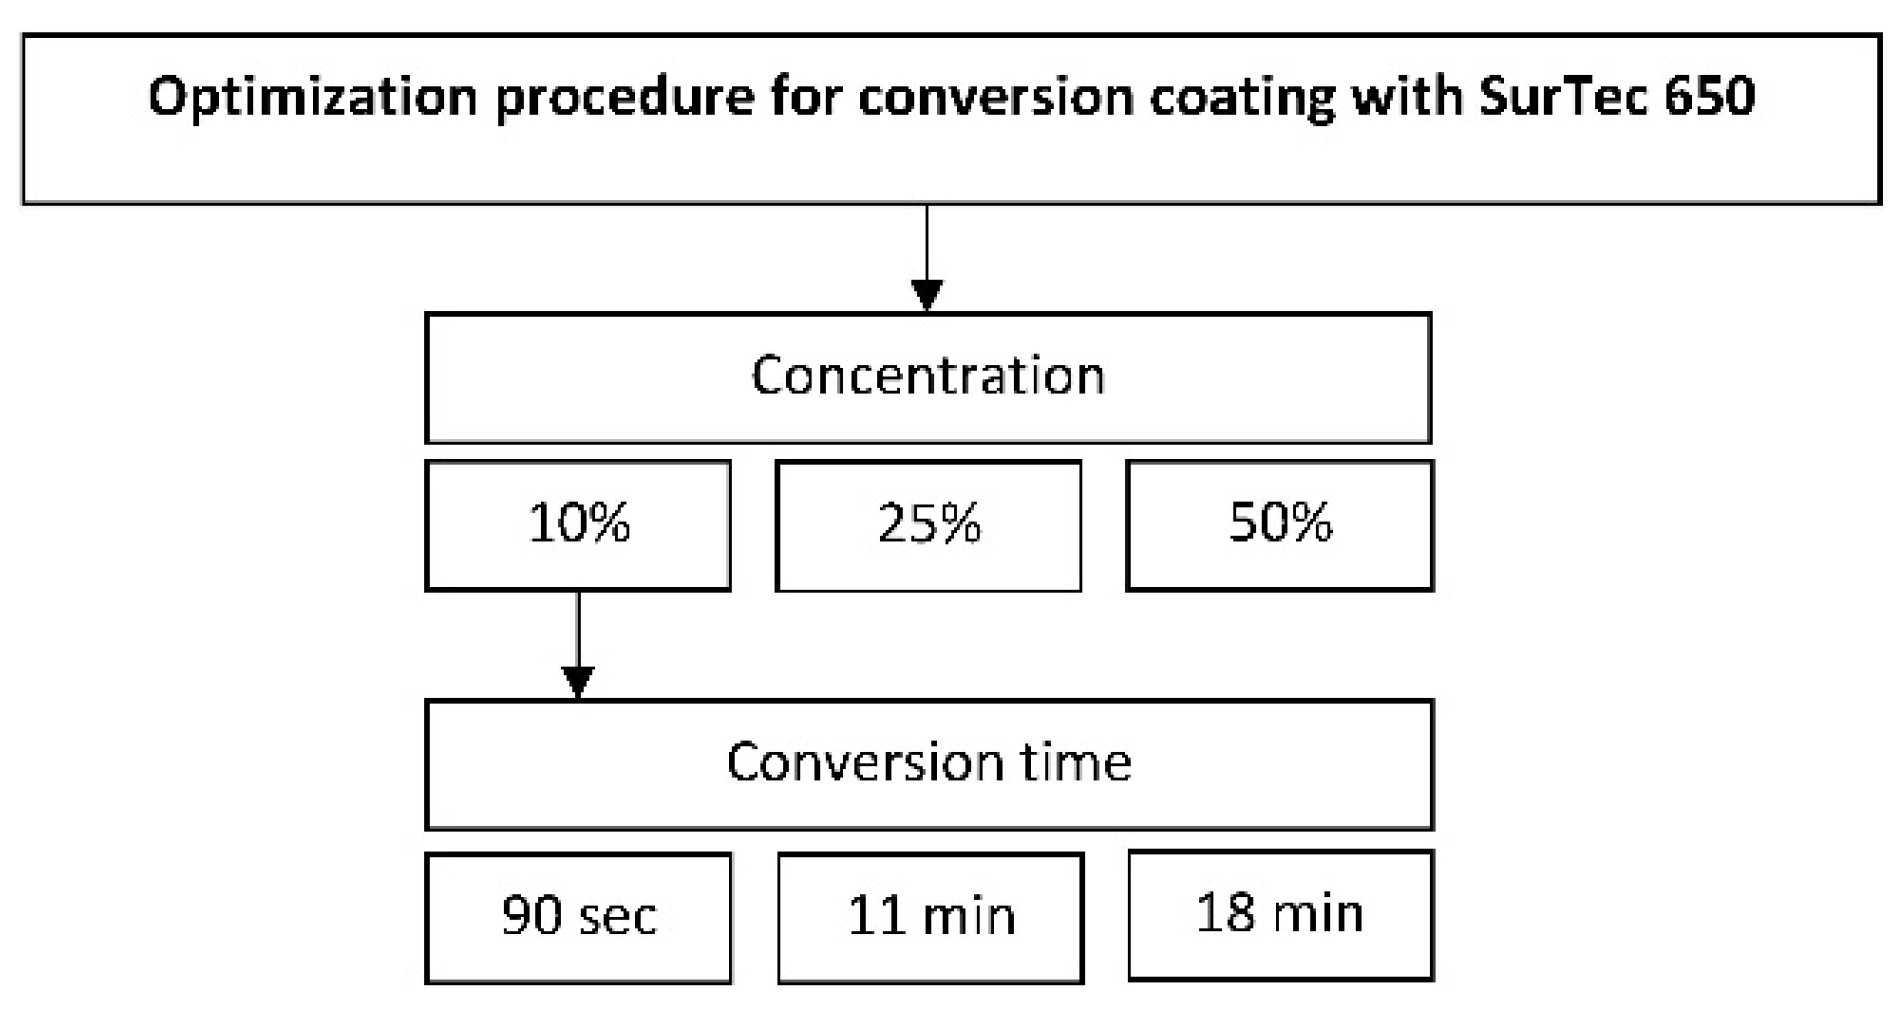
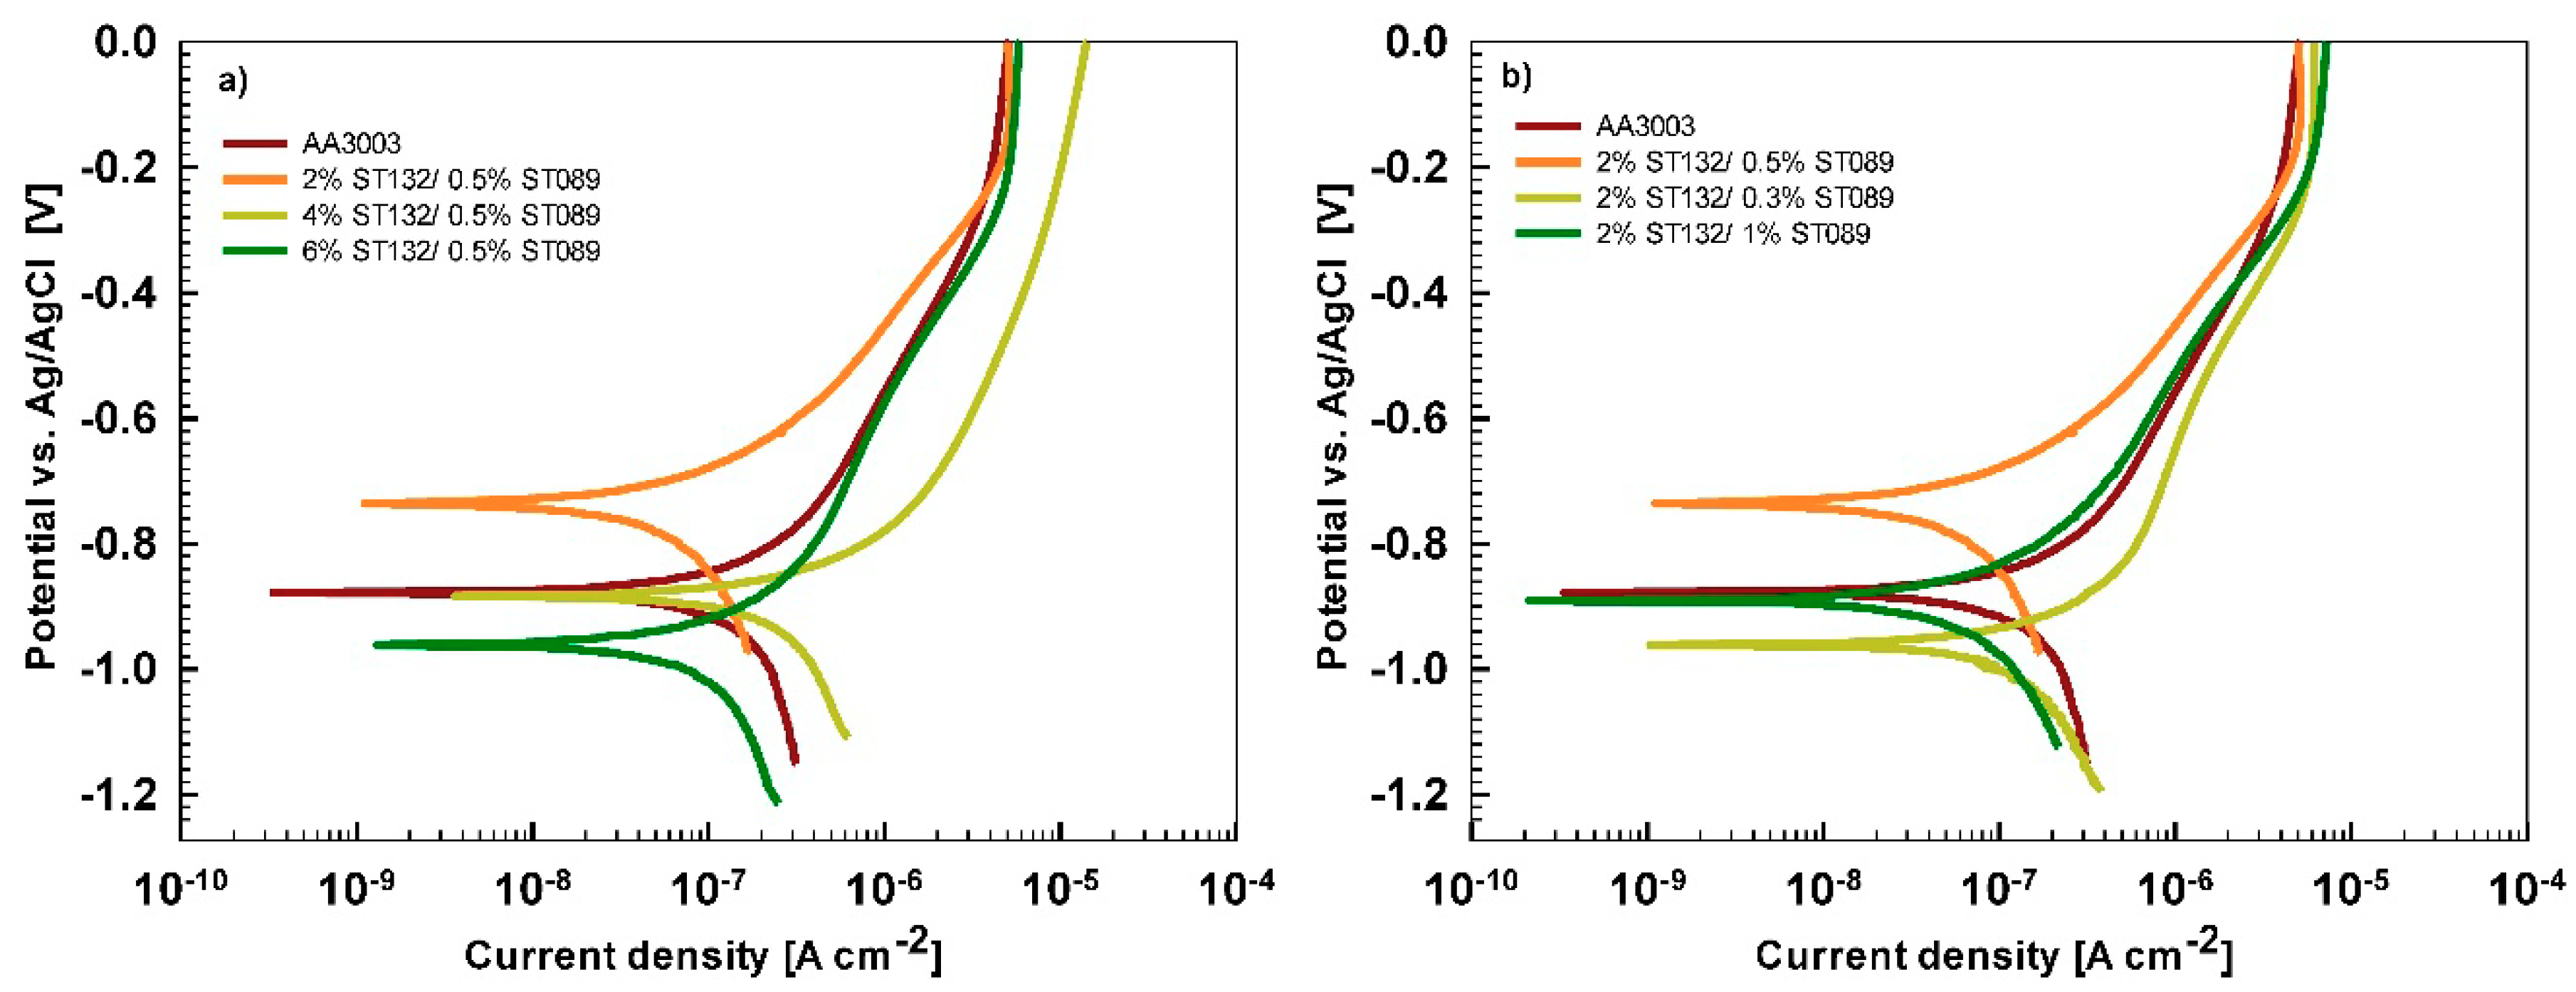
Electrochemical Measurements
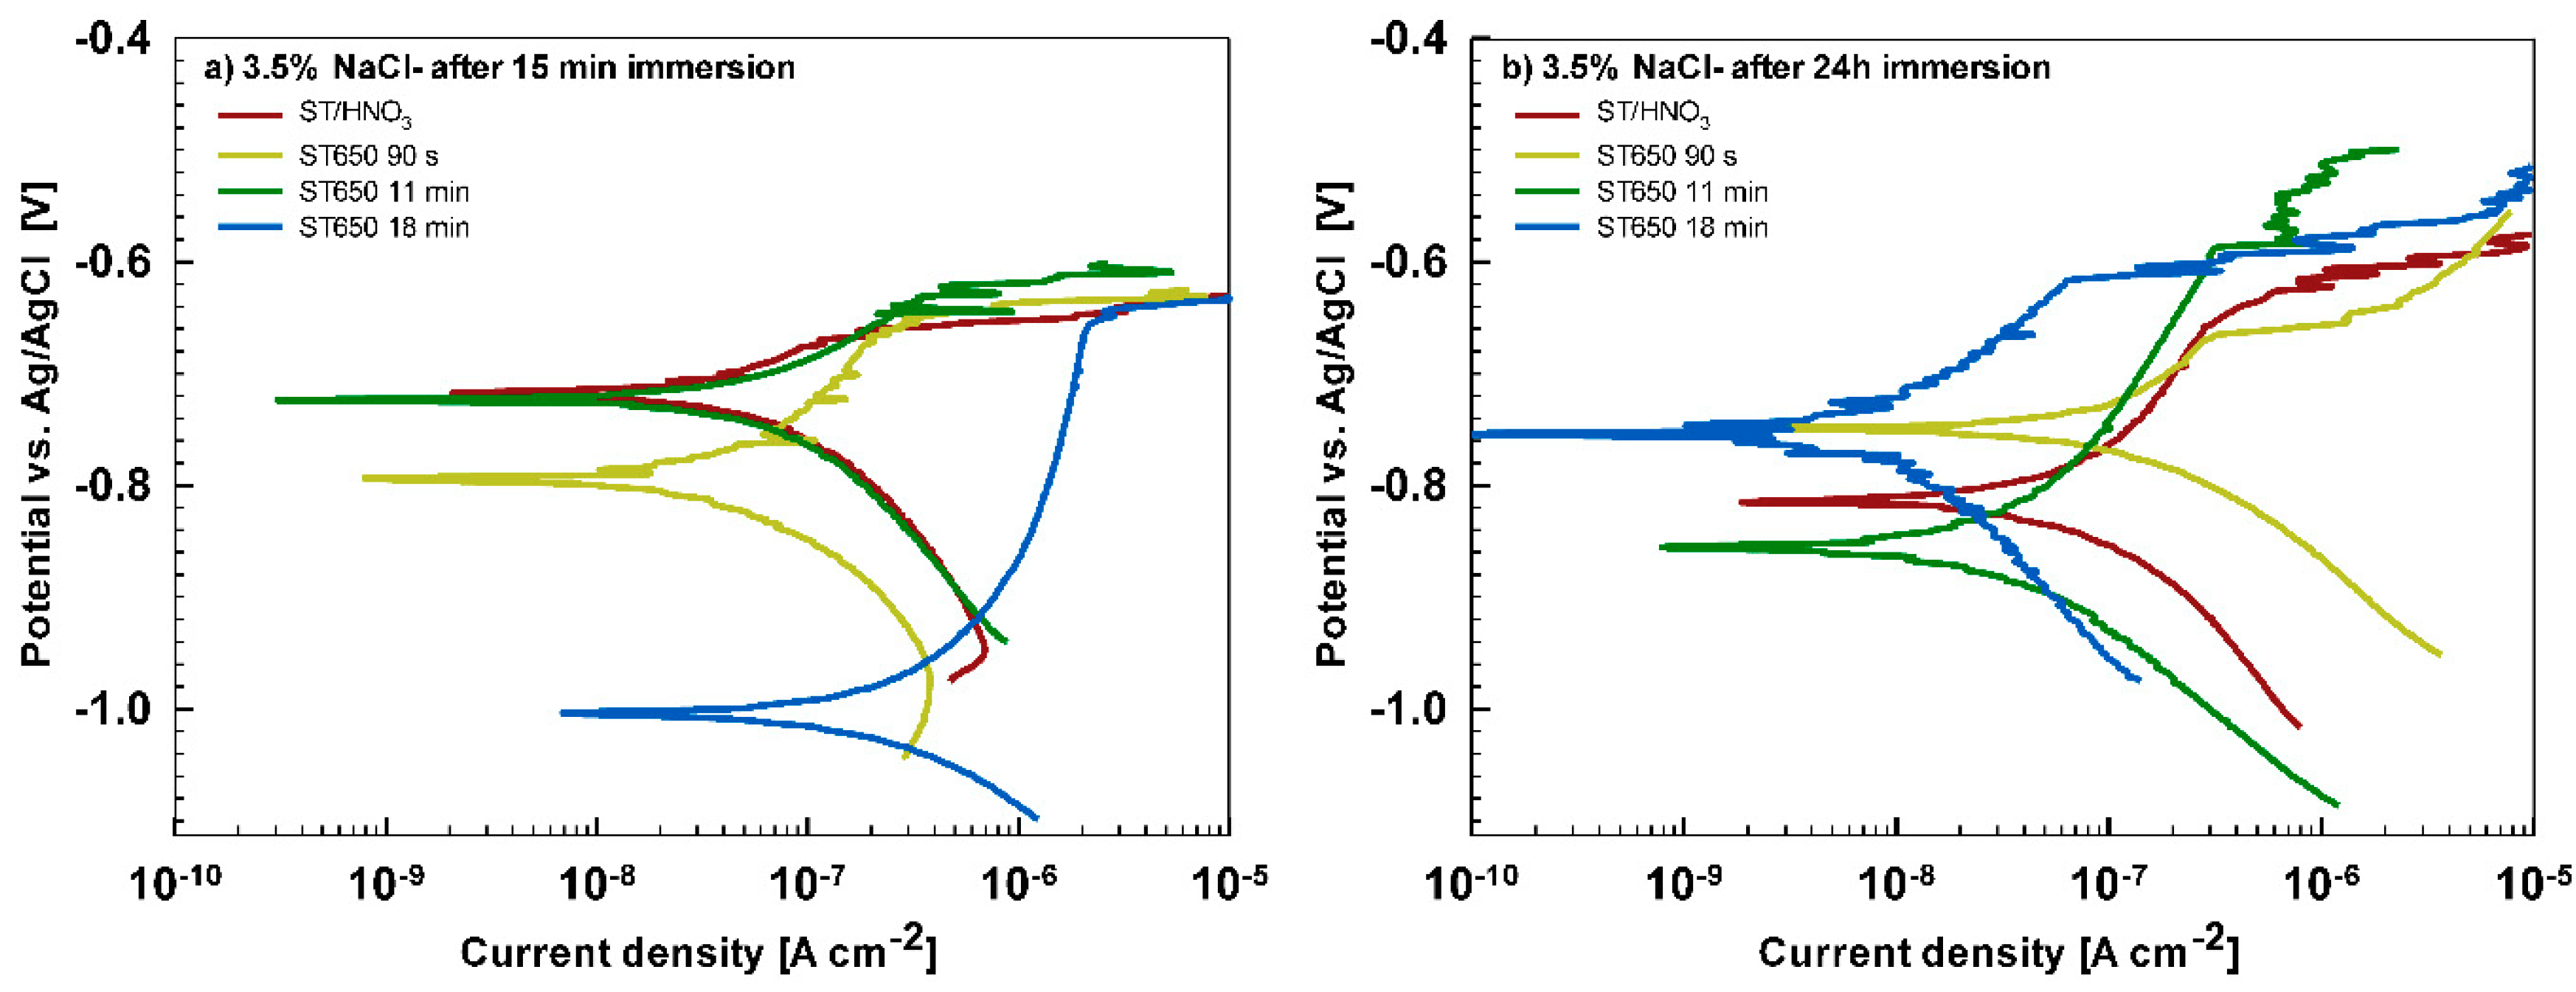
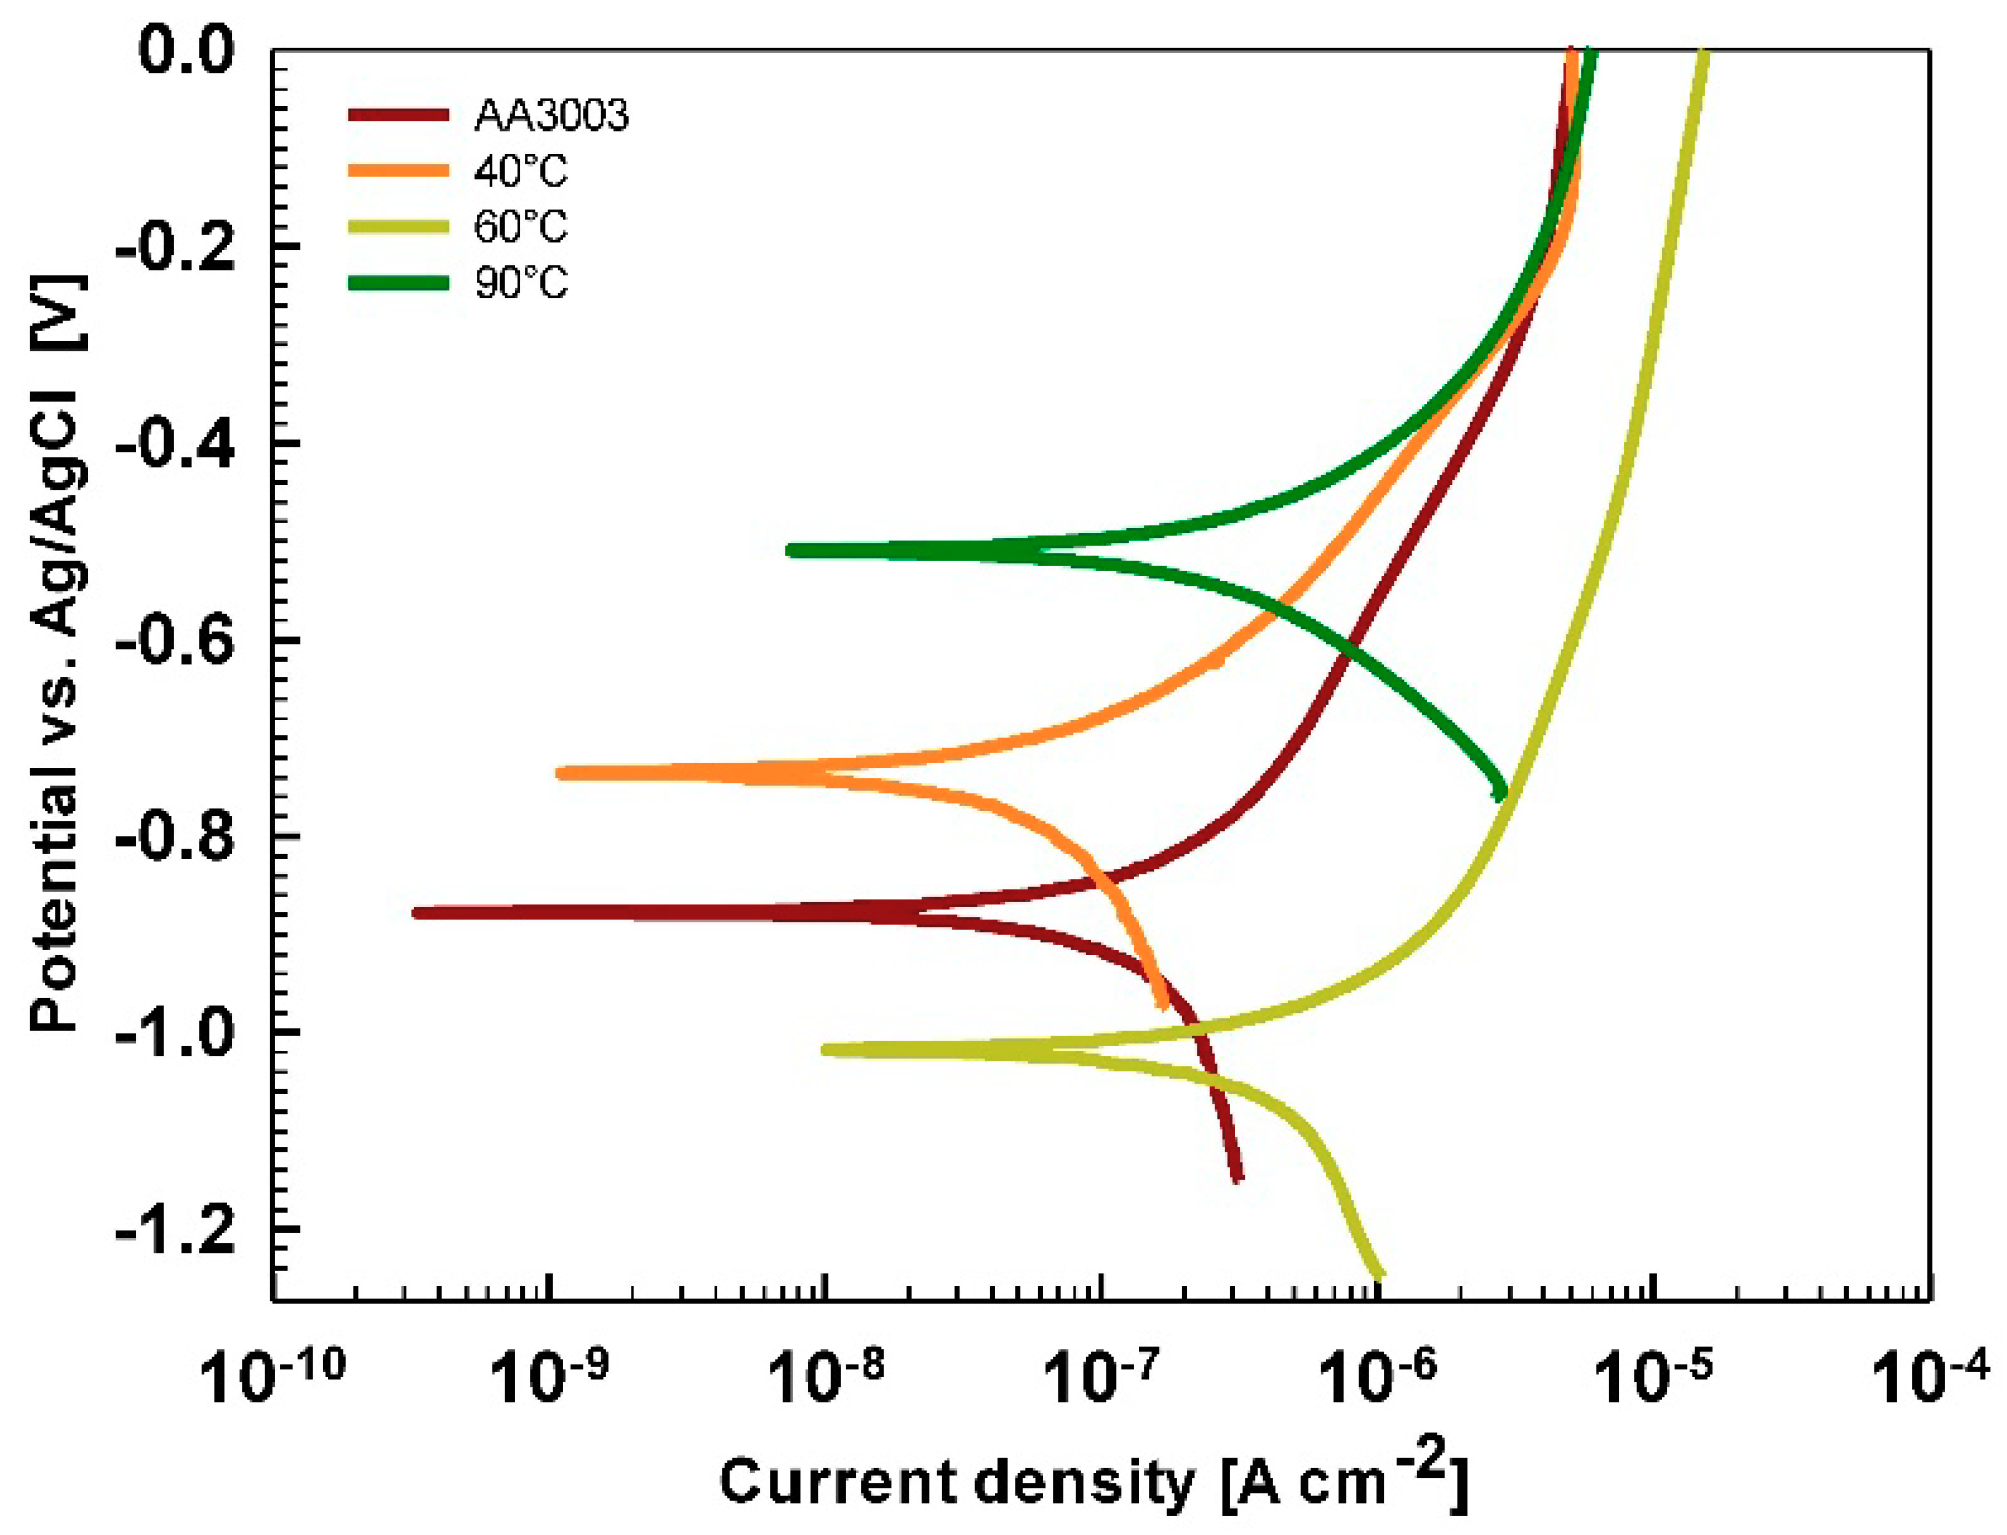
Potentiodynamic polarization curves were recorded in 3.5% NaCl and simulated acid rain after 15 min and 24 h immersion time in order to follow the behavior of coated samples as a function of time (
Figure 12 and
Figure 13,
Table 6). The polarization curve recorded for chemically pre-treated sample ST/HNO
3 is given for the sake of comparison.
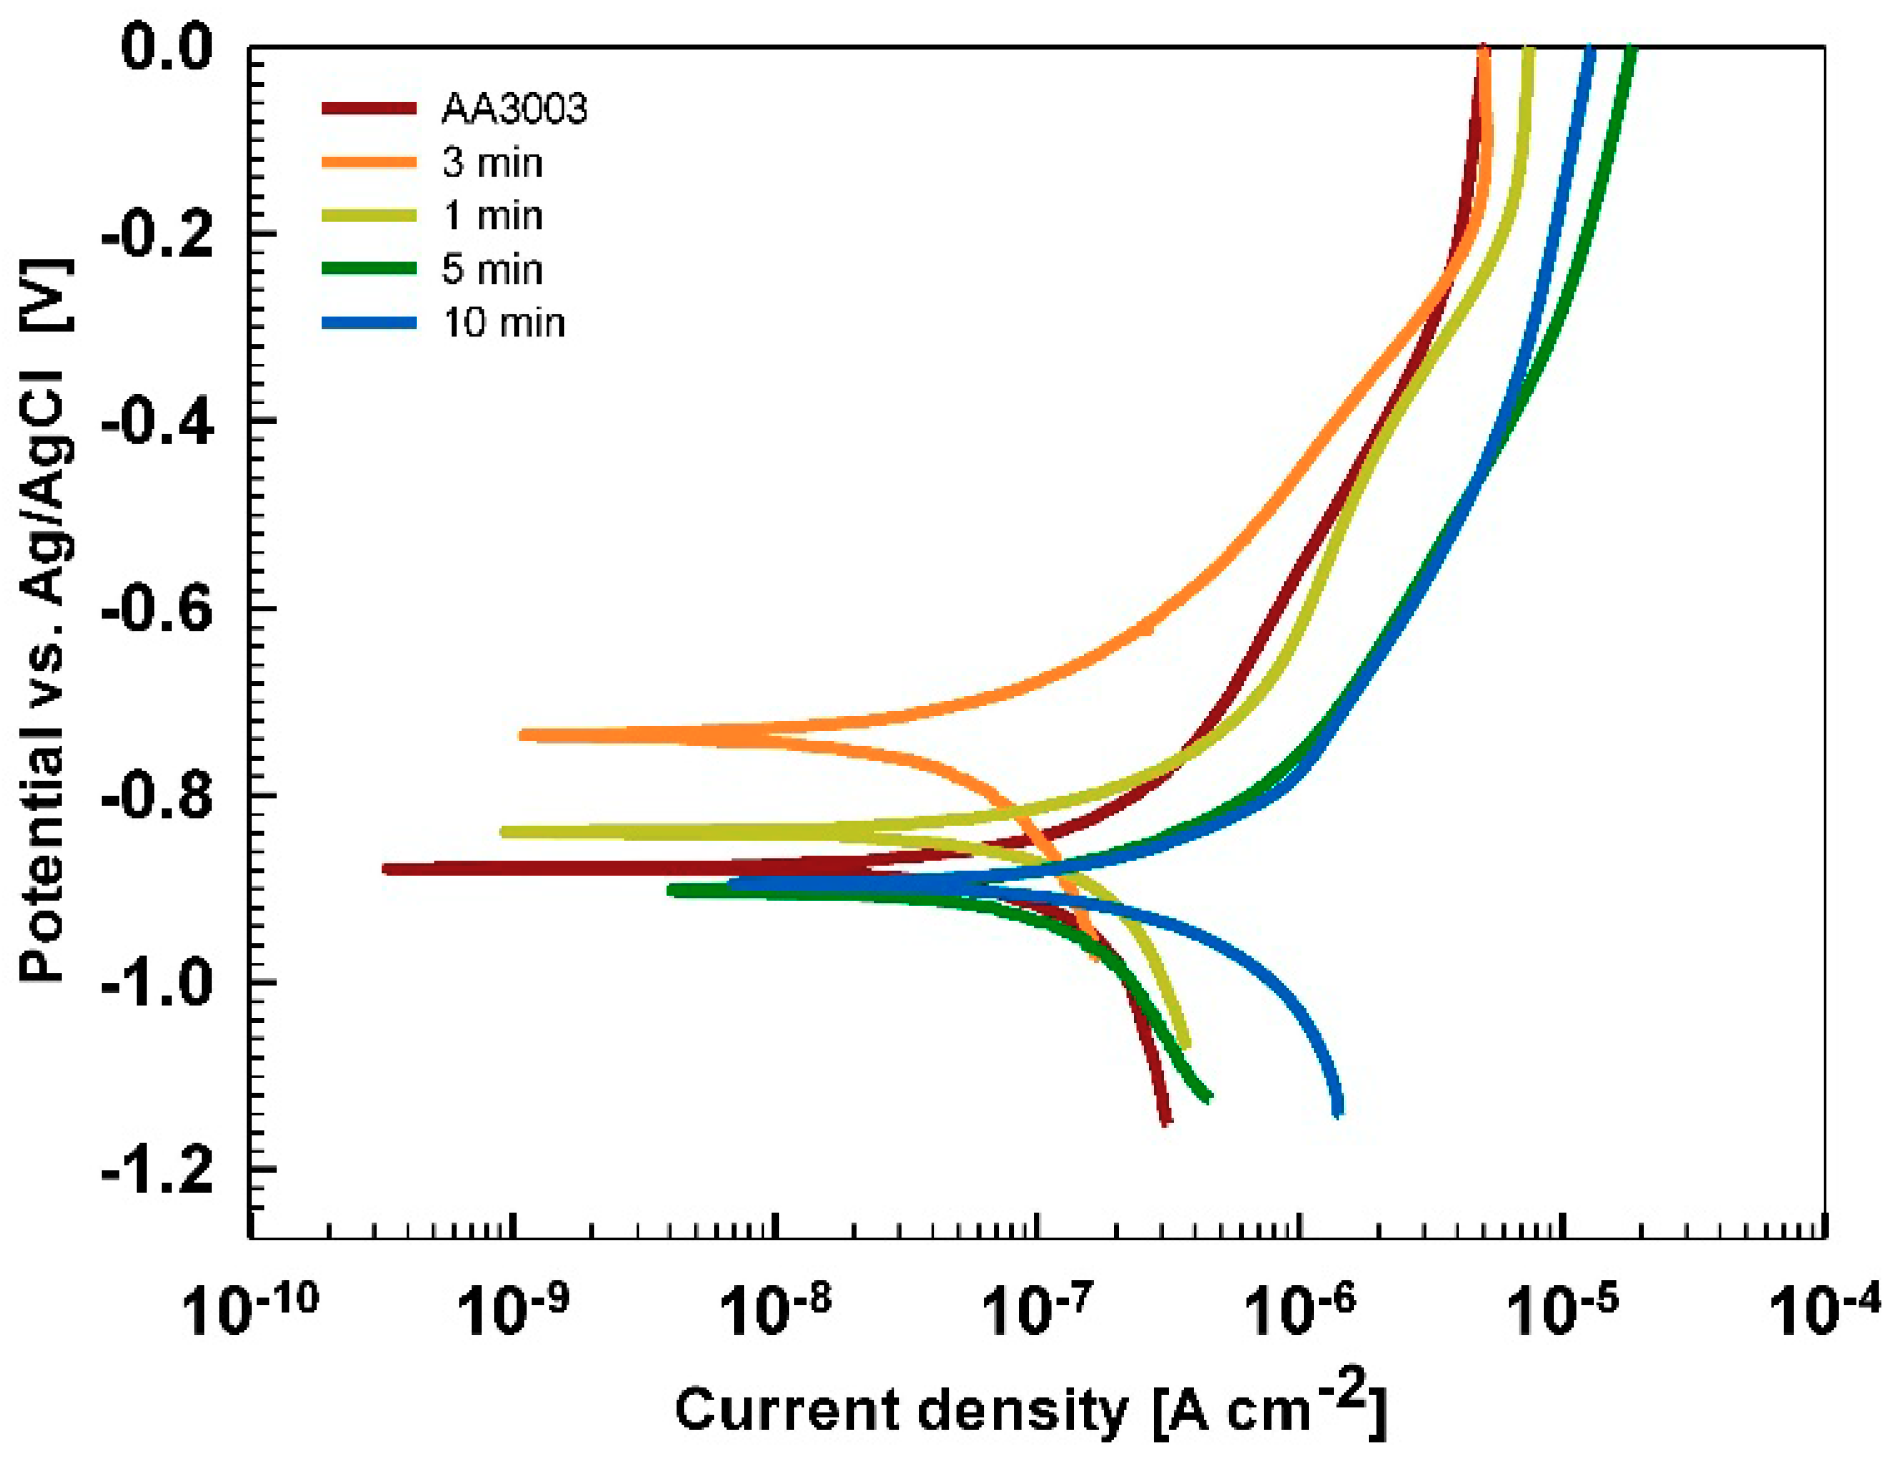
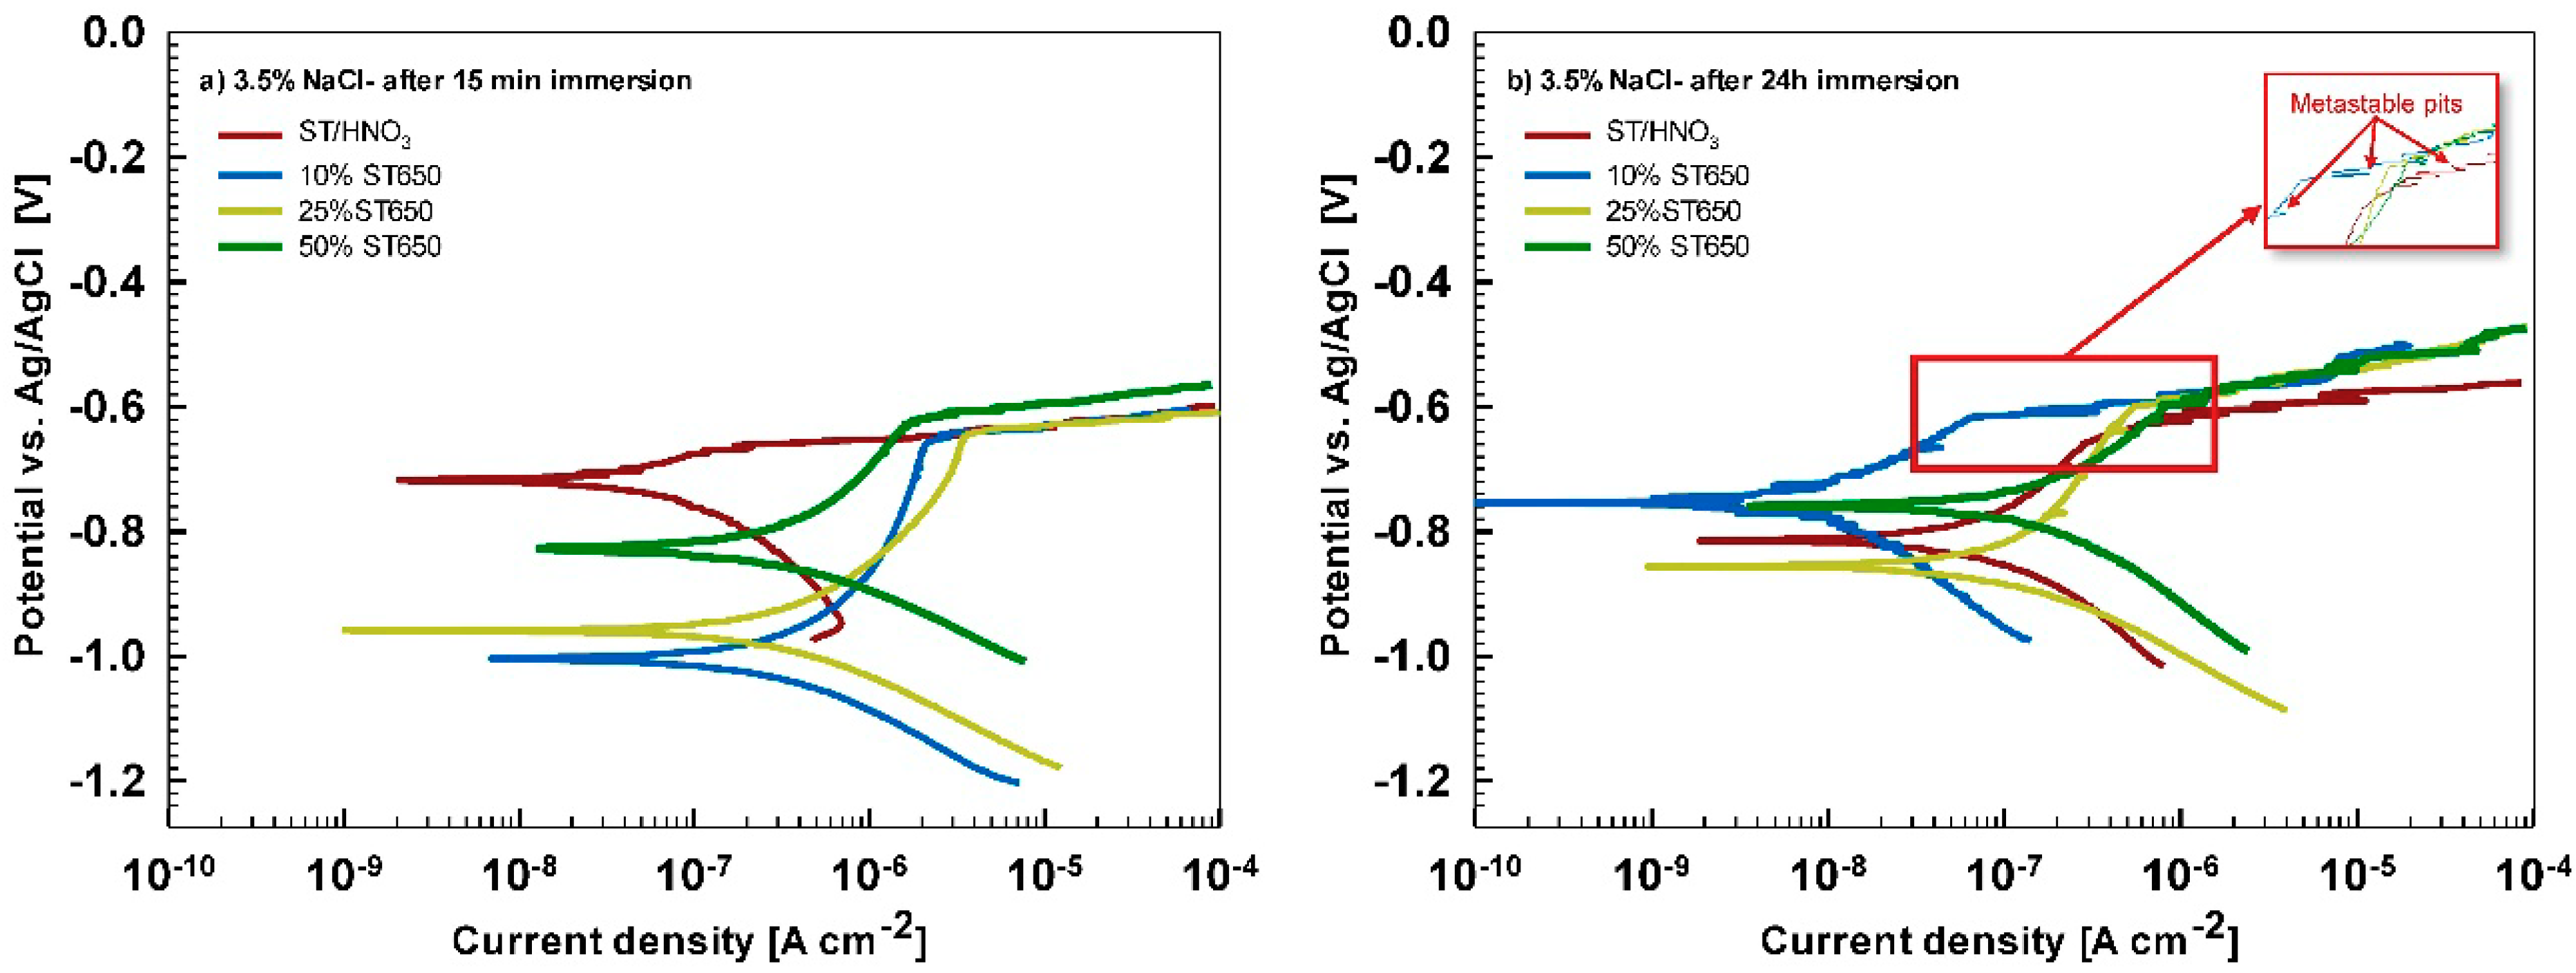
After 15 min stabilization in 3.5% NaCl, the curves recorded for coated AA3003 samples differed depending on the conversion time (
Figure 12a). The coating prepared for 11 min was similar to that of the uncoated sample; the other two curves were shifted in a negative direction. None of the curves showed an improvement in corrosion parameters compared to the bare sample (
Table 6). However, with prolonged immersion in NaCl (from 15 min to 24 h,
Figure 12b) the behavior of uncoated and, especially, coated samples changed. The uncoated sample exhibited a slight improvement in corrosion properties, probably related to the development of the naturally grown oxide layer able to temporarily resist the attack of chloride ions (
Figure 1b). The coated sample prepared at a 90 s conversion time showed degraded properties after 24 h immersion in NaCl compared to 15-min immersion. This coating was thus not protective at longer immersion times. In contrast, coatings deposited at 11 min and 18 min showed considerably larger
Rp (4- to 10-fold compared to 15 min immersion) and a smaller
jcorr (15- to 27-fold compared to 15 min immersion). During prolonged immersion, a large positive shift of the curve for the sample deposited for 18 min occurred changing
Ecorr from −0.95 V to −0.76 V. The sample deposited for 11 min showed a shift in the opposite direction, i.e., from −0.74 V to −0.86 V. This also affected
Ebd values. After 15 min in NaCl, the
Ebd values were very similar to the chemically treated sample. After 24 h in NaCl, however, the coatings deposited for 11 and 18 min showed a shift in
Ebd for 90 mV and 50 mV more positive compared to the bare alloy, respectively. Therefore, at an equivalent conversion time in the ST650 bath (11 and 18 min), the corrosion parameters of the coated samples were improved after prolonged immersion in NaCl (smaller current density, larger polarization resistance and a more positive breakdown potential). This result indicates that with a longer immersion time, the corrosion resistance increased, resulting in a better protectivity of the layer to the localized breakdown.
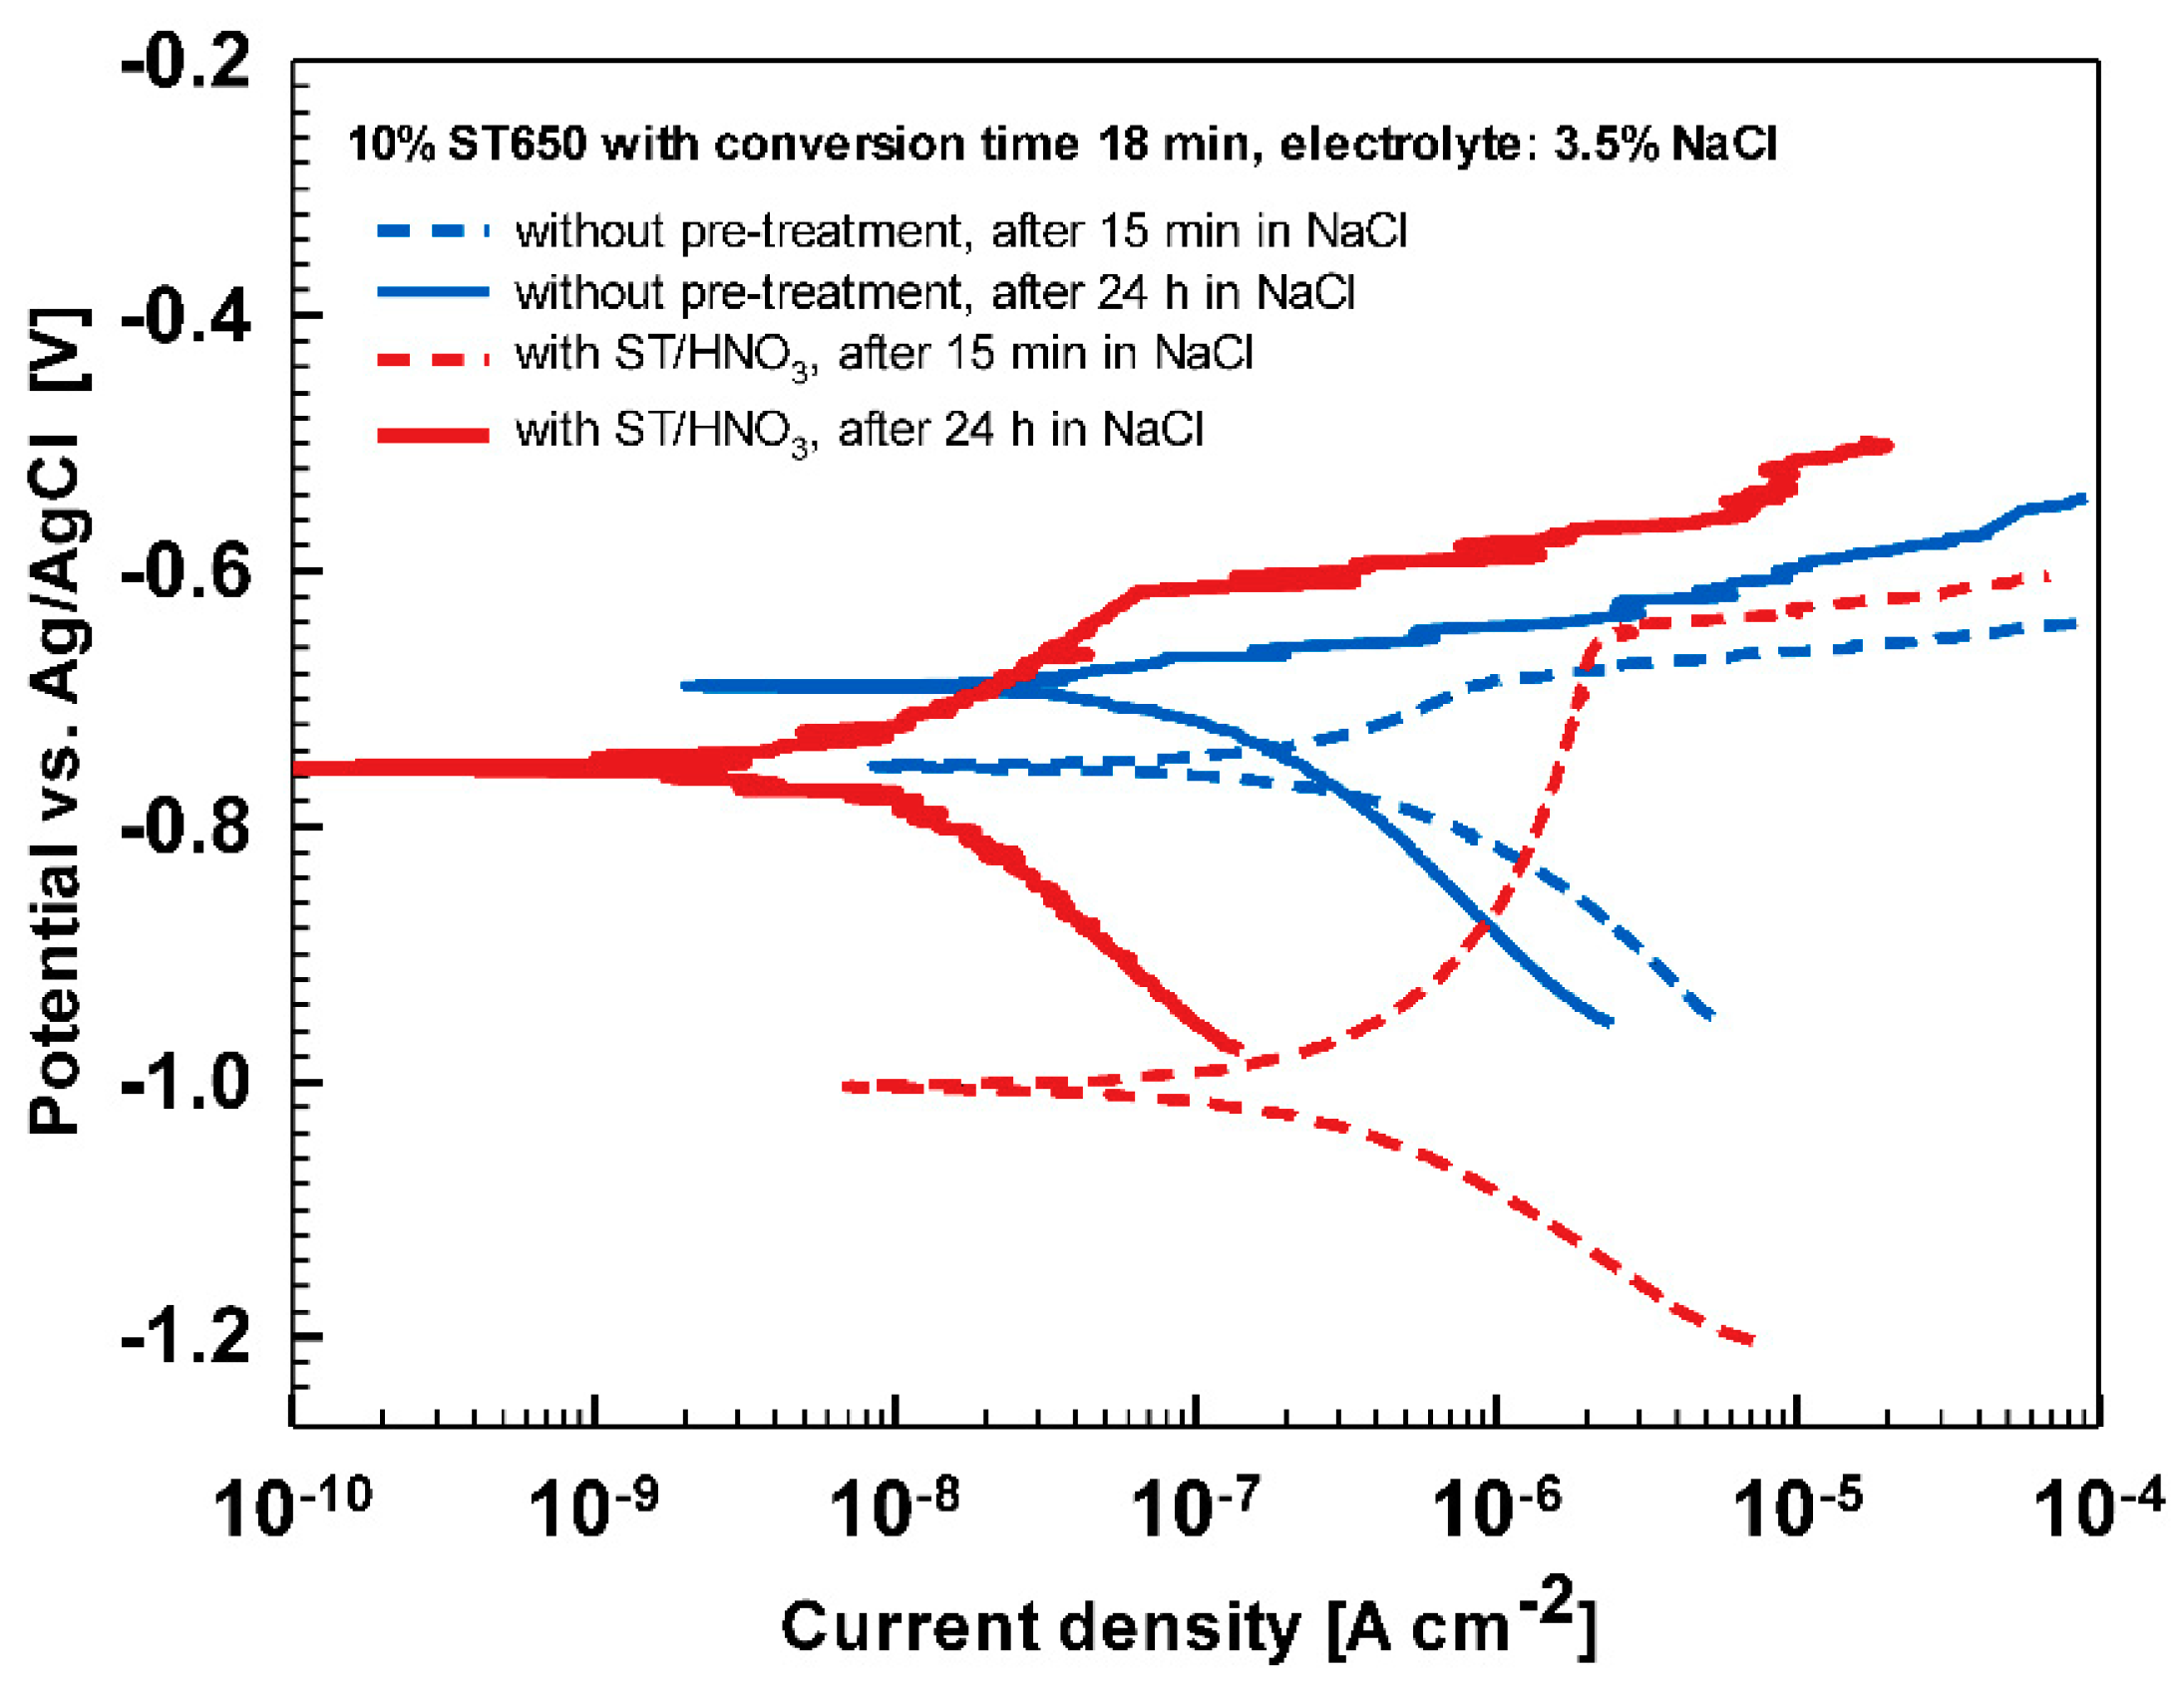
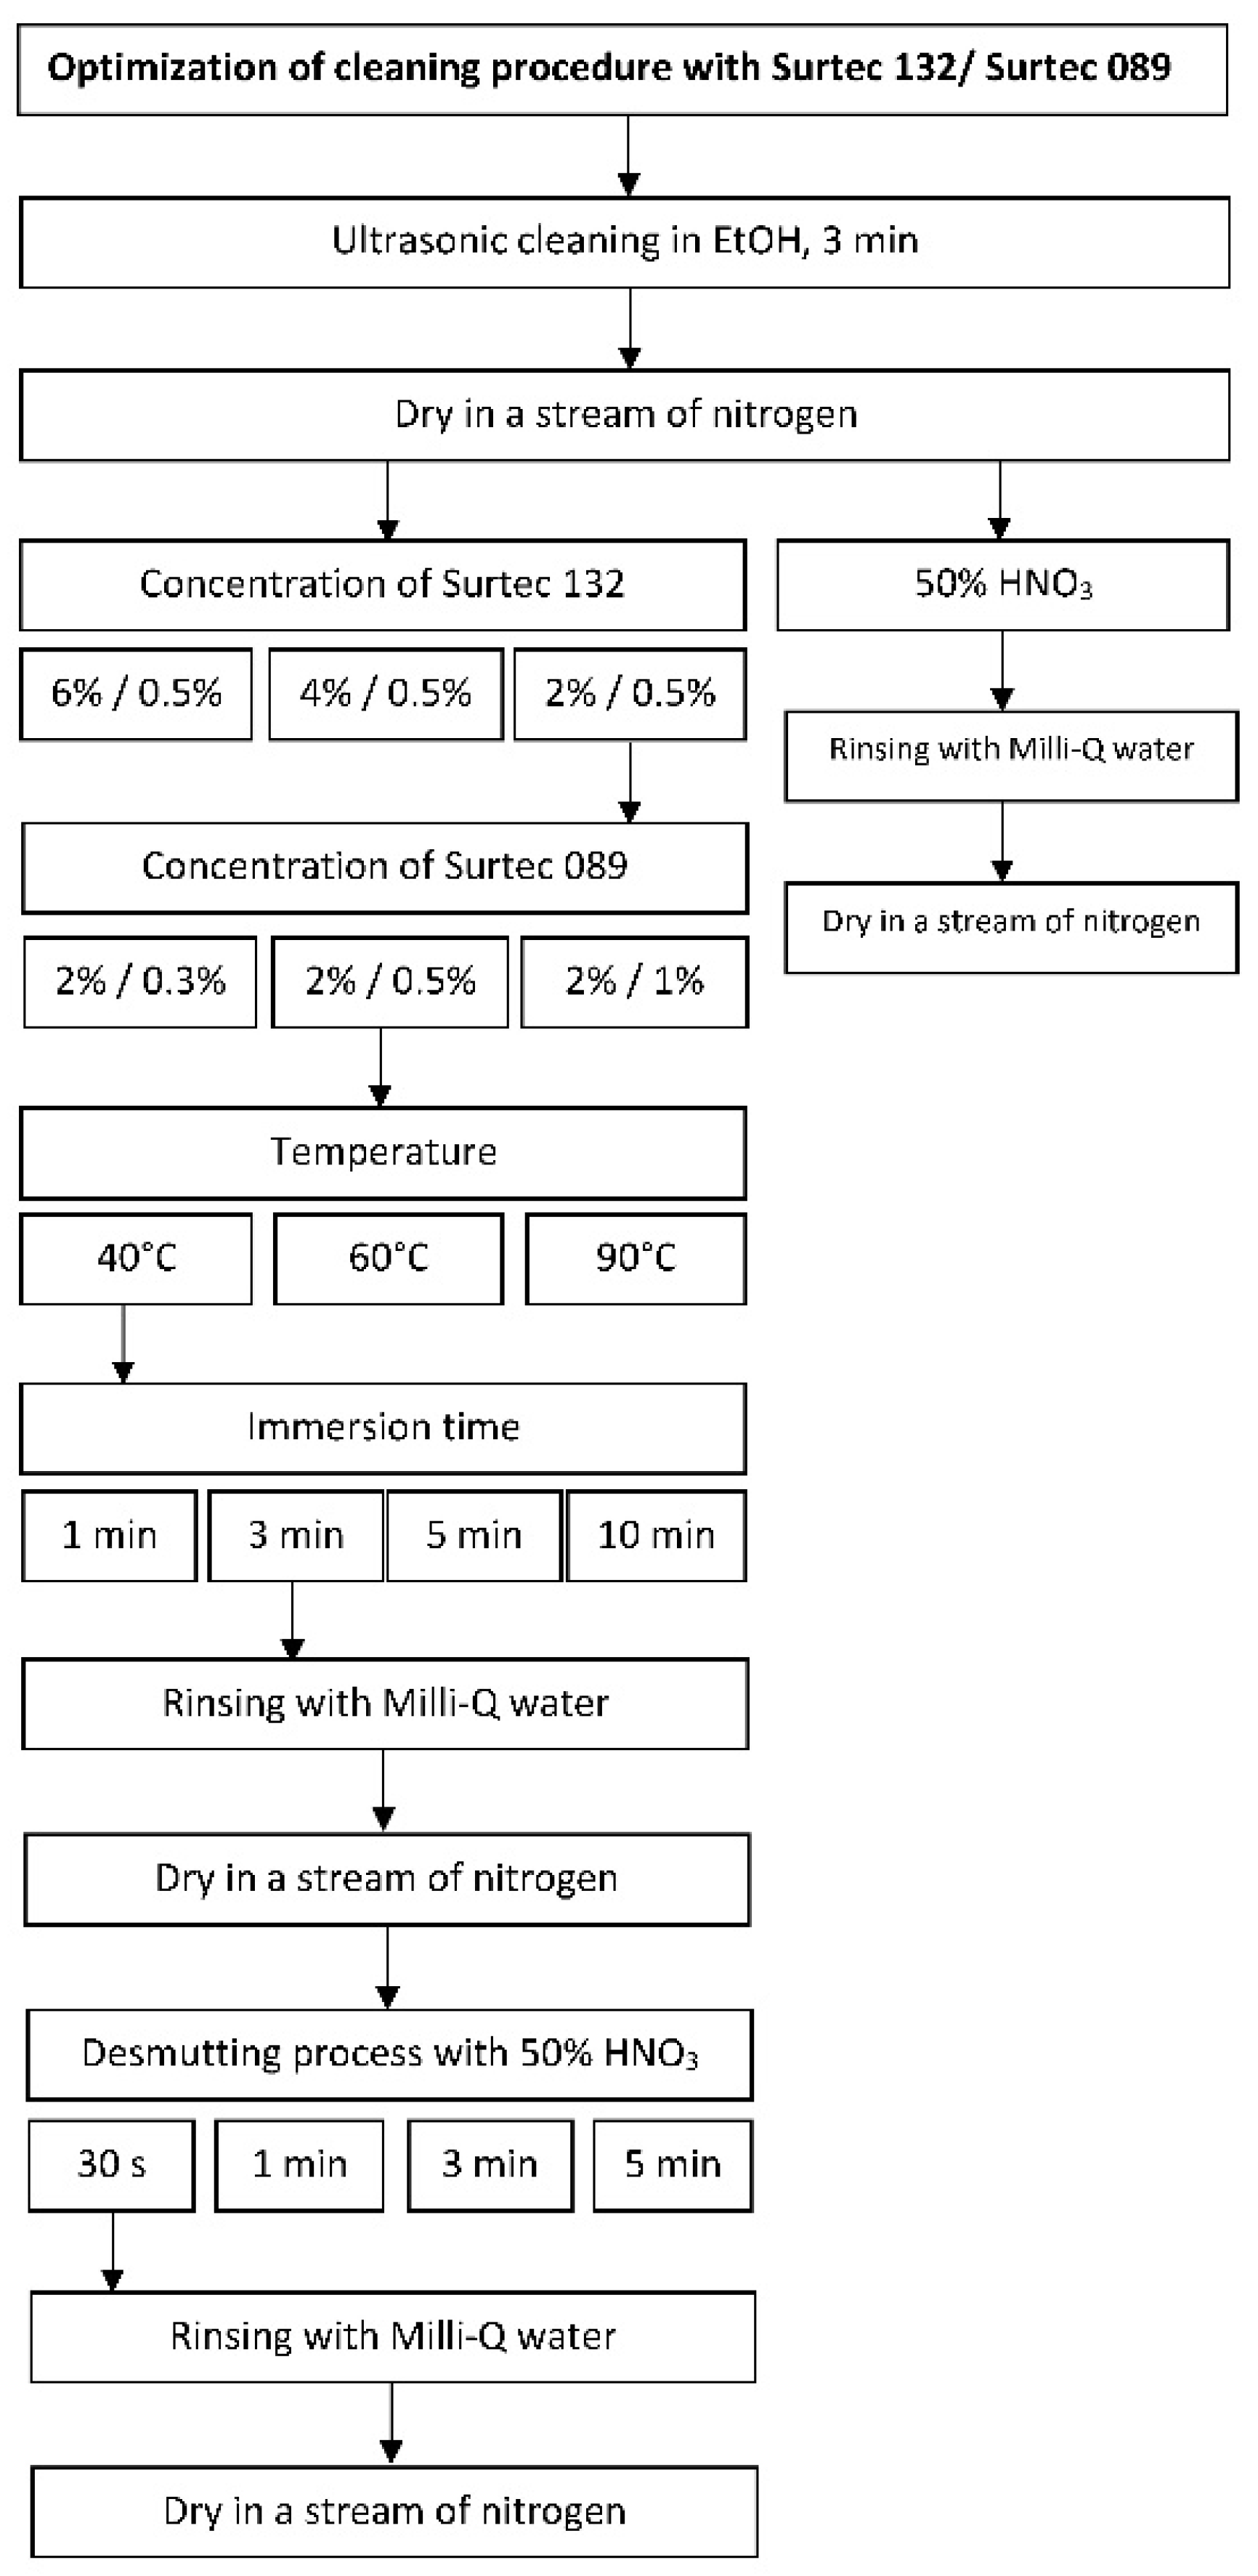
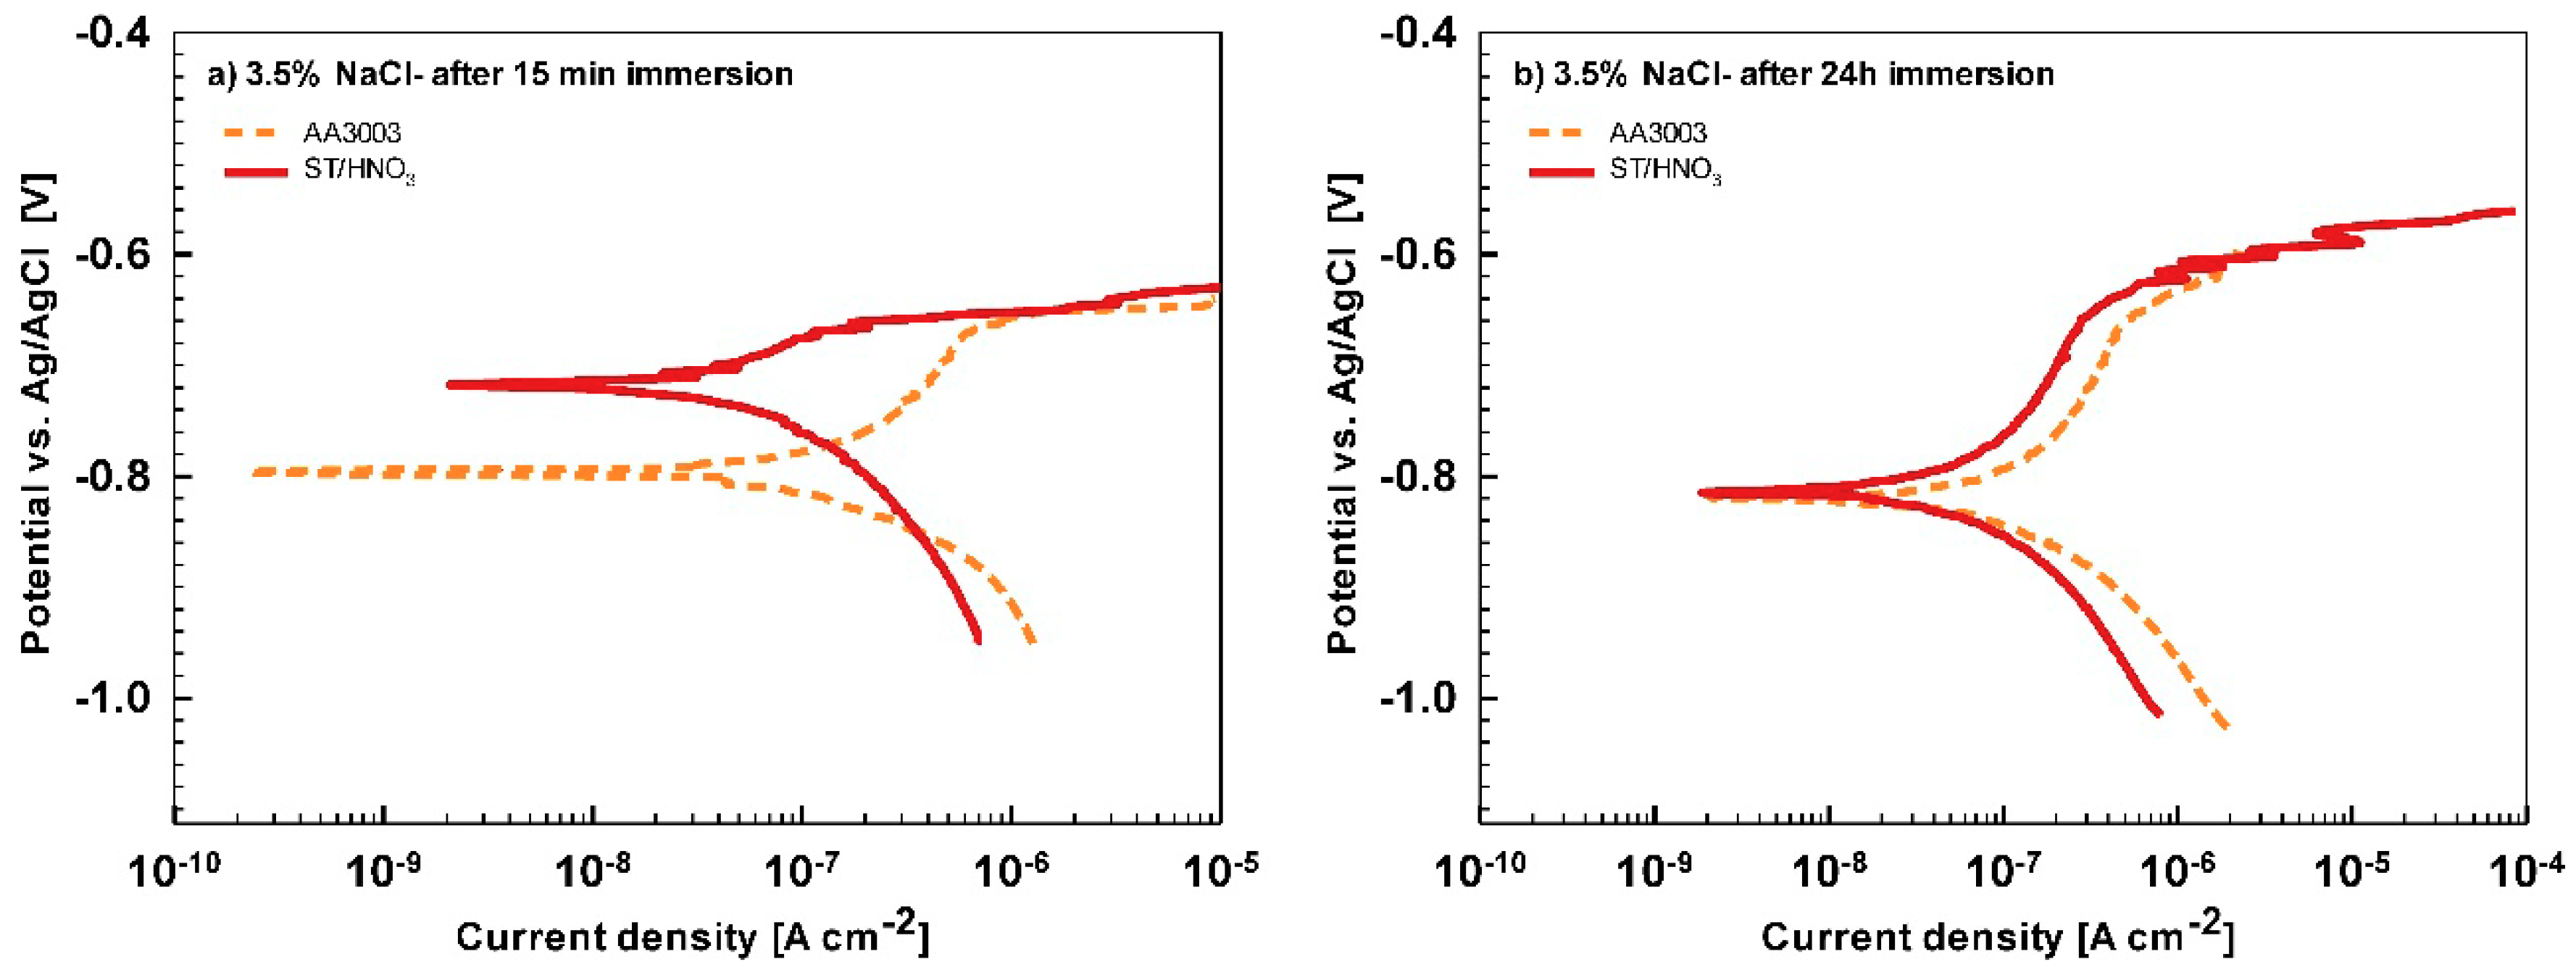
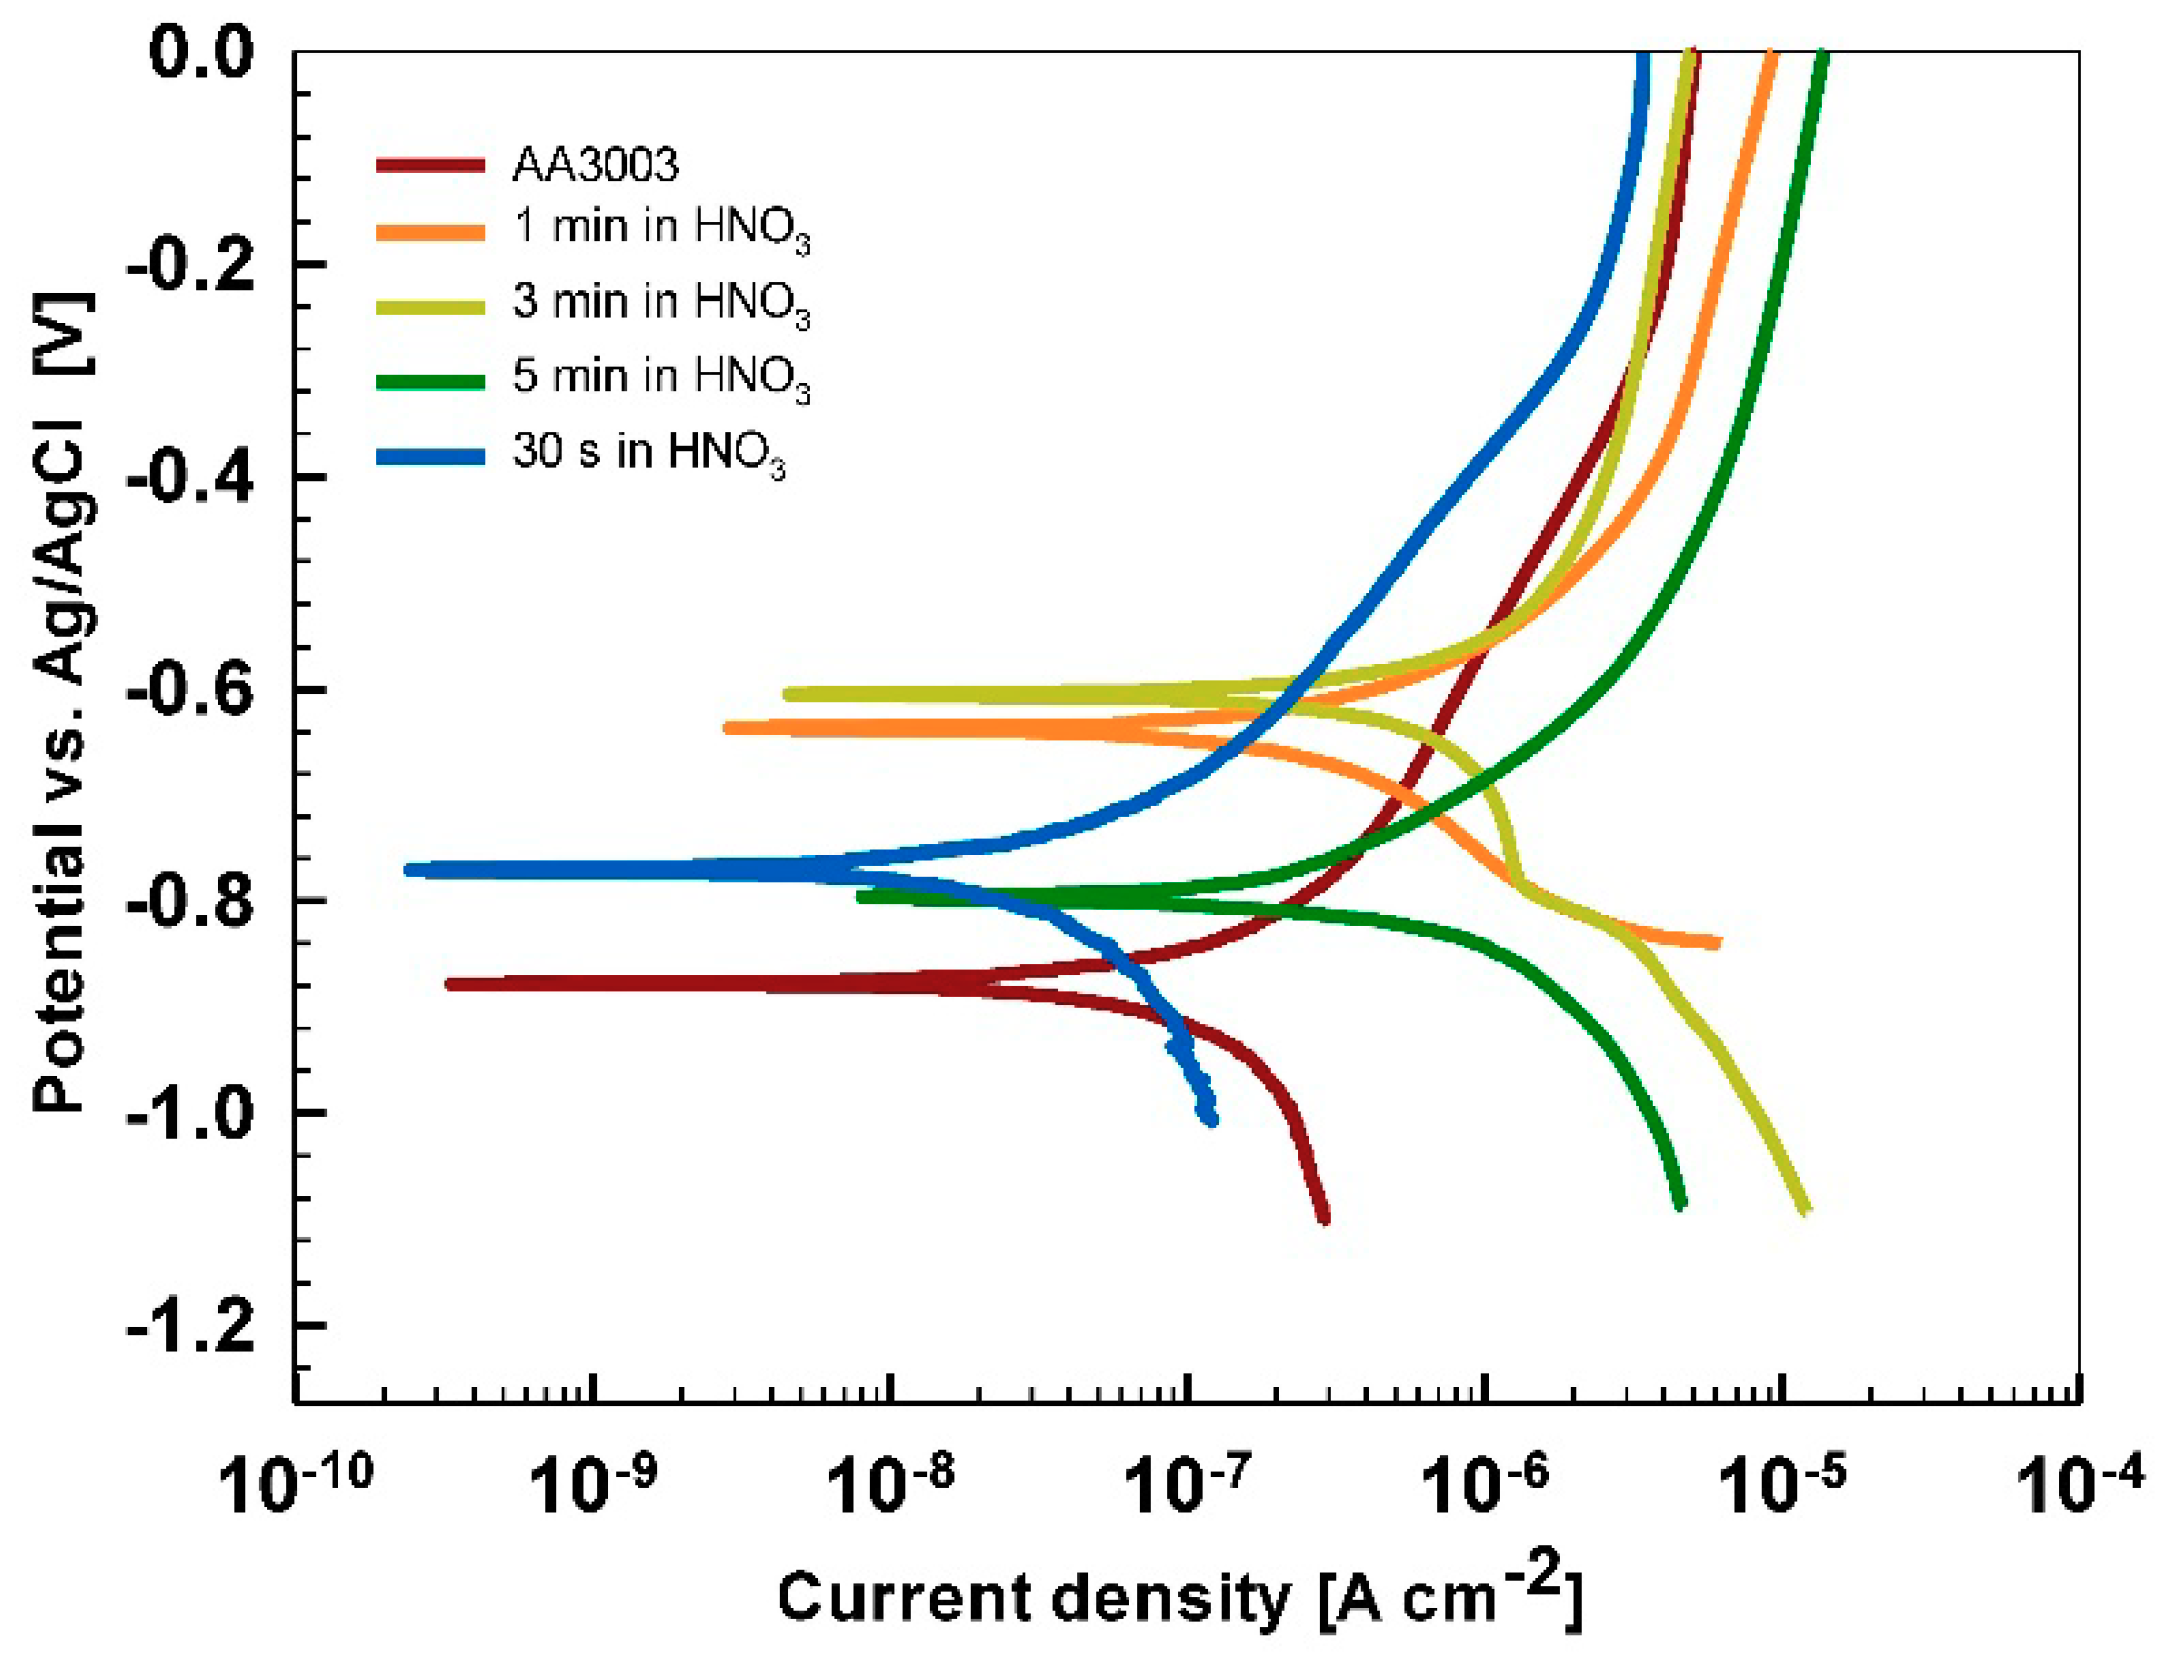
Substrate pre-treatment beneficially influences the subsequent coating process. The comparison of ST650-coated AA3003 substrates prepared with and without chemical pretreatment with ST/HNO
3 is presented in
Figure A6 and
Table A2. Potentiodynamic curves were recorded after 15 min and 24 h immersion in 3.5 wt.% NaCl. It is evident that a better corrosion resistance was achieved on chemically pre-treated substrate.
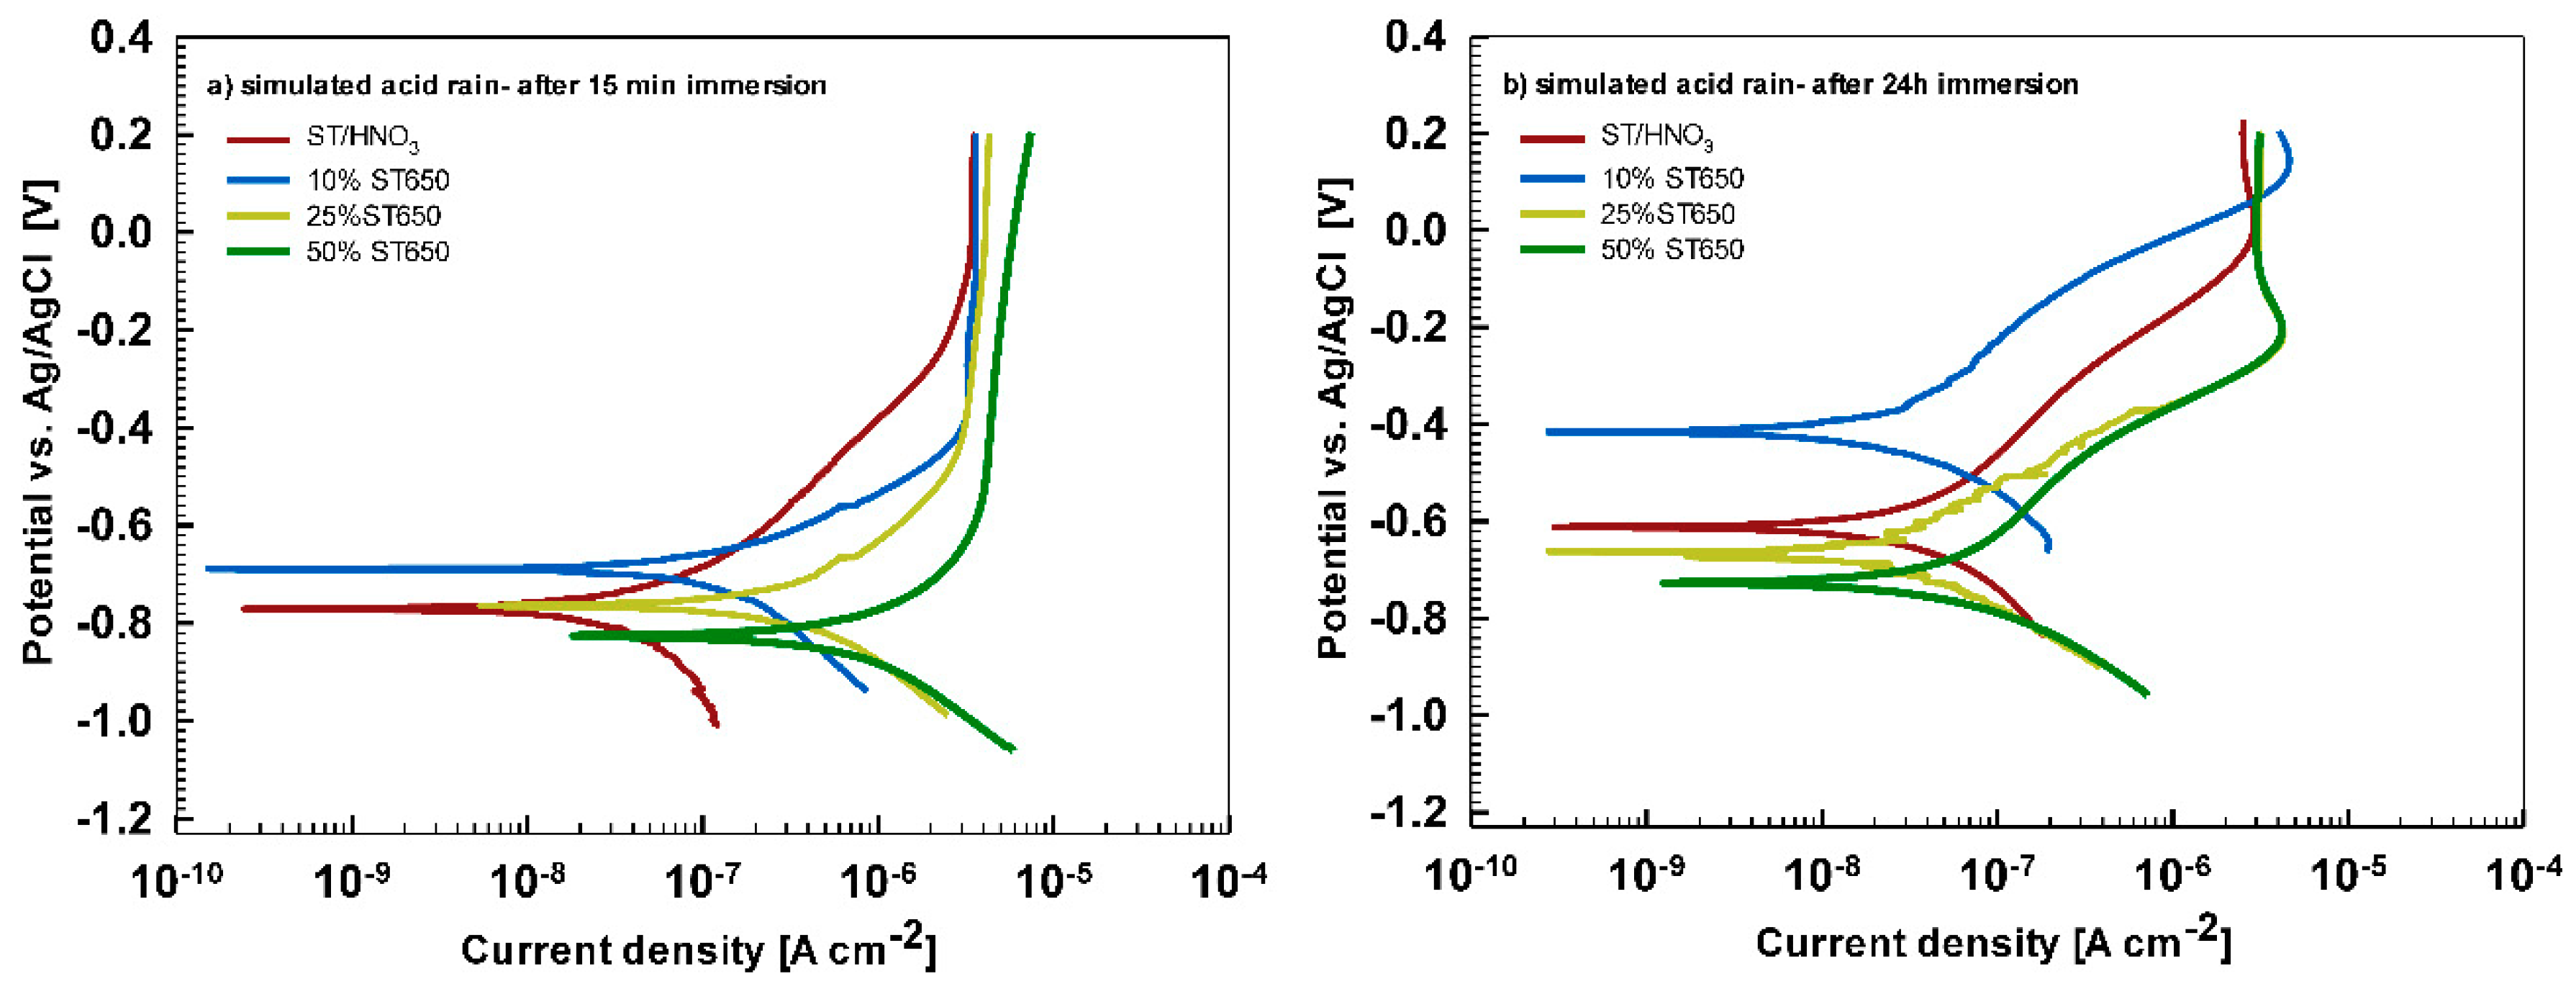
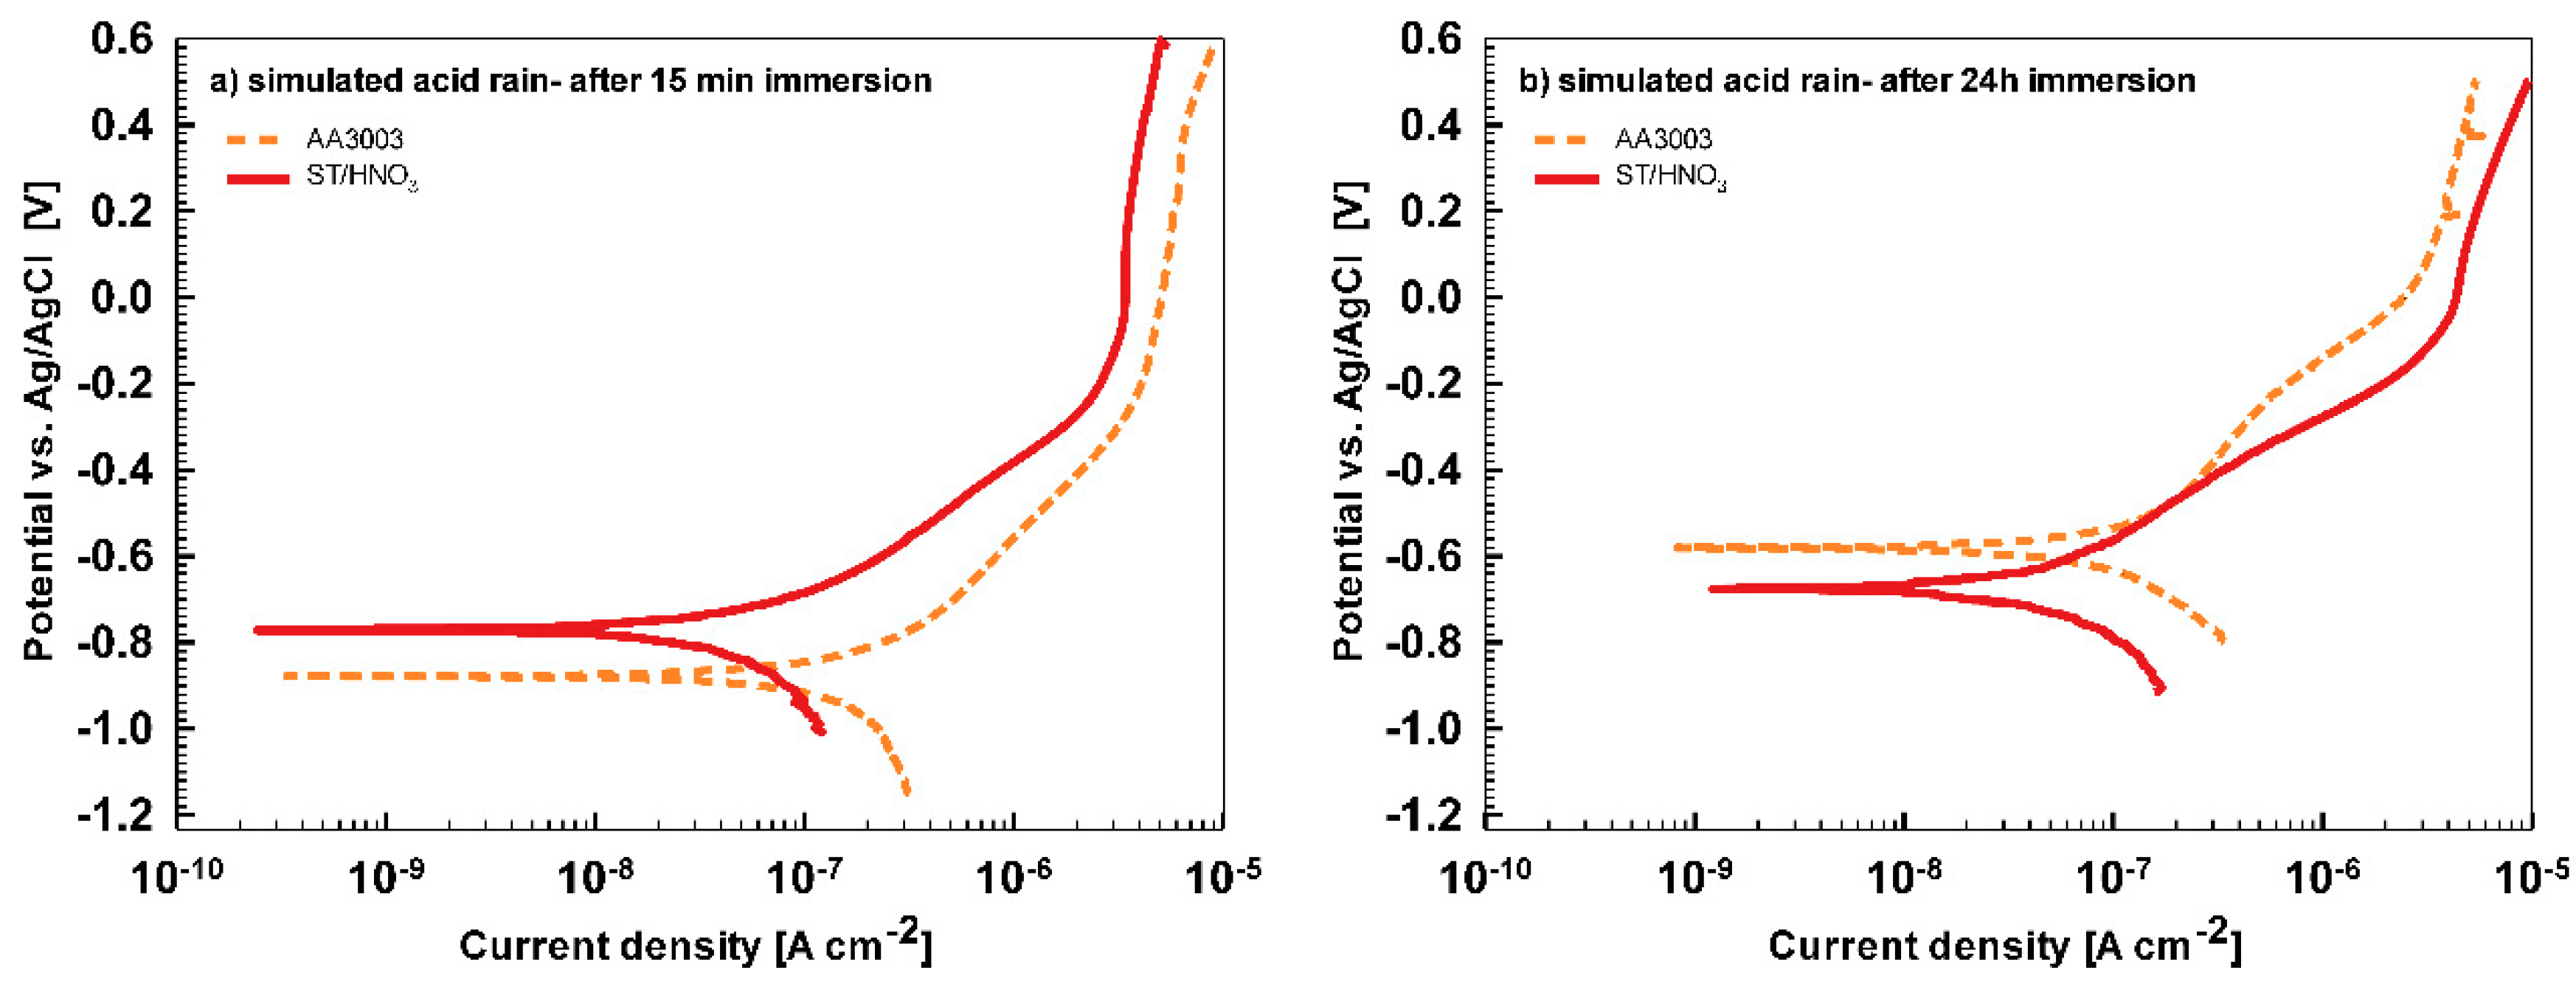
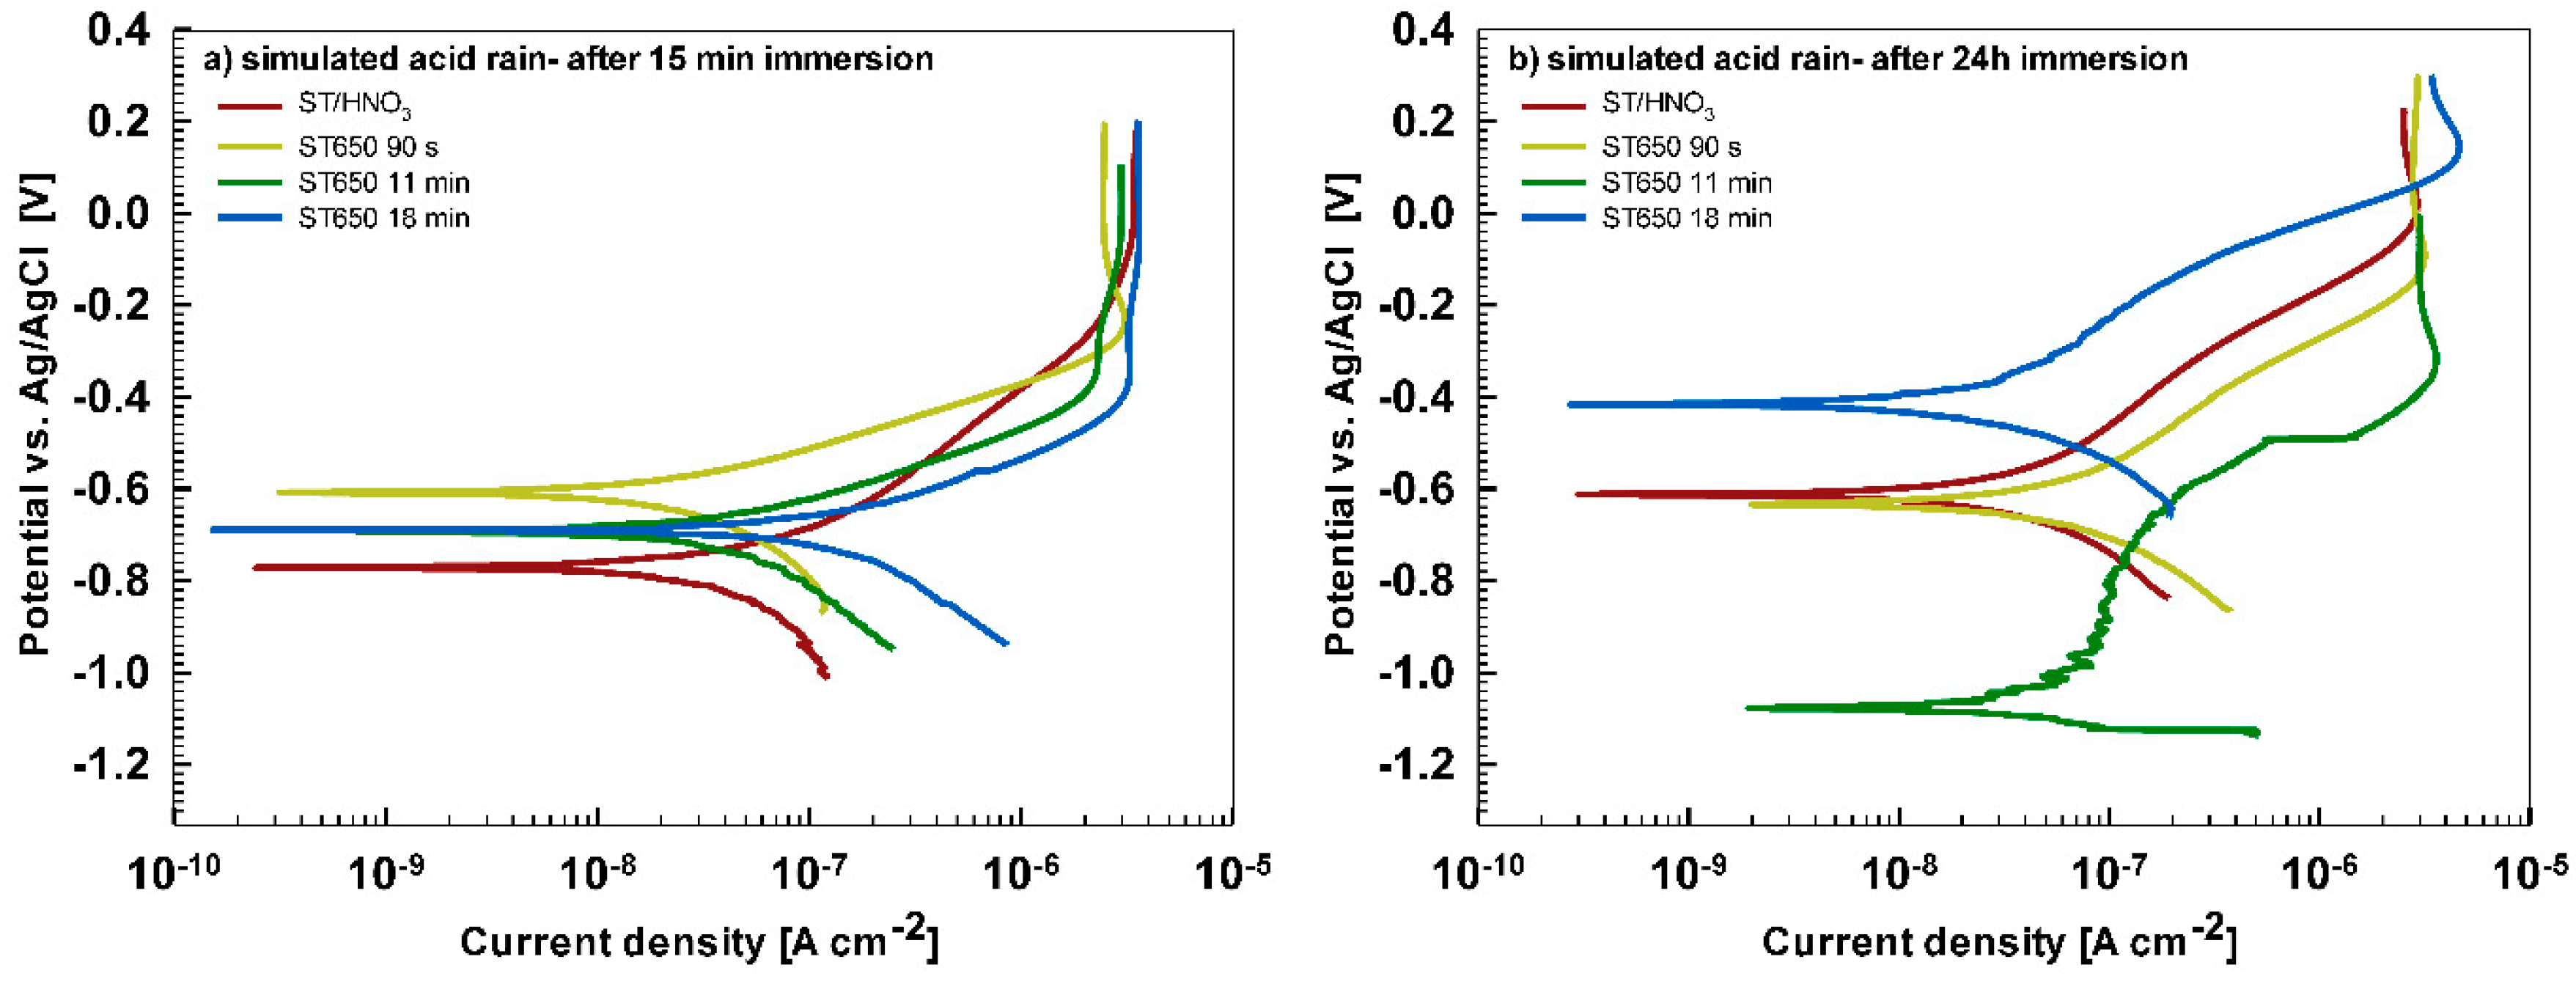
In less aggressive electrolyte of simulated acid rain, the initial attack was less severe than in 3.5% NaCl (
Figure 13). After 15-min immersion (
Figure 13a) the coating deposited for 90 s showed the most favorable corrosion parameters whilst the coating deposited at 18 min was the least resistant (
Table 6). After 24 h immersion (
Figure 13b), however, a similar behavior as in NaCl solution was observed: the curve for the coating deposited for 18 min shifted strongly in the positive direction and exhibited the most favorable corrosion parameters (smallest current density, largest polarization resistance and most positive corrosion potential) (
Table 6).
SEM/EDS and XPS Characterization
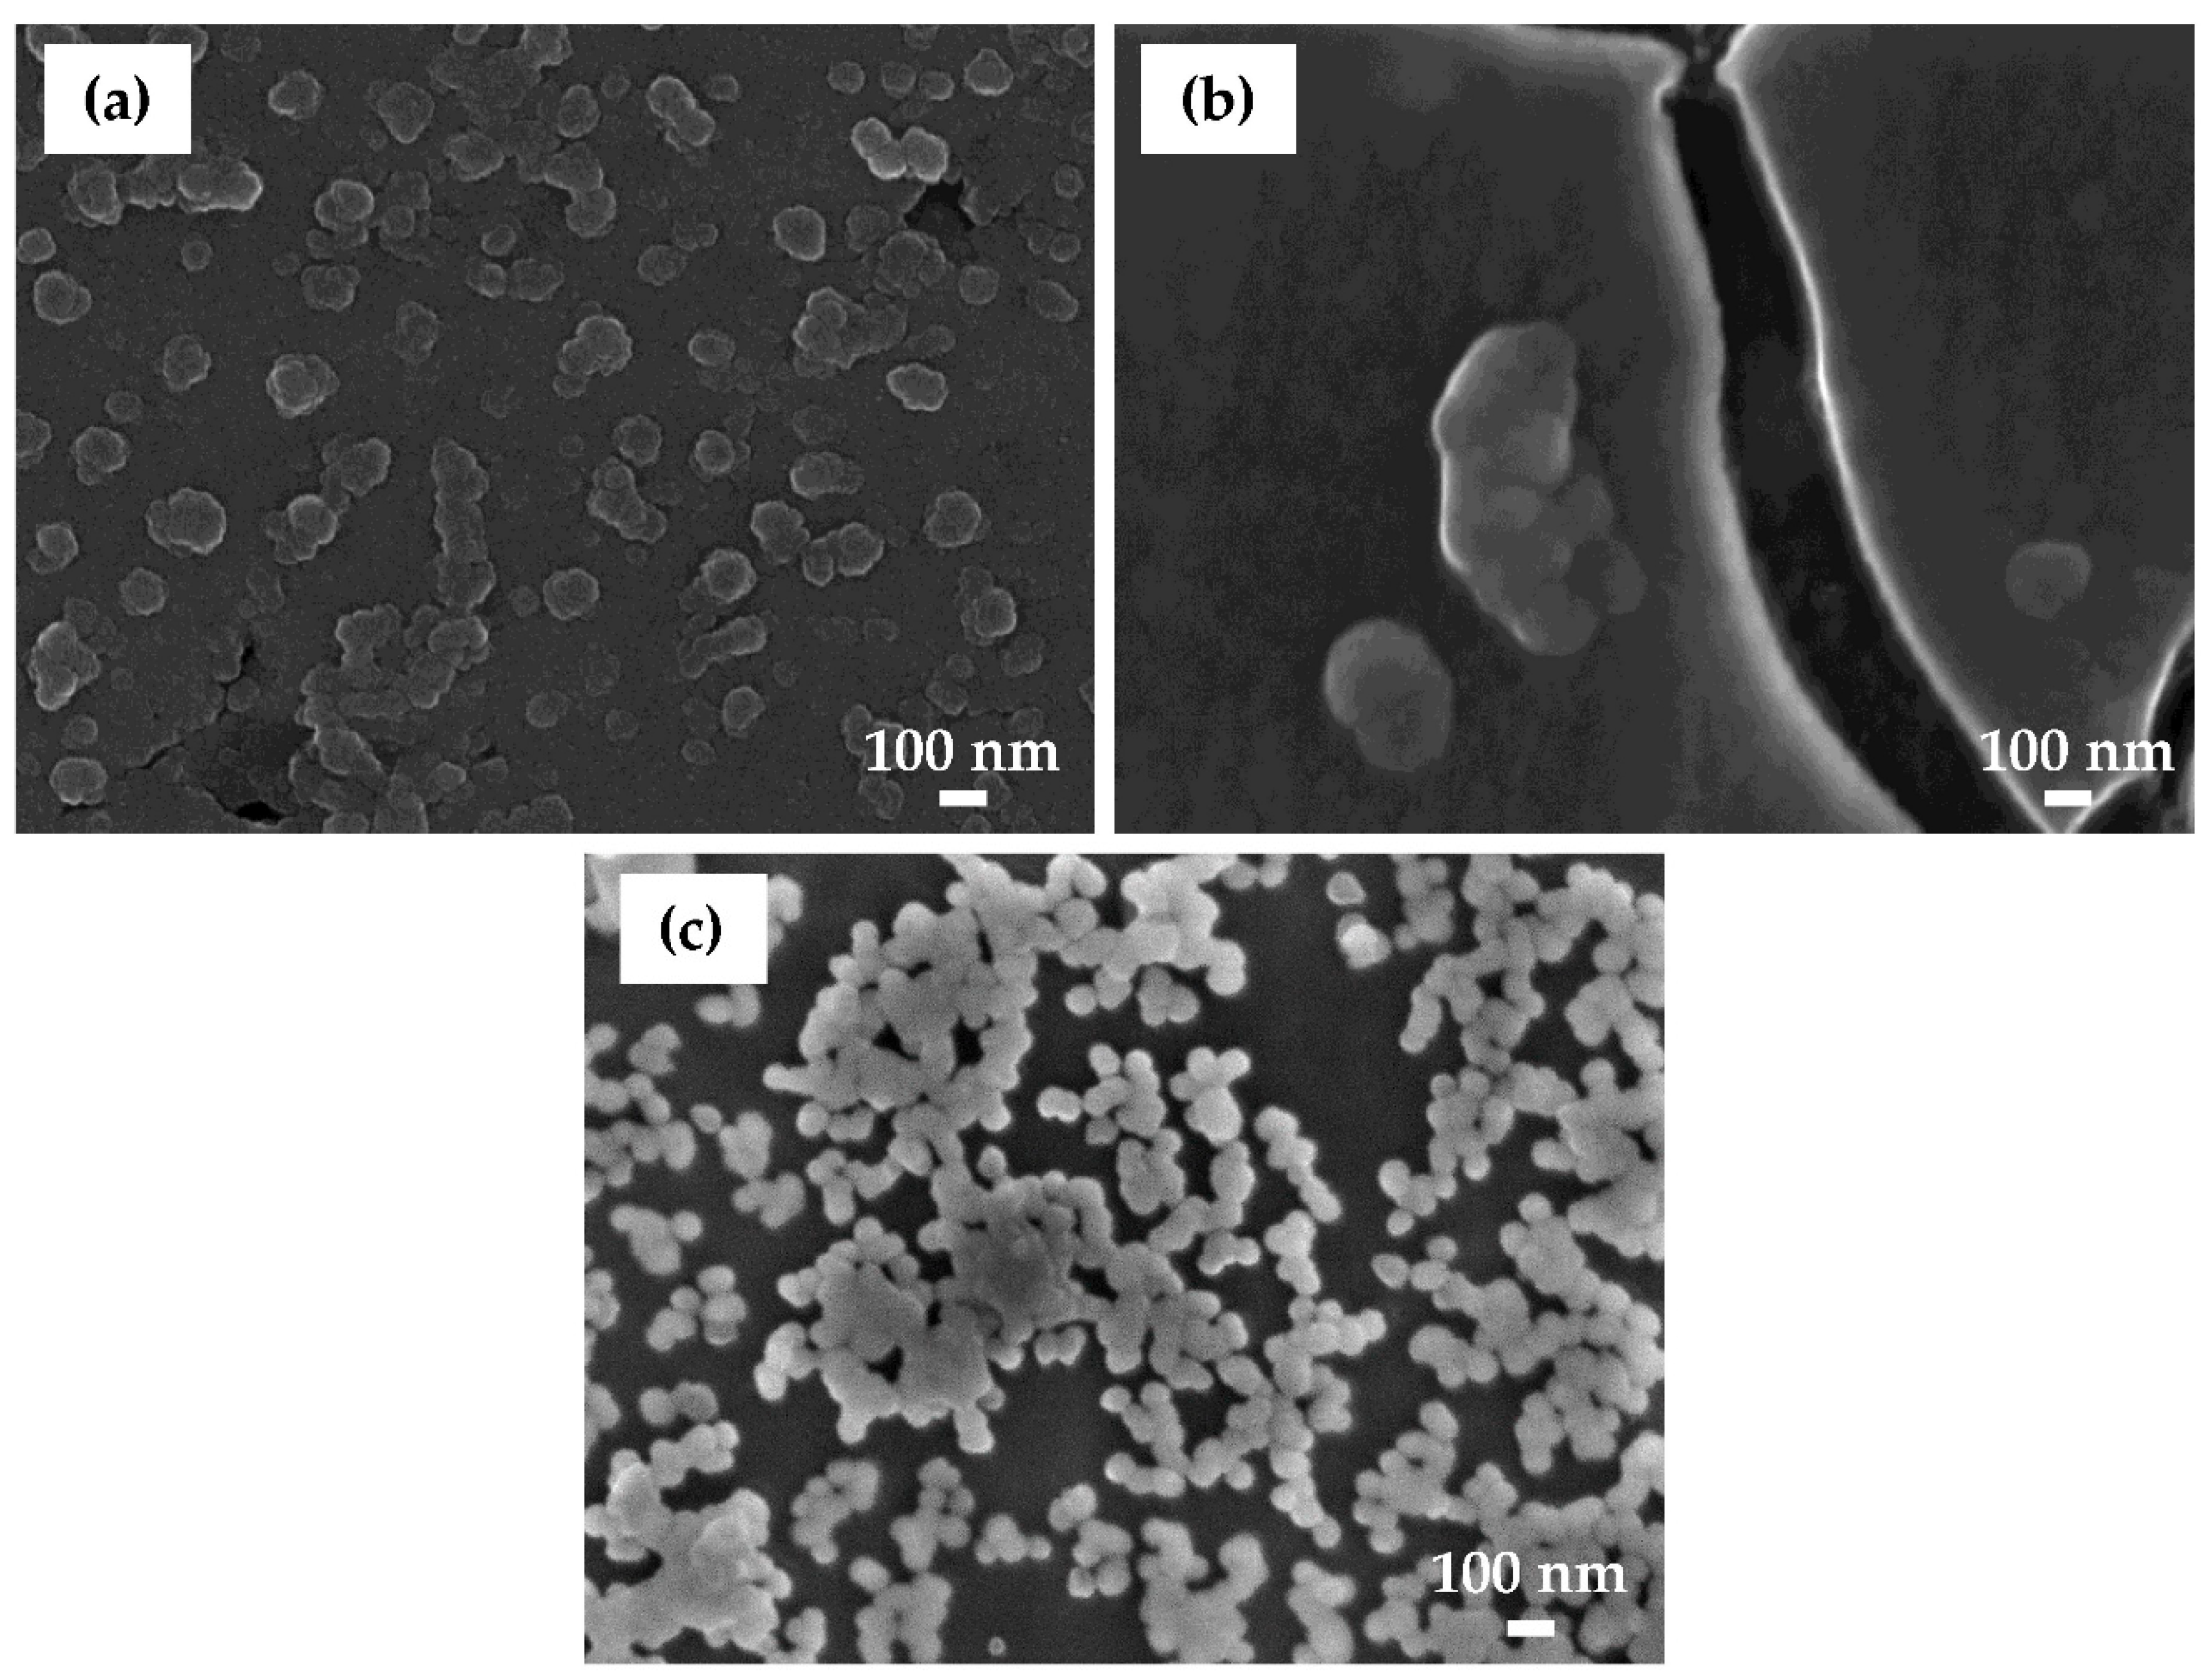
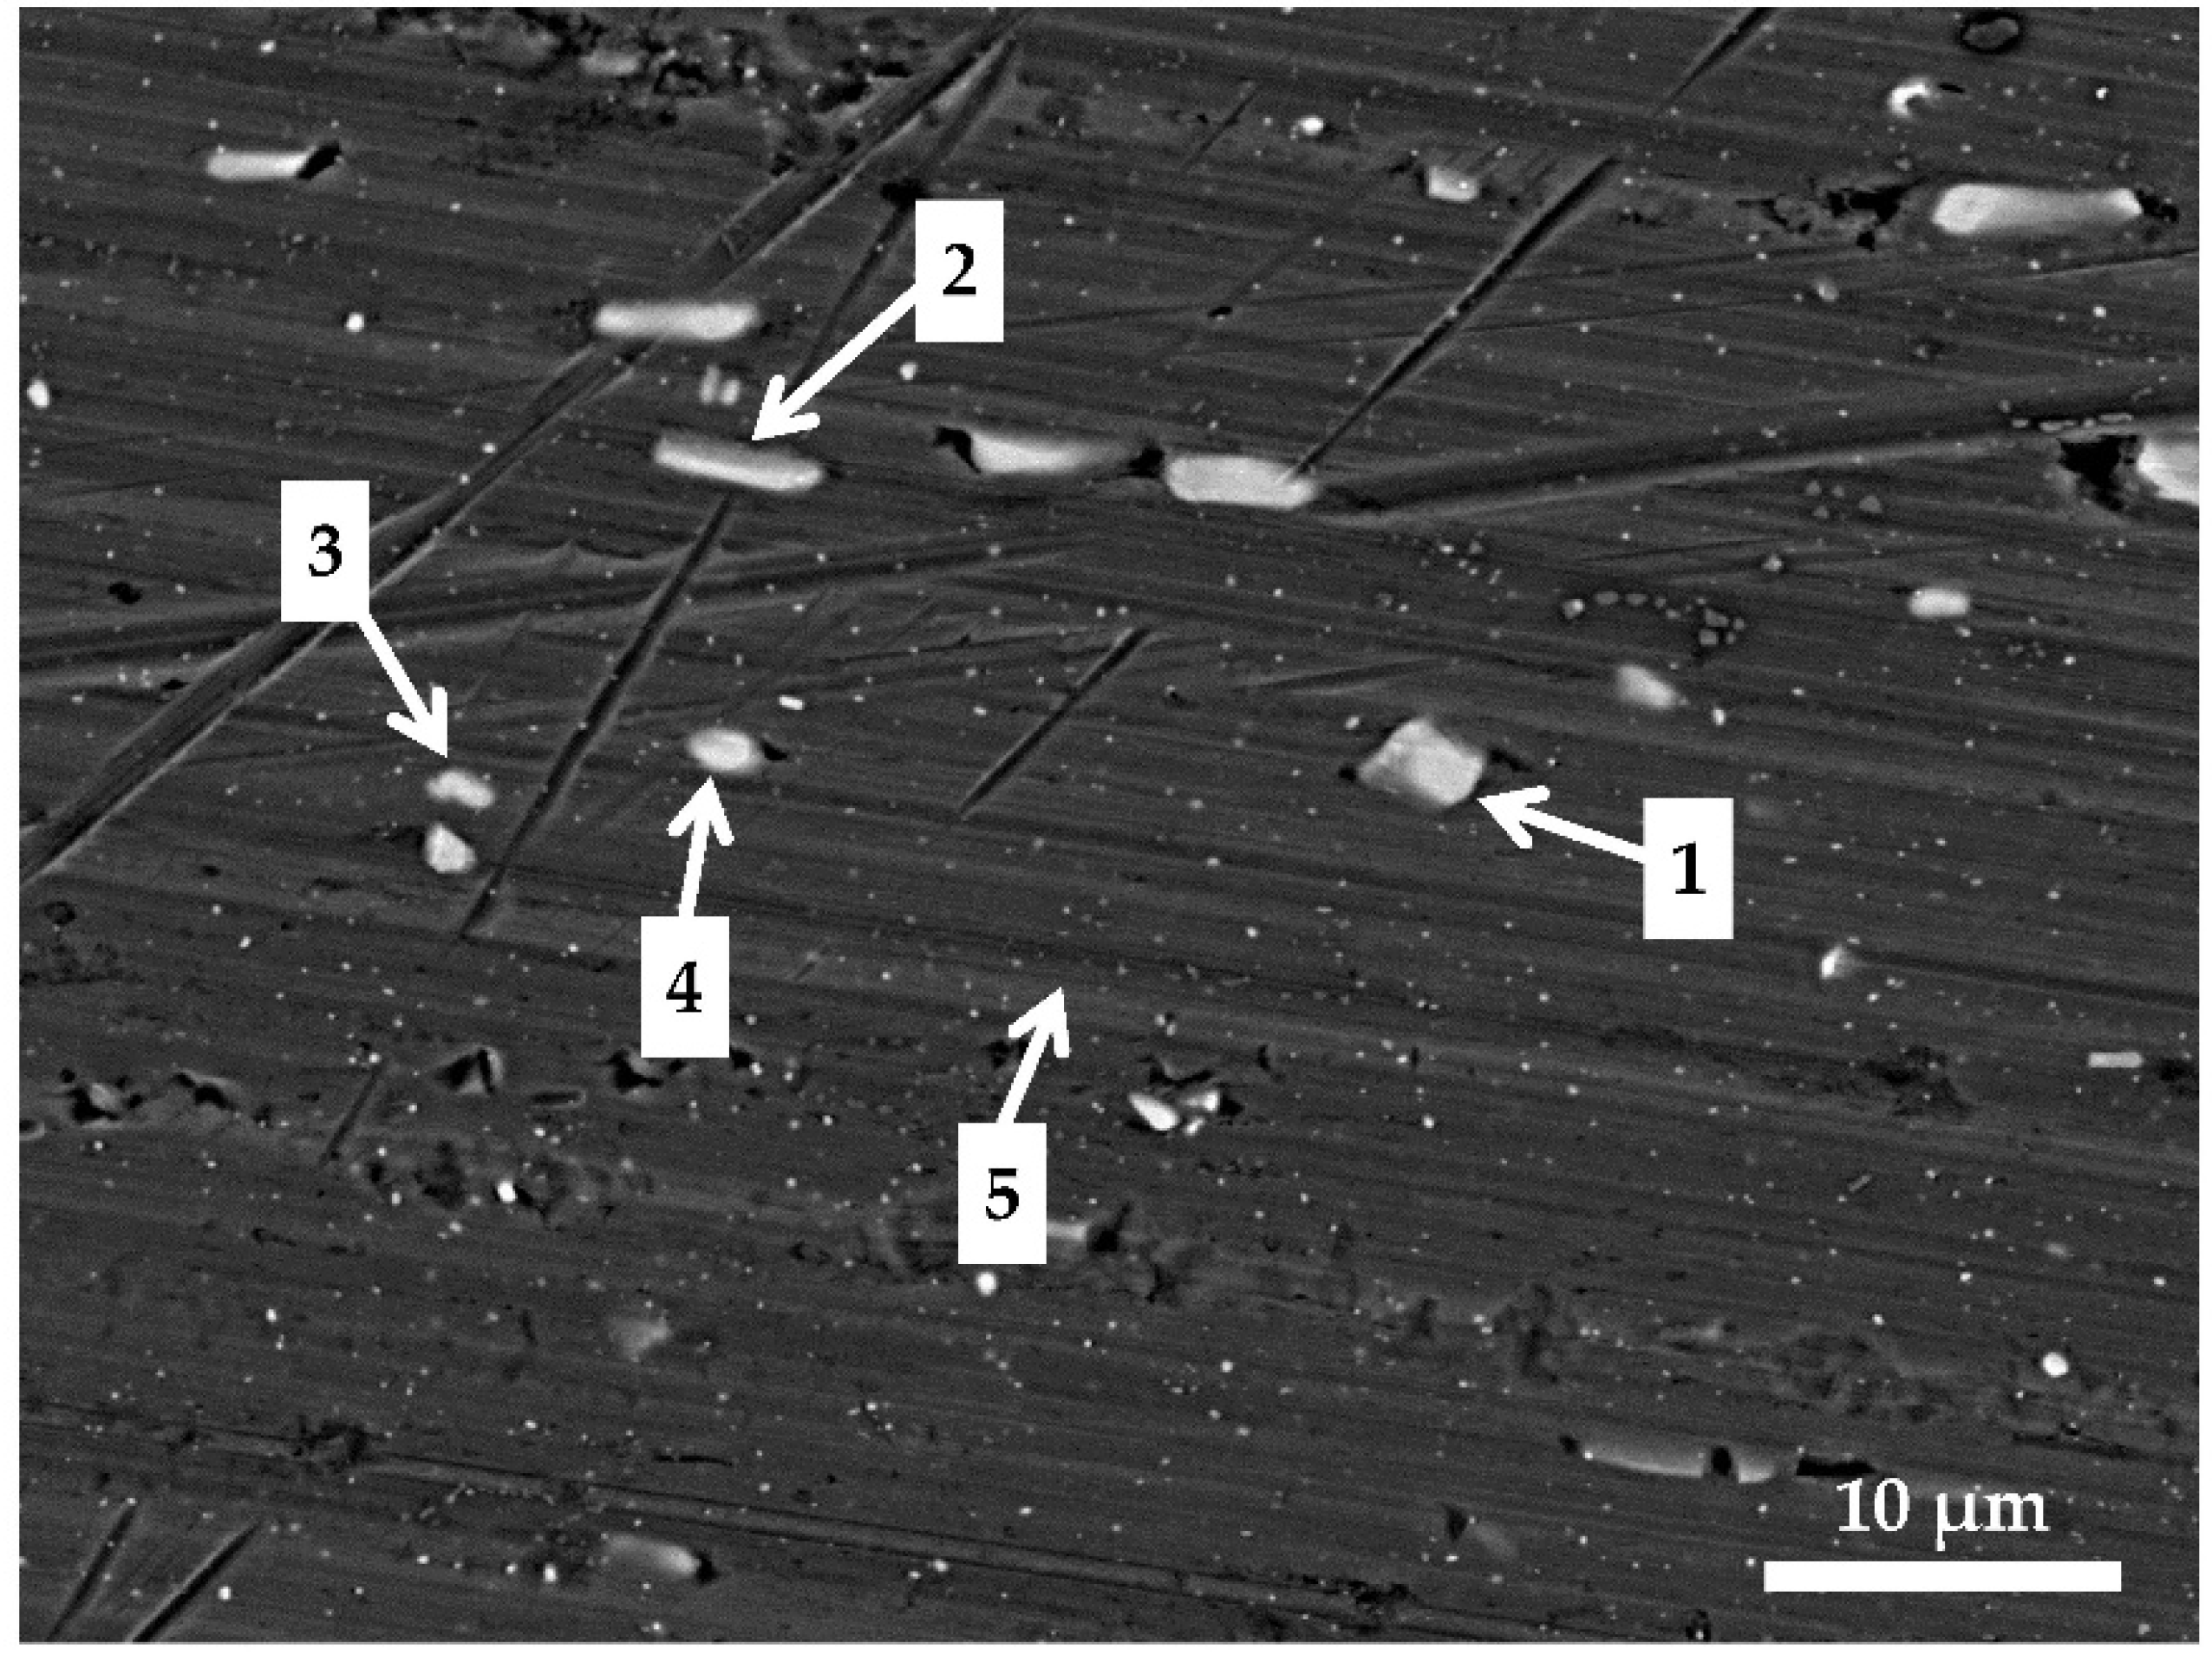
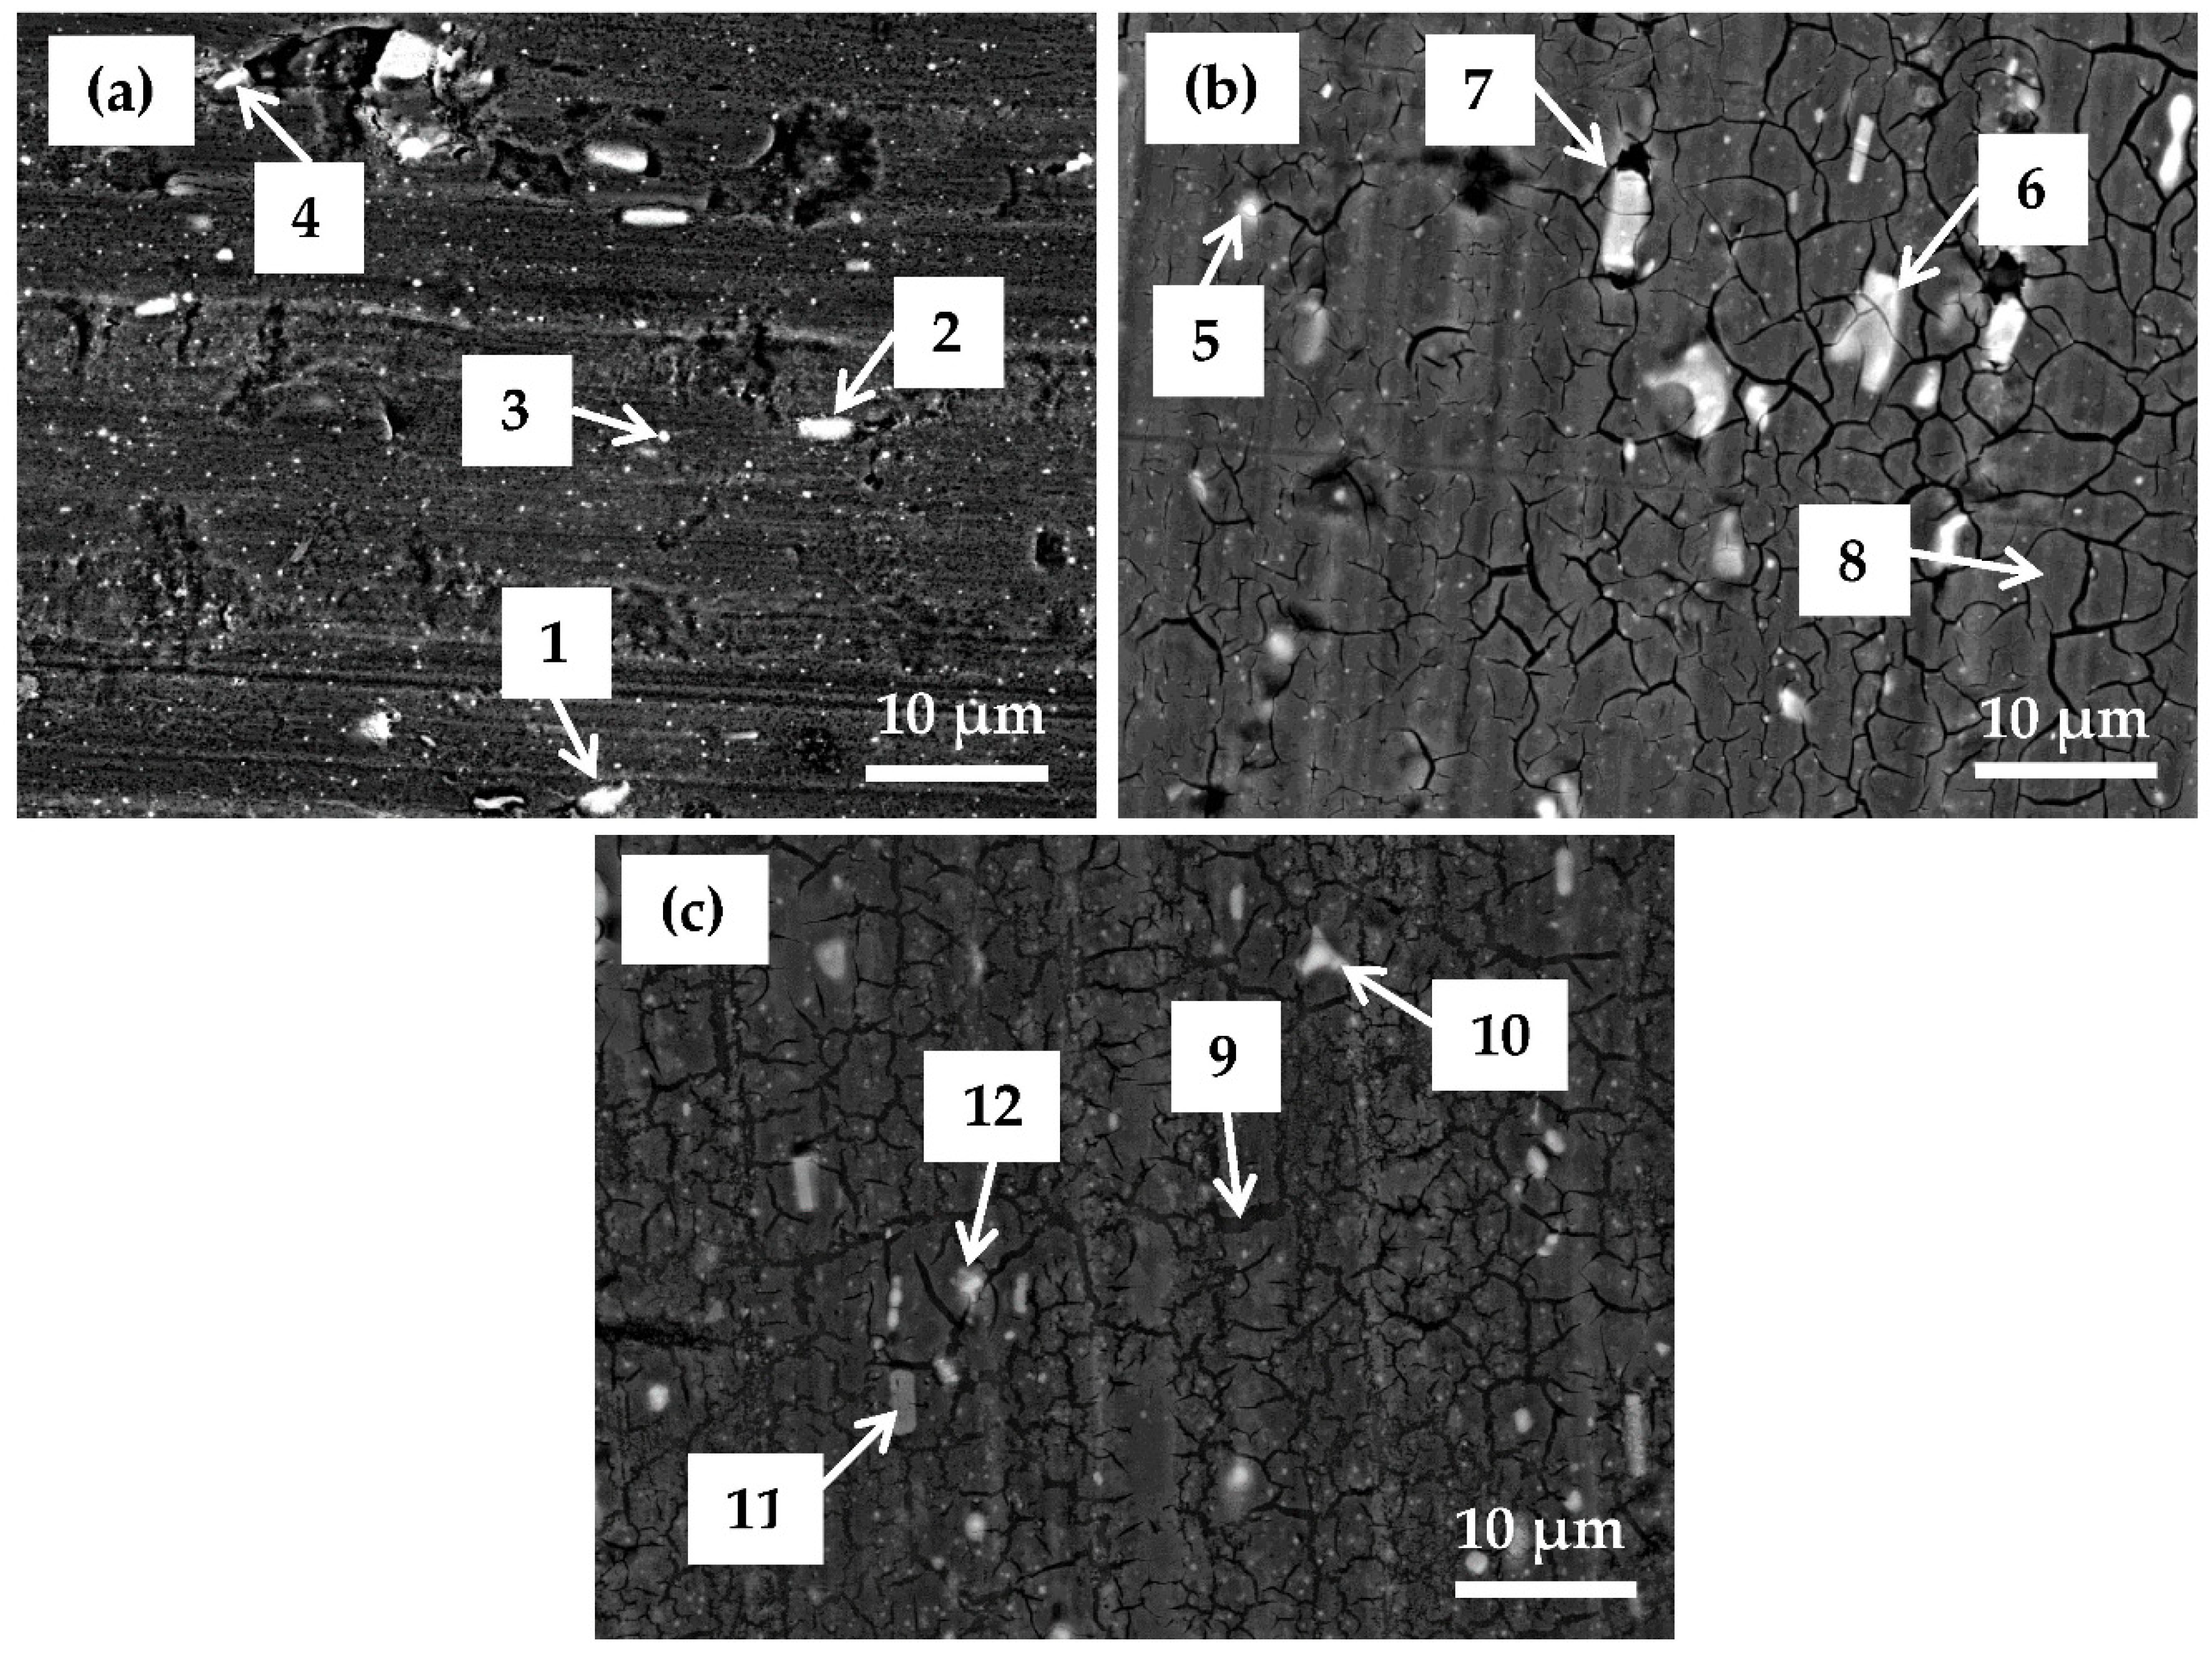
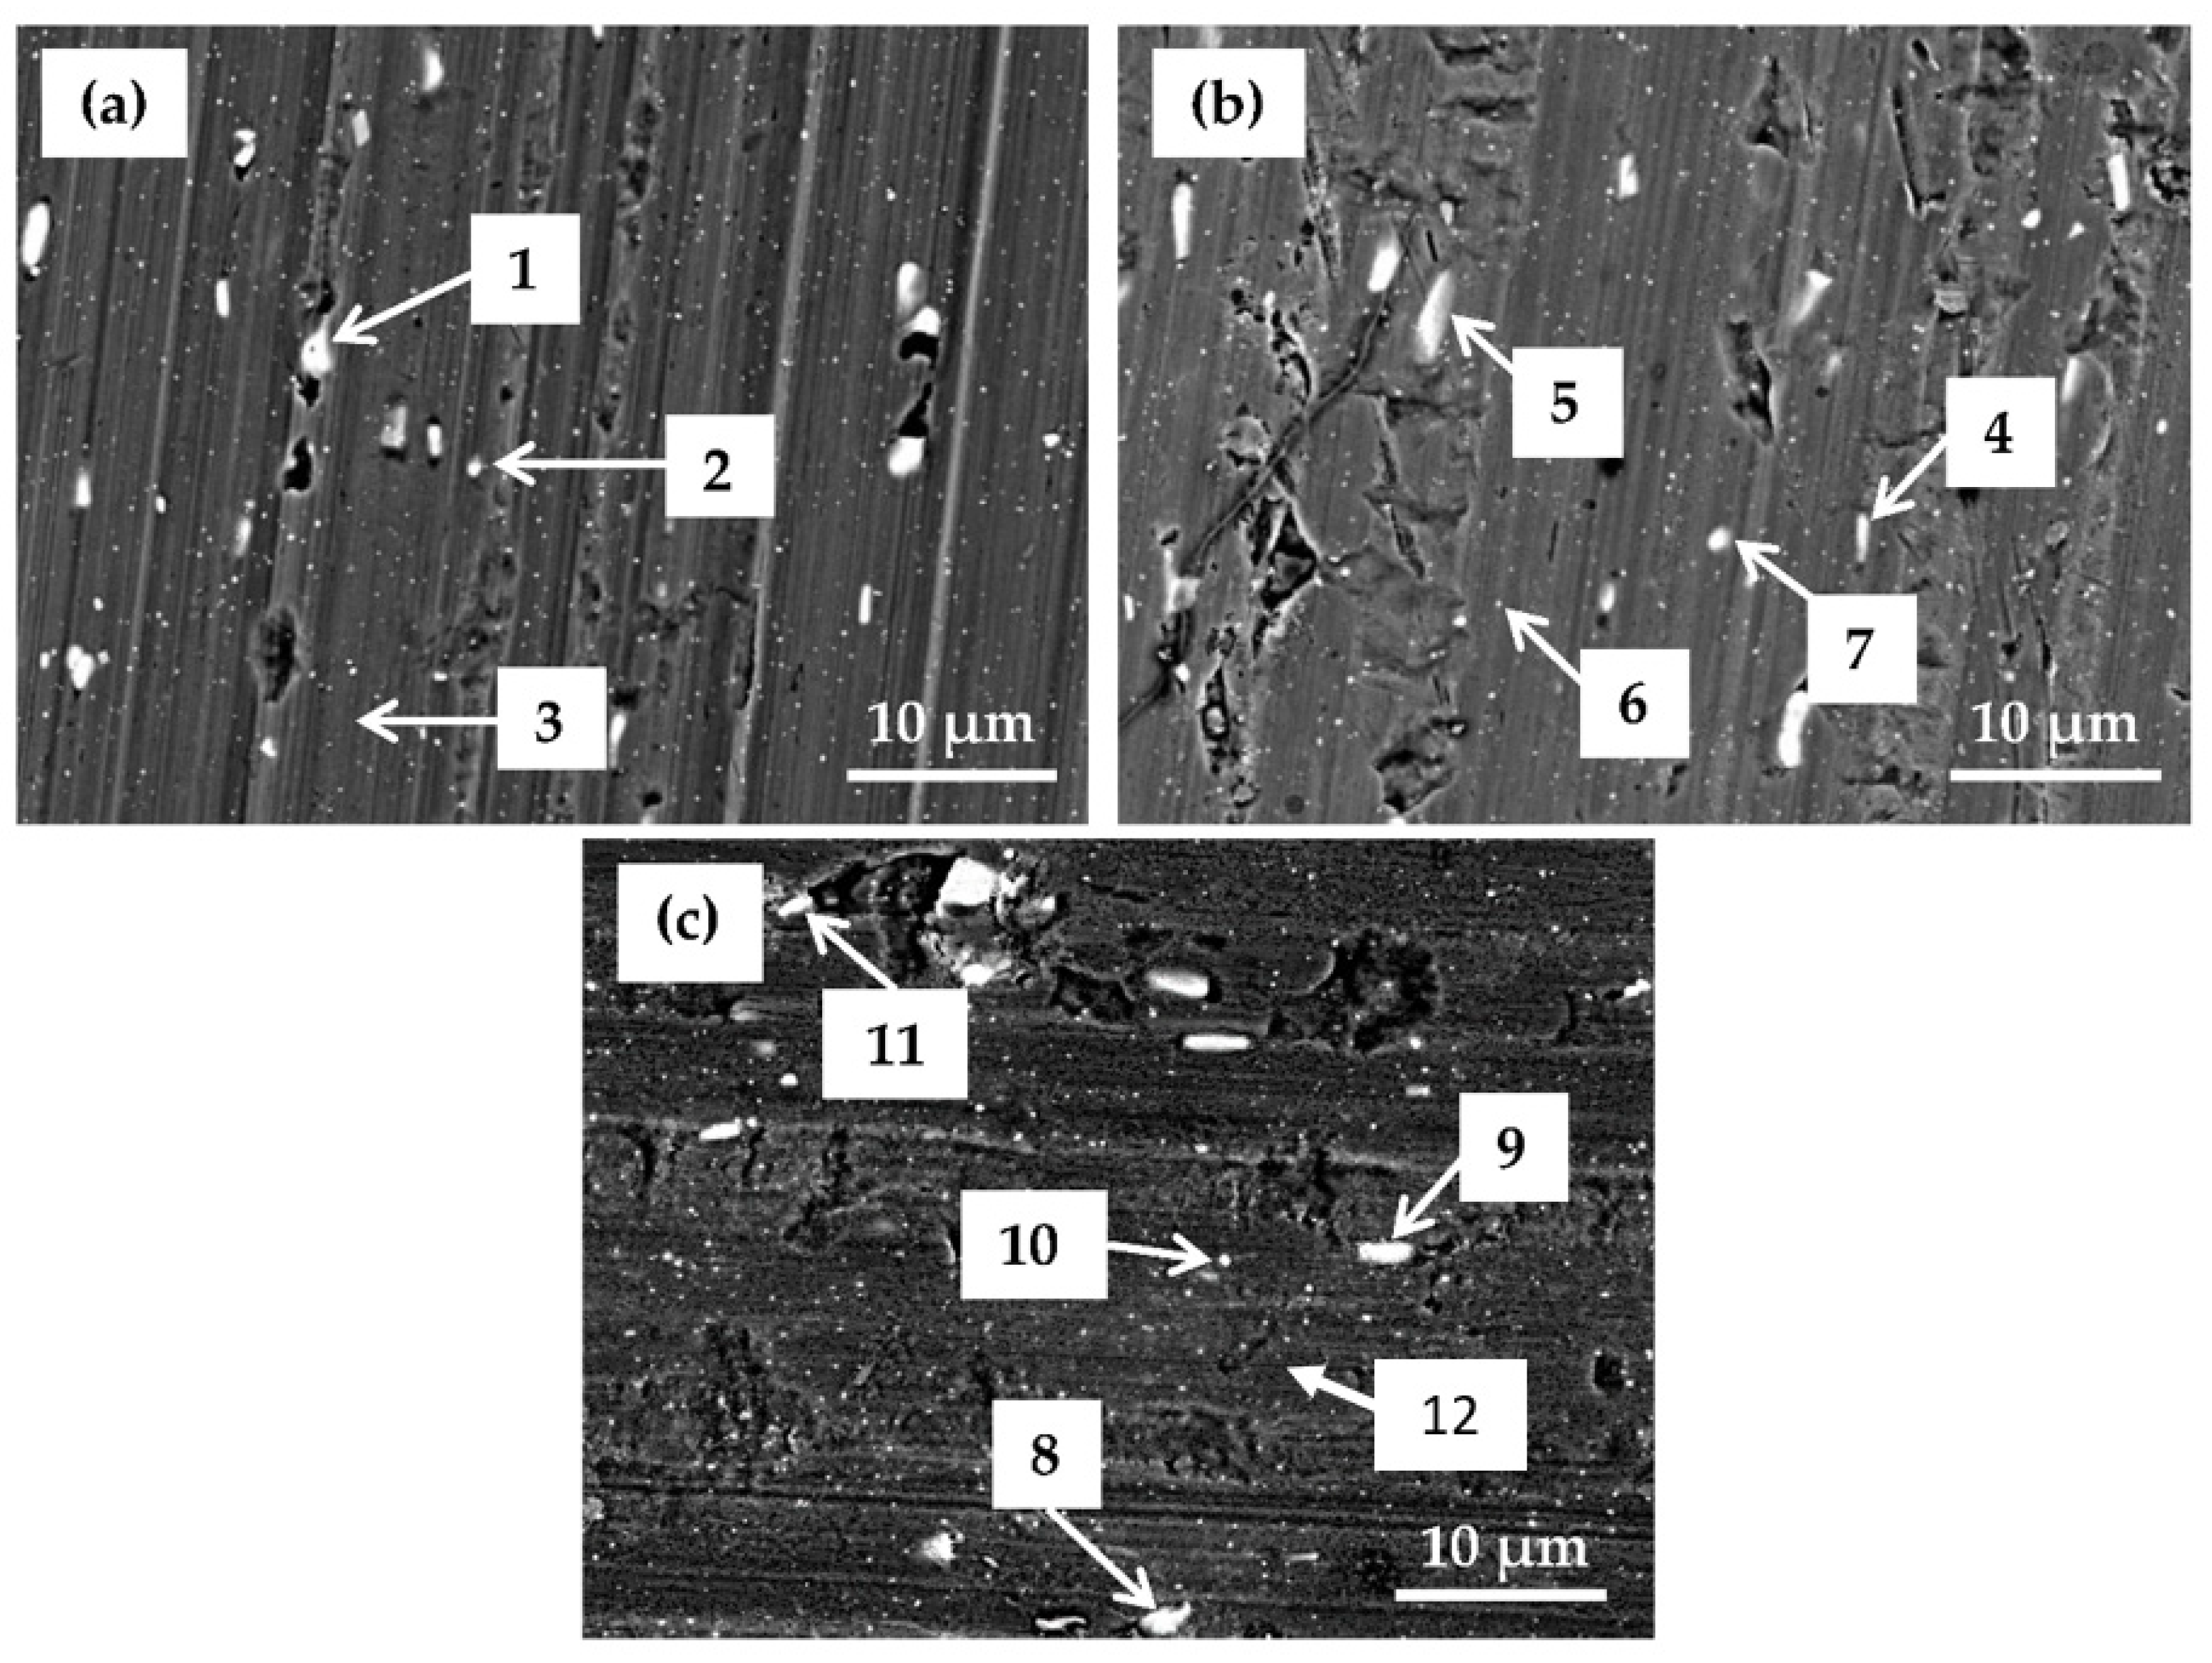
Samples prepared at selected conversion times were analyzed using SEM/EDS to investigate the morphology and composition of the coating as a function of conversion time. Related SEM/EDS analysis is given in
Figure 14 and
Table 7.
After 90 s conversion (
Figure 14a), the surface looked similar to the chemically pre-treated sample (
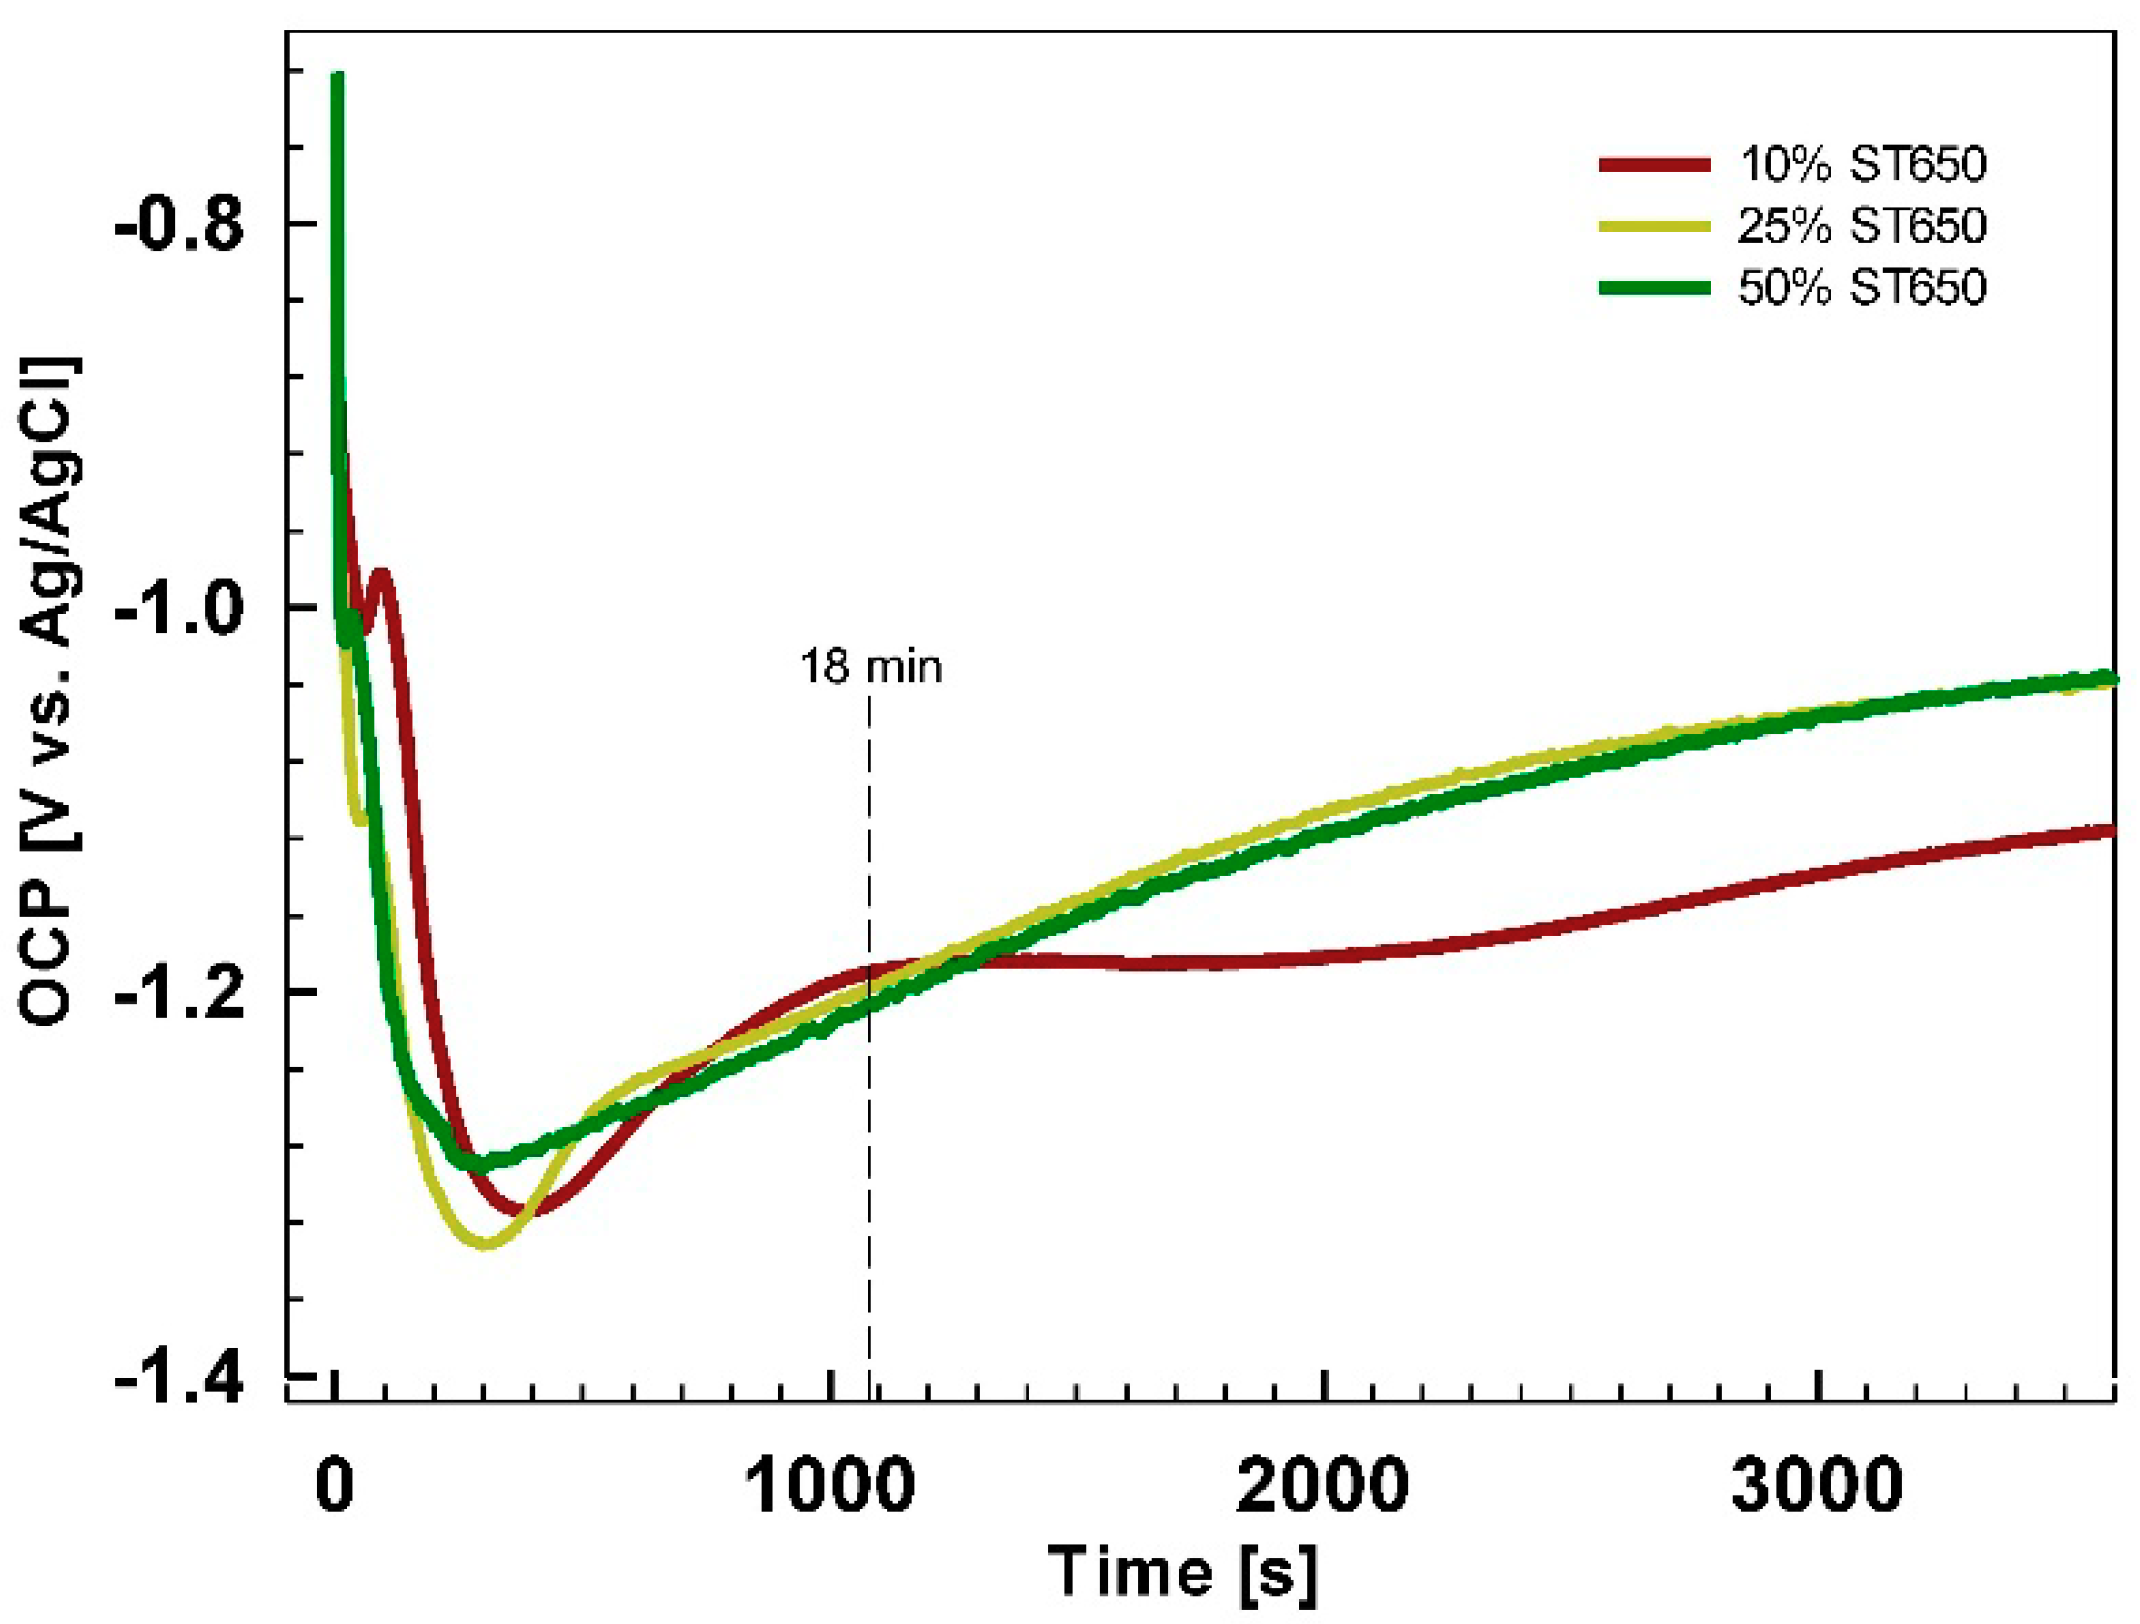
Figure 3). Two types of white particles were detected on this coated surface. EDS microanalysis showed that one type was Al(Mn, Fe) IMPs (Location 1) and the second was Al(Mn, Fe)Si (Location 2). The content of O was rather low. No F or Zr were detected. At Location 3, only the matrix appeared. These results indicate that after 90 s immersion, the conversion coating did not form, or that its thickness was too small to be detected by EDS. It can be concluded that the potential peak observed after 90 s conversion at ~−1.0 V (
Figure 5) was not related to coating formation but maybe to the oxidation of some chemical present in the bath. At Location 3, only Al was detected.
After conversion for 11 min (
Figure 14b), a significant change in the surface composition took place: the contents of alloying elements Fe and Mn were smaller, the content of O was larger, and F, Cr and Zr were detected (
Table 7). Increased O, F, Cr and Zr contents relate to the increased formation of oxides and fluorides. The coating was still not clearly visible in SEM. After conversion for 18 min (
Figure 14c), however, the surface morphology changed; the IMPs were visible underlying the coating, indicating the formation of coating throughout the sample surface, i.e., at alloy matrix and at intermetallic particles. The concentrations of O, Cr and Zr were similar as after 11 min (
Figure 14c,
Table 7). IMP at Location 8 in comparison with other IMPs contained 0.2 at.% S. The highest ratio of Zr/Cr was obtained at Location 10 (~3.7). Elements Zr and Cr originating from the coatings were detected at the alloy matrix as well (Location 12). Therefore, coatings were deposited throughout the surface, but preferentially at intermetallic particles.
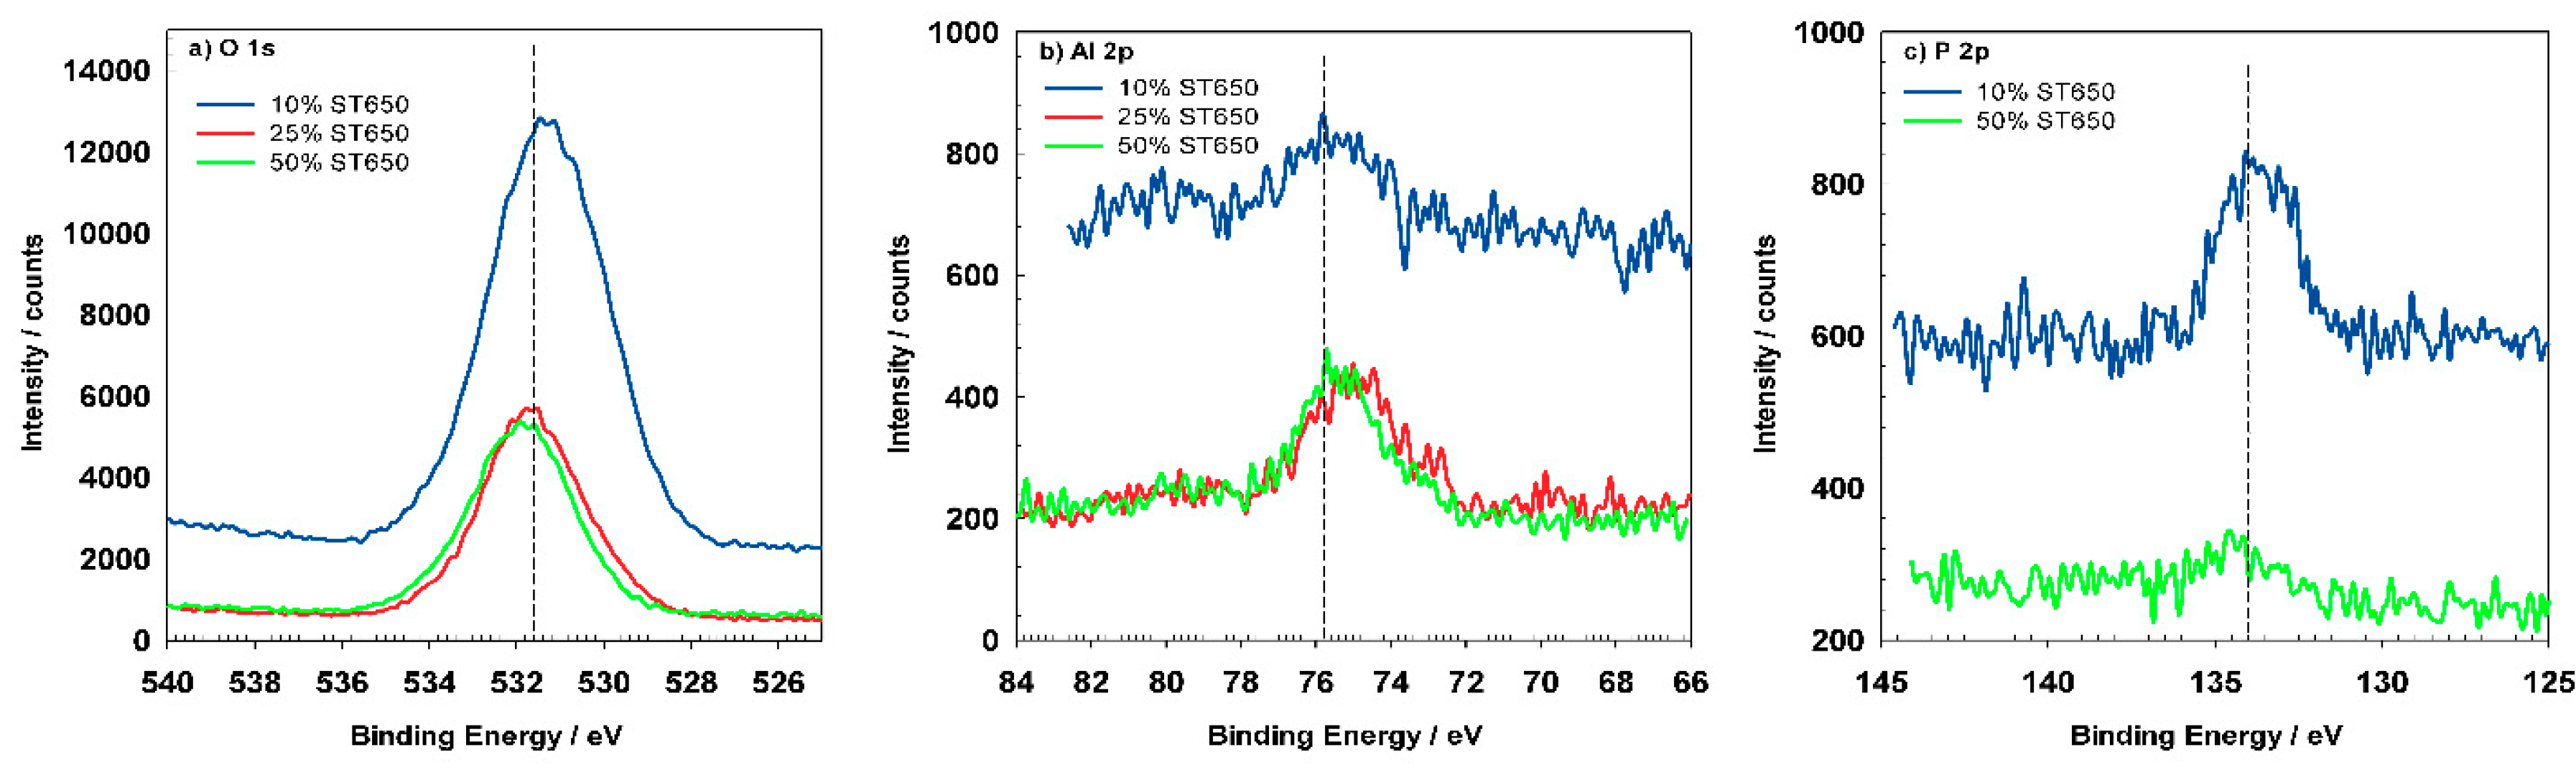
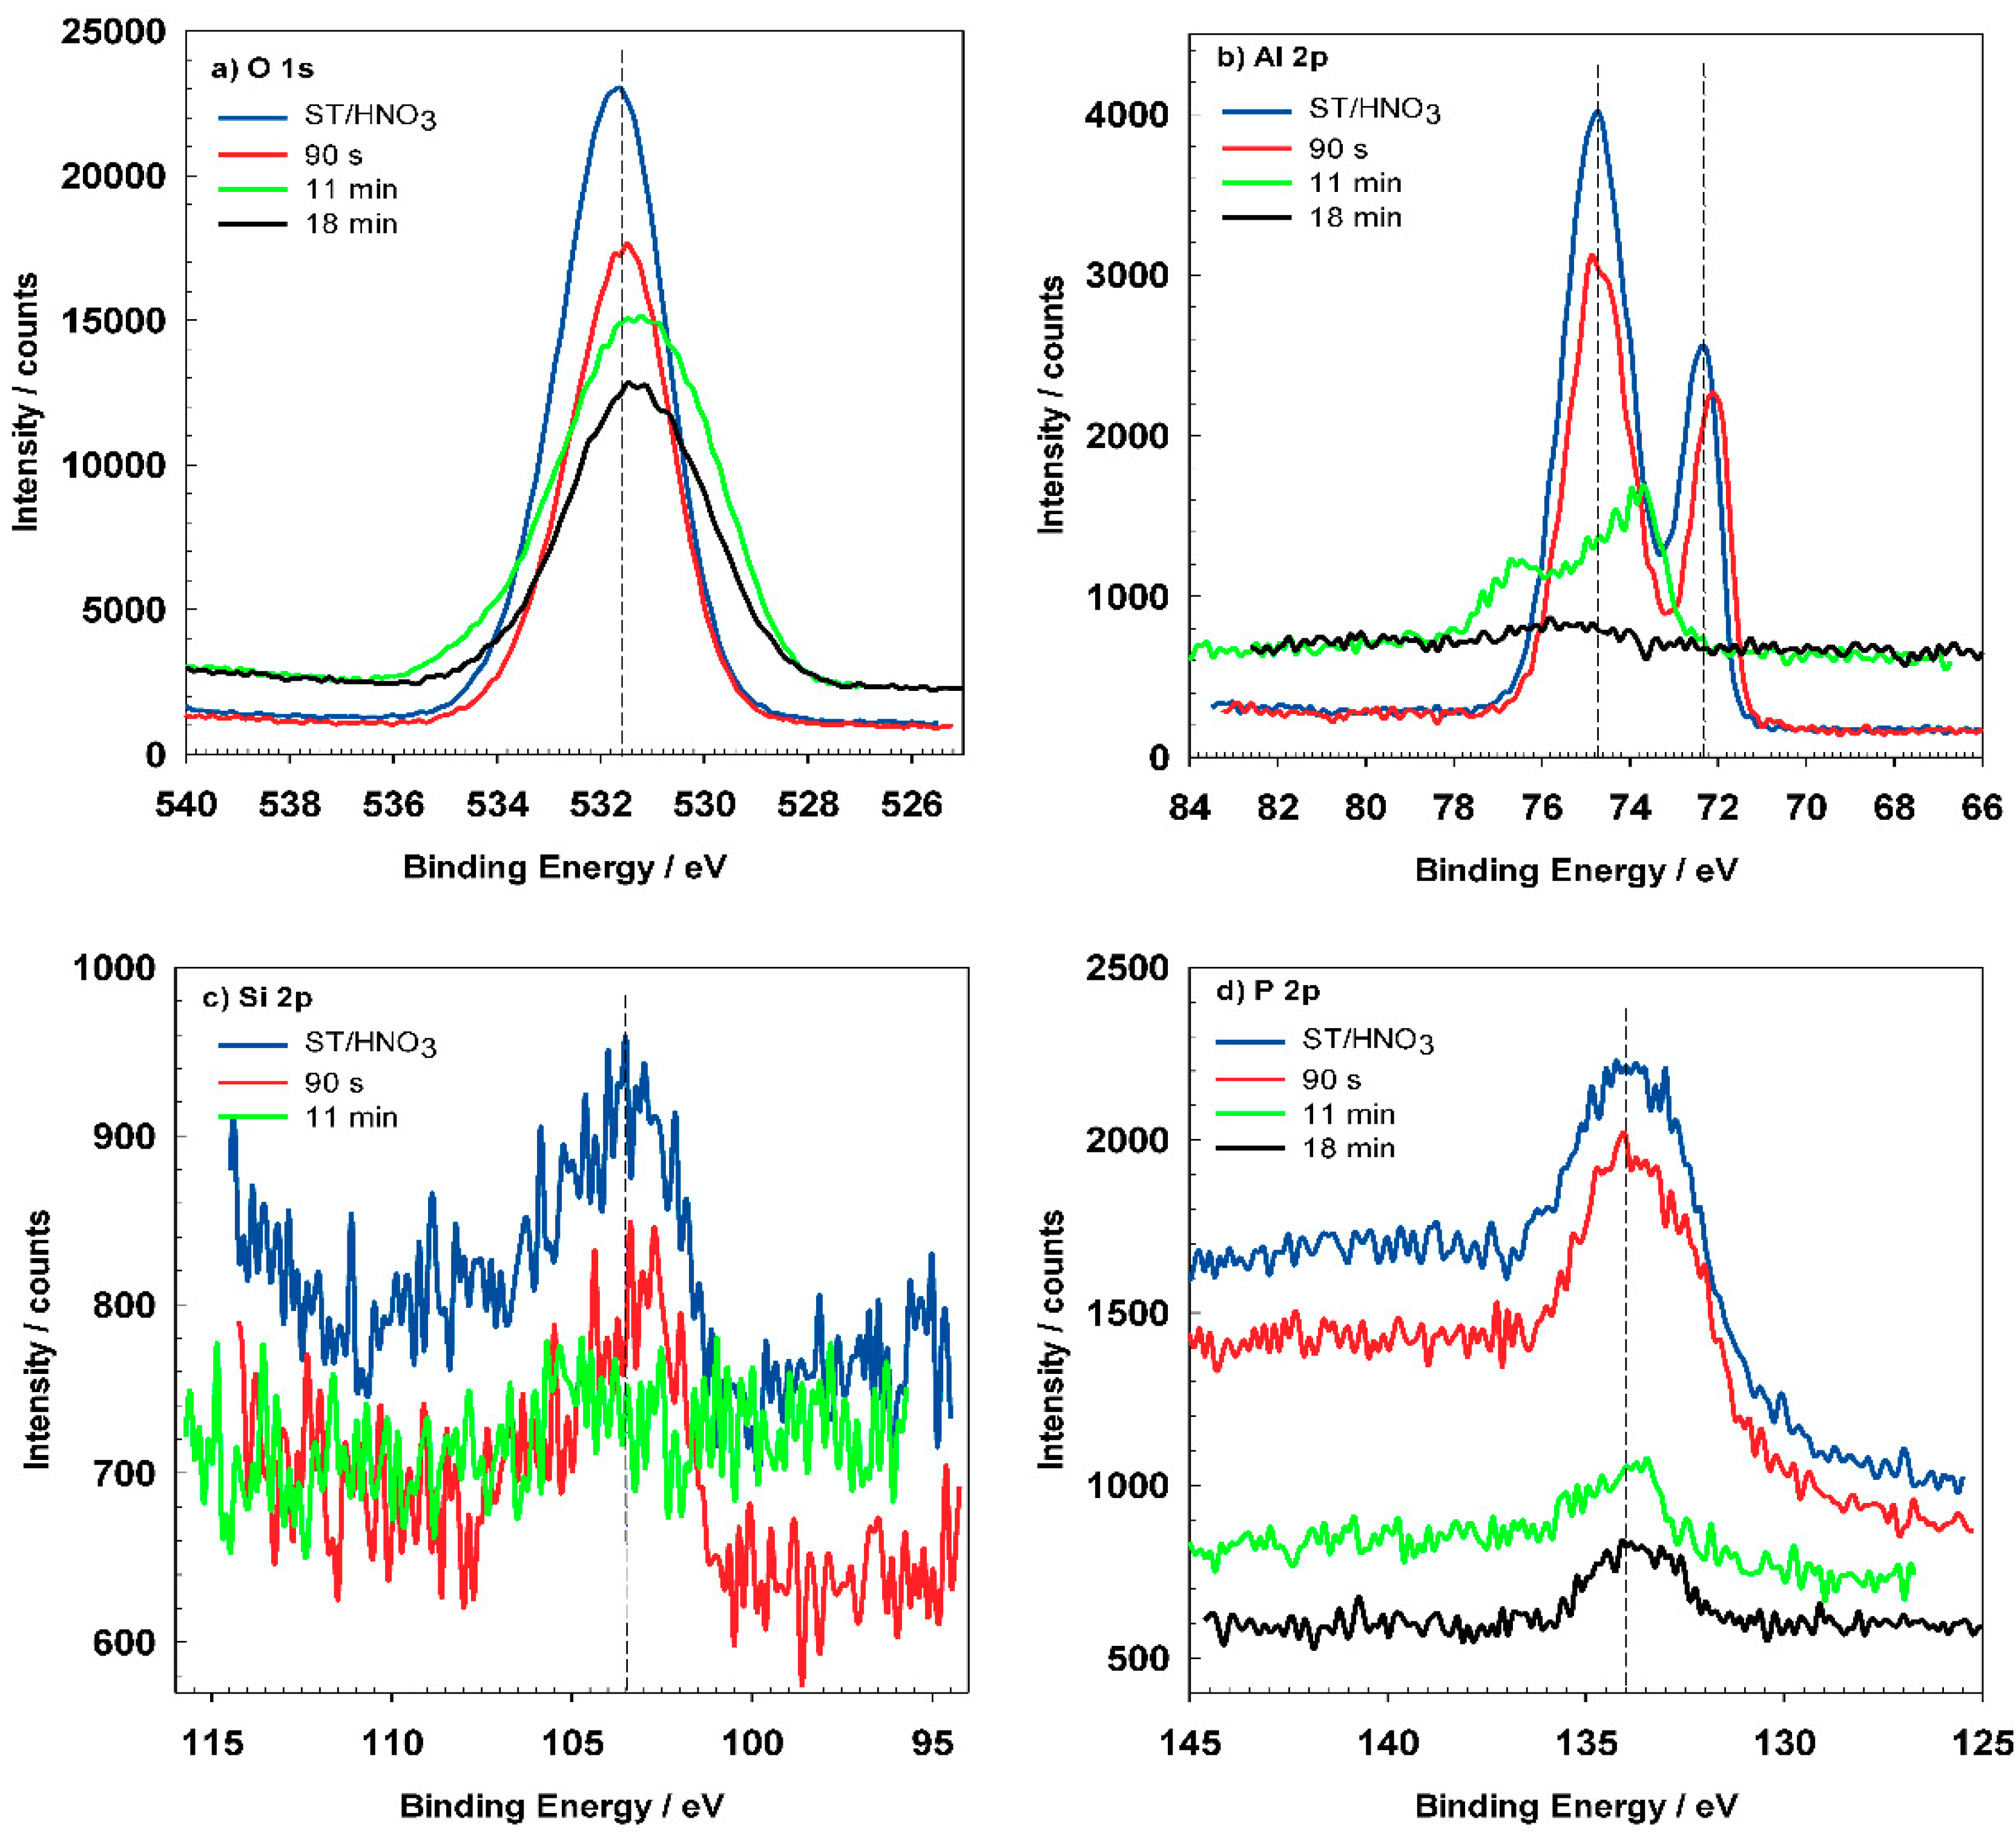
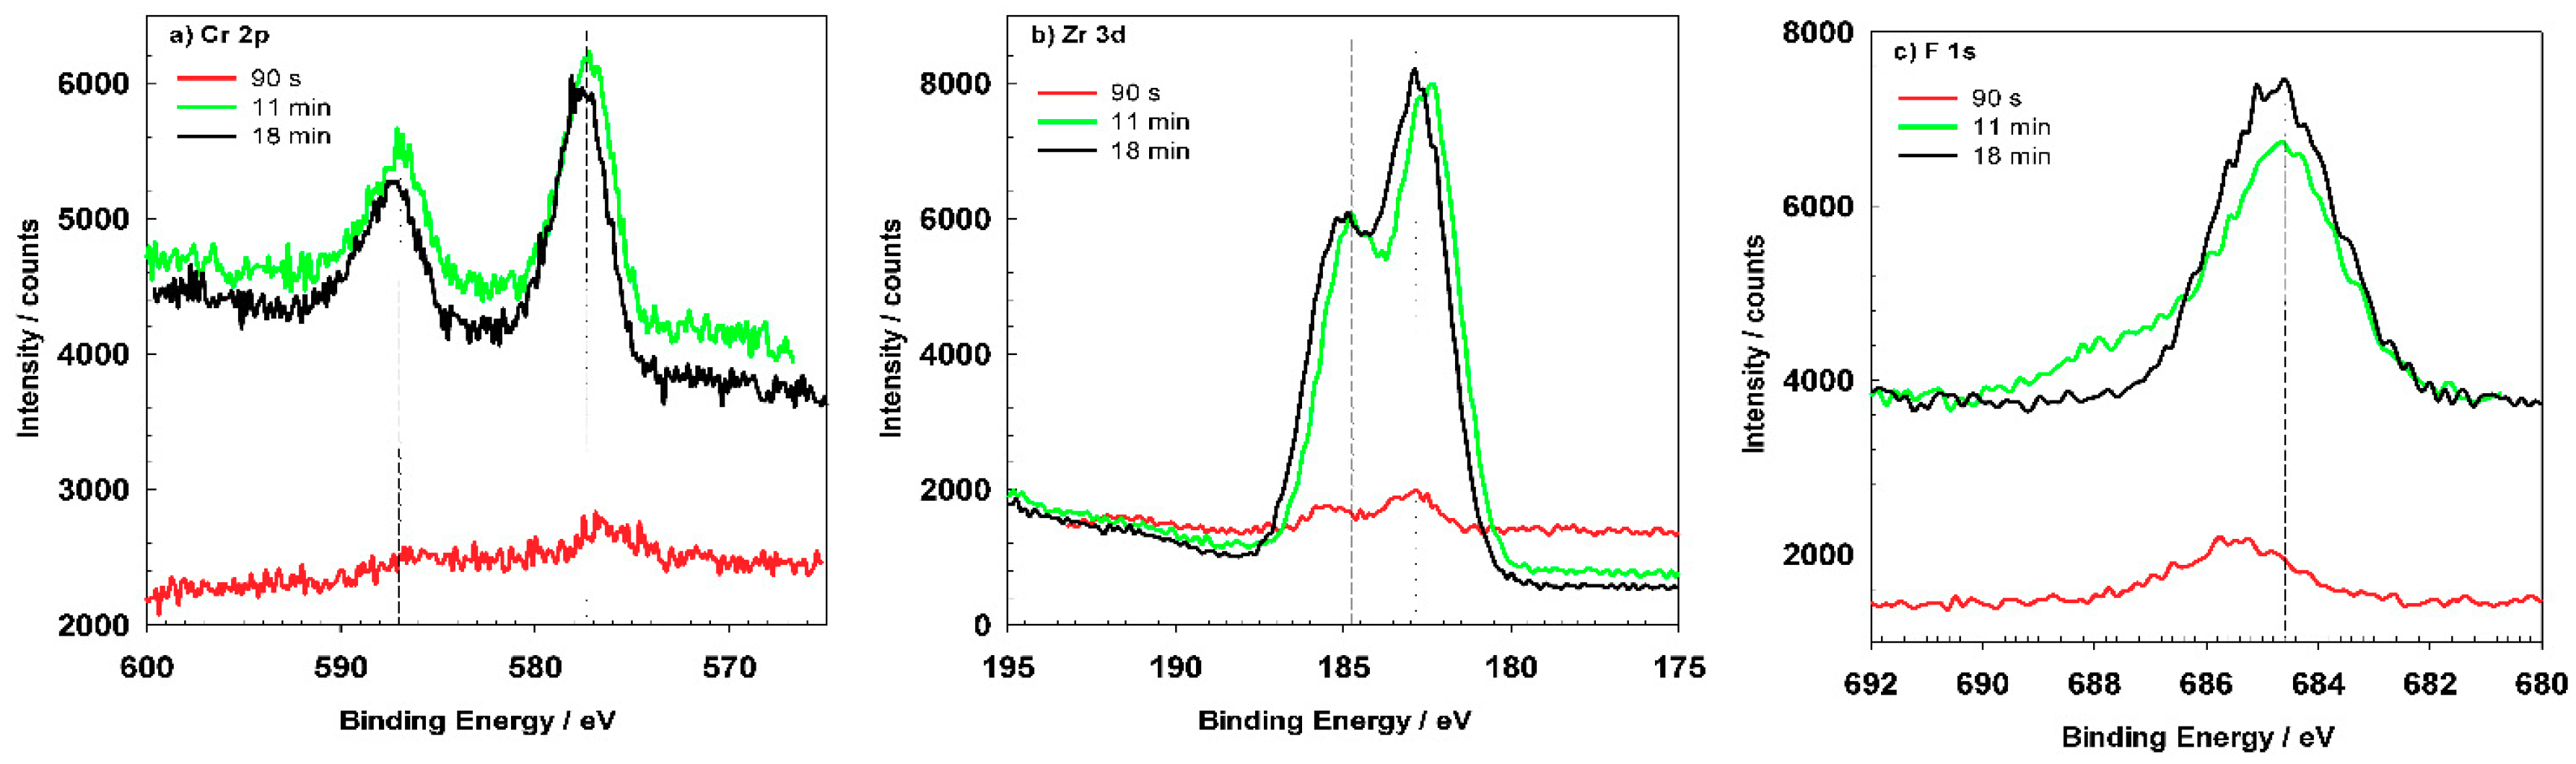
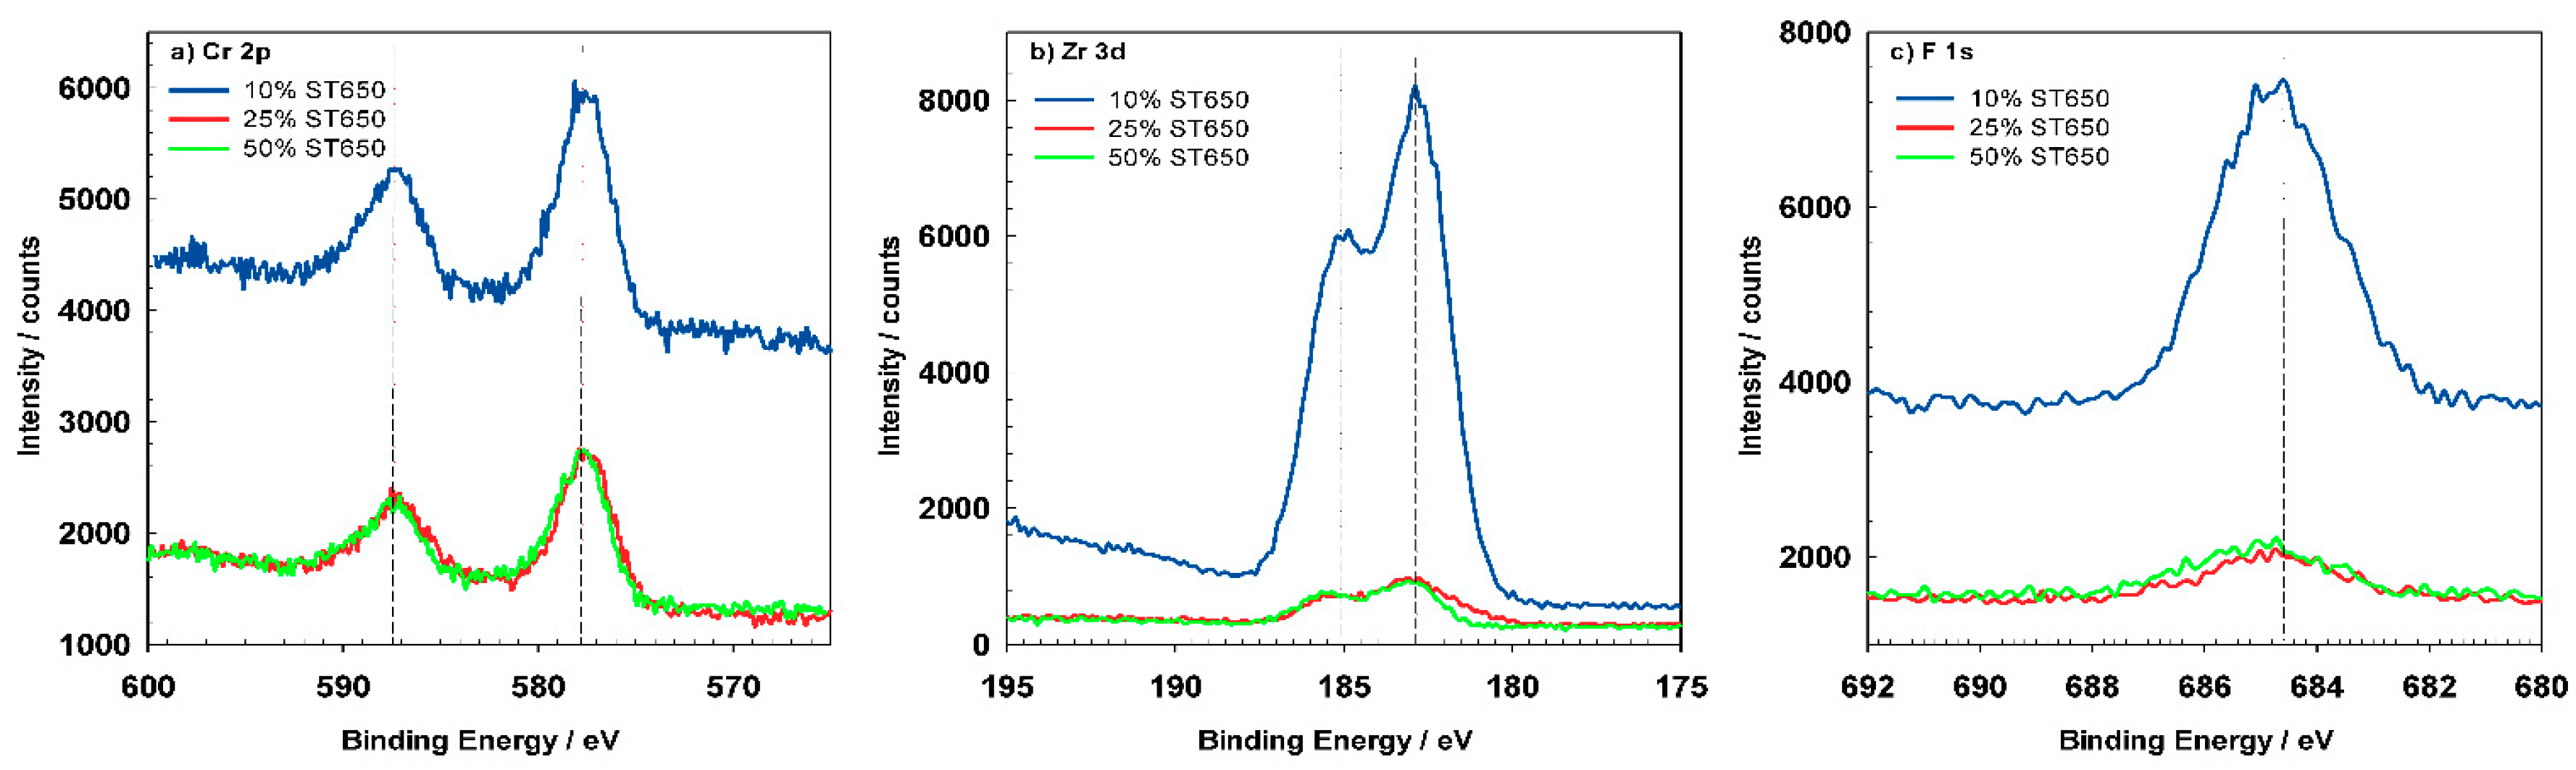
XPS spectra were recorded on chemically pre-treated AA3003 sample without the conversion coating and for ST650-coated AA3003 after various conversion times (
Figure 15 and
Figure 16). The composition of the surface deduced from survey spectra is given in
Table 8. The composition of sample ST/HNO
3 as determined from the XPS survey spectrum, includes the following elements: O, Al, Si and P. Al and O denote the formation of Al oxide, Si originates from the alloy and P originates from the chemical pre-treatment. After immersion in conversion bath ST650, the contents of Si, P and especially of Al, were reduced. In contrast, the content of Cr, Zr and F increased with a longer time immersion. Cr, Zr and F were not present on the pre-treated surface ST/HNO
3 and originate from conversion coating. With increasing conversion time, the Zr/Cr ratio increased from <1 to 9, the lowest being for 90 s. At the same time the ratio O/F decreased, indicating an increase content of F at longer conversion times. The Cr content on the surface after 11 and 18 min immersion was
cca. 2.5 times smaller than the Zr content (
Table 8). It is therefore reasonable to consider conversion coating ST650 to be a zirconate film that contains Cr [
7,
32], as will also be proven by high-resolution spectra (
Figure 15 and
Figure 16).
Figure 15a depicts high-resolution peaks for O
1s which is centered at 531.5 eV and corresponds to the hydrated Al oxide. Coated samples show similar position of the O
1s peak but the shape of the peak became broader, indicating that was composed of several oxides, i.e., Al, Cr, and Zr. The Al
2p spectrum (
Figure 15b) for pre-treated AA3003 consist of two peaks at 72.3 eV and 74.8 eV characteristic for Al metal and oxidized Al [
15]. After immersion in the conversion bath for 90 s, the Al
2p peaks slightly shifted but the shape and Al content remained similar (
Figure 15b). This indicates that the coating formation had just started and that it had not yet covered the Al surface (see
Figure 16a,b). For the sample prepared for 11 min, Al the peaks were reduced, and diminished after 18 min (
Table 8).
Figure 15c represents the Si
2p peak located at 103.4 eV, which was in accordance with the presence of SiO
2 [
33]. It became negligible due to coverage of conversion coating. The intensity of P
2p peak was also smaller for coated samples (
Figure 15d). Its position at 133.8 eV can be related to phosphate present in the cleaning agent [
33].
The most important elements related to conversion coatings are Cr and Zr (
Figure 16). Cr, Zr and F could not be detected for coatings prepared at 90 s but only after longer conversion times. The shape of the spectra appears to be similar after 11 and 18 min, but the content of these elements increased for longer immersion times, consistent with the postulated mechanism of increased coating thickness with potential approaching the OCP vs.
t plateau (
Figure 5). Spectra for O
1s, Cr
2p, Zr
3d and F
1s recorded for coating prepared at 18 min conversion time were deconvoluted using selected component sub-peaks. Details on parameters used for deconvolution of experimental spectra are given in
Appendix B (
Table A3).
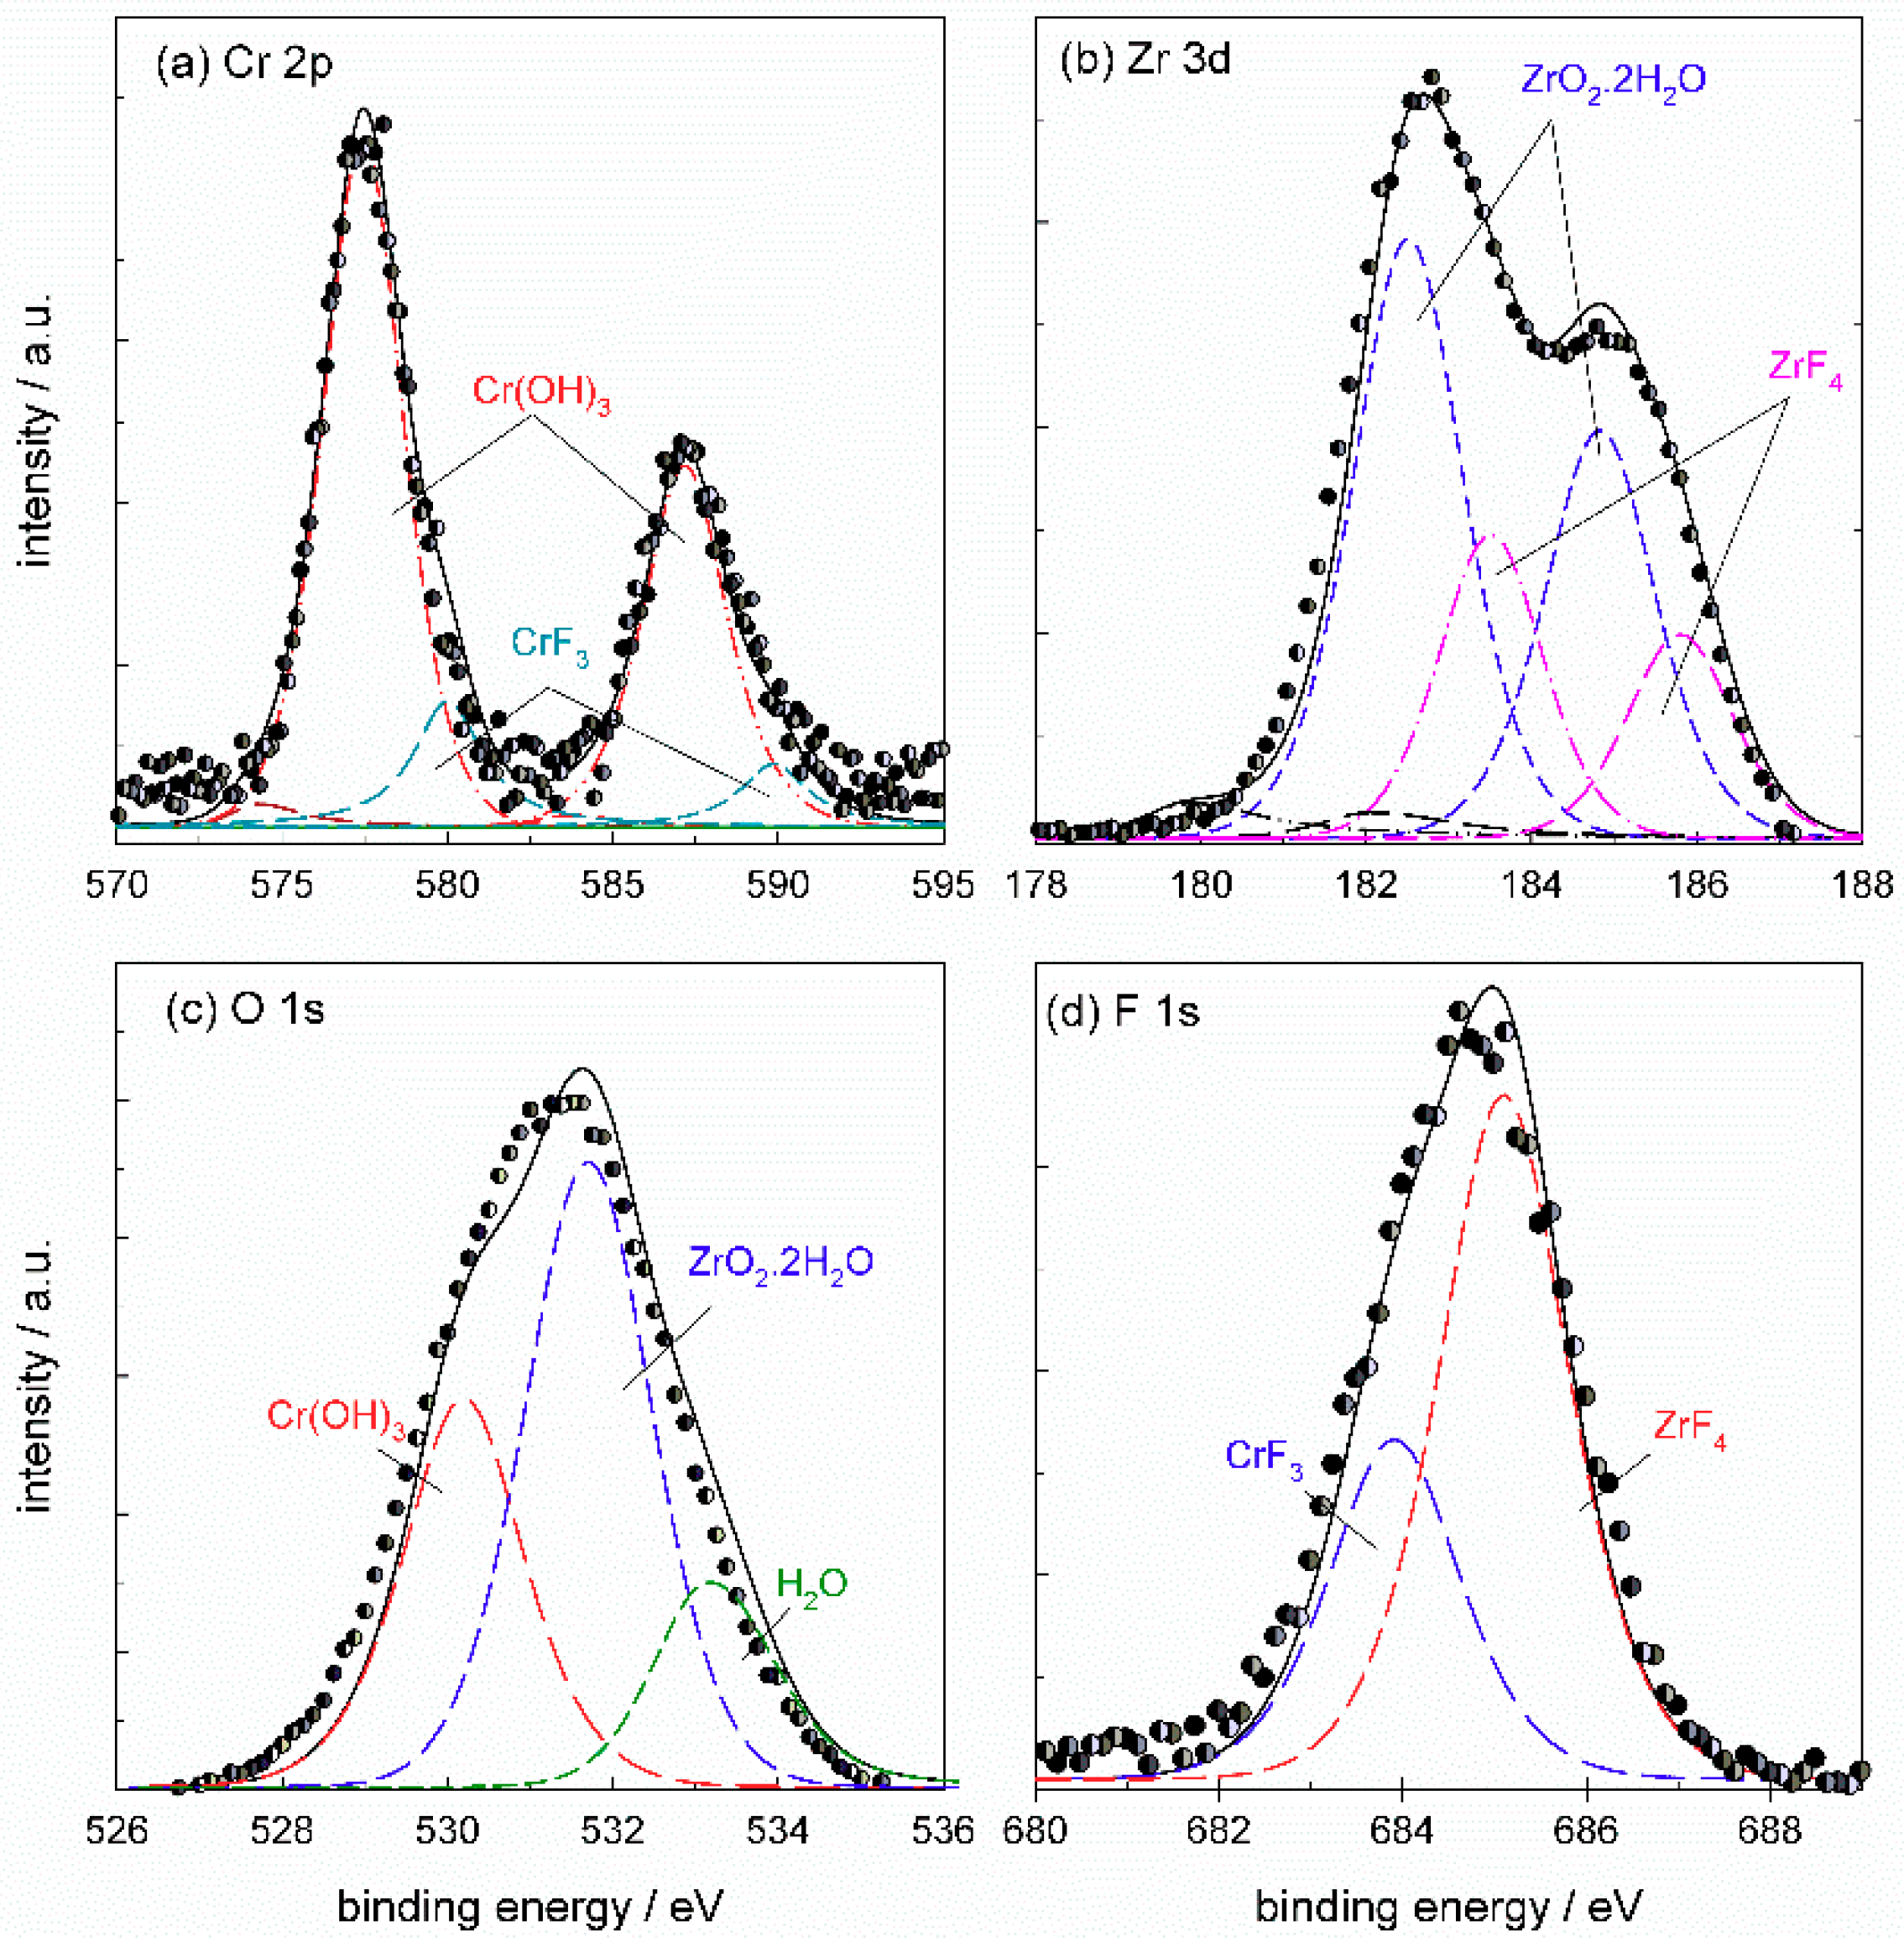
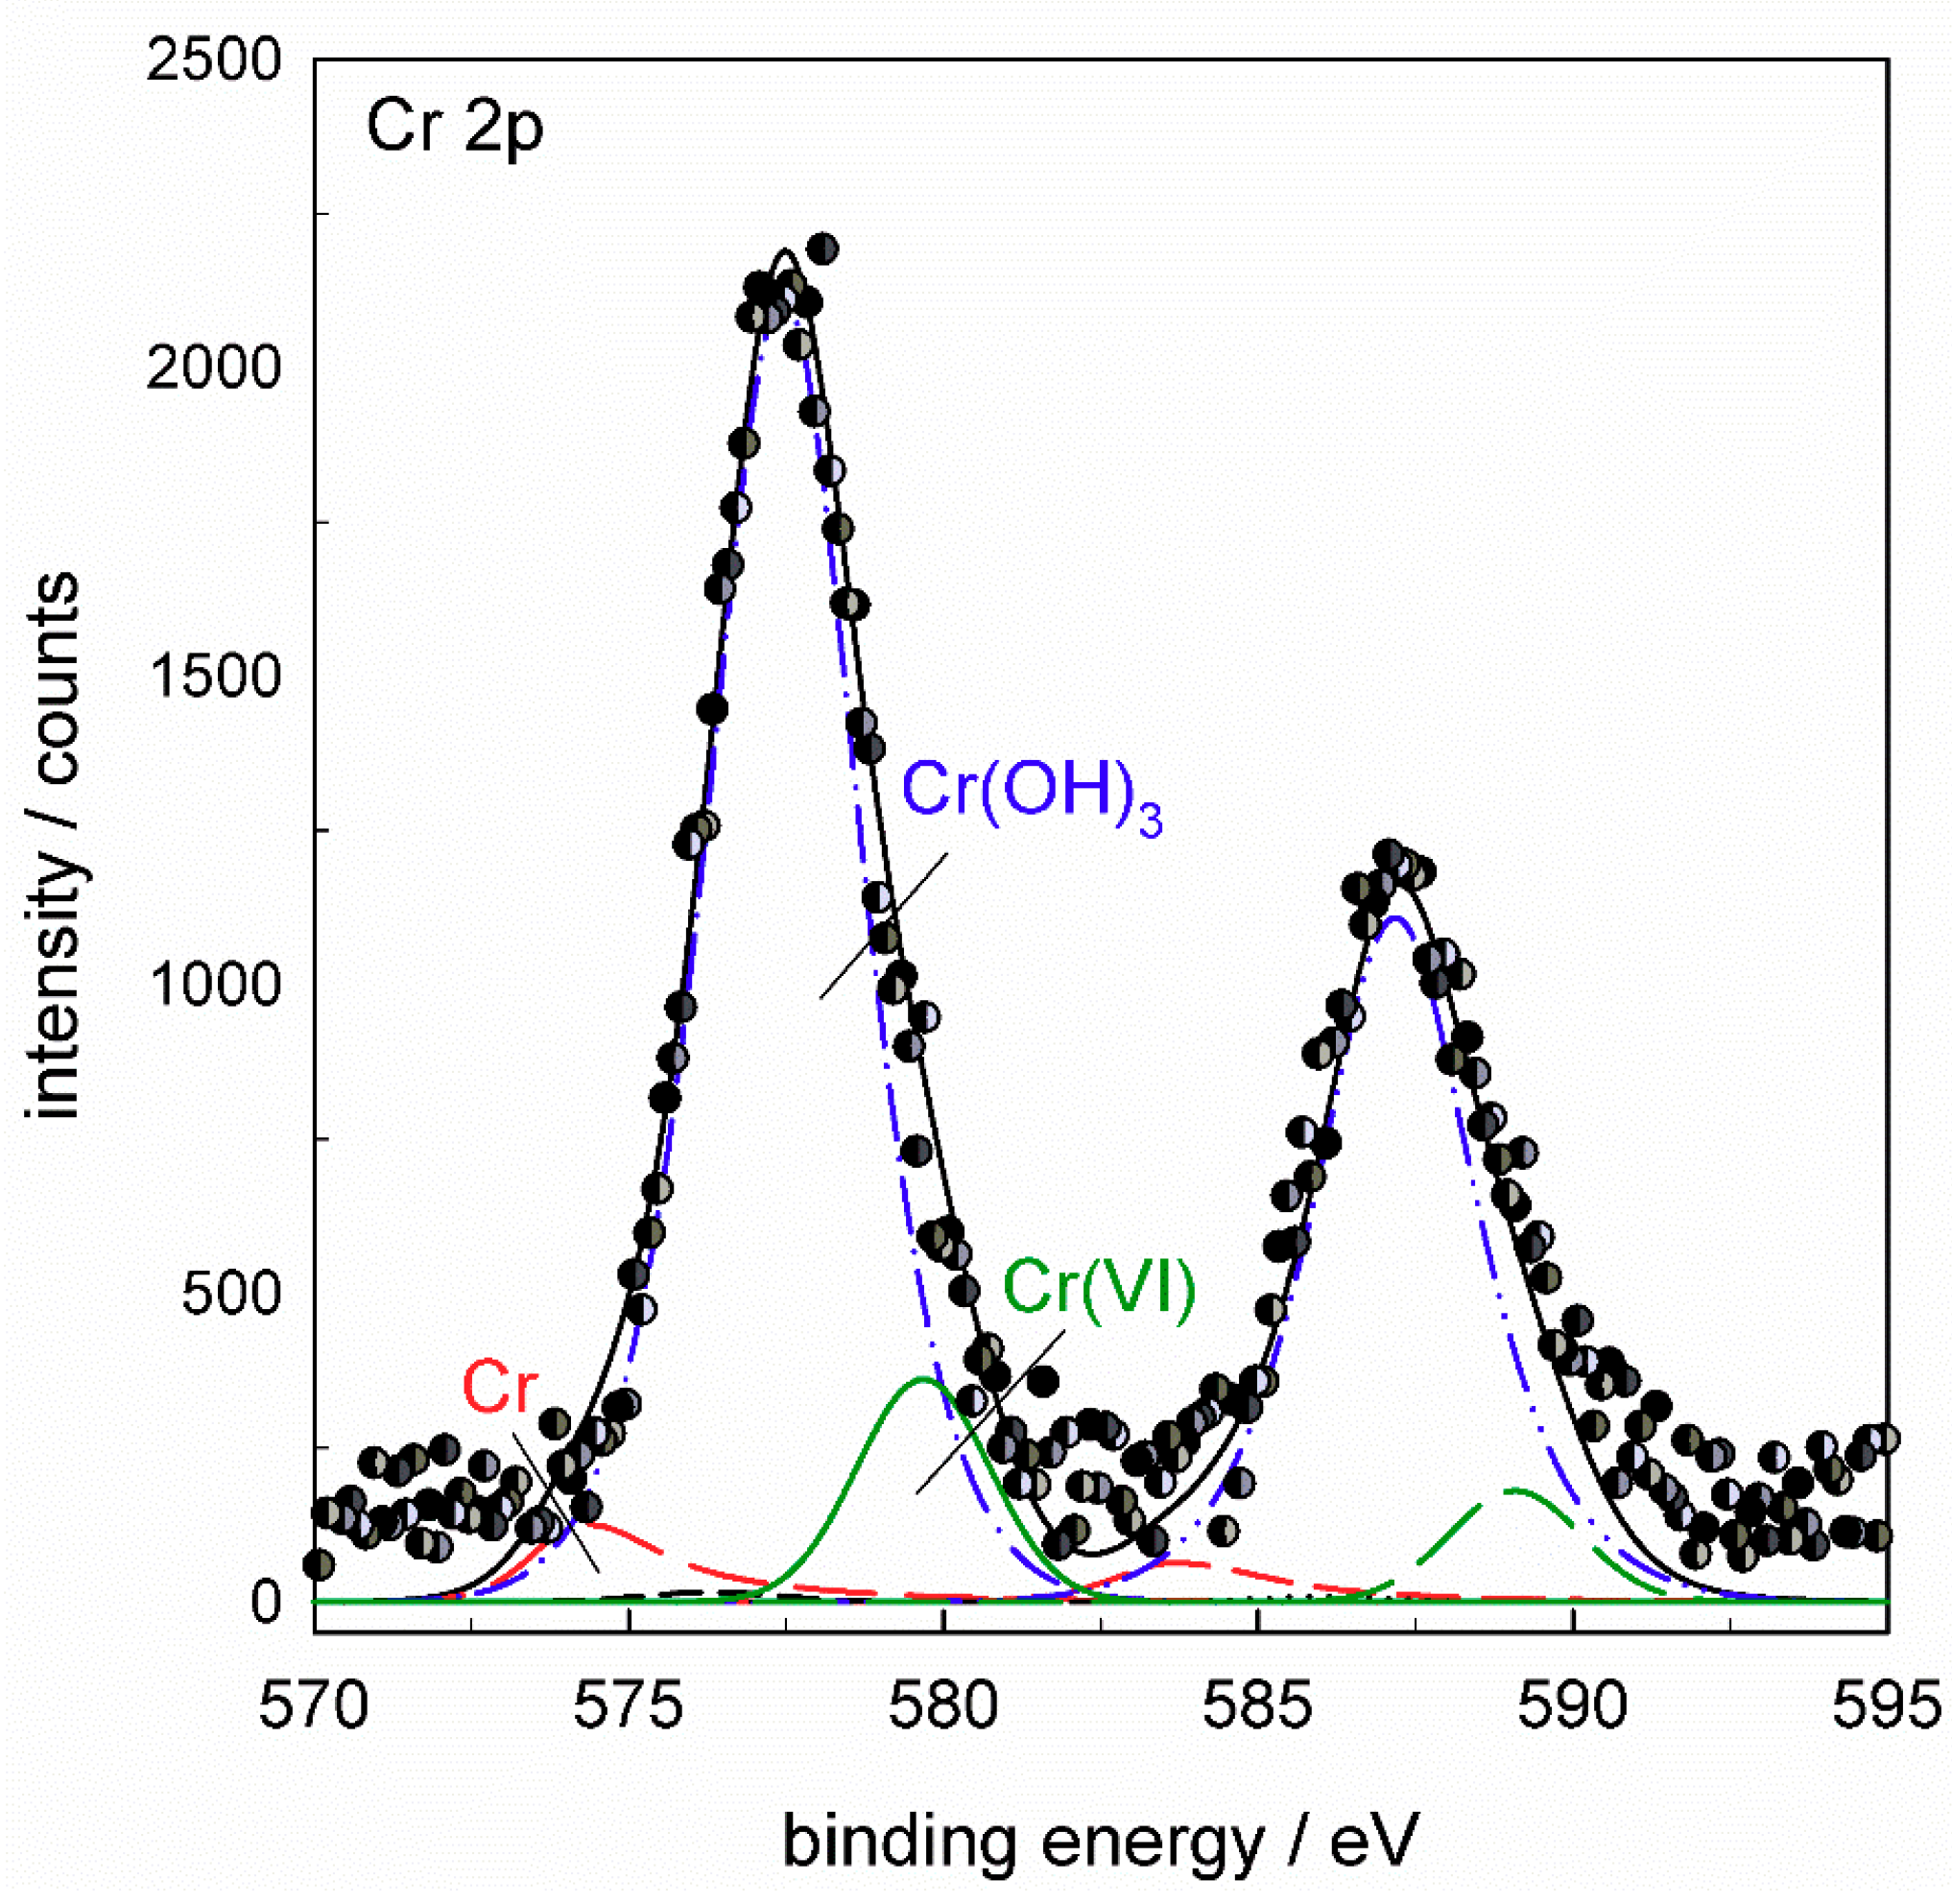
The Cr
2p spectrum (
Figure 17a) was deconvoluted using five component
2p3/2 and
2p1/2 doublets reflecting all compounds which may be formed in the conversion coating: Cr metal at 574.2 eV, Cr
2O
3 at 575.3 eV, Cr(OH)
3 at 577.4 eV, Cr(VI) species at 579.7 eV and CrF
3 at 580.0 eV (values of
Eb cited relate to
2p3/2 peak). TCP coatings were mainly composed of Cr(III) species, although the formation of Cr(VI) was also noted [
6,
24,
29,
34,
35]. Since a strong fluorine peak indicated the formation of fluorides in addition to oxides (
Table 8,
Figure 15), the presence of CrF
3 should be taken into account as well. The interpretation of peaks is rather difficult because of the close binding energies of Cr(VI) (between 579.5 eV and 580.2 eV) and CrF
3 (between 579.3 eV and 580.8 eV) [
33]. Therefore, in fluoride containing materials, such as ST650 conversion coatings, the distinction between Cr(VI) species and Cr(III) attributed to CrF
3 is difficult. The spectrum in
Figure 17a deconvoluted using all five component peaks shows that the major Cr component of ST650 TCP coating was Cr(III) hydroxide, Cr(OH)
3, with some contribution of Cr(III) fluoride, CrF
3. The area fraction related to Cr(OH)
3 was about 82% and that of CrF
3 18%. Component peaks related to Cr, Cr
2O
3 and Cr(VI) species dropped to zero during deconvolution. If the component sub-peak of CrF
3 was not taken into consideration in the deconvolution, then the peak related to Cr(VI) species was increased; the example is given in
Appendix B (
Figure A7). Therefore, according to the spectra presented, it can be stated that the coating comprised Cr(OH)
3 and CrF
3. The presence of a small amount or traces of Cr(VI) cannot be excluded but also cannot be confirmed with great accuracy.
The Zr
3d5/2 and
3d3/2 peaks were centered at 182.5 eV and 184.9 eV (
Figure 17b). The experimental spectrum was deconvoluted using three-component
3d5/2 and
3d3/2 doublets reflecting all the compounds which may be formed in the conversion coating: Zr metal at 179.9 eV, ZrO
2·2H
2O at 182.5 eV and ZrF
4 at 183.5 eV (values of
Eb cited relate to
3d5/2 peak). The deconvoluted spectrum shows that the coating comprised mainly ZrO
2·2H
2O, accounting for 66% of the peak area, and ZrF
4 with 34% of the peak area. It is noteworthy that fluorine can be present as fluoride, but also as oxyfluoride; however, due to the lack of appropriate reference compounds, we assumed the formation of fluoride.
Based on the results of the deconvolution of Cr
2p and Zr
3d spectra, the O
1s spectrum was deconvoluted using three component peaks related to hydrated Cr(III) and Zr(IV) hydrated oxides, Cr(OH)
3 at 530.0 eV and ZrO
2·2H
2O at 531.5 eV, respectively (
Figure 17c). The third component peak at 533.0 eV is related to bound water.
The F
1s seemed to be comprised of two single peaks centered at 684.5 eV and 685.2 eV (
Figure 17d). According to the XPS database [
33], the
Eb values for CrF
3 were reported in the range 684.1–685.6 eV and that for ZrF
4 in the range 685.1–685.9 eV. These values are rather close but it seems that CrF
3 appeared at somewhat lower
Eb. Therefore, we arbitrarily took component peaks for CrF
3 and ZrF
4 since, without appropriate standards, it is difficult to interpreted fluoride compounds (
Appendix B,
Table A3). According to the deconvolution of Cr
2p and Zr
3d spectra (
Figure 17a,b), the contribution of ZrF
4 to the total peak was roughly double than that of CrF
3 (34% and 18%, respectively). Therefore, more fluorine was more bonded to Zr than to Cr (
Figure 17 a,b). This was considered during deconvolution of F
1s spectra by keeping the ratio of component peak at 1:2 (
Figure 17d). The component peak of CrF
3 was centered at 683.9 eV and that of ZrF
4 at 685.1 eV.
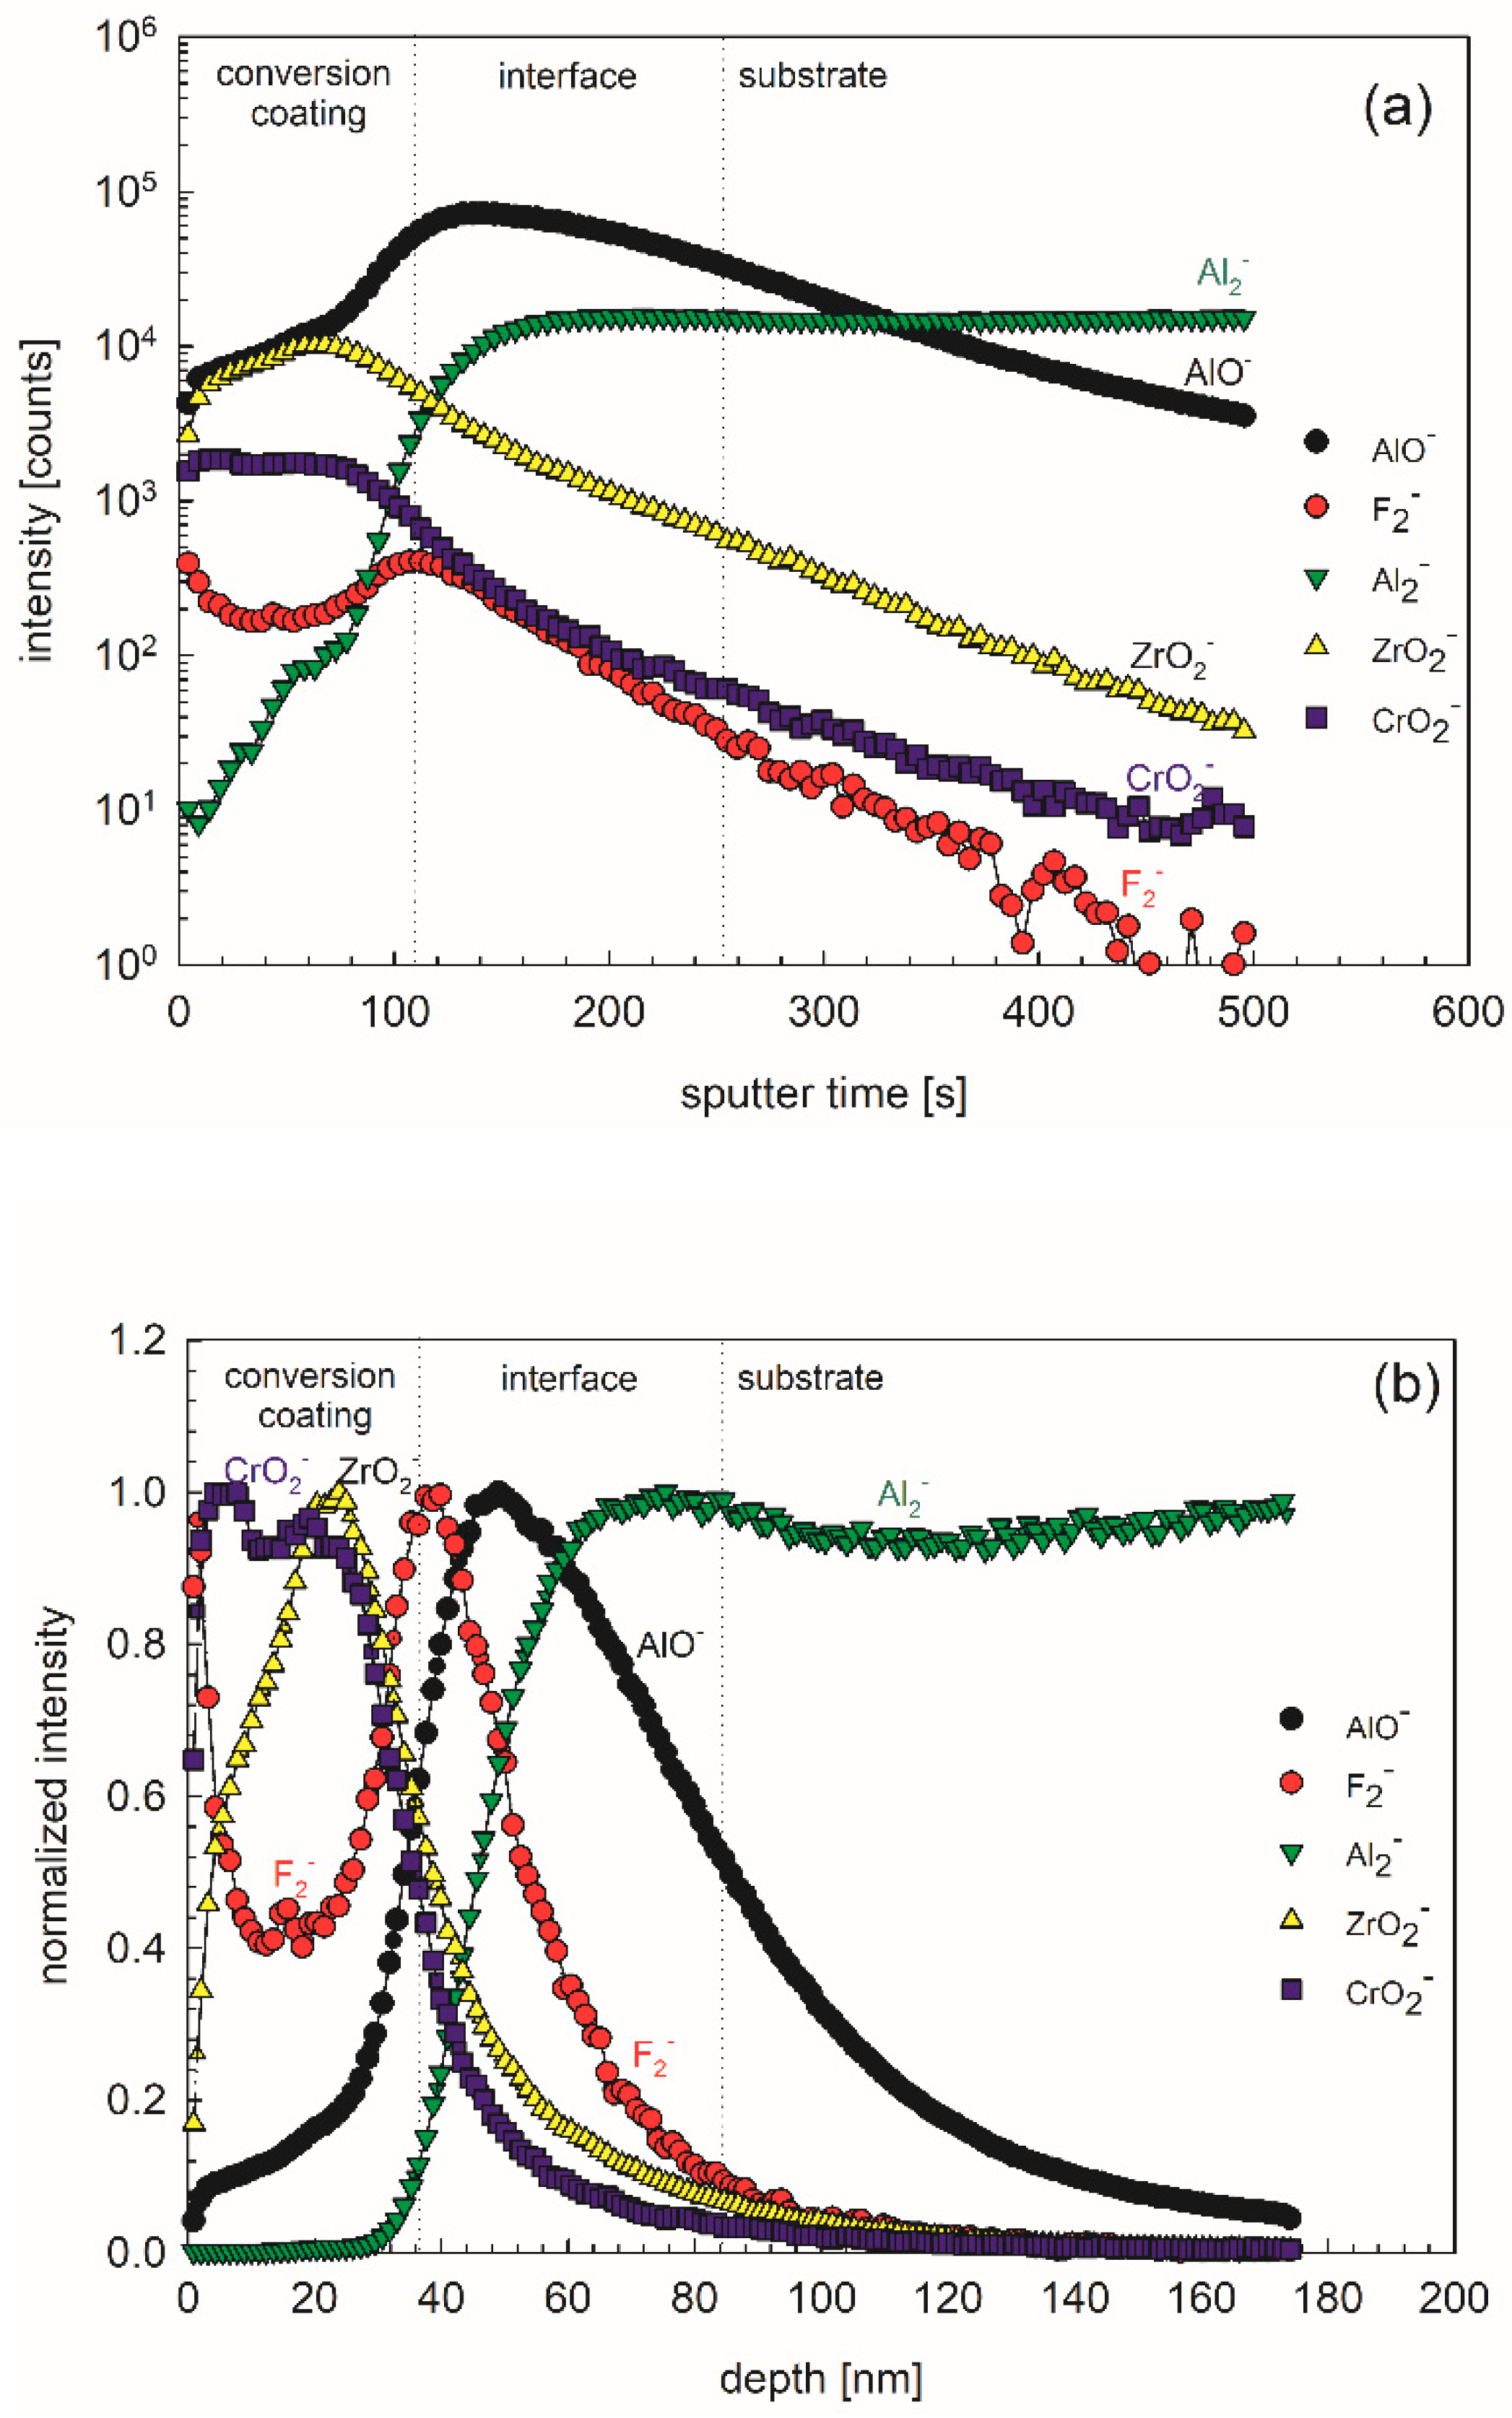
ToF-SIMS depth profiles were recorded in order to reveal the in-depth composition and thickness of the conversion layer formed using 10 vol.% ST650 at 18-min conversion times (
Figure 18).The most intense negative ion depth profiles were recorded: ZrO
2−, CrO
2−, F
2−, AlO
− and Al
2− and presented in the form of intensity vs. sputter time (
Figure 18a) and normalized intensity vs. depth graphs (
Figure 18b); please note that the sputtering rate was estimated as ~0.35 nm/s relative to a Ni/Cr standard. Three regions can be distinguished: conversion layer, interface layer and substrate. In the conversion layer, ZrO
2−, CrO
2−, F
2− and AlO
− species prevailed, whilst in the interface layer, AlO
−, Al
2− and F
2− and species were dominant (
Figure 18a,b). Taking into account the sputtering rate of 0.35 nm/s, the thickness of conversion layer was estimated to 40 nm, and that of the interface layer to 50 nm. These results are in line with data published for similar TCP coatings [
2,
7,
34,
36]. Looking at the depth profiles, especially with normalized intensities, it seems that the layer exhibited not only biphasic structure (conversion layer/interface layer) but even a tri-layer structure. Specifically, the outer part of the conversion coating seems to be enriched in Cr, and the inner part in Zr (
Figure 18b). Similar results were noticed by Munson and Swain using AES depth profiles [
36]. Such a structure is accompanied by a high fluorine content at the top and at the interface (
Figure 18b).

 and
and 


