Article

Influence of Treatment Time on Performance of Cr(III)-Based Conversion Coatings on Hot Dip Zn–55Al–1.6Si Coated Steel Sheet

School of Material Science and Engineering, China University of Petroleum (East China), Qingdao 266580, China
*
Author to whom correspondence should be addressed.
Coatings 2019, 9(5), 297; https://doi.org/10.3390/coatings9050297
Submission received: 29 March 2019 / Revised: 23 April 2019 / Accepted: 24 April 2019 / Published: 1 May 2019

Abstract

:
In this work, the effect of treatment time on the performance of Cr(III) conversion coatings (TCC) on hot dip Zn–55Al–1.6Si (Zn55Al) coated steel sheet were investigated. The surface 3D morphology and roughness of TCCs were examined by a 3D topography instrument and the structure, chemical composition, and elemental depth distribution were studied by means of scanning electron microscope (SEM), X-ray photoelectron spectroscopy (XPS), and auger electron spectroscopy (AES). The results indicated that during the formation of TCC, the macro-roughness of Zn55Al surface was reduced, but the micro-roughness increased, which are considered to be key factors in enhancing the adhesion strength of epoxy primers. The AES depth profiles showed a two-layer TCC for both dendritic and inter-dendritic regions and chemical composition analysis of XPS showed that the surface of TCC was mainly oxides, fluoride and a small number of hydroxides. Overall, Zn55Al specimen prepared in a diluted commercial Cr(III)-based solution for 180 s at 40 °C performed a better adhesion strength to epoxy primer and had the largest polarization resistance among all TCCs in this work. Additionally, longer Cr(III) passivation process (TCP) treatment time will increase the sensitivity of the TCC to micro-cracks.

1. Introduction

Hot dip coated steel (Zn–55Al–1.6Si, hereinafter referred to as Zn55Al) is widely used in residential or factory decoration, parts of electrical appliances or automobiles, engineering construction, and other fields. The uniform and fine, glittery appearance of the Zn55Al provides an aesthetic benefit in buildings constructed from unpainted products, and the unique composition and microstructure of this coating combines the good durability of aluminum coating with the sacrificial characteristics of zinc coating [1,2,3,4,5,6]. During the last decades, the process for obtaining hot-dip coated steel is transformed to a modern technology that requires additional surface treatment; for example, short-time immersion in specially developed chemical solutions for obtaining conversion coatings (CCs). In addition, as the bottom design of the coating system, both the improvement of corrosion resistance and adhesion strength to subsequent primers are the main points that people will pay attention to in the future.
Epoxy coating has been widely used on the steel substrates in order to protect them against corrosive environments, which plays out as a physical barrier between the metal surface and corrosive environment [7,8]. However, when exposed to electrolytes containing oxygen, water, and ions for a long time, the penetration of these components into the primer lead to a decrease in the adhesion of the coating. One potential advantage of chemical conversion coatings is that they can improve the adhesion of subsequent organic or epoxy primers [9]. Sababi et al. proved that the Zr-based treatment can significantly improve dry adhesion and, moreover, wet durability of fusion bonded epoxy to carbon steel upon exposure to a sodium chloride electrolyte, by inhibiting the formation of large water aggregates and preventing epoxy disbonding at the interface [10]. Ramezanzadeh et al. reported an enhanced anticorrosion performance as well as the promoted adhesion properties of the epoxy nano-composite (containing nano-ZnO particles) on the surface of hot dip galvanized specimens pre-treated by Cr(III) and Cr(VI) CCs [11]. Asemani et al. and Hosseini et al. revealed that the carbon mild steel surface treated by hexafluorozirconic acid based conversion coating had better performance in a salt spray test and electrochemical measurements against corrosive media [12,13]. Golru et al. also proved that the Zr-based conversion layer improved adhesion of the epoxy paint on the AA1050 [14,15]. Ghanbari et al. indicated that the formation of oxide–hydroxide of zirconium and adsorbed fluoride ion on the mild steel should be responsible to the increment of adhesion of the organic coating to the steel surface treated by a zirconium-based conversion layer [16].
Certainly, the trivalent chromium passivation process (TCP) will be the focused research in this field due to the environmental injunction and global emphasis on eliminating hexavalent chromium [17]. To search for an effective alternative to Cr(VI)-based chemical conversion coatings, much research has been done on the Cr(III) based or Zirconium-based conversion coating on zinc alloy coatings [18,19,20,21] and aluminum alloys such as AA1050 [14,15]; AA2024 [22,23,24,25,26], AA5052 [27], AA6014 [28,29], AA6063 [30], AA7075 [31,32,33,34] surfaces, etc. Comparisons were also made on zinc and various aluminum alloys on concerned performances [28,34,35]. Unlike these alloys, the zinc-rich inter-dendritic and aluminum-rich dendritic regions of Zn55Al interlace with each other, and there are no isolated secondary phase intermetallic particles on its surface. Due to the special surface condition of Zn55Al hot-dip coating (containing Zn-rich inter-dendritic region and Al-rich dendrite region), the formation process of trivalent chromium chemical conversion coating on its surface is different from that of zinc alloys or aluminum alloys [4,6,36].
The complexity of the microstructure and the chemical composition of the industrial Zn55Al make a complete understanding of the TCP difficult. A low concentration chromate passivation treatment has been successfully processed on Zn25Al by previous research, but it was Cr(VI) based [37]. The aim of this work was to characterize the Cr(III) based conversion coatings formed on Zn55Al, and to understand the influence of different TCP treatment time on TCC’s performance. High sensitive surface techniques such as X-ray photoelectron spectroscopy (XPS) and auger electron spectroscopy (AES) were used for the surface and in-depth chemical characterization, and combined with SEM and 3D profiler for studies of the change of the TCC’s morphology and roughness. In addition, the corrosion resistance of the Zn55Al surfaces with different TCP treatment times was estimated by electrochemical measurements.

2. Materials and Methods

2.1. Specimen Preparation and Cr(III) Treatment Process

Commercial hot-dip Zn55Al coated steel sheet (55%Al–43.4%Zn–1.6%Si by weight) with an average thickness of 25 μm Al–Zn coating was selected as the subject. The spangled microstructure of Zn55Al consists of Al-rich dendritic regions (64.5%Al–35.3%Zn–0.2%Si) and inter-dendritic Zn-rich regions (20.4%Al–78.9%Zn–0.7%Si) [4].
The Cr(III) based passivator Bonderite M-NT 5928 (also known as Adoline 5928, Hankel Corp., Dusseldorf, Germany) containing 1–10 wt. % trivalent chromium salt and 0.1–1 wt. % zirconium compounds were prepared using ultrapure water (Ulupure Water Purification System, Ultrapure Technology Co., Ltd., Chengdu, China, 2.93 MΩ·cm) to 50 vol. %. The pH of the diluted solution is 2.6, detected by Quanta (Hydrolab Corp., Austin, TX, USA). The Cr(III) conversion process (hereinafter referred to as TCP) was carried out in a plastic beaker at 40 °C at different immersion time (30, 60, 180 and 360 s) in order to investigate the properties of the trivalent chromium conversion coating (referred to as TCC for short). Afterwards, the Cr(III)-treated panels were dried in a lab dryer for at least 24 h at ambient temperature.
Prior to immersion in the Cr(III) bath, all the Zn55Al panels with a dimension of 50 mm × 50 mm used in this research was edge-sealed and pre-treated with the same following processes: (i) ultrasonic cleaning in acetone for 10 min; (ii) alkali washing for 15 s in 5 wt. % NaOH solution at 50 °C; (iii) acid pickling for 10 s in 10 wt. % HNO3 solution which is usually used as desmutting bath at room temperature. Each process was followed by ultrasonic cleaning in ultrapure deionized water for 5 min, then dried in a cool air stream. The purpose of the pre-treatment was to eliminate the fingerprint resistant coating on Zn55Al and to activate the surface subjected to Cr(III)-treatment. In order to perform 3D morphology analysis, half of a specimen was covered with insulating and corrosion-resistant tapes to retain the original surface in order to compare the surface morphology of TCP treated and untreated regions.

2.2. Surface Composition Analysis

A panel of 10.0 mm × 10.0 mm previously subjected to TCP treatment of 180 s was used for the AES analysis and a typical area with inter-dendritic and dendritic region was selected. The AES measurements were performed on a PHI 710 scanning auger nanoprobe (ULVAC-PHI, Inc., Kanagawa, Japan) with a tungsten filament electron emission source. A cylindrical mirror analyzer (CMA) was adopted and the test beam energy used for stimulating specimen signals and SEM imaging is 10 kV, and the current is 10 nA. All the Auger electron spectra were acquired with an energy analyzer resolution less than 0.5%. The surface was sputtered using a 2.0 keV Ar+ ion beam over an area of 2.0 mm × 2.0 mm and the emission current was 3.0 mA/cm2. The mode of ion beam sputtering is spin sputtering, and the rotational speed is 1.0 rpm. The sputtering rate is based on SiO2 standard specimen, about 10 nm per minute. The incident angle of electron beam was 30 degrees, while the incidence angle of ion beam was 50 degrees. The recorded spectra were analyzed with Multipak V9.0 software. The characteristic peak of element C (275.0 eV) was used for calibration.
The chemical states of coating species treated by TCP for 180 s were determined by X-ray photoelectron spectroscopy (XPS), using an ESCALAB 250Xi system (Thermo Fisher Scientific Inc., Waltham, MA, USA) equipped with an Al/K Alpha source. The micro focus monochromator was operated at a spot size of 500 µm, including the dendrite and inter-dendritic regions. In order to mitigate the influence of air pollutants and excess carbon on the test results, the Ar+ ion sputtering depth was 5 nm and the high-resolution intensities of the Cr 2p, Zr 3d, O 1s, Al 2p, Zn 2p, etc. photoelectron lines were recorded separately. The background intensity was subtracted from the spectra using the Shirley method. All data were corrected by a linear shift such that the peak maximum of the C 1s binding energy of adventitious carbon corresponded to 284.6 eV.

2.3. Surface Micromorphology and Roughness Analysis

A JSM-7200F microscope (JEOL Ltd., Tokyo, Japan) associated with an integral energy dispersive spectrometer (EDS) detector and operated at an accelerating voltage of 15 kV, were used to investigate surface morphologies and element distribution.
Zeta-20A 3D profiler instrument (Zeta Instruments, Milpitas, CA, USA) was used to observe the 3D morphology and to compare the surface roughness of TCCs with different immersion time. The field of view was 1164 μm × 873 μm. Surface profiles were obtained, repeatedly scanning a line extending from the untreated regions over the TCP-treated regions using a 10× objective lens with a length of 150 μm. The roughness Ra was calculated by Zeta3D software (version 1.7.5), which is the arithmetic mean of the absolute ordinate values Z(x) within a sampling length according to the ISO 12085 [38]:
R a = 1 l 0 l | Z ( x ) | d x
Z(x) refers to the height difference between the neighboring largest profile valley and largest profile peak. The average value of five measurements is taken as a result.

2.4. Pull-off Adhesion Tests

To study the effects of surface roughness and texture on the adhesion of the epoxy coating, epoxy zinc yellow primer-green was prepared on Zn55Al with an epoxy resin and a hardener (volume ratio is ~3:1) both from CSIC Corp. (Xiamen, China). The adhesive strength was characterized by a pull-off adhesion tester (PosiTest AT-A, DeFelsko Corp., New York, NY, USA) following a direct pull-off standardized procedure according to ASTM D4541 [39]. The dolly size was ~20 mm and the pull rate was controlled at a speed of 0.2 MPa/s. Specimens were kept at ambient temperature for at least 24 h (RT ~22 to 24 °C) to ensure that the glue fully cured before the test and a slot was made around dollies. All tests were carried out using three replicates to ensure the measurements’ repeatability.

2.5. Electrochemical Mesurements

For the electrochemical measurements, a three-electrode cell was used with an Autolab PGSTAT 302N potentiostat system (Metrohm AZ, Herisau, Switzerland). The cell contained an Ag/AgCl/Cl (saturated KCl) electrode, a 3 cm2 platinum mesh counter electrode and a working electrode with an exposed area of 0.5 cm2. In order to acquire the polarization resistance of TCC for different conversion times, the linear polarization curves were carried out from −0.015 to 0.015 V vs. the OCP, with a scanning rate of 0.166 mV/s. Measurements were carried out in a naturally aerated 0.5 M NaCl solution at room temperature. Besides, the cathodic polarization curves were obtained by scanning the potential from OCP to 0.150 V vs. the OCP in naturally aerated or nitrogen deoxidizing 0.05 M NaCl solution at room temperature, with a scanning rate of 1.0 mV/s. In the electrolytic cell, Luggin capillary was used to compensate for IR drop. Nova software (version 2.1.3) was used to fit the experimental data.

2.6. Contact Angle Mesurements

The contact angle of pure water on the trivalent chromium conversion coatings was measured by a contact angle goniometer (XG-CAMC, Shanghai Xuanzhun Instrument Co., Shanghai, China) at room temperature to investigate the surface hydrophilicity. The hot-dip Zn55Al steel samples were carefully cleaned to avoid surface contamination.

3. Results

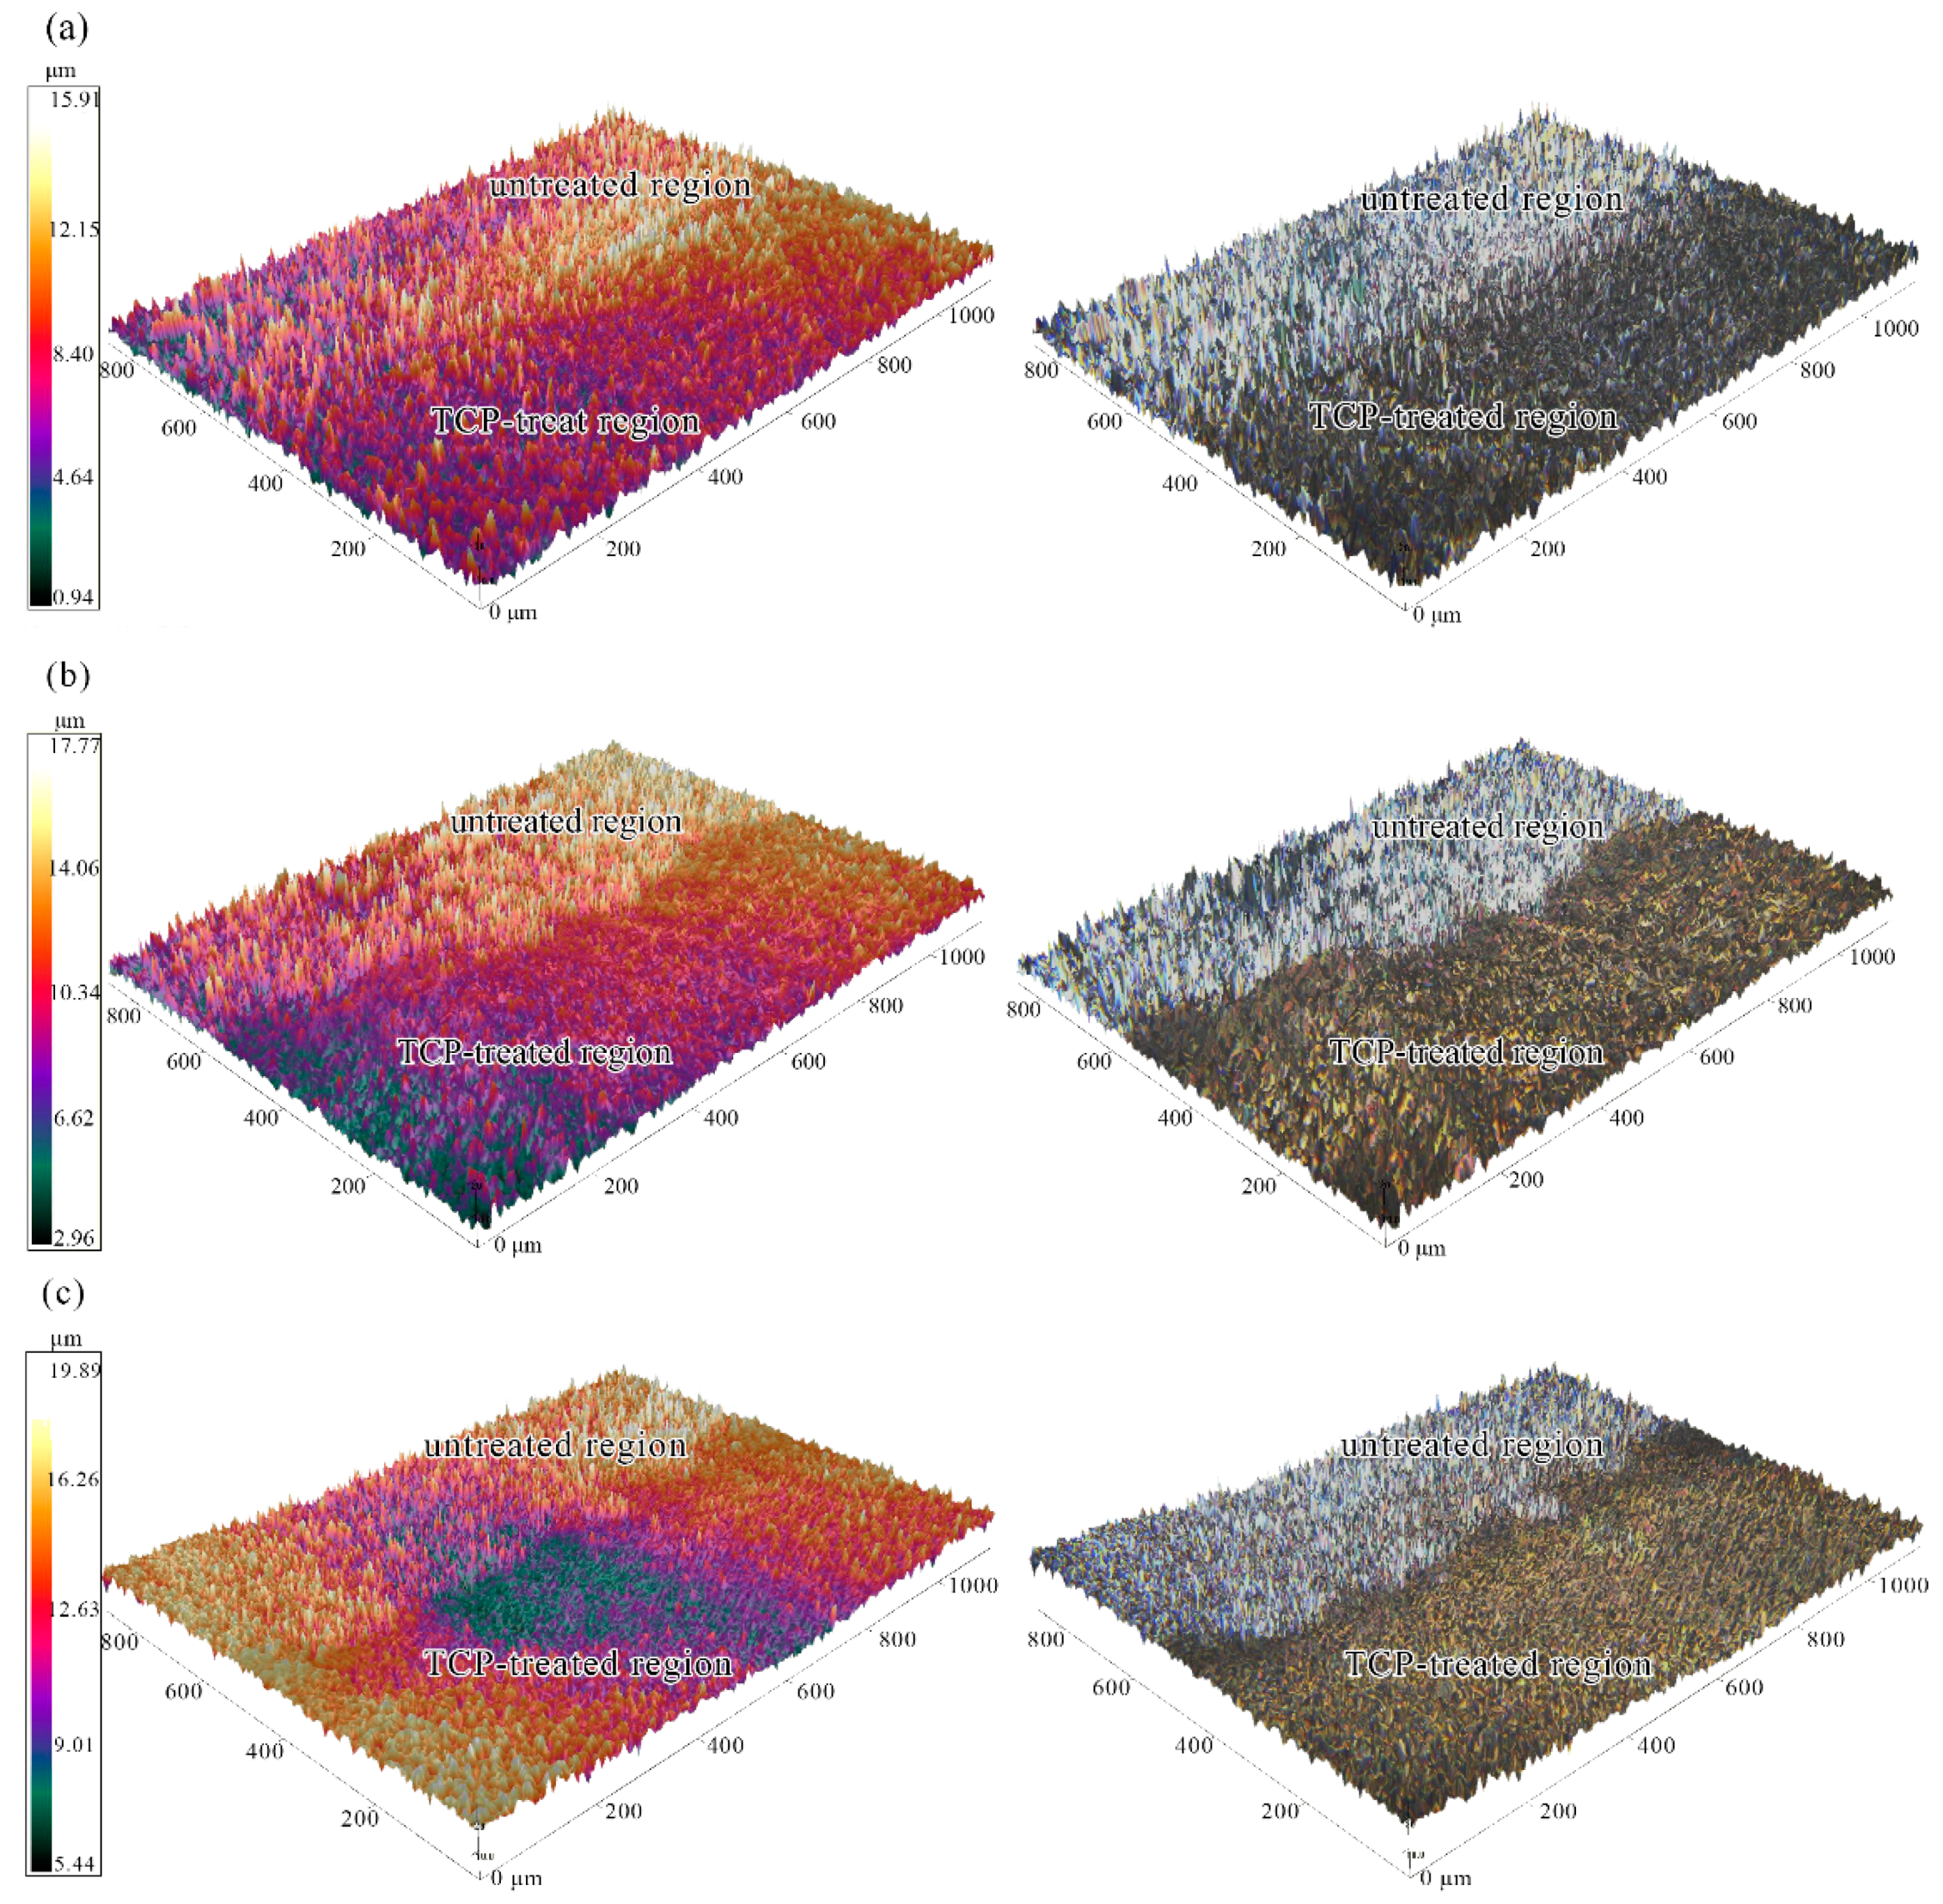
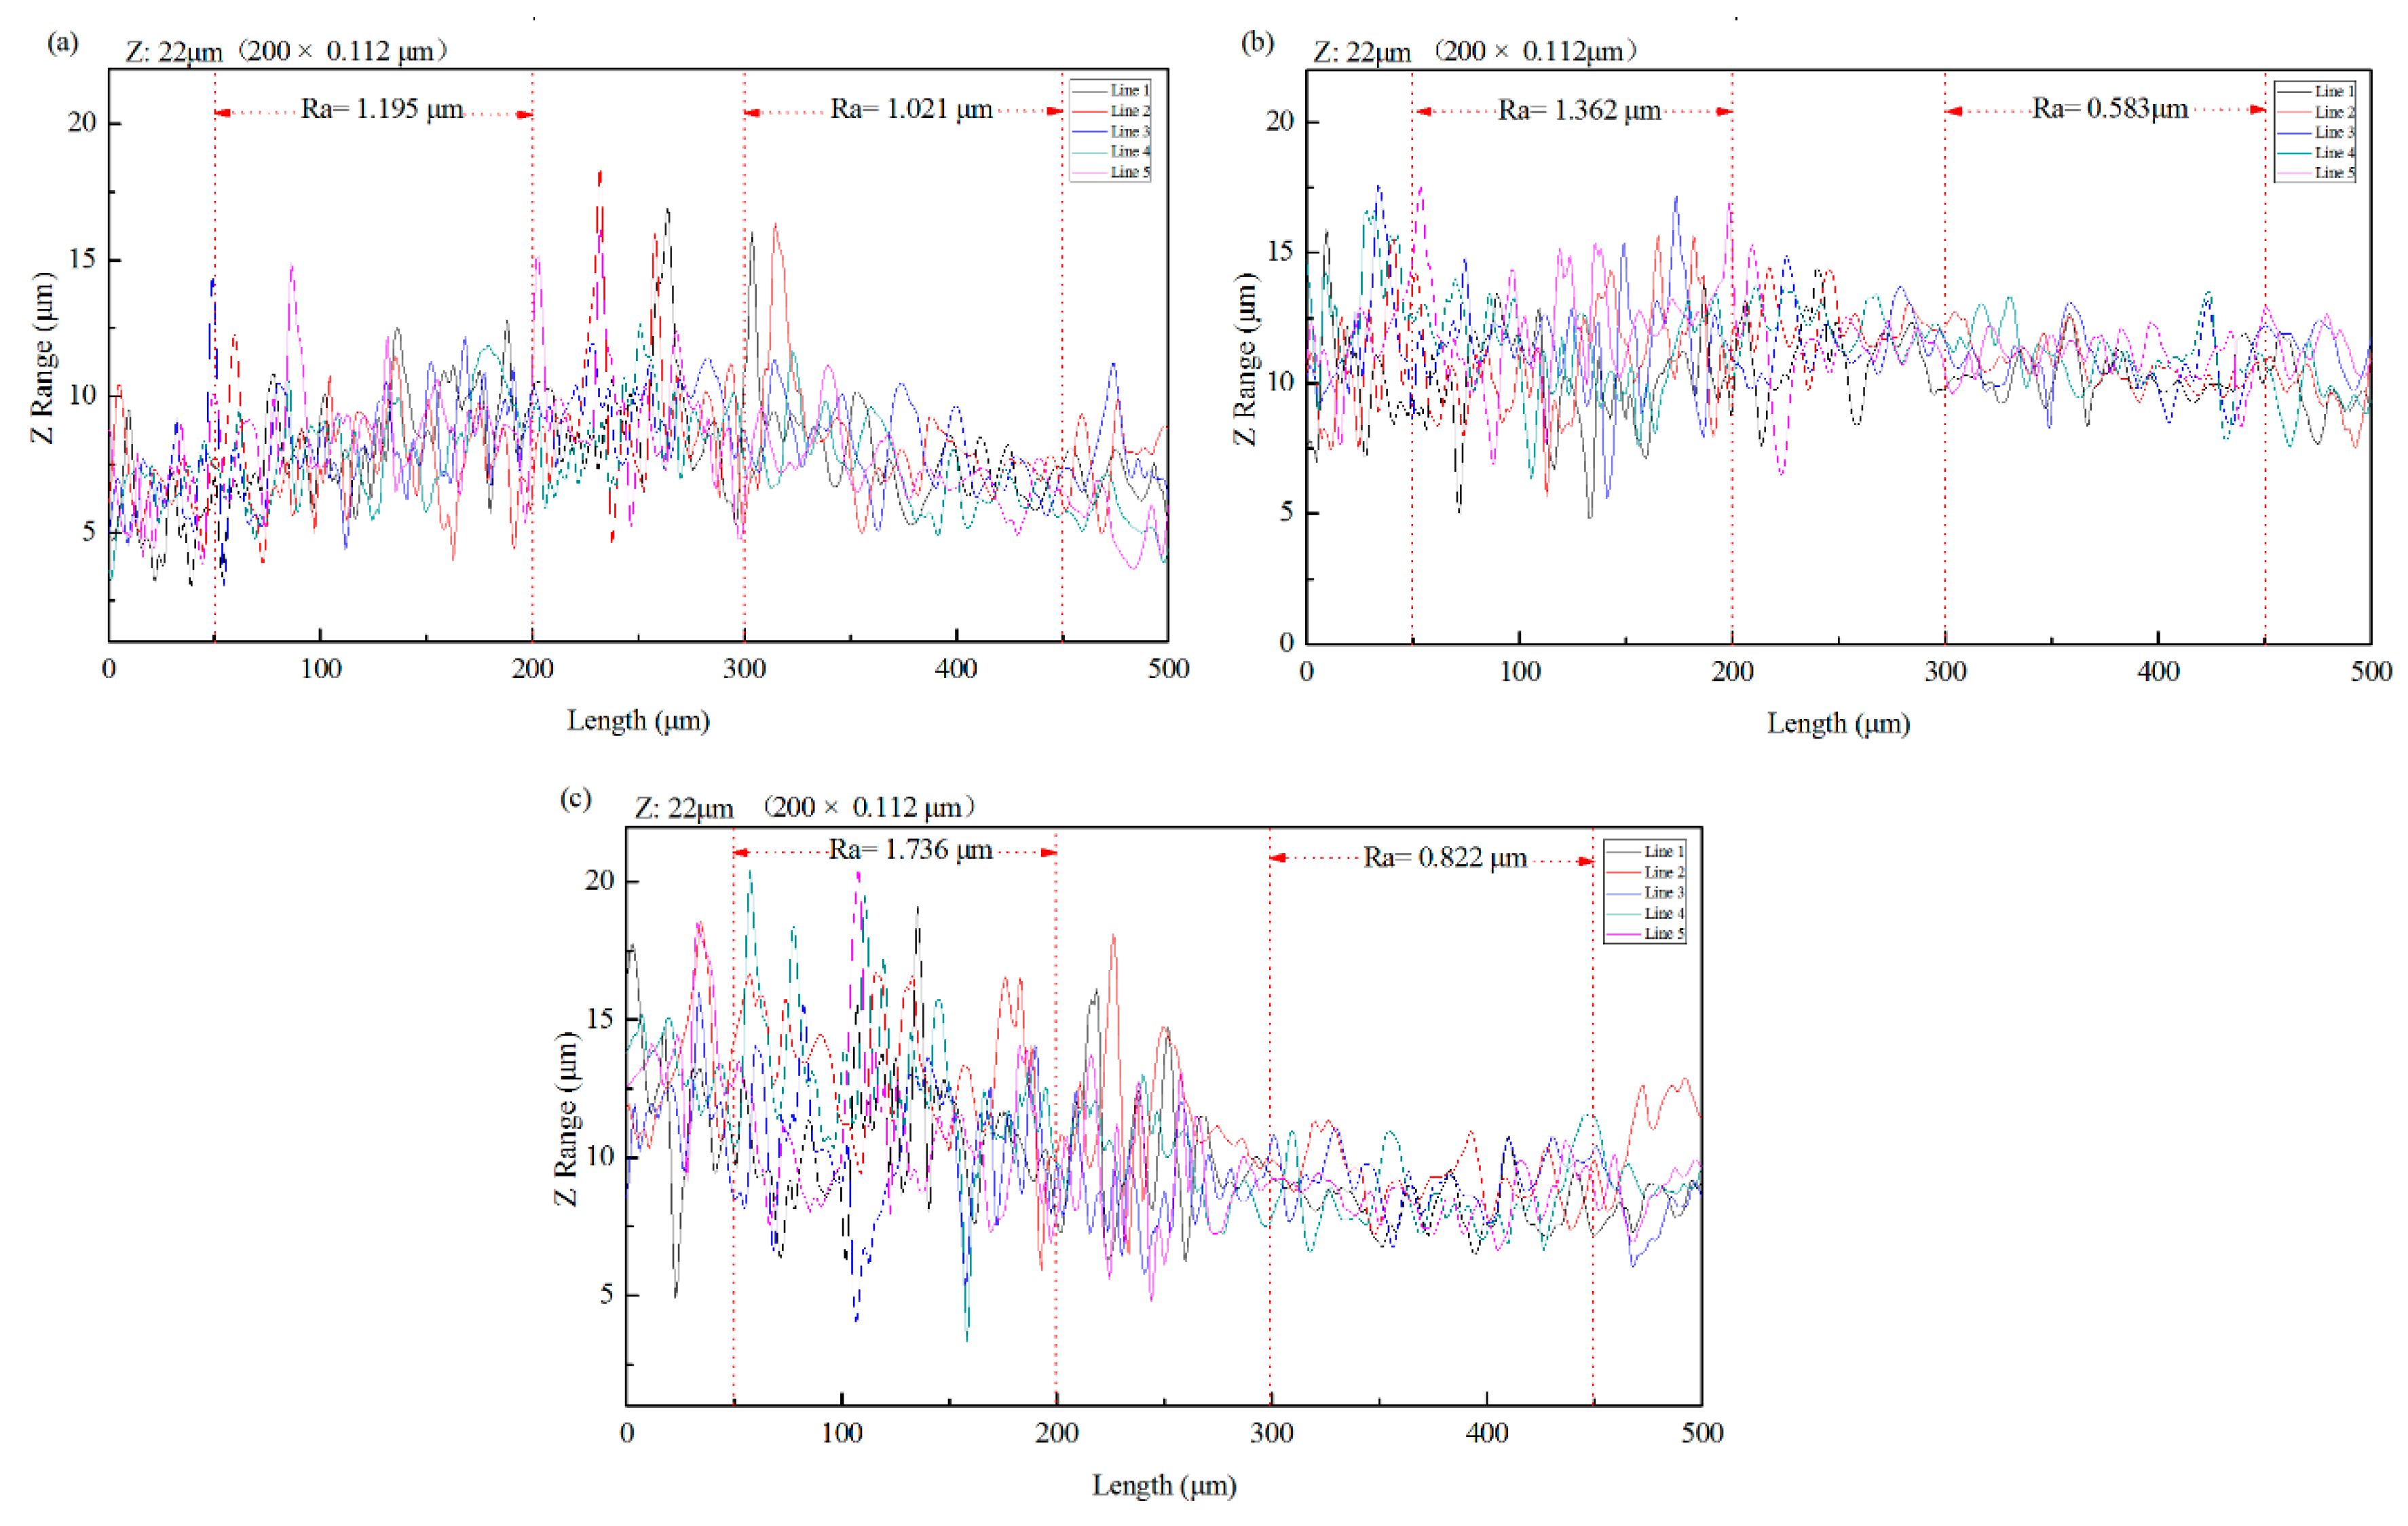
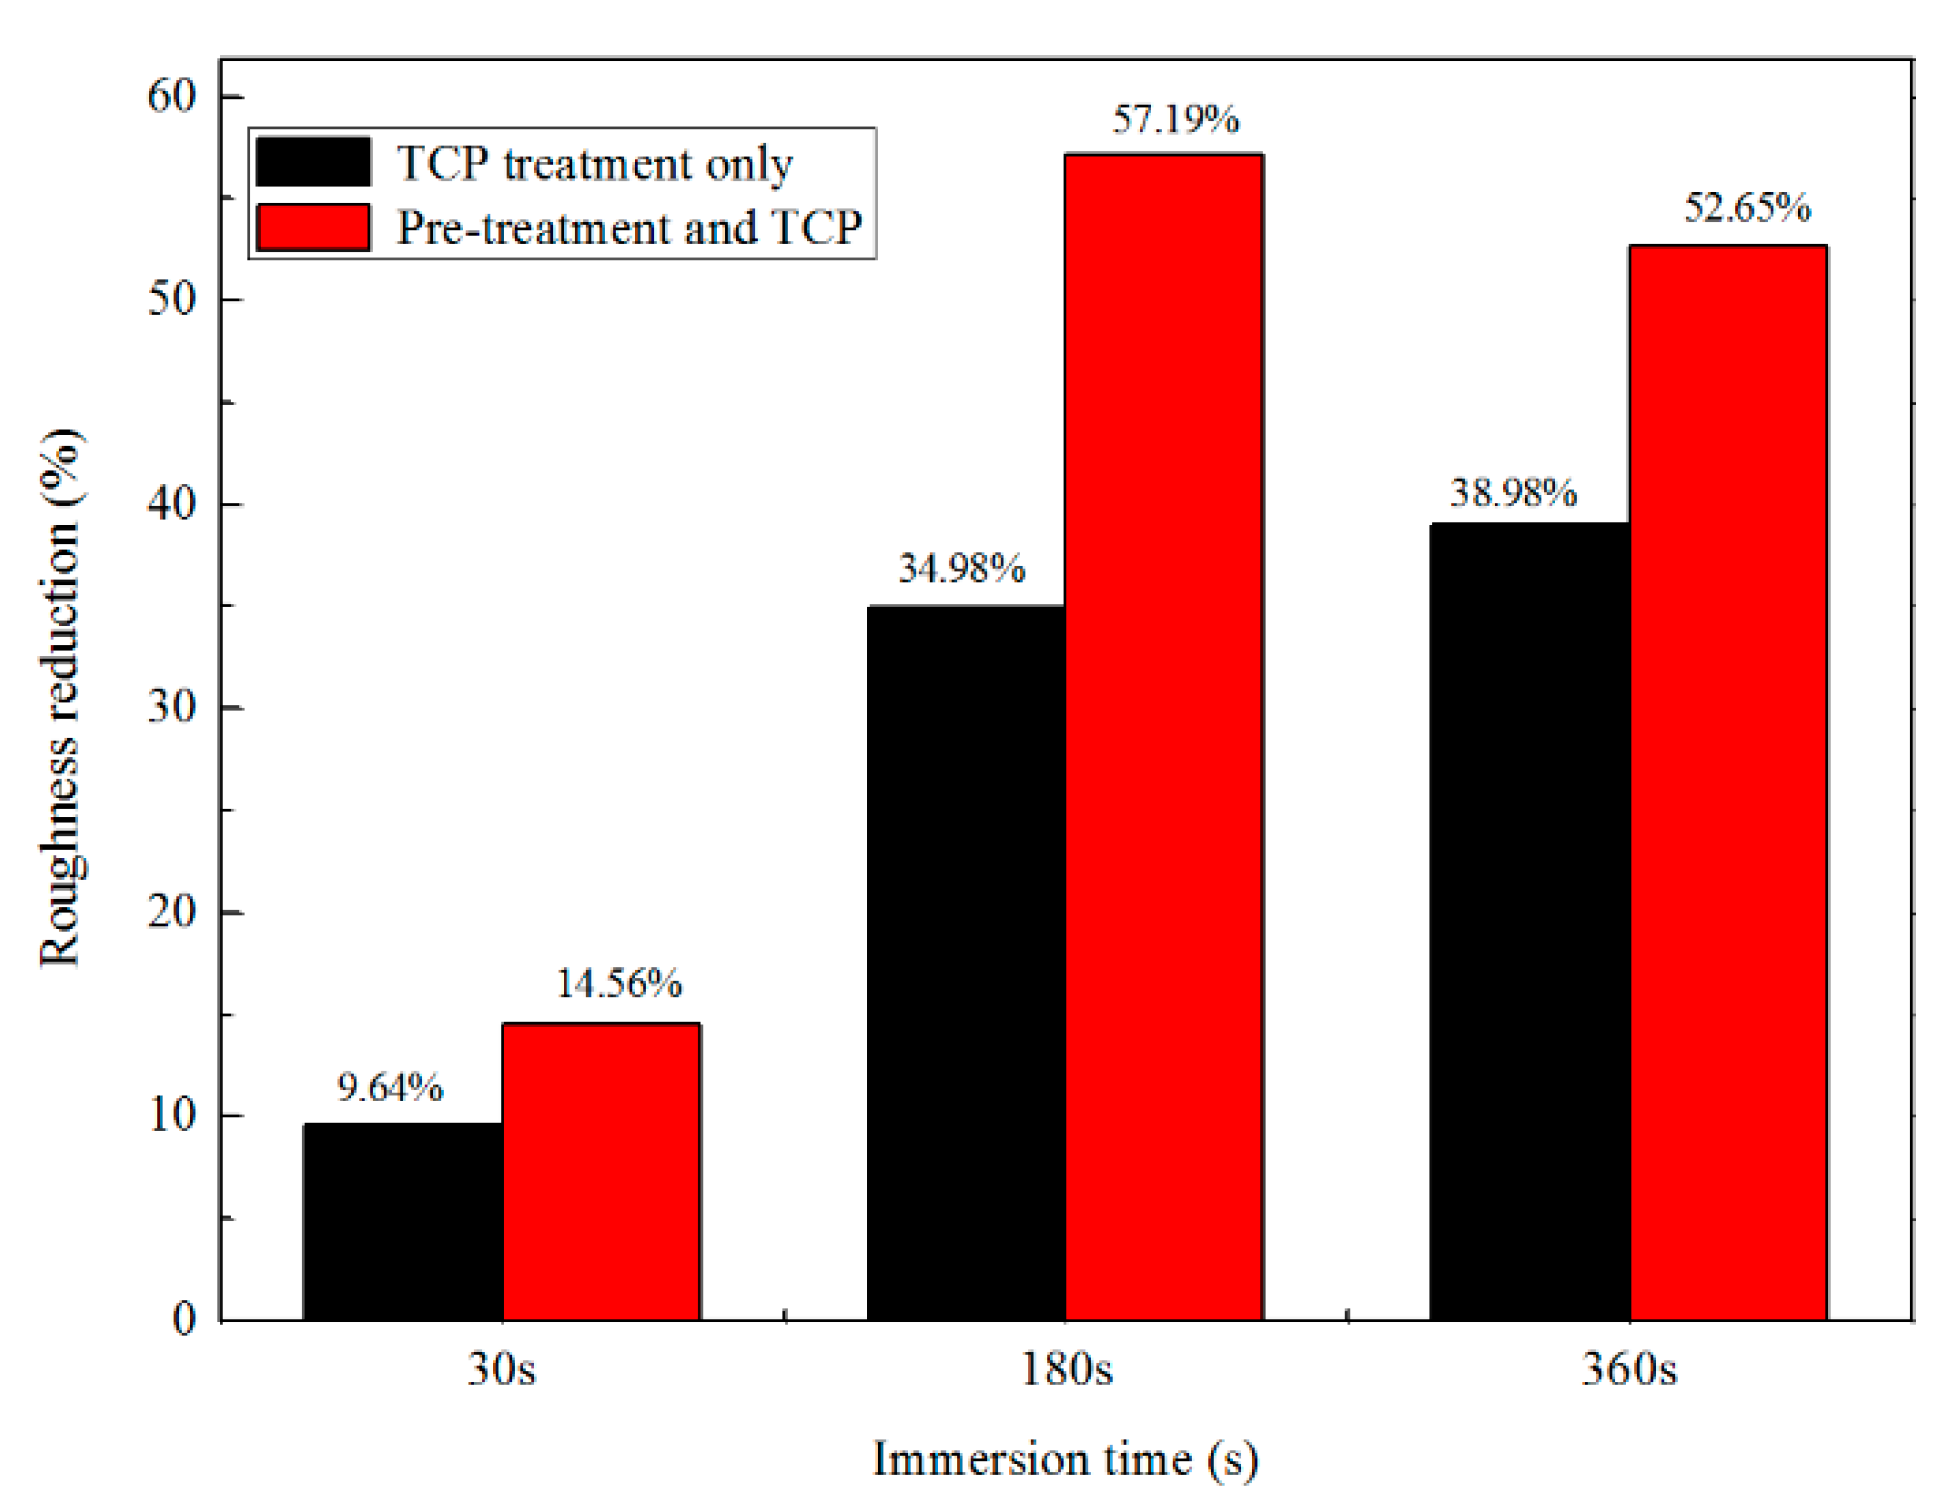
3.1. Roughness and 3D Morphologies Analysis

The effect of TCP conversion treatment on the surface morphology of Zn55Al was visually obtained by 3D profiler, and the greyscale image as well as the color map clearly show the macro roughness difference between the TCP treated region and untreated region within one specimen. The 3D surface topography comparison of Zn55Al specimens with different immersion time of 60, 180 and 360 s in TCP bath at 40 °C is shown in Figure 1. Compared to the untreated Zn55Al surface, the 3D topography images reveal a strong attack and smoothing effect of TCP treatment on the treated Zn55Al surface. The TCP treatment diminished the height difference between peak and valley on the treated surface, making the TCP-treated surface macroscopically smoother. The morphology in Figure 1 reveals a relatively smoother surface after TCP treatment time of 180 and 360 s compared to 30 s. Surface contour profiles were obtained by optical scanning at the same time, and Figure 2 reflects the profiles comparison of different specimens. Compared with an untreated specimen surface, the surface roughness of specimens decreased with the prolongation of immersion time, and since the beginning of TCC formation (60 s), this effect had become obvious.
Figure 3 reveals the surface roughness difference, which shows that the surface roughness of the region treated by TCP for 180 s was 57.19% lower than that of the surface without any treatment. However, the roughness reduction of the surface treated for 360 s did not increase further. After 360 s of TCP treatment, the surface roughness was reduced by 52.65%, which is less than that of 180 s of TCP treatment. It is worth noting that pre-treatment also has the function of etching and modifying the surface, which plays an important role before TCP treatment [40]. Figure 3 also revealed the surface roughness change of Zn55Al specimens which were processed only by the TCP treatment directly after ultrasonic cleaning with acetone. It can be concluded from Figure 3 that pre-treatment did promote the reduction of surface roughness of Zn55Al surface after TCP treatment, but the degree of the promotion was limited. The reduction of roughness should be attributed mainly to the process of the chemical conversion.

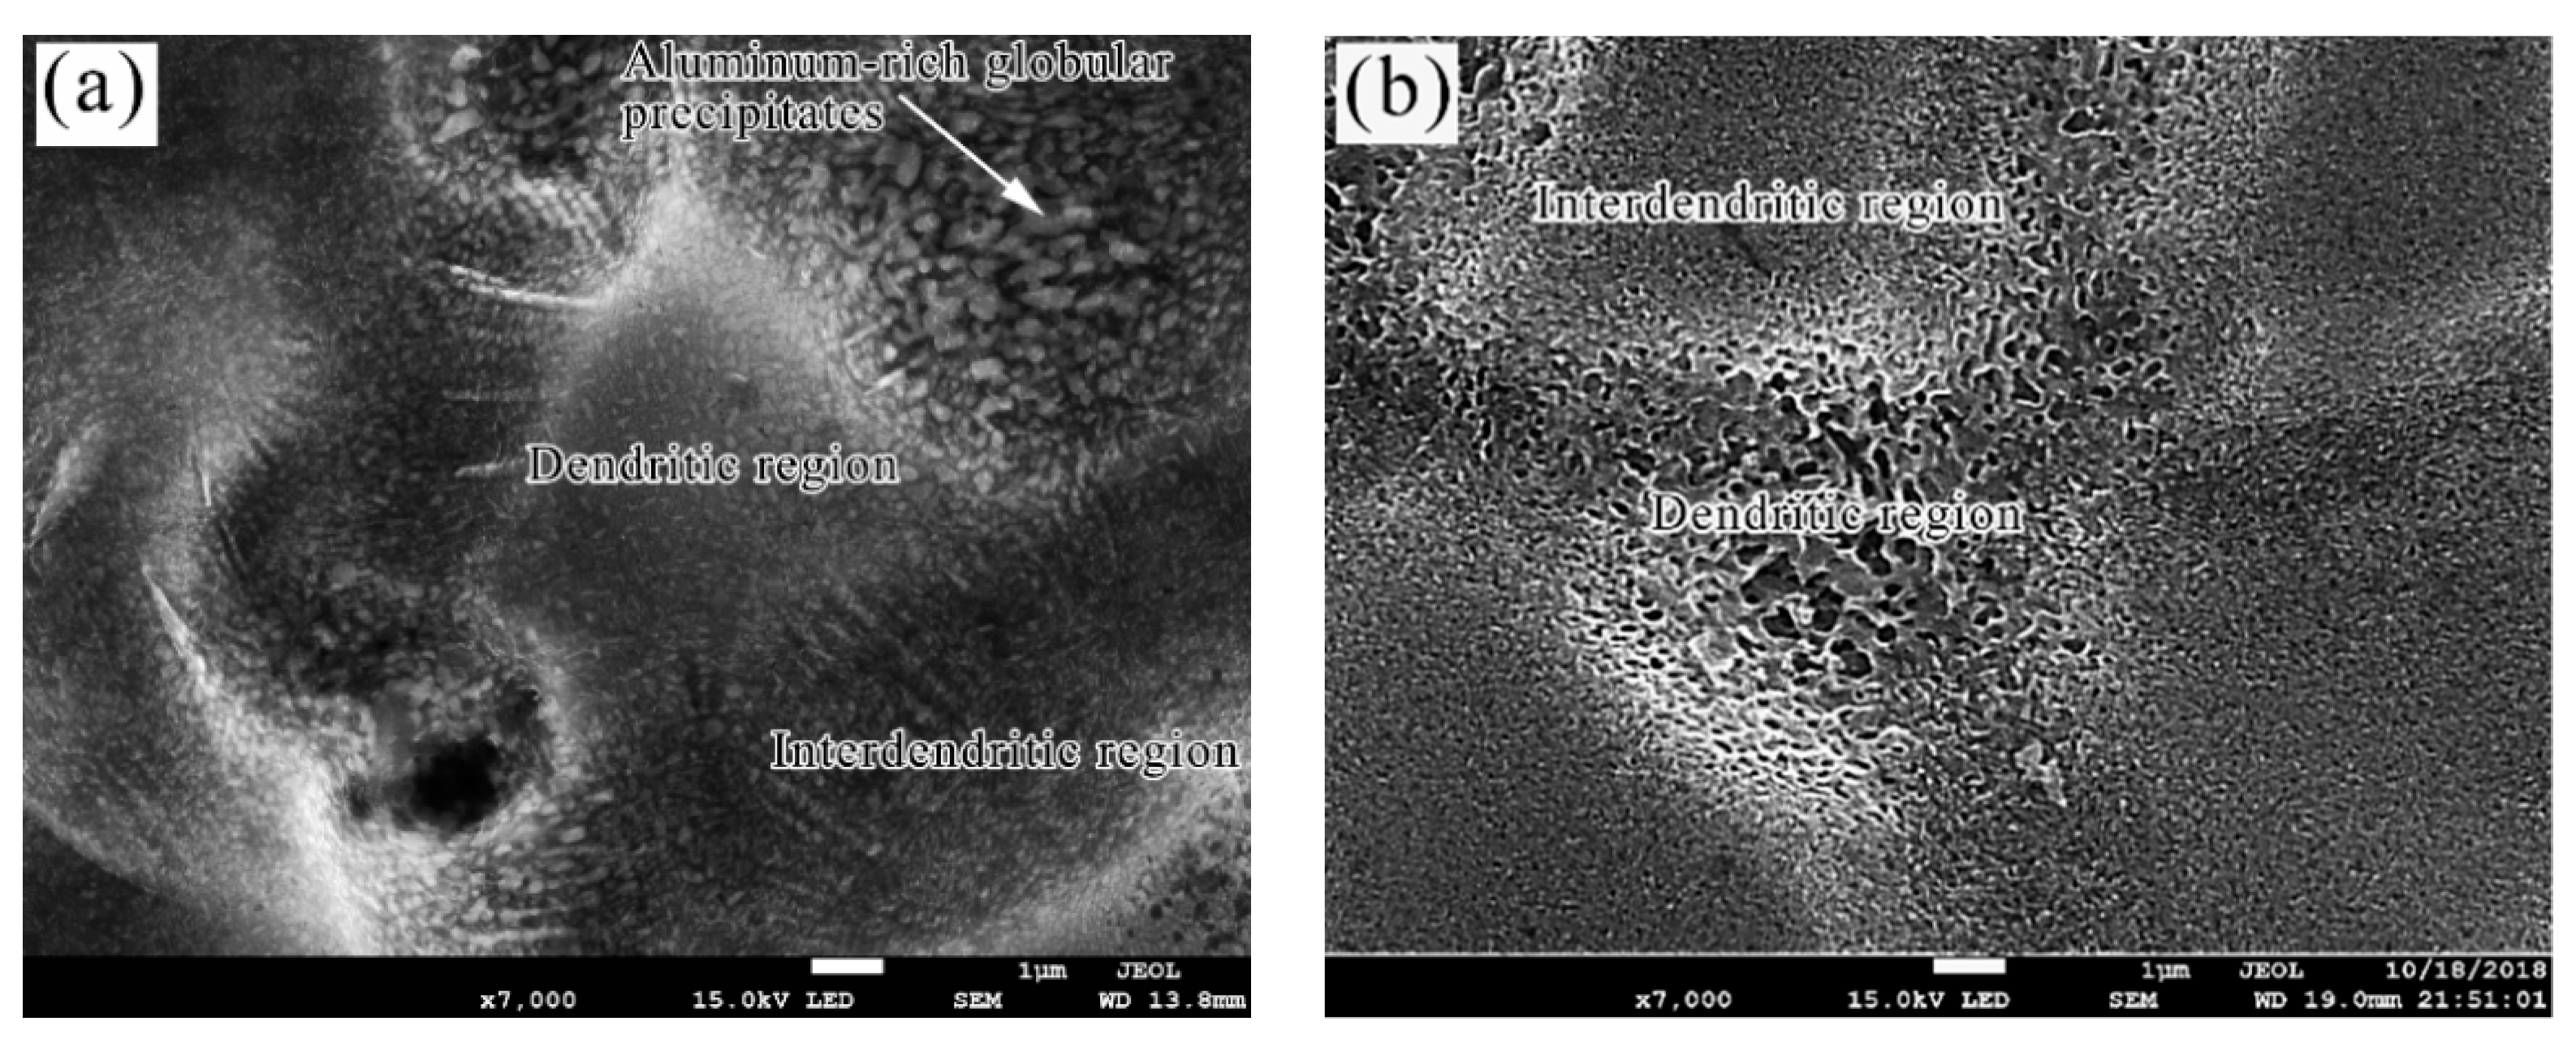
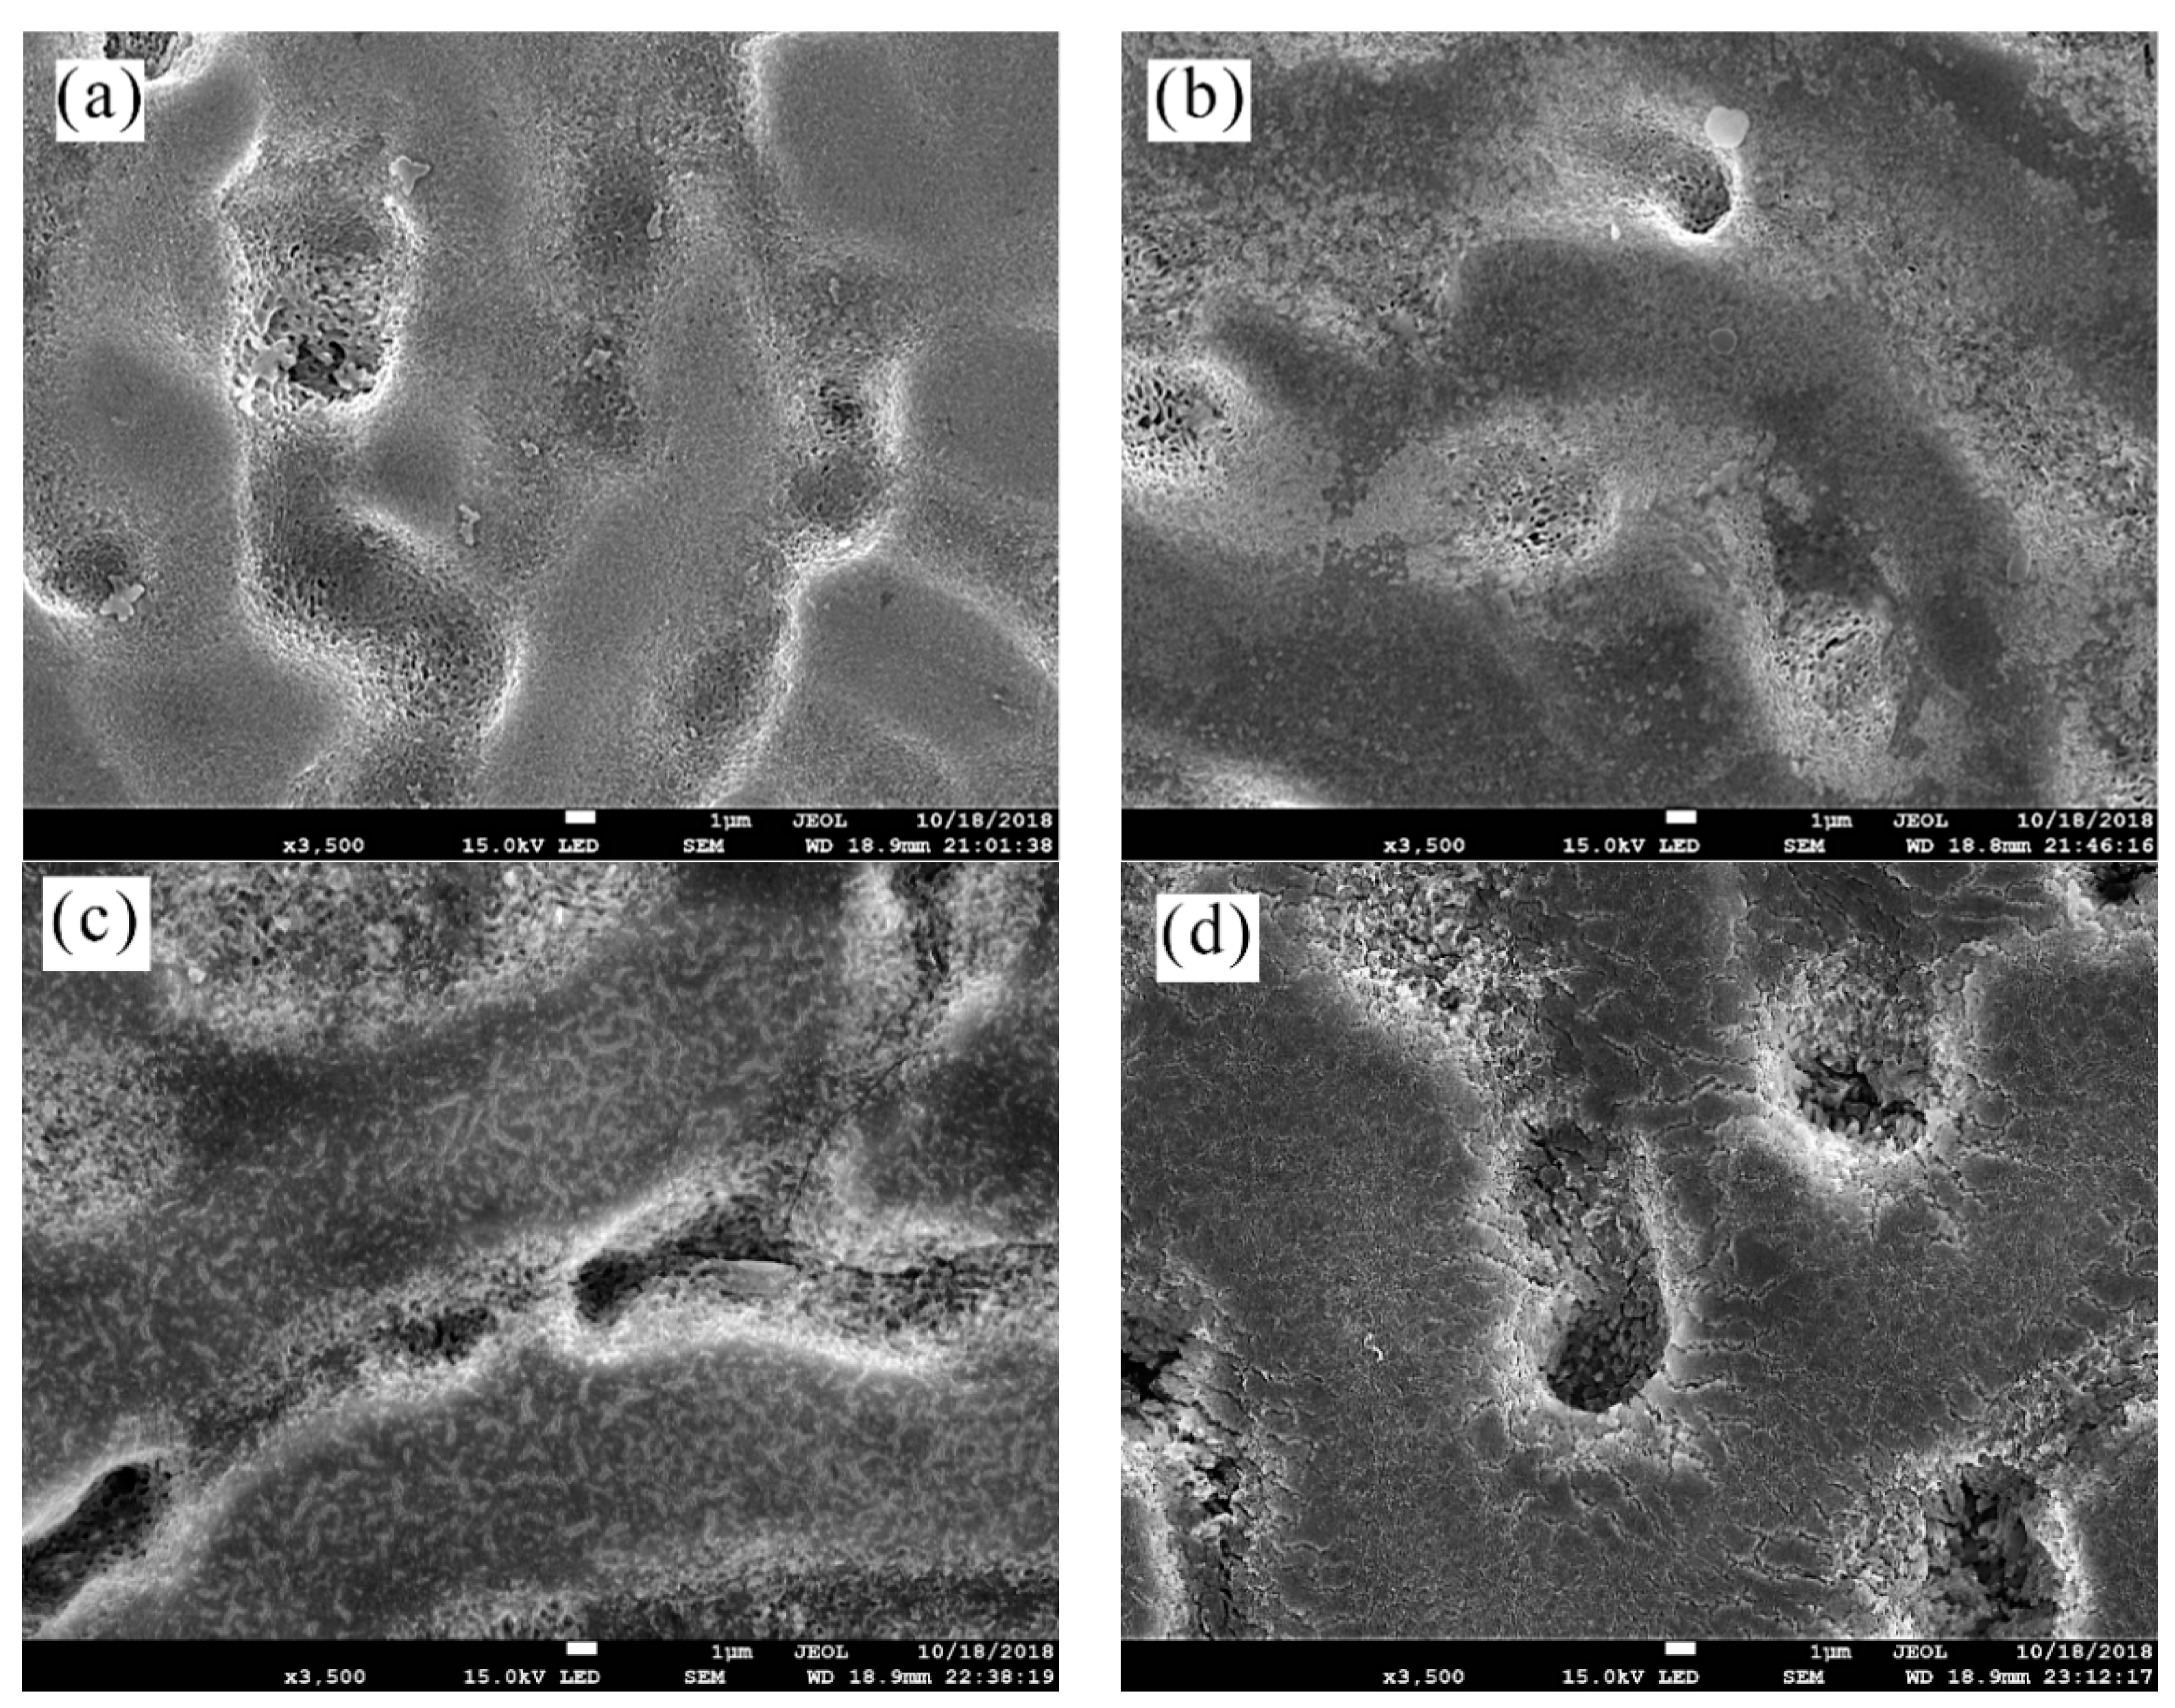
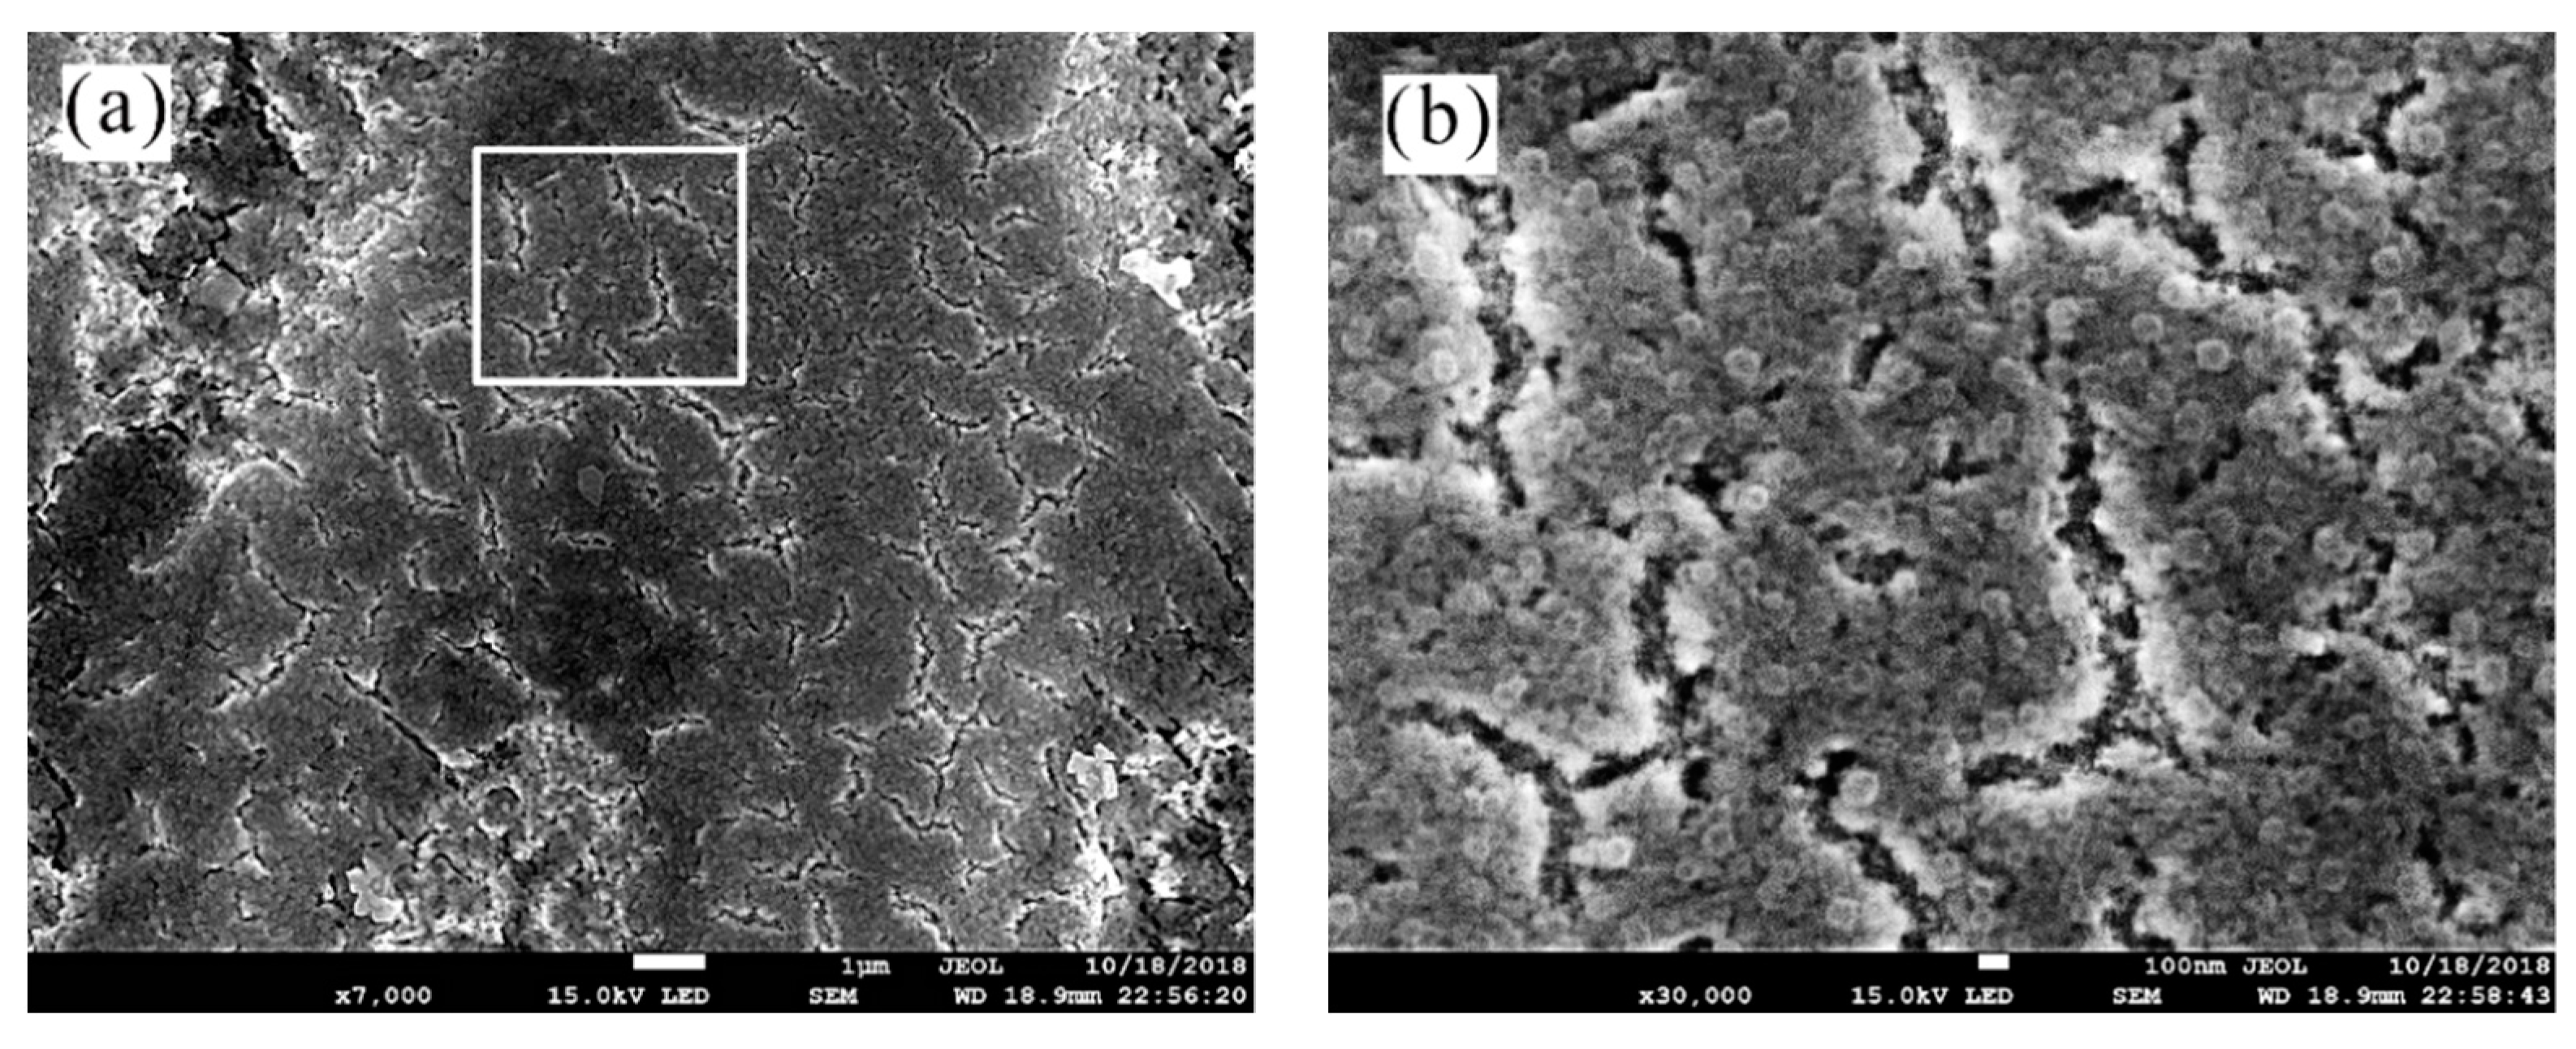
3.2. Surface Morphology Characterization

Figure 4 presents a comparison SEM micrograph of a bare and pre-treated Zn55Al surface. For untreated Zn55Al, the surface regularly distributes bulging dendritic regions and depressing inter-dendritic regions. Dendrites on the surface of Zn55Al are the aluminum-rich phase skeleton formed by undercooling during the hot-dipping process, and zinc-rich inter-dendritic regions are distributed in dendritic regions [4]. According to previous research, the inter-dendritic region properly distributed with spherical Al-rich particles, as shown in Figure 4a [4,36]. However, after pretreatment, the aluminum-rich spherical particles in the inter-dendritic region were dissolved, leaving a zinc-rich skeleton as shown in Figure 4b. Overall, pretreatment with pickling and alkali washing provided a microcosmically rougher surface for Zn55Al than untreated specimens. According to previous research, pretreatment plays an important role in removing the oxide layer on the surface and activating the surface of Zn55Al, which is beneficial to the formation of TCC [25,41,42].
Figure 5 shows plan-view SEM images of the surface prepared in the TCP bath for 0, 30, 180 and 360 s at 40 °C, respectively. The change of surface state shown in Figure 5 indicates that TCC does not form in the dendrite and inter-dendrite region at the same time, i.e., preferential film formation at dendrite. Figure 5b shows that dendrites are covered by the formed Cr(III) conversion coating immediately at the initial stage of film formation, i.e., 30 s. Parts of dendritic regions were strongly etched and continuously covered with lamellar Cr(III) conversion films. The immersion time of 0–30 s was shown to be the beginning of coating growth [30]. During the subsequent film-forming process, the dendritic and inter-dendritic regions became almost as rough after 180 s of TCC formation, as shown in Figure 5c, i.e., the contrast between concave and convex became weaker. Figure 5c also shows that after 180 s of TCP treatment, dendritic regions appeared dense micro-cracks in the vacuum environment, indicating a certain thicker TCC. A more cracked surface morphology after 360 s of film formation is shown in Figure 5d. The length of micro-cracks in the transition zone between inter-dendritic and dendritic regions is ~5 μm, which indicates a porous, thick film in this area.
Figure 6 revealed some fine micro-cracks in the dendritic region on Zn55Al by TCP-treated 180 s. The length of micro-cracks is less than ~2 μm, which is slightly shorter than the length of transition part between the dendrite region and dendrite inter-dendrite region. Microscopically, the conversion film at dendrite is composed of many nano-spherical particles with a diameter of ~100 nm [43]. Of course, this kind of high degree of micro-roughness, which is the most important feature of a conversion coating, could benefit the adhesion of the primers to the substrate surface.
According to previous research, micro-cracks are obviously caused by dehydration of the conversion coating, which is undoubtedly aggravated by a vacuum drying environment during SEM observations [24,27].

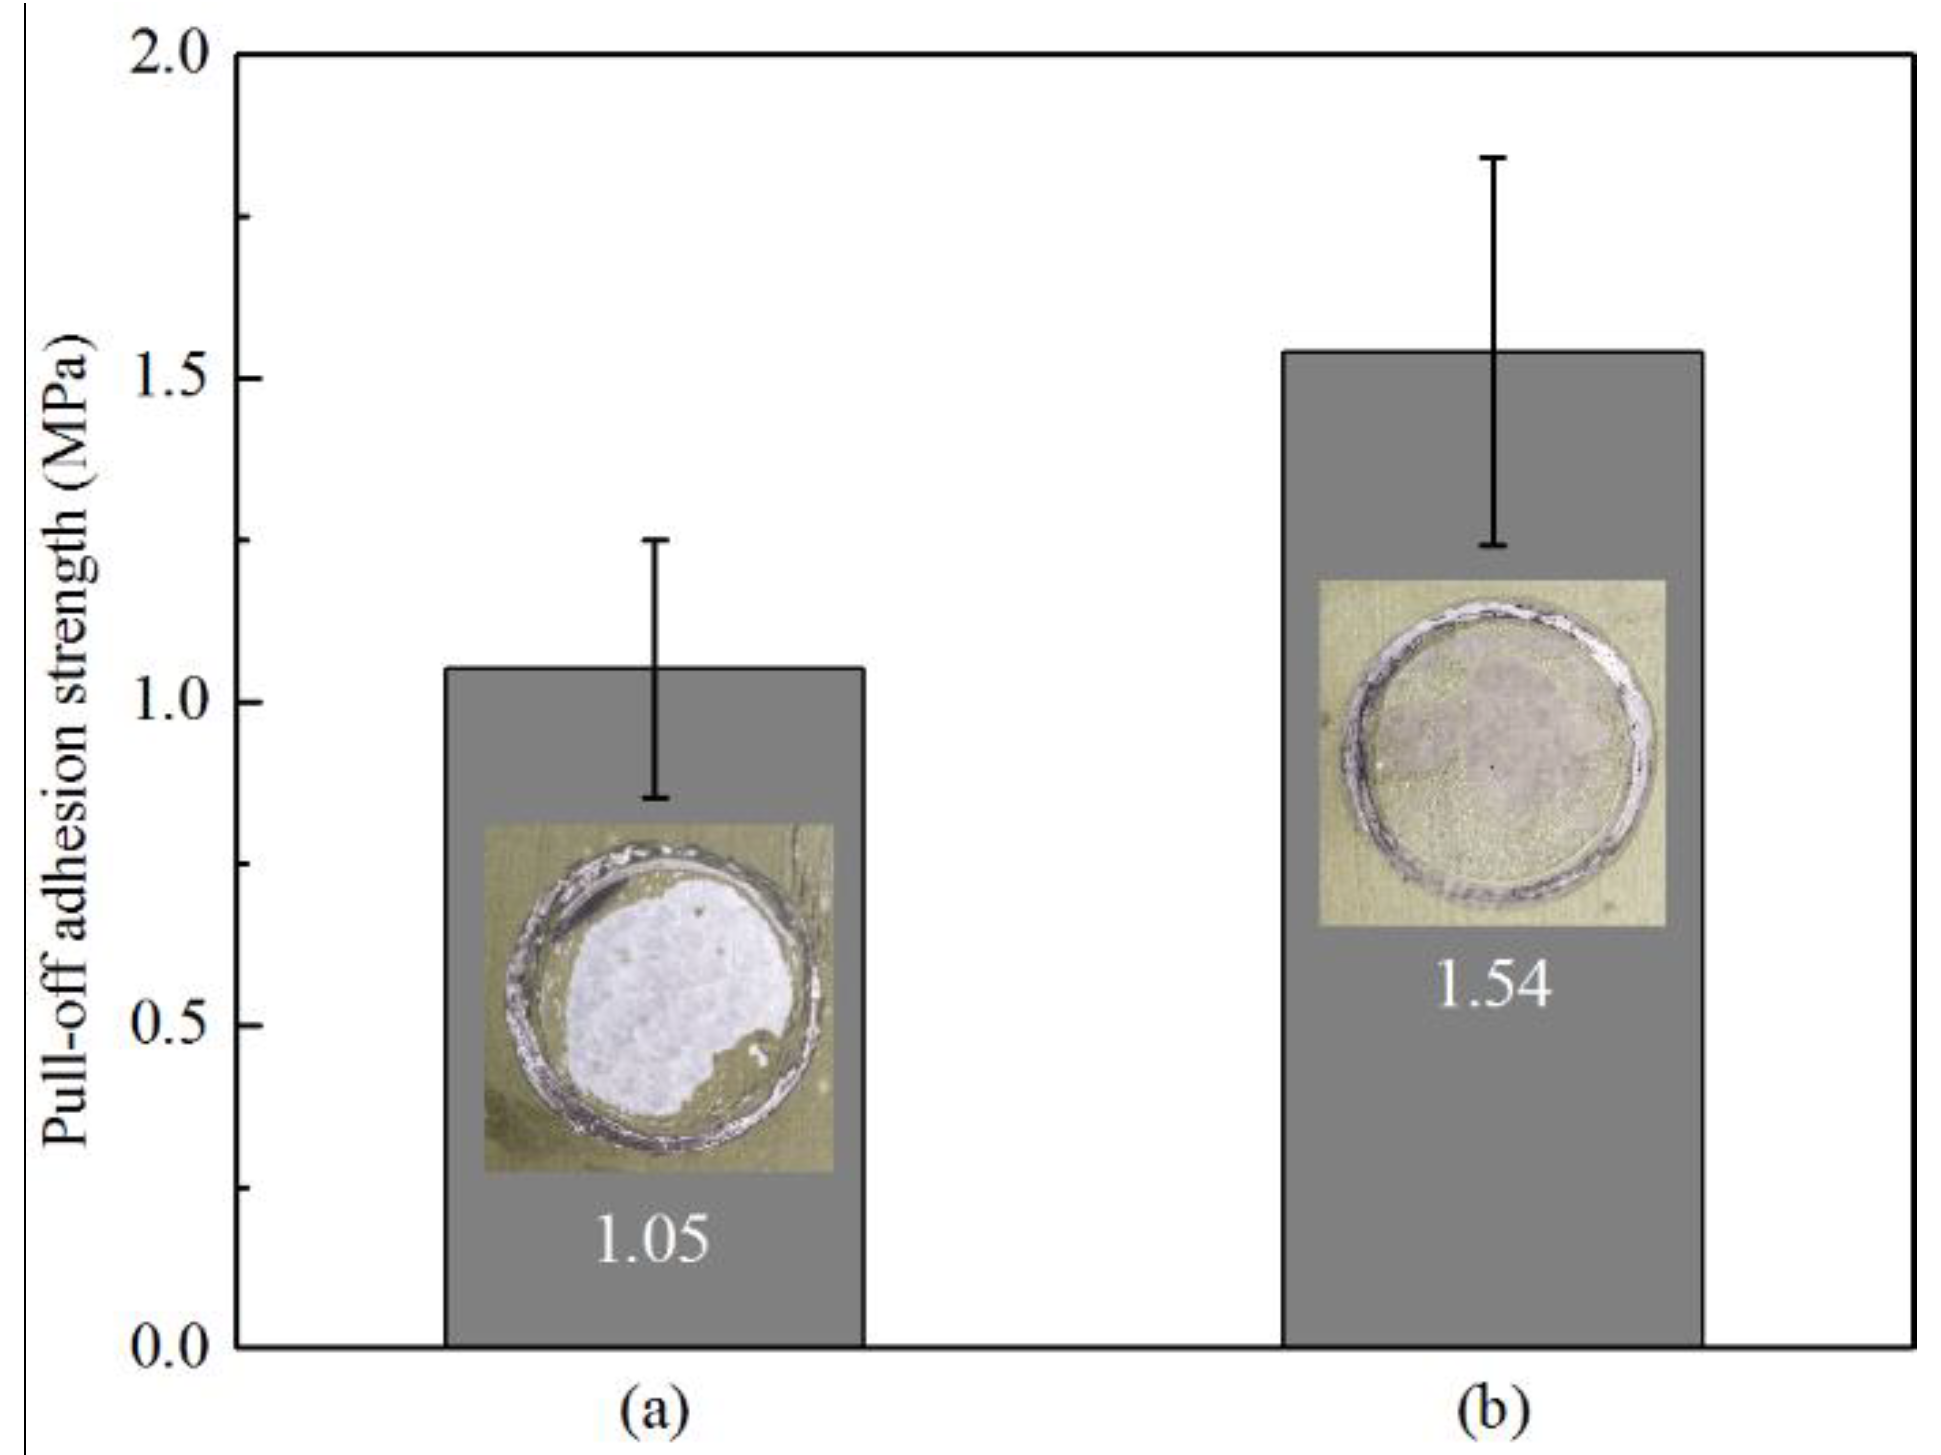
3.3. Pull-off Adhesion Measurements

In this work, dry adhesion of epoxy primer on untreated and TCP treated Zn55Al specimens was measured by the standard pull-off methods. Results obtained from a pull-off test, and also the photographs of the specimens after this test, are presented in Figure 7 with the bonding strengths at approximately 1.54 and 1.05 MPa for TCP treated and bare Zn55Al, respectively. From Figure 7 it can be clearly seen that the adhesion strength of TCP treated specimens with epoxy primer increased by 47.61%. The test area of the bare Zn55Al coated by the epoxy primer exhibits nearly 80% detachment at the interface with the substrate, while more epoxy primer adhered to the surface of the TCP treated specimen. It is evident that the improvement of the adhesion bonds between epoxy primer/substrates after formation of conversion coating leads to debonding from the internal layer of the epoxy primer [14,15].

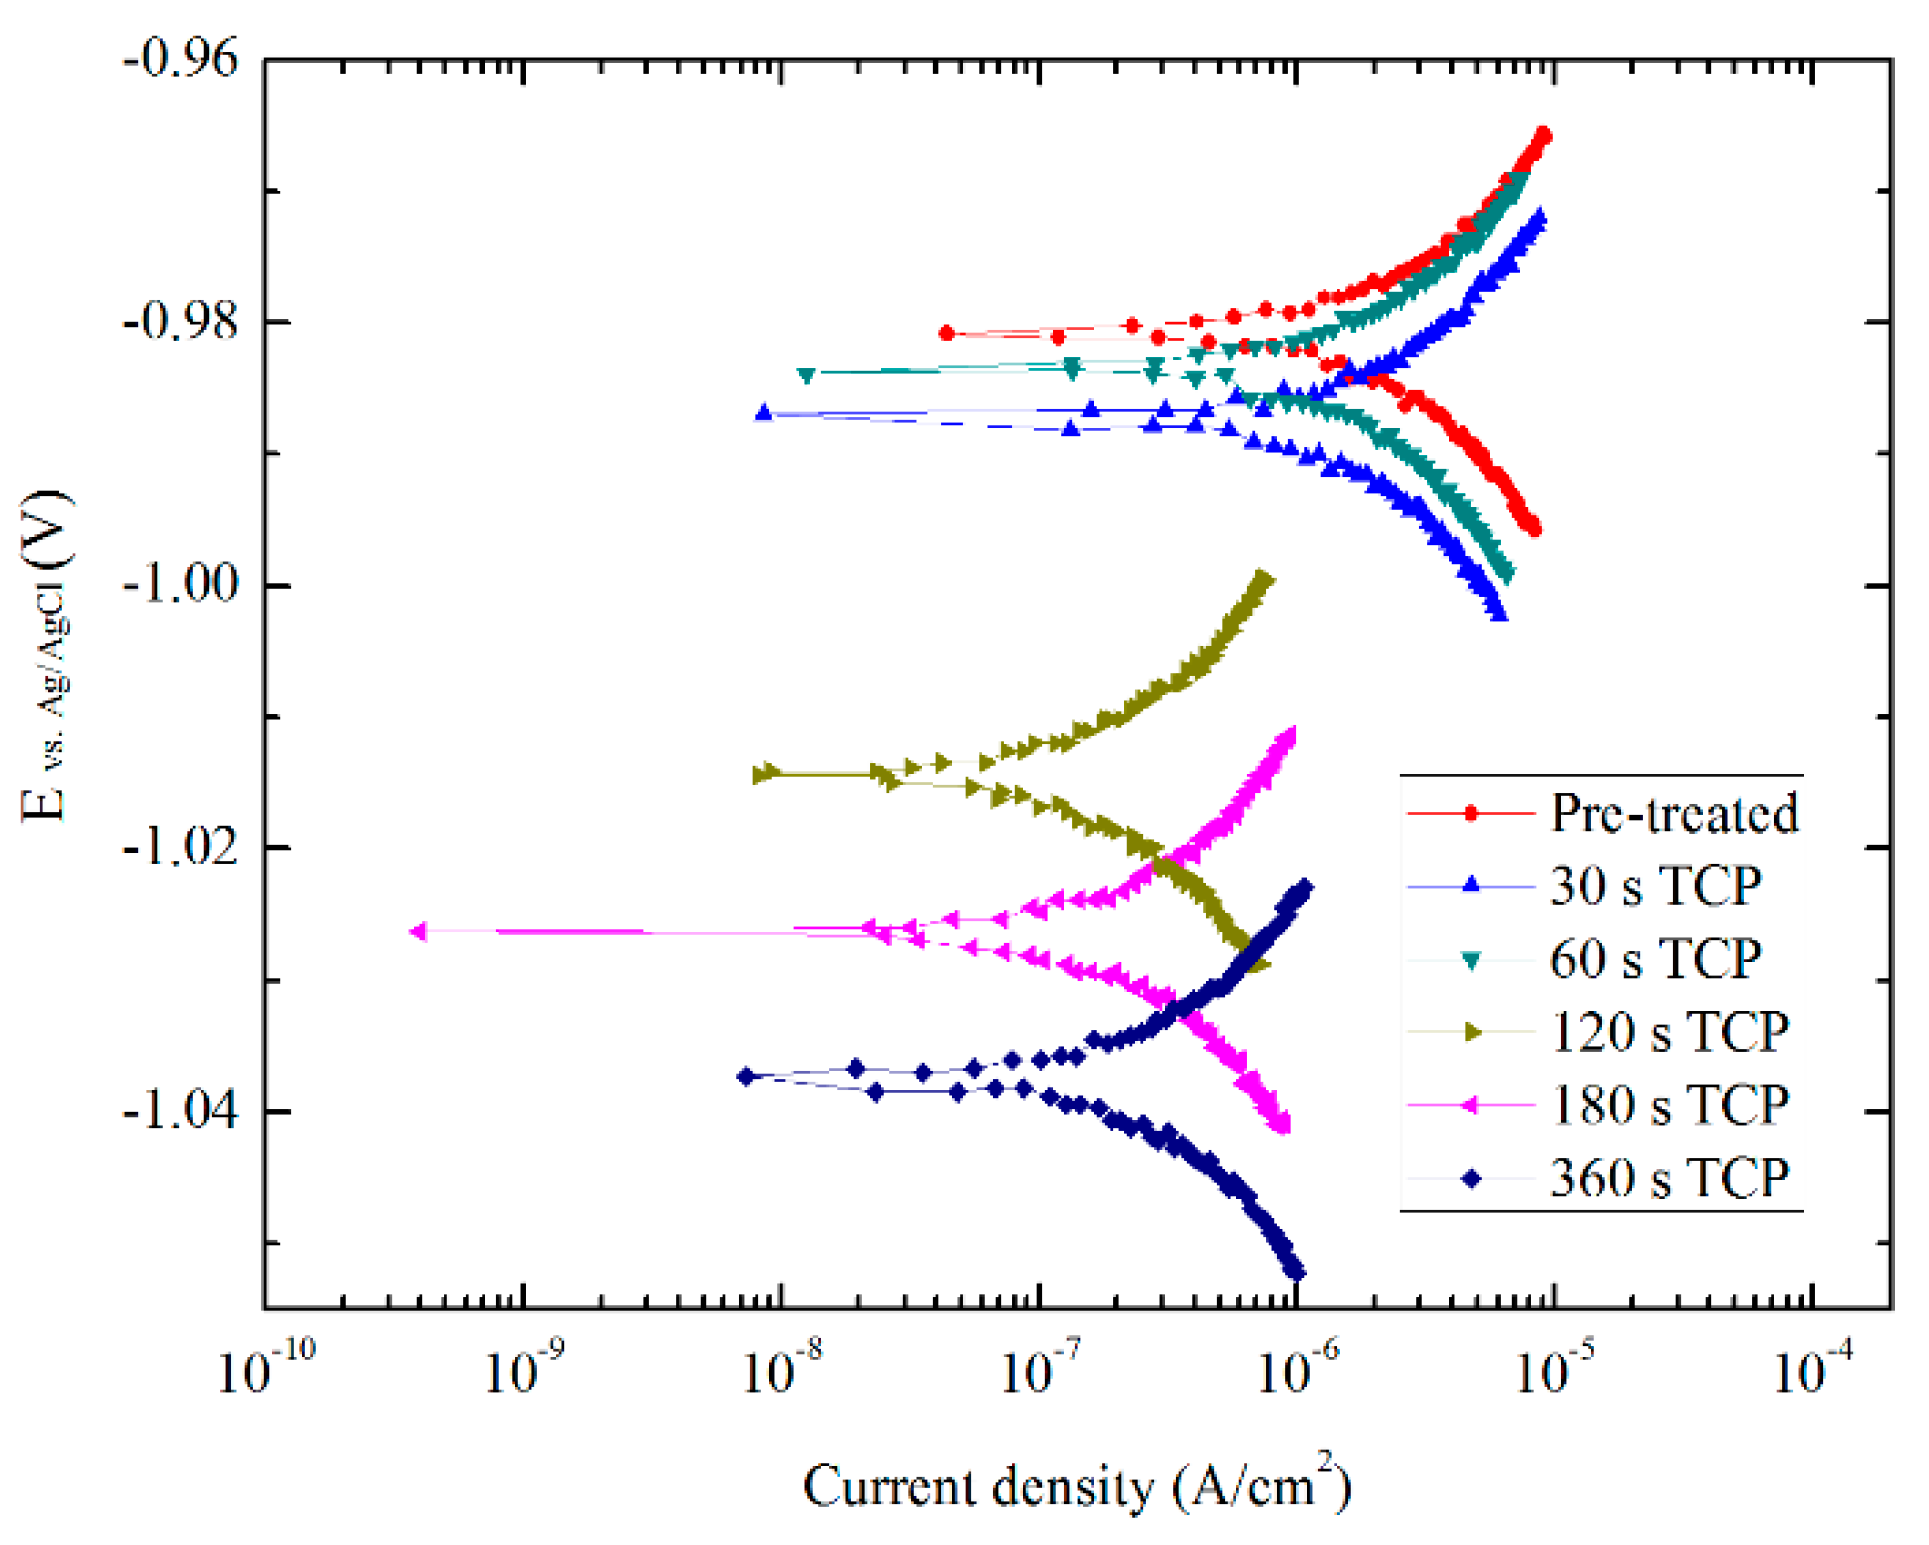
3.4. Electrochemical Characterization

The polarization curves performed from −0.015 to 0.015 V vs. OCP in 0.5 M NaCl solutions of Zn55Al treated by TCP for 30, 60, 120, 180, and 360 s are depicted in Figure 8. Within the range of ~20 mV near the corrosion potential Ecorr, the relationship between polarization current i and polarization potential E is linear. The polarization resistance Rp which is an important thermodynamic parameter of corrosion electrochemistry, can be obtained by the slope of linear zone near the free-corrosion potential Ecorr. According to Butler-Volmer polarization curve equation, the relationship between Rp value and icorr is as follows [44]:
i c o r r = b a b c 2.3 ( b a + b c ) × 1 R P
Define:
B = b a b c 2.3 ( b a + b c )
Therefore,
i c o r r = B R p
In general, the value of B is ranging from 17 to 26 mV [45]. Under the condition of a micro-polarization test, the values of ba and bc cannot be obtained by linear extrapolation method in the Tafel region. Therefore, the weak polarization curves of the Zn55Al sample after 180 s TCP treatment and pre-treated Zn55Al sample were measured in 0.5 M NaCl solution with the same scanning rate and electrochemical parameters. The values of ba and bc were obtained by non-linear fitting results based on a polarization curve equation with a range of ~±60 mV near the Eocp and the B was calculated using Equation (3) [46]. For TCP treated samples, the value of BTCP is different from that of the pre-treated sample (B0), and its value will not change much for TCCs under other film-forming periods. In this paper, defined B0 and BTCP as a constant based on the calculated results, i.e., 19 and 22 mV respectively, and the approximate values of current density of Zn55Al samples in 0.5 M NaCl solution were calculated by Equation (4) [47]. The polarization resistance (Rp), corrosion potential (Ecorr), corrosion current density (icorr) from Figure 8 are summarized in Table 1.
As revealed by Table 1, by comparing the polarization resistance of Zn55Al specimens under different treatment conditions, the Rp value significantly increased with the prolonging of the TCP-treatment time, and Zn55Al specimen treated by TCP for 180 s at 40 °C revealed the highest Rp value. The Rp values of TCC formed by 180 and 360 s are one order of magnitude larger than that of the pre-treated specimen, and the values of corrosion current density are nearly one order of magnitude lower than that of the latter accordingly. Therefore, the Zn55Al surface treated in the TCP bath for 180 s revealed a better anticorrosive performance compared to other treatment time. However, the Rp value of the specimen treated for 360 s in the TCP bath decreased again, and the corrosion current density increased slightly to 1.4996 × 10⁻⁶ A/cm2. For Zn55Al, 180 s is a suitable experimental parameter for TCP treatment, and the TCC film forming effect is the best at this time. Excessive treatment time will bring additional defects such as micro-cracks on the surface, and descends the corrosion resistance of the specimen surface.

3.5. Surface Composition Analysis

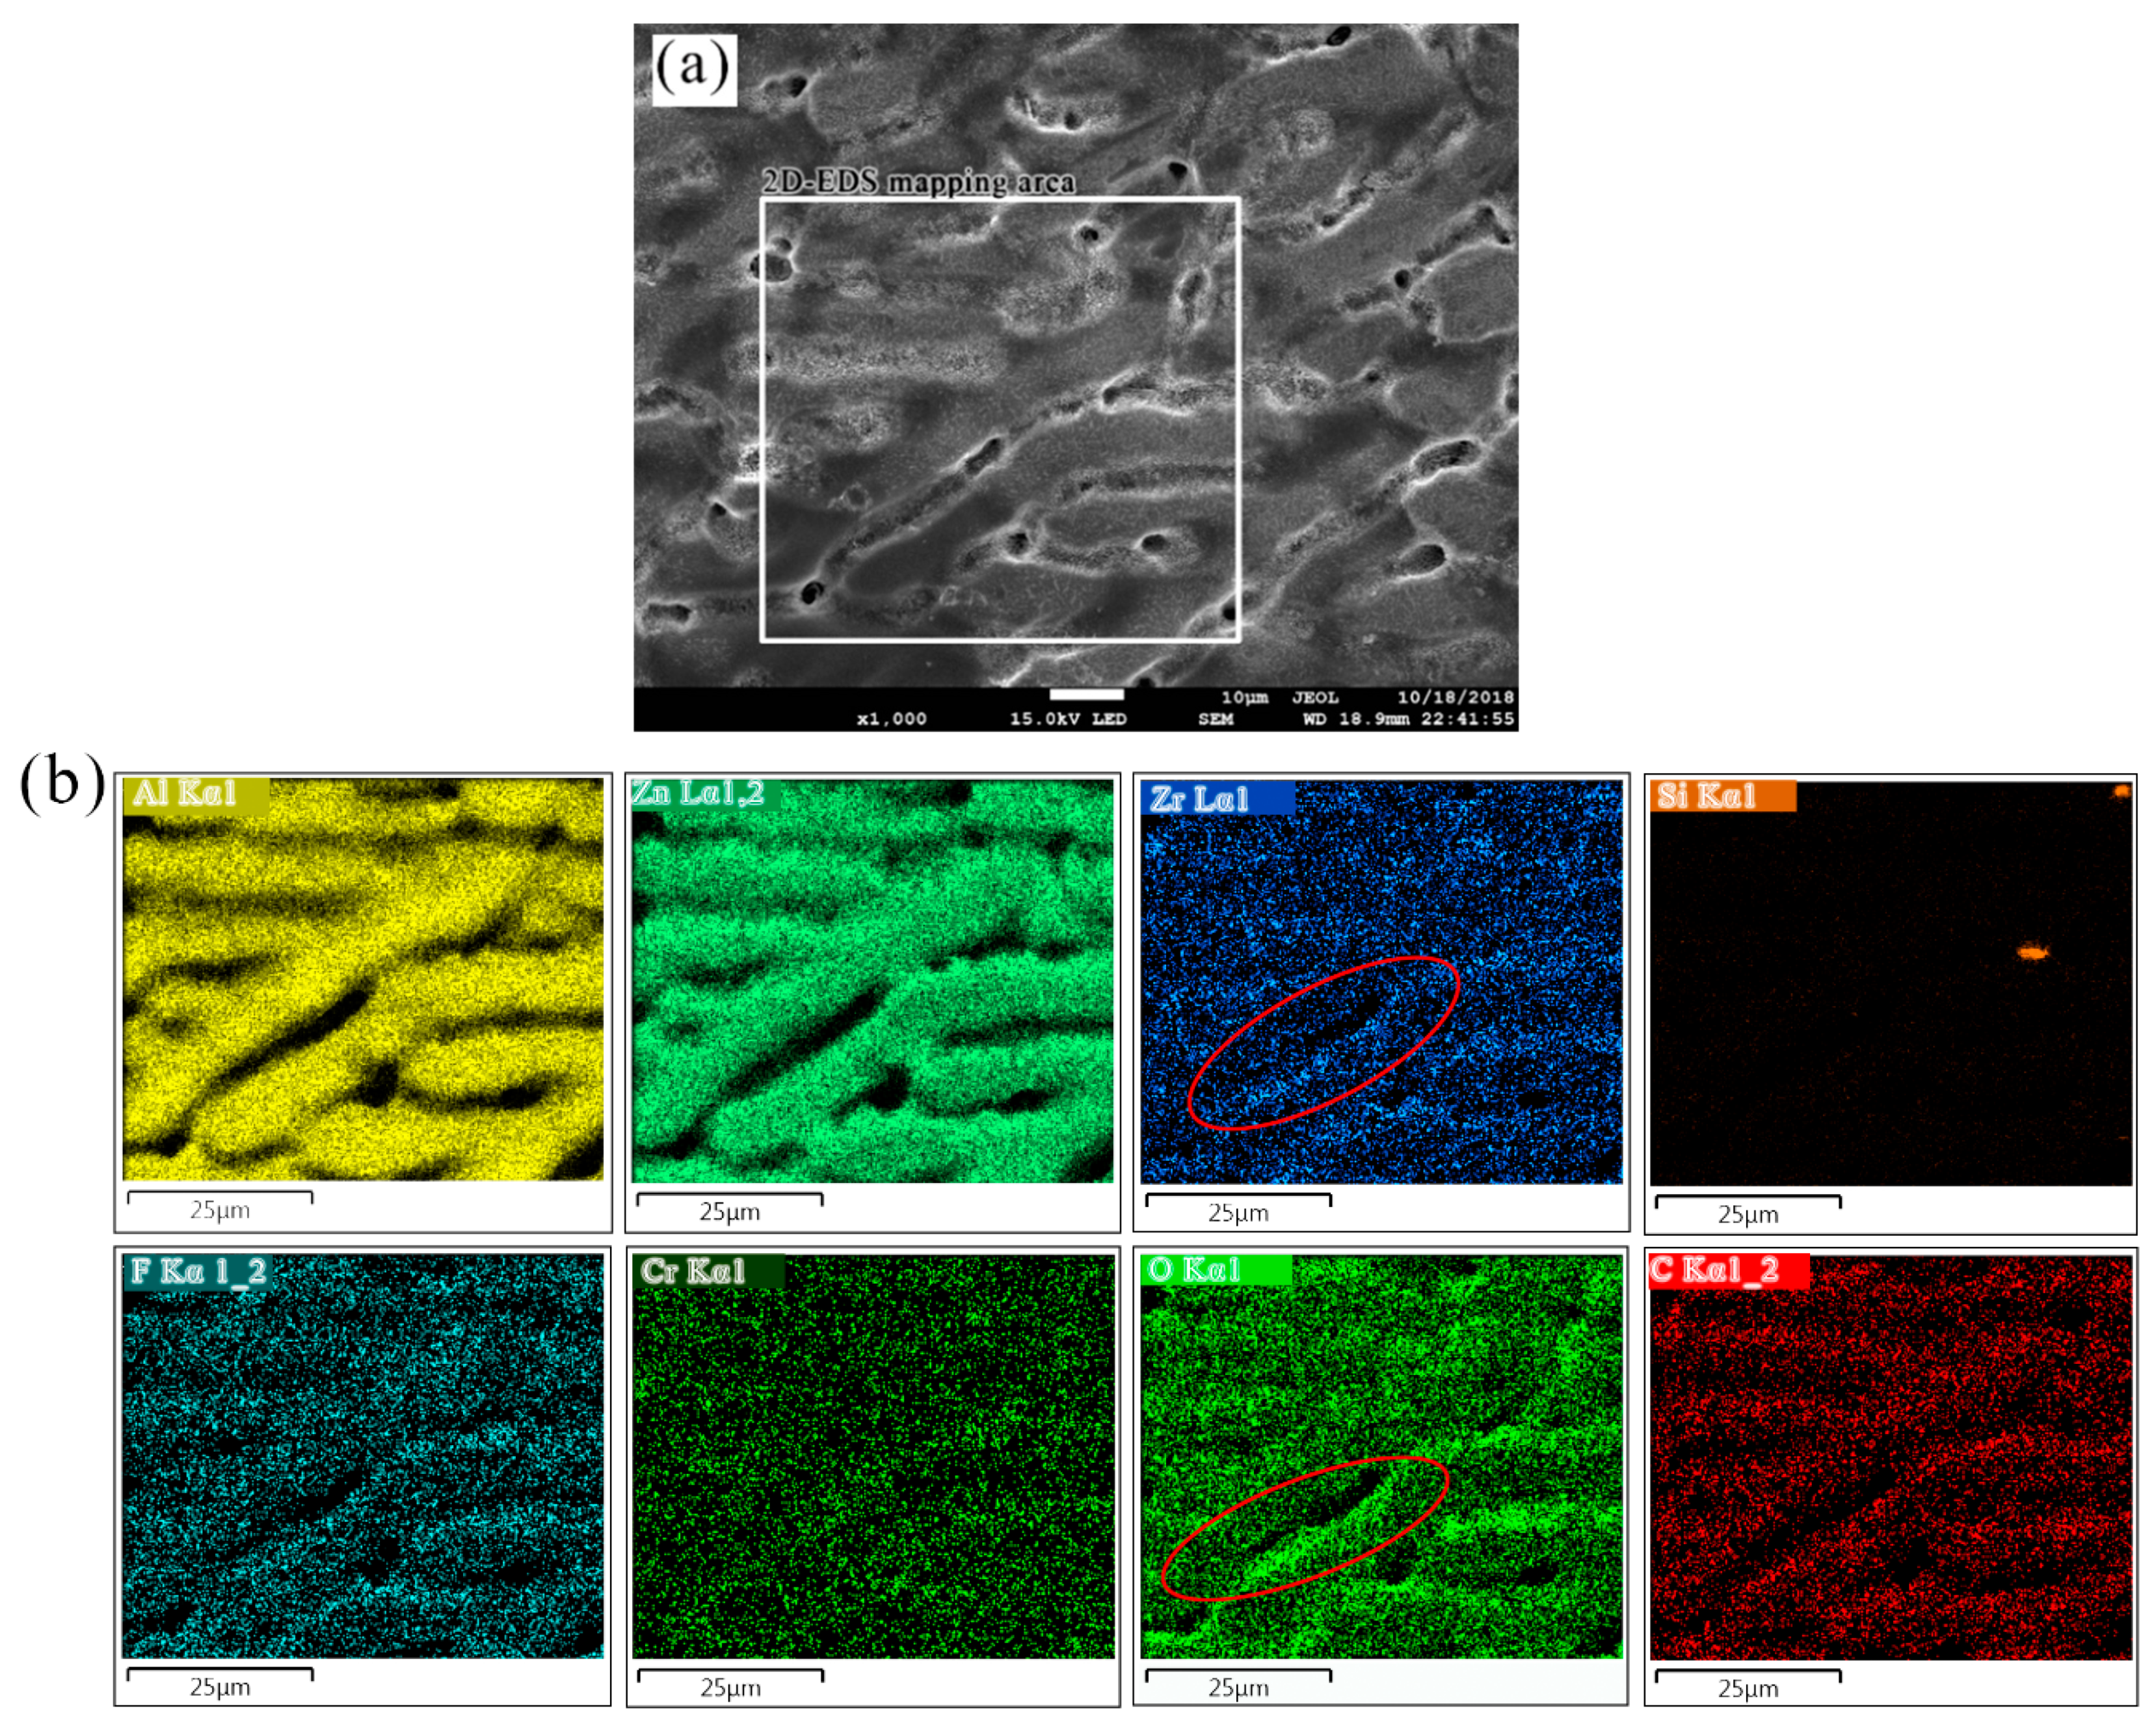
3.5.1. Composition of Coating from EDS/AES

EDS elemental distributions maps of aluminum, zinc, oxygen, zirconium, fluorine, carbon, silicon, and chromium marked with rectangle were displayed in Figure 9. Because the detection depth of EDS is micron level and can only be scanned in a certain depth of field, so the element distribution in the inter-dendritic zone cannot be well displayed and the element beneath the TCC can also be detected. However, in the transition zone between dendrites and interdendrites, the distribution of oxygen, zirconium and chromium appears to be higher than that in other regions (marked in the EDS mapping of element Zr and O), which indicates that TCC thickness here is larger, and the transition zone is the area where the micro-cracks mentioned are more dense.
The SEM morphologies of the specimen sputtered for 0, 10, and 30 min are shown in Figure 10. With the increase of sputtering depth, more micro-cracks were exposed, indicating that TCC with 180 s film formation time followed by storage in ambient air for at least 24 h on Zn55Al surface has a porous character within a certain surface thickness.
The AES elemental atomic in-depth distribution of typical dendritic region (DR) and inter-dendritic region (IDR) (marked in Figure 10) on Zn55Al surface treated by TCP for 180 s is given in Figure 11. The depth information of AES profile is obtained by calculating sputtering rate and sputtering time. Except the element of carbon, the concentration of film-forming elements such as chromium, zirconium, and oxygen increased gradually since ~10 nm.
According to the distribution trends of chromium and zirconium in Figure 11b and oxygen in Figure 11a, it can be deduced that the main part of the TCC in dendritic region is ranging from 50 to 310 nm beneath the surface. This elemental in-depth distribution results indicate that TCC at dendritic region is not a single structure, but has a multilayer structure. At more significant depths, judging by the increasing contents of Al and Zn and the decreasing contents of other TCC film-forming elements such as Cr and Zr, it can be concluded that the interfacial layer near the substrate is Al and Zn rich [23,24]. This stratification phenomenon has also been reported by AES analysis of chemical conversion coatings on AA6014 and AA7075 aluminum alloys, in which a bilayer structure was also detected [28,32,35,41].
The ratio of Cr/Zr is also an important parameter since these elements co-precipitate to form the coating [33]. It is noteworthy that in the dendritic region, the Cr/Zr atomic ratio ranged from 1.85 to 2.98 in the main part of the TCC and the maximum value of this ratio occurs at the depth of 120 nm, which is larger compared to the reported XPS results (i.e., ~0.45) of TCCs formed on the surface of AA 2024 aluminum alloy [42,48].
In the inter-dendritic region, the contents of chromium, zirconium, and oxygen reached their maximum value at 300 nm. The ratio of Cr/Zr increased from ~1.86 at 50 nm depth to ~5.92 at 300 nm, slightly larger than that at dendritic region. Figure 11c,d show that the element zinc and aluminum reached a larger content at ~410 nm, indicating that the main distribution of TCC at the inter-dendritic region was slightly thicker than that in dendritic region. However, the stratification phenomenon in the inter-dendritic zone is not as obvious as that in the dendritic zone. As an important participant in TCC formation, fluorine is widely distributed in the conversion coating. In addition, the carbon content detected in the surface layer of TCC in the inter-dendritic zone is very high, the probably reason can be attributed to carbon-based contaminations [28]. But specific reasons need to be further studied.

3.5.2. Chemical States of TCC Species from XPS

XPS were carried out on a typical specimen treated by TCP bath for 180 s followed by the storage at ambient air for at least 24 h. Figure 12 shows the overview XPS spectra acquired from the TCC on Zn55Al surface and the overview spectrum shows strong signals for Zr, O, and F. This indicates that the main components of TCC are oxides and fluorides, and in addition to chromium, zirconium also participates in the formation of TCC.
Figure 13 shows the high-resolution spectra for Cr 2p3/2 photoelectron regions. Four peaks were used to fit intensity in the region of 570.0 to 585.0 eV, including Cr(OH)3 (577.2 ± 0.2 eV), Cr2O3 (578.2 ± 0.2 eV), CrF3 (580.1 ± 0.2 eV) and Cr(VI) oxides (579.6 ± 0.2 eV) [23,25]. According to peak fitting results, at the depth of 5 nm below the surface of TCC, ~25.18% of Cr exists in the form of Cr2O3, ~44.92% in the form of CrF3, while the content of Cr(OH)3 is only ~9.45%. In addition, ~20.45% of chromium exists in the form of Cr(VI), which indicates that Cr(VI) appears on the TCC surface formed on Zn55Al exposed to acquired air and other media. Li et al. reported that the Cr(VI) forms due to the oxidation of Cr(III) oxide by locally produced H2O2 at cathodic areas on the substrate [49].
The high resolution spectrum of the Zr 3d region, including two spin orbit split doublets of Zr 3d5/2 and Zr 3d3/2, shown in Figure 14, was fitted by ZrO2 (185.3 ± 0.2 eV) for Zr 3d3/2, ZrO2 (182.9 ± 0.2 eV) for Zr 3d5/2 [13,50], ZrF4 (184.5 ± 0.2 eV) [51] and Zr(OH)4 (184.0 ± 0.2 eV) for Zr 3d5/2 [42]. About ~69.61%, ~29.94% and ~0.46% of the zirconium were in the form of oxide, fluoride and hydroxide, respectively. This indicates that Zr on the surface of TCC mostly exists in the form of oxides, and proves that the formation of ZrO2 complies with the following chemical equation [34,49,52]:
ZrF 6 2 + 4 H 2 O ZrO 2 · H 2 O + 6 HF + O 2
As reported by previous research, hexafluorozirconate in the TCP bath plays an important role in the whole process of TCC film formation. The hydrolysis of ZrF62− is the beginning of the whole chemical conversion and leads to formation of a fresh hydrated layer and results in activation of the surface, lowering of the corrosion potential and increasing in the hydrophilicity of the surface [24,35,53]. From Figure 11, zirconium containing compounds are concentrated in the middle depth of the TCC, which means Zr is the main participant in the formation of TCC both within the inter-dendritic and dendritic regions.
Figure 15 and Figure 16 show the high resolution XPS spectra from the Al 2p3/2 and Zn 2p3/2 regions. The presence of Al2O3, Al(OH)3 and AlF3 is indicated by the Al 2p peaks at 74.7, 75.7, and 76.3 eV, respectively [23,54,55,56]. The fitting of the Zn 2p peaks was achieved with a Zn(OH)2 peak at 1022.7 eV, a ZnSO4 peak at 1023.1 eV [57], a ZnF2 peak at 1022.8 eV [58] and a ZnO peak at 1021.9 eV [59]. In the outer ≈5 nm of the coating thickness, all the content of Al2O3 and Al(OH)3 are ~21.87%, and the content of AlF3 is ~56.26%. The results of Zn 2p3/2 are different from that of Al 2p3/2. Except ~46.84% of Zn(OH)2 and ~8.41% of ZnF2, no obvious ZnO has been revealed (~0.36%), and the possible ZnSO4 has appeared in the fitted results, the proportion of which is ~39.58%. The presence of ZnSO4 may be a residue of the combination of oxidized Zn2+ and SO42− ions in diluted TCP bath, and the fitting result at the Zn 2p1/2 region (1046.2 eV) is also in agreement with this conclusion.

4. Discussion

The effects of treatment time on surface morphology, composition, roughness, corrosion resistance, and adhesion of epoxy primer of Zn55Al were investigated in the present work and it has been proven that the trivalent chromium conversion coating can improve the corrosion resistance of the matrix in an aggressive electrolyte solution and the adhesion of the primer, and the optimum film formation time is 180 s at 40 °C in a diluted Cr(III)-based solution.
On one hand, the process of Cr(III)-based conversion treatment remarkably improves the adhesion of primer as compared to the untreated Zn55Al surface as shown by the measurement of the pull-off bonding strength. This coincided with the results of the aluminum alloy samples modified with Zr-based conversion coatings [14]. In Figure 3, the roughness of Zn55Al surface decreased by ~14.56% in the short period of 30 s after TCP treatment compared with that of untreated, showing the strong etching and leveling effect of TCP on Zn55Al surface. However, as illustrated by Figure 5, in both dendritic and inter-dendritic regions, TCP treatment results in an increase in surface roughness of Zn55Al by nanometric micro-scale, which in turn improves the mechanical inter-locking between the epoxy primer and the substrate [11,14,60]. Figure 17 shows the photographs of 4 μL water droplets on the TCP treated Zn55Al sheets. The water contact angle of TCP treated samples gradually decreased with the extension of TCP treatment time, as a result of the reduction of apparent surface energy [60]. The epoxy coating has polar nature due to the presence of ether and hydroxyl groups in its chemical structure. The hydrophilicity of the TCP treated specimen helps the establishment of stronger adhesive polar-polar bonds between the epoxy coating and modified substrate instead of the original weak physical bonds, such as hydrogen bond or van der Waals force [8,61].
On the other hand, according to the electrochemical results in Figure 8 and Table 1, TCP generated at 180 s has an attenuated corrosion current density, which corresponds to the maximum polarization resistance. Compared with the Zn55Al specimen only pretreated by alkaline washing and pickling, the corrosion current density decreased by one orders of magnitude after TCP treatment for 180 s.
It has been reported that the conversion coatings provide cathodic protection on aluminum, zinc, and hot-dip galvanized steel [62,63,64]. In near-neutral aggressive electrolyte solutions with and without oxygen, as shown in Figure 18, the cathodic polarization curves of Zn55Al specimens were compared in this part. The cathodic corrosion current density of uncoated Zn55Al specimen at corrosion potential is much smaller in the de-aerated 0.05 M NaCl solution, compared with the current density in the aerated solution. Therefore, the corrosion of Zn55Al surfaces takes place under cathodic control, and the reduction in the corrosion rate can be brought about by inhibiting the oxygen depolarization corrosion on bare Zn55Al surface [65]:
O 2 + 4 H + + 4 e 2 H 2 O   ( in   aerated   solution )
In order to evaluate the anticorrosion property of TCC on Zn55Al, cathodic polarization curves were also measured on specimens treated by 180 s at 40 °C in the TCP bath. As shown in Figure 18 and Table 2, cathodic current at potentials close to Ecorr measured on Cr(III) treated Zn55Al specimen in the aerated 0.05 M NaCl solution is significantly smaller than that on the uncoated specimen, to an extend of an order of magnitude (with 2.13 × 10 −7 and 4.81 × 10⁻⁸ A/cm2 separately). Hence, it is clear that Cr(III) coatings formed an effective physical barrier layer which hindered the transportation of oxygen and corrosive chloride ions to the Zn55Al substrate, and the corrosion of Zn55Al can be retarded. However, as shown in Figure 5, the effect of TCC as a corrosion barrier does not increase with the prolongation of TCP treatment time due to the micro-cracks on TCC surface that is most commonly observed [24]. This result is consistent with previous reports by Golru et al., that is, the AA1050 aluminum alloy specimens treated in a zirconium-based bath at an immersion time greater than 3 min did not shown a better corrosion resistance [14].
Previous studies have shown that the kinetics of chemical conversion film formation is the increase of pH, and the initial hydroxyl framework on the surface also plays an important role in subsequent film formation [29,66]. With the increase of pH at the newly formed TCP surface (from 2.6 to 9), the reaction kinetics decrease gradually [24]. Due to the low pH of TCP bath, the oxidation reaction of Al-rich dendritic regions takes place first:
Al Al 3 + + 3 e
The dissolved Al3+, Cr3+ and Zn2+ ions are precipitated into Al(OH)3, Cr(OH)3 and Zn(OH)2 by combining with OH ions generated by the reduction of dissolved oxygen and hydrogen evolution [13,67]:
2 H + + 2 e H 2
O 2 + 2 H 2 O + 4 e 4 OH
However, the surface of freshly formed TCC is easy to dehydrate in air with prolongation of time, and some hydroxides may dehydrate into oxides. This hypothesis explains the reason why some oxides appear in the XPS fitting results of Al and Cr. And aluminum-rich region may also be hydrolyzed directly to form Al2O3, which jointly forms TCP inner layer in dendritic region with Al(OH)3 [66]:
2 Al + 3 H 2 O Al 2 O 3 + 6 H + + 6 e
According to AES results as shown in Figure 11c,d, zinc in the inter-dendritic region mainly distributes in the inner layer of TCC, and the content of aluminum is always higher than that of zinc. We speculate that alumina and aluminum hydroxide formed in the dendritic region migrate to the inter-dendritic region shortly after TCC formation, which prevents the continuous precipitation of Zn(OH)2. And the depressions in the inter-dendritic region are filled with precipitated particles formed during film formation. This is consistent with the result that no ZnO appears in the analysis of XPS at the depth of ~5 nm. However, Lostak et al. observed that upon immersion in diluted conversion solution for rather short times of up to 40 s the deposition of TCC starts to take place preferentially on the local Zn-rich cathodes of Zn–Al–Mg alloy coated steel [68]. Therefore, it can be inferred that the transition region between dendrite region and inter-dendrite region has the thickest TCC and the maximum film forming power. This conclusion accords with the phenomenon observed in Figure 5d, because the thicker the film layer is, the greater the tendency of forming larger micro-cracks in the later stage.
Element of F was identified throughout the coatings, validating the role of this element in the formation mechanism. The mechanism of the AlF3 and ZnF2 deposition throughout the whole TCC may raise the assumption that during the TCC formation the free F- ions dissolve the Zn(OH)2 and Al2O3 as represented by the following reaction [29,69]:
Zn ( OH ) 2 + x F ZnF x ( 2 x ) + 2 OH
Al 2 O 3 + x F + 6 H + 2 AlF x ( 3 x ) + 3 H 2 O

5. Conclusions

Both of the characterizations by surface analysis and electrochemical measurements indicate that Zn55Al treated in a dilute Cr(III) bath at 40 °C for 180 s has the optimum performance in terms of the polarization resistance and adhesion strength to epoxy primer. The following conclusions can be drawn:
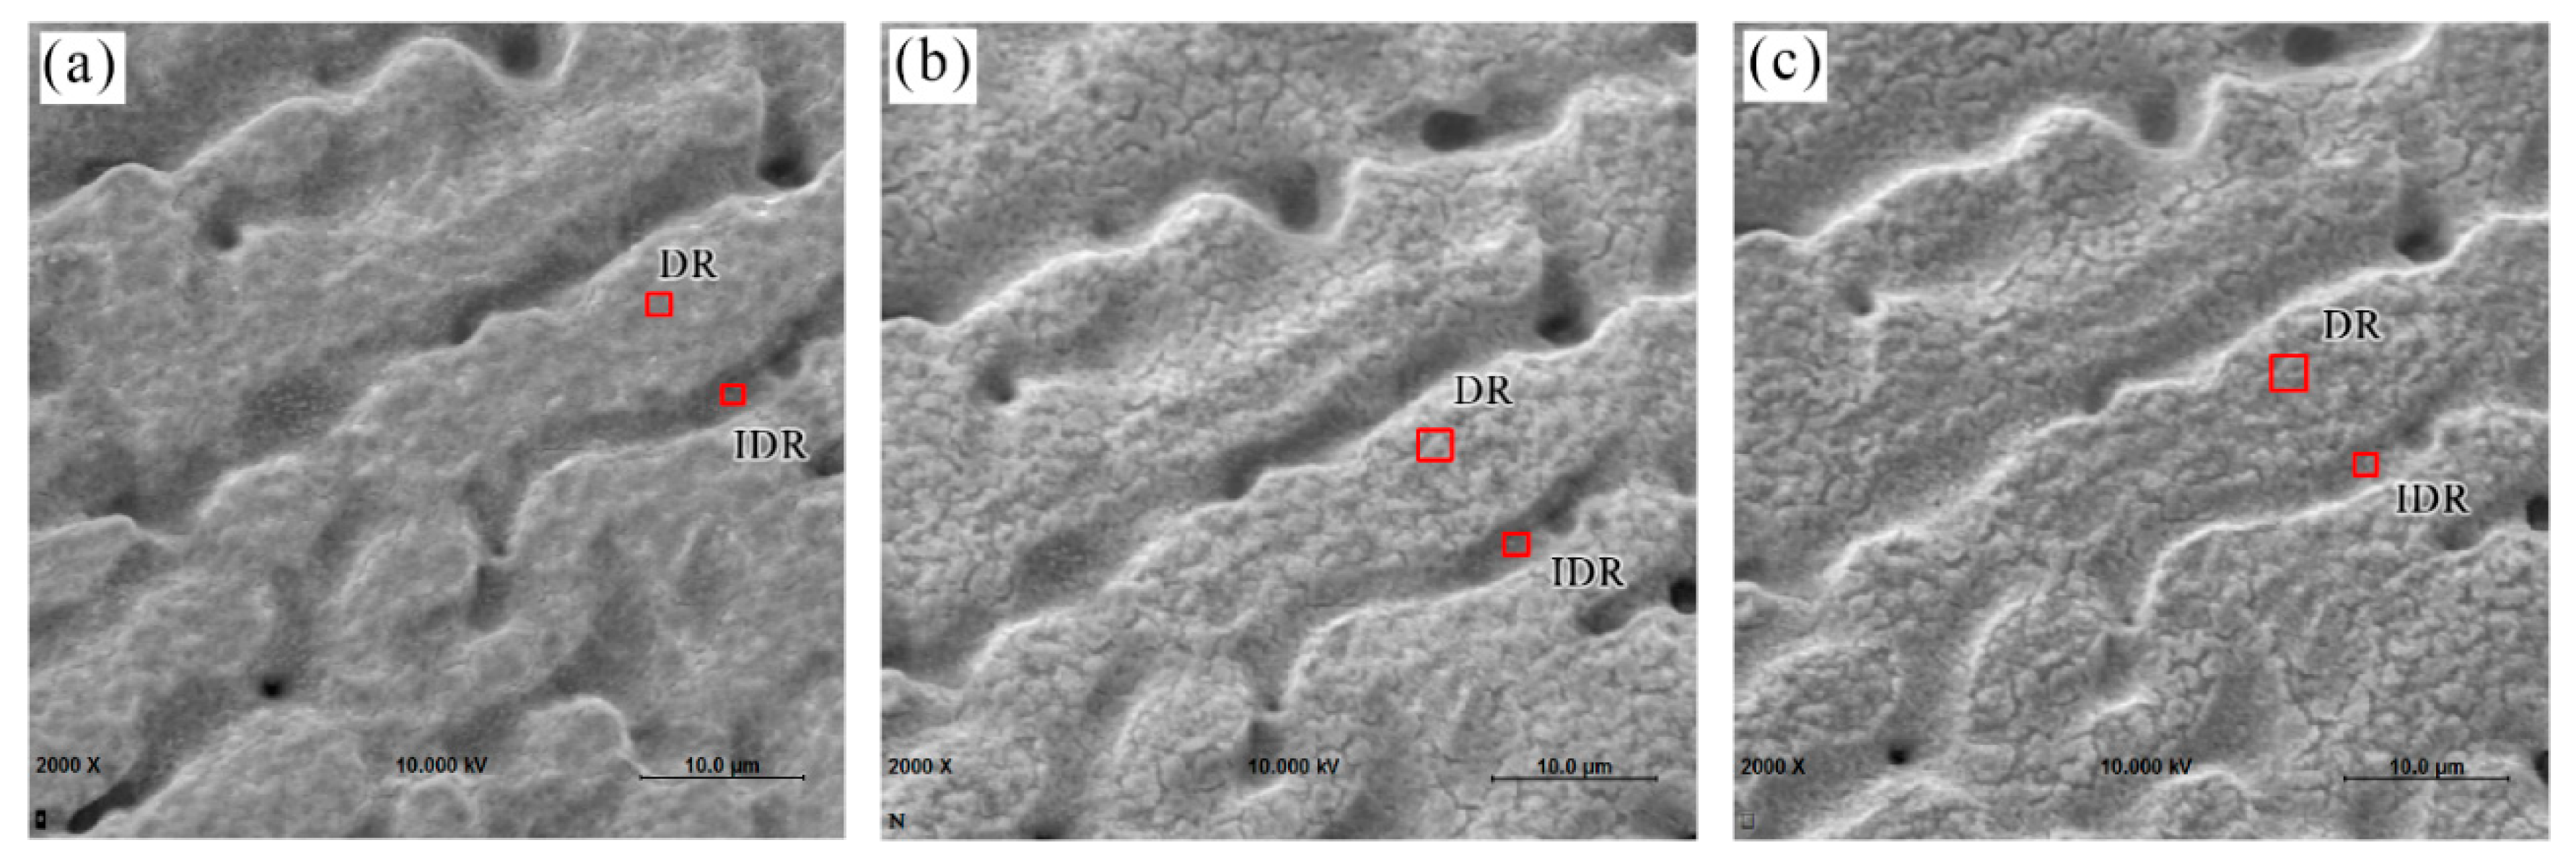
  • The analysis of 3D morphology and roughness shows that the macro-roughness of Zn55Al specimen surface decreases gradually with the prolongation of TCP treatment time. The surface roughness of Zn55Al treated for 180 s in Cr(III)-based dilution commercial solution at 40 °C is ~57% lower than that of the untreated surface. However, the formation of TCC results in the increase of the micro-roughness of the Zn55Al surface in contrast to the untreated specimen, which enhances the adhesion of the coating, and the film formation begins at the transition zone between dendrites and dendrites.
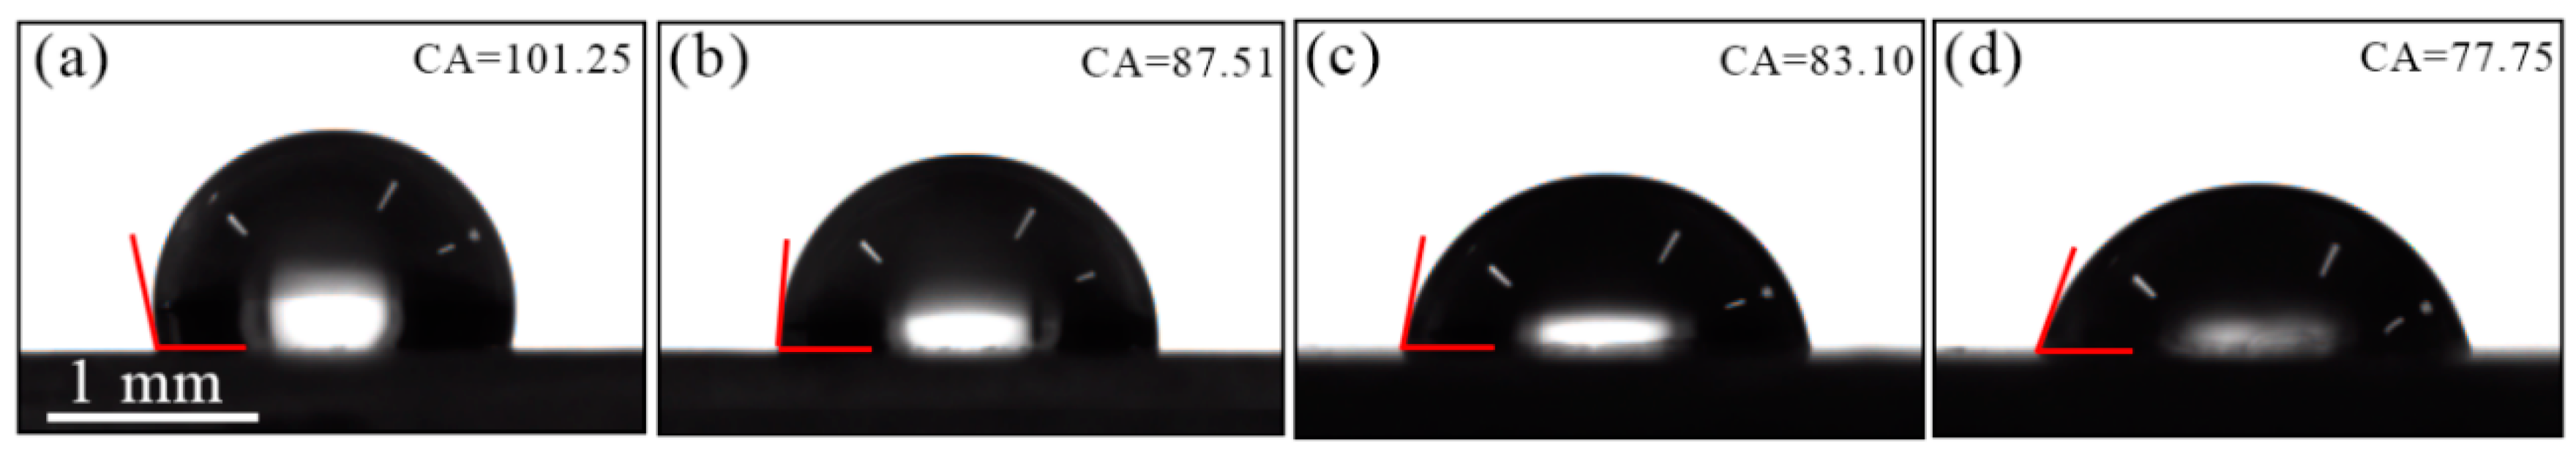
  • Pull-off adhesion strength tests revealed that the Cr(III) conversion coating improved the adhesion of the epoxy primer on Zn55Al by ~31.8% after TCP treatment of 180 s, which may be attributed to the increase of micro-roughness and the physicochemical properties of TCC.
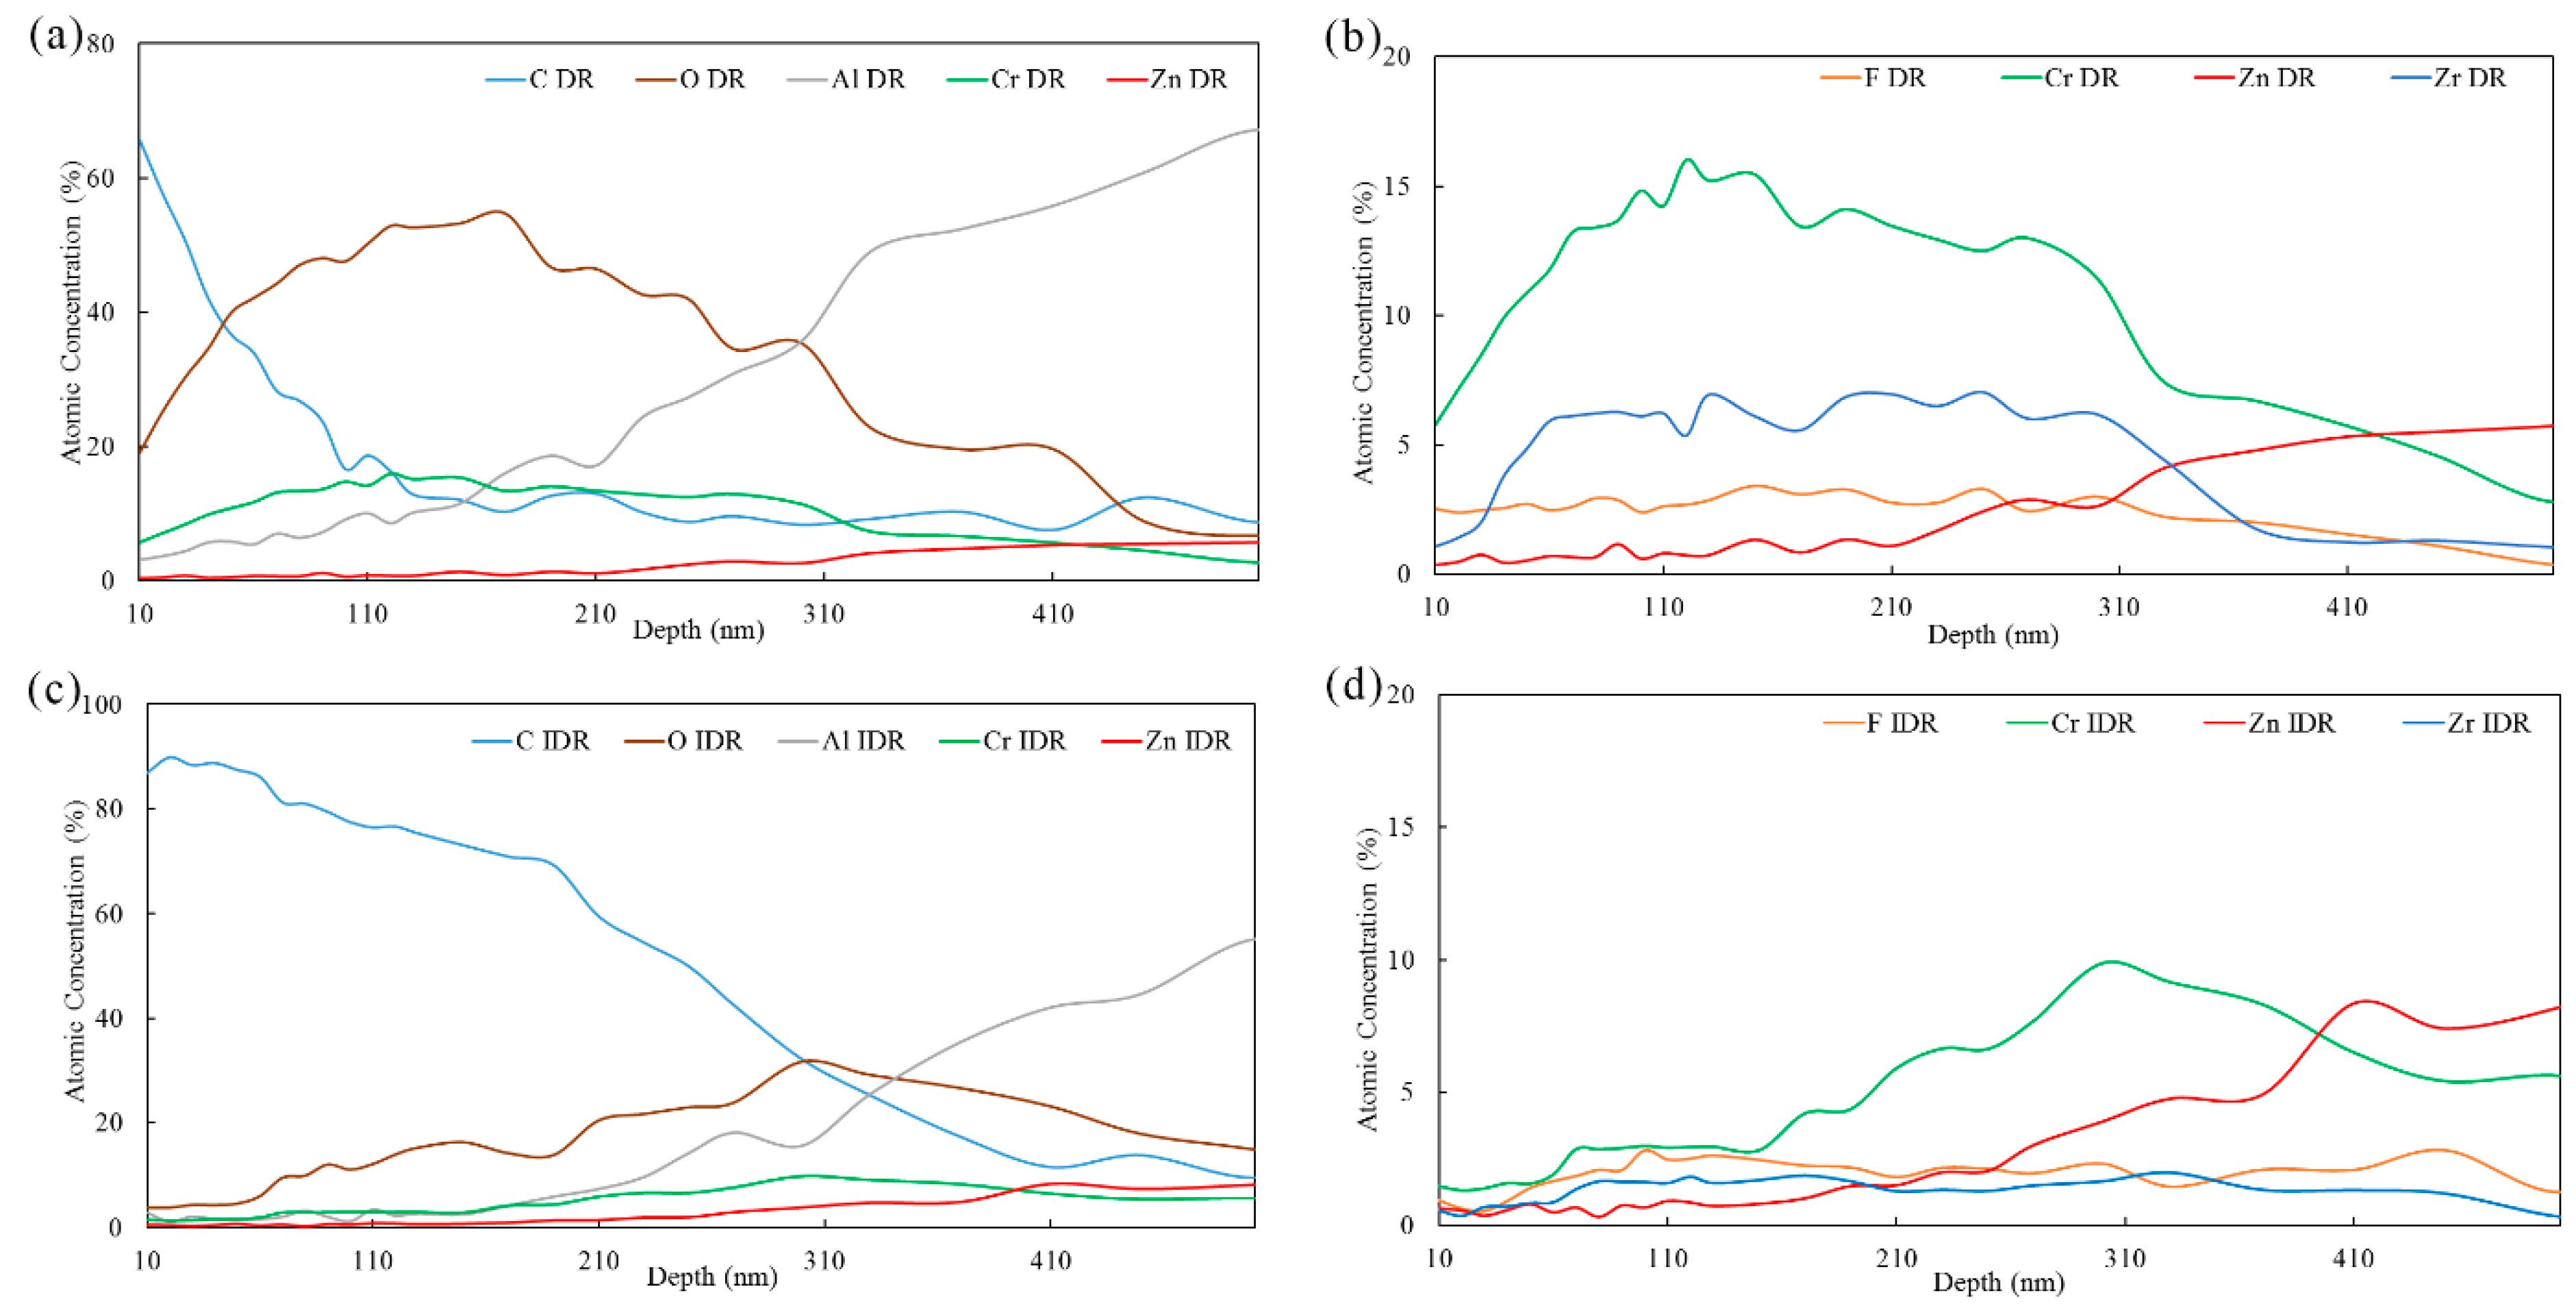
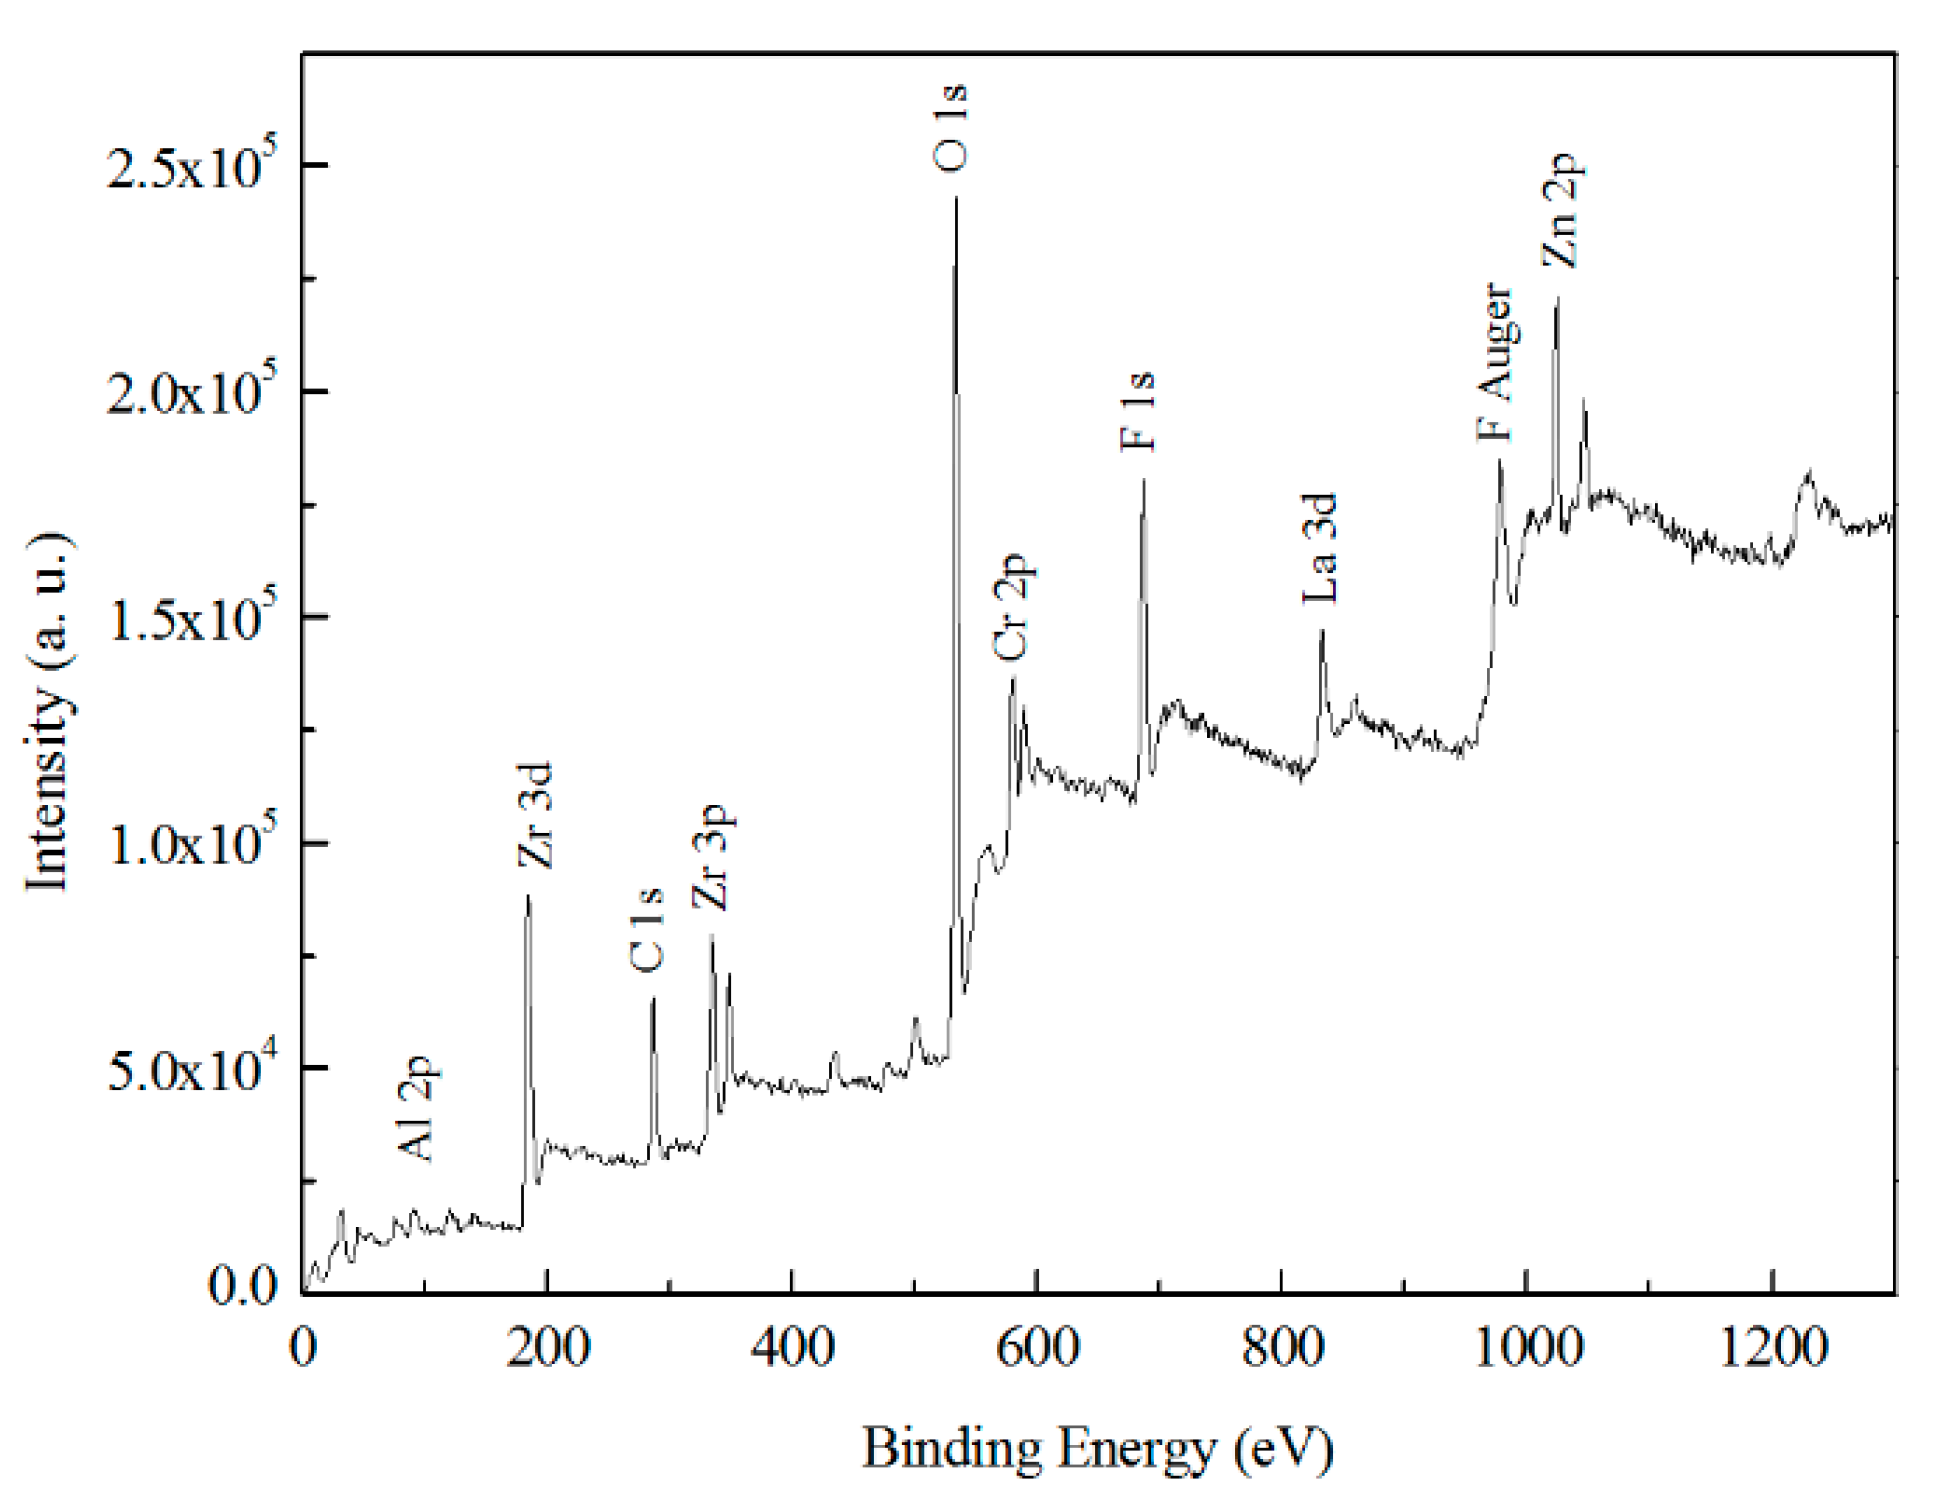
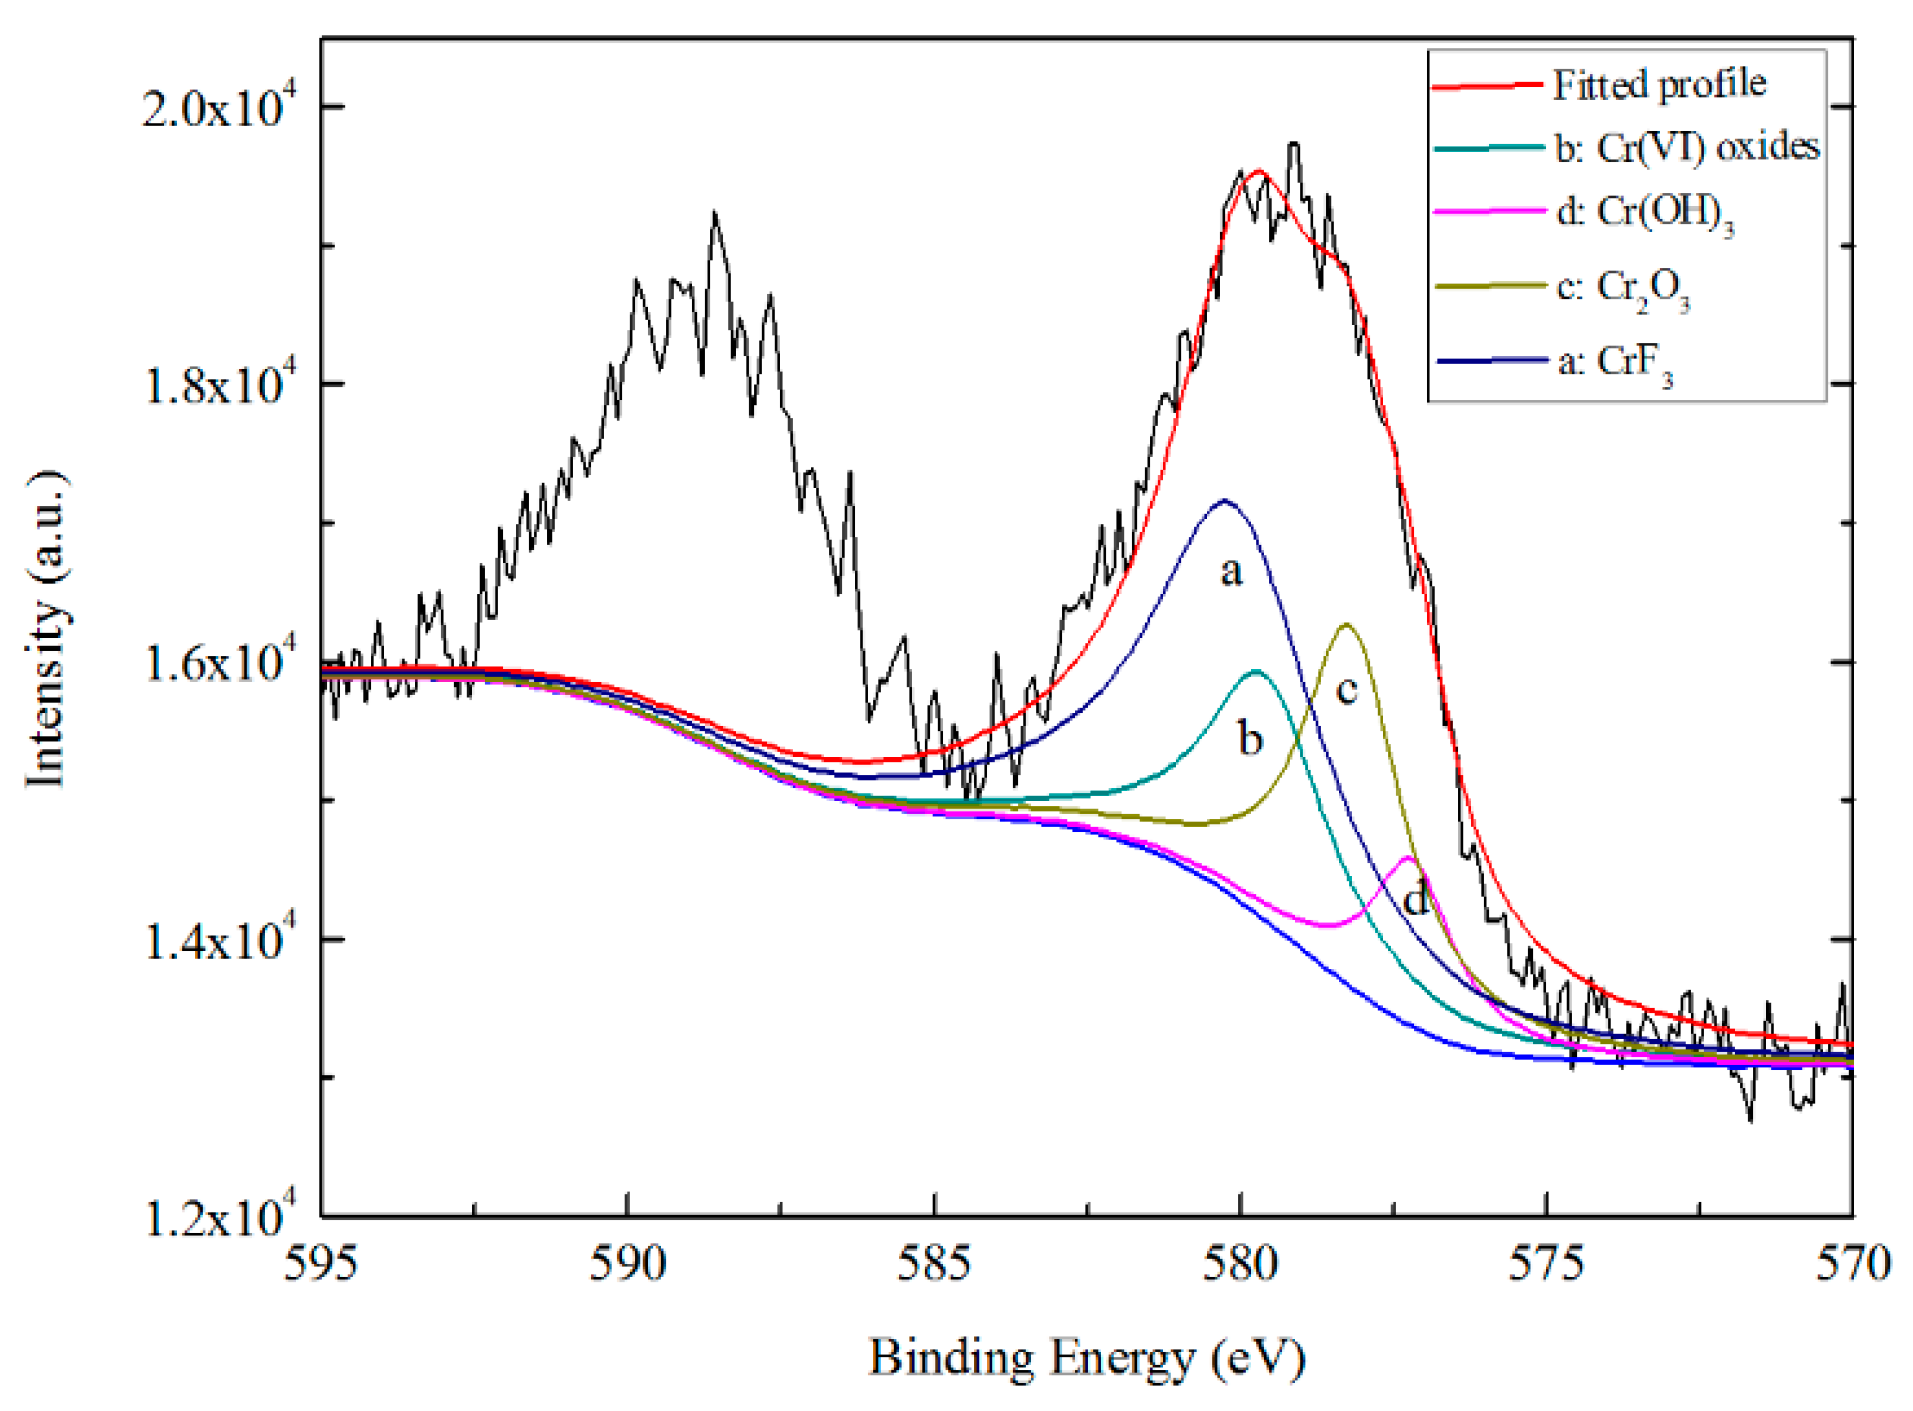
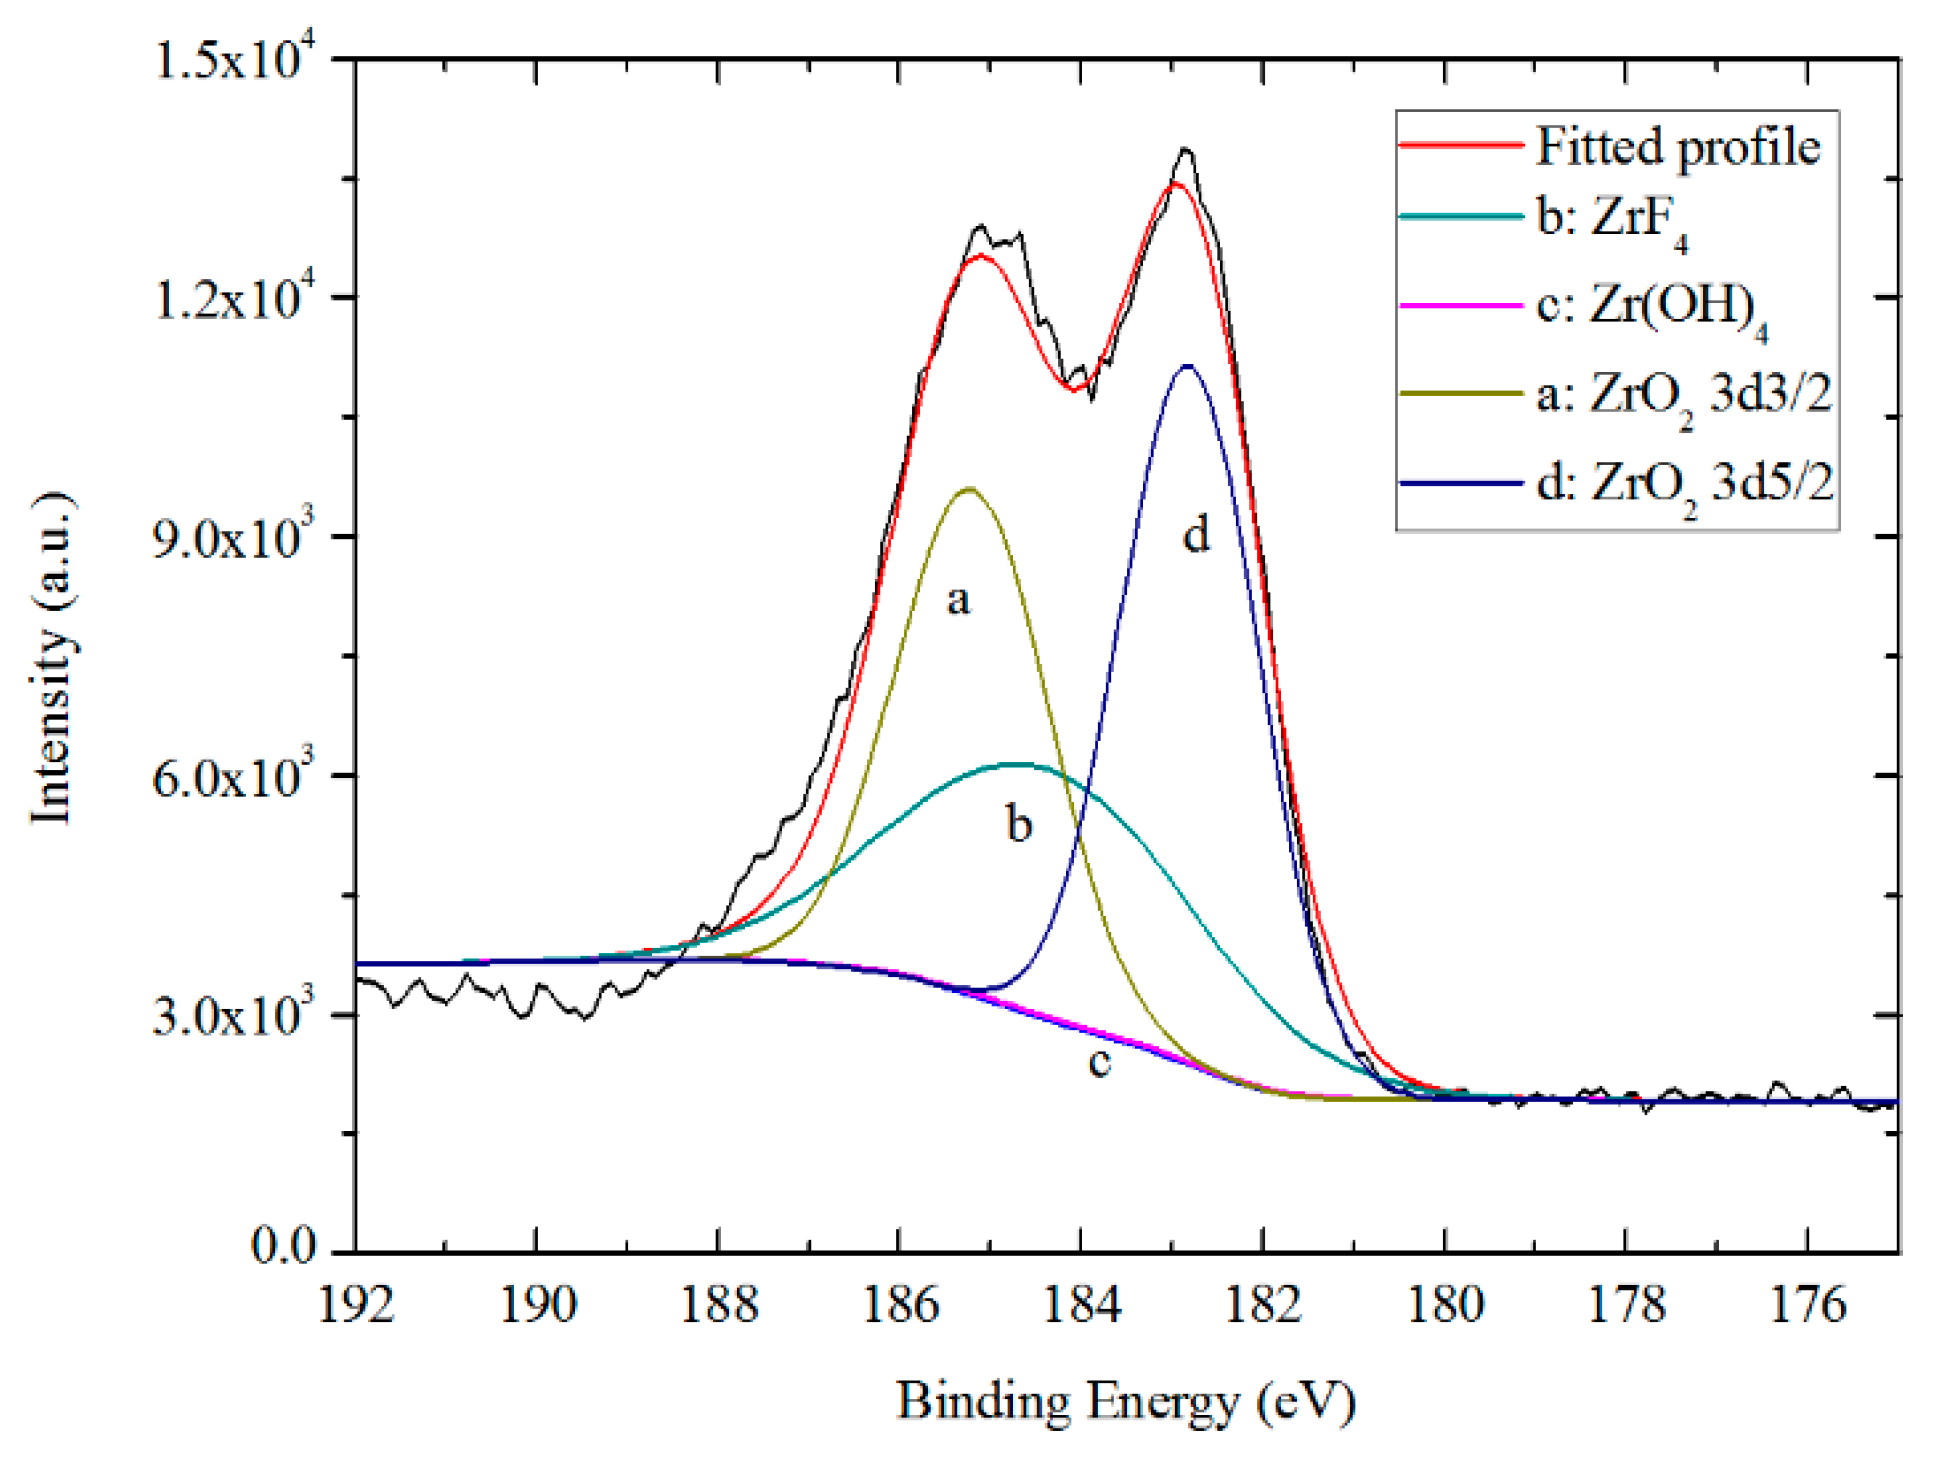
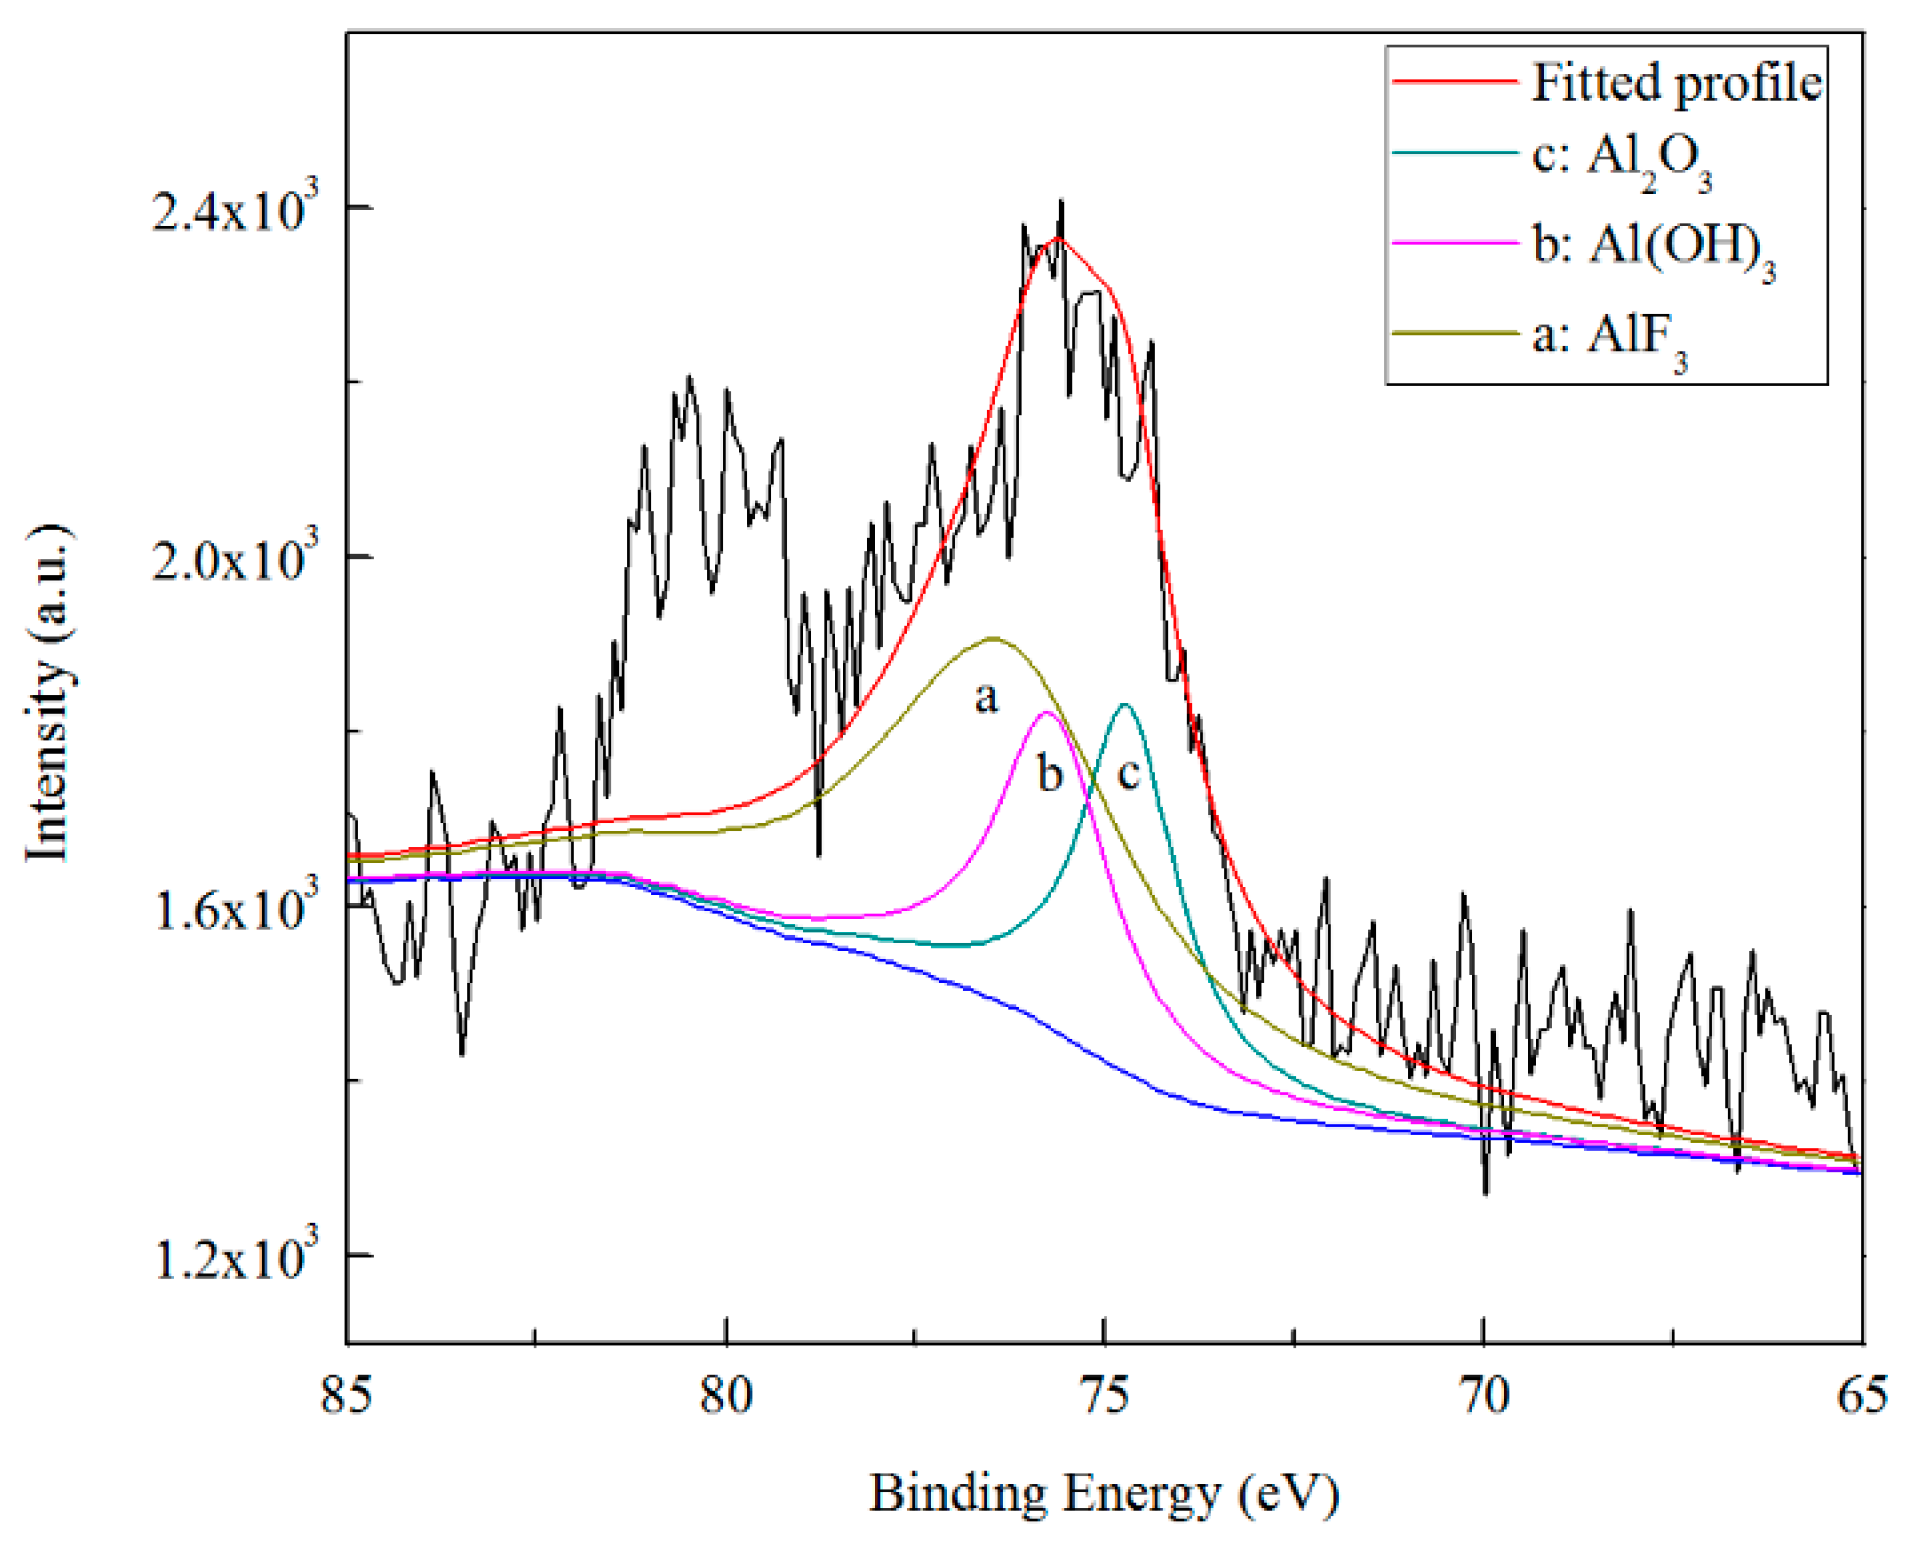
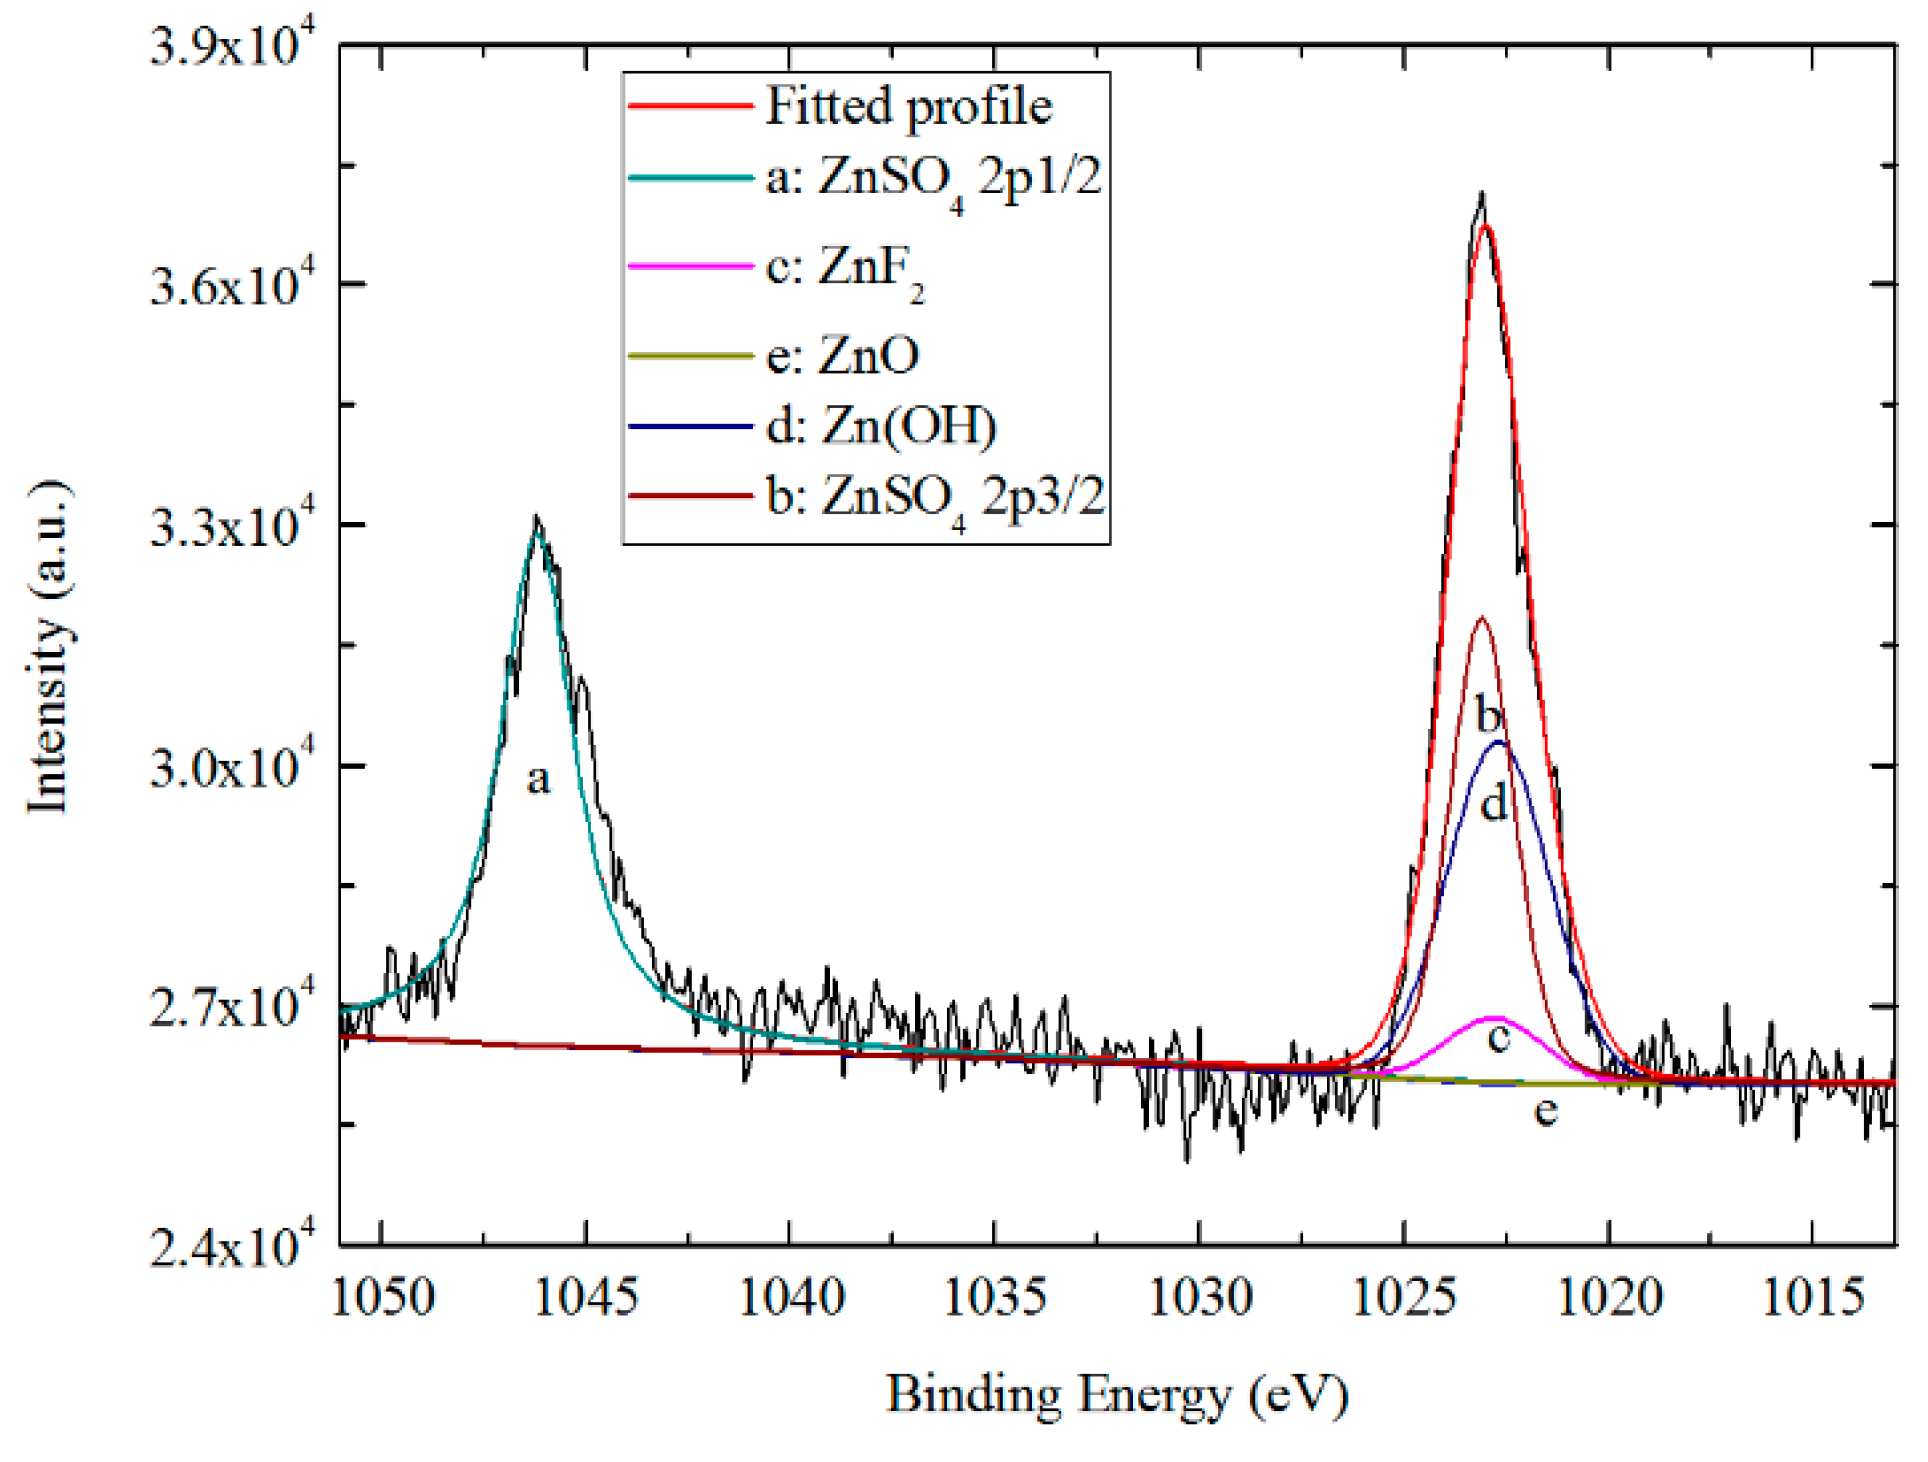
  • AES depth profiling indicates the trivalent conversion coating on Zn55Al treated by TCP for 180 s consists of a bilayer structure in the dendritic and inter-dendritic regions. The total thickness of TCC in the inter-dendritic region (~410 nm) is larger than that in the dendritic region (~310 nm), which is up to the main film-forming element of zirconium and chromium. The maximum Cr/Zr atomic concentration ratio is ~5.92 at the inter-dendritic region. The chemical states results from XPS revealed that the main chemical components on the TCC surface are oxides and fluorides of Al, Zn, Cr, and Zr, with a small number of hydroxides.
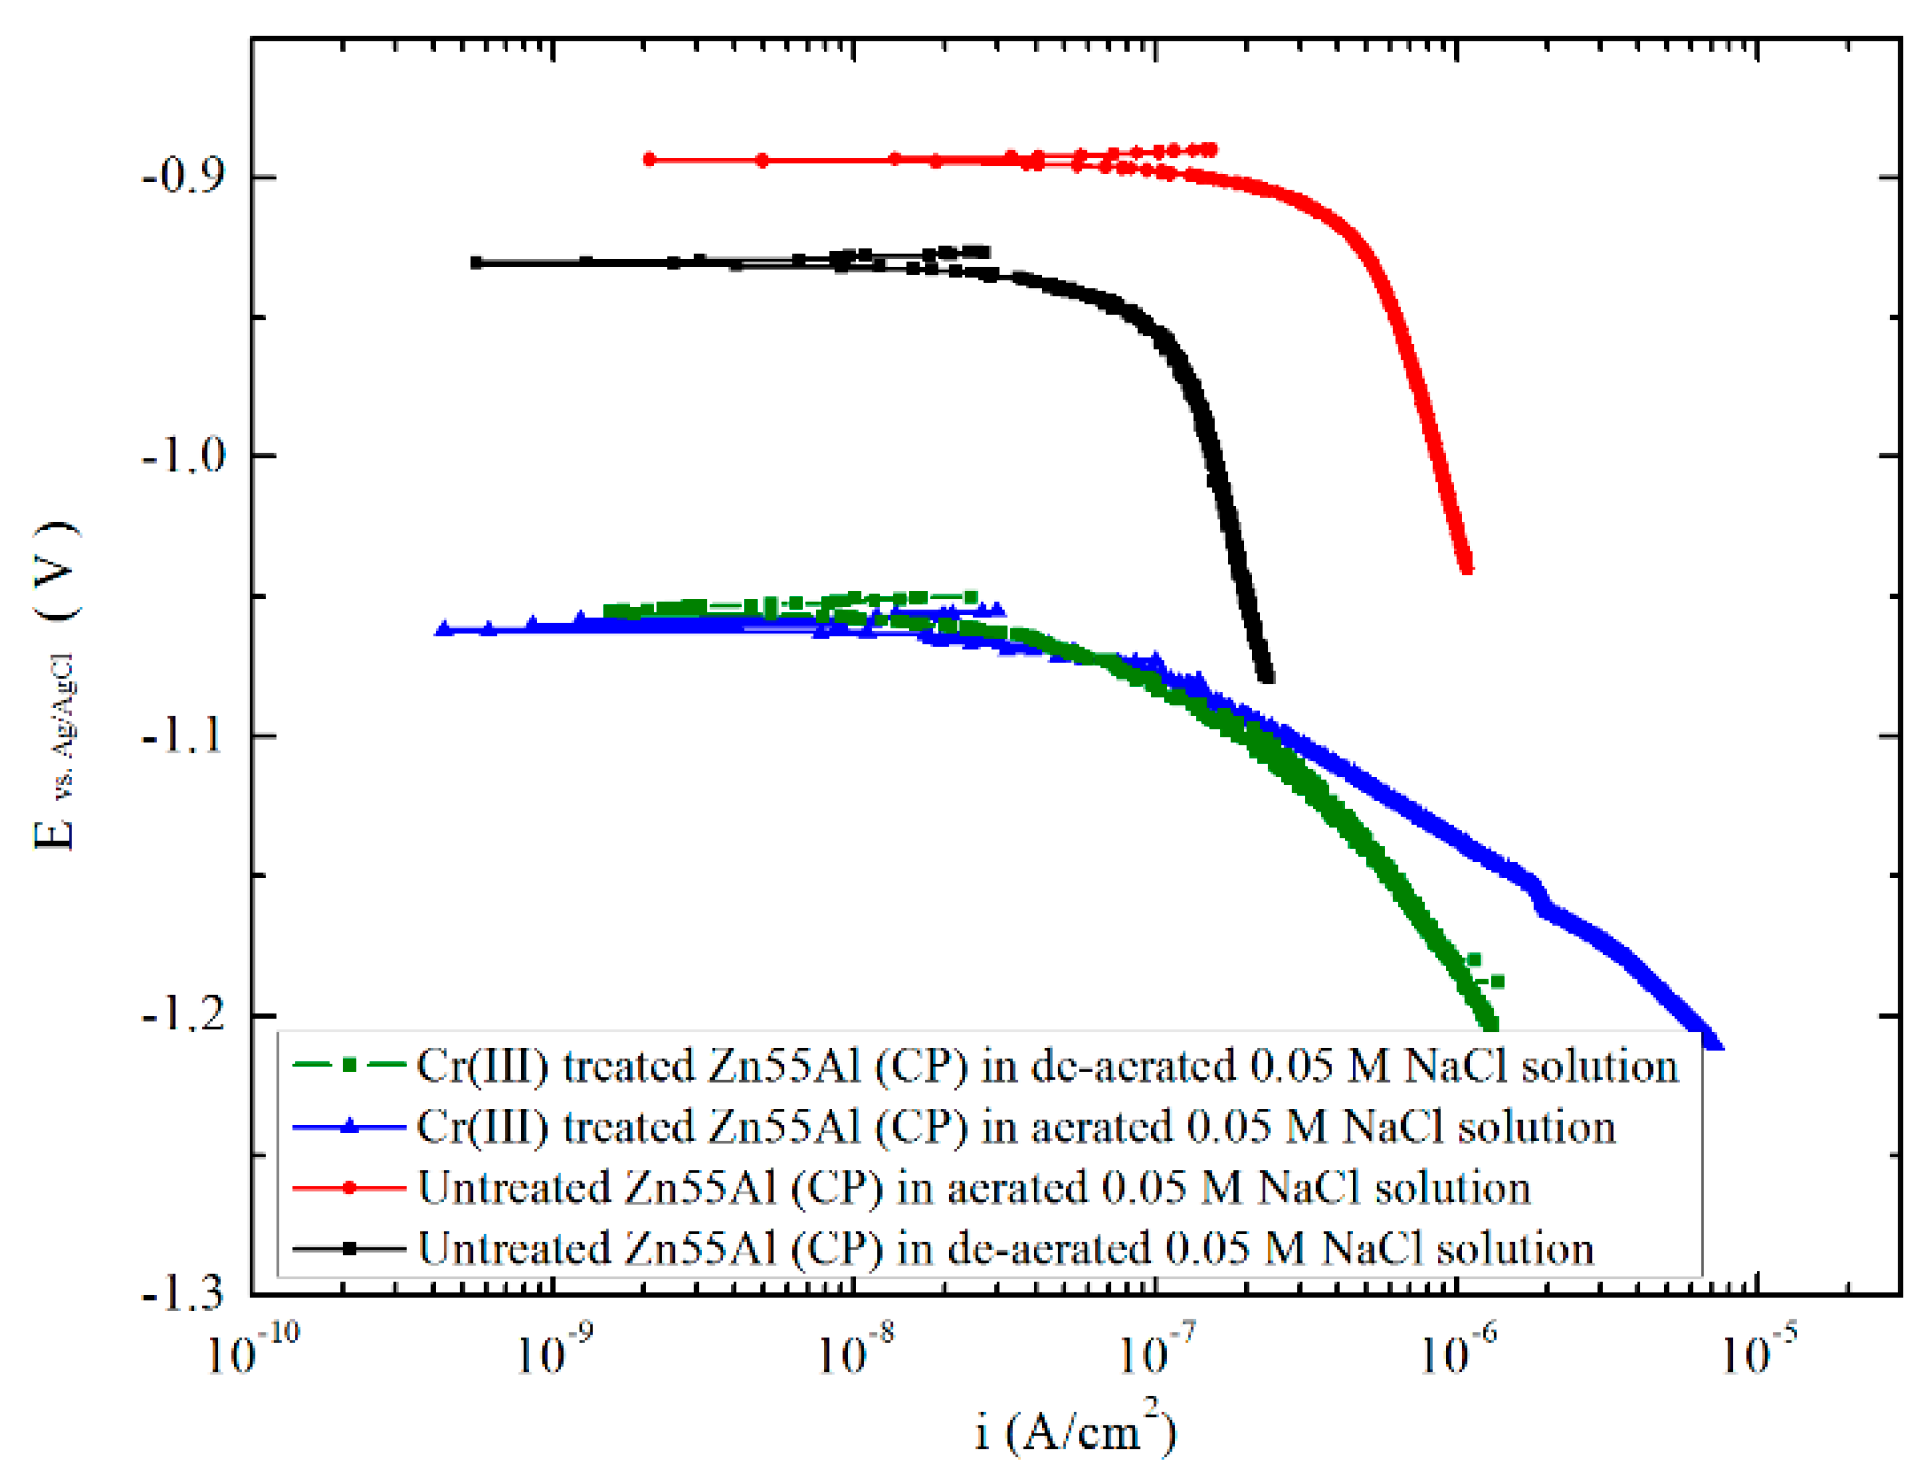
  • Results of the electrochemical tests show that in an aggressive 0.5 M NaCl solution, the corrosion resistance of Zn55Al can be greatly enhanced by TCP treatment. Zn55Al specimens after 180 s of TCC film formation have the lowest corrosion current density and the largest polarization resistance. The cathodic polarization curves measured in a less aggressive 0.05 M NaCl solutions indicated that the corrosion of Zn55Al is cathodic control and the Cr(III) can act as a barrier for corrosion mass transfer. In addition, the corrosion resistance of Zn55Al surface treated by TCP is sensitive to surface micro-cracks.

Author Contributions

Conceptualization, J.P. and Y.L.; Methodology, J.P. and Y.L.; Writing—Original Draft Preparation, J.P.; Writing—Review and Editing, J.P., X.T. and Y.L.; Supervision, X.T. and Y.L.; Project Administration, Y.L.

Funding

This research was funded by the Key Research and Development Program of Shandong Province (Grant No. 2017GHY15108) and China University of Petroleum (East China) Independent Innovation Research Project (Grant No. 18CX05021A).

Conflicts of Interest

The authors declare no conflict of interest.

References

  1. Vu, T.N.; Volovitch, P.; Ogle, K. The effect of pH on the selective dissolution of Zn and Al from Zn–Al coatings on steel. Corros. Sci. 2013, 67, 42–49. [Google Scholar] [CrossRef]
  2. Panossian, Z.; Mariaca, L.; Morcillo, M.; Flores, S.; Rocha, J.; Peña, J.J.; Herrera, F.; Corvo, F.; Sanchez, M.; Rincon, O.T.; et al. Steel cathodic protection afforded by zinc, aluminium and zinc/aluminium alloy coatings in the atmosphere. Surf. Coat. Technol. 2005, 190, 244–248. [Google Scholar] [CrossRef] [Green Version]
  3. Tachibana, K.; Morinaga, Y.; Mayuzumi, M. Hot dip fine Zn and Zn–Al alloy double coating for corrosion resistance at coastal area. Corros. Sci. 2007, 49, 149–157. [Google Scholar] [CrossRef]
  4. Moreira, A.R.; Panossian, Z.; Camargo, P.L.; Moreira, M.F.; da Silva, I.C.; de Carvalho, J.E.R. Zn/55Al coating microstructure and corrosion mechanism. Corros. Sci. 2006, 48, 564–576. [Google Scholar] [CrossRef]
  5. Persson, D.; Thierry, D.; Karlsson, O. Corrosion and corrosion products of hot dipped galvanized steel during long term atmospheric exposure at different sites world-wide. Corros. Sci. 2017, 126, 152–165. [Google Scholar] [CrossRef]
  6. Li, Y. Formation of nano-crystalline corrosion products on Zn–Al alloy coating exposed to seawater. Corros. Sci. 2001, 43, 1793–1800. [Google Scholar] [CrossRef]
  7. Vakili, H.; Ramezanzadeh, B.; Amini, R. The corrosion performance and adhesion properties of the epoxy coating applied on the steel substrates treated by cerium-based conversion coatings. Corros. Sci. 2015, 94, 466–475. [Google Scholar] [CrossRef]
  8. Mahidashti, Z.; Shahrabi, T.; Ramezanzadeh, B. The role of post-treatment of an ecofriendly cerium nanostructure conversion coating by green corrosion inhibitor on the adhesion and corrosion protection properties of the epoxy coating. Prog. Org. Coat. 2018, 114, 19–32. [Google Scholar] [CrossRef]
  9. Eivaz Mohammadloo, H.; Sarabi, A.A.; Asemani, H.R.; Ahmadi, P. A comparative study of eco-friendly hybrid thin films: With and without organic coating application. Prog. Org. Coat. 2018, 125, 432–442. [Google Scholar] [CrossRef]
  10. Sababi, M.; Terryn, H.; Mol, J.M.C. The influence of a Zr-based conversion treatment on interfacial bonding strength and stability of epoxy coated carbon steel. Prog. Org. Coat. 2017, 105, 29–36. [Google Scholar] [CrossRef] [Green Version]
  11. Ramezanzadeh, B.; Attar, M.M. An evaluation of the corrosion resistance and adhesion properties of an epoxy-nanocomposite on a hot-dip galvanized steel (HDG) treated by different kinds of conversion coatings. Surf. Coat. Technol. 2011, 205, 4649–4657. [Google Scholar] [CrossRef]
  12. Asemani, H.R.; Ahmadi, P.; Sarabi, A.A.; Eivaz Mohammadloo, H. Effect of zirconium conversion coating: Adhesion and anti-corrosion properties of epoxy organic coating containing zinc aluminum polyphosphate (ZAPP) pigment on carbon mild steel. Prog. Org. Coat. 2016, 94, 18–27. [Google Scholar] [CrossRef]
  13. Mohammad Hosseini, R.; Sarabi, A.A.; Eivaz Mohammadloo, H.; Sarayloo, M. The performance improvement of Zr conversion coating through Mn incorporation: With and without organic coating. Surf. Coat. Technol. 2014, 258, 437–446. [Google Scholar] [CrossRef]
  14. Sharifi Golru, S.; Attar, M.M.; Ramezanzadeh, B. Effects of surface treatment of aluminium alloy 1050 on the adhesion and anticorrosion properties of the epoxy coating. Appl. Surf. Sci. 2015, 345, 360–368. [Google Scholar] [CrossRef]
  15. Golru, S.S.; Attar, M.M.; Ramezanzadeh, B. Morphological analysis and corrosion performance of zirconium based conversion coating on the aluminum alloy 1050. J. Ind. Eng. Chem. 2015, 24, 233–244. [Google Scholar] [CrossRef]
  16. Ghanbari, A.; Attar, M.M. Surface free energy characterization and adhesion performance of mild steel treated based on zirconium conversion coating: A comparative study. Surf. Coat. Technol. 2014, 246, 26–33. [Google Scholar] [CrossRef]
  17. Kendig, M.W.; Buchheit, R.G. Corrosion inhibition of aluminum and aluminum alloys by soluble chromates, chromate coatings, and chromate-free coatings. Corrosion 2003, 59, 379–400. [Google Scholar] [CrossRef]
  18. Tomachuk, C.R.; Elsner, C.I.; Di Sarli, A.R.; Ferraz, O.B. Corrosion resistance of Cr(III) conversion treatments applied on electrogalvanised steel and subjected to chloride containing media. Mater. Chem. Phys. 2010, 119, 19–29. [Google Scholar] [CrossRef]
  19. Sheu, H.H.; Lin, C.H.; Jian, S.Y.; Lee, H.B.; Yang, B.R.; Ger, M.D. Effects of complexing agents and current density on carbon content of trivalent chromium carbon coating and its properties. Int. J. Electrochem. Sci. 2016, 11, 7099–7110. [Google Scholar] [CrossRef]
  20. Sheu, H.H.; Lee, H.B.; Jian, S.Y.; Hsu, C.Y.; Lee, C.Y. Investigation on the corrosion resistance of trivalent chromium conversion passivate on electroplated Zn–Ni alloy. Surf. Coat. Technol. 2016, 305, 241–248. [Google Scholar] [CrossRef]
  21. Taheri, P.; Laha, P.; Terryn, H.; Mol, J.M.C. An in situ study of zirconium-based conversion treatment on zinc surfaces. Appl. Surf. Sci. 2015, 356, 837–843. [Google Scholar] [CrossRef]
  22. Li, L.; Swain, G.M. Effects of aging temperature and time on the corrosion protection provided by trivalent chromium process coatings on AA2024-T3. ACS Appl. Mater. Interfaces 2013, 5, 7923–7930. [Google Scholar] [CrossRef]
  23. Qi, J.T.; Hashimoto, T.; Walton, J.R.; Zhou, X.; Skeldon, P.; Thompson, G.E. Trivalent chromium conversion coating formation on aluminium. Surf. Coat. Technol. 2015, 280, 317–329. [Google Scholar] [CrossRef] [Green Version]
  24. Guo, Y.; Frankel, G.S. Characterization of trivalent chromium process coating on AA2024-T3. Surf. Coat. Technol. 2012, 206, 3895–3902. [Google Scholar] [CrossRef]
  25. Viroulaud, R.; Światowska, J.; Seyeux, A.; Zanna, S.; Tardelli, J.; Marcus, P. Influence of surface pretreatments on the quality of trivalent chromium process coatings on aluminum alloy. Appl. Surf. Sci. 2017, 423, 927–938. [Google Scholar] [CrossRef]
  26. Verdalet-Guardiola, X.; Bonino, J.-P.; Duluard, S.; Fori, B.; Blanc, C. Influence of the alloy microstructure and surface state on the protective properties of trivalent chromium coatings grown on a 2024 aluminium alloy. Surf. Coat. Technol. 2018, 344, 276–287. [Google Scholar] [CrossRef]
  27. Chen, W.-K.; Bai, C.-Y.; Liu, C.-M.; Lin, C.-S.; Ger, M.-D. The effect of chromic sulfate concentration and immersion time on the structures and anticorrosive performance of the Cr(III) conversion coatings on aluminum alloys. Appl. Surf. Sci. 2010, 256, 4924–4929. [Google Scholar] [CrossRef]
  28. Cerezo, J.; Vandendael, I.; Posner, R.; de Wit, J.H.W.; Mol, J.M.C.; Terryn, H. Initiation and growth of modified Zr-based conversion coatings on multi-metal surfaces. Surf. Coat. Technol. 2013, 236, 284–289. [Google Scholar] [CrossRef]
  29. Cerezo, J.; Taheri, P.; Vandendael, I.; Posner, R.; Lill, K.; de Wit, J.H.W.; Mol, J.M.C.; Terryn, H. Influence of surface hydroxyls on the formation of Zr-based conversion coatings on AA6014 aluminum alloy. Surf. Coat. Technol. 2014, 254, 277–283. [Google Scholar] [CrossRef]
  30. Zhu, W.; Li, W.; Mu, S.; Yang, Y.; Zuo, X. The adhesion performance of epoxy coating on AA6063 treated in Ti/Zr/V based solution. Appl. Surf. Sci. 2016, 384, 333–340. [Google Scholar] [CrossRef]
  31. Cavanaugh, M.K.; Li, J.C.; Birbilis, N.; Buchheit, R.G. Electrochemical characterization of intermetallic phases common to aluminum alloys as a function of solution temperature. J. Electrochem. Soc. 2014, 161, C535–C543. [Google Scholar] [CrossRef]
  32. Munson, C.A.; Swain, G.M. Structure and chemical composition of different variants of a commercial trivalent chromium process (TCP) coating on aluminum alloy 7075-T6. Surf. Coat. Technol. 2017, 315, 150–162. [Google Scholar] [CrossRef]
  33. Munson, C.A.; McFall-Boegeman, S.A.; Swain, G.M. Cross comparison of TCP conversion coating performance on aluminum alloys during neutral salt-spray and thin-layer mist accelerated degradation testing. Electrochim. Acta 2018, 282, 171–184. [Google Scholar] [CrossRef]
  34. Li, L.; Doran, K.P.; Swain, G.M. Electrochemical characterization of trivalent chromium process (TCP) coatings on aluminum alloys 6061 and 7075. J. Electrochem. Soc. 2013, 160, C396–C401. [Google Scholar] [CrossRef]
  35. Fockaert, L.I.; Taheri, P.; Abrahami, S.T.; Boelen, B.; Terryn, H.; Mol, J.M.C. Zirconium-based conversion film formation on zinc, aluminium and magnesium oxides and their interactions with functionalized molecules. Appl. Surf. Sci. 2017, 423, 817–828. [Google Scholar] [CrossRef]
  36. Selverian, J.H.; Notis, M.R.; Marder, A.R. The microstructure of 55 w/o Al-Zn-Si (Galvalume) hot dip coatings. J. Mater. Eng. 1987, 9, 133–140. [Google Scholar] [CrossRef]
  37. Li, Y.; Wang, H.; Hou, B.; Feng, F.; Wei, X. Chromate passivation of hot dipped Zn25Al alloy coatings. Br. Corros. J. 2001, 36, 56–58. [Google Scholar] [CrossRef]
  38. ISO 12085: 1996 Geometrical Product Specification (GPS)-Surface Texture: Profile Method-Motif Parameters; International Organization for Standardization: Geneva, Switzerland, 1996.
  39. ASTM D4541-02 Standard Test Method for Pull-off Strength of Coatings Using Portable Adhesion Testers; ASTM International: West Conshohocken, PA, USA, 2002.
  40. Campestrini, P.; van Westing, E.P.M.; de Wit, J.H.W. Influence of surface preparation on performance of chromate conversion coatings on Alclad 2024 aluminium alloy Part I: Nucleation and growth. Electrochim. Acta 2001, 46, 2553–2571. [Google Scholar] [CrossRef]
  41. Cerezo, J.; Vandendael, I.; Posner, R.; de Wit, J.H.W.; Mol, J.M.C.; Terryn, H. The effect of surface pre-conditioning treatments on the local composition of Zr-based conversion coatings formed on aluminium alloys. Appl. Surf. Sci. 2016, 366, 339–347. [Google Scholar] [CrossRef]
  42. Qi, J.; Němcová, A.; Walton, J.R.; Zhou, X.; Skeldon, P.; Thompson, G.E. Influence of pre- and post-treatments on formation of a trivalent chromium conversion coating on AA2024 alloy. Thin Solid Films 2016, 616, 270–278. [Google Scholar] [CrossRef] [Green Version]
  43. Treverton, J.A.; Amor, M.P. High-resolution SEM studies of chromate conversion coatings. J. Mater. Sci. 1988, 23, 3706–3710. [Google Scholar] [CrossRef]
  44. Stern, M.; Geary, A.L. Electrochemical polarization I. A theoretical analysis of the shape of polarization curves. J. Electrochem. Soc. 1957, 104, 56–63. [Google Scholar] [CrossRef]
  45. Wang, F.; Kang, W.; Jing, H. Principle, Method and Application of Corrosion Electrochemistry, 1st ed.; Chemical Industry Press: Beijing, China, 2008; p. 64. [Google Scholar]
  46. Flitt, H.J.; Schweinsberg, D.P. Evaluation of corrosion rate from polarisation curves not exhibiting a Tafel region. Corros. Sci. 2005, 47, 3034–3052. [Google Scholar] [CrossRef]
  47. Liu, W.; Li, M.-C.; Luo, Q.; Fan, H.-Q.; Zhang, J.-Y.; Lu, H.-S.; Chou, K.-C.; Wang, X.-L.; Li, Q. Influence of alloyed magnesium on the microstructure and long-term corrosion behavior of hot-dip Al–Zn–Si coating in NaCl solution. Corros. Sci. 2016, 104, 217–226. [Google Scholar] [CrossRef]
  48. Qi, J.; Hashimoto, T.; Walton, J.; Zhou, X.; Skeldon, P.; Thompson, G.E. Formation of a trivalent chromium conversion coating on AA2024-T351 Alloy. J. Electrochem. Soc. 2016, 163, C25–C35. [Google Scholar] [CrossRef]
  49. Li, L.; Swain, G.P.; Howell, A.; Woodbury, D.; Swain, G.M. The formation, structure, electrochemical properties and stability of trivalent chrome process (TCP) coatings on AA2024. J. Electrochem. Soc. 2011, 158, C274–C283. [Google Scholar] [CrossRef]
  50. Sinha, S.; Badrinarayanan, S.; Sinha, A. Interaction of oxygen with Zr76Fe24 metglass: An X-ray photoelectron spectroscopy study. J. Less Common Met. 1986, 125, 85–95. [Google Scholar] [CrossRef]
  51. Sleigh, C.; Pijpers, A.P.; Jaspers, A.; Coussens, B.; Meier, R.J. On the determination of atomic charge via ESCA including application to organometallics. J. Electron Spectrosc. Relat. Phenom. 1996, 77, 41–57. [Google Scholar] [CrossRef]
  52. Qi, J.; Gao, L.; Liu, Y.; Liu, B.; Hashimoto, T.; Wang, Z.; Thompson, G.E. Chromate formed in a trivalent chromium conversion coating on aluminum. J. Electrochem. Soc. 2017, 164, C442–C449. [Google Scholar] [CrossRef]
  53. Chidambaram, D.; Clayton, C.R.; Halada, G.P. The role of hexafluorozirconate in the formation of chromate conversion coatings on aluminum alloys. Electrochim. Acta 2006, 51, 2862–2871. [Google Scholar] [CrossRef]
  54. Bolt, P.H.; Ten Grotenhuis, E.; Geus, J.W.; Habraken, F.H.P.M. The interaction of thin NiO layers with single crystalline α-Al2O3 (1120) substrates. Surf. Sci. 1995, 329, 227–240. [Google Scholar] [CrossRef]
  55. McGuire, G.E.; Schweitzer, G.K.; Carlson, T.A. Core electron binding energies in some group IIIA, VB, and VIB compounds. Inorg. Chem. 1973, 12, 2450–2453. [Google Scholar] [CrossRef]
  56. Lindsay, J.R.; Rose, H.J.; Swartz, W.E.; Watts, P.H.; Rayburn, K.A. X-ray photoelectron spectra of aluminum oxides: structural effects on the “chemical shift”. Appl. Spectrosc. 1973, 27, 1–5. [Google Scholar] [CrossRef]
  57. Dake, L.S.; Baer, D.R.; Zachara, J.M. Auger parameter measurements of zinc compounds relevant to zinc transport in the environment. Surf. Interface Anal. 1989, 14, 71–75. [Google Scholar] [CrossRef]
  58. Gaarenstroom, S.W.; Winograd, N. Initial and final state effects in the ESCA spectra of cadmium and silver oxides. J. Chem. Phys. 1977, 67, 3500–3506. [Google Scholar] [CrossRef]
  59. Klein, J.C.; Hercules, D.M. Surface characterization of model Urushibara catalysts. J. Catal. 1983, 82, 424–441. [Google Scholar] [CrossRef]
  60. Xu, Y.; Li, H.; Shen, Y.; Liu, S.; Wang, W.; Tao, J. Improvement of adhesion performance between aluminum alloy sheet and epoxy based on anodizing technique. Int. J. Adhes. Adhes. 2016, 70, 74–80. [Google Scholar] [CrossRef]
  61. Niknahad, M.; Moradian, S.; Mirabedini, S.M. The adhesion properties and corrosion performance of differently pretreated epoxy coatings on an aluminium alloy. Corros. Sci. 2010, 52, 1948–1957. [Google Scholar] [CrossRef]
  62. Qi, J.; Gao, L.; Li, Y.; Wang, Z.; Thompson, G.E.; Skeldon, P. An optimized trivalent chromium conversion coating process for AA2024-T351 alloy. J. Electrochem. Soc. 2017, 164, C390–C395. [Google Scholar] [CrossRef]
  63. Zhang, X.; Sloof, W.G.; Hovestad, A.; van Westing, E.P.M.; Terryn, H.; de Wit, J.H.W. Characterization of chromate conversion coatings on zinc using XPS and SKPFM. Surf. Coat. Technol. 2005, 197, 168–176. [Google Scholar] [CrossRef]
  64. Kong, G.; Lingyan, L.; Lu, J.; Che, C.; Zhong, Z. Corrosion behavior of lanthanum-based conversion coating modified with citric acid on hot dip galvanized steel in aerated 1 M NaCl solution. Corros. Sci. 2011, 53, 1621–1626. [Google Scholar] [CrossRef]
  65. Chang, Y.T.; Wen, N.T.; Chen, W.K.; Ger, M.D.; Pan, G.T.; Yang, T.C.K. The effects of immersion time on morphology and electrochemical properties of the Cr(III)-based conversion coatings on zinc coated steel surface. Corros. Sci. 2008, 50, 3494–3499. [Google Scholar] [CrossRef]
  66. Li, L.L.; Desouza, A.L.; Swain, G.M. In situ pH measurement during the formation of conversion coatings on an aluminum alloy (AA2024). Analyst 2013, 138, 4398–4402. [Google Scholar] [CrossRef]
  67. Li, L.; Whitman, B.W.; Munson, C.A.; Estrada, R.; Matzdorf, C.A.; Swain, G.M. Structure and corrosion performance of a non-chromium process (NCP) Zr/Zn pretreatment conversion coating on aluminum alloys. J. Electrochem. Soc. 2016, 163, C718–C728. [Google Scholar] [CrossRef]
  68. Lostak, T.; Timma, C.; Krebs, S.; Flock, J.; Schulz, S. Organosilane modified Zr-based conversion layer on Zn-Al alloy coated steel sheets. Surf. Coat. Technol. 2016, 305, 223–230. [Google Scholar] [CrossRef]
  69. Taheri, P.; Lill, K.; de Wit, J.H.W.; Mol, J.M.C.; Terryn, H. Effects of zinc surface acid-based properties on formation mechanisms and interfacial bonding properties of zirconium-based conversion layers. J. Phys. Chem. C 2012, 116, 8426–8436. [Google Scholar] [CrossRef]
Figure 1. Surface 3D topography comparison of untreated and TCP-treated regions within one Zn55Al specimen surface with different immersion periods: (a) 30 s; (b) 180 s; (c) 360 s at 40 °C in the TCP bath.
Coatings 09 00297 g001
Figure 2. Surface profiles scanned from untreated region to TCP treated region, with average roughness (Ra) calculated respectively. The TCP treatment conditions are: (a) 30 s; (b) 180 s; (c) 360 s at 40 °C in the TCP bath.
Coatings 09 00297 g002
Figure 3. Roughness reduction of Zn55Al surface with two kind of treatment at different immersion periods in the TCP bath.
Coatings 09 00297 g003
Figure 4. SEM micrograph of (a) bare Zn55Al surface and (b) Zn55Al surface pre-treated by pickling and alkali washing.
Coatings 09 00297 g004
Figure 5. Plan-view SEM micrographs of TCC prepared in the TCP bath at 40 °C with (a) 0 s; (b) 30 s; (c) 180 s; (d) 360 s.
Coatings 09 00297 g005
Figure 6. SEM micrograph of a TCC on Zn55Al formed by 180 s at 40 °C in TCP bath with different magnification: (a) 7000×; and (b) 30,000×.
Coatings 09 00297 g006
Figure 7. Pull-off adhesion strength measurements of the epoxy coatings applied on (a) degreased Zn55Al specimens; (b) Zn55Al specimens treated by 180 s at 40 °C.
Coatings 09 00297 g007
Figure 8. Linear polarization curves of TCCs with different treatment times in aerated 0.5 M NaCl solution.
Coatings 09 00297 g008
Figure 9. (a) SEM morphology of a 180 s formed TCC on Zn55Al and (b) 2D-EDS elemental maps of Al, Zn, Zr, Cr, F, Si, C and O performed over the area on the specimen marked with red dotted rectangle as indicated in Figure 9a.
Coatings 09 00297 g009
Figure 10. SEM micrograph of the TCCs on Zn55Al with different Ar+ ion sputtering time: (a) 0 min; (b) 10 min; (c) 30 min. The detection positions of AES depth profile in dendritic and inter-dendritic regions are also marked respectively.
Coatings 09 00297 g010
Figure 11. AES elemental atomic in-depth distribution of selected points on TCC formed by 180 s at 40 °C in the TCP bath: (a,b) dendritic region and (c,d) inter-dendritic region.
Coatings 09 00297 g011
Figure 12. XPS survey scan of a selected Zn55Al specimen treated by TCP for 180 s at 40 °C in TCP bath.
Coatings 09 00297 g012
Figure 13. High resolution XPS spectrum and curve fitting for Cr 2p photoelectron region for a TCC formed on Zn55Al for 180 s in TCP bath at 40 °C.
Coatings 09 00297 g013
Figure 14. High resolution XPS spectrum and curve fitting for Zr 3d photoelectron region for a TCC formed on Zn55Al for 180 s in TCP bath at 40 °C.
Coatings 09 00297 g014
Figure 15. High resolution XPS spectrum and curve fitting for Al 2p photoelectron region for a TCC formed on Zn55Al for 180 s in TCP bath at 40 °C.
Coatings 09 00297 g015
Figure 16. High resolution XPS spectrum and curve fitting for Zn 2p photoelectron region for a TCC formed on Zn55Al for 180 s in TCP bath at 40 °C.
Coatings 09 00297 g016
Figure 17. The contact angle of 4 μL water droplets on the TCP-treated Zn55Al sheets with different immersion periods: (a) 0 s; (b) 30 s; (c) 60 s and (d) 180 s.
Coatings 09 00297 g017
Figure 18. Cathodic polarization curves for Zn55Al specimens with and without TCP treatment in de-aerated or aerated 0.05 M NaCl solution.
Coatings 09 00297 g018
Table 1. Electrochemical parameters obtained from polarization curves shown in Figure 8.
SpecimensRp (Ω)icorr (A/cm2)Ecorr (V)
Pre-treated1.7675 × 1031.0750 × 105−0.981
TCP for 30 s2.1773 × 1031.0104 × 105−0.987
TCP for 60 s2.2851 × 1039.6276 × 106−0.984
TCP for 120 s1.7180 × 1041.2806 × 106−1.014
TCP for 180 s2.2487 × 1049.7834 × 107−1.026
TCP for 360 s1.4671 × 1041.4996 × 106−1.037
Table 2. Fitting results of cathodic polarization curves recorded in Figure 17.
SpecimensCurveEcorr (V)icorr (A/cm2)
Uncoated Zn55Al in aerated 0.05 M NaClCP−0.89362.13 × 10−7
Uncoated Zn55Al in de-aerated 0.05 M NaClCP−0.93055.21 × 10−8
Cr(III) treated Zn55Al in aerated 0.05 M NaClCP−1.05984.81 × 10−8
Cr(III) treated Zn55Al in de-aerated 0.05 M NaClCP−1.04327.72 × 10−8

