Article

Electrochemical Impedance Spectroscopy Study of Waterborne Epoxy Coating Film Formation

by
Natalija Končan Volmajer
1,
Miha Steinbücher
1,
Peter Berce
1,
Peter Venturini
1 and
Miran Gaberšček
2,*
1
Helios Tovarna barv, lakov in umetnih smol Kolicevo, d.o.o., Količevo 65, 1230 Domžale, Slovenia
2
Department of Materials Chemistry, National Institute of Chemistry, Hajdrihova 19, 1001 Ljubljana, Slovenia
*
Author to whom correspondence should be addressed.
Coatings 2019, 9(4), 254; https://doi.org/10.3390/coatings9040254
Submission received: 13 March 2019 / Revised: 8 April 2019 / Accepted: 11 April 2019 / Published: 16 April 2019

Abstract

:
The film formation process in waterborne (WB) epoxy coatings is studied using electrochemical impedance spectroscopy (EIS) measurements and dynamic mechanical analysis (DMA). Ten epoxy coatings with different pigment volume concentration were prepared on standard steel substrates and carefully monitored over four weeks (30 days). It is shown that impedance spectroscopy can serve as a very sensitive tool for accurate experimental detection of the critical pigment volume concentration. We also show that the optimal film formation process and corrosion stability of coatings are greatly affected by the coating pigment volume concentration (PVC) value. As a whole, the study confirms that the optimization of coating protection ability needs to take into account both maximization of the barrier effect as well as maximization of the degree of epoxy-amino cross-linking.

1. Introduction

With some exceptions, coatings are composite materials consisting of a polymer binder and solid particles (pigments, fillers), as well as various additives. Fillers do not only provide additional volume to coatings, but also significantly affect its applied, mechanical, anti-corrosive and visual properties [1].
The two primary functions of coatings are decoration and protection. In the case of coatings for metal substrates, the latter usually refers to protection against corrosion, mechanical wear and various extreme chemical effects. In recent years, the coating industry and, more specifically, the field of anti-corrosive coatings has undergone significant changes. More specifically, the composition of coatings had to be substantially modified in order to comply with environmental and chemical legislation and demands for products’ cost-effectiveness in the competitive market. As a result, the coating industry has been intensively working towards new solutions. One of those is waterborne epoxy coatings, which over the last 45 years have become a commercially accessible technology.
An interesting approach towards optimization of a coating is changing the composition of solid particles. In this respect one of the most important parameters that determines the quality of a coating is the pigment volume concentration (PVC), i.e., the percent by volume of a pigment in the total volume of solid material in a paint. PVC affects the coating’s mechanical properties, water permeability, anticorrosion properties of the coating’s film, physical ageing and glass transition temperature (Tg). In this paper, however, we are particularly interested in how PVC affects the formation process of a coating film. In this context, the limiting value of PVC known as critical pigment volume concentration (CPVC) is of the utmost importance. CPVC represents the value of PVC corresponding to “the random tightest possible packing pigment particles and the minimum amount of binder necessary to fill the interstices between particles” [2]. Most importantly, at this level of pigmentation practically all coating properties change drastically. Below CPVC the coating film is continuous and made only of binder and pigments. Above CPVC the coating film is discontinuous due to the presence of air pockets around pigment particles that replace the binder. The ratio PVC:CPVC is often referred to as the “reduced pigment volume concentration” and denoted as Λ (see Experimental Section).
One of the methods that has been found particularly useful for investigation of various coating properties in our case is electrochemical impedance spectroscopy (EIS) [3,4,5,6,7,8,9,10,11,12,13,14,15]. EIS is a nondestructive and relatively fast in situ method that may give important information about selected coating properties, such as concentration of water and diffusion coefficient of ions in a coating, as well as porosity and delamination. Based on this information one may try to predict the long-term performance of selected coating which, ultimately, may lead to a fast and useful ranking of various coating formulations according to their anti-corrosive protection properties.
The number of published studies on using EIS for investigating the effects of PVC is relatively small. Most of these studies [16,17,18,19,20,21] were carried out on alkyd, epoxy and other solvent borne-based coatings. Furthermore, there are only a few reports about the use of EIS to study PVC in waterborne coatings [4,22]. Similarly, EIS has very rarely been used for detection of film formation in waterborne coatings. For example, Berce et al. [23] used EIS for detection of latex film coalescence.
Film formation in waterborne coating systems is a complex, diffusion controlled process. The process involves two stages: Evaporation of water and cosolvents with coalescence of binder particles and chemical reaction (cross-linking) between the reactants [24]. When a coating system based on dispersed resin particles is applied, the resin particles merge or coalesce during the drying process and form a homogeneous polymer film [25]. The process of particle coalescence is influenced by numerous factors such as the particle size in the dispersed phase, the temperature and relative humidity (RH), the solvent content and the type of a polymer. For ambient-cured, two-component, waterborne epoxy systems, coalescence is complicated due to the ongoing reaction of the epoxy resin and the curing agent. Therefore, coalescence is further affected by the time (introduction period) between the mixing of components and the actual application of the coating, the reaction kinetics, the type of epoxy resin and curing agent system, and the rate of diffusion of the curing agent from the aqueous phase into dispersed resin. In general, the lower the viscosity and reactivity of the epoxy/curing agent, the more consistent the coating characteristics will be, which is a direct result of a more homogeneous cross-linked structure.
The present study is based on the hypothesis that the best anti-corrosive protection is achieved in coatings with two specific characteristics: (i) The highest possible undercritical PVC containing micro particles and (ii) the ability to form a homogenous film. In general, higher rates of water evaporation lead to better film formation. The use of adequate cosolvent, which extends the interval for the water evaporation by lowering Tg and viscosity of resin and thus ensures appropriate condition for coalescence, also significantly influences the film formation. We also suspect that PVC substantially affects the reaction of the epoxy-amino curing (cross-linking). Due to rigidity of the system or due to increase of system’s molar mass, the reaction of high PVC samples stops, resulting in unreacted (soft) fragments of reagents, solvents or water in the coating, which reduce the corrosive resistance of the coating. System’s rigidity can be perceived also in the overly cross-linked system, where the number of pigment particles is too low. Finally, we hypothesize that the detection of CPVC (limiting PVC) and, consequently, of corrosion resistance is of crucial importance, while assuming the ideal pigment wetting in the water system.
Based on the above hypothesis, the main goal of this work is to find a link between the film formation process, as detected using EIS, the results of classic water condensation chamber experiments and the results of thermal analysis (DMTA). In particular, we demonstrate the extreme sensitivity of EIS for detection of the transition from subcritical (PVC) to critical pigment volume concentration (CPVC) transition on a set of samples with different PVC values.

2. Materials and Methods

2.1. Method of Epoxy Paint Preparation

All experiments were carried out based on a standard procedure. The required quantity of commercially available water based epoxy emulsion (52% non-volatile matter, 1200 mPas dynamic viscosity, 1000 g/mol epoxy equivalent), deionized water, solvents and additives (defoamer and wetting agent) were taken. Talc filler (Mondo minerals/d50 (medial particle size) 50 µm, oil absorption 24 g/100 g) was slowly added to epoxy in a dissolver can. The coatings were prepared by dissolvers and bead mill (30 min, 2500 RPM, 20 °C). As a basis the composition of a standard 50% of PVC epoxy paint formulation was used: 618 g of epoxy resin, 24.7 g of cosolvent, 275.9 g of talc 66.6 g of deionized water and 14.8 g of additives (defoamer, wetting agent).
Paints containing different values of PVC were prepared by first preparing a larger quantity of a starting sample that contained a surplus of pigment (i.e., having a composition above the CPVC). To this sample, different quantities of binder were then added to change the pigment:binder ratio in a controlled way and achieve desired PVC values.
The polyamine hardener was added in stoichiometric quantity and mixed in all variations of different PVC coatings just before the application. Ten different coating variations (Table 1) with different PVCs were used, i.e., with reduced pigment-volume concentrations (Λ) having theoretical values from 42% to 111%. The viscosity of the paint was adjusted with 25 wt. % of deionized water. The paint was applied on standard steel substrates for electrochemical investigation and on plastic foils for thermo-mechanical investigations.

2.2. Electrochemical and Thermo-Mechanical Measurements

Electrochemical investigations were carried out on a Parstat 2273 potentiostat/frequency response analyzer by Princeton Applied Research (Ametek Scientific Instruments, Illinois Avenie, OR, USA). Measurements were performed at open circuit potential over a frequency range of 65.5 kHz–100 mHz with a 30 mV sinusoidal perturbation. The impedance spectra were analyzed with ZView® software (3.5d) by Scribner Associates Inc. (Southern Pines, NC, USA). A three-electrode setup based around the Tait Cell Kit (K0307, Ametek Scientific Instruments, Illinois Avenie, OR, USA) by Princeton Applied Research (see Supplementary Materials, Figure S1) was used to obtain EIS data. The Tait Cell uses pseudo-reference and counter electrodes made of Hastelloy C-276 and sample coated panels served as the working electrode with an area of 34 cm2. A 0.1 M aqueous NaCl solution was used as the connecting electrolyte.
The surface preparation of steel substrates with a size of 100 mm × 90 mm × 1 mm was carried out according to the ISO 8501-1 standard [26] and following the relevant preparation level St2. The steel substrates were coated using a 125 µm spiral film applicator (Zehntner Gmbh Testing Instruments, Sissach, Switzerland). The thickness of the dry coatings was measured with a Dualscope FMP20 by Helmut Fischer GmbH (Sindelfingen, Germany), using a magnetic induction probe in accordance with ISO 2178 [27]. Air temperature 23 ± 2 °C and the relative humidity 50% ± 5% were kept constant during the 30-day measuring period. Impedance measurements were carried out after 1, 7, 21 and 30 days after coating application. The thickness of the films on steel substrates was kept at approximately 65 ± 10 µm (Table 2). For each sample all impedance measurements (after 1, 7, 21 and 30 days) were done on the same film on steel substrate.
The mechanical properties resulting from the continuing curing were monitored using a dynamic mechanical analysis (DMA). Samples for DMA were applied on a polyester foil and curing under the same conditions as the EIS samples. Firstly, a paint film was applied with a 300 µm spiral film applicator on a polyester glassclear, two side adhesion pre-treated film Melinex (506/175 µm) foil of a size 110 mm × 210 mm. The paint was then allowed to cure for 24 h at 23 °C and 40% relative humidity. The DMA data were collected using an MCR 301 rheometer (Anton Paar GmbH, Graz, Austria) with a parallel-plate PP08 (2r = 8 mm, Anton Paar GmbH, Graz, Austria) sensor system. Subsequently a rod-shaped indenter with a radius of 8 mm was pressed to the paint film with a force of 5 Newtons. During the DMA measurements the foil with the sample was subjected to an oscillatory shear deformation heating from −10 to 100 °C at a heating rate of 5 °C/min. The deformation was performed at a frequency of 1 Hz and an amplitude of 1%.

3. Theoretical/Calculation

Impedance data were analyzed using the equivalent circuits 1, 2 and 3 shown in Figure 1, where Cc, represents capacitance of the coating, Rpo represents resistance of electrolyte filled pores, Wb represents Warburg diffusion through the coating and Wcorr represents impedance of a diffusion-controlled corrosion process. Capacitance is a manifestation of dielectric properties of a coating and is defined primarily by its chemical composition and water content. Open pores extending from the film’s surface to the metal substrate accommodate migration of ions, which shows as electrical resistance. Internal voids in the film enable diffusion of ions caused by concentration gradients, which is the underlying model for the Warburg diffusion of the coating. The models were previously discussed by Skale et al. and Murray et al. [28,29,30] and also used by other authors [9,11,13,14].
The correlation between the values of circuit elements and the physical properties of coatings is the following. The coating capacitance is given by the following formula:
C c = ε r ε 0 A d c
where εr is the average dielectric constant of the film, ε0 is the dielectric permittivity of vacuum (8.85 × 10⁻¹² F/m), A is the surface area of the electrode and dc is the film thickness.
Transport of ions by diffusion through the matrix of the coating film is described by the following Warburg element:
W b = 1 σ c j ω
where σc is the Warburg coefficient of the coating, ω is angular frequency and j is the imaginary number. Similarly, the Warburg element for a diffusion-controlled corrosion reaction can be written as:
W c o r r = 1 σ c o r r j ω
where σcorr is the corresponding Warburg coefficient.
The pore resistance is defined as follows:
R p o = l p o κ p o × A p o = ρ p o × d c
where lpo is the average pore length, κpo the conductance of the electrolyte in the pore and Apo the total pore area. The average pore length (lpo) is usually replaced with the film thickness dc, whereas the other parameters are implicitly included into an empirical value of the so-called resistivity of pores (ρpo).
Among the quantities defined in Equations (1)–(4) the average coating thickness, dc, is probably the easiest to control. Thus, it is common to normalize other selected quantities in terms of dc, such as is done in Equation (4). By analogy, a product between the Warburg coefficient and the film thickness has also been introduced and used [31].
Three different equivalent circuits (Figure 1) were used to fit the measured spectra, depending on the type and age of a given coating. During the period of film formation, the impedance due to corrosion process was still comparable to the other contributions so the model shown in Figure 1a was used. At later stages, the only significant contributions were from coating capacitance, the pore resistance and Wb so the model shown in Figure 1b was applied. Finally, as the pores became smaller and smaller, Rpo was excluded, which further simplified the equivalent circuit to the form shown in Figure 1c. Solution resistance was not included in the equivalent circuits since its value of approximately 4 Ω presents a negligible contribution to impedance spectra of analyzed films in the selected frequency range.
As regards the specific samples, model 1a was used to fit the spectra of samples 50% and 49% of PVC (for the period first day until thirteenth day of film formation process) and for all the other samples during the first day of film formation process. For samples 46% to 19% of PVC, the model in Figure 1b was used after seven days of film formation. After thirteen days of film formation process, model 1c was used for fitting the spectra of samples 41% up to 19%.

4. Results and Discussion

4.1. EIS as a Tool for Experimental Detection of PVC-CPVC Transition

Our results confirm that EIS is a very sensitive tool for experimental detection of the transition from PVC to and beyond CPVC. This transition has an extreme effect on the value of impedance at intermediate and low frequencies (below circa 1000 Hz), as can be seen from the typical changes in impedance spectra shown in Figure 2. As low frequency data were noisy, they were consequently removed below about 0.2 Hz for all samples in order to maintain consistency. Samples with 49% and 50% PVC exhibited completely different behavior in comparison to other samples, therefore they were also treated differently. Judging from the phase angle, impedance belonging to coating barrier properties of samples 49% and 50% lies above 1000 Hz. Under 1000 Hz we mostly see interface properties and processes, the study of which was not the focus of this research.
At PVC values below or close to CPVC (i.e., samples with PVC up to about 46%) the typical low-frequency value of impedance is on the order of 1 × 10⁶ Ω or higher. In samples with PVC above 46%, however, the impedance in the same range drops to less than 3 × 10⁴ Ω (more than 30 times). This can be explained with transformation of the coating above CPVC from a continuous to a discontinuous layer, which results in strongly increased penetration of electrolyte to the metallic substrate. This is in agreement with research done by Lobing et al., where they also observed a drop in low frequency impedance when the CPVC was exceeded [3]. The PVC to CPVC transition is even more dramatic if samples are exposed to a water condensation chamber for a sufficient period of time (in our case 7 days) (Figure 3).
Compared to Figure 2, the values of modulus in the lower frequency region for all samples displayed in Figure 3 are much lower—due to partial coating degradation, i.e. partial penetration of electrolyte into and through the structure. However, in terms of EIS as a “diagnostic tool” this partial degradation is beneficial as it reveals differences between the coatings even more clearly—especially as we approach to the CPVC value. In particular, a careful comparison of the measured curves in Figure 2 and Figure 3 shows that the modulus at low frequencies of sample with 46% PVC has now values comparable to the coatings with lower PVC values, whereas in Figure 2 its modulus was several times lower than in the samples with lower PVC. One might assume that the composition of this particular sample is very close to the actual CPVC. Indeed, comparing the impedance analysis with the theoretical calculations of the PVC:CVPC ratio (Table 1, 4th and 5th column, respectively), one finds a very good agreement between the experimental data and the theoretical prediction.
Finally, the change in coating porosity upon transition from PVC to CPVC is also seen from photographs in Figure 4 (and, in addition, in Figure S2, Supplementary Materials). One can see that at the PVC value of 41% (Figure 4a) there is still no observable pore formation. In the sample corresponding to the PVC of 46% (Figure 4b) small pores are already visible, which explains the relatively sharp drop of impedance in Figure 3. The porosity markedly increases at further increase of PVC (Figure 4c,d).

4.2. Monitoring of the Coating Film Formation by EIS Measurements (Versus PVC)

Figure 5 shows a typical development of impedance spectra with the time passed since application of the film. The development for other PVC values (Figure S3 in Supplementary Materials) is similar to the one displayed (PVC = 46%). The measured data (points) could be fitted quite satisfactorily (solid lines) using the equivalent circuits shown and discussed in the “Theoretical Section”. This means that individual physical parameters contained in those equivalent circuits could also be extracted and their behavior at different conditions (time, PVC value) analyzed. Note that, although in the main text we display thickness-dependent parameters, Cc, σc and Rpo, (Tables S1–S3 in Supplementary Materials) the main trends remain valid also for thickness-independent parameters because the variation of thickness in different samples is small (circa ± 15%, see Table 2). The interested reader, however, may still find the results for the corresponding frequency-independent parameters, namely εr, σc, dc, ρpo in the Supplementary Materials (Figures S4–S6, in Supplementary Materials).
Figure 6 shows the time dependence of coating capacity (Cc) for the whole series of prepared formulations. While no obvious trend can be observed, we note, however, that the spread of capacity values is much higher above CPVC (PVC samples 50%–46%) than below CPVC. Theoretically, one would expect that—due to the higher coating porosity above CVPC—samples would contain more chemicals trapped water and thus a higher average dielectric constant, εr (see Equation (1)) [32]. This would, in turn, lead to a higher coating capacity. However, not all the measurements display such a trend. We explain this by the fact that around CVPC the measured impedance spectra drastically transform in shape and magnitude and the resistive properties start to dominate. This means that the determination of capacitive properties becomes more difficult and also less reliable.
Figure 7 shows the dependence of Warburg coefficient, σc, on sample PVC and time of film formation. Higher values of this parameter correspond to lower Warburg impedance and hence higher diffusivity of ions through the film [29]. Due to poor reproducibility and predominantly resistive nature of the spectra corresponding to the critical PVC conditions (samples with PVC = 49%), the corresponding values were omitted. In all samples below that critical percentage the value of σc drops significantly from day 1 to day 7 of film formation. Later on, the value of σc is stabilized and comparable in all samples from PVC value 46%–19%. According to Skale et al. [29] σc is proportional to the square root of ion diffusivity. Thus, lowering of σc is a direct indication of decreasing permeability of the film, which is a consequence of increasing cross-linking density caused by chemical reaction between the epoxy resin and the polyamine hardener. Obviously, the higher values of σc in samples of 50% PVC reflect the higher porosity of these samples due to excess CPVC.
The dependence of film resistance, Rpo, on PVC and time (Figure 8) expectedly confirms the conclusions based on the analysis of the Warburg diffusion parameter: The resistance of films above CVPC remains low at all times (due to significant porosity), whereas in other samples the intrinsically higher initial resistance further increases with time (by more than 1 order of magnitude over 21 days of film formation.

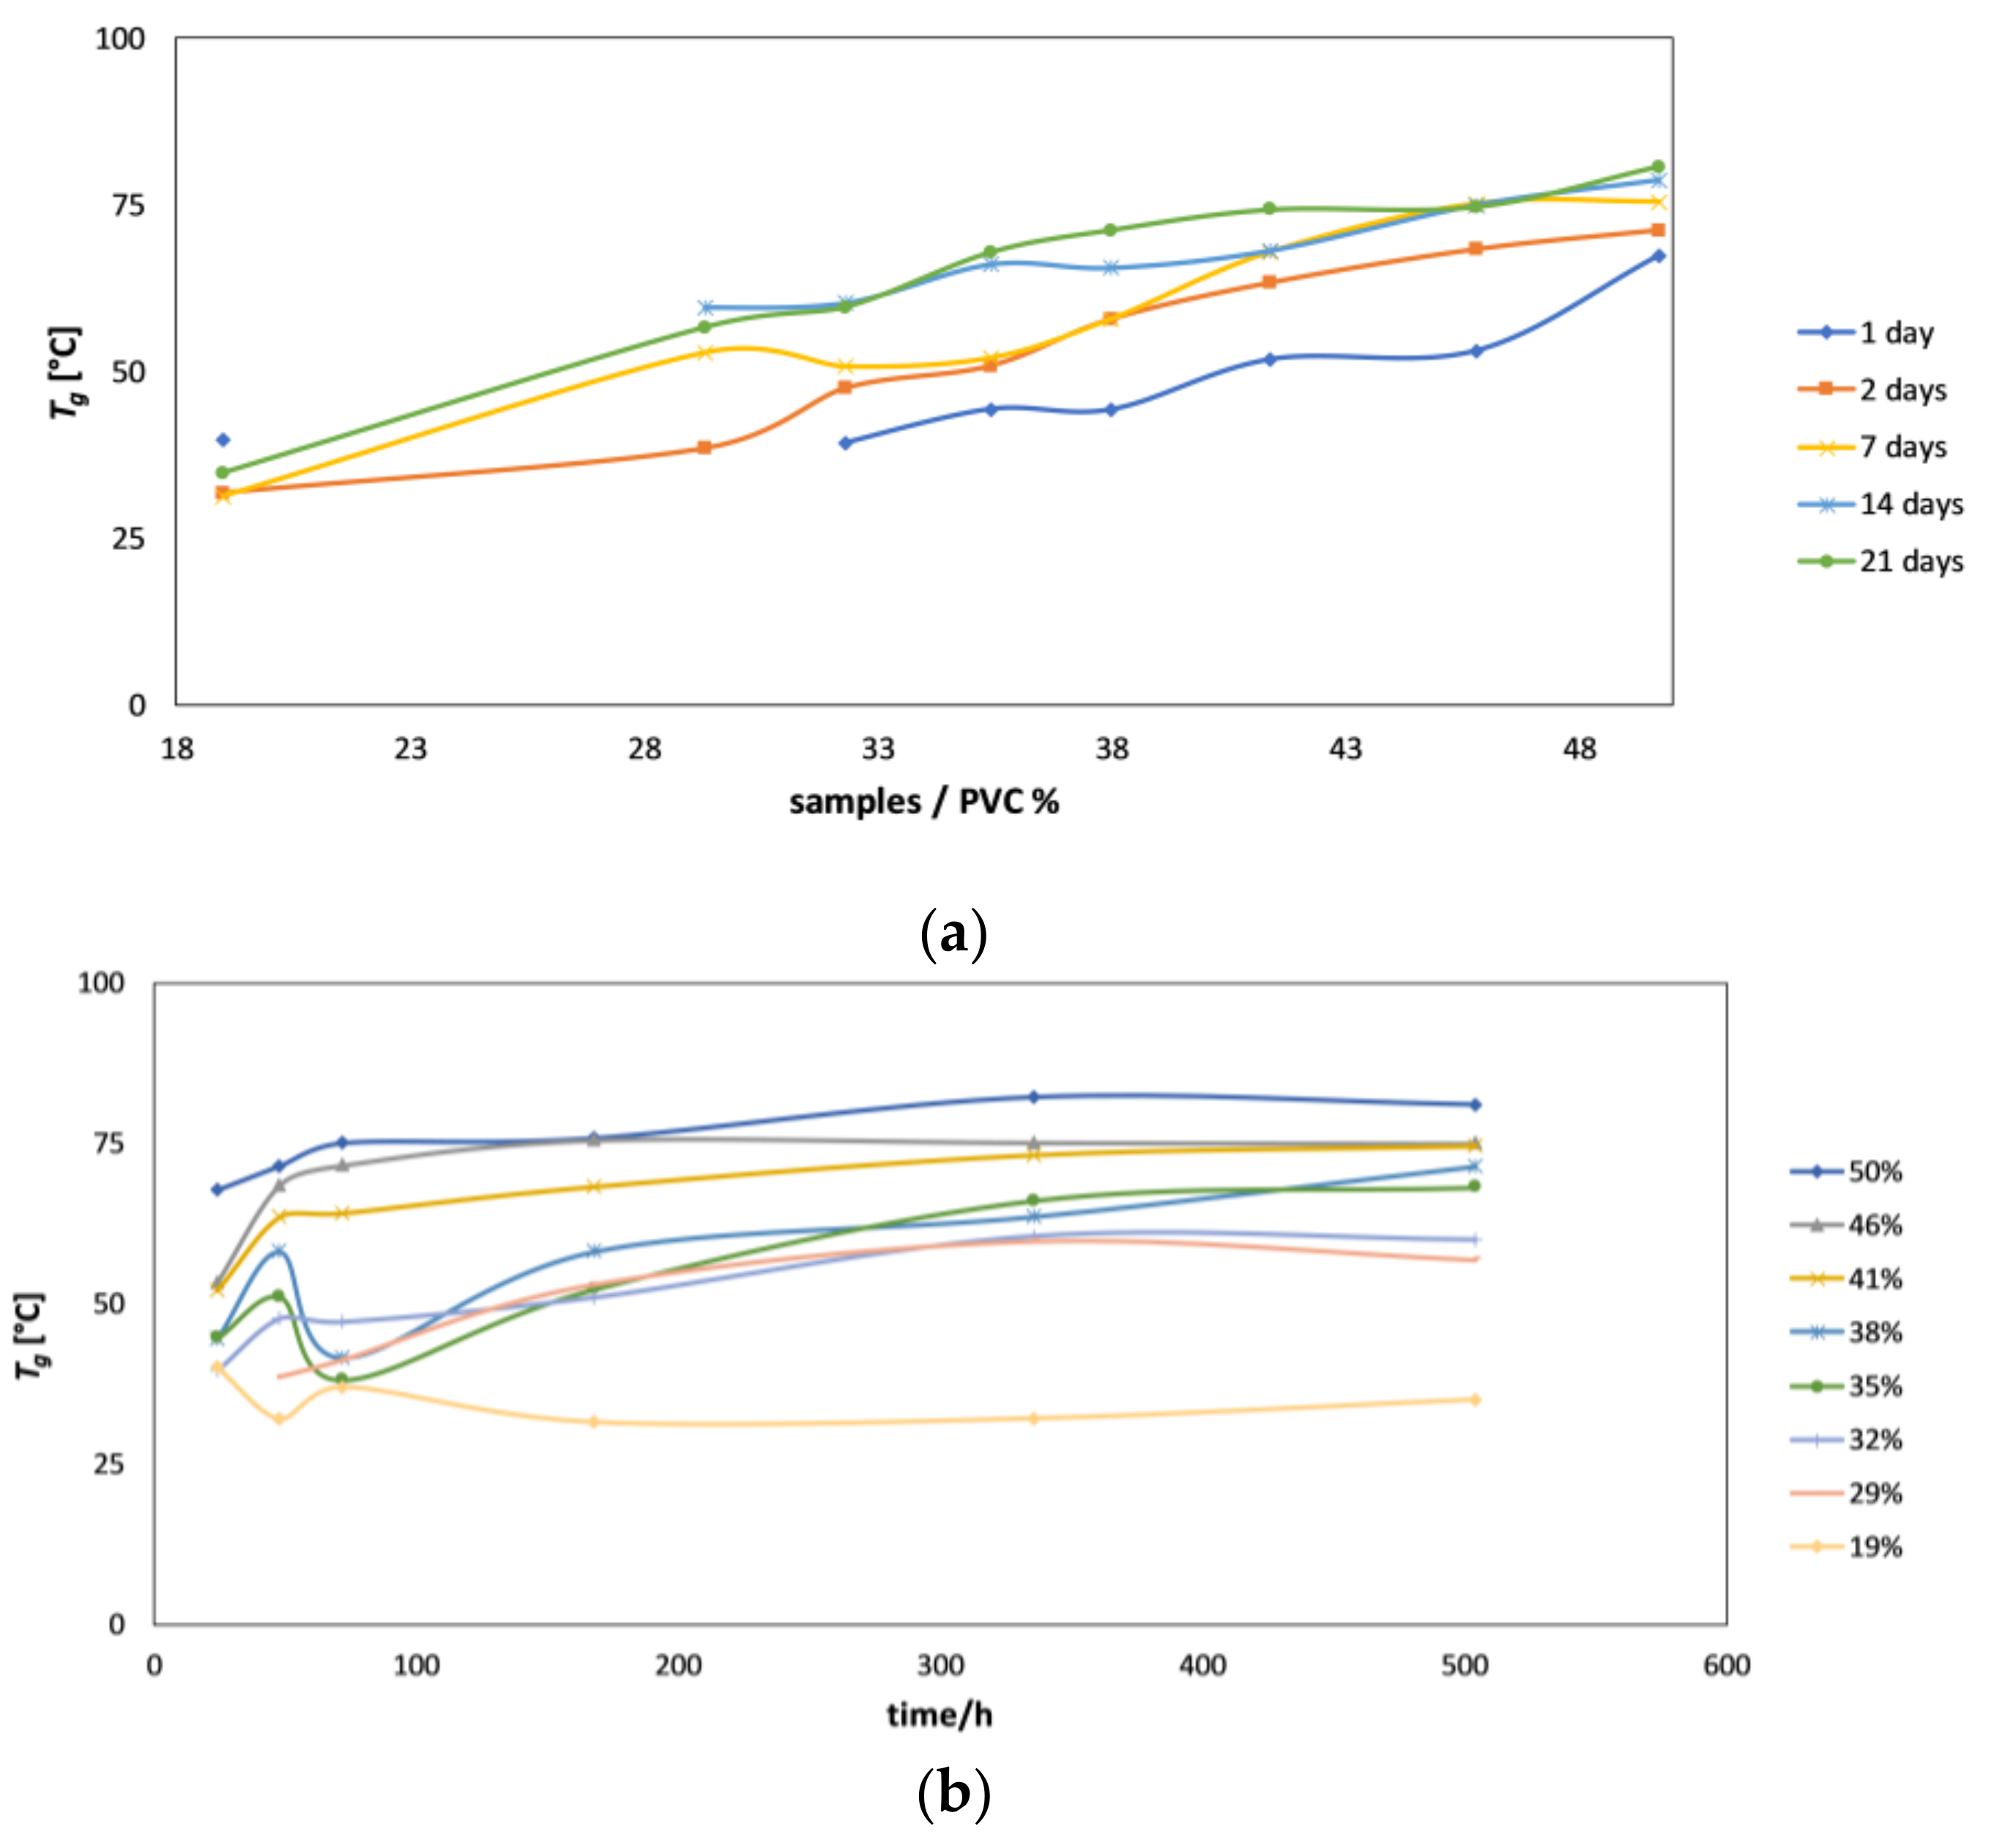
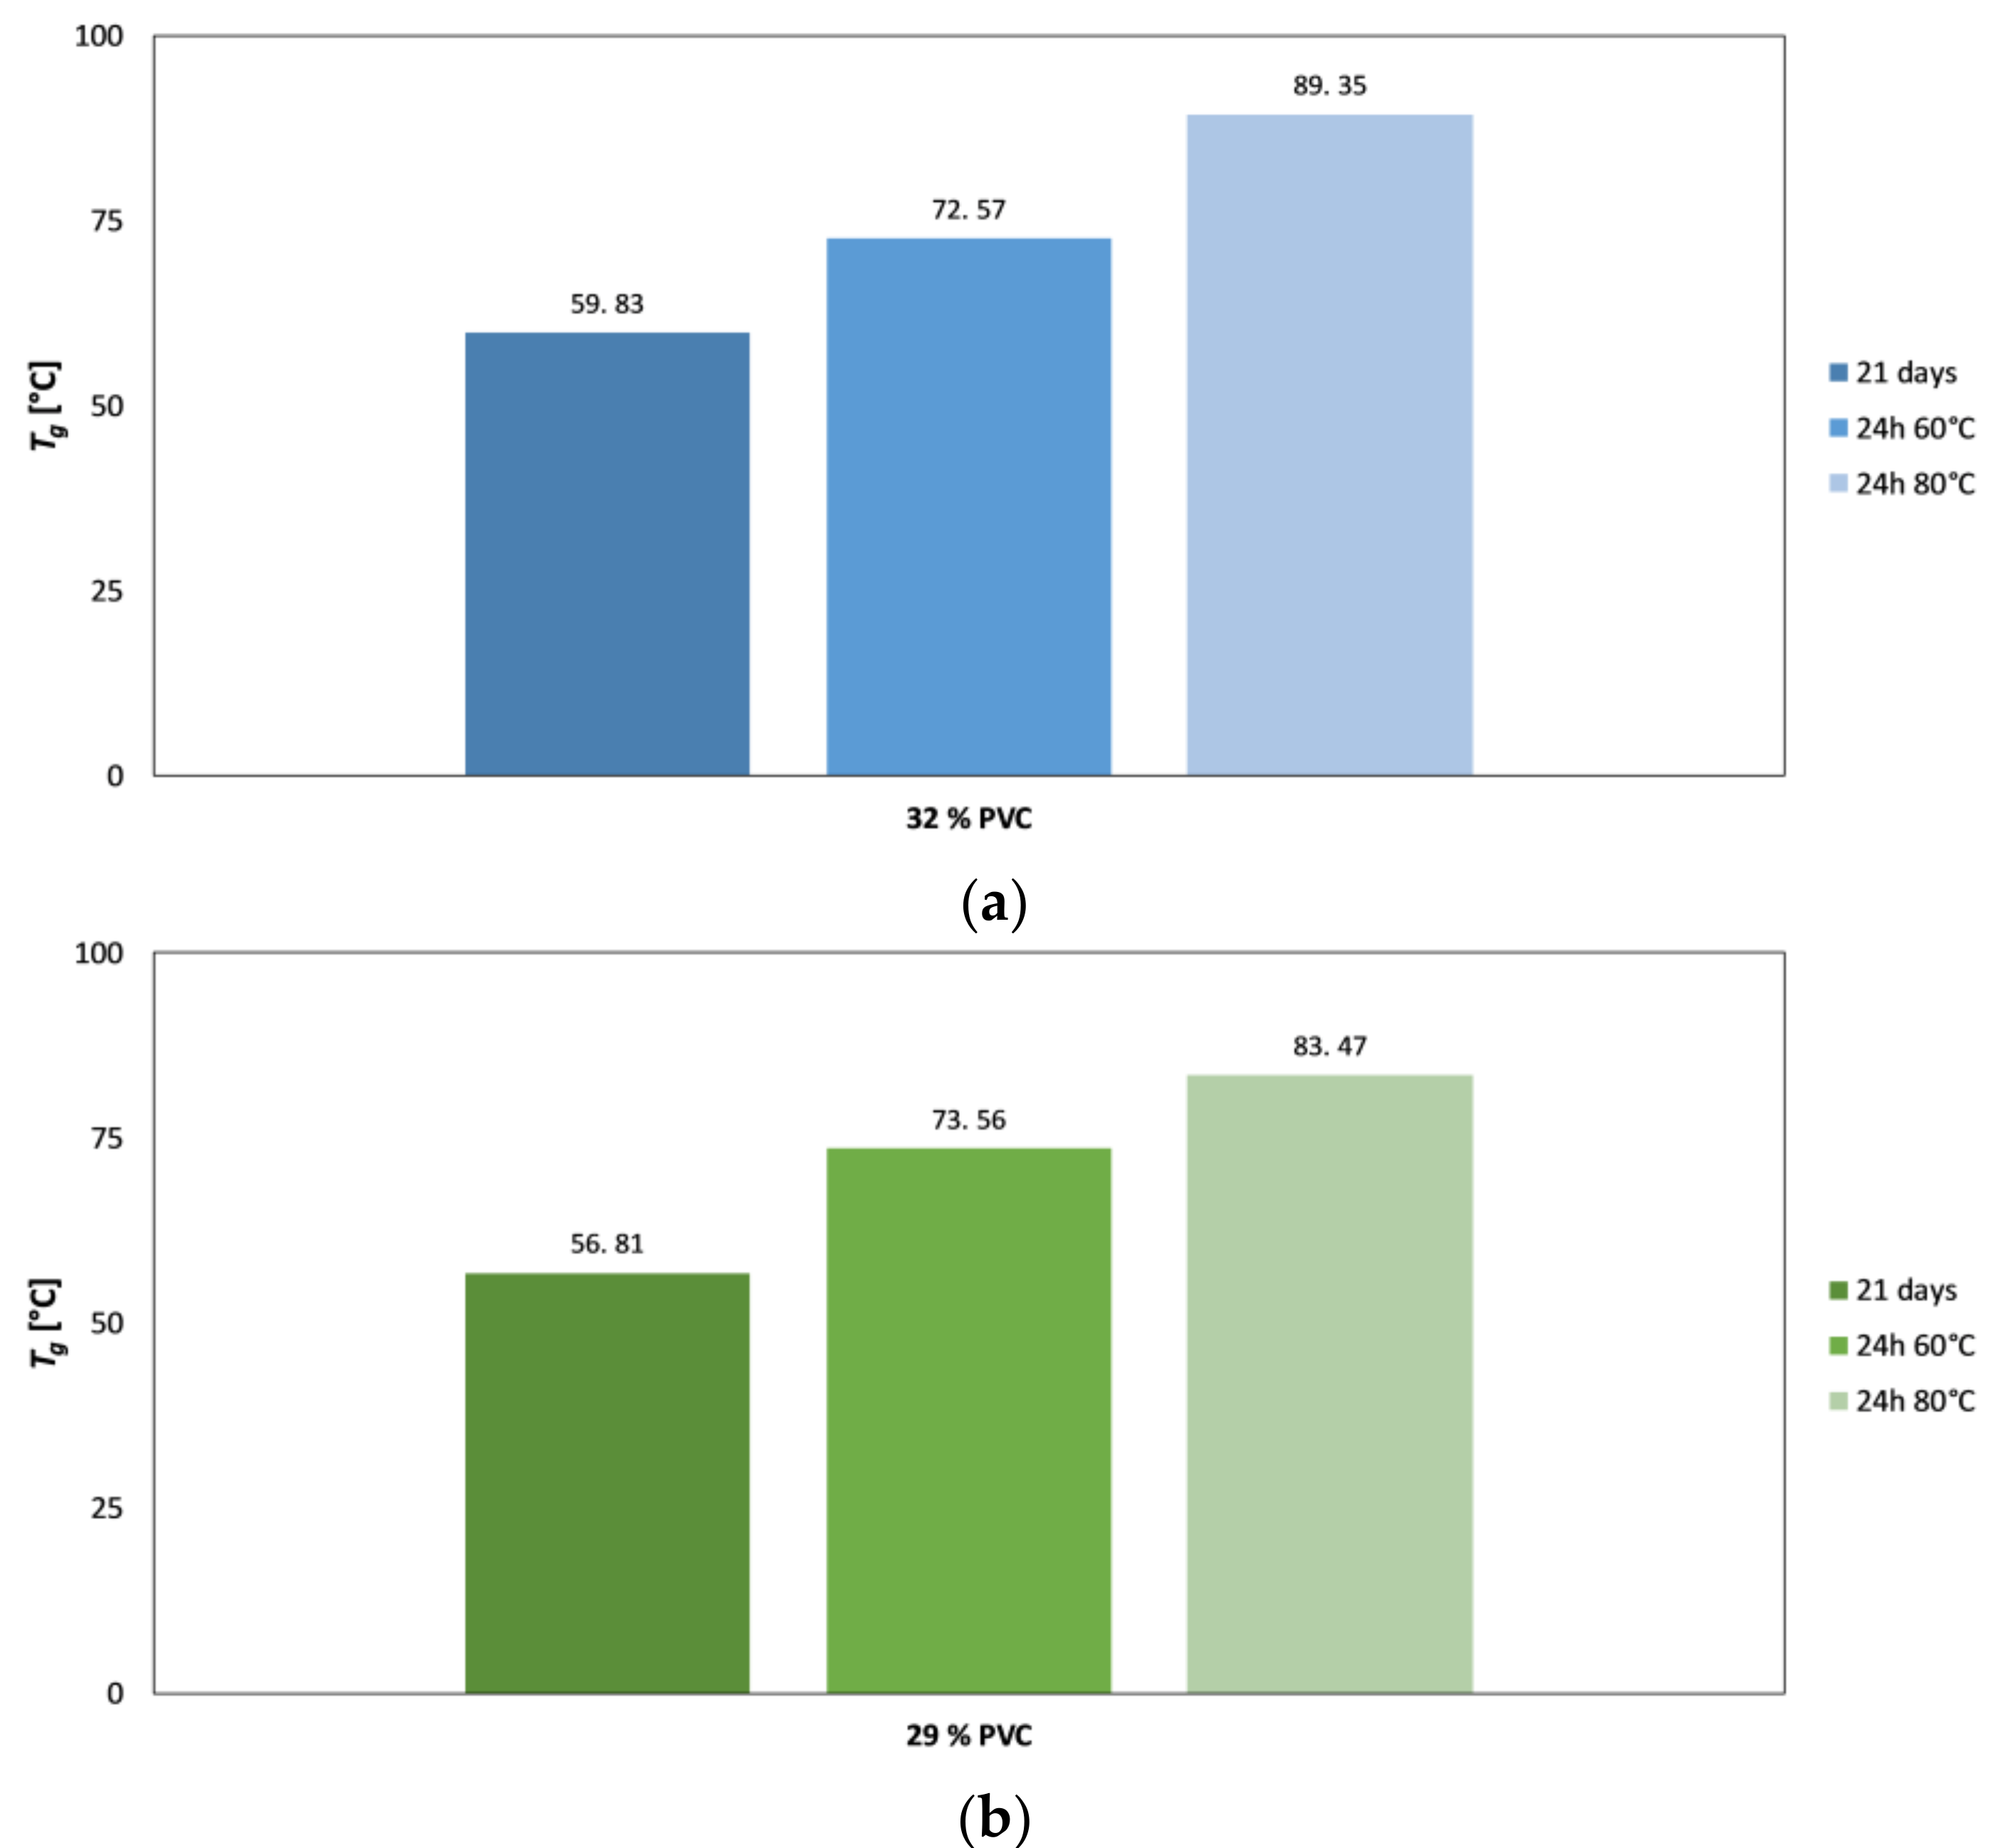
4.3. DMTA as a Supporting Technique for Explanation of EIS Results

General results obtained using dynamic mechanical thermal analysis (DMTA) measurements are displayed in Figure 9a. Clearly, in all samples Tg tends to increase with time of film formation. This is directly correlated with the increasing average cross-link density of coating and is in full agreement with the EIS results, in particular the decreasing Warburg coefficient (Figure 7) and increasing pore resistance (Figure 8). Another evident feature is the decrease of Tg with decreasing PVC content (increasing sample number). A similar behavior has been observed before [1].
Figure 9b shows similar data as those displayed in Figure 9a but in alternative representation highlighting the temporal development of Tg for different samples. Furthermore, an additional measurement carried out after 3 days (72 h) is added. This representation reveals that, despite the general increase of Tg with time, one may observe a maximum at circa 48 h for certain samples, e.g., the ones denoted with 38% to 29% PVC. This initial maximum can be explained by the effect of water evaporation as, consistently, also detected with impedance spectroscopy. In the case of samples 50%, 46% and partly 41% PVC the changes of Tg with time are much less pronounced than in the other samples. Note again that these samples are above the PVC-CPVC transition and are much more porous. Thus, evaporation of bulk water from relatively large open pores proceeds (much) faster although, on the other hand, some water remains entrapped in numerous small pores also at later stages. Another factor that prevents bigger changes of Tg with time is the higher rigidity of cross-linked polymers in samples inside the CVPC region.
We also wanted to check the degree of epoxy-amino cross-linking of typical samples in this study. This was done indirectly by heating the samples to higher temperatures (60 and 80 °C) for 24 h and measuring the Tg of those samples using DMTA (Figure 10). Clearly, Tg still increases at higher temperatures, which indicates that the cross-linking in samples kept at RT for 21 days did not proceed to a full extent due to a slow kinetics. Obviously, there is still room for optimization in this respect. One possibility could be a decrease of the content of PVC fillers (to lower the barrier effect) and another one to increase the cross-linking temperature.
Figure 10 shows that already-small differences in PVC (PVC of sample 29% is 3 percentage points lower than that of sample 32%) affect visibly the Tg of a sample. Expectedly, the higher PVC of sample 32% leads to a higher Tg when treated at room temperature (left columns). However, when the treatment temperature is increased enough, the Tg temperature of sample 32% becomes significantly higher than that of sample 29% (right columns in Figure 10).
As a whole, these results indicate that, in order to maximize the coating protection ability, one needs to find the best compromise between the barrier effect and the degree of cross-linking. As demonstrated, already-subtle differences in PVC content in the vicinity of CPCV value result in visible effects on cross-linking as well as on the barrier effect.

5. Conclusions

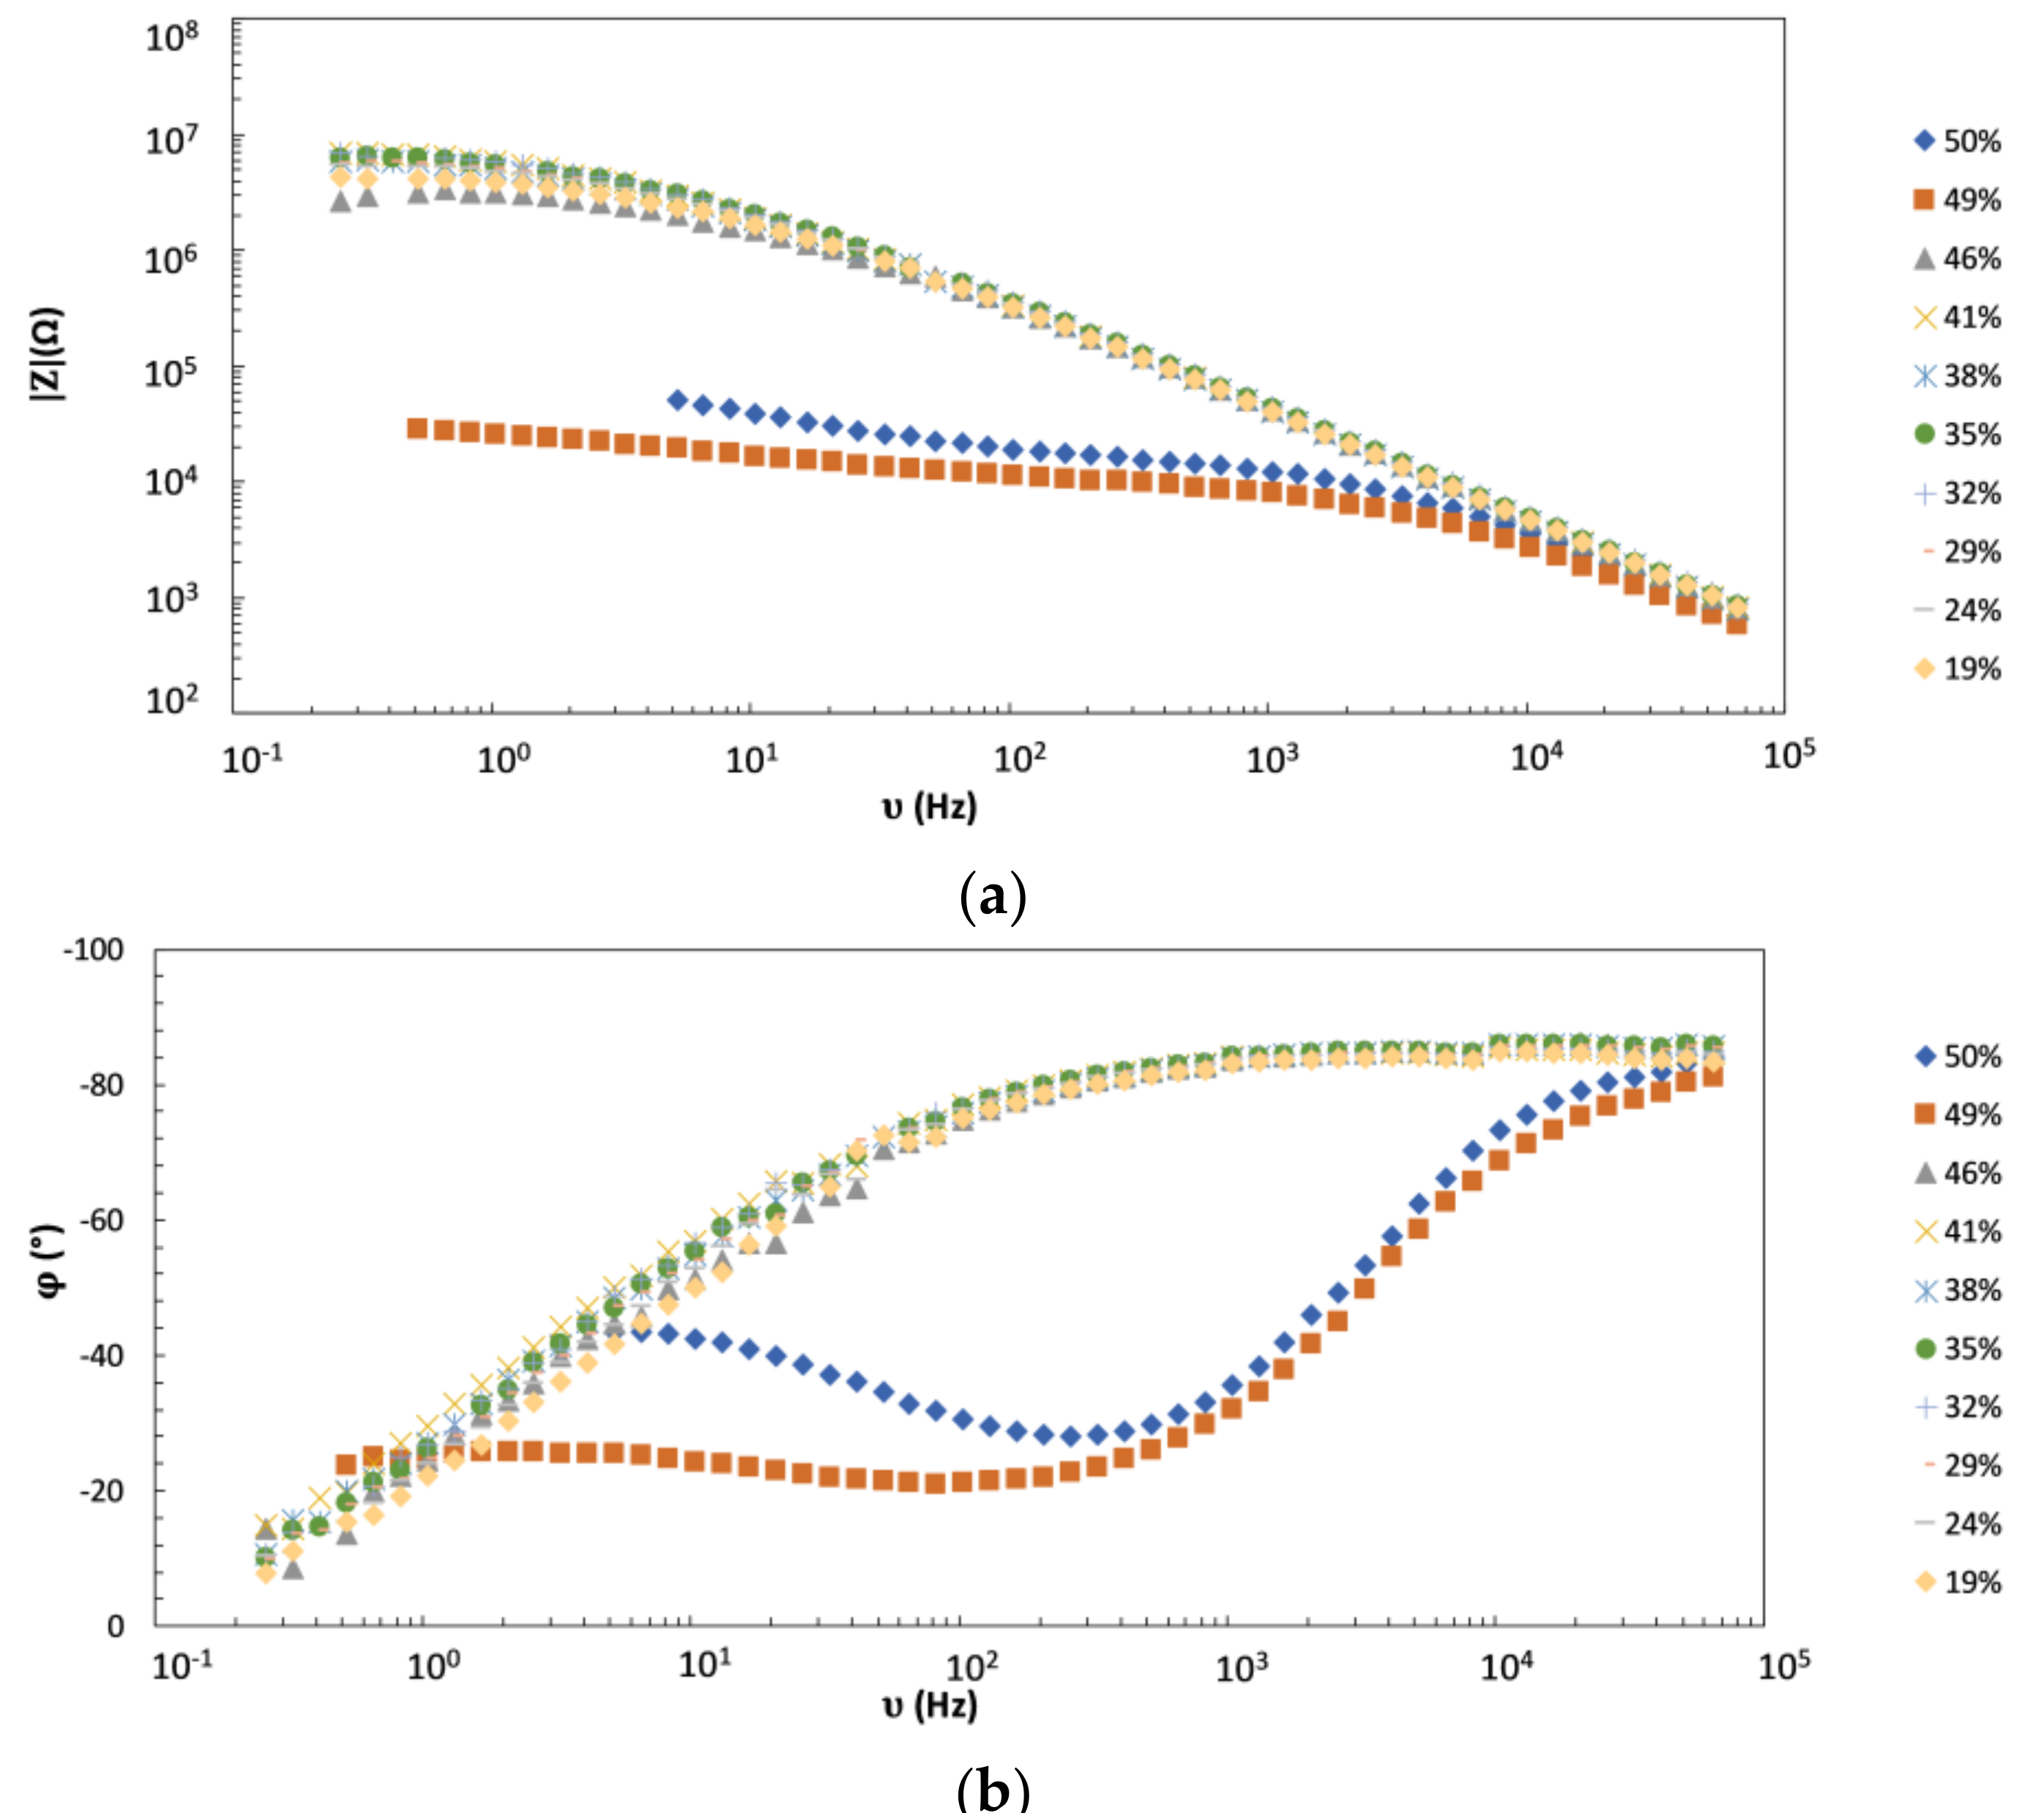
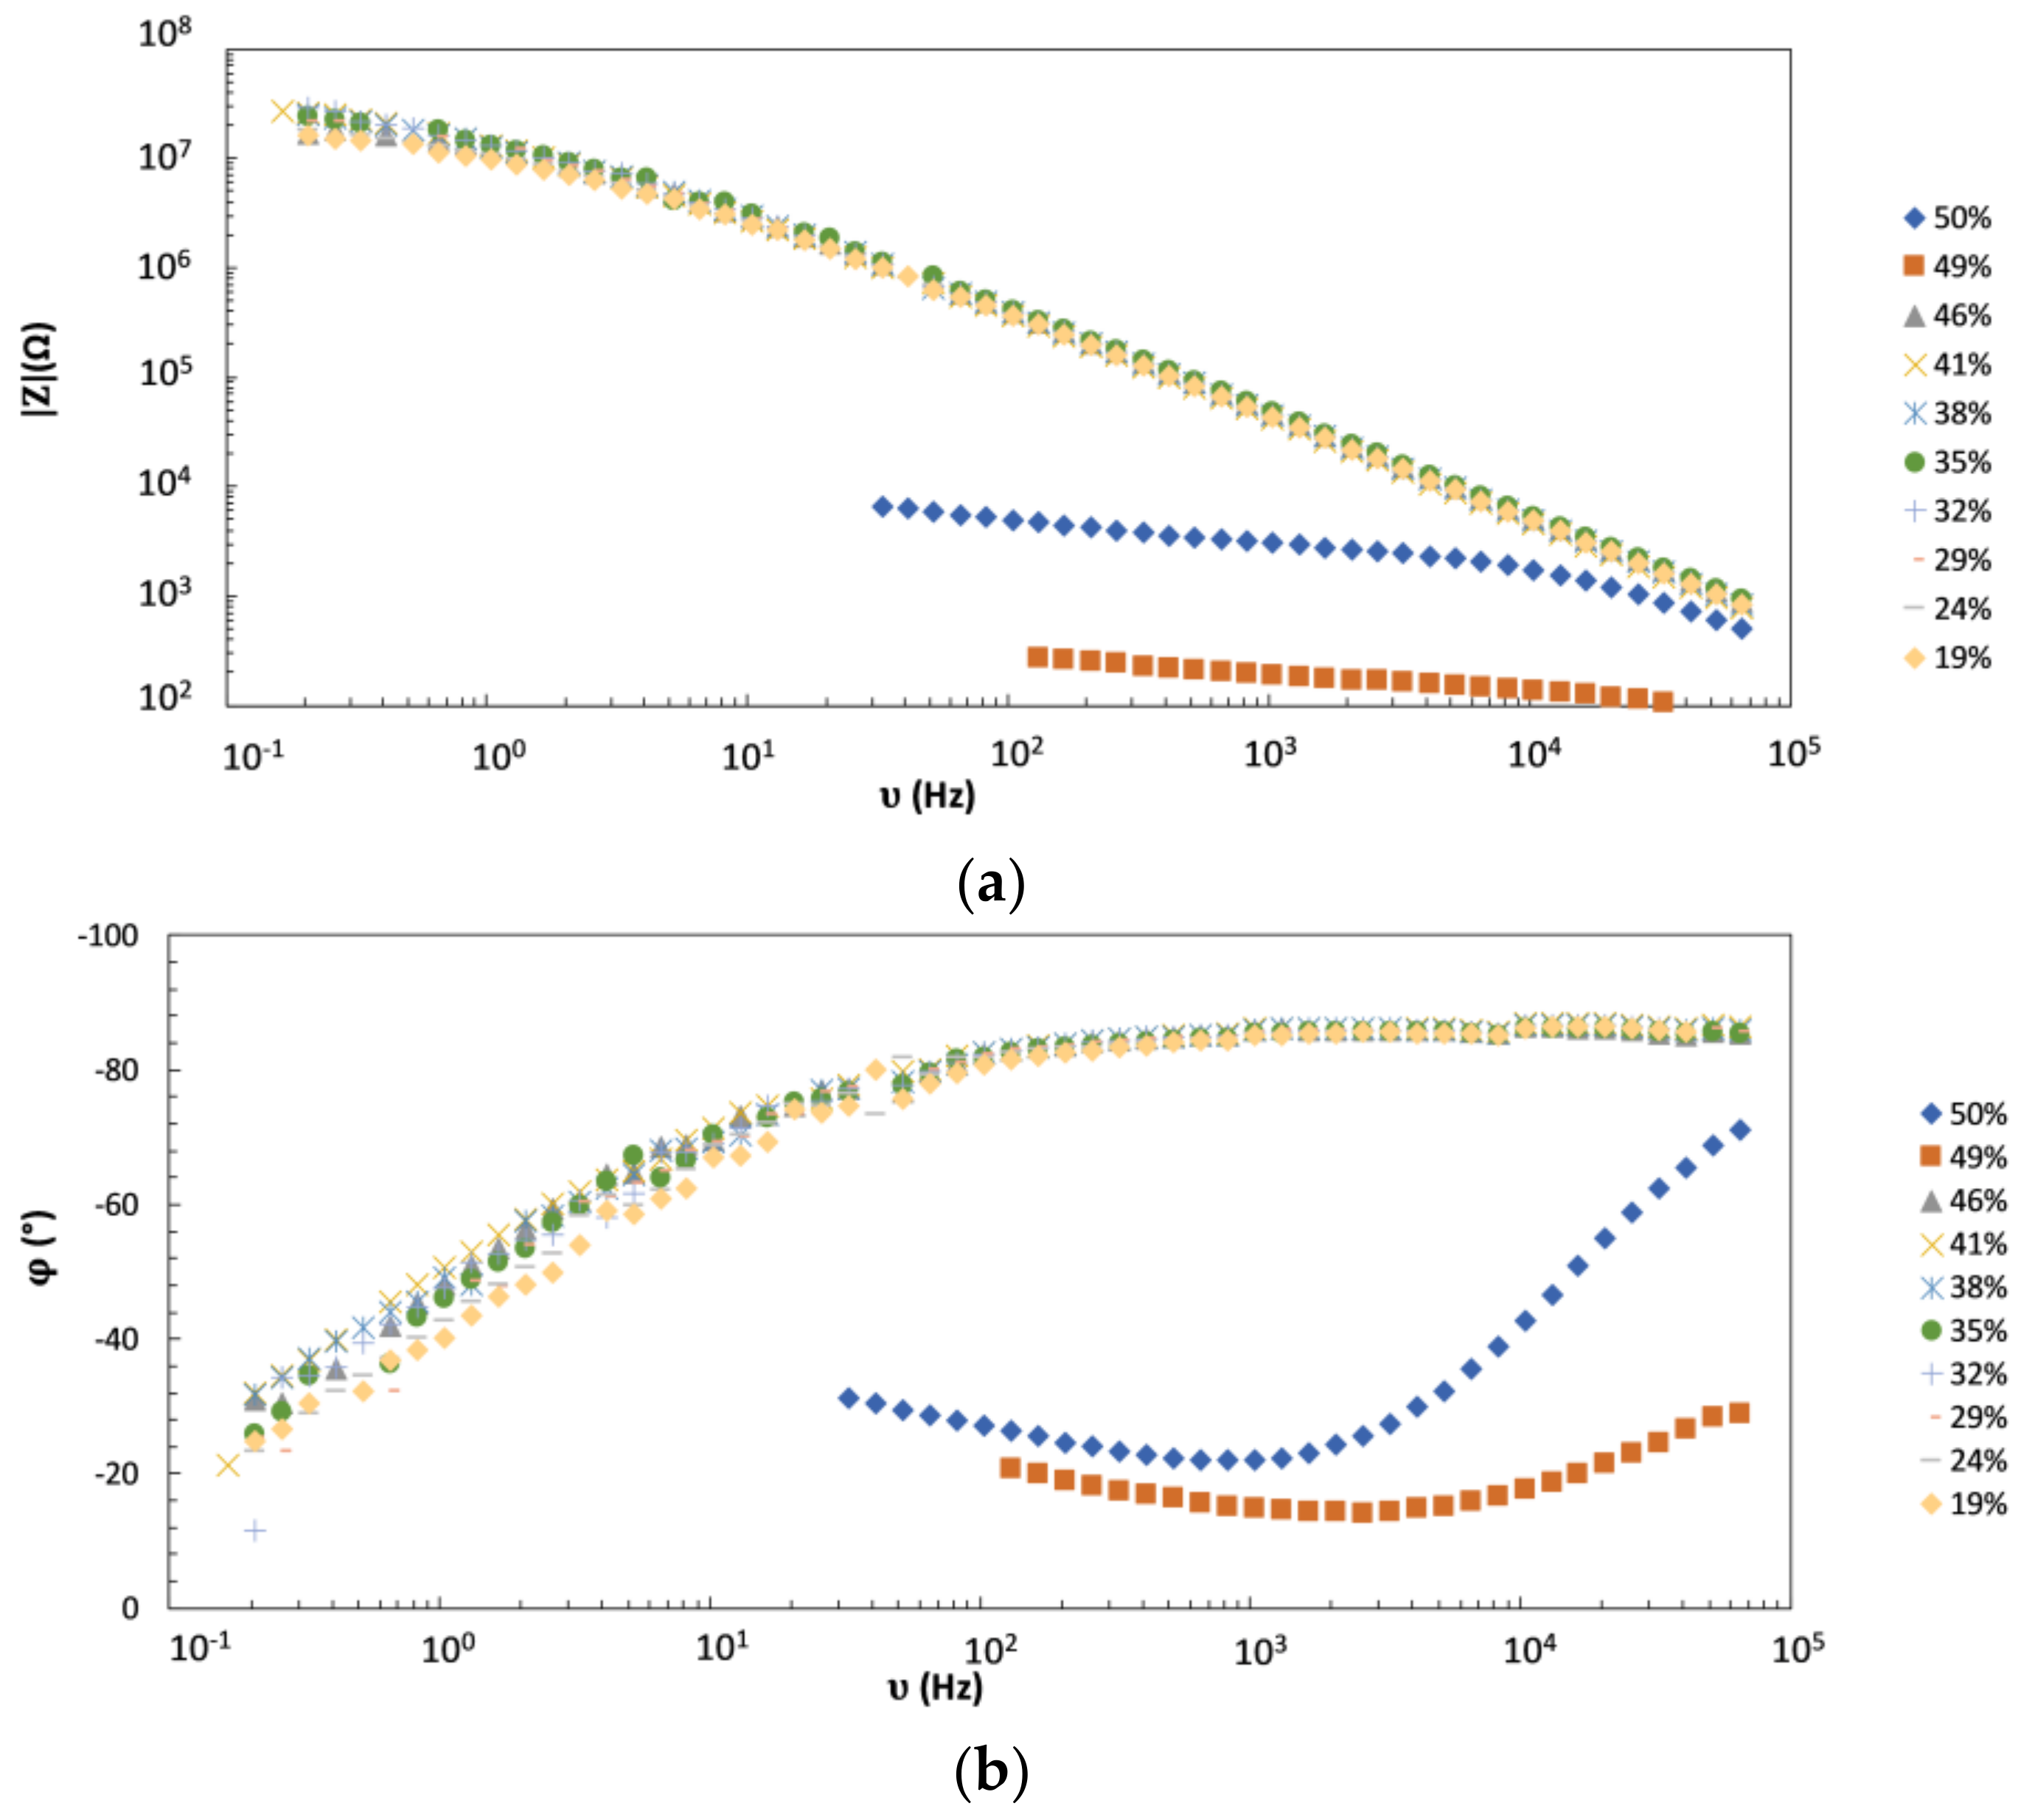
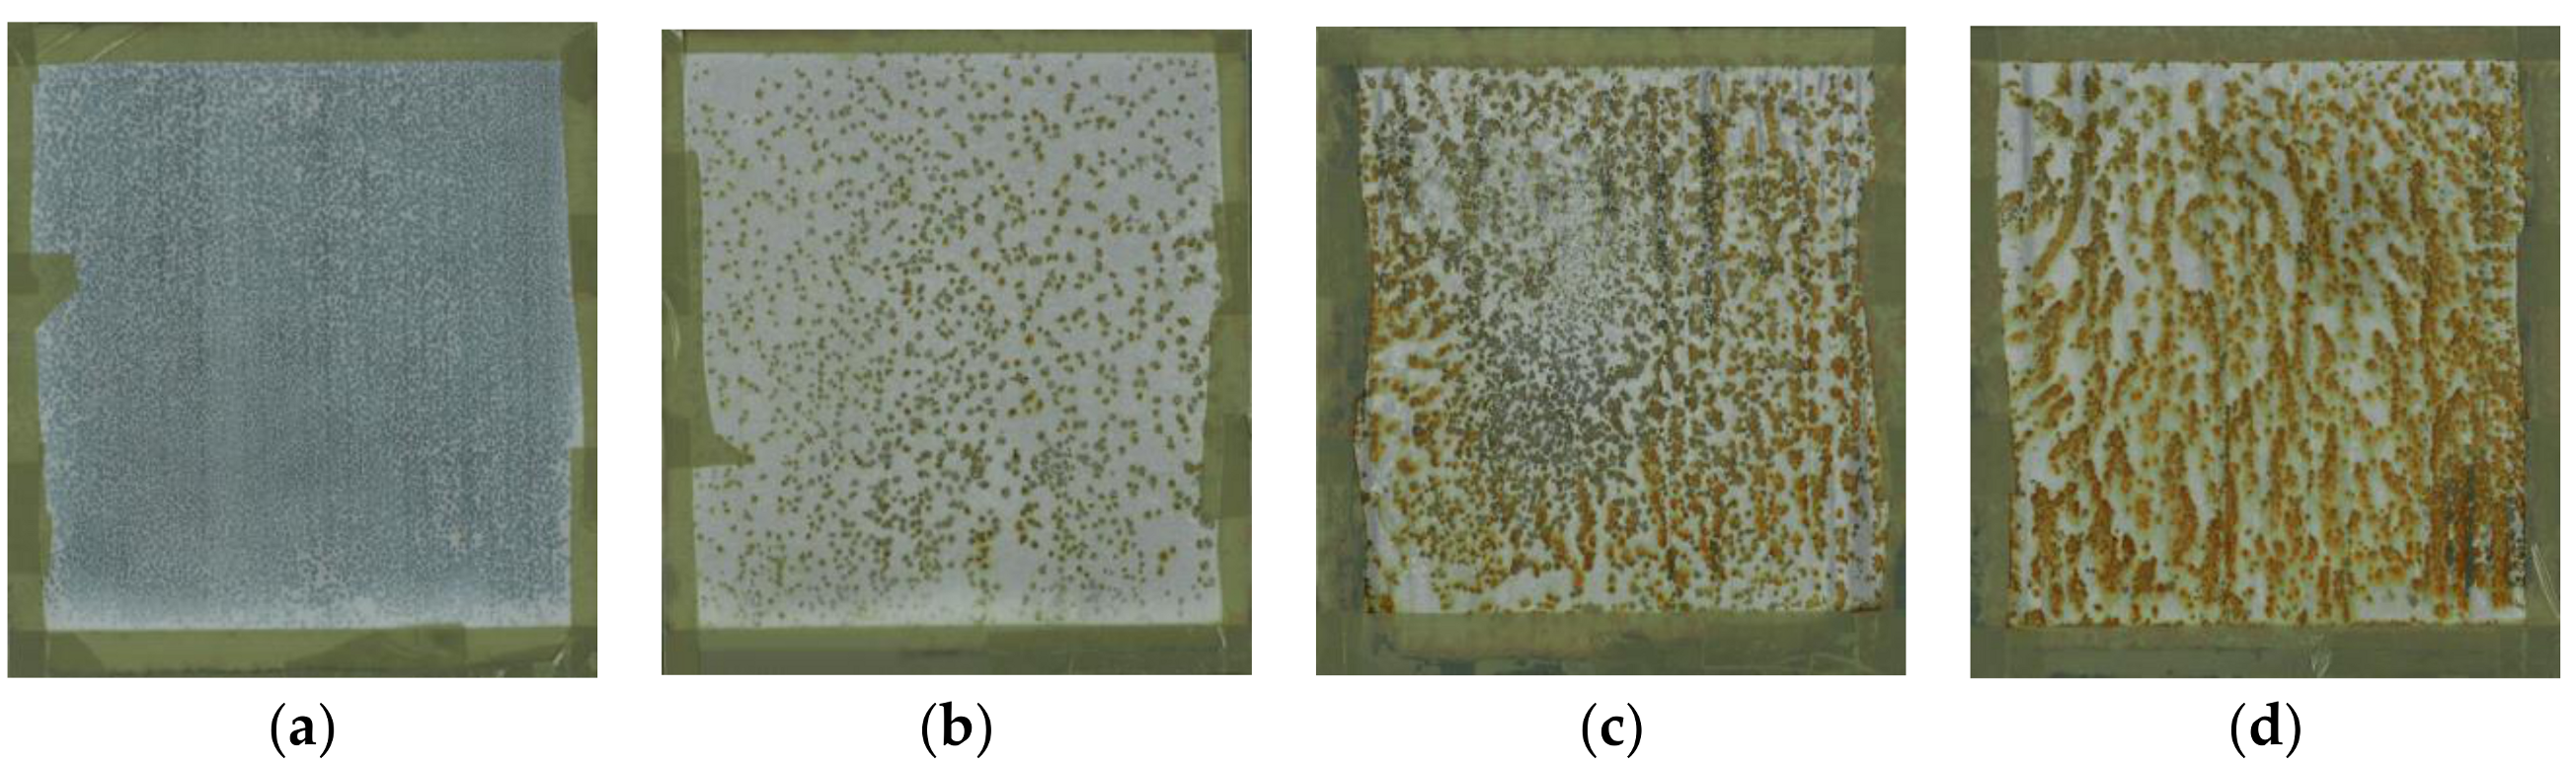
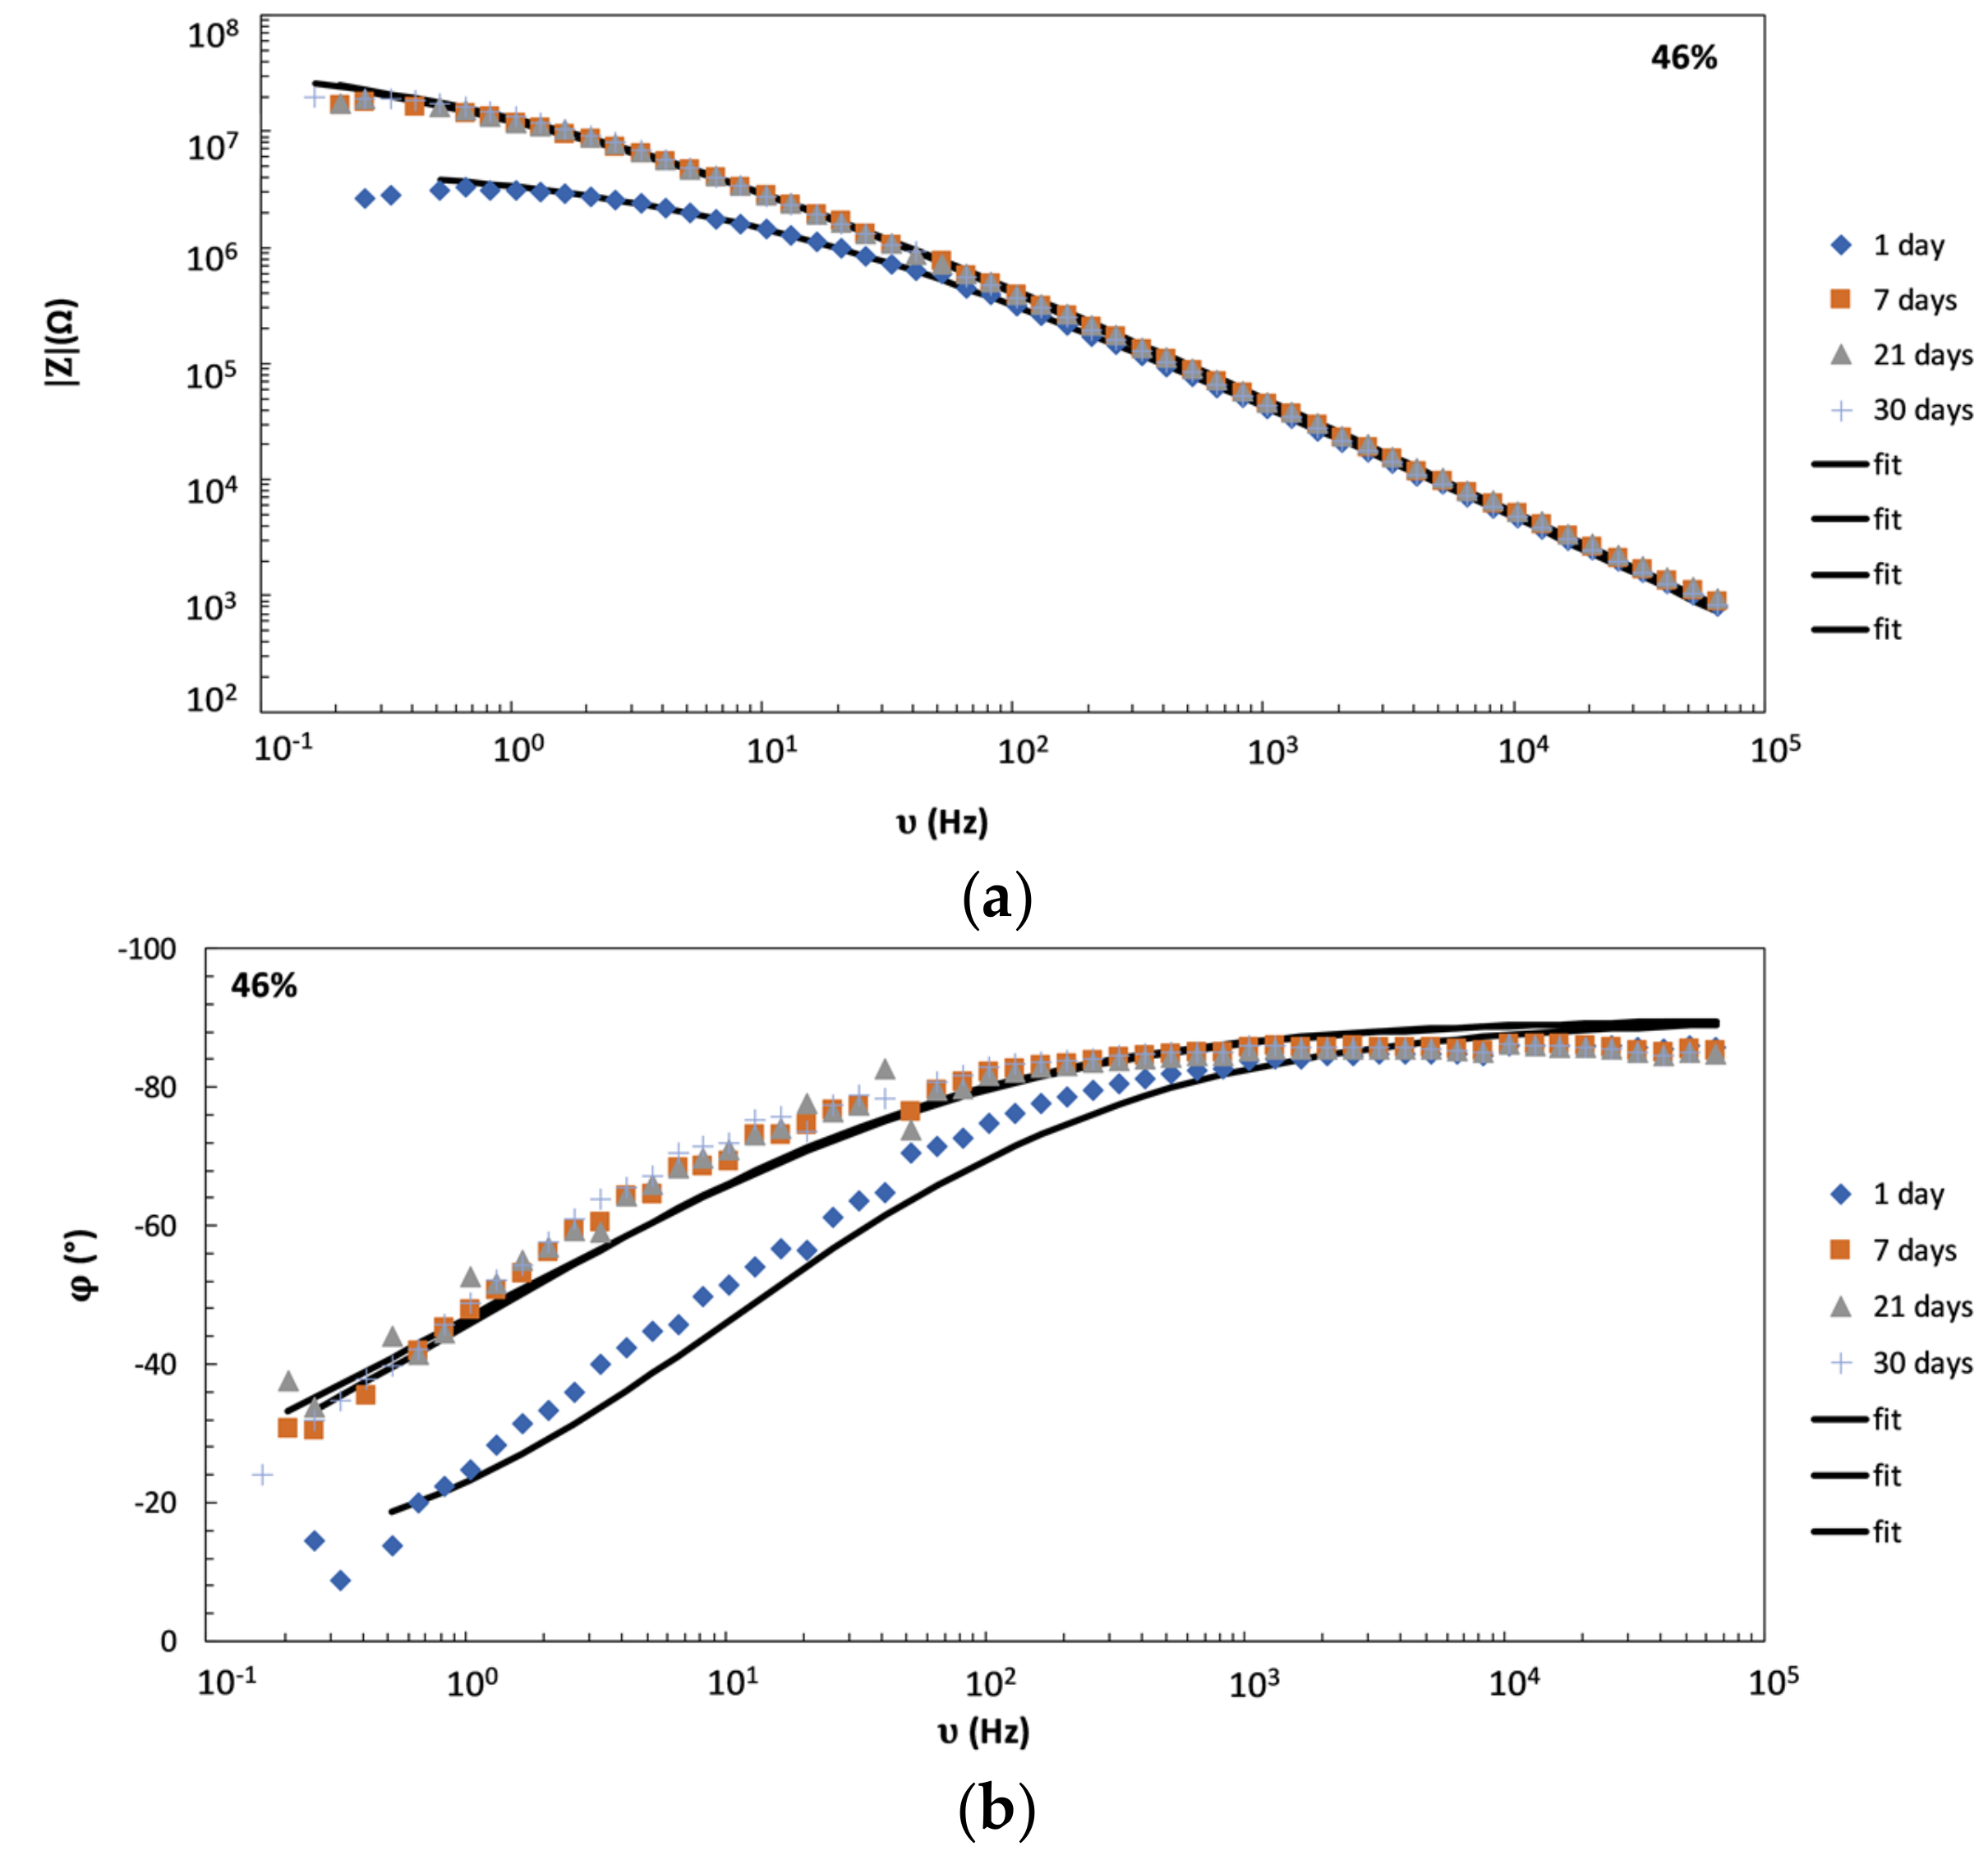
  • We showed that the magnitude (modulus) of impedance at frequencies below circa 100 Hz changes dramatically (for several orders of magnitude) when the pigment volume concentration (PVC) is increased from slightly below to slightly above its critical value (CPVC). The reason is the transformation of coating from a continuous to a discontinuous layer that greatly enhances the penetration of electrolyte to the metallic substrate. Thus, EIS seems a very appropriate technique for accurate detection of practical CPVC value of a given coating, a crucial parameter related to coating protection efficiency.
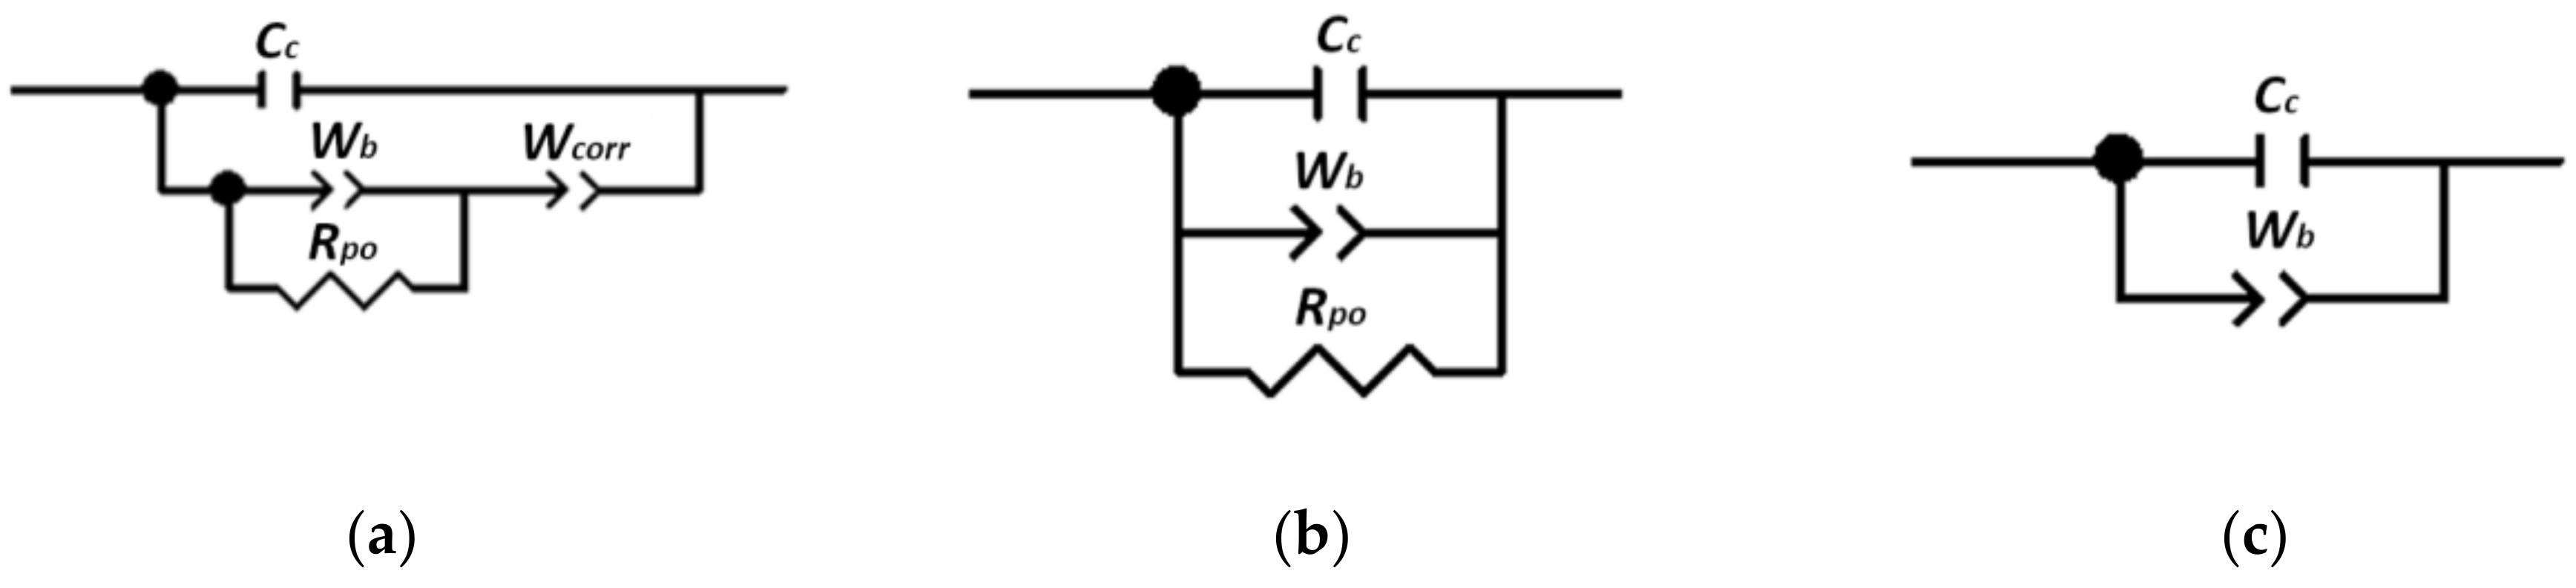
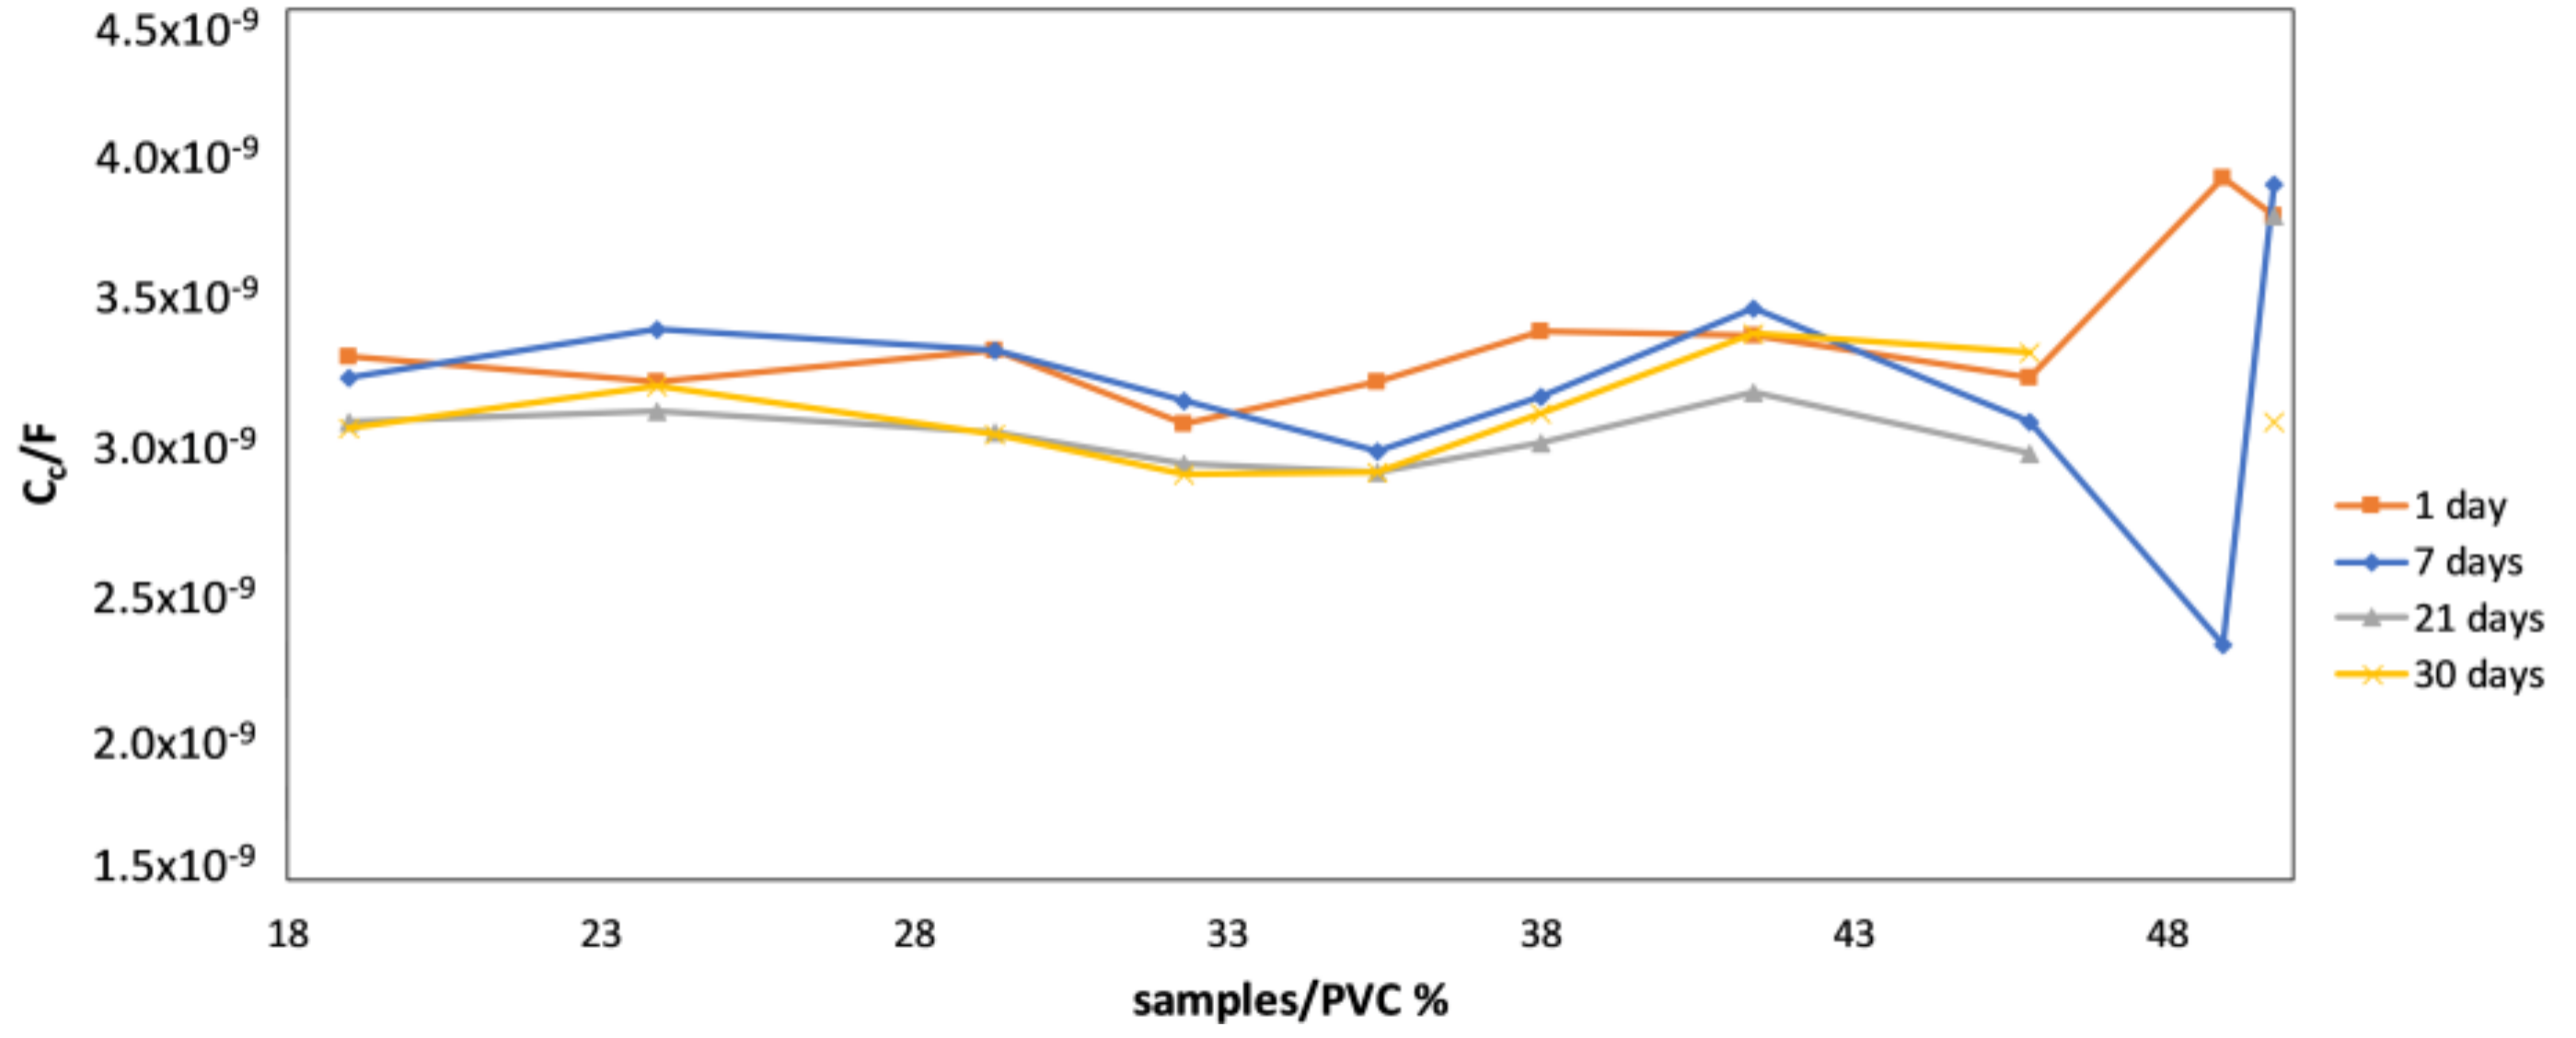
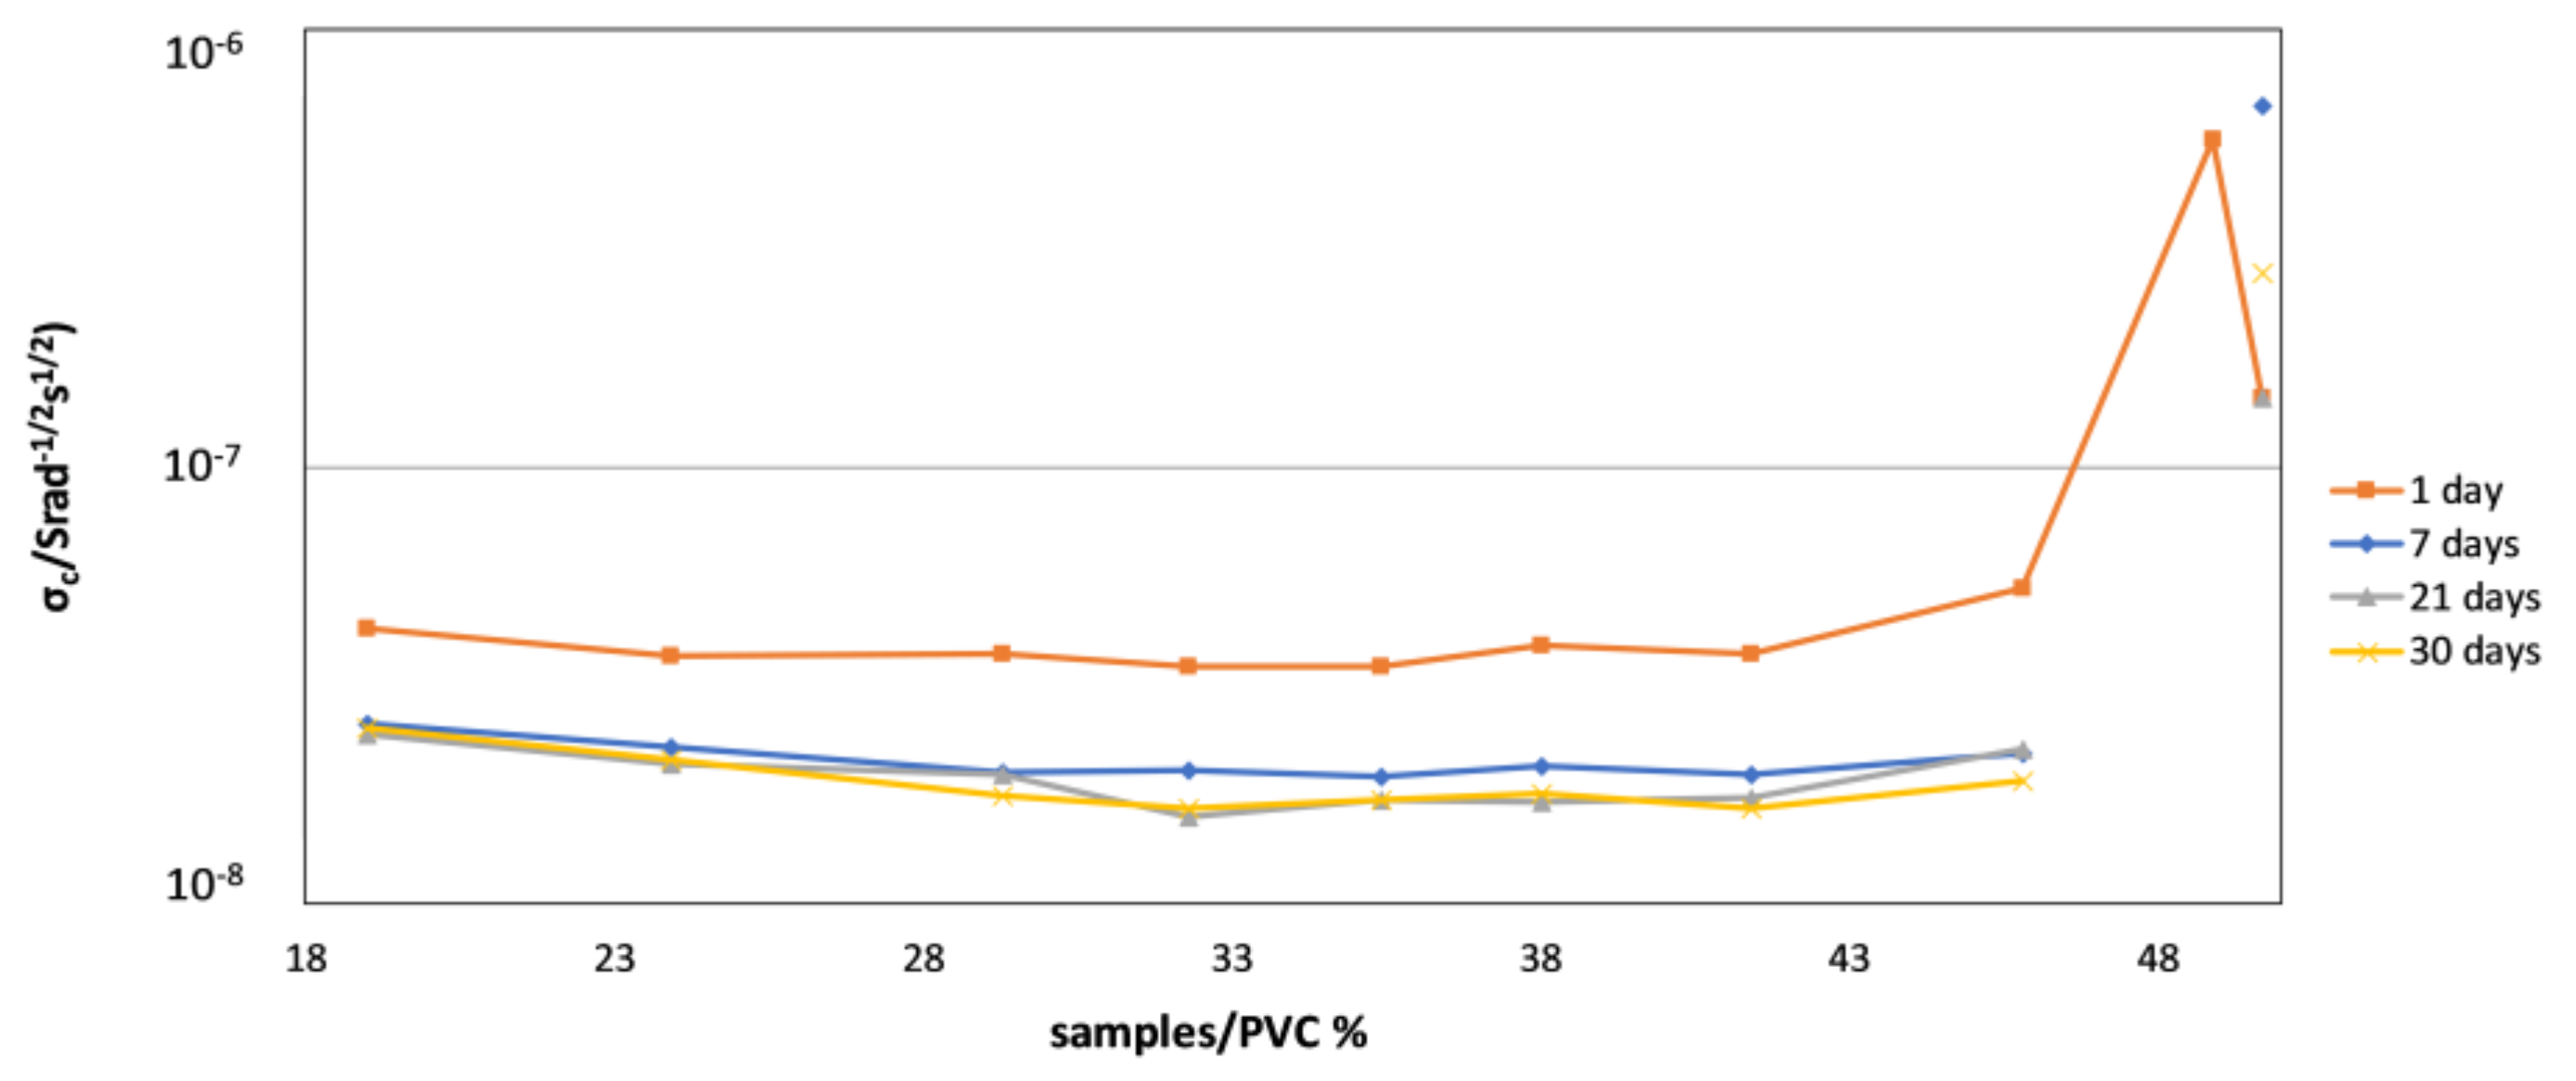
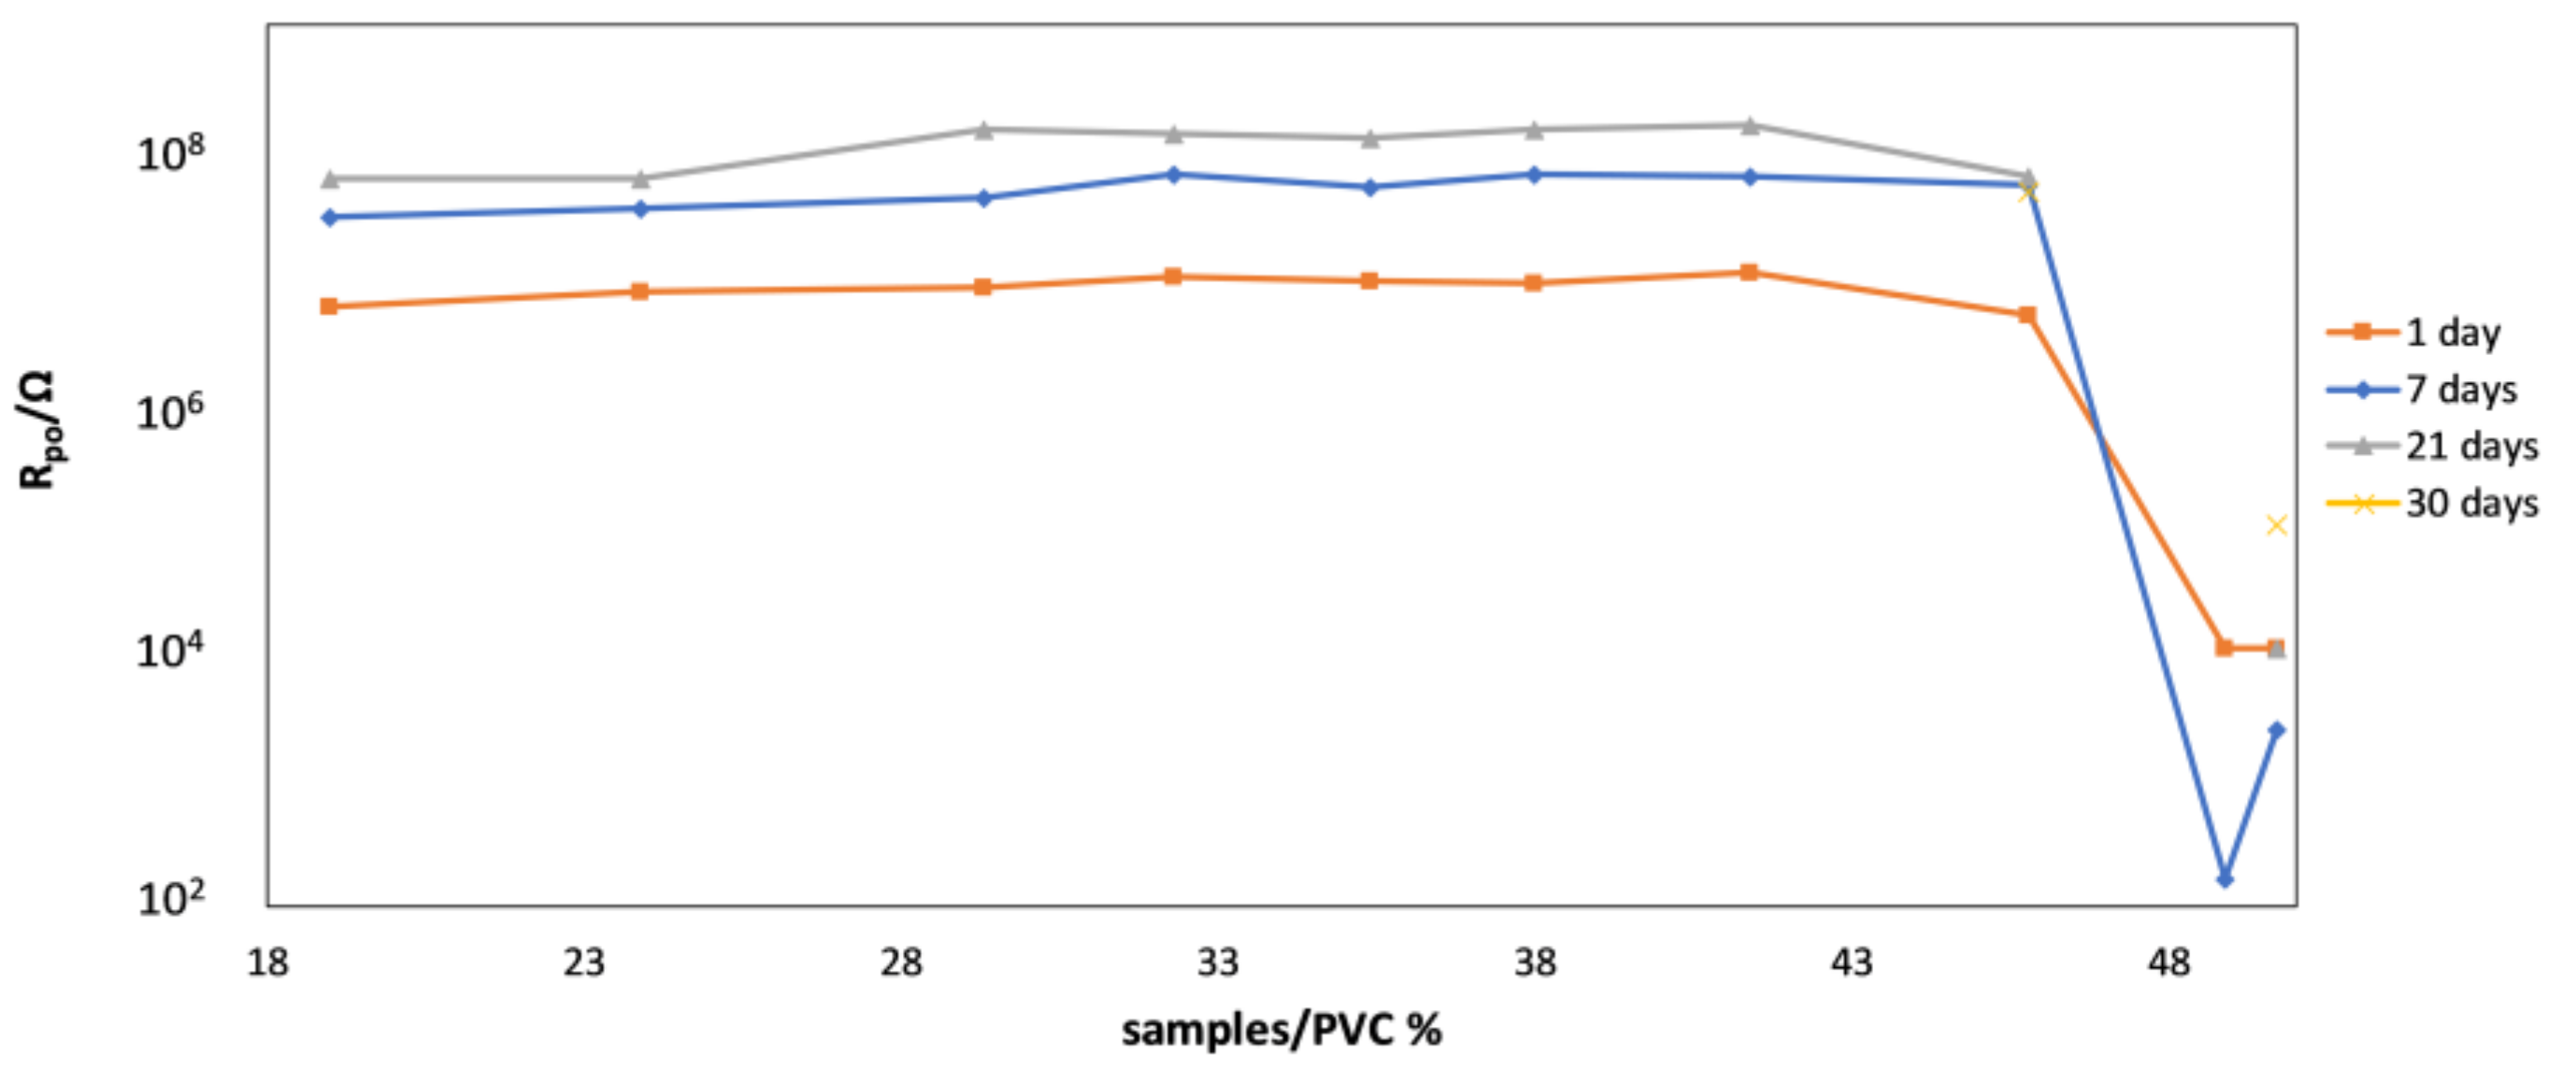
  • Due to reasons similar to those stated above, impedance spectroscopy was also found to be a suitable technique for monitoring the coating film formation in samples with different PVC values. It was shown that—throughout the entire time of film formation—the most indicative impedance parameters of conventional corrosion equivalent circuits (pore resistance, coating capacity, Warburg coefficient) have distinctly different values below and above CPVC. Additionally, temporal evolution of impedance parameters was shown to be different in coatings with PVC above and below the critical value.
  • Additional insight into the differences in film formation mechanisms of coatings with different PVC values was obtained using dynamic mechanical thermal analysis (DTMA). The effects of PVC on water evaporation and polymer cross-linking process during film formation were discussed in considerable detail. The effect of curing temperature on these processes was elucidated as well.
  • The results indicate that, in order to further increase the coating protection of waterborne epoxy coatings, one needs to find the best compromise between the so-called “barrier effect” and the degree of epoxy-amino cross-linking. Both are decisively affected by the PVC level, however, in different ways. In order to achieve a fine tuning of PVC near the CVPC value, one might want to exploit the very high sensitivity of impedance spectroscopy, as demonstrated in this paper.

Supplementary Materials

The following are available online at https://www.mdpi.com/2079-6412/9/4/254/s1, Figure S1: tait cell for EIS measuring, Figure S2: images of samples surfaces after (a) 0 h, (b) 24 h and (c) 7 days of water condensation chamber exposures, Figure S3: impedance spectra of representative samples WB EP-talc coatings series with different PVC in the Bode diagrams, Figure S4: relative dielectric constant vs. different PVC of the representative samples WB talc coatings, Figure S5: the product of Warburg coefficient with film thickness vs. different PVC of the representative sample WB talc coatings, Figure S6: specific resistance of pores vs. different PVC of the representative sample WB talc coatings, Table S1: coating capacitance of the samples versus annealing time, Table S2: coefficients of the Warburg element of the samples versus annealing time, Table S3: pore resistance of the samples versus annealing time.

Author Contributions

Conceptualization, N.K.V., M.S. and M.G.; Methodology, N.K.V. and P.B.; Formal Analysis, N.K.V., P.B.; Investigation, N.K.V. and P.B.; Writing—Original Draft Preparation, N.K.V., M.S.; Writing—Review and Editing, N.K.V., M.S., P.B. and M.G.; Project Administration, P.V.; Funding Acquisition, P.V., M.G.

Funding

This research received no external funding.

Acknowledgments

The author would like to thank Saša Skale for valuable discussions and mag, Tina Razboršek, Jožefa Zabret from Analytical Department in Helios for technical help in thermal analysis.

Conflicts of Interest

The authors declare no conflict of interest.

References

  1. Wicks, Z.W.; Jones, F.N.; Pappas, S.P. Organic Coatings: Science and Technology, 3rd ed.; John Wiley & Sons, Inc.: New York, NY, USA, 2007; pp. 466–468. [Google Scholar]
  2. Perera, D.Y. Effect of pigmentation on organic coating characteristics. Prog. Org. Coat. 2004, 50, 247–262. [Google Scholar] [CrossRef]
  3. Lobnig, R.E.; Villalba, W.; Goll, K.; Vogelsang, J.; Winkels, I.; Schmidt, R.; Zanger, P.; Soetemann, J. Development of a new experimental method to determine critical pigment–volume–concentrations using impedance spectroscopy. Prog. Org. Coat. 2006, 55, 363–374. [Google Scholar] [CrossRef]
  4. Lobnig, R.E.; Bonitz, V.; Goll, K.; Sinlge, M.; Villalba, W.; Vogelsang, J.; Winkels, I.; Schmidt, R.; Zanger, P. Development of a new experimental method to determine critical pigment-volume-concentrations using impedance spectroscopy: Part II: Solvent based coatings with components typical for commercial organic anticorrosion coatings or with nanoparticles. Prog. Org. Coat. 2007, 60, 1–10. [Google Scholar] [CrossRef]
  5. Lobnig, R.E.; Bonitz, V.; Goll, K.; Villalba, W.; Schmidt, R.; Zanger, P.; Vogelsang, J.; Winkels, I. Development of a new experimental method to determine critical pigment-volume-concentrations using impedance spectroscopy: Part III: Water-based coatings with components typical for commercial organic anticorrosion coatings. Prog. Org. Coat. 2007, 60, 77–89. [Google Scholar] [CrossRef]
  6. Le Pen, C.; Lacabanne, C.; Pebere, N. Structure of waterborne coatings by electrochemical impedance spectroscopy and a thermostimulated current method: influence of fillers. Prog. Org. Coat. 2000, 39, 167–175. [Google Scholar] [CrossRef]
  7. Rodriguez, M.T.; Gracenea, J.J.; Saura, J.J.; Suay, J.J. The influence of the critical pigment volume concentration (CPVC) on the properties of an epoxy coating: Part II. Anticorrosion and economic properties. Prog. Org. Coat. 2004, 50, 68–74. [Google Scholar] [CrossRef]
  8. Del Grosso Destreri, M.; Vogelsang, J.; Fedrizzi, L.; Deflorian, F. Water up-take evaluation of new waterborne and high solid epoxy coatings. Part II: Electrochemical impedance spectroscopy. Prog. Org. Coat. 1999, 37, 69–81. [Google Scholar] [CrossRef]
  9. Denton, D.D.; Day, D.R.; Priore, D.F.; Senuria, S.D. Moisture diffusion in poltimide films in integrated circuits. J. Electron. Mater. 1985, 14, 119–136. [Google Scholar] [CrossRef]
  10. Downey, S.J.; Devereux, O.F. The Use of impedance spectroscopy in evaluating moisture-caused failure of adhesives and paints. Corrosion 1989, 45, 675–684. [Google Scholar] [CrossRef]
  11. Pebere, N.; Picaud, T.; Duprat, M.; Dabosi, F. Evaluation of corrosion performance of coated steel by the impedance technique. Corros. Sci. 1989, 29, 1073–1086. [Google Scholar] [CrossRef]
  12. Bellucci, F.; Nicodemo, L. Water transport in organic coatings. Corrosion 1993, 49, 235–247. [Google Scholar] [CrossRef]
  13. Wind, M.M.; Lenderink, H.J.W. A capacitance study of pseudo-fickian diffusion in glassy polymer coatings. Prog. Org. Coat. 1996, 28, 239–250. [Google Scholar] [CrossRef]
  14. Perez, C.; Collazo, A.; Izquierdo, M.; Merino, P.; Novoa, X.R. Characterisation of the barrier properties of different paint systems: Part II. Non-ideal diffusion and water uptake kinetics. Prog. Org. Coat. 1999, 37, 169–177. [Google Scholar] [CrossRef]
  15. Shiller, C.A.; Strunz, W. The evaluation of experimental dielectric data of barrier coatings by means of different models. Electrochim. Acta 2001, 46, 3619–3625. [Google Scholar] [CrossRef]
  16. Skerry, B.S.; Chen, C.T.; Ray, C.J. Pigment volume concentration and its effect on the corrosion resistance properties of organic paint films. J. Coat. Technol. 1992, 64, 77–86. [Google Scholar]
  17. Gowri, S.; Balakrishnank, K. The effect of the PVC/CPVC ratio on the corrosion resistance properties of organic coatings. Prog. Org. Coat. 1994, 23, 363–377. [Google Scholar] [CrossRef]
  18. Gervasi, C.A.; DiSarli, A.R.; Cavalcanti, E.; Ferraz, O.; Bucharsky, E.C.; Real, S.G.; Vilche, J.R. The corrosion protection of steel in sea water using zinc-rich alkyd paints. An assessment of the pigment-content effect by EIS. Corros. Sci. 1994, 36, 1963–1972. [Google Scholar] [CrossRef]
  19. Shao, J.; Wan, P.; Liu, X.; Lu, H.; Zhang, S. The effect of Pigment volume concentration on corrosion protection of new sacrificial coating. Mater. Corros. 1995, 46, 33–38. [Google Scholar] [CrossRef]
  20. Barbbucci, A.; Delucchia, M.; Goretta, L.; Cerisola, G. Electrochemical and physico-chemical characterization of fluorinated organic coatings for steel and concrete protection: Influence of the pigment volume concentration. Prog. Org. Coat. 1998, 33, 139–148. [Google Scholar] [CrossRef]
  21. Hernandez, L.S.; Garcia, G.; Lopez, C.; delAmo, B.; Romagnoli, R. Evaluation, using EIS, of anticorrosive paints pigmented with zinc phosphate. Surf. Coat. Int. 1998, 81, 19–25. [Google Scholar]
  22. Liu, B.; Li, Y.; Lin, H.; Cao, C. Effect of PVC on the diffusion behaviour of water through alkyd coatings. Corros. Sci. 2002, 44, 2657–2664. [Google Scholar] [CrossRef]
  23. Berce, P.; Skale, S.; Slemnik, M. Electrochemical impedance spectroscopy study of waterborne coatings film formation. Prog. Org. Coat. 2015, 82, 1–6. [Google Scholar] [CrossRef]
  24. Bianchini, G.; Fream, A.; McOwan, S.P.; Roystron, I. Waterborne and Solvent Based Surface Coatings and Their Applications, 2nd ed.; John Wiley & Sons Ltd: London, US, 1996. [Google Scholar]
  25. Pruskowski, S.J. Coating Fundamentals: Waterborne Coating Technology; Federation of Societies for Coatings Technology: Washington, DC, USA, 2004. [Google Scholar]
  26. ISO 8501-1, Preparation of Steel Substrates before Application of Paints and Related Products—Visual Assessment of Surface Cleanliness—Part 1: Rust Grades and Preparation Grades of Uncoated Steel Substrates and of Steel Substrates after Overall Removal of Previous Coatings; ISO: Geneva, Switzerland, 2007.
  27. ISO 2178, Non-Magnetic Coatings on Magnetic Substrates–Measurement of Coating Thickness by the Magnetic Method; ISO: Geneva, Switzerland, 2016.
  28. Skale, S.; Doleček, V.; Slemnik, M. Substitution of the constant phase element by Warburg impedance for protective coatings. Corros. Sci. 2007, 49, 1045–1055. [Google Scholar] [CrossRef]
  29. Skale, S.; Doleček, V.; Slemnik, M. Electrochemical impedance studies of corrosion protected surfaces covered by epoxy polyamide coating systems. Pro. Org. Coat. 2008, 62, 387–392. [Google Scholar] [CrossRef]
  30. Murray, J.N. Electrochemical test methods for evaluating organic coatings on metals: an update. Part III: Multiple test parameter measurements. Prog. Org. Coat. 1997, 31, 375–391. [Google Scholar] [CrossRef]
  31. Kendig, M.; Scully, J.R. Basic aspects of electrochemical impedance application for the life prediction of organic coatings on metals. Corrosion 1990, 46, 22–29. [Google Scholar] [CrossRef]
  32. Castela, A.S.; Simões, A.M. An impedance model for the estimation of water absorption in organic coatings. Part I: A linear dielectric mixture equation. Corros. Sci. 2003, 45, 1631–1646. [Google Scholar] [CrossRef]
Figure 1. Equivalent circuits used for analysis of EIS data (models a, b and c). Cc, Wb, Rpo and Wcorr, represent the coating capacitance, the Warburg diffusion through the coating, the resistance of conductive paths through the electrolyte-filled coating pores and the Warburg coefficient for a diffusion-controlled corrosion process (see Equations (1)–(4)), respectively.
Coatings 09 00254 g001
Figure 2. (a) Modulus and (b) phase angle (Bode diagrams) of the waterborne (WB) talc coatings with various PVC values after 24 h of curing time at room temperature.
Coatings 09 00254 g002
Figure 3. (a) Modulus and (b) phase angle (Bode diagrams) of the WB talc coatings with various PVCs at 7 days exposure in water condensation chamber.
Coatings 09 00254 g003
Figure 4. Images of sample surfaces with different PVC values ((a) 41%, (b) 46%, (c) 49%, (d) 50%) after 7 days of water condensation chamber exposures. No magnification was used, the dimensions are the same as in actual objects.
Coatings 09 00254 g004
Figure 5. Impedance spectra of representative samples WB-talc coatings series with different PVC in the Bode diagrams: (a) Modulus and (b) phase angle vs. log (frequency).
Coatings 09 00254 g005
Figure 6. Coating capacitance vs. different PVC values (x-axis, see Table 1) and at different times of film formation (see legend).
Coatings 09 00254 g006
Figure 7. Warburg coeficient, σc (see Equation (2)) as a function of PVC value and time of film formation for representative samples WB talc coatings serie.
Coatings 09 00254 g007
Figure 8. Pore resistance vs. different PVC of the representative samples WB talc coatings serie. Note that among the samples corresponding to 30 days, only two samples exhibited pore resistivity (see yellow symbols).
Coatings 09 00254 g008
Figure 9. Glass transition temperature (Tg) measured by dynamic mechanical thermal analysis (DMTA) of the representative samples WB talc coatings series (a) and versus time (b).
Coatings 09 00254 g009
Figure 10. Glass transition temperature (Tg) measured by DMTA of the representative samples 32% of PVC (a) and 29% of PVC (b) WB talc coatings. The left columns represent the present samples treated at room temperature. The middle columns represent the samples treated 24 h at 60 °C. The right columns represent the samples treated 24 h at 80 °C.
Coatings 09 00254 g010
Table 1. Labeling of samples with different pigment volume concentration (PVC) values (in % vs. theoretical value) and the corresponding reduced PVC values (Λ). The PVC-critical pigment volume concentration (CPVC) transition (Λ = 1) is theoretically expected at a PVC of 44.75%. The last column indicates detection of the ratio PVC:CPVC (often denoted as Λ) using electrochemical impedance spectroscopy (EIS) (for details see Results and Discussion Section).
Sample PVC [%]
(Theoretical)
Pigment:Binder
(p/b) Ratio
Λ (PVC/CPVC)
(Theoretical)
Λ (PVC/CPVC)
(EIS Detection)
502.651.12
492.571.09
462.261.03≥1
411.880.92<1
381.620.85
351.450.78
321.260.72
291.090.65
240.820.54
190.610.42
Table 2. Dry film thickness and pigment-binder ratio of epoxy polyamine protective system samples.
Sample
PVC [%]
p/b RatioDry Film Thickness on Steel Substrates (µm) after 1 Day of Coating ApplicationStandard Deviation of Dry Film Thickness (µm)
502.6563.7±8.8
492.5772.3±5.2
462.2655.8±1.9
411.8869.1±2.2
381.6273.7±1.2
351.4575.6±1.5
321.2672.2±1.7
291.0969.5±1.1
240.8268.7±0.8
190.6170.2±1.0

