Article

Condensation Test and Simulation of Superhydrophobic Coatings

Electric Power Research Institute of Yunnan Power Grid Co., Ltd., Kunming 650000, China
*
Author to whom correspondence should be addressed.
Coatings 2019, 9(11), 743; https://doi.org/10.3390/coatings9110743
Submission received: 17 August 2019 / Revised: 28 September 2019 / Accepted: 3 October 2019 / Published: 8 November 2019

Abstract

:
Pollution flashover accidents pose a great threat to the safe and stable operation of a power system, and superhydrophobic materials have broad application prospects in the field of pollution flashover prevention of the external insulation of transmission and transformation equipment. In this paper, PVDF@PMMA/SiO2 superhydrophobic coatings were prepared using a spraying method. Superhydrophobicity is defined as an angle larger than 150° and a small roll-off angle smaller than 10°. The static contact angle of the coatings reached 155°, which meant they had excellent superhydrophobic properties. The distribution characteristics of water droplets on superhydrophobic surface were analyzed through a live condensation test, and simulation analysis was carried out. It was found that the distance between water droplets on the superhydrophobic surface was larger, which increased the distance of the arc development; the static contact angle was larger; and the electric field strength at the three-phase junction was lower. Both of them worked together to enhance the pollution flashover voltage of the coating.

1. Introduction

In recent years, with the continuous improvement of the voltage level of power systems, the insulator, which bears the function of mechanical support and insulation, has become the weak link in transmission line operation [1,2]. Under adverse weather conditions—such as fog, dew, drizzle, and ice and snow melting—solid, liquid, or gas contaminated particles are easily deposited on the surface of insulators, which greatly reduces the electrical strength of insulators, thus causing pollution flashover outage accidents [3,4,5]. Pollution flashover accidents of transmission lines are determined by the surface contamination of insulators caused by air pollution and the ability of the insulators to resist this air pollution under humid weather conditions.
Pollution flashover on an insulator surface mainly undergoes four stages: contamination, humidity, dry band formation, and local arc generation and development to full flashover. Pollution flashover on an insulator surface must meet three necessary conditions: voltage effect, surface contamination, and surface wetting. Current studies show that superhydrophobic coatings can effectively delay and remove surface condensation [6,7,8,9,10]. Delaying surface condensation makes it possible to reduce the wettability of insulators, while removing the condensation process has the ability to take the contamination away from the surface of insulators. Therefore, superhydrophobic coatings have great potential in improving the lightning voltage level of insulators.
In a high humidity environment, when the surface temperature of the object is lower than the dew point temperature of the surrounding air, the surface of the object is prone to condensation [11,12,13]. Compared with the surface of ordinary materials, a superhydrophobic surface has remarkable anti-condensation effect. The superhydrophobic surface condensation can be further reduced using mechanical vibration, pulse current, electrode, and droplet evaporation bounce methods [13,14,15].
In this paper, the reason why a superhydrophobic coating can increase pollution flashover voltage is studied using a condensation test on the surface of the superhydrophobic coating. The low temperature and high humidity condensation platform was used to form condensation rapidly on the surface of a resin superhydrophobic coating. The surface condensation of superhydrophobic coatings under pressure of 1.2 kV for 30 min was observed. By extracting the characteristic parameters, such as the diameter and number of water droplets, the corresponding uniform distribution model of water droplets was established, and the electric field distribution on the superhydrophobic surface was analyzed and compared with an RTV (room temperature vulcanized silicone rubber) coating.

2. Experiment

2.1. Materials

Methyl methacrylate (PMMA) was purchased from Shanghai Huizheng Plastic technology Co., Ltd., Nantong, Jiangsu, China; polyvinylidene difluoride (PVDF) was purchased from Shanghai Huizheng Plastic technology Co., Ltd., Nantong, Jiangsu, China; tetraethyl orthosilicate (TEOS) was purchased from Shanghai Jiachen chemical Co., Ltd., Shanghai, China; dibutyldilaurate (DBTD) was purchased from Chongqing Zhiyuan Chemical Co., Ltd., Jiangbei, Chongqing, China; polydimethylsiloxane (PDMS) was purchased from Chongqing Zhiyuan Chemical Co., Ltd.; sodium peroxydisulfate was purchased from Jingzhou Jianghan Fine Chemical Co., Ltd., Jingzhou, Liaoning, China; acetone was purchased from Chongqing Zhiyuan Chemical Co., Ltd.; deionized water was purchased from Chongqing Xinyuan Chemical Co., Ltd., Yongchuan, Chongqing, China; and distilled water was purchased from Chongqing Zhiyuan Chemical Co., Ltd.

2.2. Preparation of the Superhydrophobic Surface

In this paper, PMMA particles (10–50 μm) and nanosilica particles (15–50 nm) were used to construct the micro-nano rough structure using a spraying method with PVDF as the matrix. The nano-SiO2 was prepared using a hydrothermal method [16]. Then, 0.5 g of nano-SiO2, 0.5 g of polydimethylsiloxane, 0.05 g of dibutyltin dilaurate, and 50 mL of heptane were placed in a three-necked flask. The nanocomposite solution was allowed to stand for 24 h or more to cause a graft reaction of the polydimethylsiloxane with the surface of the nanosilica, thereby obtaining hydrophobic nano-SiO2 particles having a low surface energy. The PVDF was used as a binder, acetone was used as a solvent, and the PMMA microparticles and hydrophobic nano-SiO2 prepared above were used as a filler. The binder, the filler, and the solvent were mixed in a high-speed mixer (mass ratio PMMA:SiO2:PVDF:acetone = 1:1:8:10) at a certain ratio and thoroughly stirred, and the stirring temperature was maintained at 70 °C. Finally, this composite solution was sprayed onto a piece of glass and cured in a 60 °C oven for 1 h, and a superhydrophobic coating was obtained.

3. Result and Discussion

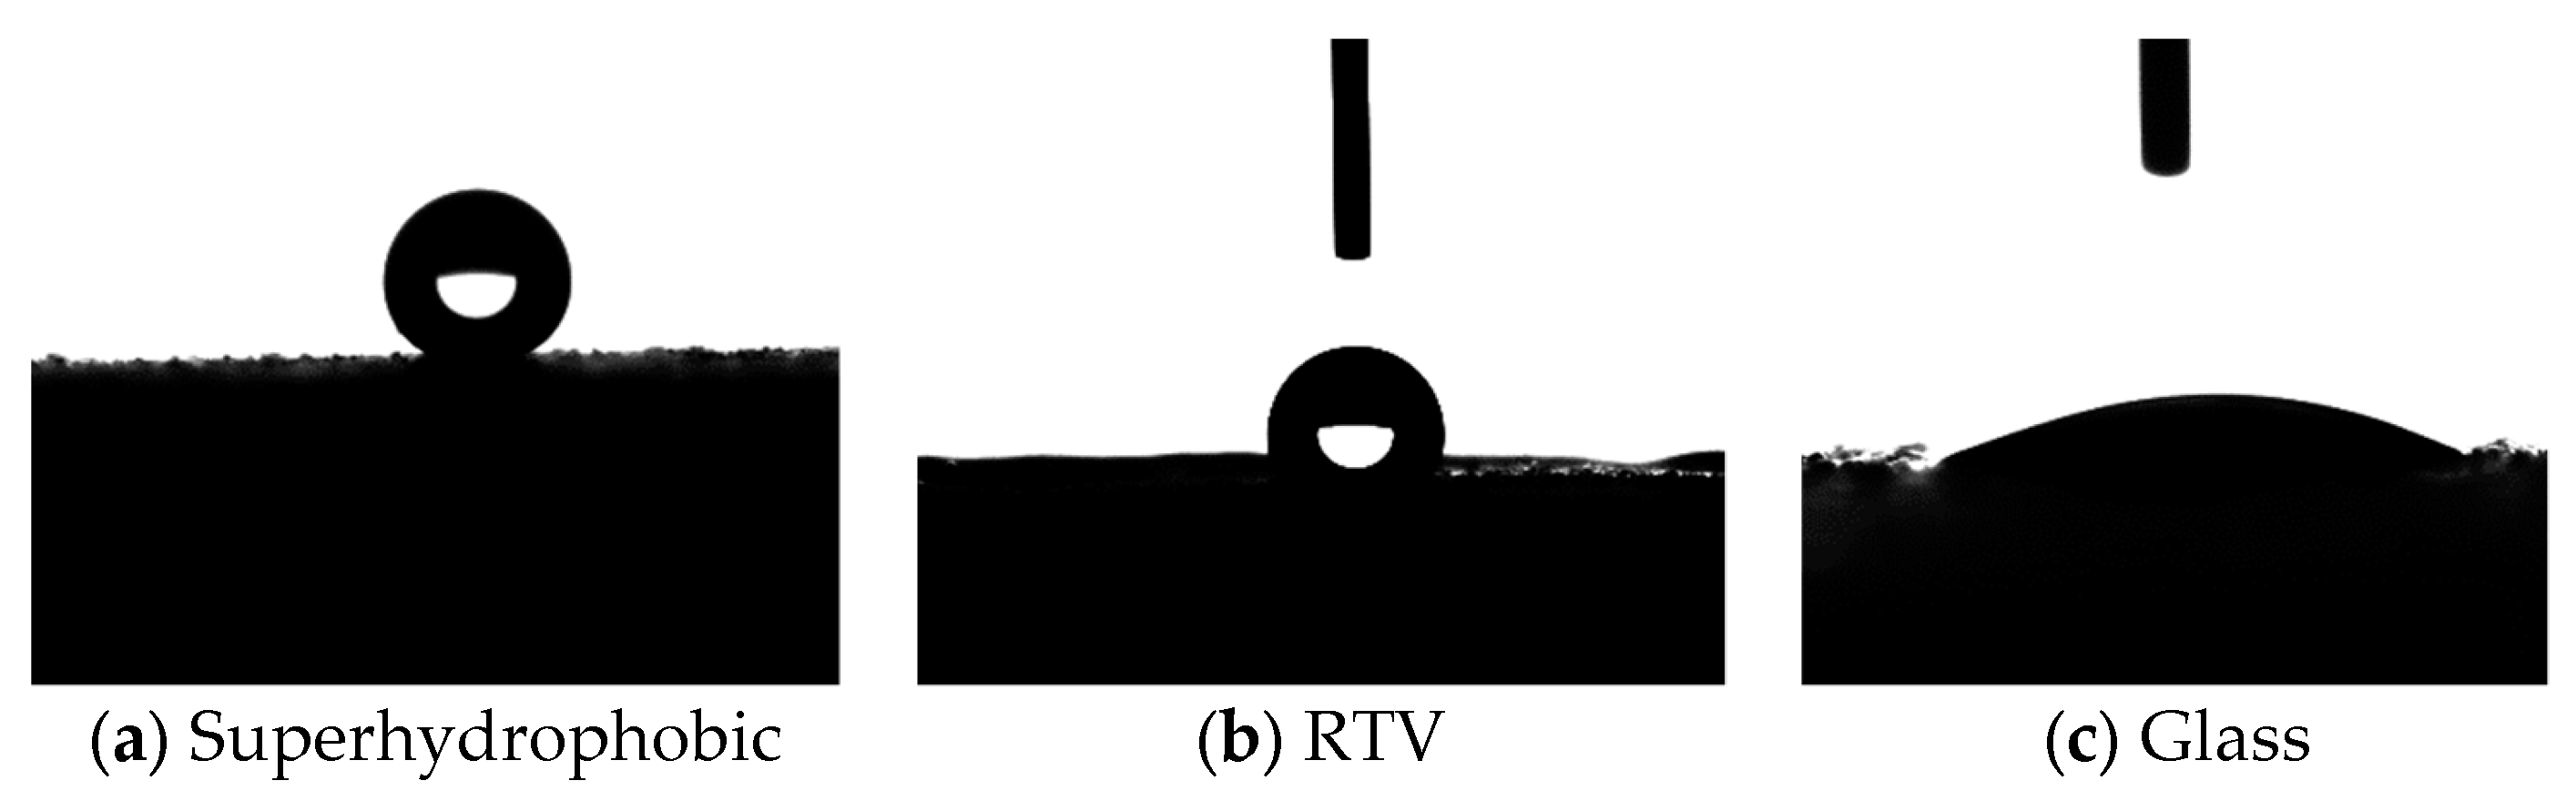
3.1. Wettability and Dielectric Properties

The hydrophobicity of the superhydrophobic coatings was tested using a contact angle measuring instrument Drop Meter A-100p (Dongguan, China). The droplet volumes were 5 and 10 μL [17,18,19,20], and the average hydrophobic angle of the coating was measured five times, which were fitted using the Young–Laplace equation. Figure 1 shows the static contact angle of the surface of the polyvinylidene fluoride silica sol superhydrophobic coating. As shown in the figure, the water droplets were spherical on the superhydrophobic surface. According to the contact angle measurement results, the static contact angle on the superhydrophobic surface was 155° ± 2° for 10 μL water droplets, and 156° ± 2° for 5 μL water droplets, which indicates that the prepared polyvinylidene fluoride silica sol hybrid coating exhibited superhydrophobic performance. Meanwhile, the static contact angles on the RTV coating were 113° (10 μL) and 112° (5 μL), and for the glass, the static contact angles were 34° (10 μL) and 32° (5 μL).
Novocontrol broadband dielectric spectroscopy (Montabaur, Germany) was used to measure the dielectric constant and conductivity of superhydrophobic coatings under the action of a power frequency voltage. Novocontrol broadband dielectric spectroscopy can measure the relative dielectric constant, dielectric loss factor, bulk resistance, and complex capacitance. The gold-plated electrode with a diameter of 30 mm was selected for the test. The structure of the sample test system is shown in Figure 2. The average thickness of the superhydrophobic coating was 0.35 mm, which was measured accurately using a vernier caliper with an accuracy of 0.001 mm. The relative dielectric constant and conductivity of the superhydrophobic coatings at a power frequency were 2.8 and 3.3 × 10⁻¹³ S/m, respectively. The experimental results showed that the superhydrophobic coating had an excellent insulation performance and met the insulation requirements for a power equipment.
The microstructure of the superhydrophobic coatings doped with nanosilica were analyzed. Field emission-scanning electron microscopy (JEOL (Beijing) Co., Ltd., Beijing, China) was used. The test results are shown in Figure 2. The image shows that the surface was closely distributed with unregular scattered micron-scale protrusions. The protrusions were connected to each other. Furthermore, the coating had a dual micro-nano composite rough structure.

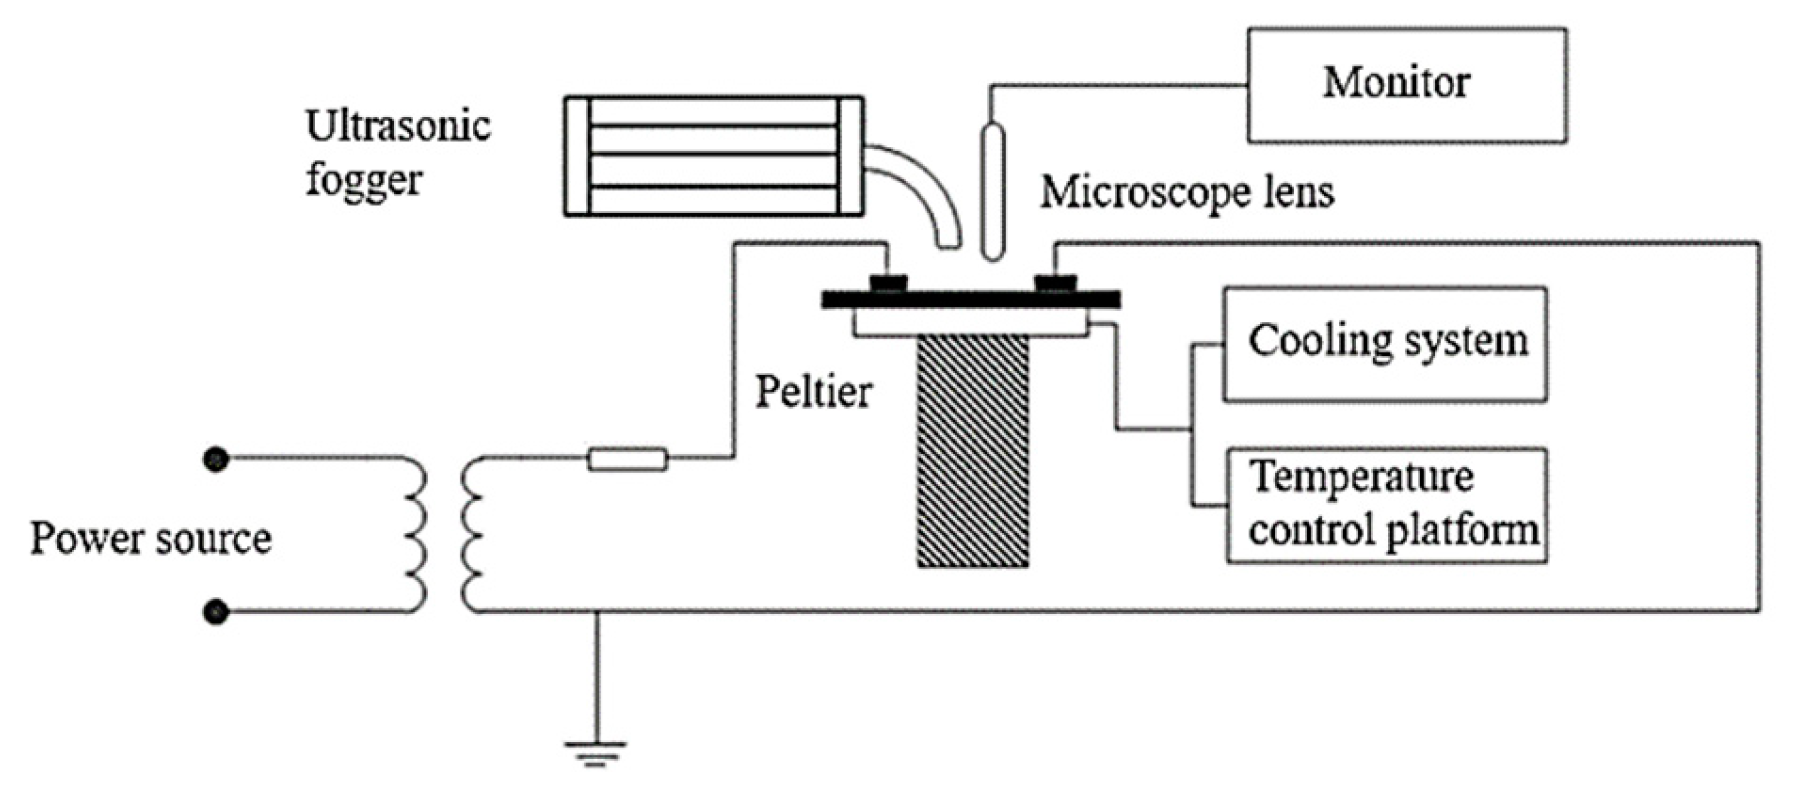
3.2. Charged Condensation

The test device is shown in Figure 3. The test sample was fixed on a Peltier temperature control platform (Tianjin Auto Science Instrument Co., Ltd., Tianjin, China), and the thermal resistance between the platform and the sample was effectively reduced using thermal conductive silicone grease. The temperature of the platform was set to 5 ± 1 °C. Also, the ambient humidity of the test sample was controlled at 85% ± 2% relative humidity using an ultrasonic atomizer (Zhejiang Oulun electric Co. Ltd, Hangzhou, China). The temperature and humidity of the environment were monitored online using using a temperature and humidity monitor (Shandong Renke measurement and control technology Co. Ltd, Jinan, China). The images of the surfaces were photographed using a microscopic lens. The end of the sample are connected to the electrodes, which we applied 1.2 kV AC voltage, and the distance between the electrodes is 20 mm.
During the 30 min of charged condensation, the distribution of condensate droplets on the superhydrophobic surface hardly increased. Because the bonding force between the superhydrophobic coatings and water droplets was small, and combined with the effect of the electric field force, condensate droplets were effectively driven away from the superhydrophobic surface. Only a few droplet-like droplets were sparsely distributed on the superhydrophobic surface.
For RTV samples, the surface condensation was dominated by large droplets. The effect of the electric field force aggravated the merging process of small water droplets, and at the same time, large water droplets could merge small water droplets together via vibration. However, due to the strong bonding force between the RTV coating and water droplets, the large water droplets that had formed on the surface of RTV were still difficult to separate.
For the blank glass sample, a continuous water film bridged the two electrodes after 30 min of electrified condensation. Under a 1.2 kV AC voltage, an obvious partial discharge appeared in the water film. A large number of bubbles were rapidly generated in the water film, and the gas discharge in the bubbles gradually developed to produce a final surface flashover.

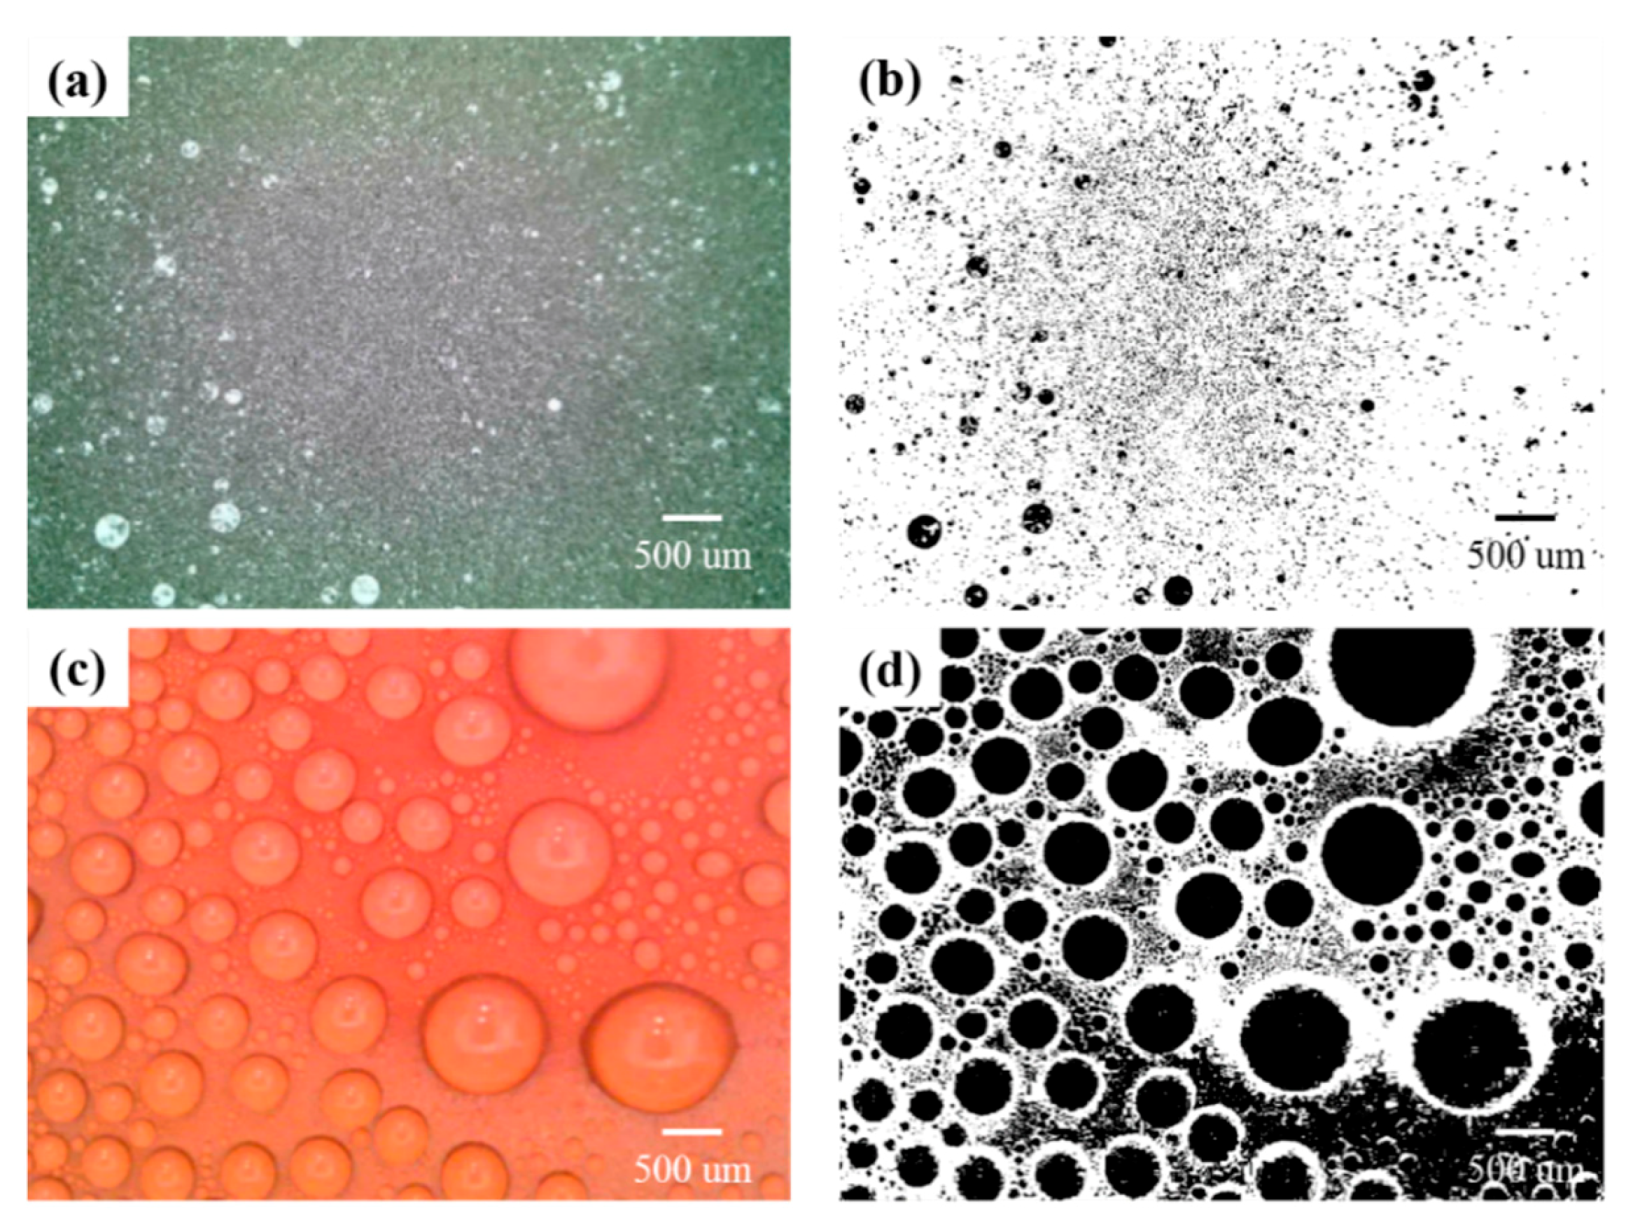
3.3. Distribution Statistics of Surface Water Droplets

The characteristic parameters of the two surfaces in the experiment were extracted, and the secondary factors were excluded, such that a simplified electric field model was established. Two kinds of coating surface images were processed using image analysis software (5.1). Figure 4 is the surface condition of the superhydrophobic sample and the RTV sample when they condensed at a 1.2 kV AC voltage for 30 min. In order to extract more accurate data regarding the distribution of water droplets on the surface, we binarized the original image. After statistical analysis of the images, it can be seen from Table 1 that most of the surface of superhydrophobic coatings were small droplets with diameters of 100–300 μm. Therefore, the influence of these droplets on the electric field must be taken into account when establishing a simplified electric field model. The surface of the RTV coatings had mainly smaller diameter droplets with diameters of 100–500 μm, but although the number of droplets was large, the area they covered was relatively small, which meant they had little effect on the electric field distribution over the whole coating surface. As a result, the small droplets with diameters of 100–500 μm were neglected in the establishment of the simplified electric field model. It was concluded that there were 264 droplets on the surface of the superhydrophobic with a diameter of 100–1000 μm and a total area (S) of 6.184 mm2. The Sa (average area) of water droplets on the surface of the superhydrophobic coatings was 0.0234 mm2, and the superhydrophobic coatings were hydrophobic. Hence, the maximum cross-section of water droplets was reflected in the two-dimensional image. Thus, the water droplets on the surface of superhydrophobic coatings could be calculated. The ra (average radius) was 0.08634 mm, and the total area of all the water droplets on RTV coating surface was 50.178 mm2. Therefore, the average area of water droplets on the RTV coating surface was 0.8651 mm2, and the RTV coating was hydrophobic. Therefore, the maximum cross section of water droplets was reflected in the two-dimensional image, so the average water droplets on RTV coating surface could be calculated. The ra was 0.52476 mm. The equations used were as follows, where the S is the total area, n is the number of water droplets, Sa is the average area of each droplet, and ra is the average radius:
S = n S a
S a = π r a 2
r a = S a π = S n π

3.4. Analysis of Simulation Results

3.4.1. Static Contact Angle

According to the static contact angle measured in Section 3.1, we built the simulation models with COMSOL. The surface electric field distribution of the superhydrophobic, RTV, and blank glass samples is shown in Figure 5. For the superhydrophobic coating, the electric field intensity distribution near the water droplets is shown in Figure 5a. It can be seen that the maximum electric field intensity was located at the junction of the gas, liquid, and solid phases, and the maximum electric field intensity was 3.13 × 10⁵ V/m. The distribution of electric field intensity of the RTV coating is shown in Figure 5b. The highest electric field intensity of the RTV coating also appeared at the junction of the gas, liquid, and solid phases, and its value was 3.79 × 10⁵ V/m. The electric field intensity distribution of the blank glass is shown in Figure 5c. The highest electric field intensity of the blank glass also appeared at the junction of gas, liquid, and solid phases, which was 4.26 × 10⁵ V/m. Therefore, the simulation results show that the static contact angle had a significant effect on the electric field distribution near the water droplets. With the increase of the static contact angle, the electric field intensity at the junction of the gas, liquid, and solid phases decreased significantly, which reduced the risk of partial discharge.

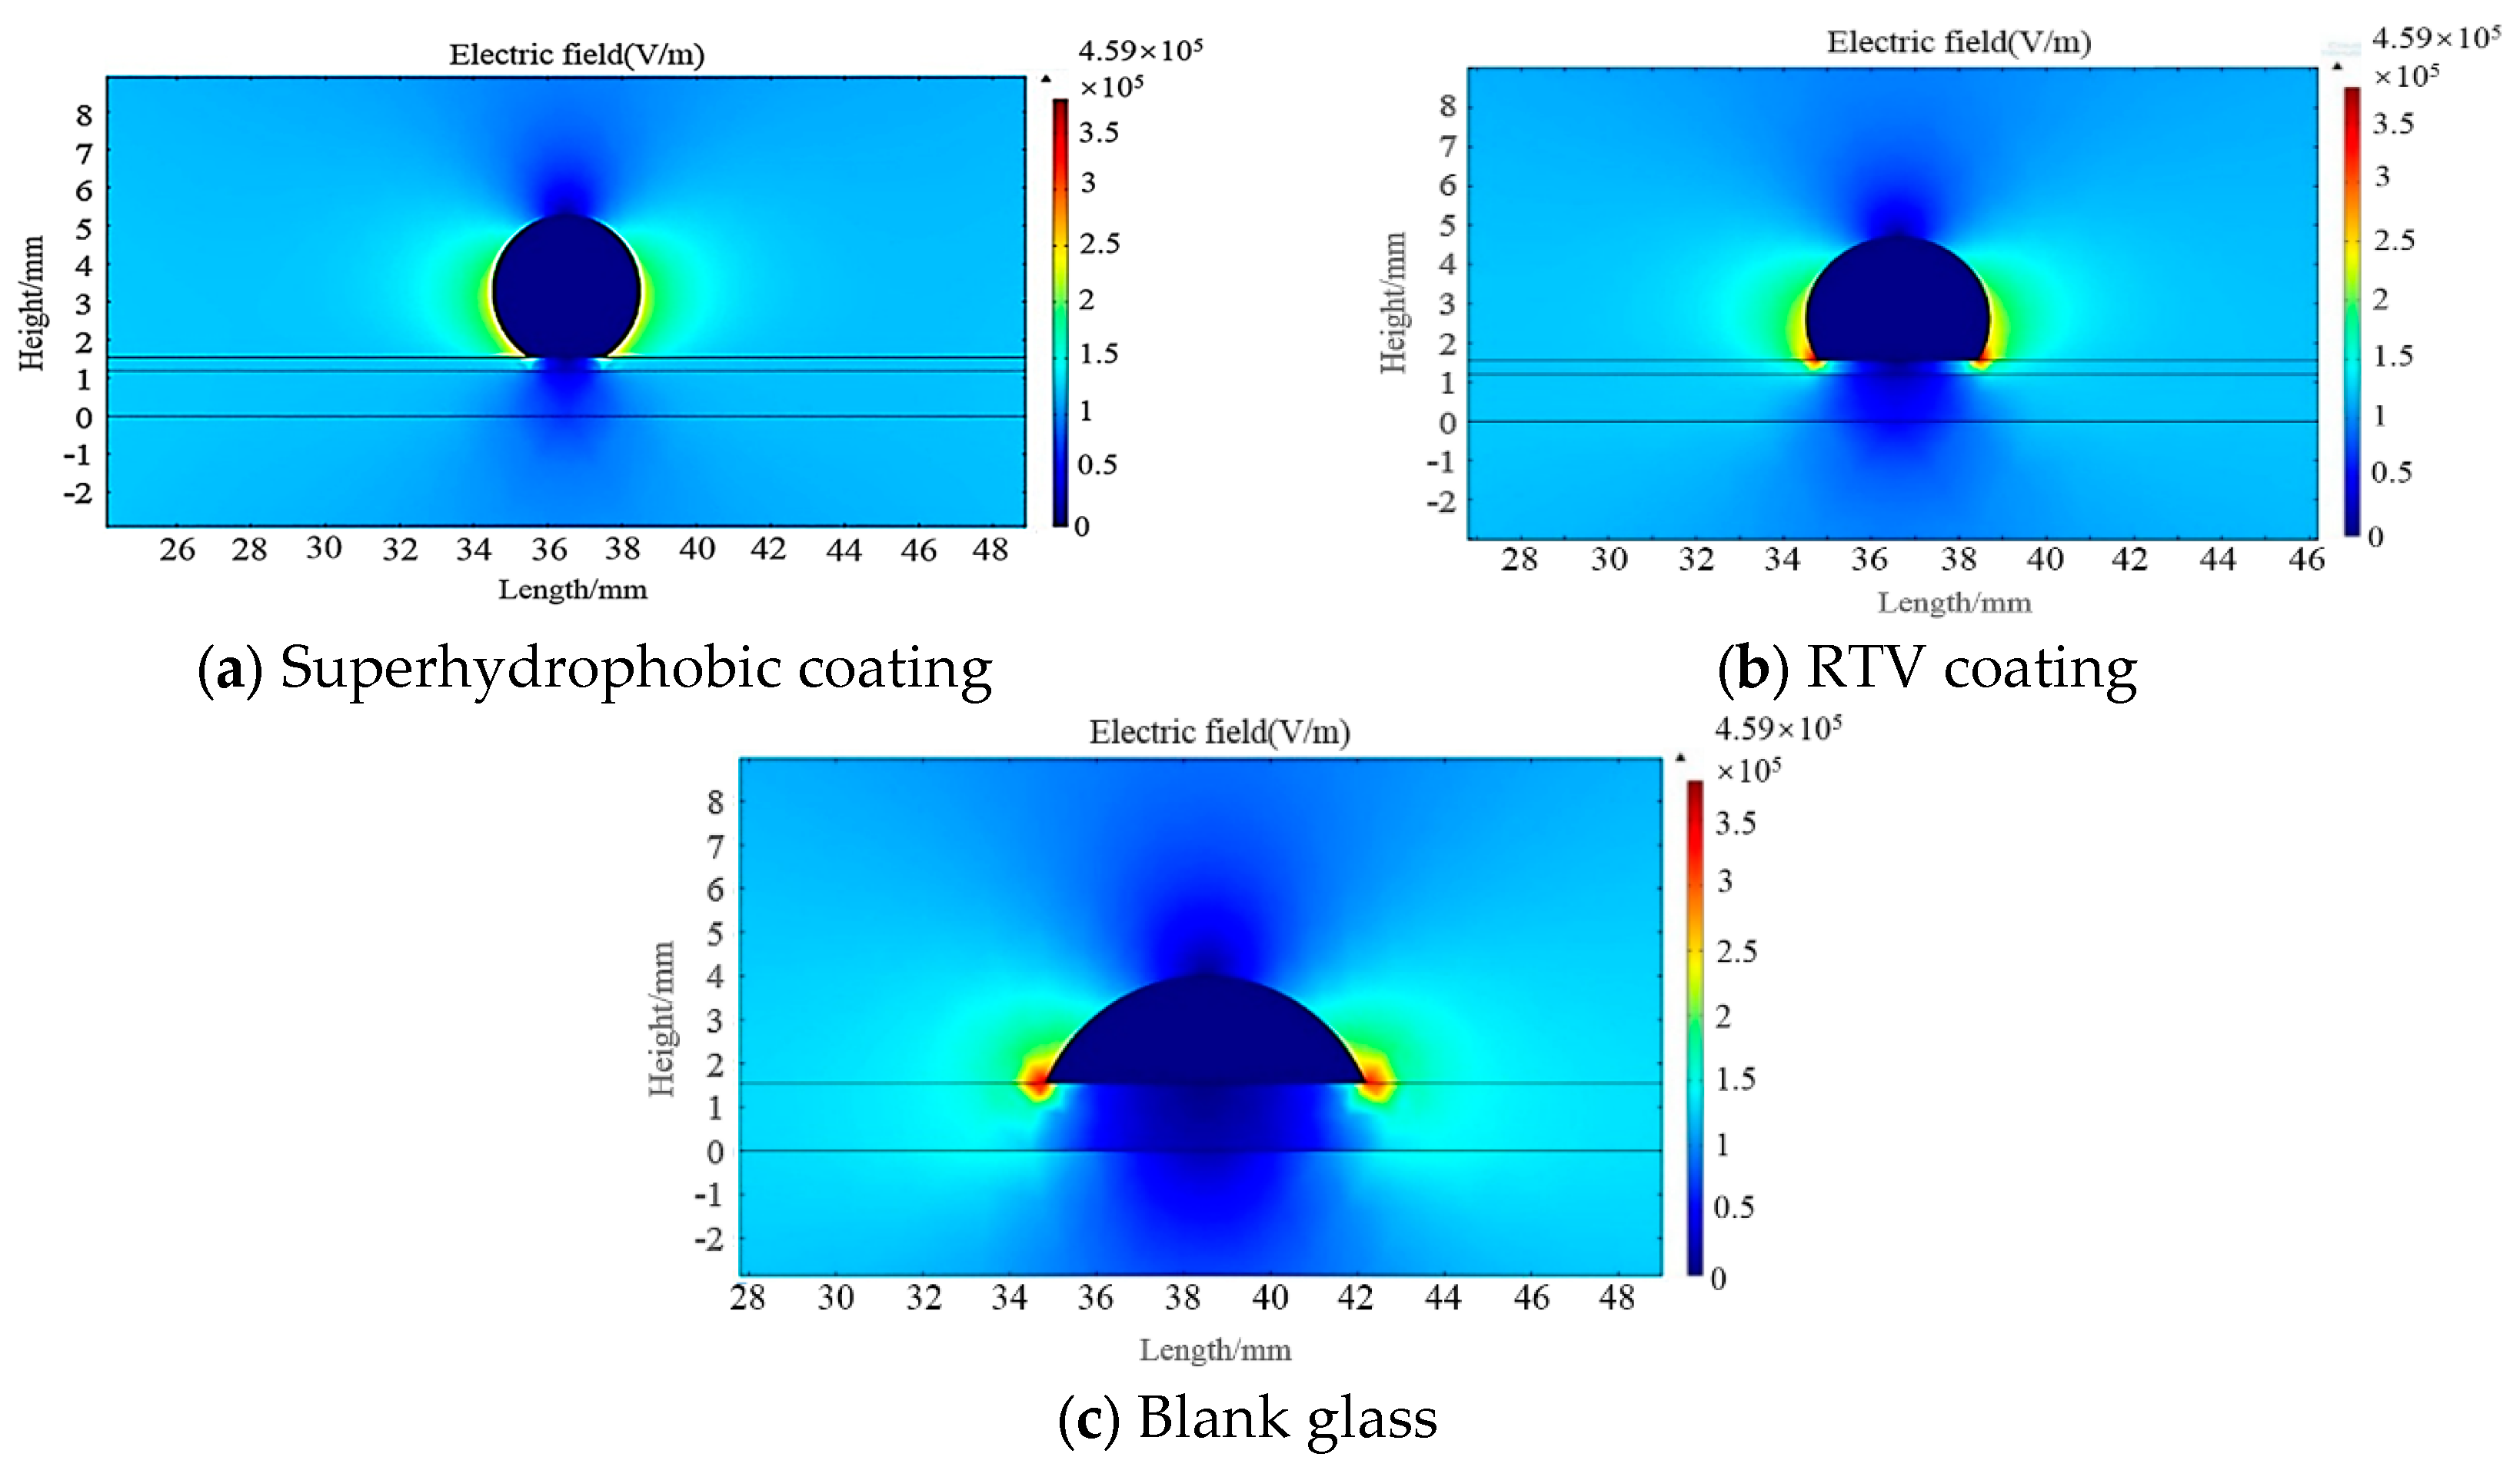
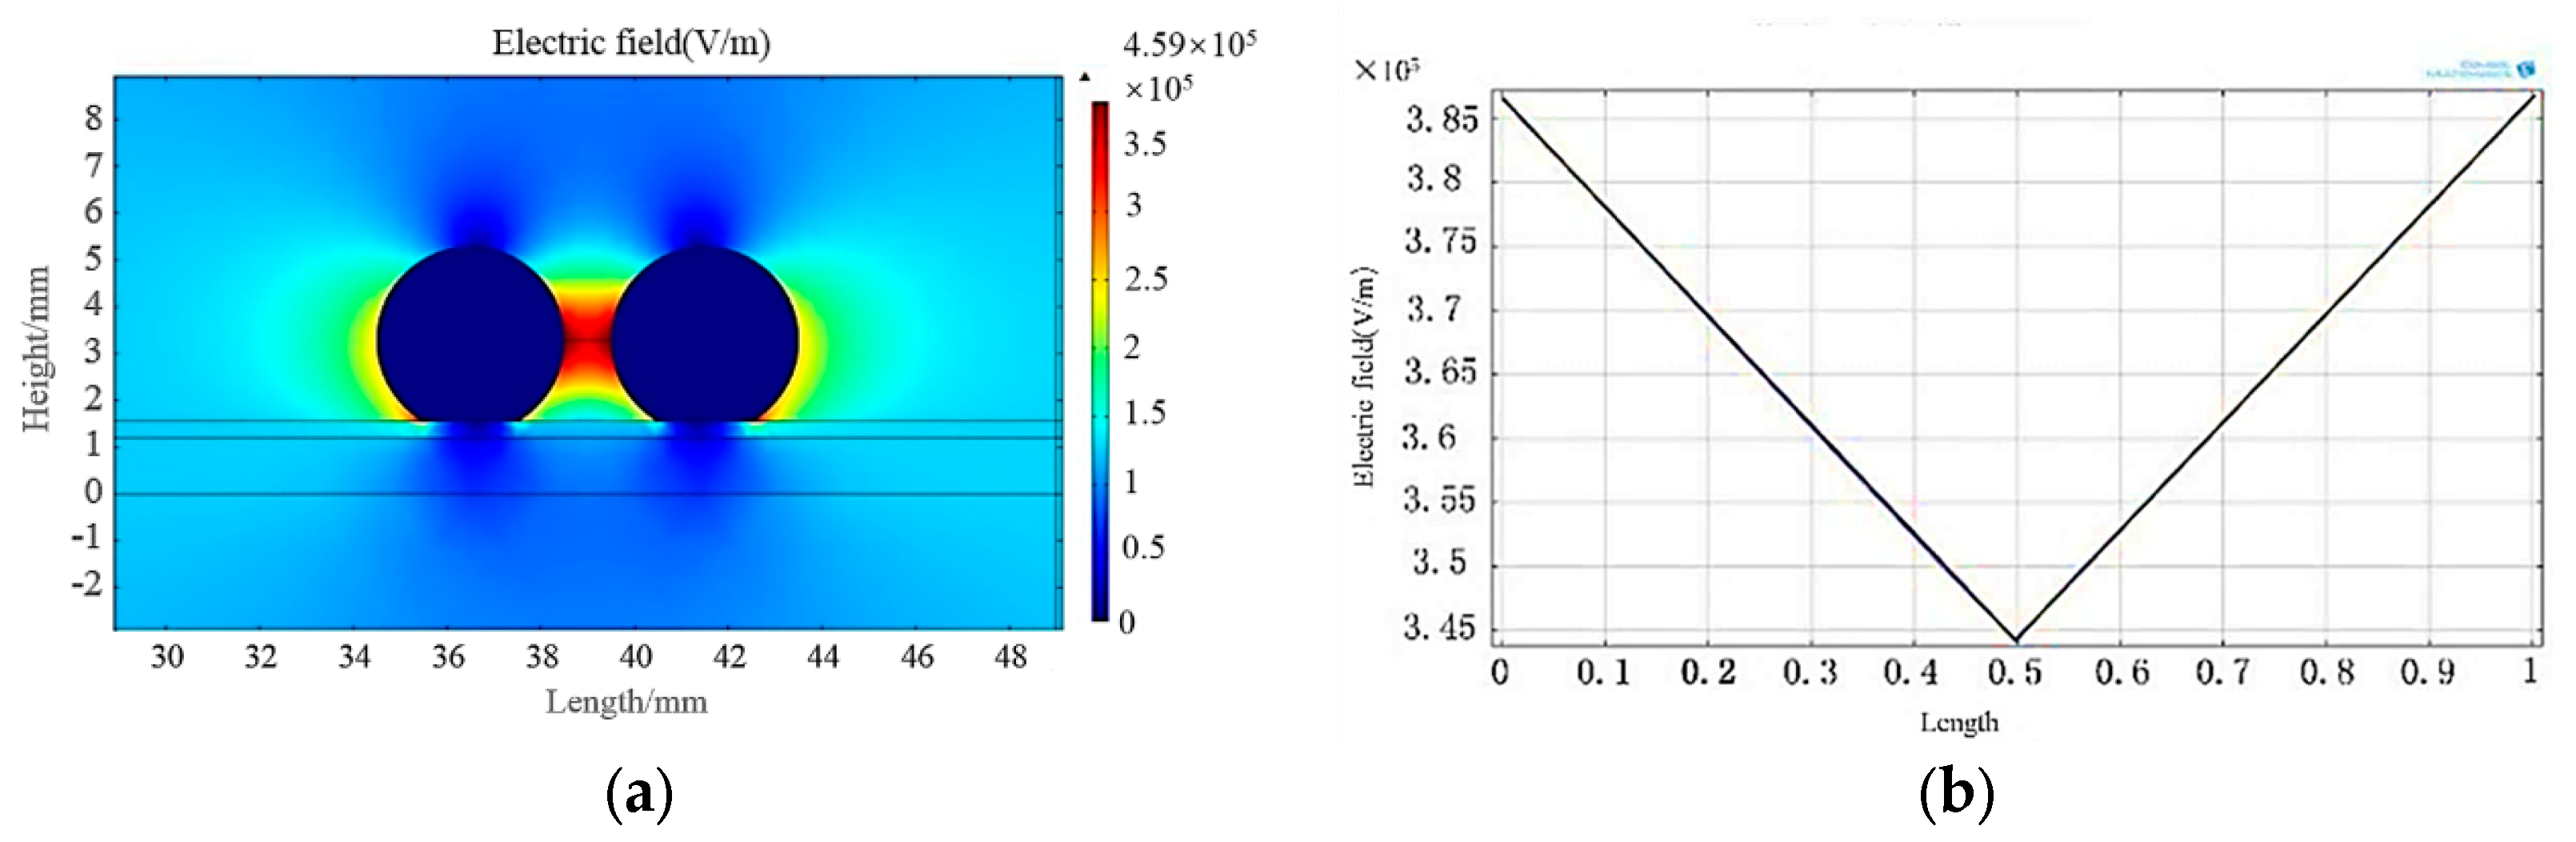
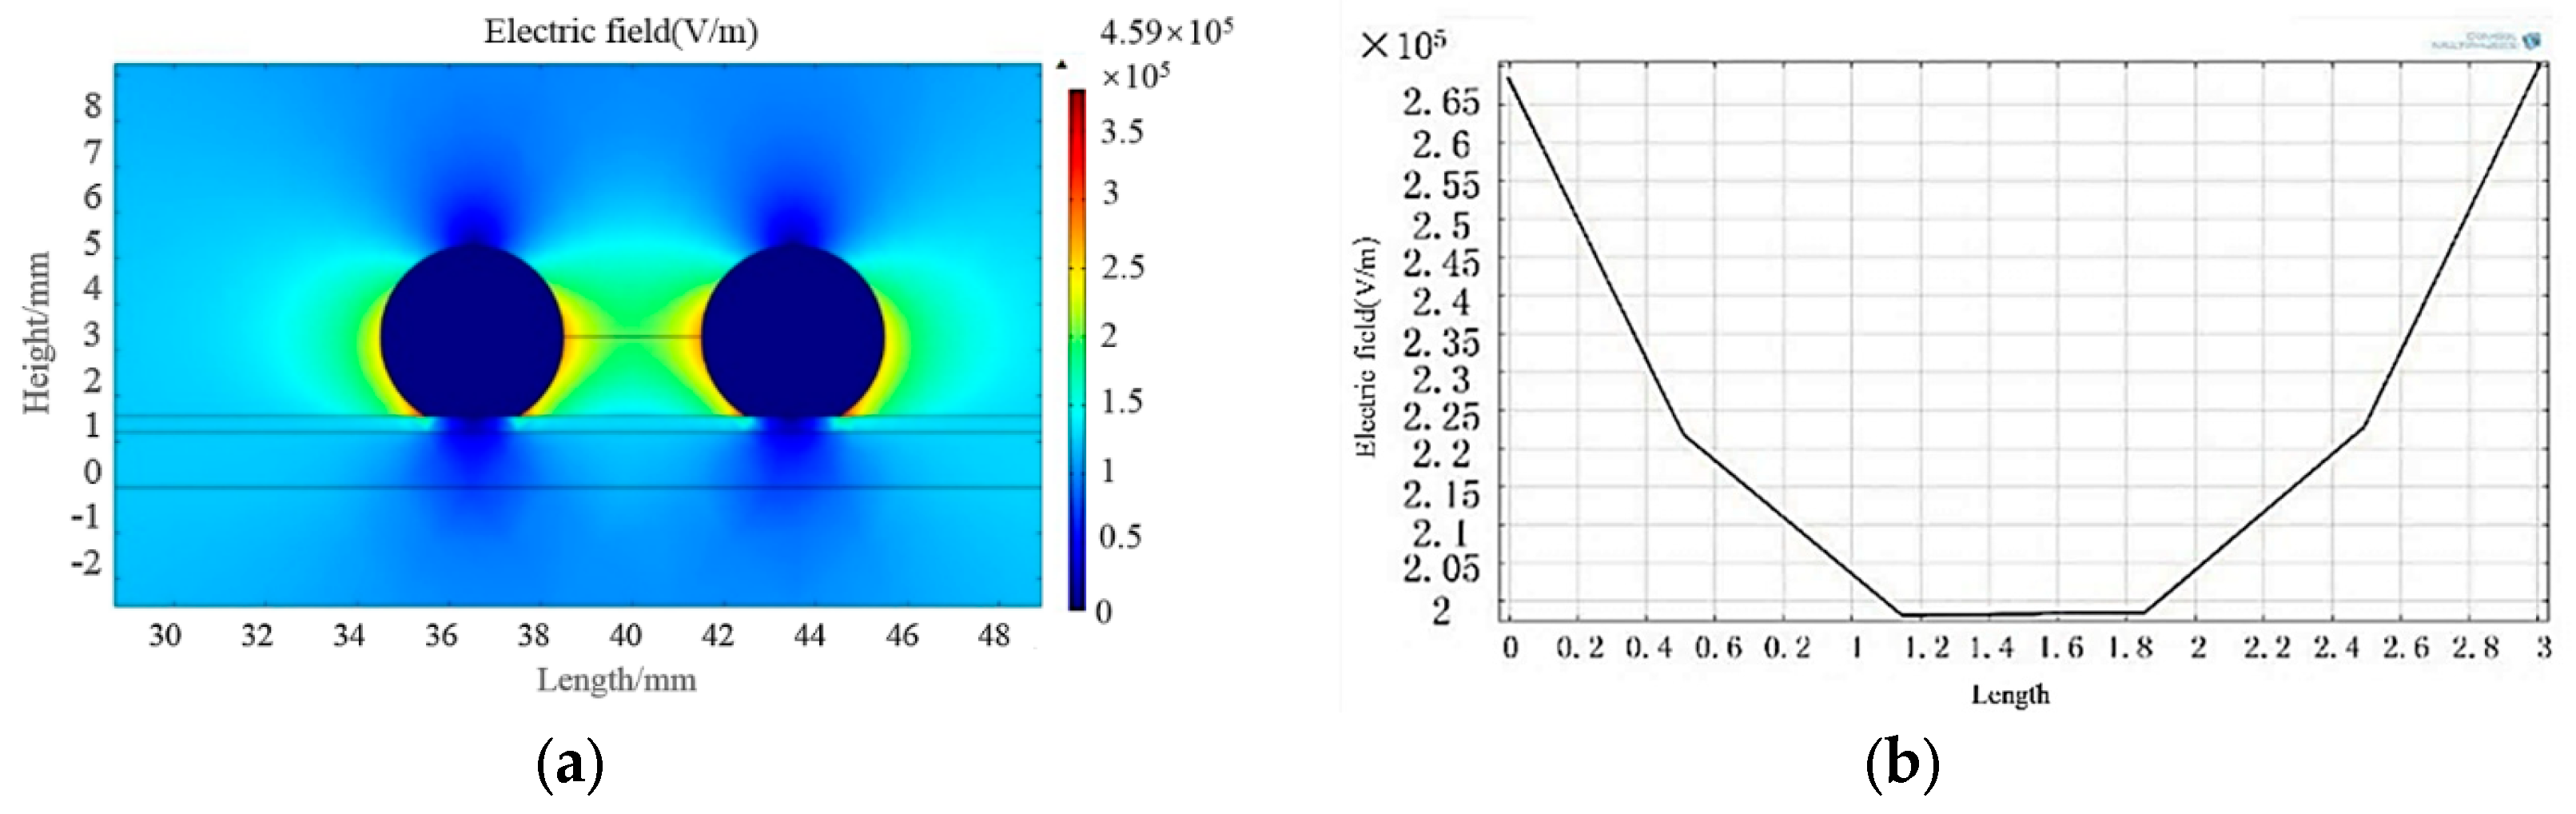
3.4.2. COMSOL Simulation

We use COMSOL simulations to simulate the electric field between the water droplets with different spacings in order to explore the effect of spacing on the electric field and even the whole macro-discharge. When the distance between the water droplets was set to 1 mm in the figure below, the blue represents the lowest electric field, and the higher the field intensity was, the darker the red was. The simulation of the electric field distribution between two droplets is shown in Figure 6a.
From the figure, it can be seen that the maximum electric field appeared at the surface of the droplet passing through the line of the droplet center, and the value was 3.8678 × 10⁵ V/m. The intensity of the electric field decreased evenly and reaches the lowest point in the center.
When the distance between water droplets was changed to 3 mm, the electric field changed and is shown in Figure 7.
It can be seen from the graph that the field strength decreased from 3.8678 × 10⁵ to 2.6986 × 10⁵ V/m, a drop of nearly one third. The field strength remained relatively constant at a position of about 0.65 mm in the middle.
Based on the above two experiments, we can see that when the gap between water droplets became larger, the electric field decreased correspondingly, and the possibility of arc generation was reduced. The reason why superhydrophobic materials can greatly increase the pollution flashover voltage is that the superhydrophobic materials leads to the larger distance between water droplets remaining on them, and it is more difficult to generate enough electric field strength under the same electric field to trigger an arc phenomenon, which increases pollution flashover difficulty. The contact angle due to the hydrophobicity is also an important reason.

4. Conclusions

(1)
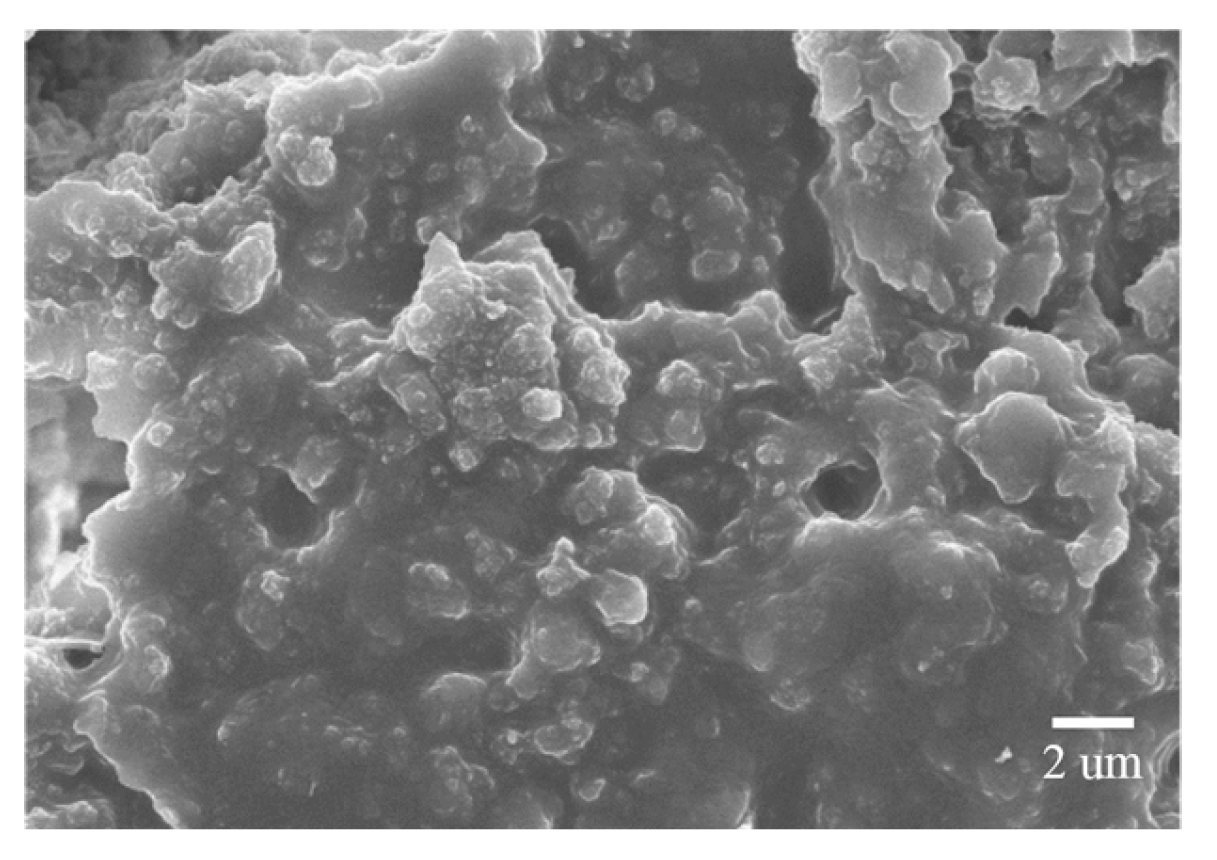
The micro-nano composite rough structure was constructed using PMMA particles and nano-SiO2 particles, and the superhydrophobic coating was prepared by spraying with PVDF for a low surface energy treatment.
(2)
The average static contact angle of the superhydrophobic coating was 155°, and the relative dielectric constant and conductivity were 2.8 and 3.3 × 10⁻¹³ S/m, respectively, at a power frequency. The prepared coating had excellent superhydrophobic and dielectric properties.
(3)
Based on the condensation test platform, we analyzed the distribution characteristics of water droplets on the superhydrophobic coating. The water droplets on the superhydrophobic coating were sparse, and the particle size was relatively small, which was beneficial for improving the dielectric properties of the coating. There were fewer water droplets on the surface of the superhydrophobic coating, the particle size was smaller, and the spacing was larger, which was beneficial for improving the dielectric properties of the coating.
(4)
According to the results of the simulation, the electric field intensity at the interface of the gas, liquid, and solid phases on the surface of superhydrophobic coatings was relatively low, which reduced the risk of partial discharge compared to the RTV coating.
In conclusion, we prepared PVDF@PMMA/SiO2 superhydrophobic coatings and analyzed the condensation properties on the surface, the results of which formed a basis for a simulation model of the electric field. This research is helpful to explain the excellent pollution flashover performance of superhydrophobic coatings.

Author Contributions

Data curation, Y.H.; Formal analysis, Y.Y.; Funding acquisition, X.G.; Resources, H.X.

Funding

This research was partially funded by National Natural Science Foundation of China (Nos. 51425702 and 51707016), the Science and Technology Project of SGCC (SGTYHT/14-JS-188), National Key Basic Research Program of China (973 Program) (2015CB251003), the 111 Project of the Ministry of Education, China (B08036), the Special Funding for China Postdoctoral Science Foundation (No. 2018T110944).

Acknowledgments

We thank Zhengyong Huang for improving some figure artwork and doing additional experiments and helpful discussions. We would also like to acknowledge the reviewers and editor for helpful feedback and ideas for improving the quality of our manuscript.

Conflicts of Interest

The authors declare no conflict of interest.

References

  1. Zhang, Z.; Jiang, X.; Sun, C. Present situation and prospect of research on flashover characteristics of polluted insulators. Power Syst. Technol. 2006, 30, 35–40. [Google Scholar] [CrossRef]
  2. Zhang, Z.; Jiang, X.; Sun, C.; Hu, J.; Shu, L.; Mao, F. Influence of air pressure on DC pollution flashover performance of insulator string. Trans. China Electrotech. Soc. 2010, 25, 38–43. [Google Scholar]
  3. Gençoğlu, M.T.; Cebeci, M. The pollution flashover on high voltage insulators. Electr. Power Syst. Res. 2008, 78, 1914–1921. [Google Scholar] [CrossRef]
  4. Zhang, Z.; Liu, X.; Jiang, X.; Hu, J.; Gao, D.W. Study on AC flashover performance for different types of porcelain and glass insulators with non-uniform pollution. IEEE Trans. Power Deliv. 2013, 28, 1691–1698. [Google Scholar] [CrossRef]
  5. Jiang, X.; Du, Y.; Lin, F.; Hu, J.; Zhang, Z.; Lu, J. Effect of permanent in-situ forming anti-fouling composite coating on insulator ice coating and AC ice flash voltage. Power Syst. Technol. 2008, 32, 71–75. [Google Scholar]
  6. Zeng, Z.; Gu, Z.; Huo, R.; Ye, Y.; Zhang, Z. Super-hydrophobic and Self-cleaning PVDF film fabricated by chemical bath deposition. J. Donghua Univ. (Engl. Ed.) 2010, 27, 451–457. [Google Scholar]
  7. Fürstner, R.; Barthlott, W.; Neinhuis, C.; Walzel, P. Wetting and self-cleaning properties of artificial superhydrophobic surfaces. Langmuir 2005, 21, 956–961. [Google Scholar] [CrossRef] [PubMed]
  8. Nakajima, A.; Hashimoto, K.; Watanabe, T.; Takai, K.; Yamauchi, G.; Fujishima, A. Transparent superhydrophobic thin films with self-cleaning properties. Langmuir 2000, 16, 7044–7047. [Google Scholar] [CrossRef]
  9. Jin, M.; Feng, X.; Xi, J.; Zhai, J.; Cho, K.W.; Feng, L.; Jiang, L. Super-hydrophobic PDMS surface with ultra-low adhesive force. Macromol. Rapid Commun. 2005, 26, 1805–1809. [Google Scholar] [CrossRef]
  10. Farhadi, S.; Farzaneh, M.; Kulinich, S.A. Anti-icing performance of superhydrophobic surfaces. Appl. Surf. Sci. 2011, 257, 6264–6269. [Google Scholar] [CrossRef]
  11. Miljkovic, N.; Preston, D.J.; Enright, R.; Wang, E.N. Electric-field-enhanced condensation on superhydrophobic nanostructured surfaces. ACS Nano 2013, 7, 11043–11054. [Google Scholar] [CrossRef] [PubMed]
  12. Bhushan, B.; Jung, Y.C.; Koch, K. Self-cleaning efficiency of artificial superhydrophobic surfaces. Langmuir 2009, 25, 3240–3248. [Google Scholar] [CrossRef] [PubMed]
  13. Wisdom, K.M.; Watson, J.A.; Qu, X.; Liu, F.J.; Watson, G.S.; Chen, C.H. Self-cleaning of superhydrophobic surfaces by self-propelled jumping condensate. Proc. Natl. Acad. Sci. USA 2013, 110, 7992–7997. [Google Scholar] [CrossRef] [PubMed] [Green Version]
  14. Boreyko, J.B.; Chen, C.H. Self-propelled dropwise condensate on superhydrophobic surfaces. Phys. Rev. Lett. 2009, 103, 184501. [Google Scholar] [CrossRef] [PubMed]
  15. Jun Lee, S.; Lee, S.; Hyoung Kang, K. Droplet jumping by electrowetting and its application to the three-dimensional digital microfluidics. Appl. Phys. Lett. 2012, 100, 81604. [Google Scholar] [CrossRef] [Green Version]
  16. Li, S.; Page, K.; Sathasivam, S.; Heale, F.; He, G.J.; Lu, Y.; Lai, Y.K.; Chen, G.Q.; Carmalt, C.J.; Parkin, I.P. Efficiently texturing hierarchical superhydrophobic fluoride-free translucent films by AACVD with excellent durability and self-cleaning ability. J. Mater. Chem. A 2018, 6, 17633–17641. [Google Scholar] [CrossRef] [Green Version]
  17. Schmitt, M.; Heib, F. A more appropriate procedure to measure and analyse contact angles/drop shape behaviours. Adv. Contact Angle Wettabil. Adhes. 2018, 3, 1–57. [Google Scholar]
  18. Extrand, C.W. Model for contact angles and hysteresis on rough and ultraphobic surfaces. Langmuir 2002, 18, 7991–7999. [Google Scholar] [CrossRef]
  19. Patankar, N.A. On the modeling of hydrophobic contact angles on rough surfaces. Langmuir 2003, 19, 1249–1253. [Google Scholar] [CrossRef]
  20. Marmur, A. Soft contact: Measurement and interpretation of contact angles. Soft Matter 2006, 2, 12–17. [Google Scholar] [CrossRef]
Figure 1. Static contact angle.
Coatings 09 00743 g001
Figure 2. SEM images of a superhydrophobic coating.
Coatings 09 00743 g002
Figure 3. Diagram of condensation test equipment.
Coatings 09 00743 g003
Figure 4. Two types of coating surface conditions under under pressure: (a,b) superhydrophobic coating and (c,d) RTV coating, where (a,c) are the original condensation pictures and (b,d) are the image binarizations.
Coatings 09 00743 g004
Figure 5. Simulation of electric field strength distribution on sample surfaces.
Coatings 09 00743 g005
Figure 6. (a) Simulation of the electric field distribution when the space between water droplets was 1 mm; (b) Simulation of the field intensity when the space between water droplets was 1 mm.
Coatings 09 00743 g006
Figure 7. (a) Simulation of electric field distribution when the space between water droplets was 3 mm; (b) Simulation of electric field intensity when the space between water droplets was 3 mm.
Coatings 09 00743 g007
Table 1. Statistical analysis of the water droplets on the surface.
Coatings100~300 μm300~500 μm500~1000 μm1000~2000 μm>2000 μm
Superhydrophobic coating24912300
RTV coating3485235203

