1. Introduction
In industry, there is a need to improve the processes of protection and repair of naval, automotive, and aeronautical components. These structural elements exist in a marine environment in the transportation system, where the high degree of deterioration and wear causes loss of material. In order to reduce the wear rate of these components, the application of protective coatings using thermal spraying is a strategy that has undergone rapid development in recent years. These techniques seek to extend the useful life of the components in the face of the difficulties of fabrication and the rise in price of the components in the replacement process. The practice of installing a new piece or discarding it once it has been worn out and replacing it with a spare part has been reduced, and now there is a tendency to install parts with protective coatings produced by thermal spraying.
Some of the parts that fail most in the naval sector are made with bronze alloys, for example, propellers, pumps, shafts, pipes, bushings, etc. As mentioned above, an economical and efficient alternative for protecting these components is the use of flame spraying. For this purpose, an aluminum–bronze alloy can be used, which is a good alternative for replacing parts subjected to wear environments [
1] and which has a chemical composition very similar to that of the components that are used in the transportation industry. Aluminum–bronze, or cuproaluminium, coatings are copper-based coatings that contain between 5% and 12% aluminum, which is the main alloy metal that is added to copper. The mechanical properties of aluminum–bronze coatings depend on the aluminum content. In recent years, much research has been done on the tribological behavior of aluminum bronzes. Sullivan and his colleagues studied the wear of aluminum bronzes on steel under conditions of limit lubrication, and a theoretical wear model was proposed under limit lubrication [
2].
In the process of thermal projection by combustion, the chemical energy of combustible and combustion gases is used for the generation of the flame responsible for melting the projected particles. Oxyacetylene torches use a mixture of acetylene (C
2H
2) and oxygen (O
2), which in a stoichiometric ratio produces a flame that reaches a temperature of up to 3386 K at 1 atmosphere of pressure [
3]. An oxidant or highly oxidizing flame is one in which an excess of oxidizer is applied, and as a result a primary reaction zone (cone of the flame) is obtained that is much longer than for a reductive flame or a stoichiometric flame. The particles stay longer in the hottest area of the flame, and therefore they can achieve better heating.
The axial and radial temperature distribution and the changes in the velocity of the flame gases significantly affect the temperature of the particles and their behavior in flight, which influences the quality of the coating. The hot gases generated by combustion undergo complex events that involve heat and mass transfer phenomena in the boundary layers of the particle [
4]. In order to predict the thermal effect of a particle in flight during the process of thermal projection by oxyacetylene flame, numerical simulations have been made using Jets & Poudres software [
5]. This software is based on GENMIX computer code, which was developed by Spalding and Patankar [
6] and was improved by the use of thermodynamic and transport properties related to the local temperatures and the composition of the thermal sources that it simulates.
Wear resistance is an important design factor that is generally of great importance in the recovery of naval components. To improve the wear resistance, various surface recovery techniques are used in the shipbuilding industry. However, thermal flame projection has proved to be one of the most versatile methods for producing a coating with the desired properties on a surface, regardless of its internal microstructure. This technique is an effective way to produce aluminum-bronze coatings for a wide range of applications in the naval industry [
7]. It has shown its effectiveness in processes aimed at improving the erosion or corrosion characteristics and improving the dimensional accuracy of worn components. In addition, thermal flame projection coatings can be used in the recovery of naval elements. Previously, several researchers have produced Cu-Al coatings according to the application recommendations of the suppliers, but they have not obtained improvements in the quality of the coatings in terms of adherence, mechanical properties, and wear resistance [
8]. In order to optimize the results, the coatings have been deposited while changing the working distance and substrate roughness, and the effect of the pretreatment of the surface using different physical and chemical methods has been studied [
9]. However, a combination of parameters relating to the combustion and gas projection pressure for producing better strength and good adhesion has not been found. Aluminum-bronze coatings have good wear and corrosion resistance properties because a copper oxide layer is formed on the surface, and they are recommended for the protection and dimensional restoration of parts that are subject to harsh operating conditions [
10]. Li [
10] investigated the wear of aluminum-bronze using the “pin-on-disk” dry slip test by establishing a 67:33 boundary ratio between soft and hard phases, concluding that if this ratio is greater, the wear tends to be of the adhesive type, exhibiting a hard β’ phase, while if the ratio is smaller, the wear tends to be abrasive, exhibiting a soft α phase. Williams [
11] and Koivuluoto [
12] established that there is considerable uncertainty about the microstructural characteristics in the alloy, in particular the distribution of crystallographic phases within the sample. A similar study, where the relationship between the method of preparation and the adhesion was analyzed, was carried out by Hincapie [
13]. In this study, a Cr
xO
y coating was deposited on naval brass substrates, and it was determined that the method of surface preparation of the sample affects the loss of volume and that the base layer decreases the wear coefficient. However, to the authors’ knowledge, no studies have reported the effect of the collision speed of the particles on the tribological behavior of aluminum–bronze coatings deposited via thermal spraying.
The main objective of this research was to study the effect of the pressure of the feed gases on the mechanical and tribological properties of the aluminum–bronze coatings deposited via thermal spraying by flame. To understand the effect of the gas pressure on the mechanical properties and the wear behavior of the deposited coatings, previous simulations with Jets & Poudres software were done, which allowed establishing the main thermodynamic and kinetic parameters during the growth of the coating.
2. Materials and Methods
Before the application of the coatings, numerical simulations were carried out with Jets & Poudres software (Jets&Poudres for Windows 98/ME/2000/XP, SPCTS, UMR-CNRS 6638 University of Limoges, 123, avenue Albert Thomas 87060 Limoges Cedex, France), in order to predict the behavior of the particles during the transport from the combustion zone to the substrate surface in the process of thermal spraying under different gas pressures. The Jets & Poudres software allows control of the gas and the material feed conditions in order to simulate the thermodynamic variables in the process of the spraying of the material. This software is used to estimate the effect of the geometry of the torch nozzle and the volumetric flow of the gases involved in the combustion.
The aluminum–bronze coatings were obtained via the technique of thermal projection by flame, using TeroDyn
® System 2000 equipment (Castolin Eutectic, Messer Castolin Eutectic, Frankfurt, Germany). The feed pressures of the combustion gases were controlled on three levels for each gas, oxygen and acetylene, following the values presented in
Table 1. Before the deposition of the coating on the samples, numerical simulations were developed using the Jets & Poudres software. This simulation tool allows evaluating the kinematic and thermodynamic behavior of the particles and gases in the jet spray from the combustion zone to the collision area on the substrate surface [
14]. Jets & Poudres software allows controlling the nozzle geometry and the feed conditions of the combustion gases and powders. Simulation results show that the temperature of the particles in the collision zone was not significantly different in response to pressure variations; above 2500 K, however, the collision speed of the particles changed in response to the feed pressure of the gases.
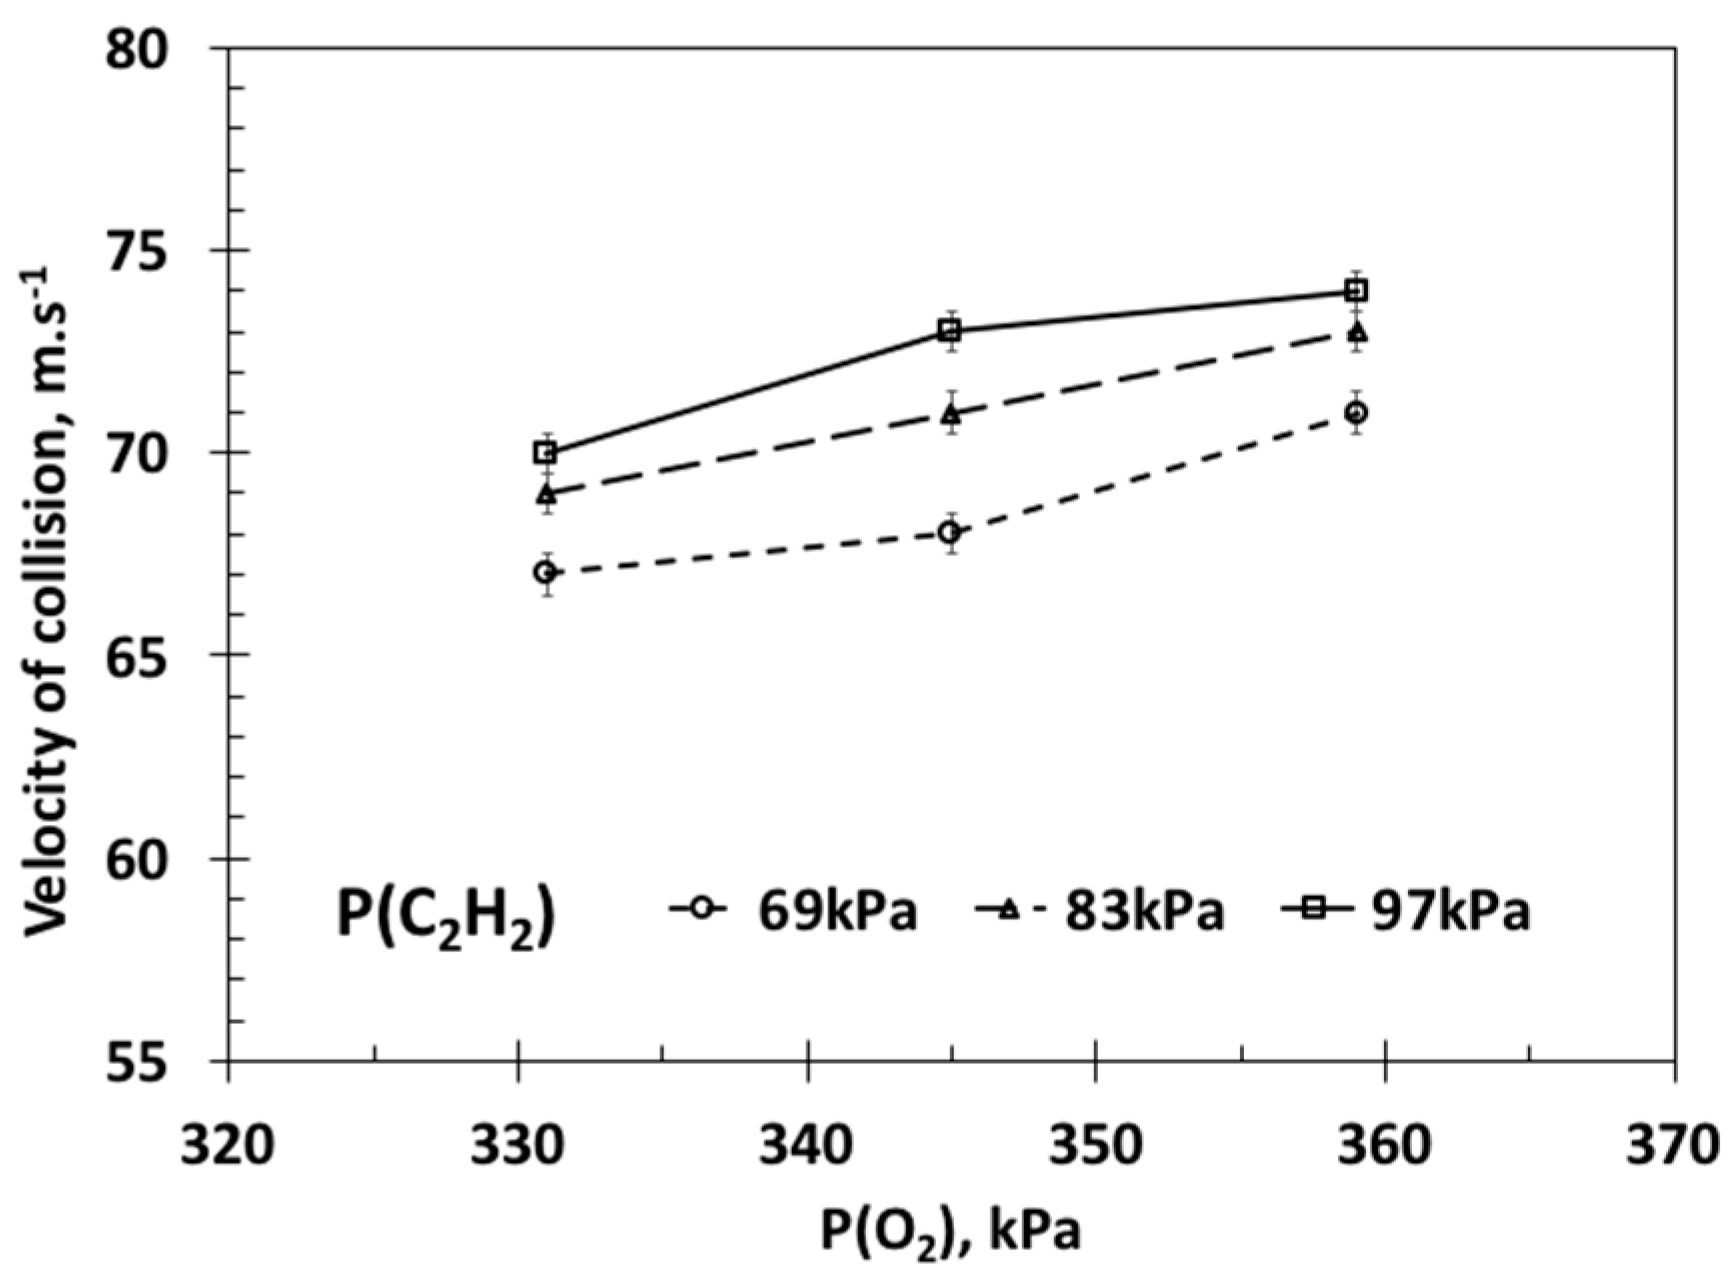
Figure 1 shows the collision speed values for each evaluated combination of the pressure of the feed gases. This behavior shows a response of the volumetric flow of the gases to the increase in feed pressure under conditions of subsonic flow with the addition of heat [
15]. In
Figure 1, it can be seen that the highest simulated collision velocity was 74 m/s, while the lowest value was 67 m/s. This was obtained for the highest and lowest feed pressures, respectively.
Table 1 shows the feed pressure levels obtained for the experimental design and collision velocity, based on the simulation results. The values of the collision velocity are similar to those obtained experimentally by Cadavid [
14] investigated the physical and thermal behavior of the flame, obtained from different oxygen and acetylene ratios, through simulations with the Jets & Poudres software. It was observed that the flame oxidizers are the ones with the longest length of the hottest zone. During the fabrication of the coating, the projection distance was maintained at 160 mm, the preheating temperature of the substrate was maintained at approximately 367 K, the compressed air pressure was 275.8 kPa, and a flat position was used. The coatings were deposited on substrates of navy brass UNS No. C46400 (Cu 60%, Zn 39.25% and Sn 0.75%, lead-free). Each specimen was a circular plate of 25 mm in diameter and 5 mm in thickness.
The surface of the substrates was prepared by sanding with abrasive paper from #80 to #100, and then the surface was shot-blasted with aluminum oxide (Al2O3) with a particle size of 100 μm “No. 24” at a pressure of 689.5 kPa for 30 s. Thereupon, the cleaning of the surface was continued using dry air under pressure in order to remove the waste from the shot blasting. The average rugosity of the substrate was approximately 30 μm.
Residual stresses were evaluated with the sin2ψ method, which allows determination of the distribution of the deformation of the crystalline lattice in a thin surface layer. The main advantage of this method, notwithstanding that it requires additional time for data collection, is the establishment of the linearity of the interplanar distance as a function of sin
2ψ [
15] The crystallographic structure was analyzed with X’PertPro (Panalytical, Almelo, The Netherlands) equipment operating in the Bragg–Brentano configuration with Cu Kα (1.5406 Å) radiation at 40 kV and 30 mA. The sweep range was from 10° to 60°, with a step size of 0.05° and 2θ. The changes in the morphology and the chemical composition of the coatings were determined through scanning electron microscopy (SEM) with a Jeol JSM-7400F (Jeol, 3-1-2 Musashino, Akishima, Tokyo 196-8558, Japan) in a high vacuum with a voltage of 30 kV. Complementary studies to characterize the structure were done by means of transmission electron microscopy with FEI TECNAI 20 TWIN (Thermo Fischer Scientific, Waltham, MA, USA) equipment operating in diffraction mode, with a potential difference of 300 kV and with a constant chamber of 730 mm. The chemical composition was determined through X-ray energy-dispersive spectroscopy (EDS) using Hitachi SU1510 (Hitachi High-Technologies, 24-14 Nishi-Shimbashi 1-chome, Minato-ku, Tokyo 105-8717, Japan) equipment with an EDAX APOLLO probe (Edax Inc., Devon-Berwyn, PA, USA).
The percentage of porosity in the coatings was determined from cross-section SEM images. The images were characterized at 300× and 250× through ImageJ (ImageJ bundled with 64-bit Java 1.8.0_112, National Institutes of Health, Bethesda, MD, USA) image analysis software. The percentage of porosity of the coatings was determined through grayscale contrast analysis. ImageJ software quantifies the total area and the gray areas of the cross-section micrography and automatically quantifies the percentage of porosity. The roughness and the morphology of the surfaces were determined using an OLYMPUS reference S×500 optical-digital microscope (Olympus Corporation, Shinjuku, Tokyo, Japan). Thickness measurements were taken in the cross-section of the coating. For these measurements, Quartz PCI image analysis software was used (Quartz Image Corporation, Vancouver, Canada). Ten measurements were made per record in 4 different continuous sections of the coating, and thicknesses between 127 and 299 μm were obtained.
The mechanical properties such as nanohardness and elastic module values of the coatings were measured using a nanoindentation device (Hysitron TI 750 Ubi, Bruker, Billerica, Massachusetts, Estados Unidos) equipped with a Berkovich diamond indenter. The load and unload curves were used to determine the nanohardness and the elastic modulus of the coatings, respectively, using the Oliver and Pharr method [
16]. Ten nanoindentations were performed, and the average and the standard deviation of the nanohardness and the elastic modulus are shown. Complementary measurements were performed using Vickers microhardness equipment with a uniaxial load, 10 g of force, and a time of 30 s.
A ball-on-disc test was carried out in order to determine the wear resistance of the films. The test was carried out through dry sliding with a stationary stainless steel ball (6 mm in diameter) using a CETR-UMT-2-110 tribometer (Bruker, Billerica, Massachusetts, Estados Unidos), under laboratory ambient conditions, with a wear-track radius of 6.8 mm, normal load 4 N, and sliding time 10 s. At the beginning of the test, the maximum Hertzian contact pressure, Po, was 989 MPa and the radius of the contact circle, a, was 0.088 mm, assuming a Young modulus (E) of 200 GPa and a Poisson ratio (v) of 0.30 for SS 440, as well as E = 190 Gpa and v = 0.275 for the Cu-Al coating, obtained using the nanoindentation test. After the test, the wear tracks and wear products were examined, and the wear rate (K) was calculated using Equation (1), where V is the worn volume, W is the applied weight, and X is the distance traveled. The units are mm
3, N
−1, and mm
−1, respectively. [
5]. An ASTM G-65 test [
17] under the C procedure (load of 130 N and 200 revolutions of the wheel to obtain ~1436 m of wear distance) was also carried out. These wear tests were carried out in order to analyze the response of the coatings to dry wear, and each wear test was carried out twice in order to verify the repeatability of the results. The scratch tests were carried out on cross-sections of the coatings and not on their surface, due to the thickness, porosity, and roughness of the coatings and in accordance with what is recommended by the literature for coatings obtained by thermal spray techniques [
18]. In the scratch tests, two cones are usually recorded, one at the substrate-coating interface and another at the upper border of the coating. The tests were carried out with the scratch method at a constant speed of 10 mm/min and a constant load of 5 and 15 N.
3. Results and Discussion
The microstructure of the coatings plays a significant role in the tribological and corrosion resistance properties. The morphology will depend on the solidification stages of the individual splats, as well as the accumulation of these splats on the substrate, the speed of the particles, and their temperature [
19]. On the other hand, the characteristic microstructurals will generally depend on the nature of the materials, the melting point, the degree of overheating, the viscosity, and interactions with the substrate [
20]. In
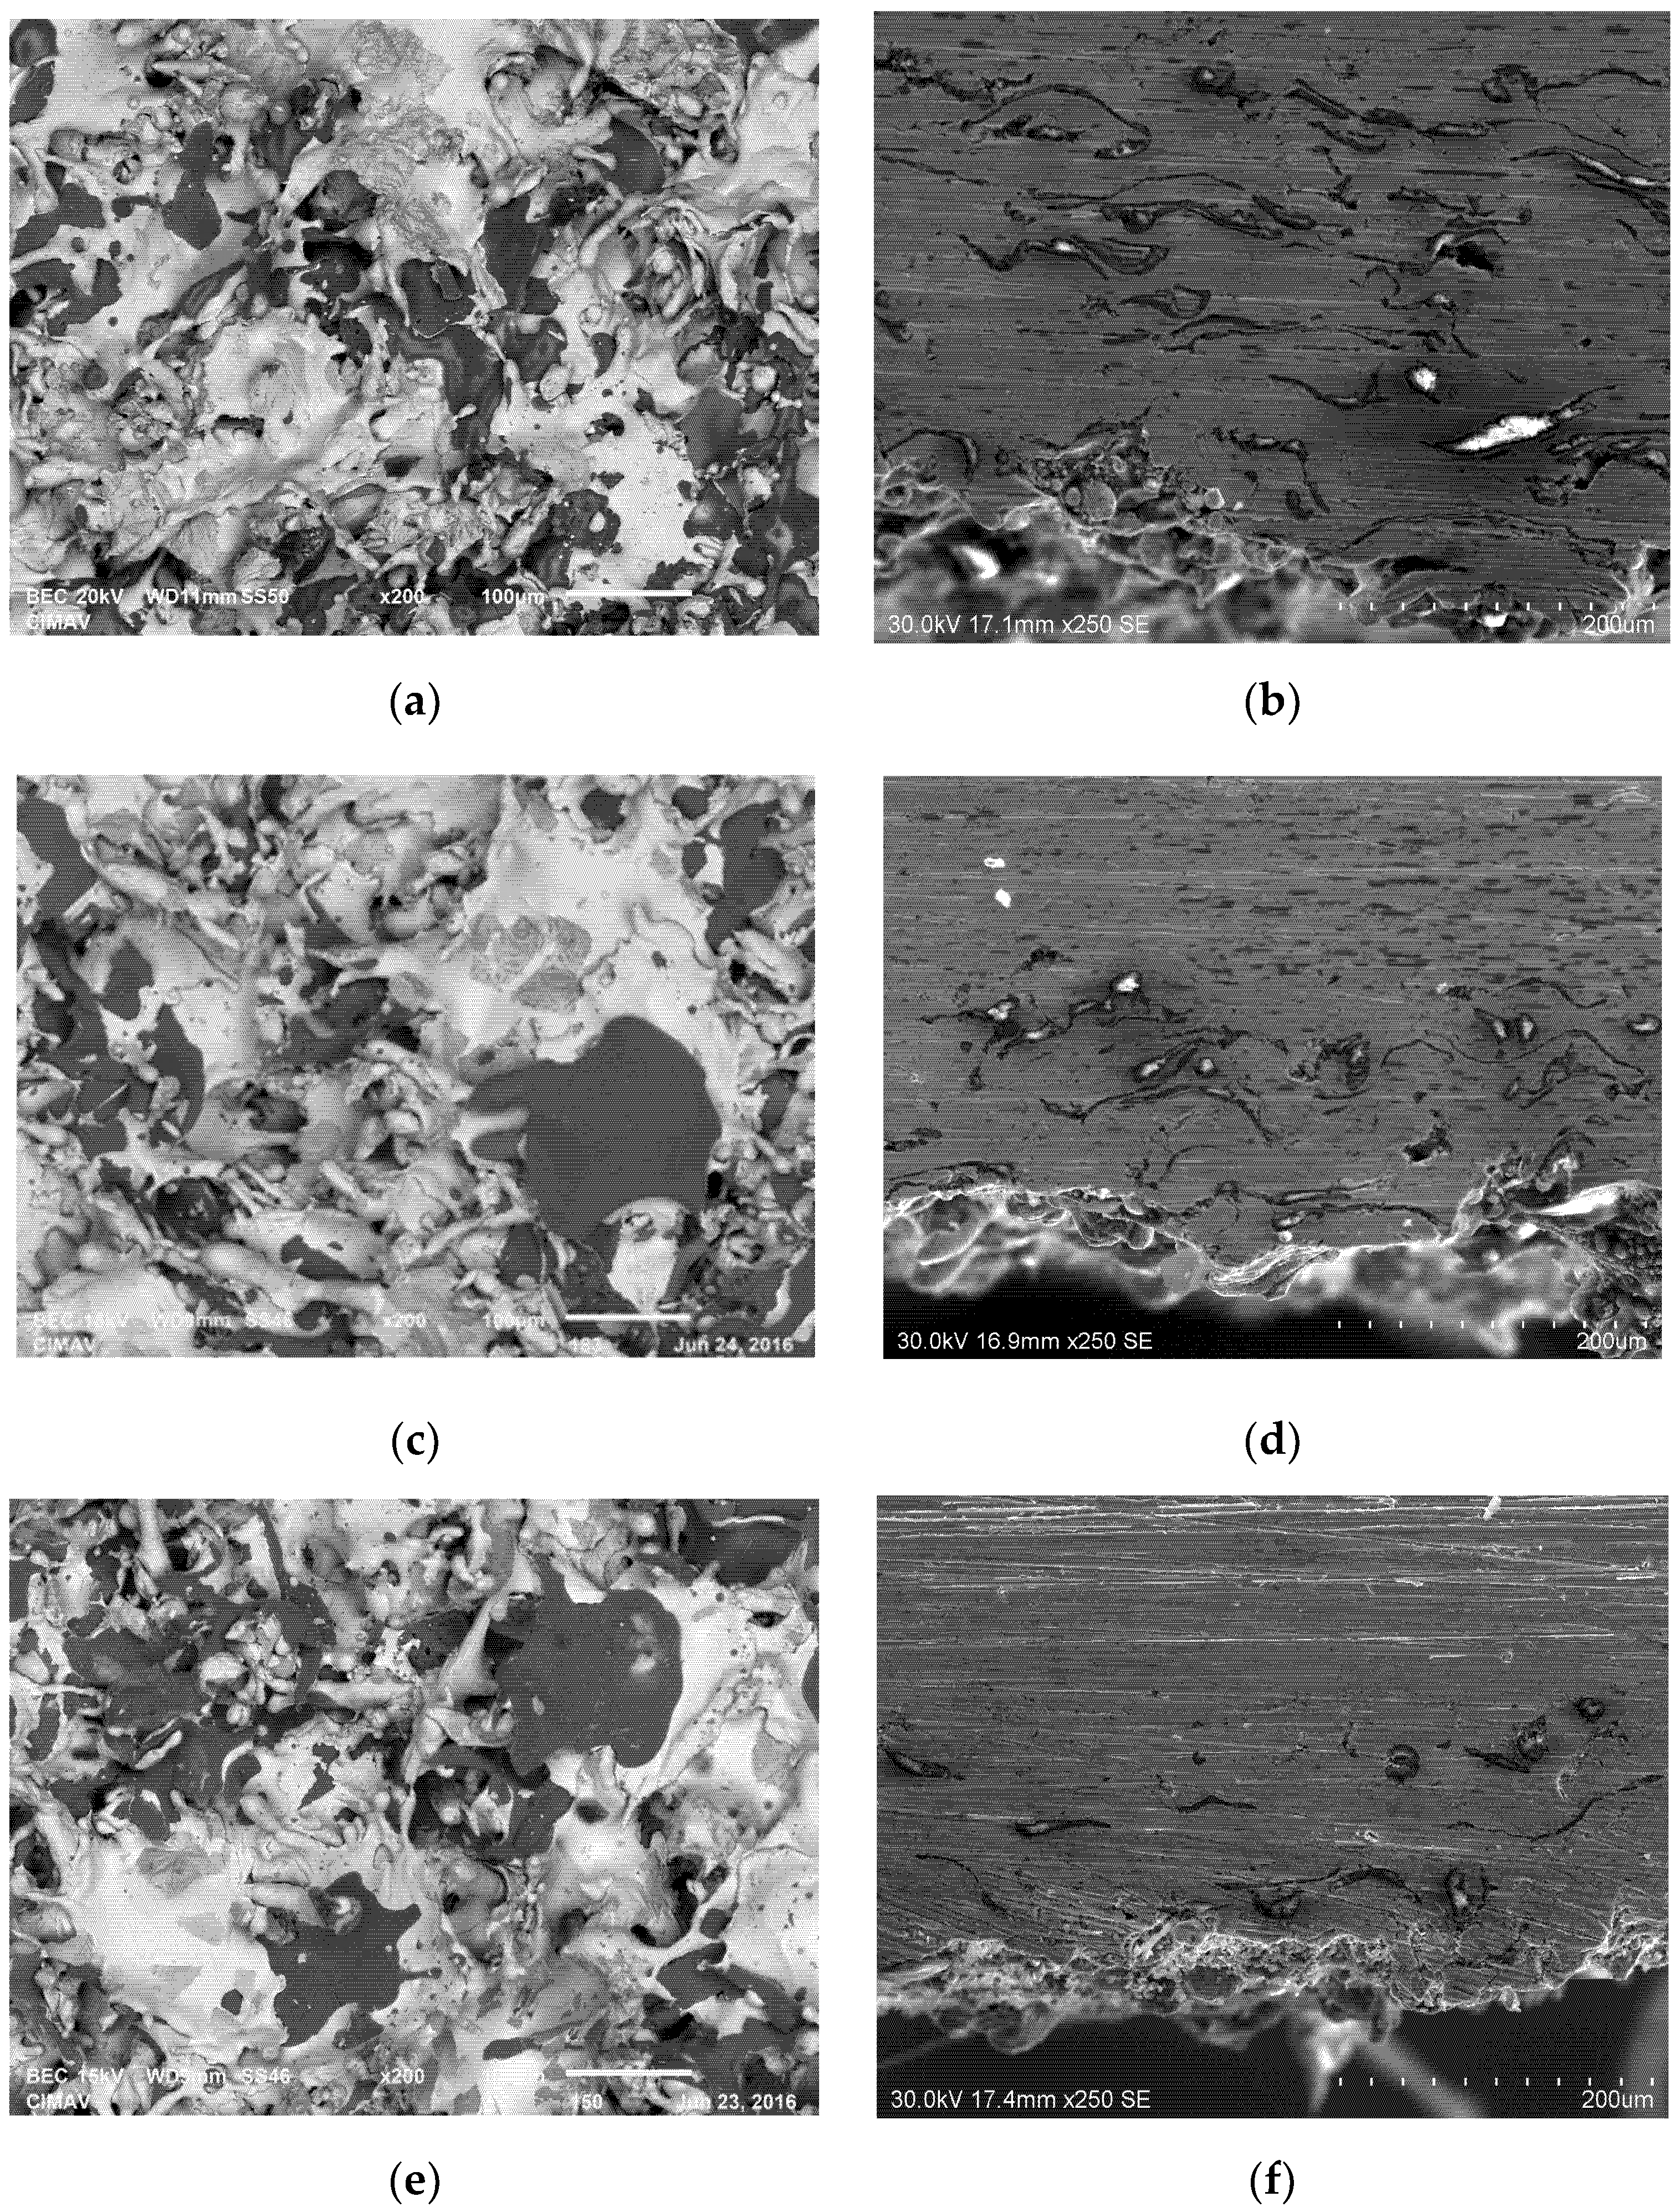
Figure 2a–f, SEM images of the coatings produced on the surface and in cross-section are shown. On the surface, spherical particles without melting, molten particles forming splats, pores, and in some cases dendritic structures can be seen, due to the solidification process of the molten drops. In the cross-section of the coatings, a stacking of the splats can be seen in the morphology, as well as the presence of defects from the technique, such as pores, cavities, oxides, and limits of the splats. The images also show the interface line that separates the substrate from the coating. The coatings exhibited laminar structures comprised of the stacking of particles and pores generated by the short time of the material in the flame and the high cooling rate of the molten material during the formation of the coating [
21]. In general, most coatings exhibited good compaction and were homogeneous. This is due to the great ease with which the oxyacetylene flame melts the aluminum–bronze (melting point of aluminum-bronze: 880°–920°). However, the working pressures applied (331 kPa oxygen and 69 kPa acetylene) result in detachments and a high percentage of porosity. In
Figure 2b,d,f can be observed that, the coating produced at low pressure values shown a higher presence of defects on the cross section. This defects decrease when the pressures are increased, to medium pressure (
Figure 2d) and the higher pressure of the experimental range (
Figure 2f).
The results of the EDS analysis can be seen in
Table 2. The composition was analyzed at several points, both in the area corresponding to the splats and in the areas of unmelted particles. According to these results, the coating is an aluminum-bronze alloy whose matrix is rich in copper, alloyed with Al and with small amounts of Fe, which agree with results published by other investigations, in which a matrix rich in copper in the α phase was identified [
22]. The copper concentration was within a range of 80% to 90% by weight, according to the initial composition of the deposition material. The concentration of aluminum yielded values ranging between 5% and 10%, which was probably affected by a possible segregation of aluminum in the most energetic processes. The presence of zinc from the substrate can also be observed.
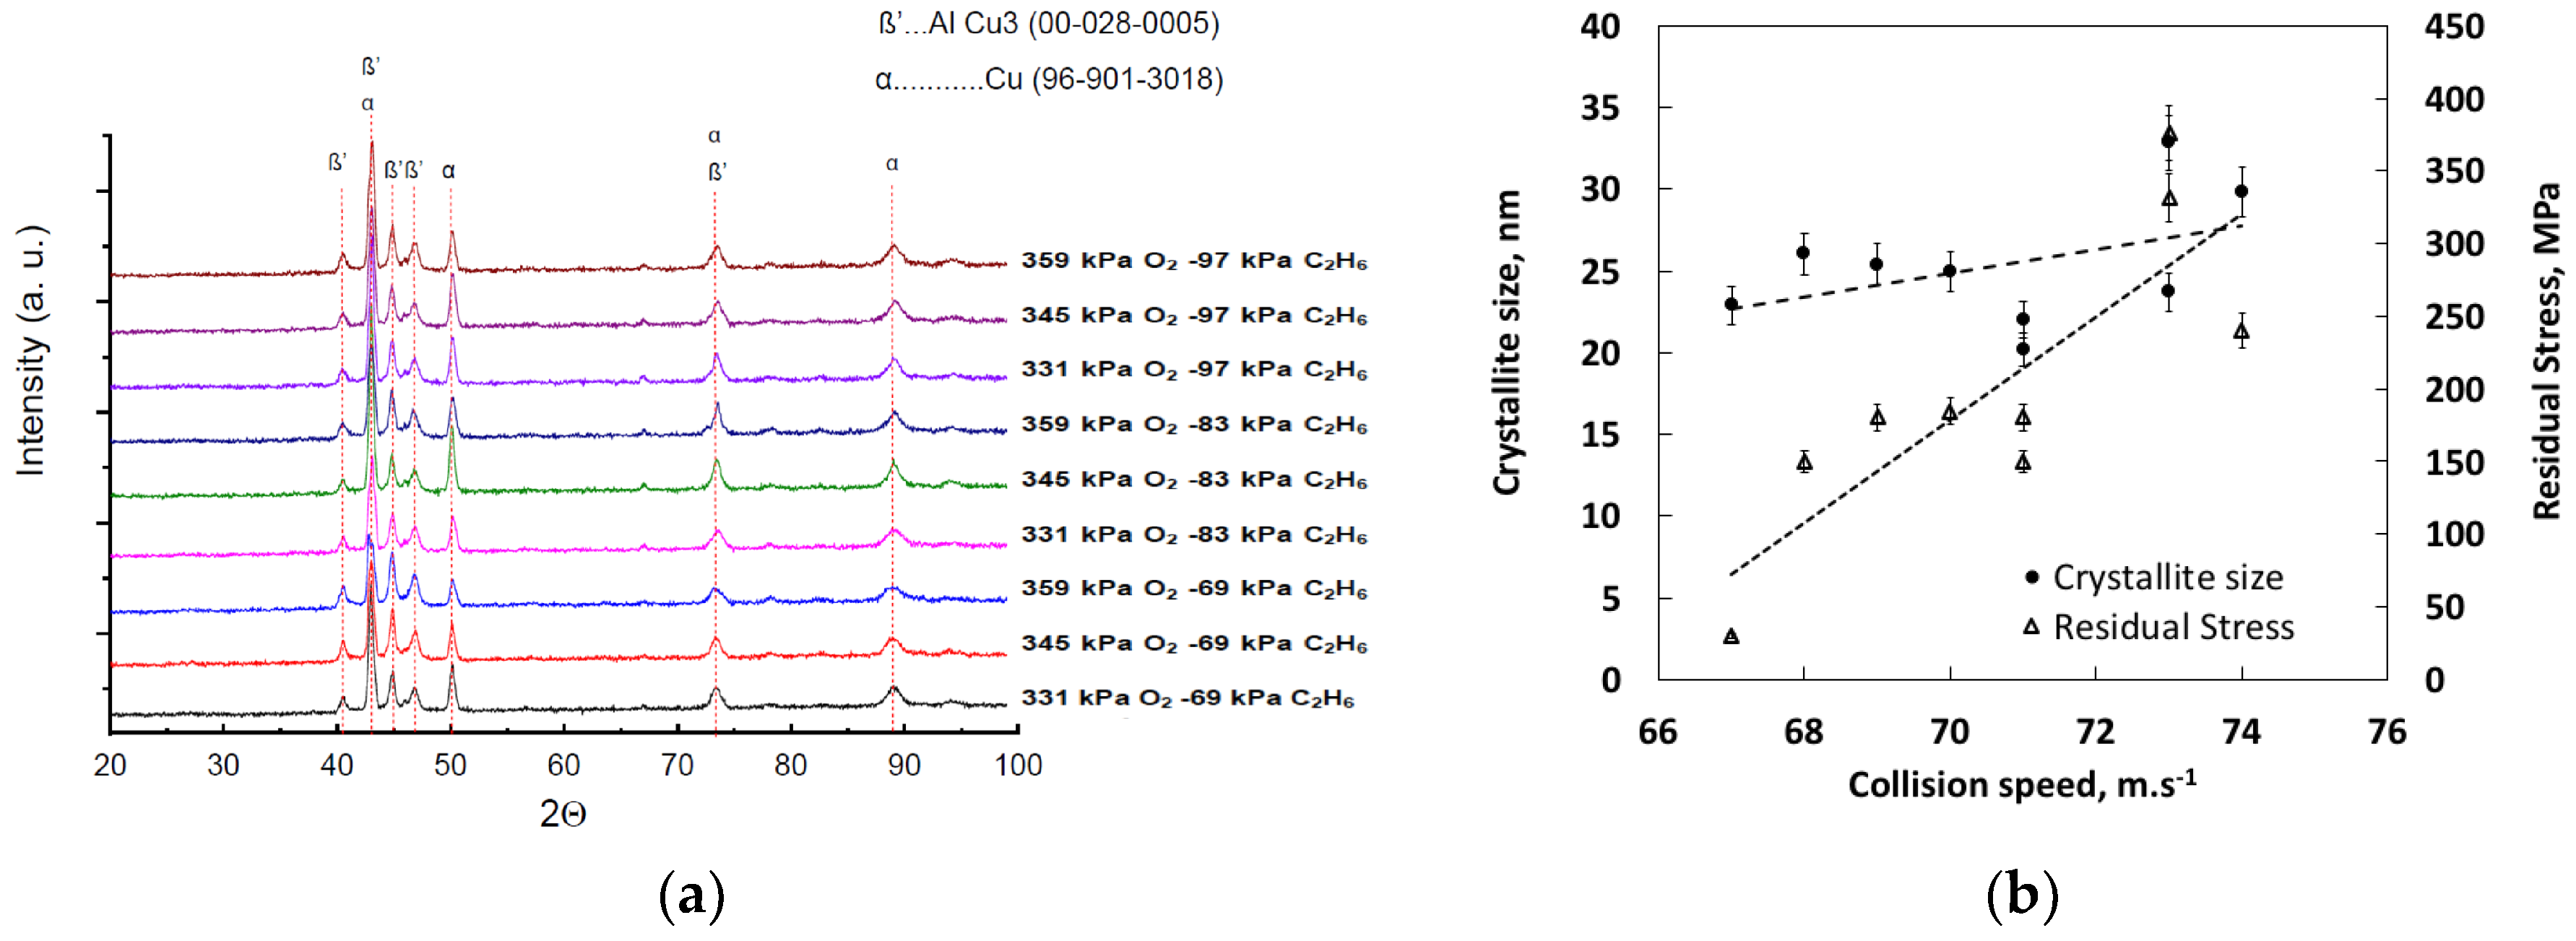
Figure 3a shows the XRD pattern of the nine experiments performed during the fabrication of the aluminum–bronze coatings. It can be seen that all the applications exhibited the same phases, and among them there was a small shift to the right. In general, the presence of the β′-AlCu
3 phase was observed, and its most important planes are in the 2θ position of 40.28, 42.73, 44.81, 46.85, and 73.00, according to letter 00-028-0005 [P. P. JCPDS]. The α phase of Cu FCC was also detected, which can be seen in the peaks located at 42.73, 50.5, and 88.9, according to letter 96-901-3018 [
22,
23,
24,
25]. The study by Li Wen-sheng et al. [
22] reported that AlCu
3 stoichiometry corresponds to an intermetallic compound that has a wide range of solubility, exhibits an FCC crystalline structure with 0.353 nm reticular spacing, and belongs to the 221 space group. In this spatial group, the atoms of Al
3+ are located in the vertices of the cell and the atoms of Cu are located in the centers of the faces of the crystalline structure. This compound is metastable and is produced by the rapid heating and cooling of the particles during the synthesis. In addition, rapid cooling of the particles after the process allows eutectoid decomposition of β′-AlCu
3 [
22,
26].
Figure 3b shows the results of the crystallite size vs. the collision rates of the particles. It can be seen that at low speeds, smaller crystallite sizes are obtained, while at high speed the size increases. This may be associated with higher particle velocities’ producing higher kinetic and/or particle impact energy on the growth surface of the coating. This greater kinetic energy produces a greater degree of deformation of the particles and mobility of its elements, favoring the growth of the crystallite. The results of the residual stress measurements determined by X-ray diffraction are summarized in
Figure 3b. According to these results, it can be established that the coatings exhibit tensile residual stress. This can possibly be explained by the combination of the values of the impact velocities and the solidification process of the particles during the nucleation and growth stages of the coating.
Figure 3b also shows a comparison between the values of the residual tension and the projection velocities of the gases, where it can be seen that the coating projected with O
2 pressure of 359 kPa and C
2H
2 pressure of 83 kPa exhibits the greatest residual stress, reaching a maximum stress of approximately 376 MPa. This is because the projected particles reached the highest collision speeds, which according to the numerical simulation were 73 m/s. When hitting the substrate, the drops with greater speed tend to deform and spread over the surface. The residual stresses produced during the fabrication of the coatings are a consequence of the high thermal and kinetic energy involved in the process and also of the cooling process and the impact of the particles with the substrate and their subsequent stacking to form the coating [
27,
28]. Individual particles are able to freely decrease their temperature from the molten state to the temperature of the environment [
29] [
30]. Cooling stresses arise from the rapid solidification and the thermodynamic imbalance between the coating and the substrate after the association process, in addition to the effect of the differences in the thermal expansion coefficients of the materials involved [
30,
31,
32]. In
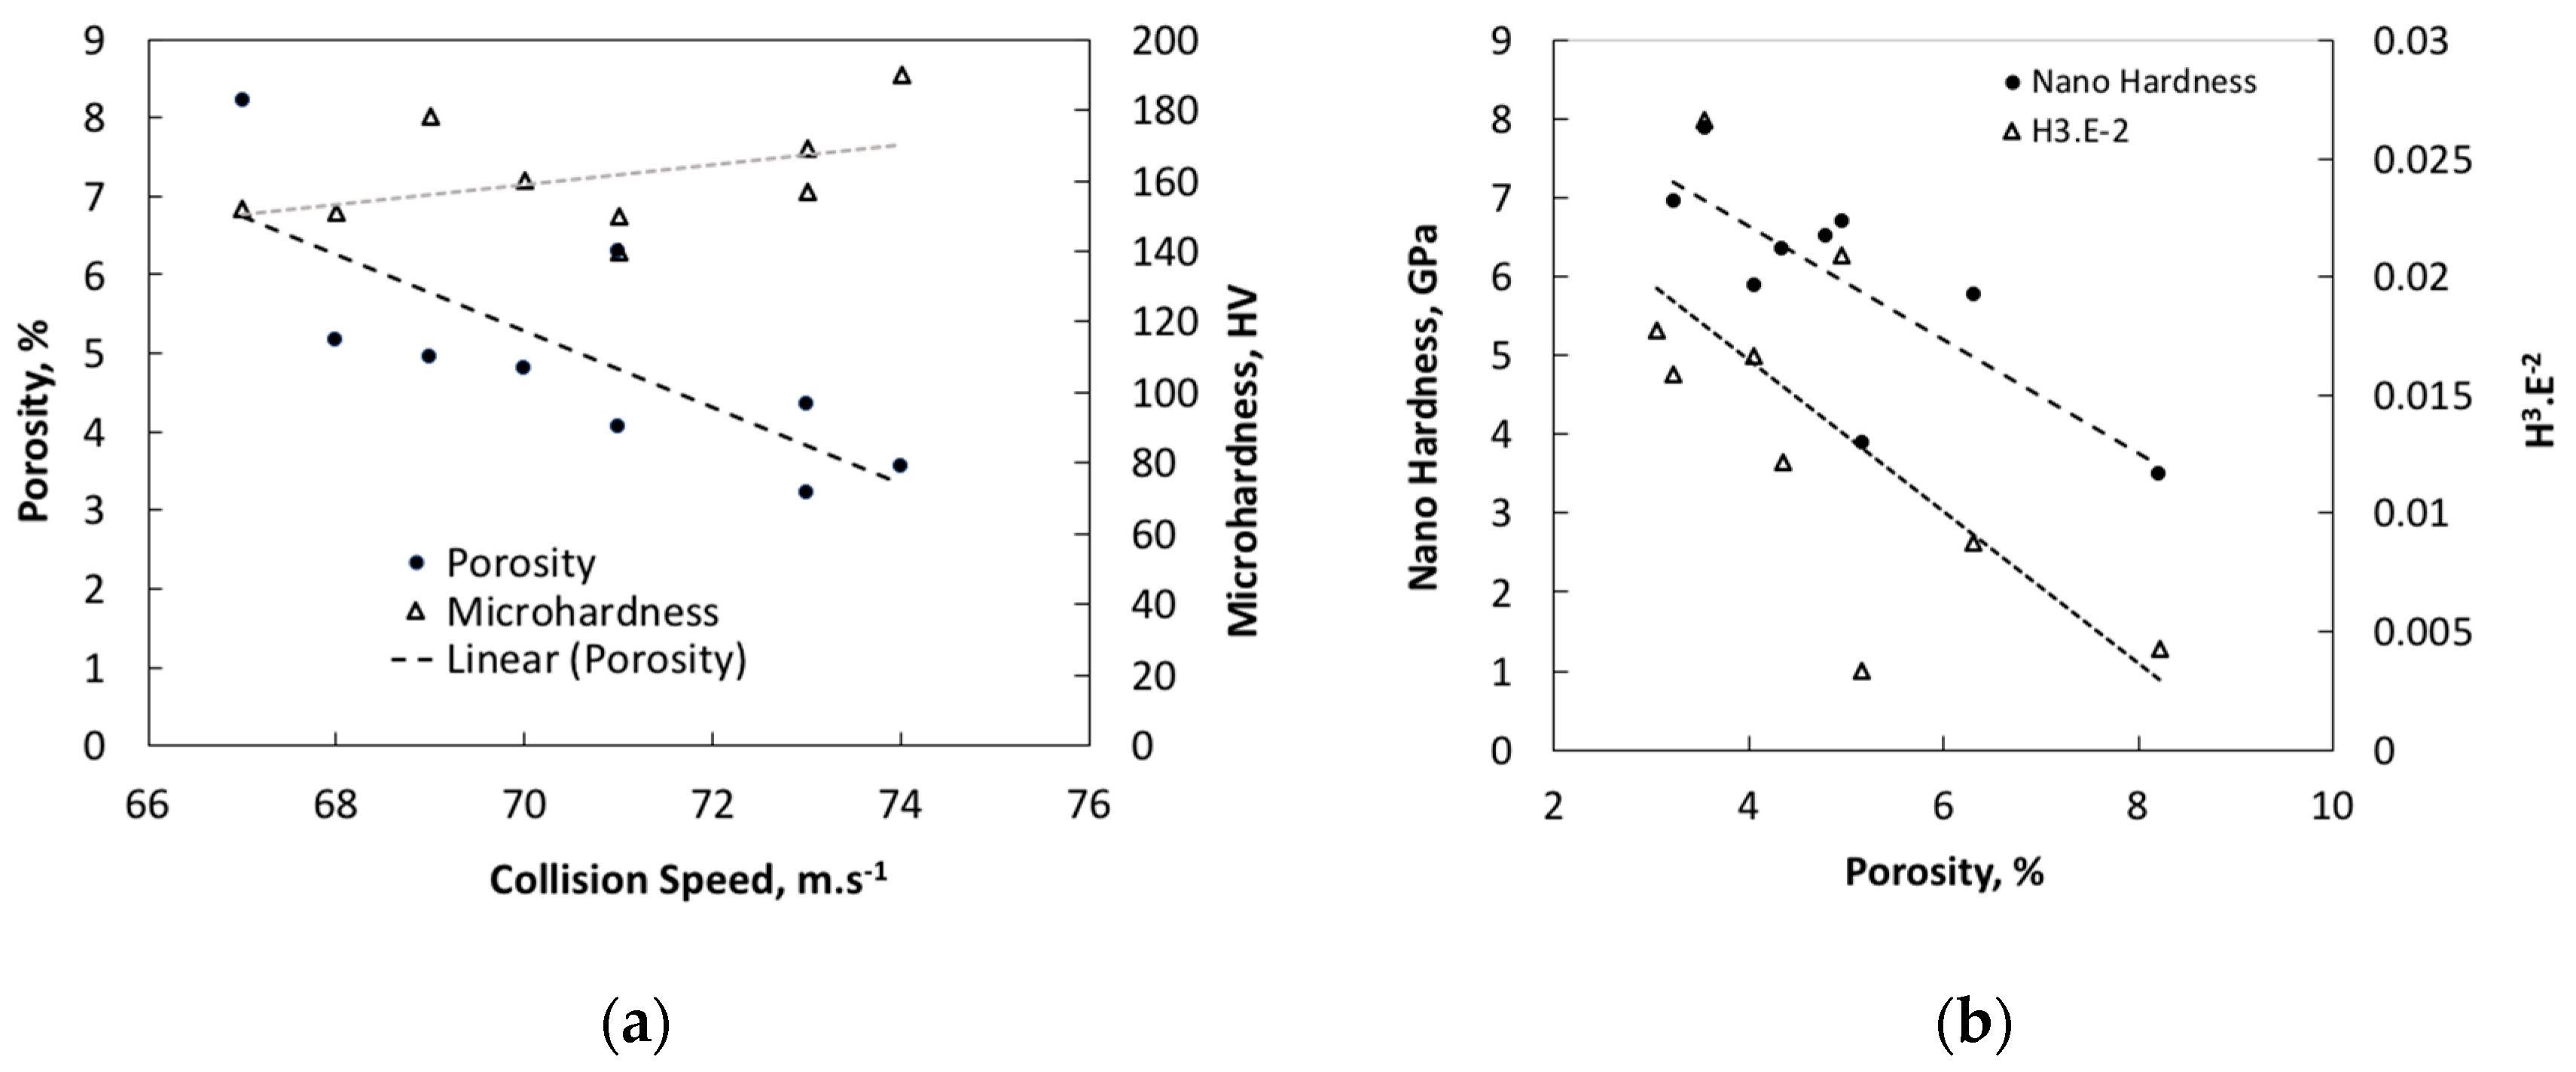
Figure 4a, the variations in the porosity percentages vs. the variation in collision rates can be seen. In general, there is a tendency to reduce the porosity percentages as the collision rates increase. The coatings have porosity percentages between 3.2% and 8.2%; the application with pressures of 331 kPa O
2–69 kPa C
2H
2 exhibited the highest percentage of porosity. With an increase in the particle velocity or the pressure during the synthesis of the coating, a greater atomization of the particles is favored, generating smaller molten droplets, which are accelerated at a higher speed. The impact of these particles allows their deformation on the topography of substrate before its solidification, which produces a denser coating with greater bonding between splats and a less porous structure. Kawaguchi [
33] indicates that the high porosity is due to the low velocity of the drops resulting from its poor acceleration by compressed air in the thermal projection process.
Figure 4a shows the results of the microhardness vs. the particle collision speeds. It can be seen that there are great variations in the hardness in almost all the test. These variations are attributable to the non-uniform morphology, where the indenter can have contact with a zone with defects or fragility [
34]. However, an increase in the hardness of the coating can be seen with an increase in the impact speed. This may be associated with an increase in shot blasting and the kinetic energy of the drops that arrive at substrate, which allows an increase in the deformation of the particles and the bond between splats when the substrate is reached. We found that the hardness increases with a decrease in porosity. In general, it is known that the porosity of a material can act as a stress concentrator, so that it can generate cracks, which worsen the mechanical behavior of the coating. In addition, nanointentation measurements were made in some areas of the splats of the coatings produced.
Figure 4b shows the results of the nanoharness as a function of the porosity and resistance to plastic deformation (H
3/E
2). In general, there is a tendency to increase the hardness of the coatings when reducing the porosity and increasing the H
3/E
2 ratio, which can be explained by the fact that the material has a higher density.
Scratch tests were performed on the cross-sections and not on the surface of the coatings, due to the high roughness, porosity, and thickness [
18,
35]. In
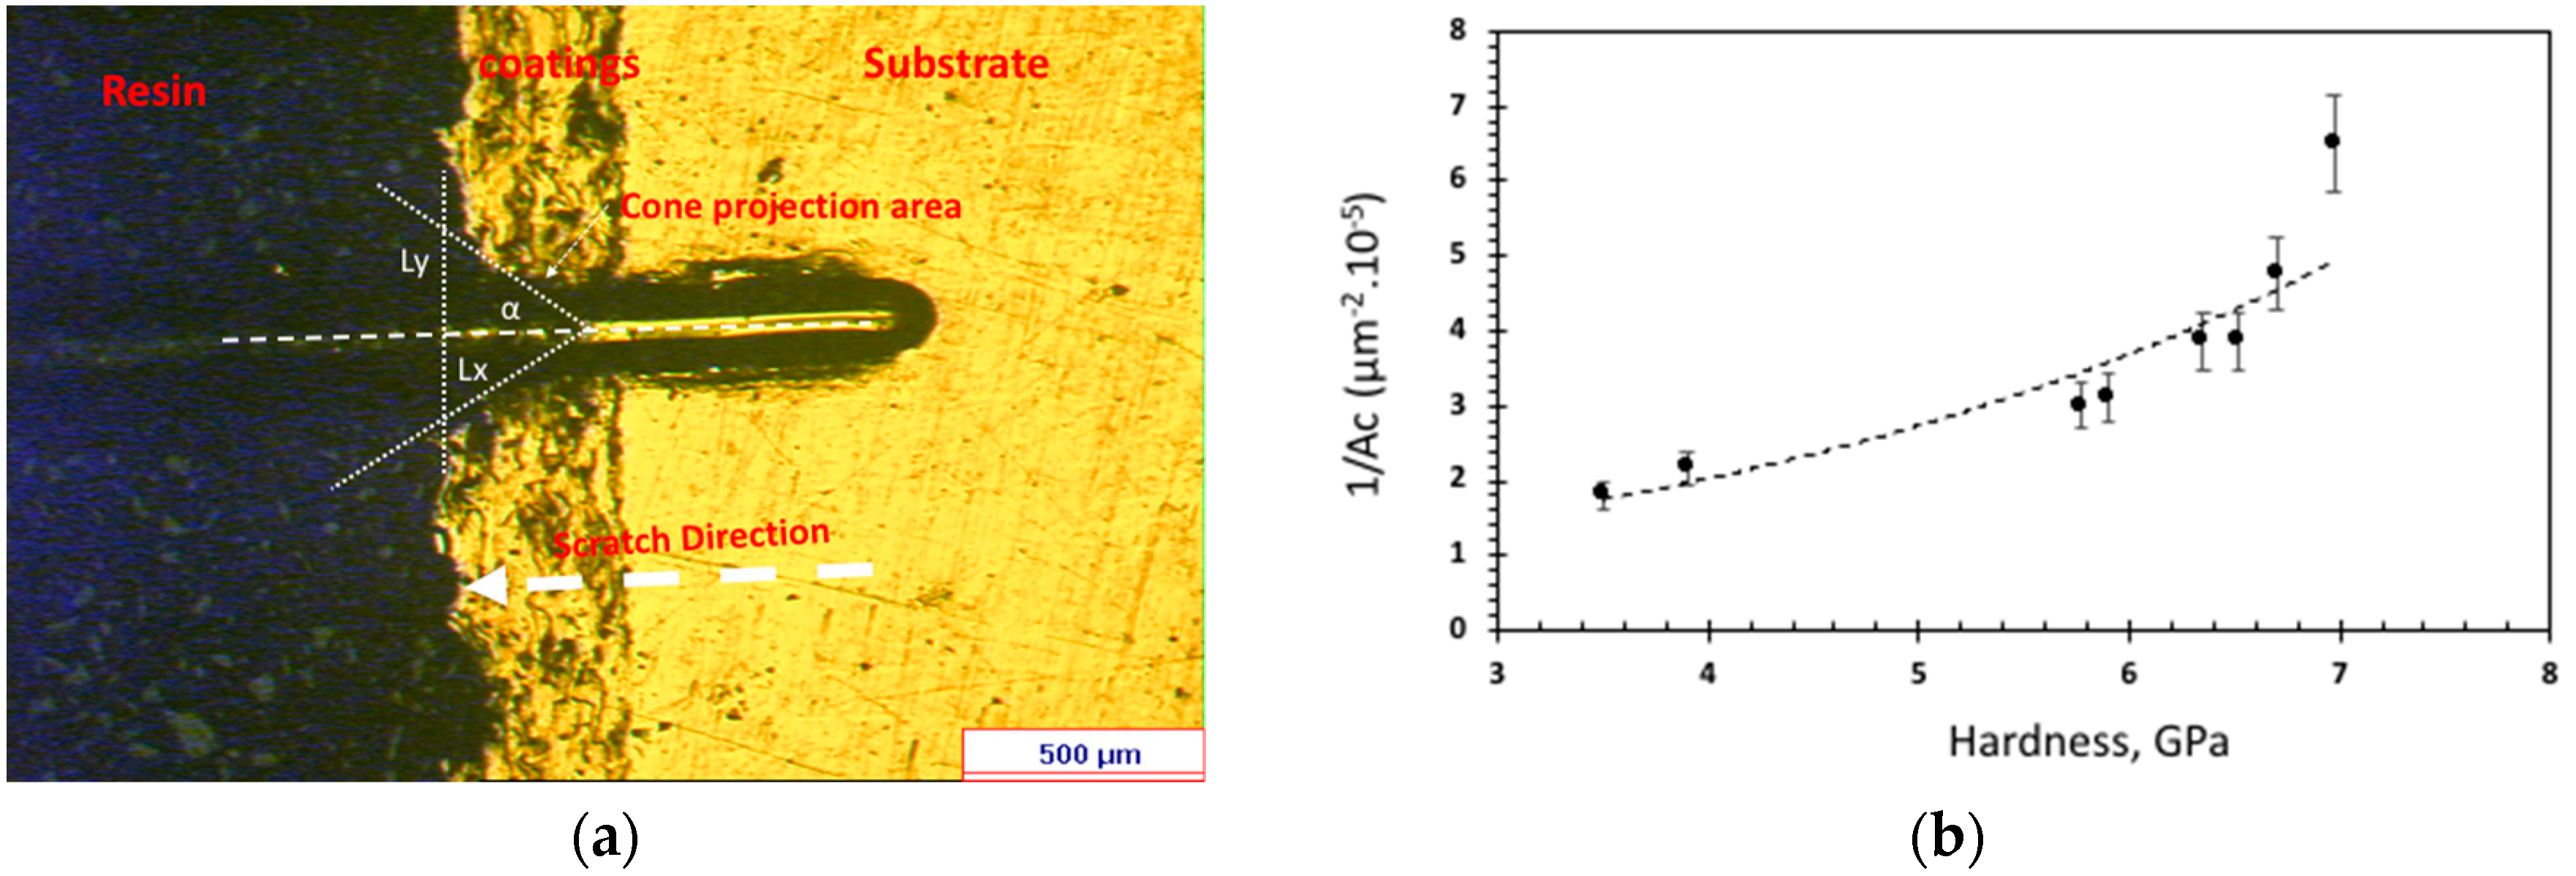
Figure 5a, the wear footprint of the Rockwell C indenter and the projected area of the cone on the surface of the coating can be seen, which was calculated by means of optical microscopy on the coating deposited at 345 kPa oxygen and 69 kPa acetylene. In general, in the scratch track of all the coatings, only a fracture on the surface of the coating was seen. This fracture has a conical shape, which indicates that the deposited coatings exhibited cohesive failure. The formation of cracking in the substrate/coating interface was not evident during the scratch test, indicating that under the conditions of the test, the coating has good adhesion. These results are in agreement with the studies by Wang and Mellali [
36,
37], who studied the effect of substrate roughness on adhesion and concluded that with greater roughness there was increased adhesion, due to a greater surface area and mechanical anchoring. On the other hand, with the movement of the indenter on the coating, radial or arc cracks were generated, which were propagated through the thickness and generated by the abrasive wear induced by the horizontal displacement of the indenter on the surface of the coating, as can be seen in
Figure 5a.
Figure 5b shows the relationship between the inverse of the cone area and the hardness of the aluminum–bronze coatings. These results indicate that better adhesion is achieved on increasing the hardness of the coating; that is, a high degree of hardness could be related to a high level of adhesive/cohesive strength. Considering that this test produced abrasion mechanisms at low speeds, samples with greater hardness may exhibit a better response to reducing the plastic deformation generated by the indenter. On the other hand, porosity has also been seen to be an important parameter for determining the adhesion resistance of the coating. For example, Vencl et al. [
18] found that hardness alone does not allow a prediction of adhesive/cohesive strength in nickel-based coatings deposited via thermal spraying. For this, it is necessary to take into account parameters such as the porosity and the tensile strength of the coatings. Likewise, microcracks, similar to pores, can induce macroscopic failures when a sufficiently high load is applied. It was also observed that small cracks around the scratch path may decrease cohesive resistance in the test [
18,
33]. In the present investigation, a direct relationship between porosity and resistance to cohesion was not found, probably because hardness had a more important effect, due to the fact that it was an abrasion test.
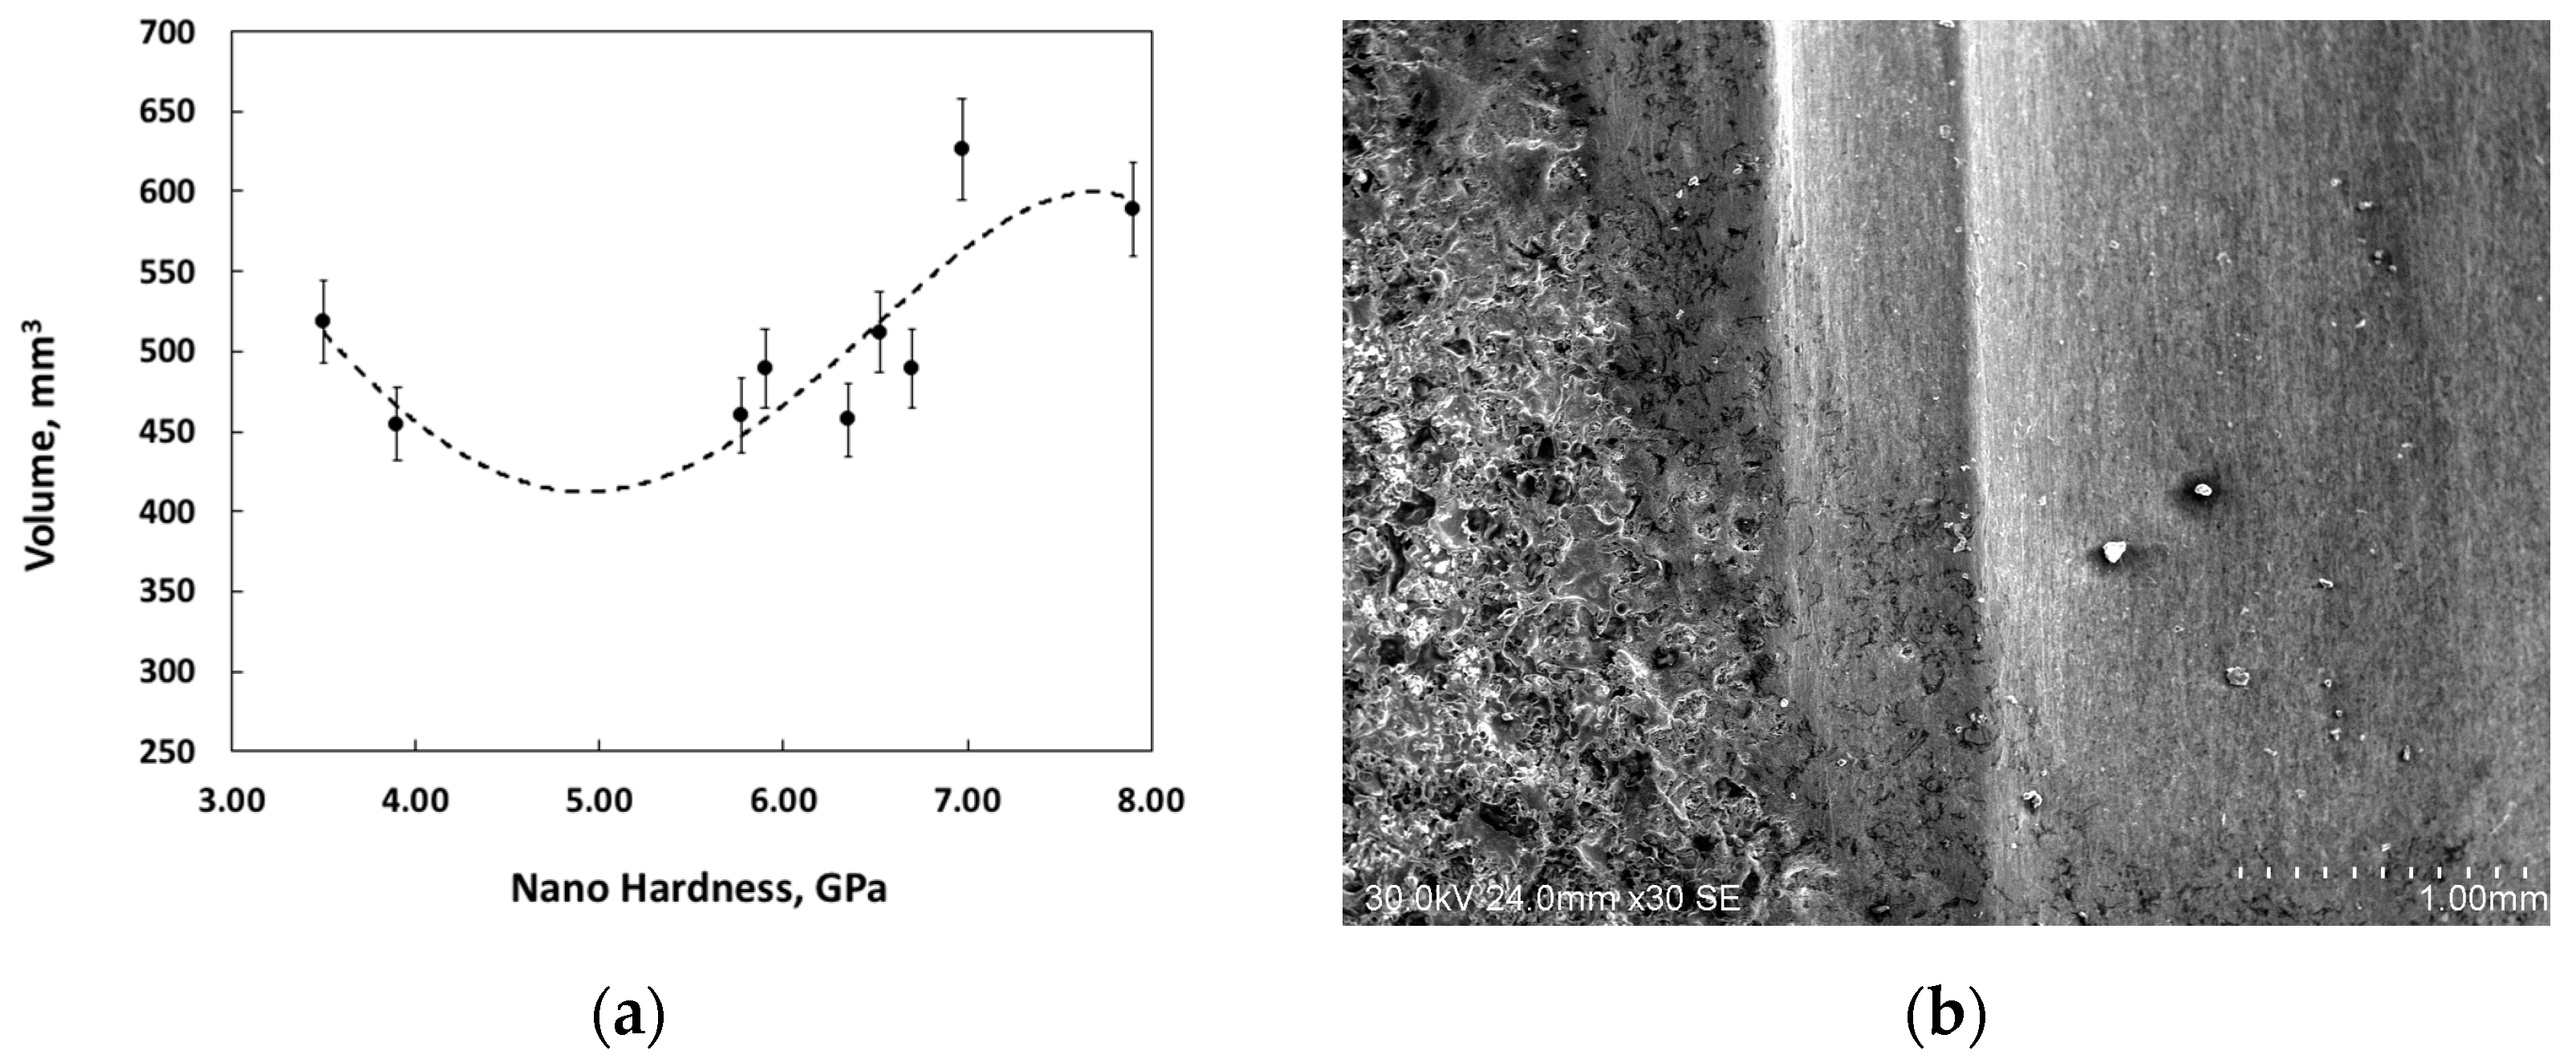
Figure 6 shows the results of the abrasive wear rates vs. the nanohardness using the dry sand rubber wheel method (ASTM G-65). To relate the hardness to the displaced volume, we followed the methodology of Fang [
38] and Gore [
39], who plotted the hardness data on the X axis and the volume data on the Y axis. When there is a high contribution of abrasive wear, the curve exhibits an S shape, varying with the hardness, and when it does not exhibit this shape, the wear mechanism is adhesive.
Figure 6a shows that the results obtained are consistent with that of S and tend in the direction of the axis of hardness, which shows that the contribution by plow wear was high.
Figure 6b shows the SEM micrograph of the wear traces for the sample produced at pressures of 345 kPa oxygen and 69 kPa acetylene. In these images, the distance between grooves or channels in the wear traces is wide, which confirms the abrasive wear mechanism. Plastic deformation and abrasive wear are basically due to the penetration of sand particles and their sliding on the coating. This is why the hardness and crystalline structure are important properties of the material, because they are related to the plastic deformation mechanism of the material. For example, a harder material is more resistant to plastic deformation, while the crystalline structure determines the number of sliding systems of a material, which is the combination of planes and crystallographic directions where dislocations can move more easily. The more sliding systems the structure has, the more ductile the material is [
40]. According to the literature, aluminum bronzes have an FCC structure; thus aluminum-bronze coatings have high ductility [
22]. This type of structure has 12 sliding systems; therefore, it is ductile and exhibits high plastic deformation, which allows abrasive wear in the material. The morphology of the wear trace is in accordance with the reports by Ingrid Kovaříková et al. [
41], T. Kayaba et al. [
42], and Antonio Jauja [
43], who recorded morphologies of wear traces similar to those reported in the present investigation.
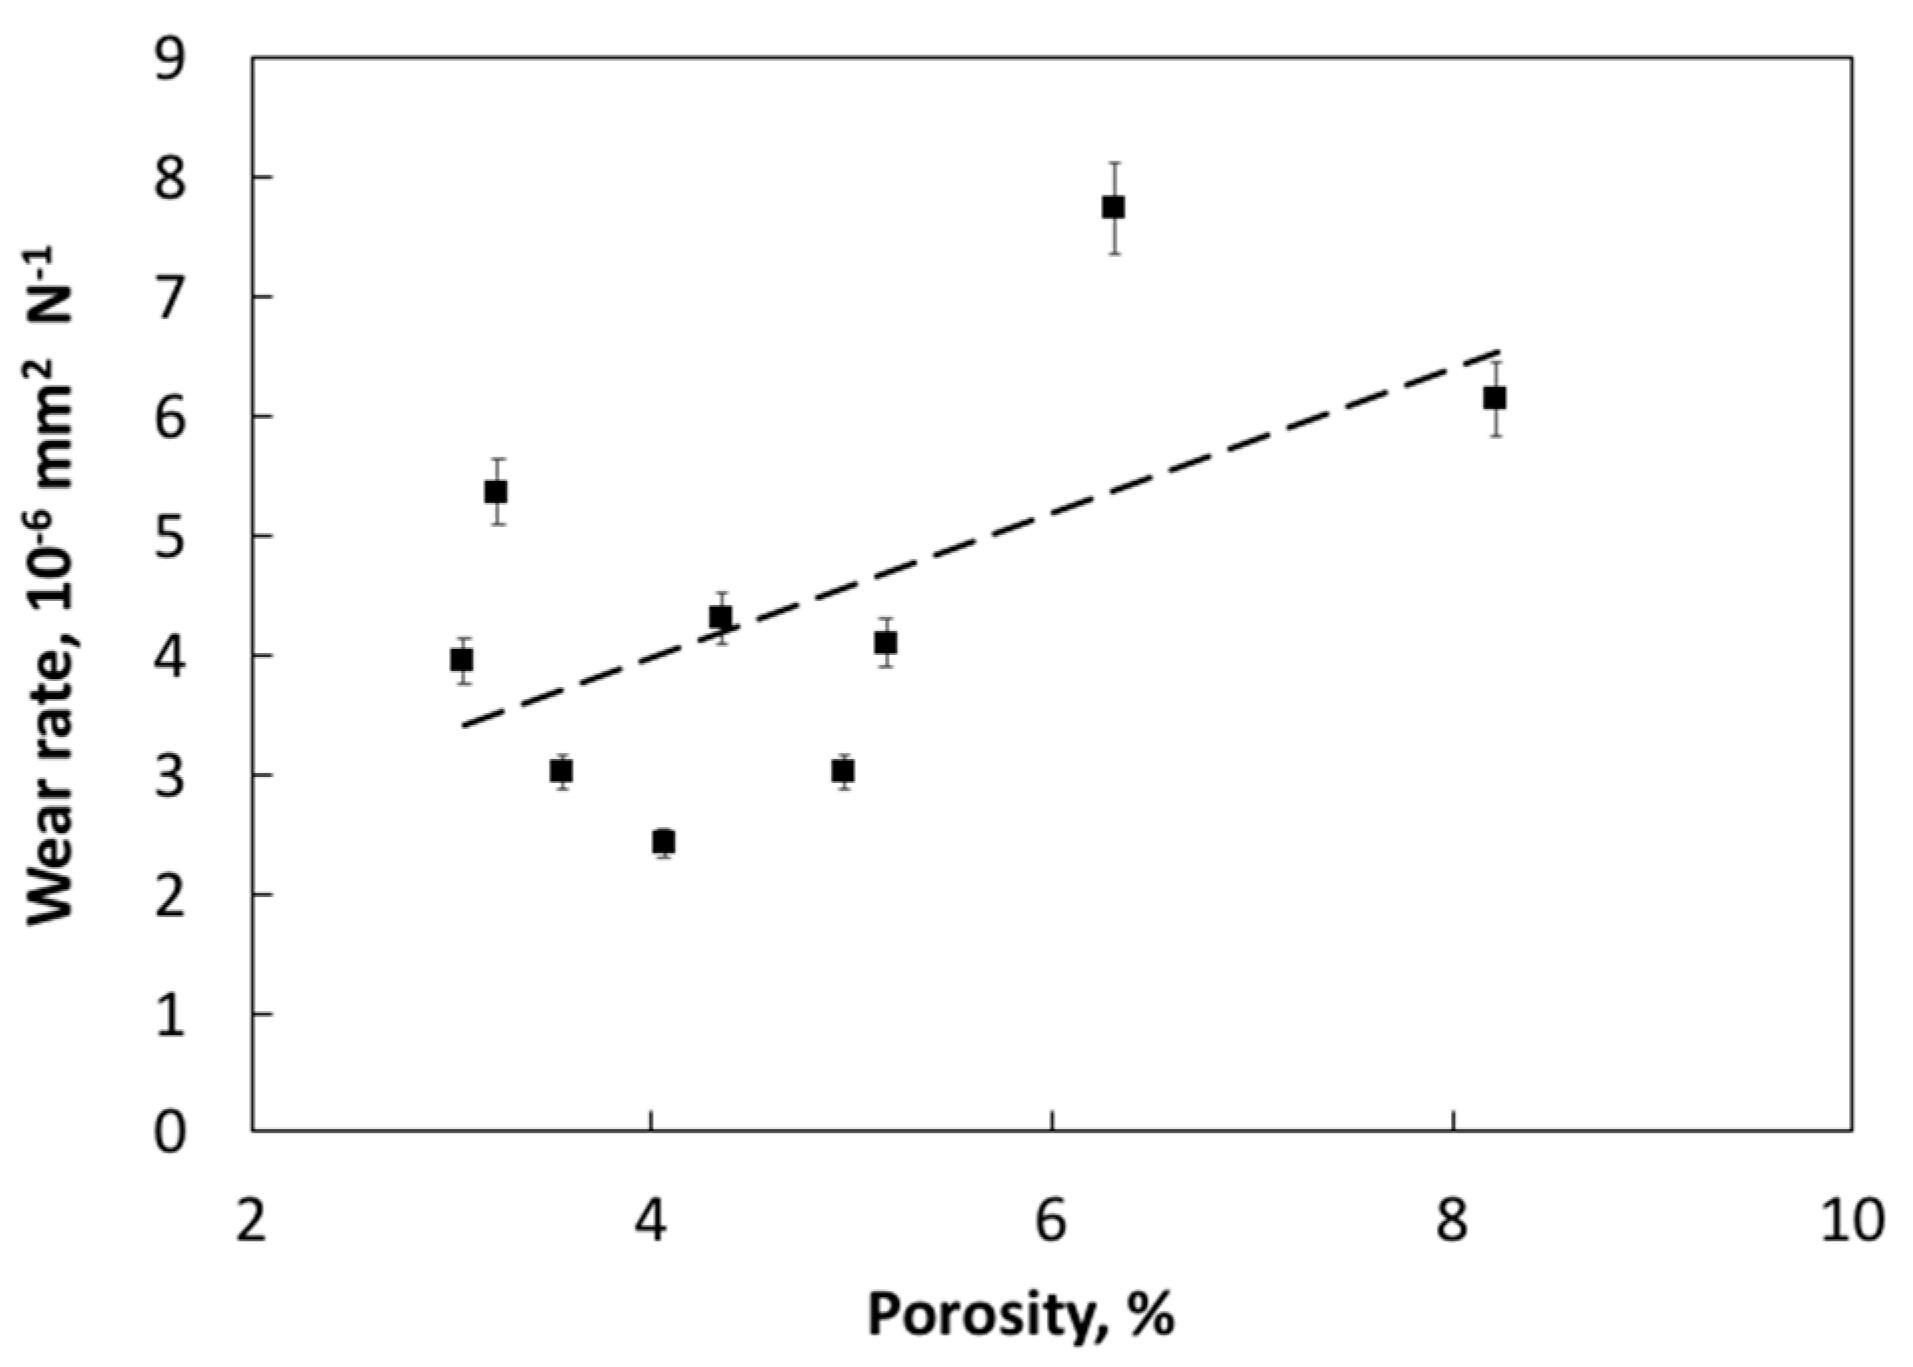
The results of wear rates vs. porosity obtained in the ball-on-disc test are shown in
Figure 7. In general, coatings that have lower wear rates are associated with being less porous. This could be due to the fact that coatings deposited with higher pressures, which exhibited the highest enthalpy rates and high particle velocity, have a less porous morphology. Higher particle velocities result in higher impact energy, which leads to a greater degree of deformation of these particles, producing higher coating densities [
44,
45]. A high porosity of the coatings did not improve the wear resistance, possibly because during the ball-on-disk test, the pores can act as a stress concentrator, generating cracks and further degradation. Similar results were reported by Yasar [
45].
Figure 8 shows the variation of the wear rates and the coefficient of friction (COF) determined with the ball-on-disc test vs. the value of the microhardness of the coatings produced, using an AISI 440 stainless steel ball. In general, it can be seen that the coatings with greater hardness exhibit lower wear rates. For example, the coating produced with 345 kPa O
2 and 97 kPa acetylene had the lowest wear rate, with 1.97 × 10
−6 mm
3 N
−1 mm
−1. In the early stages of this test, the wear resistance of the material was closely related to its strength, plastic deformation, and fracture of the rough edges on the surface of the coating. However, it should be borne in mind that a tribological pair between the coating and the ball is generated with the test time, where the coating or the ball is harder. Therefore, the coating will generate greater deformation and fracture of its rough edges, which could produce particles that act as abrasives, generating a phenomenon of three-body wear, which increases wear rates [
46]. Therefore, harder coatings can improve the abrasive wear resistance generated in this tribological pair. Also,
Figure 8a shows the results of the coefficient of friction versus the microhardness of the coating produced. These results show a clear tendency to reduce friction coefficients as the hardness of the coating increases. This can be explained by the fact that increasing the hardness of the coating reduces the deformation of the asperities and wear residues, which reduces the movement of the surfaces in contact.
Figure 8b shows the SEM micrographs of the wear trace for the sample deposited at 331 kPa O
2 and 83 kPa C
2H
2. In general, areas with soft and adhesive wear, plowing, grooves, and abrasive wear can be seen; also, there are areas that have a polished texture, surface plastic deformation, and material transport. These wear mechanisms are explained in the literature by a combination of several factors. For example, natural adhesion occurs with contact between the tribological pair and the surface irregularities, which generates chemical bonds and welding in localized regions. There is also a detachment of particles or debris that are adhered to the adhesive contact of the two surfaces, which generates three-body abrasive wear, which is shaped like channels and leaves wear traces with parallel grooves [
10]. Finally, during the time of the test, load contacts and cycles and fatigue wear are generated, which, combined with high Hertzian loads, generate a movement of dislocations in the contact subsurface, which produces plastic deformation and accumulation of dislocations in the defects of the coating. On the other hand, there are some defects (pores, inclusions, etc.) of the morphology of the coating that become stress concentrators. The accumulation of stresses and dislocations in these defects favors a hardening by deformation that allows the accumulation of cracks and the degradation of the surface.
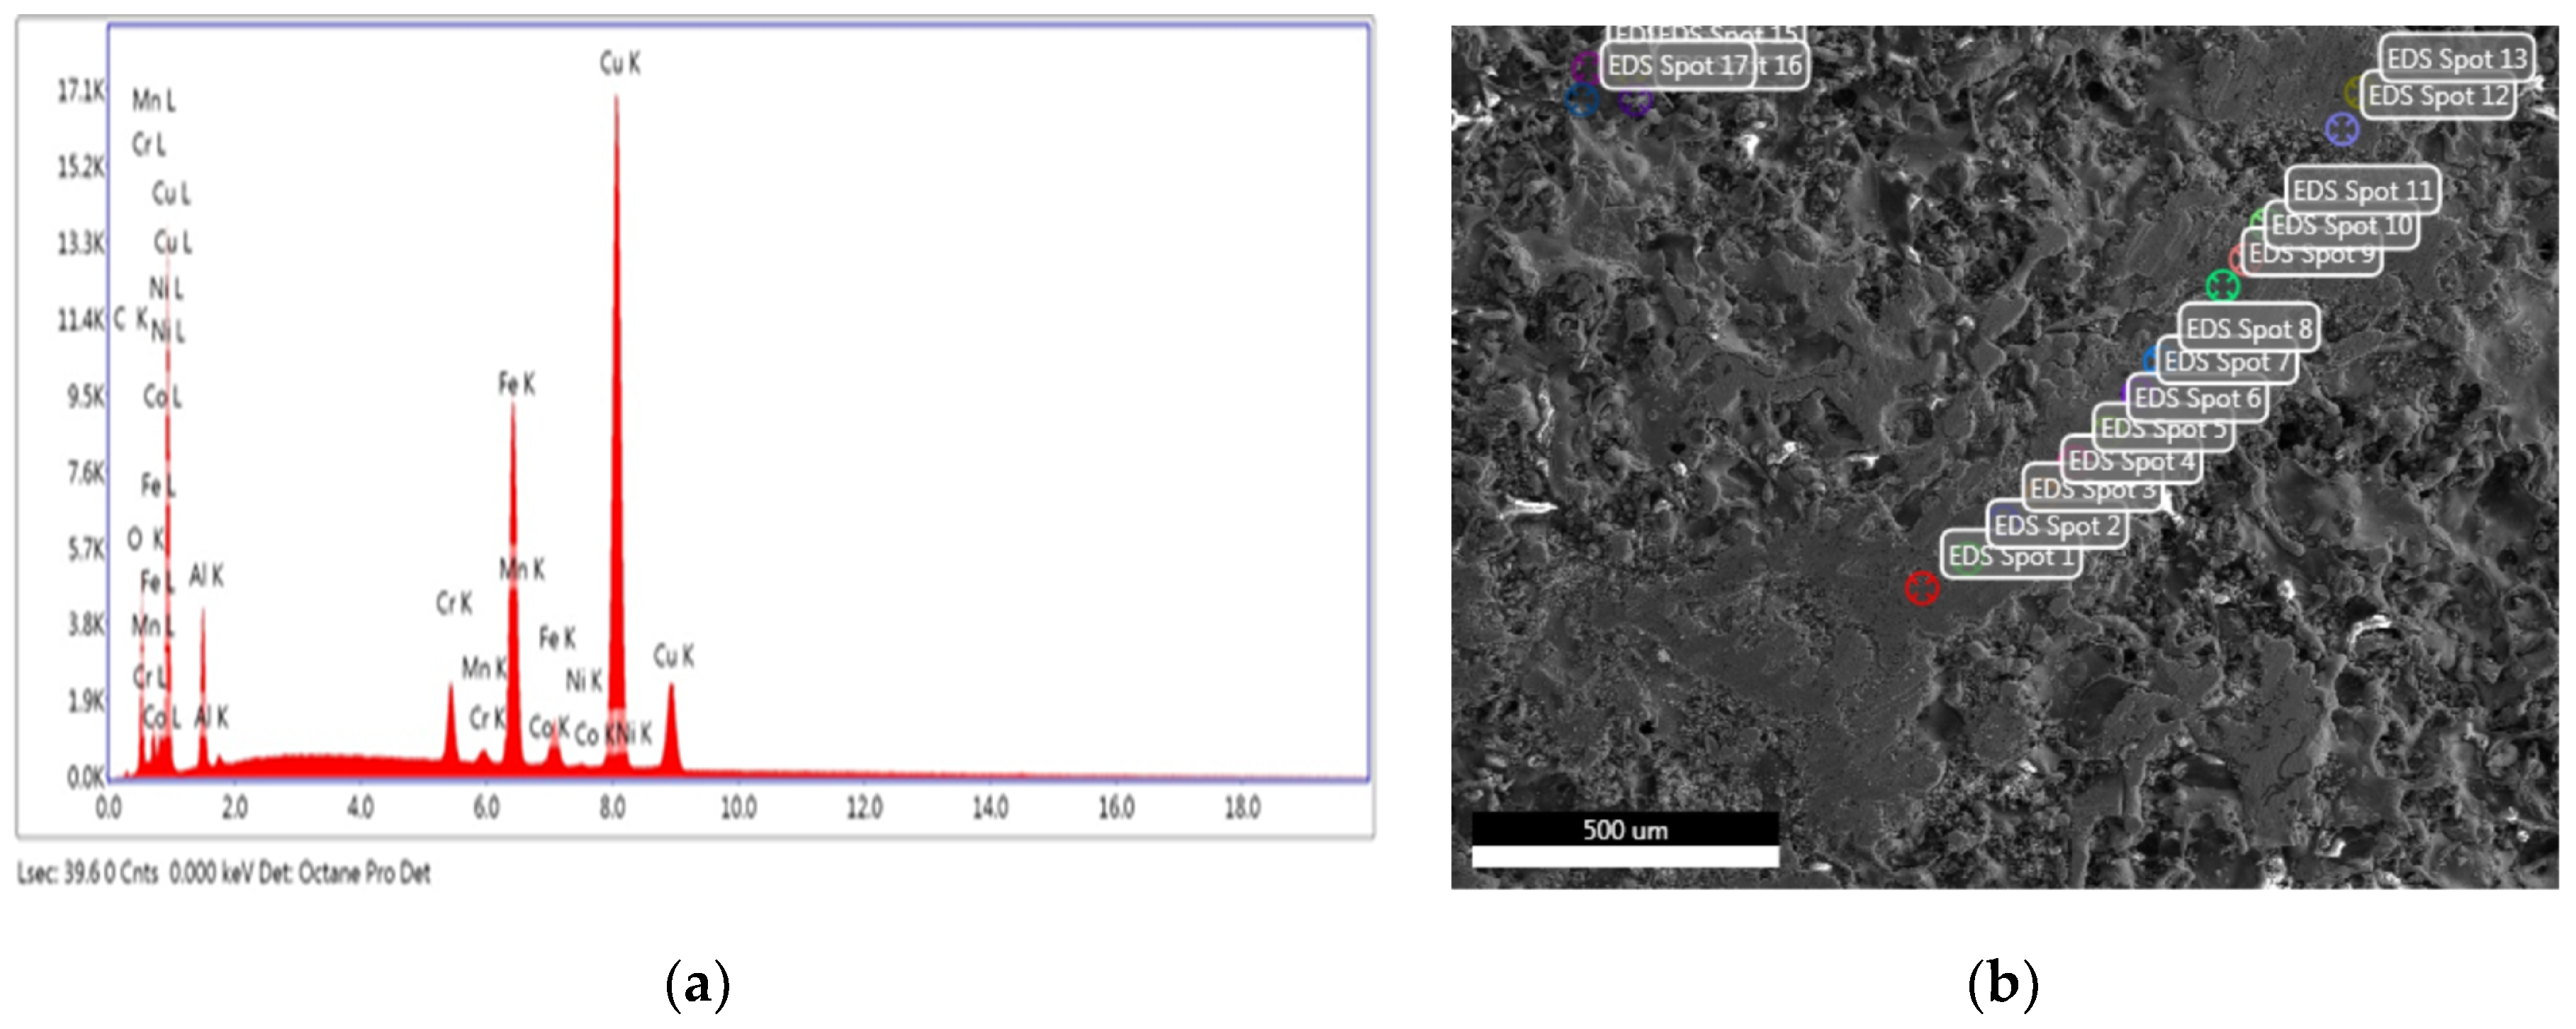
Figure 9 shows the EDS elementary chemical microanalysis of the coating deposited with 345 kPa O
2 and 83 kPa C
2H
2 after the wear test. The presence of chromium and nickel adhered to the coating is evidence that the stainless steel ball was worn and steel elements adhered to the coating surface, which confirms the occurrence of adhesive wear mechanisms. In addition, an increase in the oxygen content in the wear trace was observed, which may be associated with the formation of copper oxides and aluminum oxides formed by the increase in temperature during the contact of the tribological pair and the chemical reaction of the alloying elements of the coating with the air. These oxide layers can generate oxidative wear that can protect the surface of the coating. However, during the time of the test and the number of turns of the disc, a mechanism for removal and growth of the oxide layer can be generated, increasing wear rates. Because the COF in the ball-on-disk test is a response of several mechanisms themselves, the relationship between surface parameters such as roughness, mechanics such as hardness, morphological defects such as porosity, chemical composition, and compound formation or adhesion between the elements of the tribological pair does not allow easily formulating an explanation of these results. This was established by authors such as Gopi et al. [
47], who confirmed that the rate of attrition decreased with increasing hardness. In addition, they confirmed that the wear rate increased with increasing load, while remaining constant with varying speeds. This disparity of results only demonstrates the complexity of the mechanisms involved in explaining the coefficient of friction.
