Article

Rapid Electrodeposition of Fe–Ni Alloy Foils from Chloride Baths Containing Trivalent Iron Ions

1
Key Laboratory of Comprehensive Utilization of Mineral Resources in Ethnic Regions, Yunnan Minzu University, Kunming 650500, China
2
Key Laboratory of Resource Clean Conversion in Ethnic Regions of Education Department of Yunnan, Yunnan Minzu University, Kunming 650500, China
*
Author to whom correspondence should be addressed.
Coatings 2019, 9(1), 56; https://doi.org/10.3390/coatings9010056
Submission received: 12 December 2018 / Revised: 6 January 2019 / Accepted: 14 January 2019 / Published: 17 January 2019

Abstract

:
This work presents the rapid electrodeposition of Fe–Ni alloy foils from chloride baths containing trivalent iron ions at a low pH (<0.0). The effect of the concentration of Ni2+ ions on the content, surface morphology, crystal structure, and tensile property of Fe–Ni alloys is studied in detail. The results show that the co-deposition of Fe and Ni is controlled by the adsorption of divalent nickel species at low current density and the ionic diffusion at high current density. The current density of preparing smooth and flexible Fe–Ni alloy foils is increased by increasing the concentration of Ni2+ ions, consequently the deposition rate of Fe–Ni alloy foils is increased. For example, at 0.6 M Ni2+ ions, the current density can be applied at 50 A·dm−2, along with a high deposition rate of ~288 μm·h−1.

1. Introduction

Electrodeposition of the Fe–Ni alloy is receiving constant attention because the method is considered as easy and cost-effective and Fe–Ni alloys have many desirable performances in the mechanical, magnetic, electrical, corrosion, and wear-resistant fields [1]. The performance could be further improved by introducing heterogeneous particles (for example SiC, Al2O3, ZrO2 and Si3N4) into the Fe–Ni matrix [1,2].
Chloride [3,4,5,6], sulfate [5,7], fluorborate [8,9], and sulphamate [10,11,12] baths have been explored and reported in order to achieve electrodeposition of the Fe–Ni alloys. However, there are some shortcomings associated with these baths. In the chloride bath, a high temperature, above 85 °C, was applied to obtain ductile foils [3], which will result in massive evaporation of corrosive hydrochloric acid. It is difficult to carry out at a high current density (usually at a high deposition rate) in the sulfate bath. The fluorborate bath has some drawbacks such as high cost and corrosivity [1] and the need for fluoride wastewater treatment. Azodisulfonate, which comes from the hydrolysis of sulphamate, introduces a sulfur impurity into Fe–Ni alloys [1]. In addition, in baths described above, the applied current density in the chloride baths is usually higher than other baths, but it is still low, for example, only 10 A·dm−2 [3], 0.8 A·dm−2 [4], 2 A·dm−2 [5] and 0.5 A·dm−2 [6]. However, it is desirable for the electrodeposition process of Fe–Ni alloy foil to be carried out with a high current density, needed for a high production efficiency.
It is usually considered that a key point is the control of Fe3+ ions in the above baths, because the formed insoluble Fe(OH)3, especially at high pH (>2), could be incorporated into deposits [4], resulting in serious performance degradation [13]. Complexing agents, such as citric acid and glycolic acid, and reducing agents, such as L-ascorbic acid, I and V2+ ions were used to inhibit the formation of Fe(OH)3. However, it must be noted that the oxidation reaction of Fe2+ to Fe3+ by the dissolved oxygen in the baths is unavoidable, because of a more positive potential for oxygen reduction. Thus, the baths based on Fe2+ ions are thermodynamically unstable and consequently, it is difficult to control the electrodeposition process.
In fact, Fe3+ ions can exist in the baths with low pH according to the solubility product (Ksp = 1.1 × 10−36) of the following reaction.
Fe ( OH ) 3   Fe 3 + + 3 OH
At [Fe3+] = 1 mol·L−1 (M), the Fe(OH)3 precipitation does not occur when the pH is lower than 2.01. Of course, the bulk solution pH should be far lower than the value because the surface pH could increase due to hydrogen evolution reaction (HER) during Fe–Ni alloy electrodeposition. The existence of HER results in low current efficiency. It is very worthwhile considering that the standard potential for the reduction of Fe3+ to Fe0 is −0.0337 V, more positive than that of Fe2+ to Fe0 (−0.44 V) and more negative than that of H+ to H2 (0 V). In our previous work, Fe foils had been electrodeposited from the chloride bath containing Fe3+ ions [14]. However, a study on the Fe–Ni alloy foils from the bath containing Fe3+ ions is rather limited. In this work, Ni2+ ions were added into the chloride bath to electrodeposit Fe–Ni alloy foils. The effect of the concentration of Ni2+ ions and current density on the electrodeposition of Fe–Ni alloy foils and their structure and mechanical property will be discussed.

2. Experimental

2.1. Electrodeposition of Fe–Ni Alloy Foils

The bath for electrodeposited Fe–Ni alloy foils consisted of 2.25 M FeCl2·4H2O, 0.75 M FeCl3·6H2O, 0.25 M H3BO3, 4 mL/L HCl (36 wt %–38 wt %), and NiCl2·6H2O with different concentrations ranging from 0.1 to 1.0 M. The CaCl2 salt improves the bath boiling point and consequently retards the evaporation of water, but it can cause the plating solution to overflow along the beaker wall. Therefore, it was not used in the above baths. The bath pH was not adjusted further and was lower than 0.0. The bath temperature was maintained at 80 ± 1 °C with a thermostat, which is lower than that of the electroforming Fe foil [3,14]. To avoid significant changes in the solution composition over the course of several experiments, an electrolyte would not be used further if electrolyzed over 10 Ah/L. All chemicals were of analytical reagent grade and deionized water was used.
Fe–Ni alloy foils were galvanostatically electrodeposited on pure Ti circle plates with a diameter of 18 mm in a single-compartment glass cell with a two-electrode configuration using a DC power supply. An IrO2/Ti plate was employed as an inert anode and its exposed area is equal to that of a cathodic Ti plate. The current density was tuned between 10 and 80 A·dm−2 and the total number of consumed coulombs was kept at a constant of 1200 C. Before each electrodeposition, the Ti plates were finished with waterproof abrasive paper (1000 Cw) after which the backs of the plates were protected using insulating tape. After electrodeposition, the resultant Fe–Ni/Ti circle plates were rinsed immediately using deionized water and then dried in air. After separation from the Ti plates, the weight and thickness of Fe–Ni foils were directly measured using an analytical balance and a micrometer, respectively, or if not completely separated, they were calculated according to the difference of weight and thickness of Ti circle plates after and before electrodeposition, respectively. Subsequently, they were preserved in a plastic bag.

2.2. Characterization

The phase structure of Fe–Ni foils on Ti circle plates was characterized by a powder X-ray diffractometer (XRD, D8 Advance, Bruker, Billerica, MA, USA) with Cu Kα radiation operating at 40.0 kV and 40.0 mA over 2θ-range of 30°–100°.
The morphologies of the electrodeposited Fe–Ni alloys separated from Ti circle plates were investigated by scanning electron microscopy (SEM, Nova 450, FEI, Hillsboro, OR, USA) and their chemical composition was analyzed using energy-dispersive X-ray spectroscopy (EDX). The collection time for EDX data was 50 s.

2.3. Tensile Tests

Figure 1a shows the plan of the Ti template. A Ti plate was cut into the shape using a wire-cutting machine, then was sealed using transparent epoxy and polished with waterproof abrasive paper (1000 Cw). The Ti template sealed by epoxy is shown in Figure 1b and its exposed area is 0.107 dm2. The Fe–Ni alloy foils with a thickness of 50 μm were electrodeposited onto the Ti template. As shown in Figure 1c, there is dendritic growth of the Fe–Ni alloy along the edges of the Ti template; however, the middle dumbbell Fe–Ni alloy foil is smooth and uniformly thick. The Fe–Ni alloy foil was carefully separated from the Ti template and is shown in Figure 1d. The resultant dumbbell-shaped Fe–Ni alloy foil samples possess a gauge size of 25 mm × 10 mm × 50 μm (length × width × thickness). The tensile tests of dumbbell-shaped Fe–Ni alloy foils were carried out at room temperature and a strain rate of 0.2 mm·min1 using an electromechanical universal testing machine (CMT4104, MTS systems (China) Co., Ltd, Shenzhen, Guangdong, China).

3. Results and Discussion

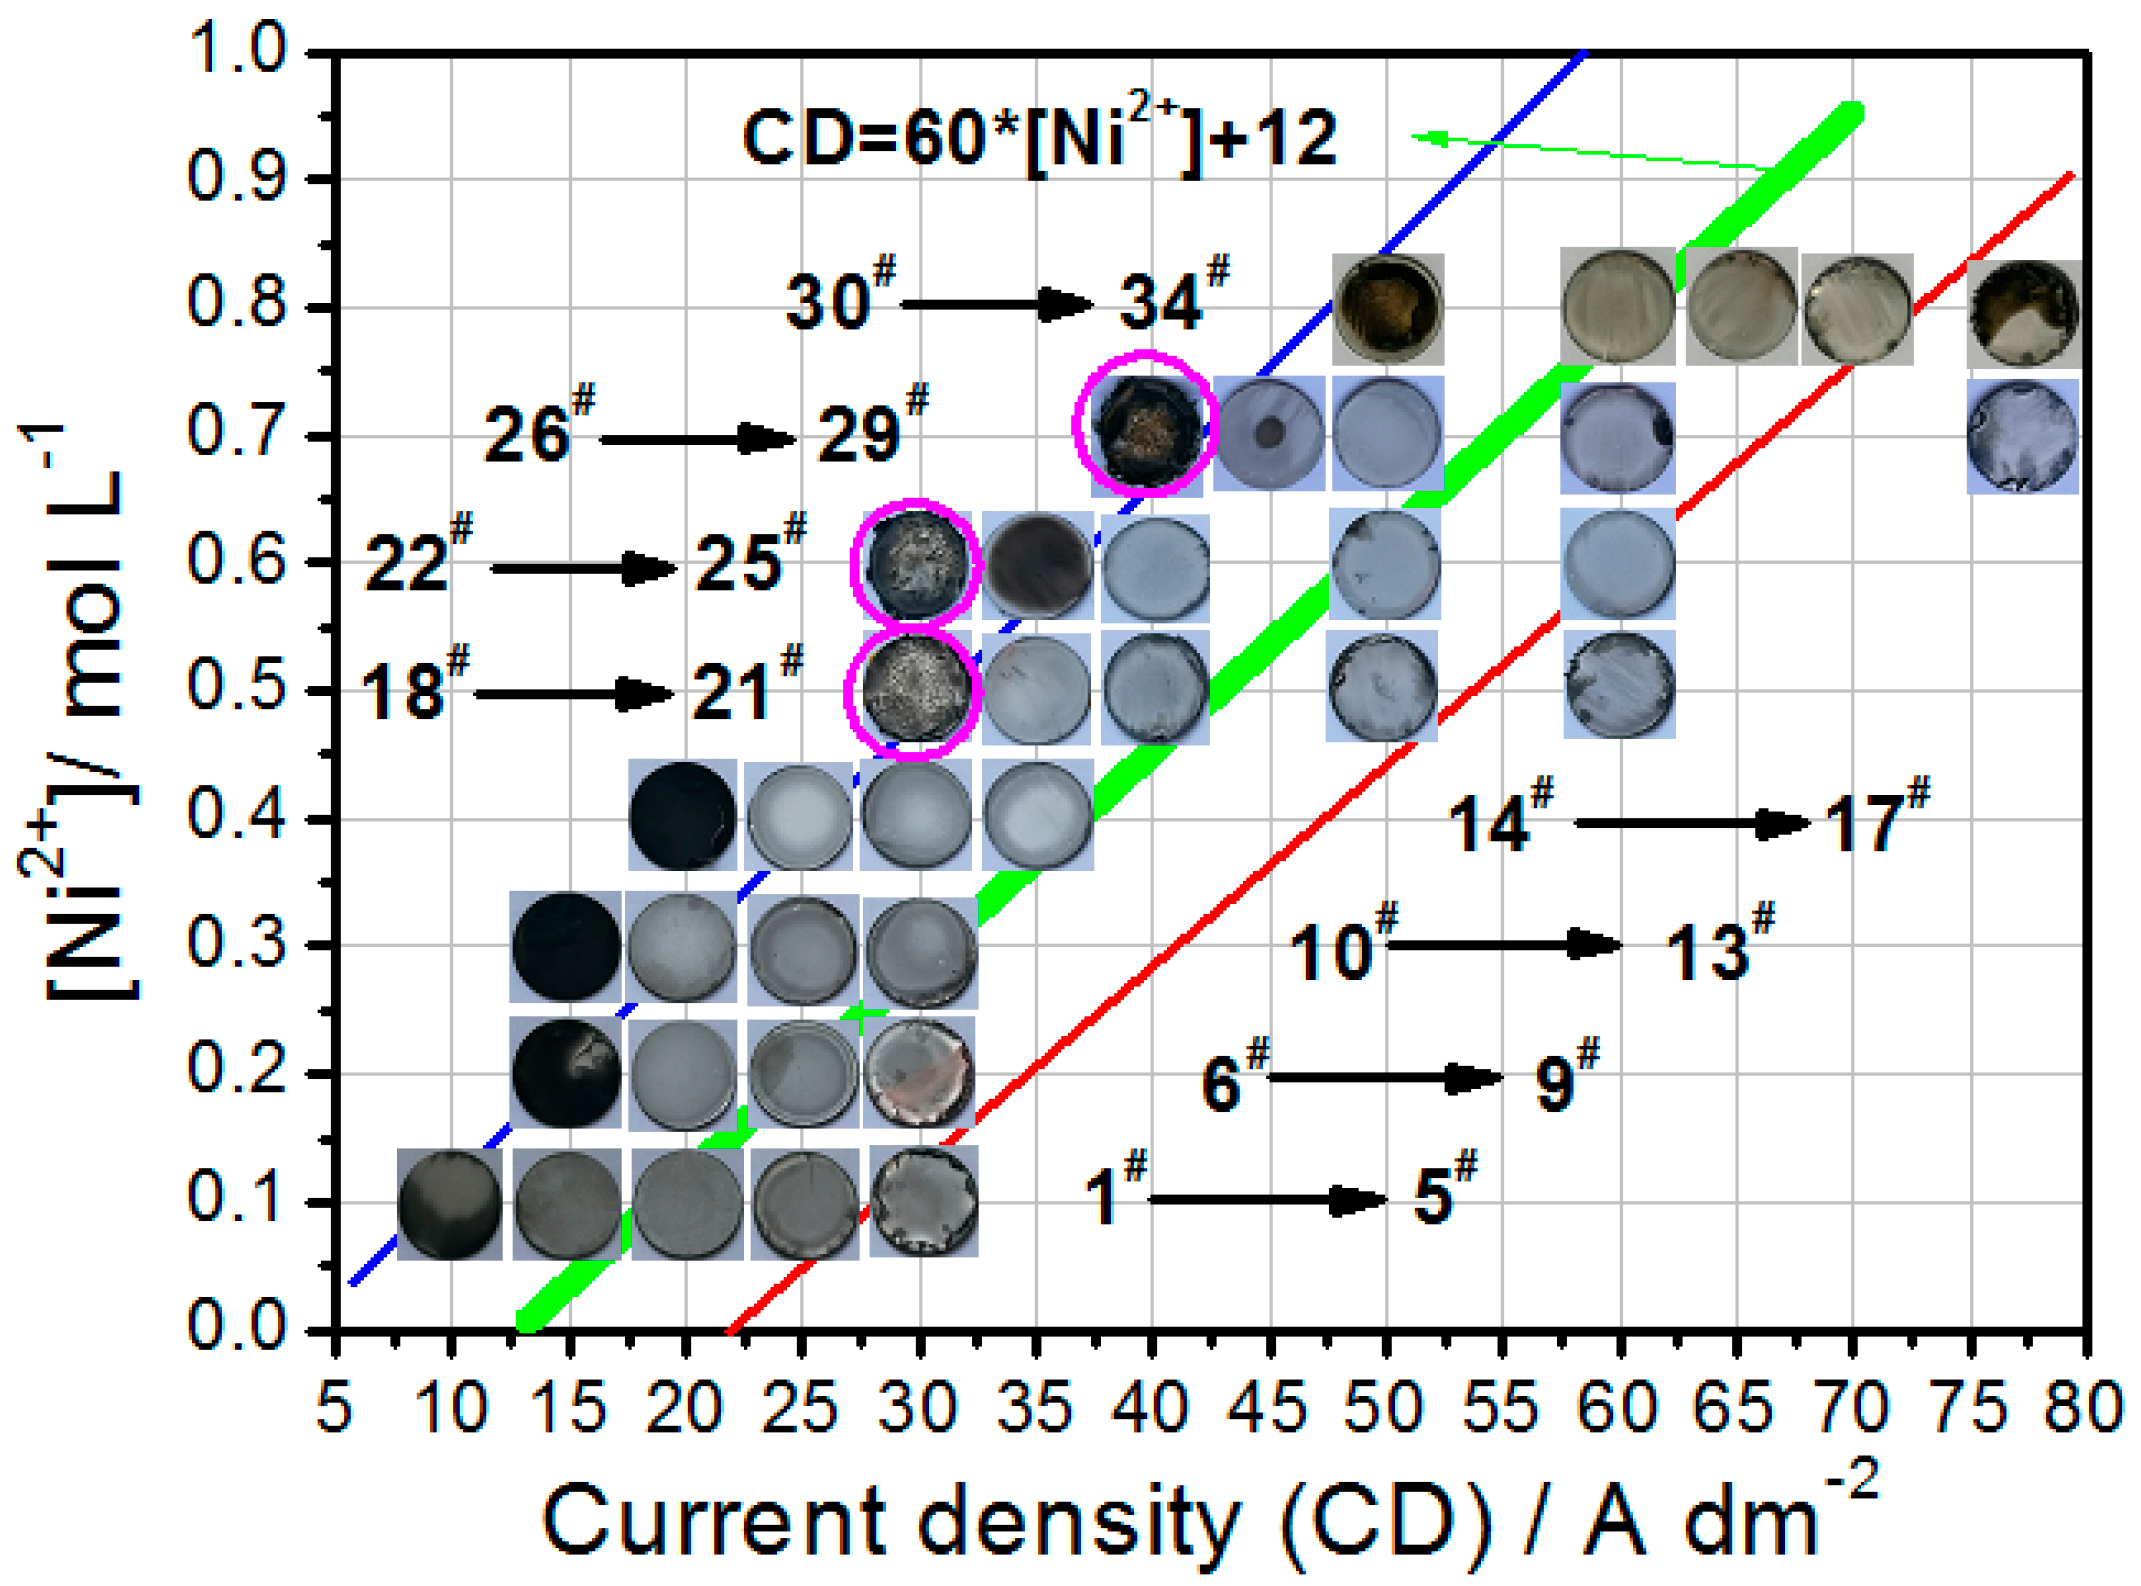
3.1. Electrodeposition of Fe–Ni Alloy Foils

The current density (CD) range of the electrodeposition of Fe–Ni alloy foils was selected by tuning the applied current in the chloride baths containing different concentrations of Ni2+ ions (CNi) from 0.1 to 0.8 M. The photographs of the Fe–Ni alloy samples numbered 1# to 34# are shown in Figure 2. For the 0.1 M Ni2+ ions bath, it can be seen from Figure 2 that the 1# sample presents a black and gray appearance while 2# to 5# samples present a grayish white appearance. It is difficult to completely separate the black and gray Fe–Ni alloy foil (the 1# sample) from the Ti circle plates, because the foil is brittle. It can be seen form the photograph of the 5# sample that the edge is peeling. Hence, it is considered that the CD range of the electrodeposited Fe–Ni foils in the bath containing 0.1 M Ni2+ ions is between 15 and 25 A·dm−2. A similar appearance of evolution from black to grayish is also observed in other baths, as shown in Figure 2. However, the CD range of electrodeposited foils shifts to higher values along with the increase of CNi. The relationship of the CD range and the concentrations of Ni2+ ions can be estimated according to the following equation.
CD = 60   × C Ni + 12 ± 5
where, CD is current density, A·dm−2, and CNi is the concentration of Ni2+ ions, mol·L−1 (M). Below the CD range, the electrodeposited Fe–Ni alloy films were black, brittle, and even cracked and peeling. Over the CD range, the cracked and even peeling Fe–Ni films were obtained. The samples circled in Figure 2 are almost completely exfoliated and no further analysis is required. Therefore, they are not numbered.
The ratio of the electrodeposited Fe–Ni alloy weight to the consumed quantity of electricity is defined as WQ. The relationships between WQ and current density are shown in Figure 3a. It can be seen that the WQ increases along with current density in almost any bath and increases along with CNi at almost any current density. The maximum WQ value is 0.52 g·A−1·h−1 appearing at 65 A·dm−2 from the bath containing 0.8 M Ni2+ ions. The hydrogen evolution reaction (HER) is weak during the electrodeposition of Fe–Ni alloys because almost no gas is observed near the cathodes, especially below 50 A·dm−2. Even so, compared with any of the three electrochemical equivalents of 0.6943 g·A−1·h−1 for Fe3+ to Fe0, 1.042 g·A−1·h−1 for Fe2+ to Fe0, 1.095 g·A−1·h−1 for Ni2+ to Ni0, the value of WQ is lower. The results suggest that during the electrodeposition of the Fe–Ni alloy, the reduction reaction of Fe3+ to Fe2+ occurs and is the main process at low current density because of the positive standard potential.
Fe 3 + + e Fe 2 +             + 0.771   V ( standard   potential )
The bubbles appeared on the anode until the anodic current exceeded 60 A·dm−2, which indicated the main oxidation reaction Equation (4) on the IrO2/Ti anode is the reverse process of Equation (3), especially at low current density.
Fe 2 + e Fe 3 +
Figure 3b shows the relationship between the deposition rate and current density. The current density was selected according to Equation (2). It can be seen that the relationship of the deposition rate and current density is linear. At 50 A·dm−2 in the bath containing 0.6 M Ni2+ ions, the deposition rate is up to 288 μm·h−1, implying high production efficiency for the electrodeposition of Fe–Ni alloy foils.

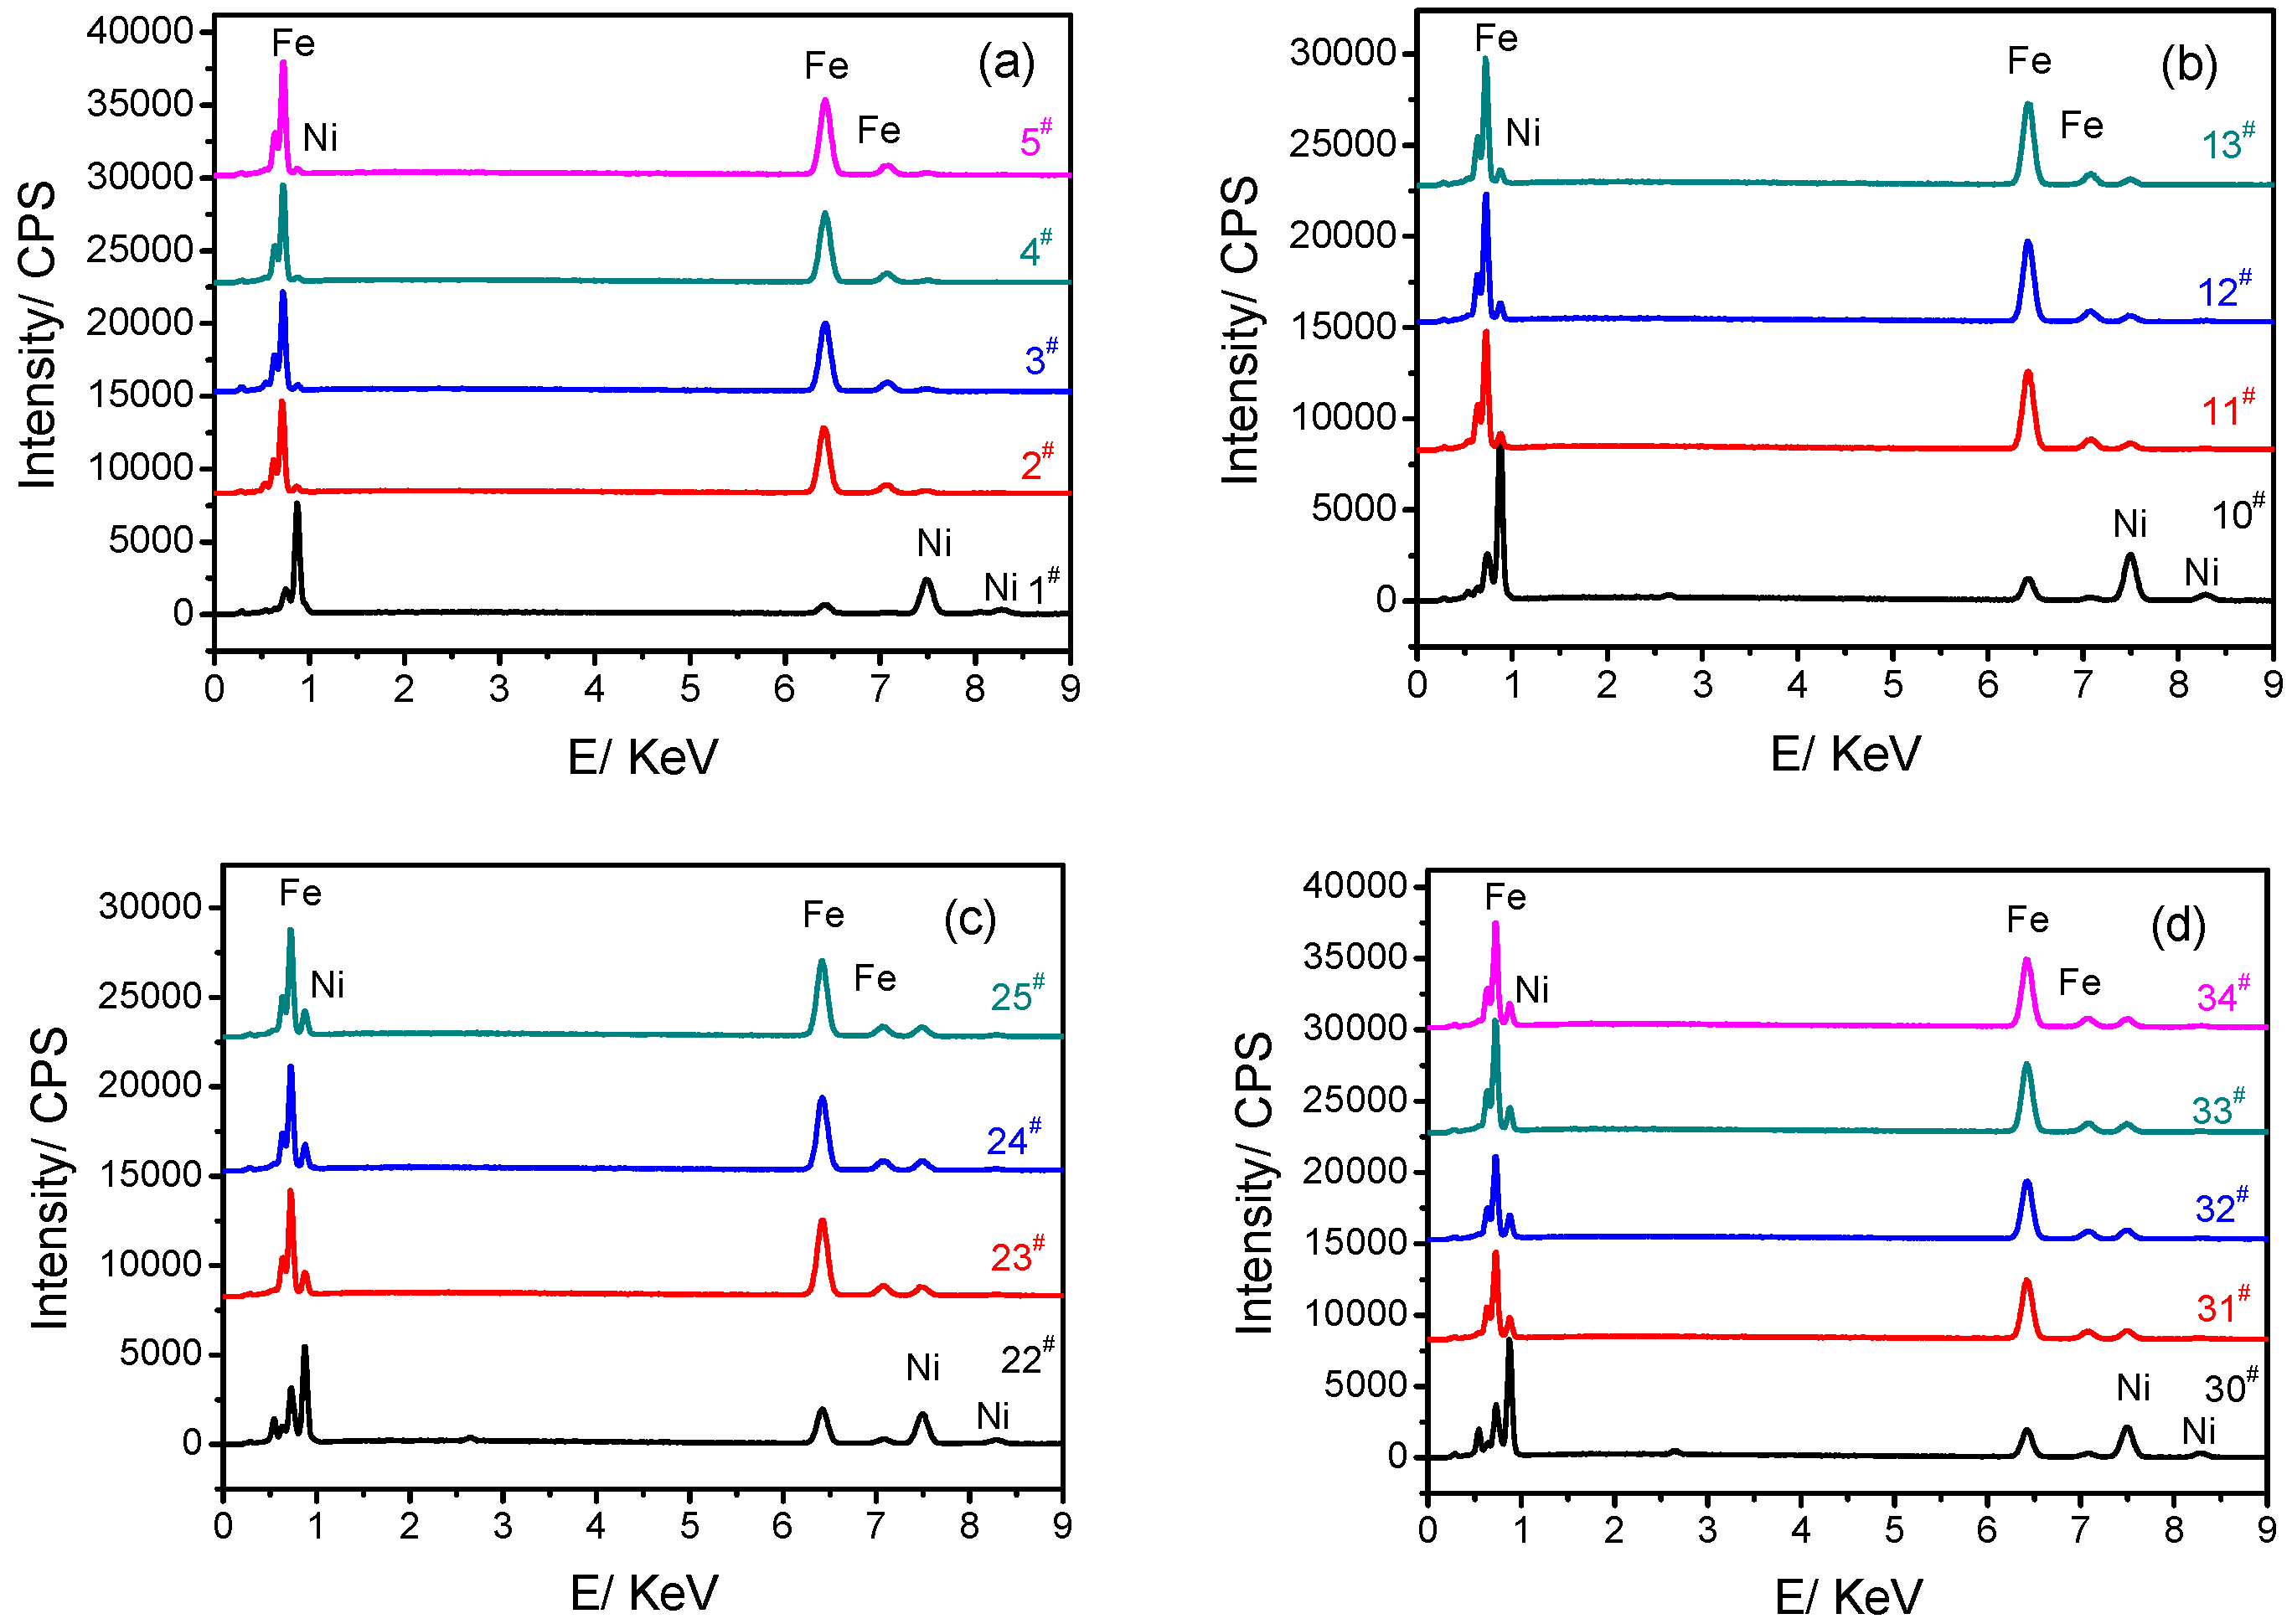
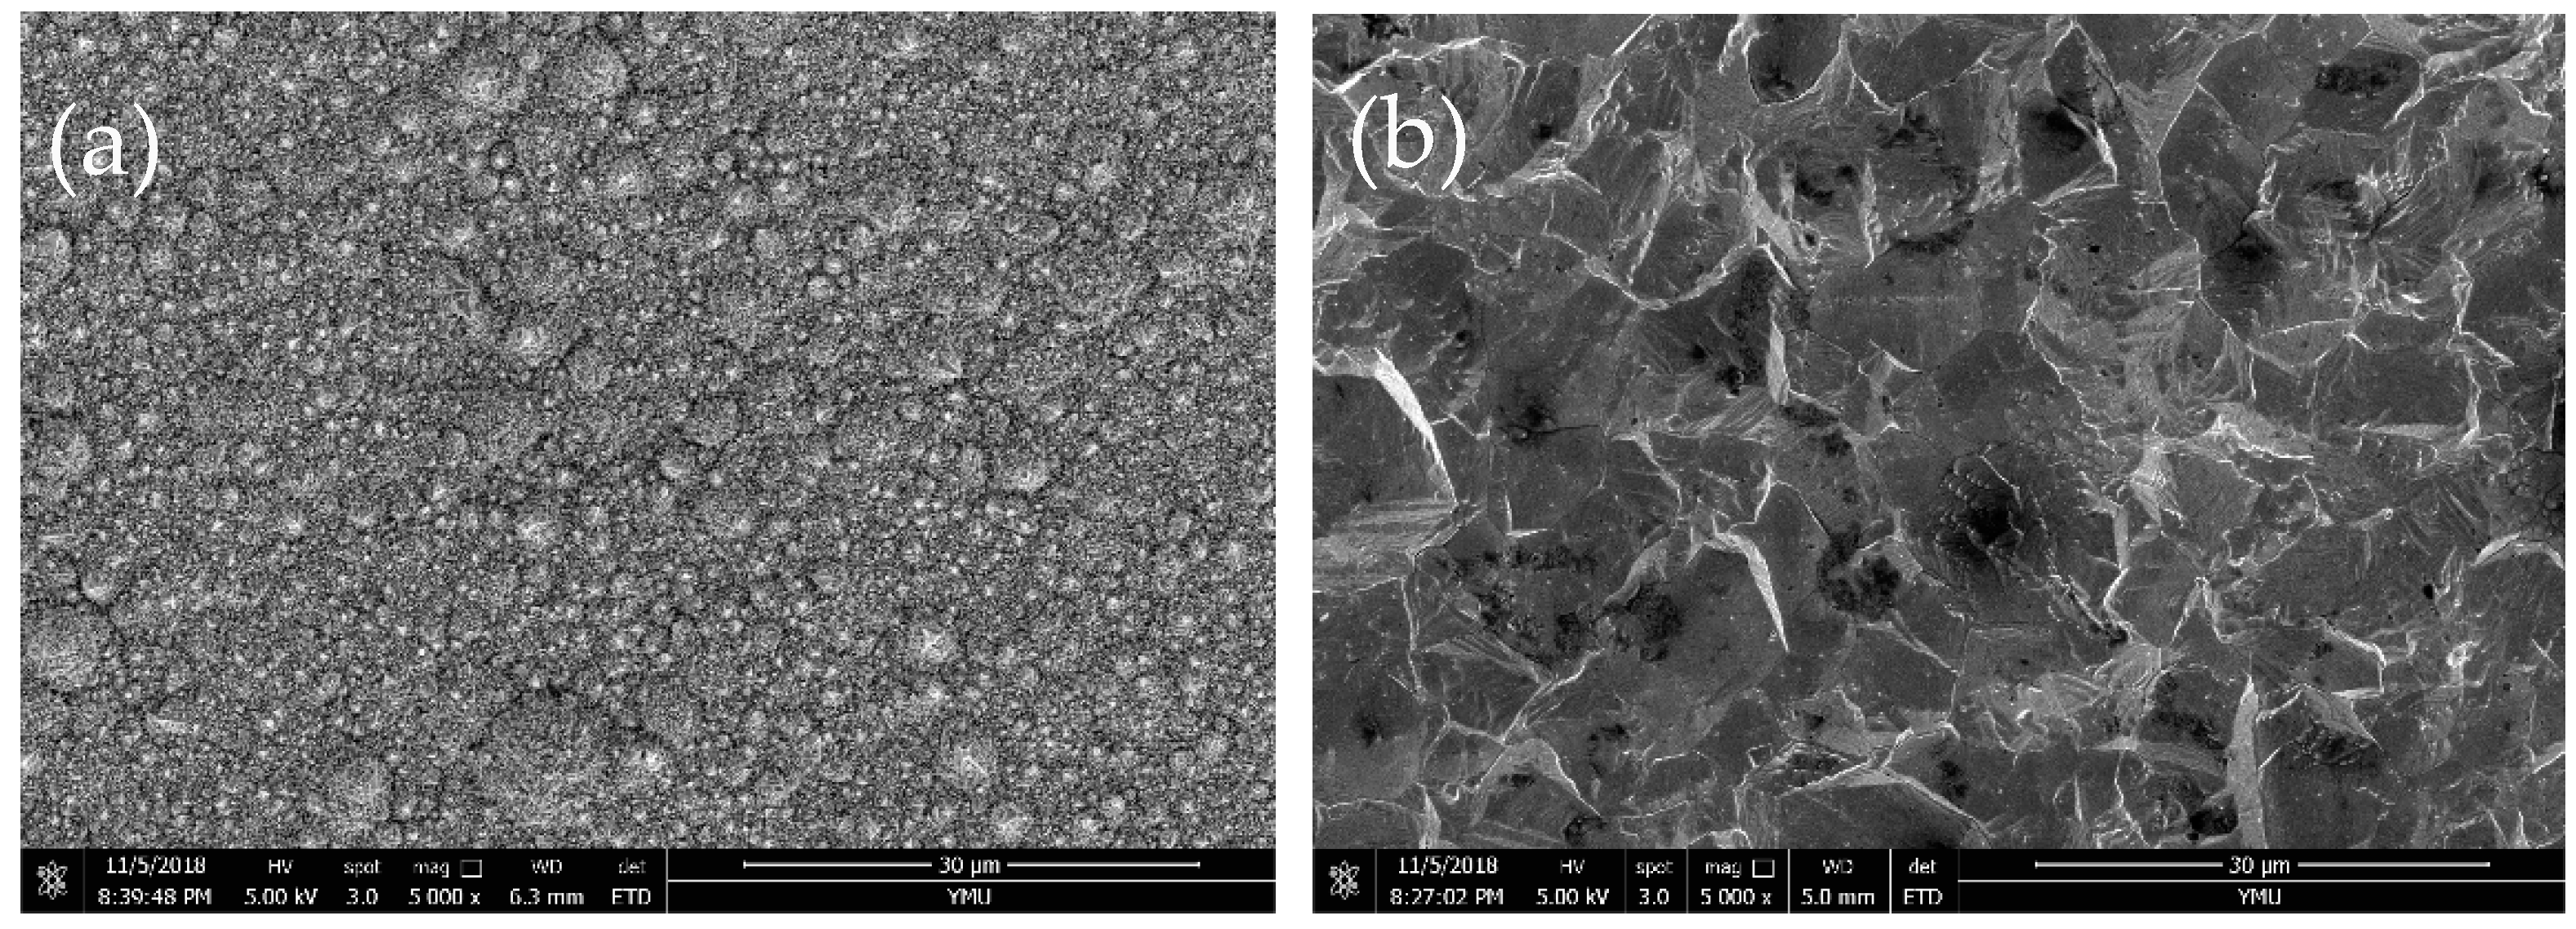
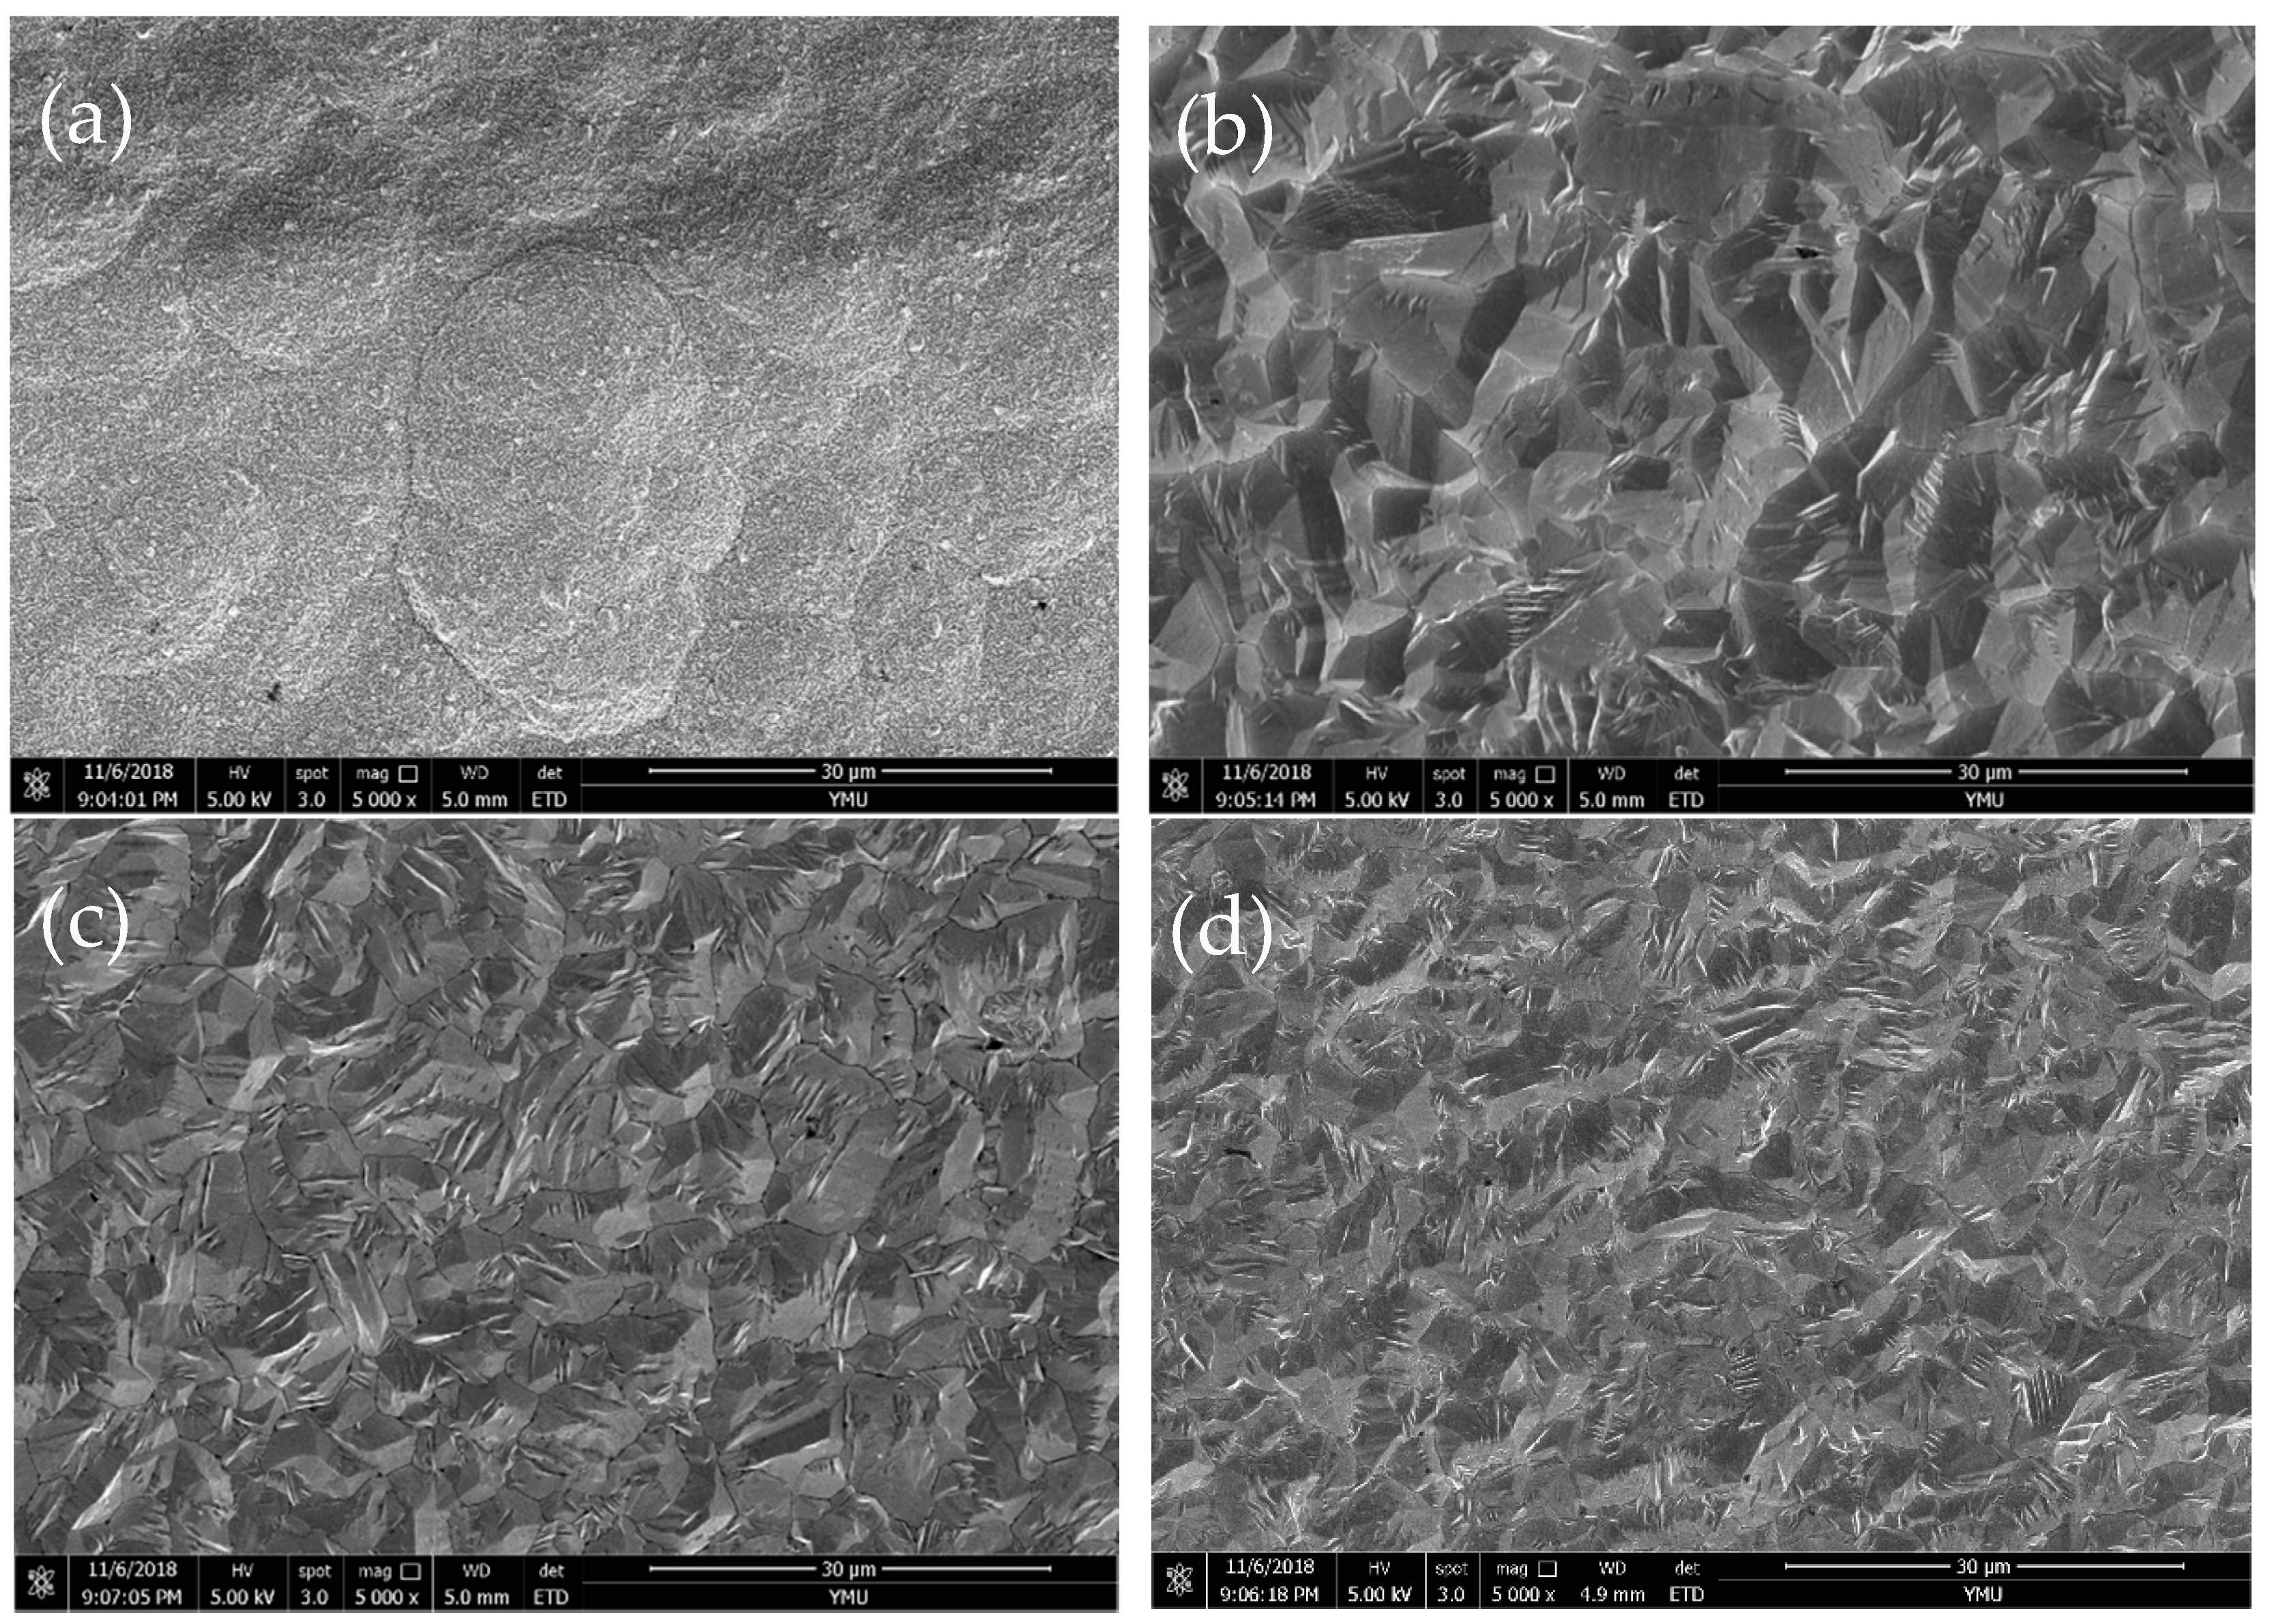
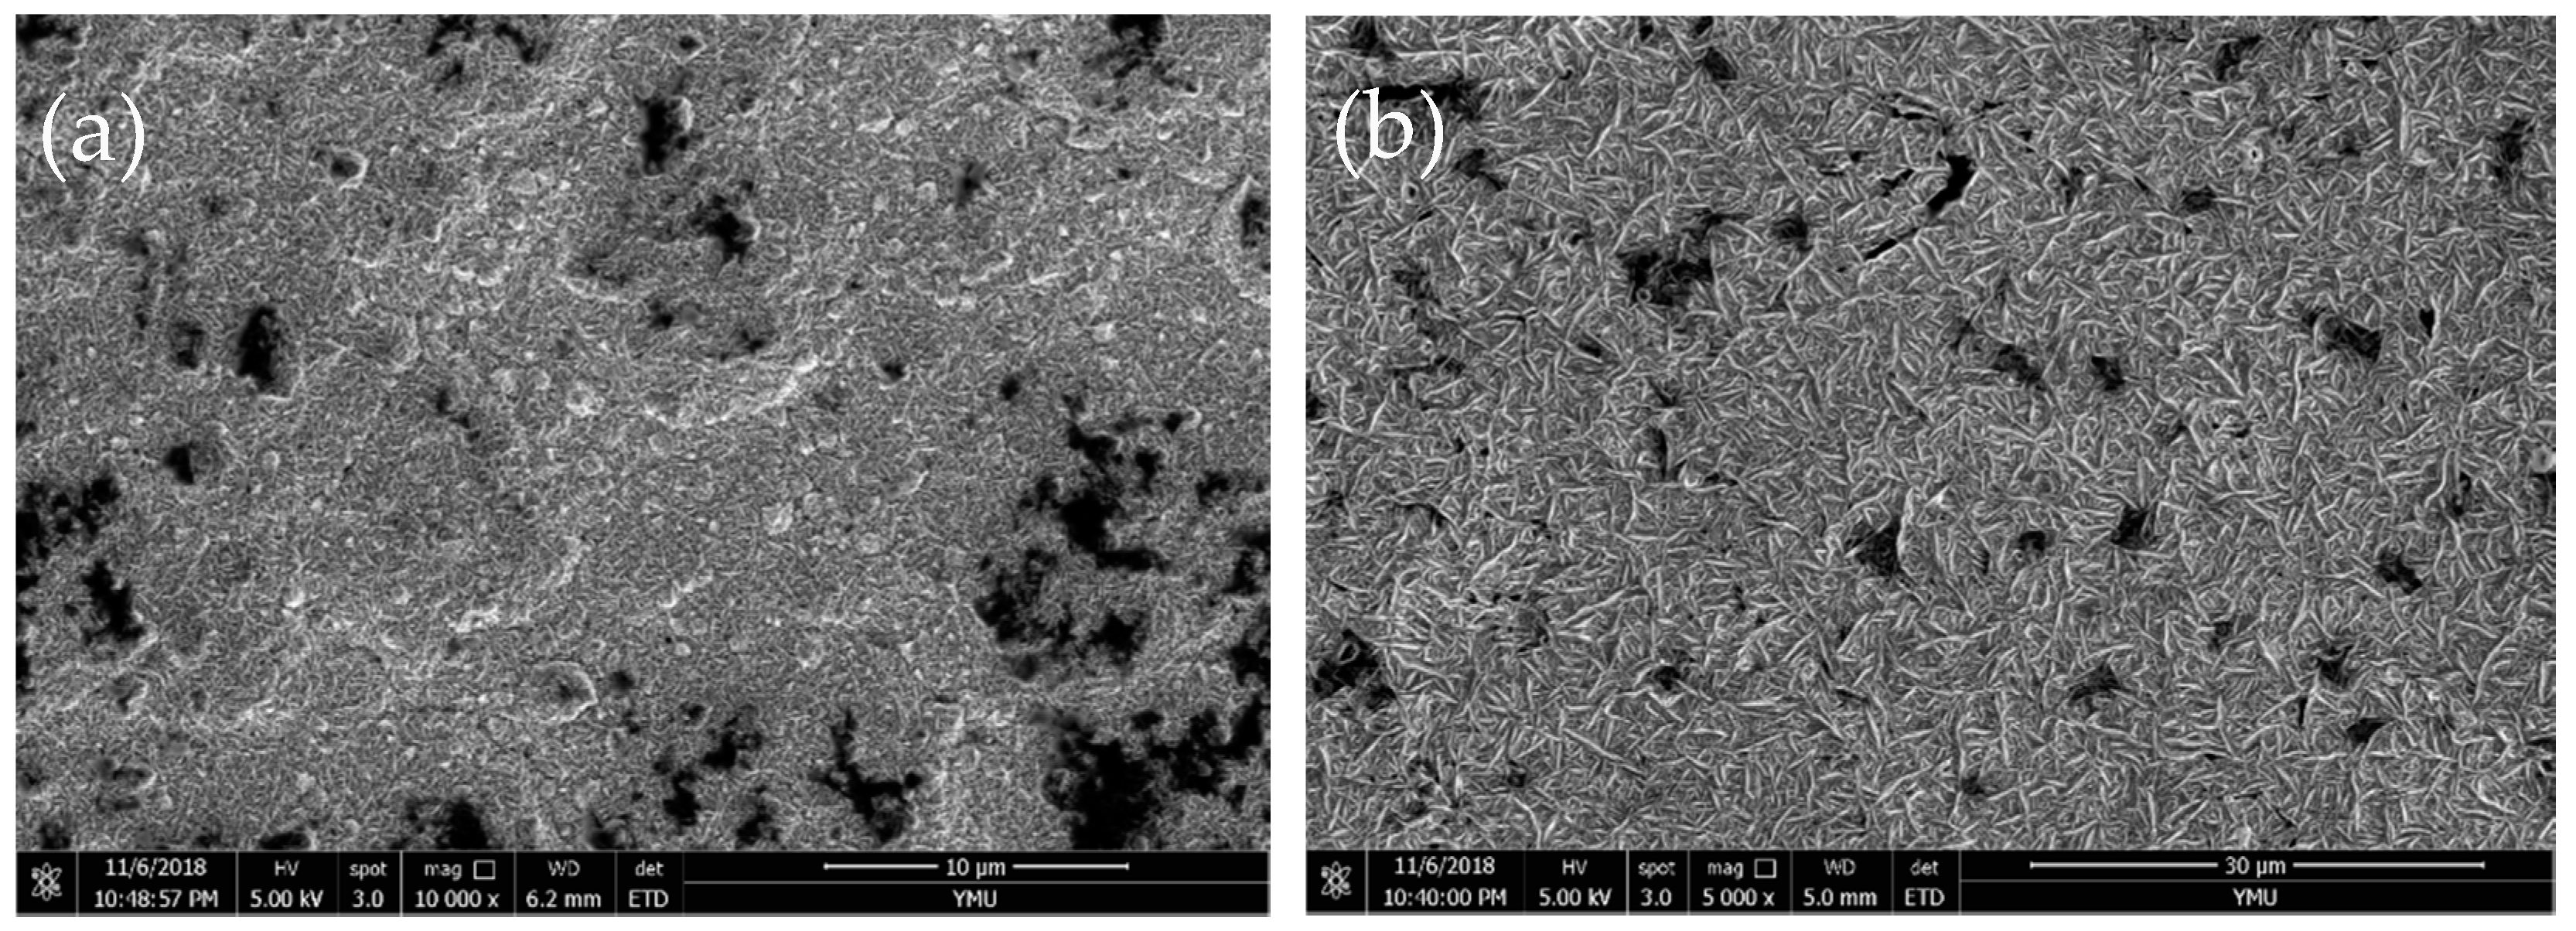
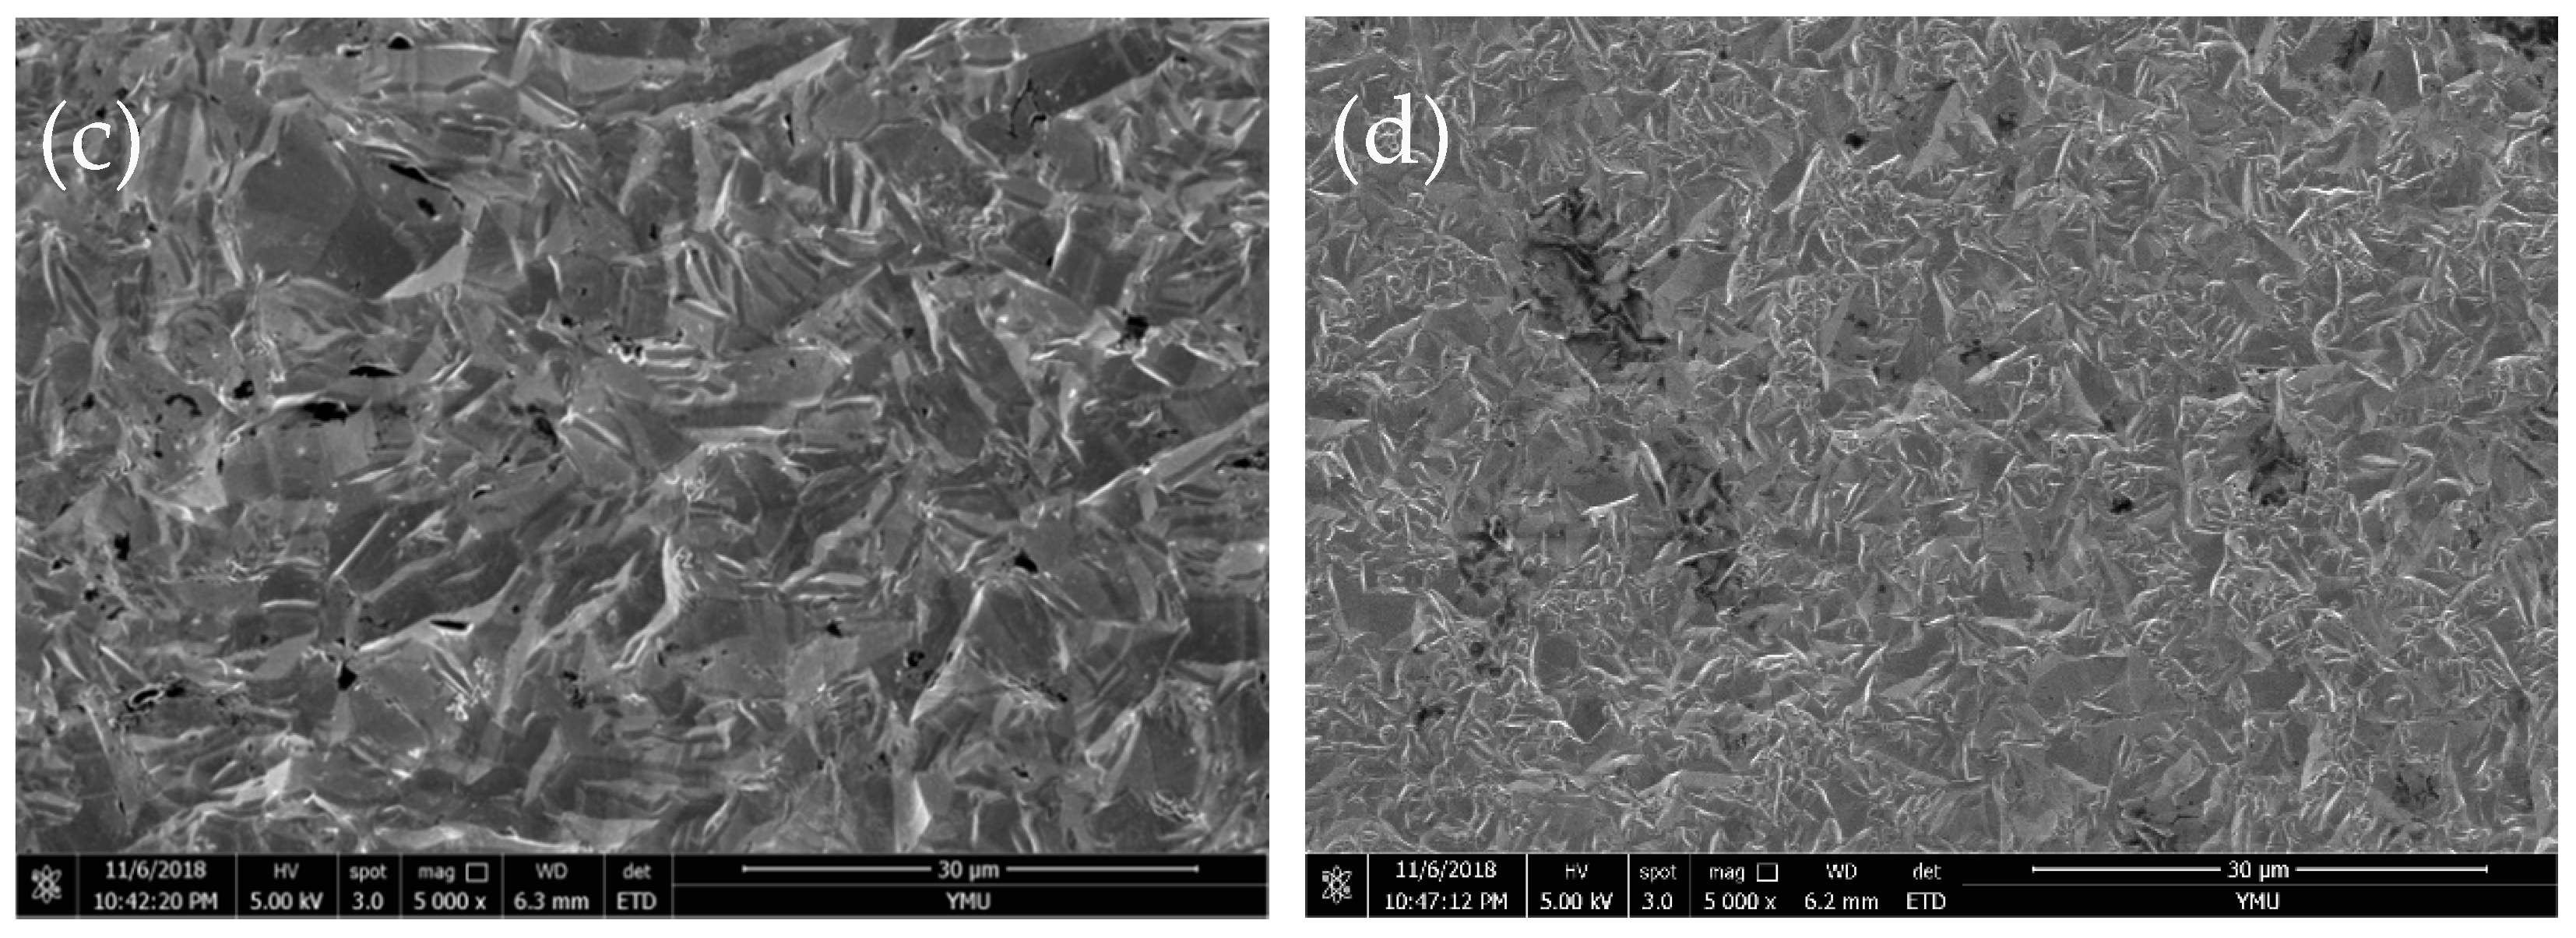
3.2. Chemical Composition and Surface Morphology of Fe–Ni Alloy Foils

The characteristic EDX peaks of Fe and Ni elements can be clearly observed from Figure 4, suggesting the occurrence of co-deposition of Fe and Ni. The corresponding chemical composition is shown in Table 1. It is found that the four black samples of 1#, 10#, 22#, and 30# electrodeposited at low current density from the respective bath have abnormally high Ni content and high oxygen content, in addition, the oxygen content increases along with CNi. That is, if the conditions employed are low current density and high CNi, the oxygen content in the deposits increase. Gadad [4] considered that oxygen incorporation resulted from Fe(OH)3 particle co-deposition. However, in the present baths, it is unreasonable due to low pH (<0.0) and weak HER (no bubbles nearby cathodes). Divalent nickel ions adsorbed on the cathode may be an acceptable reason, which results in the preferential deposition of nickel. Hydrated nickel ions adsorbed on the cathode partially incorporate into the Fe–Ni alloy matrix at low current density, consequently increasing oxygen content.
The variations of Ni content in the Fe–Ni alloy foils along with current density and CNi are shown in Figure 5. Form the bath of CNi = 0.1 M, the 1# sample electrodeposited at 10 A·dm−2 presents 88.16 wt % Ni, while the content of Ni rapidly drops to 5.330 wt % for the 2# sample electrodeposited at 15 A·dm−2. By further increasing the current density, the content of Ni slowly decreases. For example, the decreasing value is only 0.46 wt % when increasing the current density from 15 to 20 A·dm−2. Regardless of this, the lowest content of Ni in Fe–Ni alloys (4.10 wt % at 30 A·dm−2) is still higher than that of in the bath (3.20 wt %). The same behaviors are presented from other baths containing 0.2 to 0.8 M Ni2+ ions, as Figure 5a shows. It is well known that the Fe–Ni alloy electrodeposition was classified as anomalous co-deposition by Brenner [15], because the less noble Fe (more negative standard potential) is preferentially deposited, consequently resulting in more Fe (or less Ni) in the deposit than in the bath. The converse phenomenon is named regular co-deposition [2,15], which has been found in a citrate-ammonia system by Zhou et al. [16]. They proposed a poly-nuclear complex deposition mechanism to understand the converse phenomenon. It is still anomalous co-deposition in chloride baths without Fe3+ ions [3], so it can be considered that Fe3+ ions are responsible for the above behaviors. In the present baths, there probably exist the following reduction reactions and Equation (3).
Fe 2 + + 2 e Fe    0.44   V ( standard   potential )
Fe 3 + + 3 e Fe    0.0337   V ( standard   potential )
Ni 2 + + 2 e Ni    0.225   V ( standard   potential )
2 H + + 2 e H 2              0   V ( standard   potential )
The standard potential of the Ni2+/Ni couple is more positive than for Fe2+/Fe and more negative than Fe3+/Fe. Hence, it is considered that the poly-nuclear complex may be composed of Fe3+, Ni2+, Cl, and H2O in the present baths.
The inclined limiting value of Ni content in deposits obtained at a high current density from the chloride baths is given in Figure 5b. It can be seen that Ni content in deposits almost linearly increases from 4.10 wt % to 16.96 wt % along with the concentration of Ni2+ ions from 0.1 to 0.8 M, suggesting that Ni electrodeposition at high current density is controlled by the diffusion of Ni2+ ions.
Figure 6 shows the SEM images of Fe–Ni alloys electrodeposited from the chloride bath that contained 0.1 M Ni2+ ions. As shown in Figure 6, the surface morphology of Fe–Ni alloy foils can be modulated by the applied current density. At a low current density of 10 A·dm−2, the surface of the 1# sample is porous, see Figure 6a, which results in a black and gray appearance. Increasing the current density to 15 A·dm−2, polygonal crystals are observed in Figure 6b, similar to the polygonal structure of Fe foils electrodeposited from the chloride bath without Ni2+ ions [14]. Upon further increasing the current density to 25 A·dm−2, clearer and larger polygonal crystals are presented in Figure 6c. While, as Figure 6d shows, polygonal crystals become small when the applied current density increases to 30 A·dm−2. Compared with the microstructure evolution of Fe foils with the current density [14], one can consider that the microstructure of Fe–Ni foils is mainly controlled by the diffusion of Ni2+ ions at low current density, but by the reduction of Fe3+ ions at high current density.
A similar morphology evolution of Fe–Ni alloys indicating that their crystals become big then small along with the increase of applied current density is observed from other baths that contained 0.3 M Ni2+ ions, see Figure 7, 0.6 M Ni2+ ions, see Figure 8, or 0.8 M Ni2+ ions, see Figure 9. Flexible and smooth Fe–Ni alloy foils with big polygonal crystals were formed at the current density range according to Equation (2). The polygonal crystal size range ranges from several to tens of micrometers. Lower and higher current densities will result in smaller crystals, resulting from the adsorption of divalent nickel species and high cathodic polarization, respectively. The resultant Fe–Ni alloy foils are embrittling and even spontaneously peeling from Ti plates.

3.3. Crystal Structure of Fe–Ni Alloy Foils

XRD measurements were carried out to analyze the crystal structure of the obtained samples. As Figure 10a shown, sample 1#, obtained at a low current density, presents a FCC (face-centered cubic) crystal structure (refer to nickel, JCPDS No. 04-0850), possessing a (1 1 1) texture orientation with perceptible (2 0 0) and (2 2 0) reflections. The diffraction peaks located at 2θ = 40.1°, 52.9°, and 70.6° can be assigned to the pure Ti substrate corroding to the JCPDS card No. 44-1249, as the ample 1# is porous, see Figure 6a. When the current density is increased from 10 to 15 A·dm−2, the obtained sample 2# transforms into a BCC (body-centered cubic, α-Fe) crystal structure (refer to iron, JCPDS No. 06-0696), possessing a (1 1 0) texture orientation with a perceptible (2 0 0) reflection, because of the high Fe content in deposits (92.92 wt %, see Table 1). The dominant (1 1 0) diffraction peak became stronger when the applied current density was again increased to 20 A·dm−2 (3#) and 25 A·dm−2 (4#), suggesting coarse grains in the Fe–Ni alloy foils were formed, as shown in Figure 6. However, upon being further increased to 30 A·dm−2, the (1 1 0) diffraction peak became weak, because of finer crystals, which result from a high cathodic polarization.
It can be seen from Figure 10b–d that a similar crystal structure evolution of Fe–Ni alloys along with CD was presented in other baths. Of course, the CD range is different. However, the sample 30# that was obtained at the lowest current density of 50 A·dm−2 from the bath containing 0.8 M Ni2+ ions presents a FCC and BCC mixed crystal structure, although the content of Ni is up to 66.73 wt %. The mixed state of FCC and BCC had been found in other electrodeposited Fe–Ni alloys [1]. The result indicates that the co-deposition of Fe and Ni is controlled by the adsorption of divalent nickel species and the ionic diffusion.

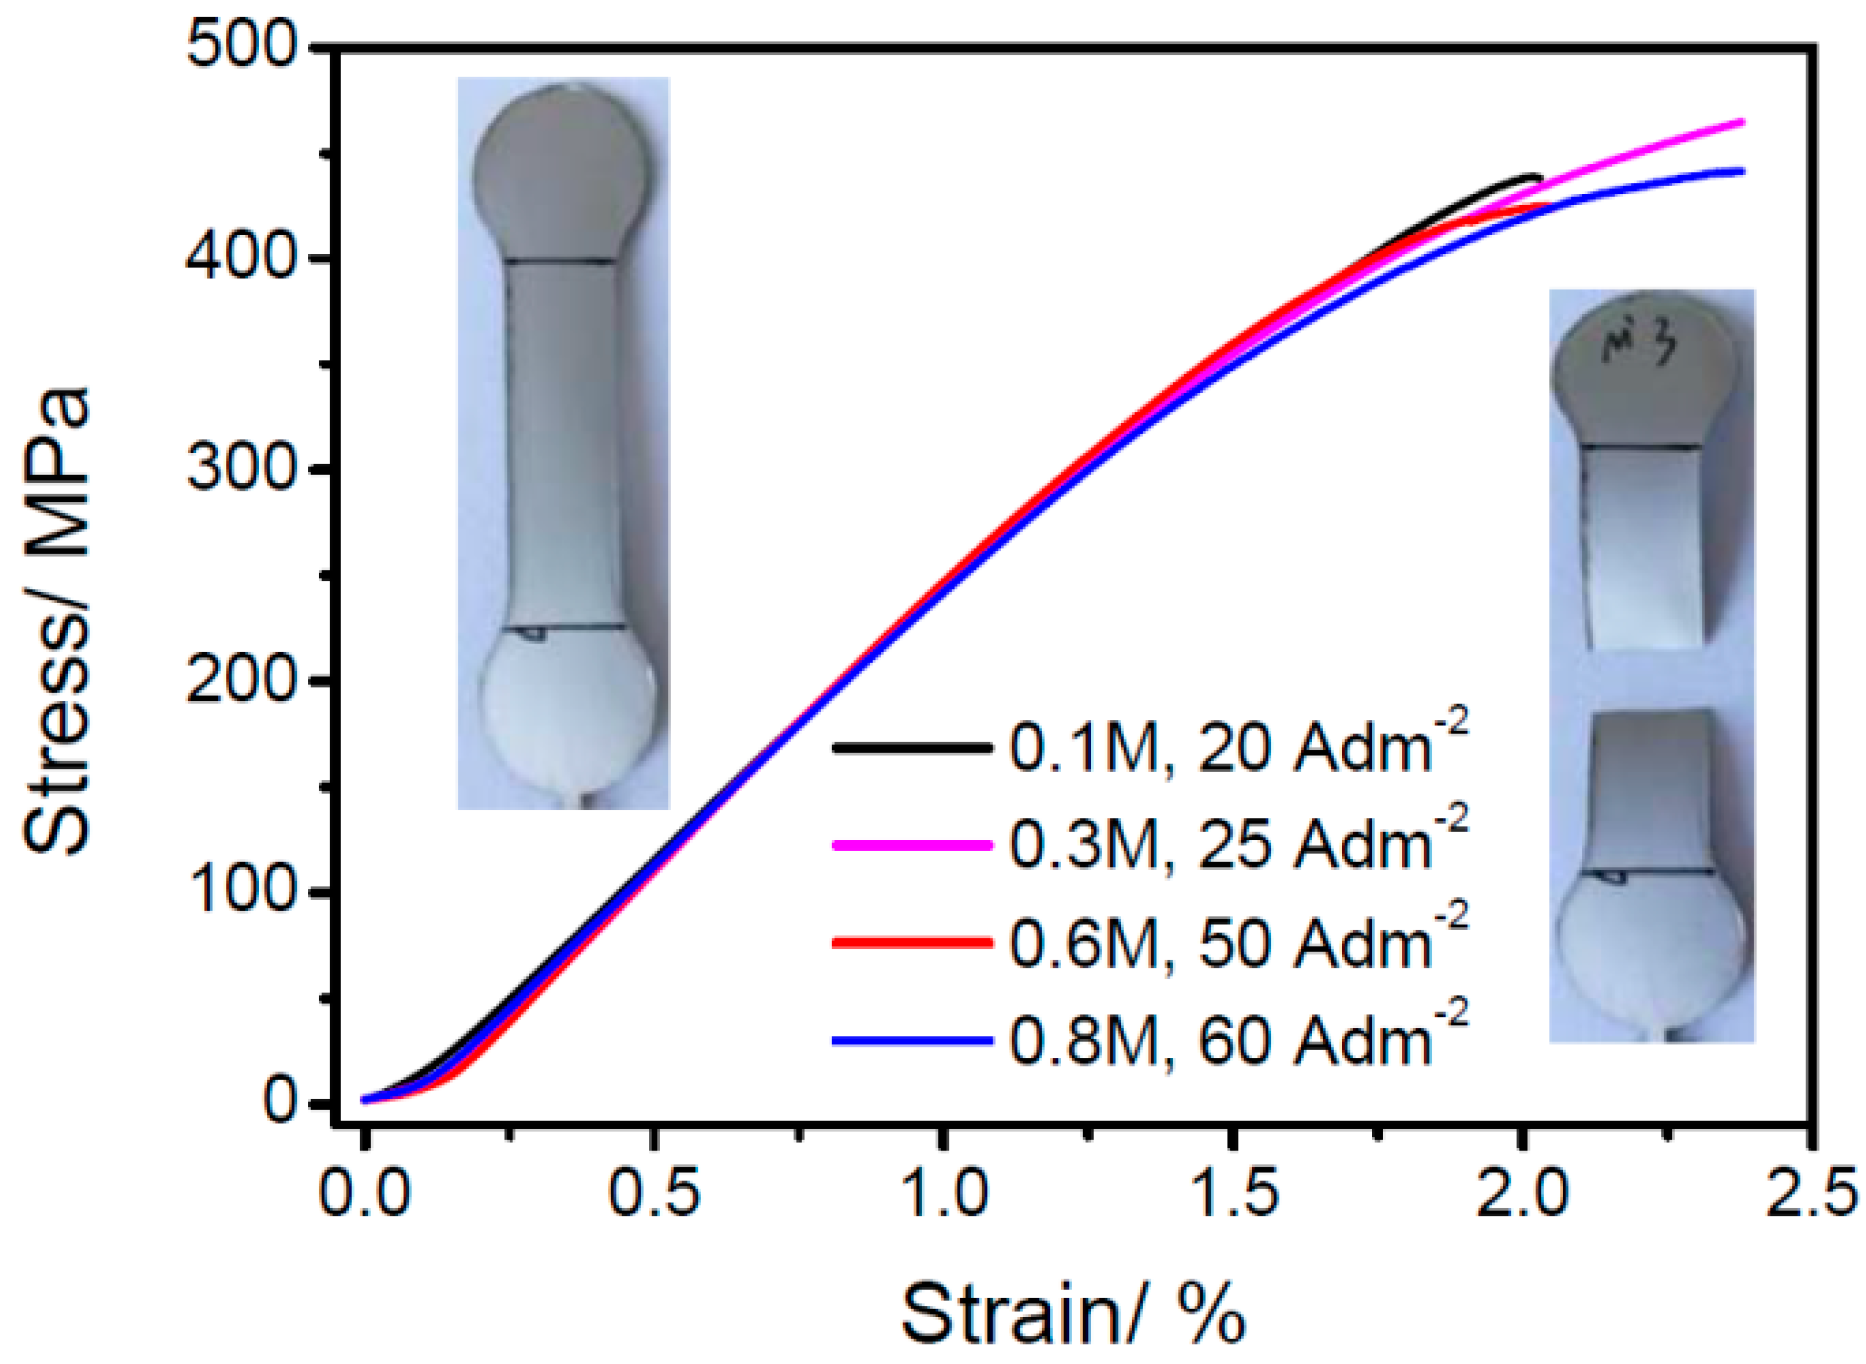
3.4. The Tensile Property of Electrodeposited Fe–Ni Alloy Foils

Representative stress–strain curves of Fe–Ni alloy foils electrodeposited from chloride baths that contained 0.1, 0.3, 0.6 and 0.8 M Ni2+ ions at 20, 25, 50, and 60 A·dm−2, respectively, are presented in Figure 11. The stress–strain behaviors of the Fe–Ni alloy foils are similar to that of cast iron (representative of brittle metal). The Fe–Ni alloy foils exhibit a tensile strength of between 420 and 480 MPa, and an elongation of between 2.0% and 2.5%, being independent of the Ni2+ ion concentrations (that is, nickel contents in deposits). The result indicates that the electrodeposited Fe–Ni alloy foils with similar crystal sizes are hardly strengthened by the introduced Ni element. The polygonal crystal size of electrodeposited Fe–Ni alloy foils may be the main determiner in their tensile properties.

4. Conclusions

Smooth and flexible Fe–Ni alloy foils were successfully prepared by tuning the current densities using an electrodeposition technology. The current density (CD, A·dm−2) range for electrodepositing Fe–Ni alloy foils was optimized by the concentration of Ni2+ ions according to the Equation (2). The Ni deposition was controlled by the diffusion of Ni2+ ions, and consequently, the nickel content in the Fe–Ni alloy foils can increase from 4.10 wt % to 16.96 wt % with the increase of the concentration of Ni2+ ions from 0.1 to 0.8 M. The crystal size of the smooth and flexible Fe–Ni alloy foils was from several to tens of micrometers, and could become smaller by both decreasing and increasing the current density because of the effect of the adsorption of a divalent Ni species and cathodic polarization, respectively. The XRD patterns indicated that the Fe–Ni alloy foils possessed a BCC crystal structure with the dominant (1 1 0) reflection. The Fe–Ni alloy foils exhibited a tensile strength of between 420 and 480 MPa, and an elongation of between 2.0% and 2.5%, which were independent of the nickel contents in deposits.

Author Contributions

Conceptualization, C.S. and J.G.; Methodology, C.S., L.Z. and W.B.; Validation, L.Z., L.T. and B.W.; Formal Analysis, C.S. and M.X.; Data Curation, C.S. and L.Z.; Writing—Original Draft Preparation, C.S. and L.Z.; Writing—Review and Editing, C.S., L.Z. and M.X.; Project Administration, C.S.

Funding

This research was funded by the National Natural Science Foundation of China (No. 51561032).

Conflicts of Interest

The authors declare no conflict of interest.

References

  1. Torabinejad, V.; Aliofkhazraei, M.; Assareh, S.; Alahyarazadeh, M.H.; Sabour Rouhaghdam, A. Electrodeposition of Ni-Fe alloys, composites and nano coatings—A review. J. Alloys Compd. 2017, 691, 841–859. [Google Scholar] [CrossRef]
  2. Chaudhari, A.K.; Singh, V.B. A review of fundamental aspects, characterization and applications of electrodeposited nanocrystalline iron group metals, Ni-Fe alloy and oxide ceramics reinforced nanocomposite coatings. J. Alloys Compd. 2018, 751, 194–214. [Google Scholar] [CrossRef]
  3. Harty, S.F.; Mcgeough, J.A.; Tulloch, R.M. A review of the electroforming of iron and iron-nickel alloy. Surf. Technol. 1981, 12, 39–55. [Google Scholar] [CrossRef]
  4. Gadad, S.; Haris, T.M. Oxygen incorporation during the electrodeposition of Ni, Fe and Ni-Fe alloys. J. Electrochem. Soc. 1998, 145, 3699–3703. [Google Scholar] [CrossRef]
  5. Kieling, V.C. Parameters influencing the electrodeposition of Ni-Fe alloys. Surf. Coat. Technol. 1997, 96, 135–139. [Google Scholar] [CrossRef]
  6. Tabakovic, I.; Gong, J.; Riemer, S.; Kautzky, M. Influence of surface roughness and current efficiency on composition gradients of thin NiFe films obtained by electrodeposition. J. Electrochem. Soc. 2015, 162, D102–D108. [Google Scholar] [CrossRef]
  7. Nagayama, T.; Yamamoto, T.; Nakamura, T. Thermal expansions and mechnical properties of elecctrodeposited Fe-Ni alloys in the invar compositionrange. Electrochim. Acta 2016, 205, 178–187. [Google Scholar] [CrossRef]
  8. Su, C.-W.; He, F.-J.; Ju, H.; Zhang, Y.-B.; Wang, E.-L. Electrodeposition of Ni, Fe and Ni-Fe alloy on the 316 stainless steel surface from fluorborate bath. Electrochim. Acta 2009, 54, 6257–6263. [Google Scholar] [CrossRef]
  9. Su, C.-W.; Wang, E.-L.; Zhang, Y.-B.; He, F.-J. Ni1−xFex (0.1 < x < 0.75) alloy foils prepared from a fluorborate bath using electrochemical deposition. J. Alloys Compd. 2009, 474, 190–194. [Google Scholar]
  10. Grimmett, D.L.; Schwartz, M.; Nobe, K. Pulsed electrodeposition of iron-nickel alloys. J. Electrochem. Soc. 1990, 137, 3414–3418. [Google Scholar] [CrossRef]
  11. Trudeau, M.L. Nanocrystalline Fe and Fe-riched Fe-Ni through electrodeposition. Nanostruct. Mater. 1999, 12, 55–60. [Google Scholar] [CrossRef]
  12. Dubin, V.M.; Lisunova, M.O.; Walton, B.L. Invar electrodeposition for controlled expansion interconnects. J. Electrochem. Soc. 2017, 164, D321–D326. [Google Scholar] [CrossRef]
  13. Brankovic, S.R.; Bae, S.-E.; Litvinov, D. The effect of Fe3+ on magnetic moment of electrodepositied CoFe alloys-experimental study and analytical model. Electrochim. Acta 2008, 53, 5934–5940. [Google Scholar] [CrossRef]
  14. Su, C.-W.; Yang, W.; Guo, J.-M.; Zhang, Y.-J. Modulated morphology of Fe foils electrodeposited at a high current density by adding cations. Vacuum 2012, 86, 2095–2101. [Google Scholar] [CrossRef]
  15. Brenner, A. Electrodeposition of Alloys; Academic Press, Inc.: New York, NY, USA, 1963. [Google Scholar]
  16. Zhou, Q.; He, F. Insight into the mechanism of the Fe-Ni alloys co-deposition from ploy-nuclear complexes. J. Electrochem. Soc. 2018, 165, D681–D686. [Google Scholar] [CrossRef]
Figure 1. (a) The plan of the Ti template, (b) the Ti template after sealing using transparent epoxy and polishing using silicon carbide waterproof abrasive paper of 1000 Cw, (c) the Fe–Ni alloy foil electrodeposited on the Ti template, and (d) the stripped Fe–Ni alloy foil.
Coatings 09 00056 g001
Figure 2. The photographs of Fe–Ni alloys electrodeposited from chloride baths with different current densities and concentrations of Ni2+ ions. The samples are marked 1# to 34#, respectively. Because the samples circled in Figure 2 are almost completely exfoliated, they are not numbered.
Coatings 09 00056 g002
Figure 3. (a) The relationships between WQ (Fe–Ni alloy weight electrodeposited for 1 A·h, 1 A·h = 3600 C) and current density, (b) the relationship of deposition rate and current density.
Coatings 09 00056 g003
Figure 4. EDX spectra of Fe–Ni alloy foils electrodeposited from chloride baths contained different Ni2+ ion concentrations of (a) 0.1 M, for 1# to 5# samples, (b) 0.3 M, for 10# to 13# samples, (c) 0.6 M, for 22# to 25# samples, and (d) 0.8 M, for 31# to 34# samples.
Coatings 09 00056 g004
Figure 5. The effects of (a) current density and (b) concentration of Ni2+ ions on Ni content in Fe–Ni alloy foils.
Coatings 09 00056 g005
Figure 6. SEM images of Fe–Ni alloys electrodeposited from the chloride baths that contained 0.1 M Ni2+ ions at (a) 10 A·dm−2, 1#, (b) 15 A·dm−2, 2#, (c) 25 A·dm−2, 4#, and (d) 30 A·dm−2, 5#.
Coatings 09 00056 g006
Figure 7. SEM images of Fe–Ni alloys electrodeposited from the chloride baths that contained 0.3 M Ni2+ ions at (a) 15 A·dm−2, 10#, (b) 20 A·dm−2, 11#, (c) 25 A·dm−2, 12#, and (d) 30 A·dm−2, 13#.
Coatings 09 00056 g007aCoatings 09 00056 g007b
Figure 8. SEM images of Fe–Ni alloys electrodeposited from the chloride bath contained 0.6 M Ni2+ ions at (a) 35 A·dm−2, 22#, (b) 40 A·dm−2, 23#, (c) 50 A·dm−2, 24#, and (d) 60 A·dm−2, 25#.
Coatings 09 00056 g008
Figure 9. SEM images of Fe–Ni alloys electrodeposited from the chloride baths that contained 0.8 M Ni2+ ions at (a) 50 A·dm−2, 30#, (b) 60 A·dm−2, 31#, (c) 65 A·dm−2, 32#, and (d) 70 A·dm−2, 33#.
Coatings 09 00056 g009aCoatings 09 00056 g009b
Figure 10. XRD patterns of Fe–Ni alloy foils electrodeposited from chloride baths that contained different Ni2+ ion concentrations of (a) 0.1 M, for 1# to 5# samples, (b) 0.3 M, for 10# to 13# samples, (c) 0.6 M, for 22# to 25# samples, and (d) 0.8 M, for 31# to 33# samples.
Coatings 09 00056 g010
Figure 11. Representative stress–strain curves of Fe–Ni alloy foils electrodeposited from chloride baths that contained 0.1, 0.3, 0.6, and 0.8 M Ni2+ ion. The insets are views of a Fe–Ni alloy foil before and after tensile test.
Coatings 09 00056 g011
Table 1. Chemical composition of the Fe–Ni alloys.
SampleElementWeight %Atomic %
1#O K1.0603.780
Ni K88.1685.26
Fe K10.7810.97
2#O K1.7405.850
Ni K5.3304.870
Fe K92.9289.28
3#O K1.4504.890
Ni K4.8704.480
Fe K93.6890.62
4#O K0.9303.180
Ni K4.1003.830
Fe K94.7492.89
5#O K0.9403.220
Ni K4.1003.820
Fe K94.9692.97
10#O K1.4905.220
Ni K81.1177.34
Fe K17.4017.44
11#O K1.3304.530
Ni K11.2010.39
Fe K87.1784.97
12#O K1.0503.600
Ni K11.1810.44
Fe K87.5485.88
13#O K1.0503.580
Ni K9.7909.130
Fe K88.9787.22
22#O K4.01013.09
Ni K61.2154.42
Fe K34.7732.49
23#O K1.0303.540
Ni K16.9615.88
Fe K81.7580.48
24#O K1.1003.770
Ni K18.2016.83
Fe K80.6979.32
25#O K1.0203.490
Ni K17.6416.53
Fe K81.1479.90
30#O K4.76015.32
Ni K66.7358.50
Fe K28.3426.12
31#O K1.1904.080
Ni K19.4218.07
Fe K79.3977.79
32#O K0.9903.420
Ni K20.8019.53
Fe K78.2176.97
33#O K1.0903.730
Ni K16.6515.47
Fe K82.1680.71
34#O K1.0603.640
Ni K16.9415.75
Fe K81.9980.53

