Article

Thickness-Dependent Bioelectrochemical and Energy Applications of Thickness-Controlled Meso-Macroporous Antimony-Doped Tin Oxide

1
School of Molecular Sciences, Arizona State University, Tempe, AZ 85287-1604, USA
2
Biodesign Center for Innovation in Medicine at Biodesign Institute, Arizona State University, Tempe, AZ 85287, USA
*
Author to whom correspondence should be addressed.
Coatings 2018, 8(4), 128; https://doi.org/10.3390/coatings8040128
Submission received: 31 December 2017 / Revised: 17 March 2018 / Accepted: 28 March 2018 / Published: 2 April 2018

Abstract

:
Coatings of hierarchically meso-macroporous antimony-doped tin oxide (ATO) enable interfacing adsorbed species, such as biomacromolecules, with an electronic circuit. The coating thickness is a limiting factor for the surface coverage of adsorbates, that are electrochemically addressable. To overcome this challenge, a carbon black-based templating method was developed by studying the composition of the template system, and finding the right conditions for self-standing templates, preventing the reaction mixture from flowing out of the mask. The thicknesses of as-fabricated coatings were measured using stylus profilometry to establish a relationship between the mask thickness and the coating thickness. Cyclic voltammetry was performed on coatings with adsorbed cytochrome c to check whether the entire coating thickness was electrochemically addressable. Further, bacterial photosynthetic reaction centers were incorporated into the coatings, and photocurrent with respect to coating thickness was studied. The template mixture required enough of both carbon black and polymer, roughly 7% carbon black and 6% poly(ethylene glycol). Coatings were fabricated with thicknesses approaching 30 µm, and thickness was shown to be controllable up to at least 15 µm. Under the experimental conditions, photocurrent was found to increase linearly with the coating thickness, up to around 12 µm, above which were diminished gains.

Graphical Abstract

1. Introduction

Finding the right conducting substrate for safely hosting biomacromolecules is necessary to transfer chemical potential from biochemical pathways to electrical circuits. Such porous electrodes open the way for hybrid photovoltaic [1,2,3,4,5,6,7,8,9], battery [10], photocatalytic [11,12,13,14] and sensing [15,16] applications. The high surface area provided by mesopores allows for high surface coverage of redox-active species on an electrode [7,17,18,19,20], while the co-presence of openly connected macropores facilitates the better diffusivity of solvent and solutes for better electrochemical performance [9,21,22,23] and is crucial for diffusion of bulky molecules through the entire coating thickness [15,16,24]. Macroporous coatings of transparent conducting oxides (TCOs), namely of SnO2 and TiO2-based materials, have been synthesized by various methods. Aside from our previous reports [1,25], without employing pre-formed particles, meso-macroporous coatings have been fabricated with thickness up to 1 µm [11,26] which can accommodate one or two layers of macropores. However, by forming particles prior to depositing the meso-macroporous coatings, TiO2 coatings with 15–20 µm thickness have been reported [6,7,27]. Even coatings of up to 31 µm thick have been reported, although they have had large non-uniformities [8]. SnO2 coatings up to 10 µm thick have been reported [28]. While thicker coatings have been enabled by using pre-formed particles, this increases the resource intensiveness of the methods. Further, many of these coatings exhibit large macropores that are connected by relatively narrow necks [2,10,13,14,22,23,29] or in only one dimension [8], which hinders the diffusivity of macromolecules through the pore network [16].
Meso-macroporous coatings have been proven as hosts to biomacromolecules [1,2,11,15,16,25], and biomacromolecule electrochemistry has been reported using SnO2-based electrodes in the following cases: electrochemical redox potentials were measured for hemoglobin in several-µm thick In-doped SnO2 [15], photoelectric current from dye-labeled DNA and dye-labeled immunoassay system were measured in ~300 nm thick SnO2 [16], and photocurrent from Rb. sphaeroides reaction center (RC) [1] and from photosystem I [2] were measured in antimony-doped tin oxide (ATO) with thicknesses around 5 and 2 µm, respectively. Despite these reports on the fabrication of macroporous and meso-macroporous electrodes, they are limited by the maximum thickness of the coatings, which is generally less than five micrometers. In the cases where photoactive biomacromolecules are used, more light absorption can lead to a higher photocurrent [1], and one limiting factor of light absorption is the coating thickness that limits the surface coverage [11]. In our previous report for RC-decorated meso-macroporous ATO, templated by acetylene carbon black, four to five µm coatings showed a photocurrent density of 2.1 µm·A/cm2 under continuous illumination at 800 nm and 5 mW/cm2 [1].
Carbon black (CB), specifically which is derived from acetylene, has all the right properties to act as a template for generating thick meso-macroporous TCOs. Not only does the highly branched structure soak up the solvent and dissolved metal precursors, providing a template for macropores, but also the soaked aggregates can pack in a continuous network such that the fluid becomes solidified with a low solids fraction (<5%) [30,31], and leaves a highly connected, continuous network of macropores upon removal. By using a poly(ethylene glycol) compound, we successfully intermixed the aqueous sol-gel system with CB. However, the fluidity of the reaction mixture in the previous reports prevented the direct control of the calcined coating thickness with the mask thickness [1,25].
We sought to understand the viscous behavior, and measured the viscosities of mixtures with various polymer and CB amounts. Identifying the compositional boundary that marks a sol-gel transition of CB aggregates from Newtonian fluidity to Bingham plasticity allowed us to identify the template blends of interest. ATO coatings were produced using the new formulations, and were characterized using scanning electron microscopy (SEM) to image the surface pore structure, stylus profilometry to measure the coating thickness, and UV/Vis, current-voltage and photovoltaic studies to understand the dependence between coating thickness and photocurrent generated from photosynthetic RC that is presumed to be attached through cytochrome c (cyt c).

2. Materials and Methods

2.1. Sample Preparation for Viscosity Studies

Mixtures were prepared by systematically varying the amounts of acetylene CB (Alfa Aesar, Heverville, MA, USA; 50% compressed ≥ 99.9%, surface area = 75 m2/g, bulk density of 0.095–0.103 g/cm3) and polyethylene glycol bisphenol A, epichlorohydrin copolymer (PEG) (Sigma-Aldrich, Saint Louis, MO, USA; 15–20 kDa) per the naming scheme CBX-PEGY, where X and Y are the weight percent values of CB and of PEG, respectively. The specific amounts used for the sample preparation are reported in Table S1. The PEG stock solution (PEG SS) was a 45.5 wt % solution of PEG in deionized water. Stock paste, prepared in a separate jar, consisted of 12.4 wt % CB, 25.5 wt % PEG and 61.8 wt % (±)-epichlorohydrin (ECH) (Fluka™, Fisher Scientific, Hampton, NH, USA; ≥99.9%), and was mixed by first dissolving the PEG in the ECH, followed by slowly adding the CB with continuous, vigorous and thorough manual stirring until the consistency was smooth and uniform, generally for around 5 min. A third jar contained the stock solution, which was prepared by combining n-butanol (J.T. Baker®, Avantor Performance Materials, Inc., Center Valley, PA, USA; 99.9%), deionized water, ECH and PEG SS. These substances were combined in a 15-mL Ultra-Turrax Tube equipped with a rotor-stator element, subsequently called a Tube.
Preparation of the mixture CB7-PEG14 is reported as an example. First, the stock solution was prepared by combining 7.42 g of n-butanol, 0.28 g of deionized water, 0.53 g of ECH and 1.60 g of PEG SS in an 8-dram vial. Next, 0.37 g of CB was weighed into the Tube, to which 9.3 g of the stock solution was added. Finally, 5.72 g of the stock paste was weighed into the mixture. The Tube was closed, and the contents were subjected to high-shear mixing using a setting of three for 15 s, followed by vigorous shaking. Then, the mixing was performed with a setting of seven for 15 s, and the Tube was shaken vigorously. This step was repeated until the mixture appeared visually uniform. Finally, the mixing was performed with a setting of 9 for 2 min with intermittent shaking, and the mixture was transferred to a 50-mL centrifuge tube with a spatula. This entire procedure was carried out twice to obtain roughly 30 mL of mixture.

2.2. Viscosity Measurements

Viscosity was measured between the shear rates of 1.7 and 34 s−1 with a Brookfield LVDV-II Pro EXTRA Viscometer (Brookfield Engineering Laboratories, Inc., Middleborough, MA, USA) equipped with an aluminum SC4-27 spindle. Measurements were carried out on samples with a volume of ~30 mL in 50 mL plastic centrifuge tubes.

2.3. Fabricating ATO Coatings

In the case when metal precursors were included in the mixture, a reaction mixture was produced from which meso-macroporous coatings were fabricated. Preparation of the reaction mixture CB7-PEG6-ATO was carried out by partially dissolving 0.05 g of SbCl3 (Alfa Aesar, Heverville, MA, USA; ≥99.9%) and 1.00 g SnCl4·5H2O (Alfa Aesar, Heverville, MA, USA; 98%) in 7.49 g of cold n-butanol, followed by the addition of 1.17 g cold deionized water. After complete dissolution/hydrolysis of the metal salts, 3.80 g of the stock paste was added to the Tube, which was briefly mixed at a setting of five. Next 0.68 g of CB was added, followed by 2.24 g of cold ECH. After the same high-shear mixing procedure that was used for the non-reacting mixture, the homogenized reaction mixture was transferred to a separate vial, from which the coatings were prepared.
Coatings were prepared on TEC-15 fluorine tin oxide FTO glass (Hartford Glass, Inc., Hartford City, IN, USA) with the doctor-blading technique. First, a mask with differing thickness was applied to cover one or two mm of the long edges. The coating thickness was adjusted by using from one to five layers of tape to mask, and included in the sample names as a prefix (1×–5×) when coatings were produced. To a third edge, a single layer of tape was applied to cover roughly one centimeter. A bead of reaction mixture was pipetted along the tape on the third edge, and was drawn smoothly across the length of the glass. The coated slides were left under ambient conditions overnight, followed by removal of the tape mask and calcination at 500 °C for 7 h under an oxygen atmosphere.

2.4. Characterizing the Coatings

Scanning electron microscopy (SEM) studies were carried out on an AMRAY 1910 field-emission scanning electron microscope (SEMTech Solutions, Billerica, MA, USA), with 20 kV electrons. Stylus profilometry was carried out using a Dektak XT (Bruker, Billerica, MA, USA) with a 12.5 µm tip diameter using 0.3 mg of force.

2.5. Incorporation of Bacterial Reaction Centers into ATO Films

RCs were isolated from semi-anaerobically grown cultures of Rb. sphaeroides as described in Dutta et al. 2014 [32]. Harvested cells were resuspended in 50 mM phosphate buffer (pH 8.0) containing 150 mM NaCl and broken by two passages through a French press (15,000 kpsi) in the presence of a small amount of DNase with Ca2+ and Mg2+ ions. Unbroken material was removed by low speed centrifugation (9000 g for 10 min). The supernatant was treated with imidazole (final concentration 5 mM) and N,N-dimethyldodecylamine N-oxide (LDAO, final concentration 0.65% by volume) for 25 min at room temperature. The resulting solution of solubilized RCs was then centrifuged at 14,000 g to pellet any unsolubilized material. The supernatant was filtered through a 0.45 µm PES filter and RCs were purified with Ni affinity chromatography. Eluted RCs were dialyzed overnight at 4 °C against 15 mM Tris (pH 8.0) containing 0.05% LDAO, 150 mM NaCl and 1 mM EDTA, using 50 kDa molecular weight cutoff membrane (Amicon®, Sigma-Aldrich, Saint Louis, MO, USA), to remove imidazole and excess LDAO. Samples were concentrated using 30 kDa PES centrifugal filters (Satorius, Göttingen, Germany) and the concentration of purified RCs was measured using absorbance at 804 nm (ε ~ 288,000 M−1·cm−1).
Cyt c was used as an oriented docking component and redox wire, connecting the RCs to the ATO electrode as described previously [1]. In the intracytoplasmic membrane of Rb. sphaeroides, cyt c docks at the P end of the reaction center and donates an electron to the specialized pair of bacteriochlorophylls (Bchls) to re-reduce the reaction center. Cyt c (equine heart, Sigma, Sigma-Aldrich, Saint Louis, MO, USA) was adsorbed to ATO pore surfaces by incubating ATO slides in a solution of 50 μM cyt c in 5 mM phosphate buffer (pH 7.0) followed by repeated washes in nanopure water (18.2 MΩ·cm−1) to remove unbound molecules. Rb. sphaeroides RCs were then applied as reported earlier [1] and steady-state UV-Vis absorption spectra (Varian Cary 50 UV-Vis spectrophotometer, Agilent, Santa Clara, CA, USA) were collected to confirm successful incorporation of cyt c and RCs within the ATO coatings.

2.6. Cyclic Voltammetry and Photovoltaic Measurements

Meso-macroporous ATO slides, Pt wire and Ag/AgCl were used as working electrode, counter electrode and reference electrode, respectively. The electrolyte buffer was 0.1 M Tris (pH 8.0), and cyclic voltammetry was carried out between 0.15 and −0.15 V vs. Ag/AgCl, and using a scan rate of 5 mV/s. Photocurrents were measured to characterize the function of the ATO-cyt c–RC slides as reported previously [1]. For photovoltaic measurements, the electrolyte buffer was 0.1 M Tris (pH 8.0) containing 500 µM ubiquinone-0. A potential of 0.8 V (SHE) was applied to the working electrode (ATO) and photocurrents were recorded in the absence and presence of illumination (white lamp, 35 mW/cm2).

3. Results and Discussion

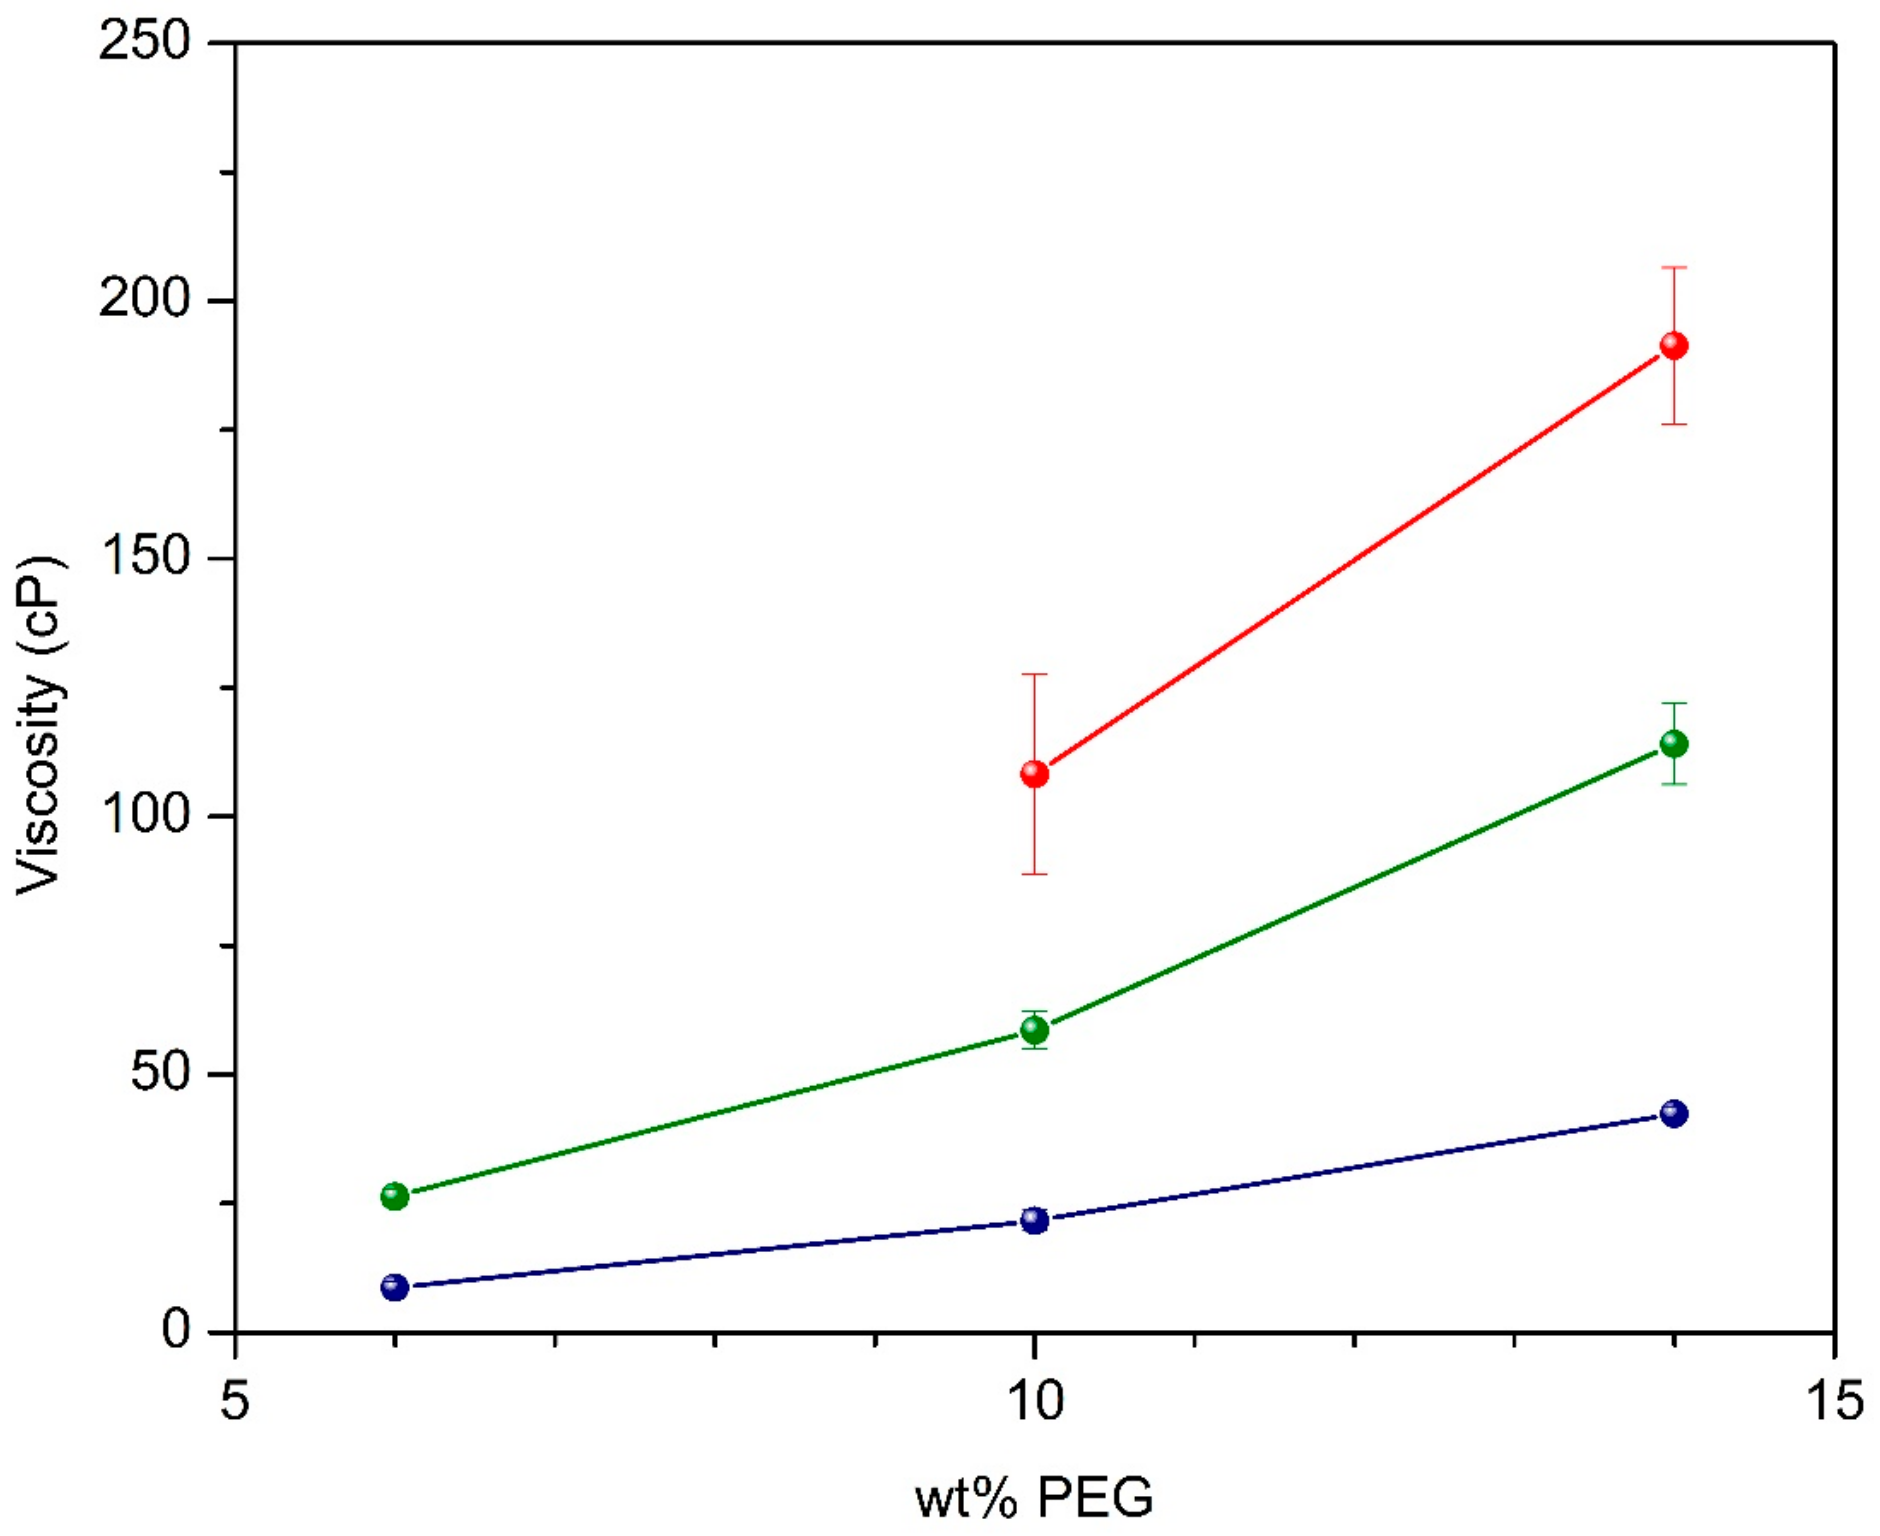
3.1. Studies of the Template System

Previously, we reported a new route to meso-macroporous ATO coatings around four or five µm thick. While this blend was optimized qualitatively, finding the formulation to produce self-standing reaction mixture that were also homogeneous was precluded by the sensitivity to slight changes in the amount of CB. One challenge for achieving homogeneity was related to the difficulty of dispersing CB in water, because the ATO sol-gel system that we use is aqueous. Dissolving PEG in the aqueous solvent allowed for the dispersion of CB, and for a homogeneous blend to form with the co-presence of CB and water upon high-shear mixing. Below roughly 6 wt % PEG, CB was not dispersible.
Viscosity measurements were performed on mixtures of CB and PEG in the comparable n-butanol-based solvent systems to find the optimal composition for producing self-standing coatings of the reaction mixture. Table 1 shows the CB and PEG amounts in the 12 mixtures that were prepared and studied, with measured viscosities in centipoise (cP) and comments on the viscous behavior. Non-Newtonian behavior was evident by the non-zero yield stress, and similar behavior was described for CB dispersions in 5 wt % PS in dibutylphthalate solutions [30] in which the yield stress of dispersions of acetylene CB aggregates increased sharply with the amount [31]. Gelation was observed around 5 wt % to 10 wt % CB in the reports [30,31], which mentioned that this elasto-plastic behavior was caused by the formation of a continuous network of solids that percolated throughout the fluid [30]. We observed a similar solidification around 5 wt %–7 wt % CB. The formation of a self-standing mixture at relatively low amounts of CB (~5 wt %) reflects the poor affinity between the CB and the dispersing matrix [30,33].
Figure 1 shows the measured viscosities of different mixture compositions reported in Table S1, which exhibit Newtonian behavior. The viscosity increases almost linearly with the amounts of PEG and of CB, and the line could intersect the origin. While the viscosity profiles (Figure S1) exhibit a slight shear-thickening behavior especially with more CB, this may be due to the proximity between the spindle and the vessel wall. Although we observe the trend that the viscosity increases with both CB and PEG amounts, there is one exception that we observed during our experiments. It is interesting to note that with 5 wt % CB, decreasing the amount of PEG from 10 wt % to 6 wt % causes the fluid to develop a non-zero yield stress, and the viscosity increases beyond the instrument’s capabilities. Figure S2 shows the viscosity profile measured for CB5–PEG6 (instrument’s limit), in comparison to those measured for the Newtonian liquids. The rheological properties warrant further study.
Presuming that the viscosity increase with CB addition is due to attractive forces between aggregates’ surfaces that prevents or resists slipping [34], the observation of decreasing viscosity with increasing PEG amount would be consistent with the notion that the PEG coats the CB aggregates’ surfaces, and keeps the aggregates isolated by reducing the surface interaction strength between aggregates.
In any event, the finite yield stress was desirable for our goal of producing coatings with controllable thicknesses. Without this property, the reaction mixture flowed out of the coating mask and pools at the edges. Having identified the template composition for achieving a finite yield stress, metal precursors were introduced to produce a reaction mixture of CB7–PEG10–ATO. Introducing the metal chloride precursors to the mixture CB7–PEG10 caused it to become fluidic again. The reason for this thinning behavior is still unknown, although the acidity from the hydrolysis of the metal precursor salts was ruled out by a control experiment with HCl, as was the structural water of SnCl4·5H2O. Recognizing the importance of having sufficient CB to produce the non-Newtonian mixture, CB7–PEG6 was utilized for preparing the self-standing reaction mixture with metal precursors. This reaction mixture, CB7–PEG6–ATO, was used for fabricating ATO coatings masked by varying the number of tape layers. Due to drawbacks that we discovered associated with using a non-Newtonian reaction mixture, the somewhat fluidic composition CB6.5–PEG5.6–ATO was also explored.

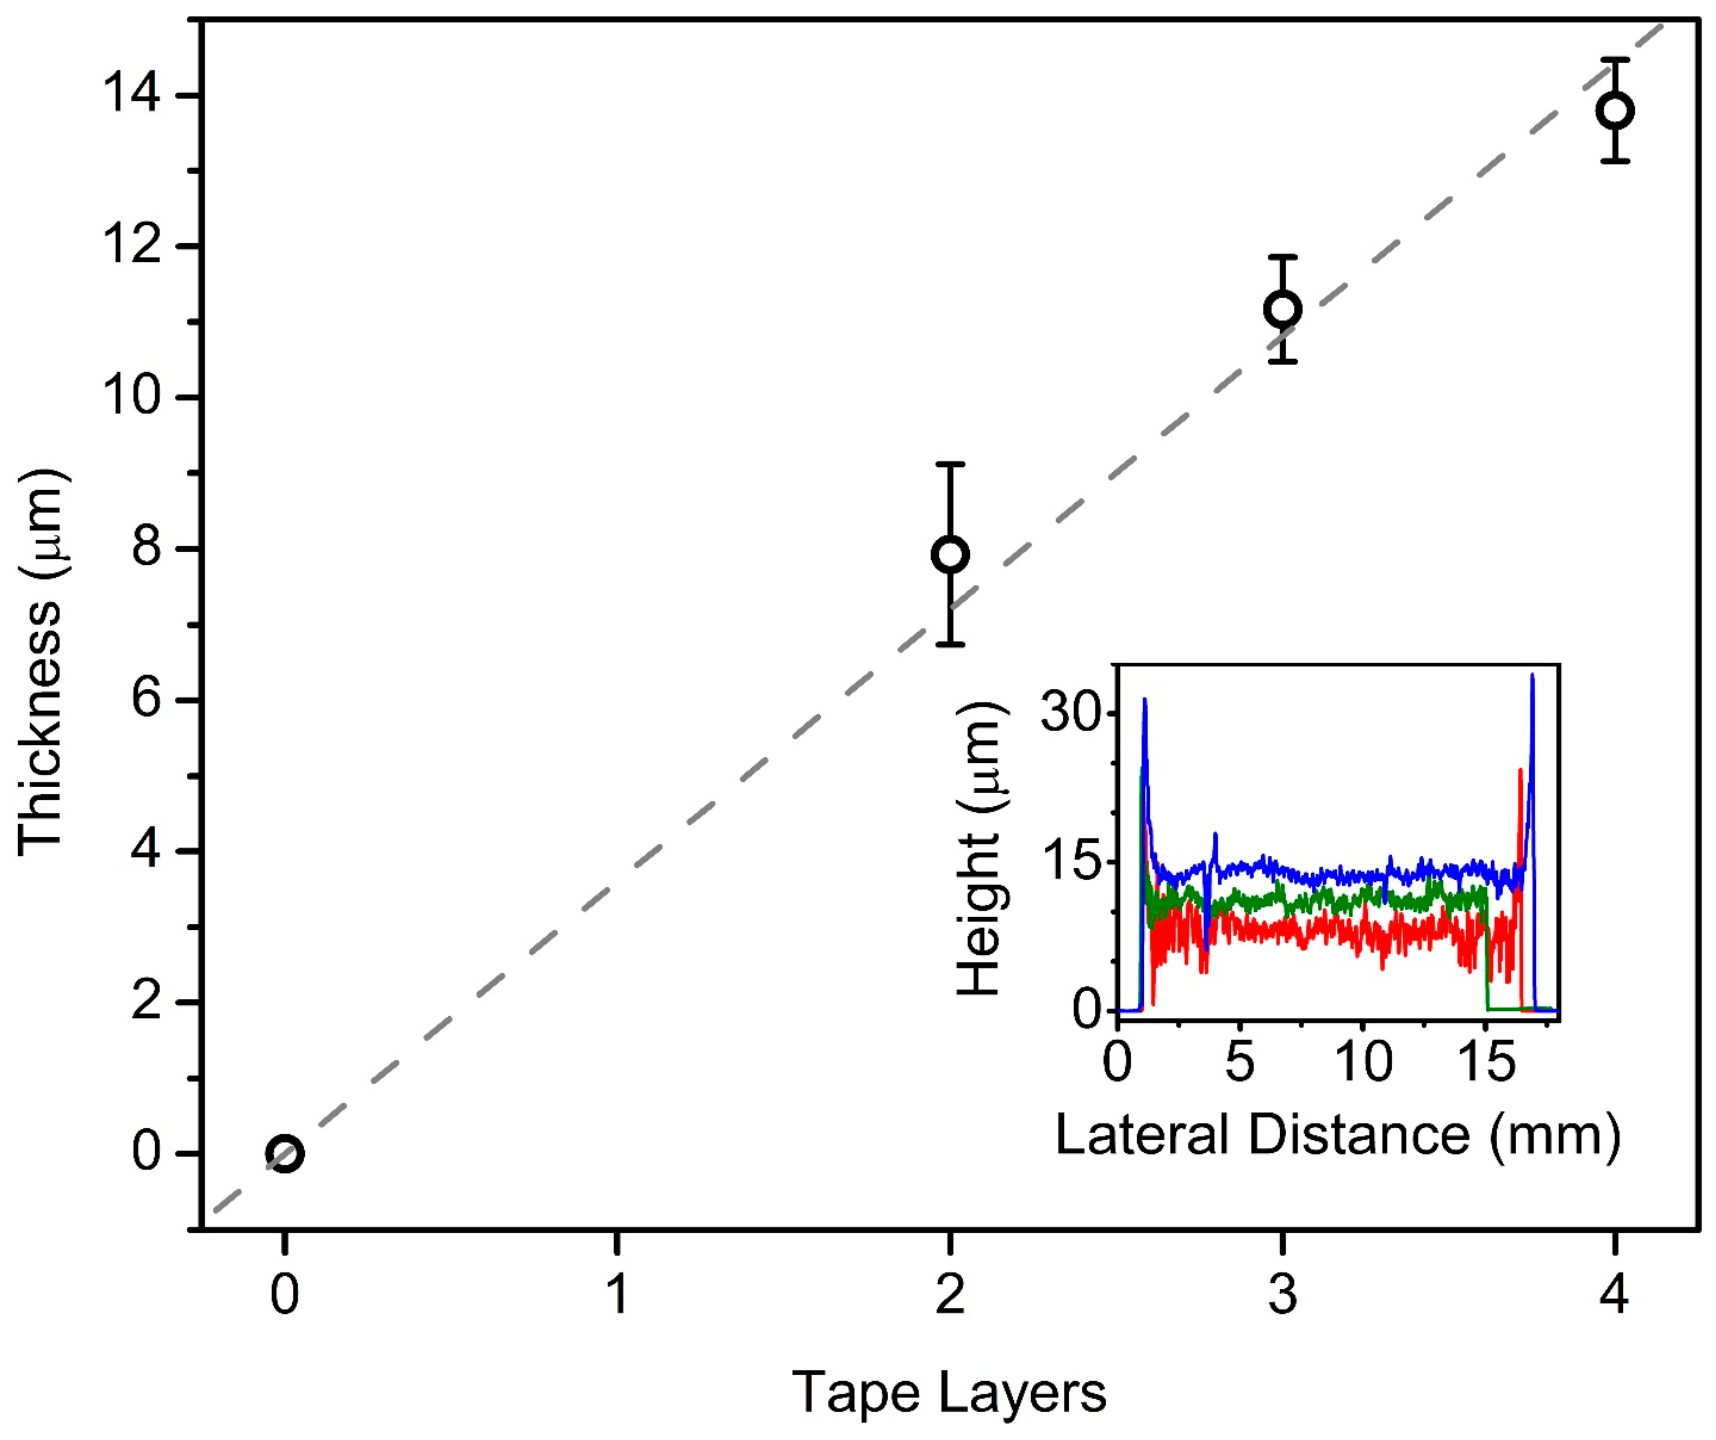
3.2. Fabrication and Characterization of Meso-Macroporous ATO Coatings with New Template System (CB7–PEG6–ATO)

Figure 2 shows SEM micrographs of the 4× CB7–PEG6–ATO coatings. As the 2× thick coatings made with CB5–PEG10–ATO, there appears to be some extent of cracking on the surface without peeling and the cracks are roughly 5–10 µm wide; however in this case the cracks are not continuous, and some are filled with the meso-macroporous ATO coating material as seen in Figure 2a. The texture of the meso-macropore structure, seen in Figure 2b, shows the open pore network at the surface. The pore structure at the surface appears the same for all coatings examined under SEM. Based on previous works, the mesopores may be around 20 nm [1], and consistent with the SEM image (Figure 2b), the macropore diameter is distributed mostly around 200 nm but range in size up to 2 µm [25].
Figure S3 shows the average thicknesses of coatings made with CB7–PEG6–ATO, taken from the profiles of calcined CB7–PEG6–ATO (inset). The jagged features in the profiles may be related to the cracks, while the fine variations can be attributed to the meso-macroporous structure. Error bars are drawn based on the standard deviation of the thickness across the coatings, which reveal pronounced bumps with a peak-to-valley height of roughly 10 µm for 2× and 3× thick coatings, and up to 25 µm for 4× (coatings severely cracked and delaminated from the FTO with five tape layers). With one tape layer, the connectivity of the ATO particles was poor and coatings were scraped away by the stylus. The thickness of the CB7–PEG6–ATO coatings (t) is reproducibly directly proportional to the thickness of the tape mask (x), indicated by the dashed gray trendline (t = 6.5x) that omits the 1× coating measurement. The dramatic variations in the thickness seem due to streaks that are, to some extent, symptomatic of our doctor blading procedure with non-Newtonian fluids. The large height variations can be avoided by using the slightly fluidic CB6.5–PEG5.6–ATO reaction mixture.
Figure 3 summarizes the stylus profile thickness measurements of CB6.5–PEG5.6–ATO coatings made using masks of varying thicknesses (inset; 2× (red), 3× (green) and 4× (blue)). While the 1× coating is scraped off by the stylus, the integrity of the coatings increases with the thickness. The gray trendline of the average thicknesses is drawn as t = 3.6x with R2 = 0.99, although the quadratic equation t = −0.26x2 + 0.45x fits better. The coating thickness is almost directly proportional to the mask thickness up to at least 15 µm, but the fluidity of the reaction mixture is likely responsible for an increasing amount of the volume flowing out with thicker tape masks, reflected by the better fit of the quadratic equation. Non-uniformities in the height appear on two length scales. Shallow peaks and valleys (~2–3 µm) appear across a lateral distance of ~5 mm from streaking, and the local height variation decreases from ~4 µm for 2× coatings to ~1–2 µm for 3× and 4× coatings.
In comparison to the previously reported stylus profile of 2× CB–PEG10–ATO coatings that were around four to five µm thick, and showed spikes in height at the edges [1,25], the coatings of 2× CB7–PEG6–ATO are 10–12 µm thick and of 2× CB6.5–PEG5.6–ATO are ~8 µm thick. Also, because pooling next to the tape mask does not occur due to the non-zero yield stress of CB7–PEG6–ATO, there is not a jump in the thickness at the edges as seen with coatings made with fluidic reaction mixtures [1,25]. Electrochemical and photovoltaic measurements of adsorbed biomolecules in the coatings demonstrate the viability of using thick meso-macroporous coatings as electrodes.

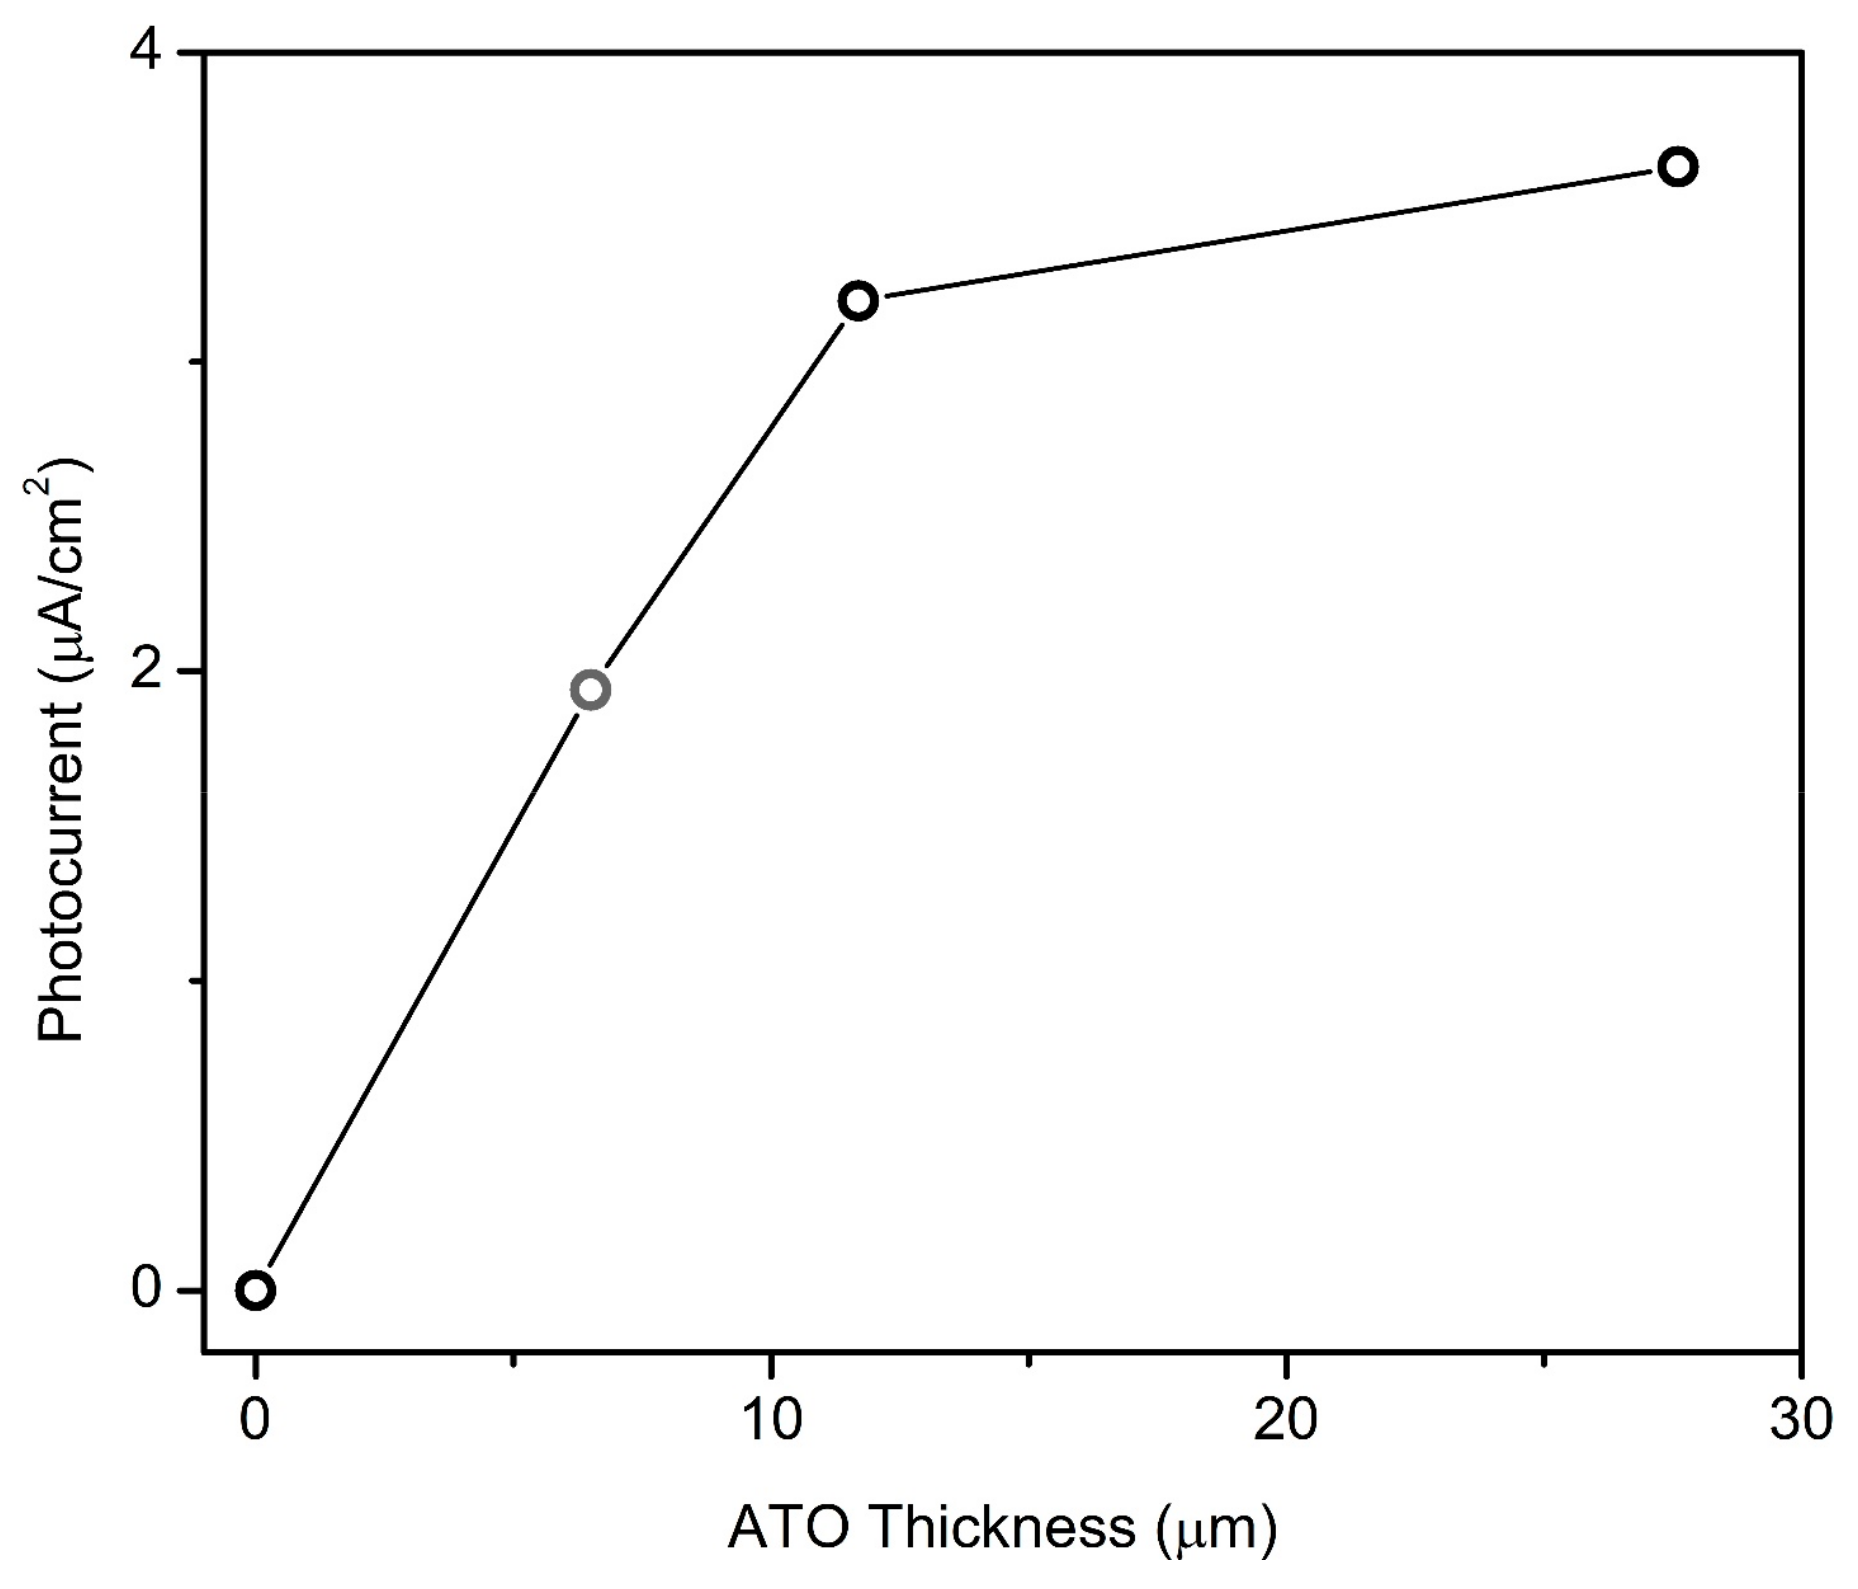
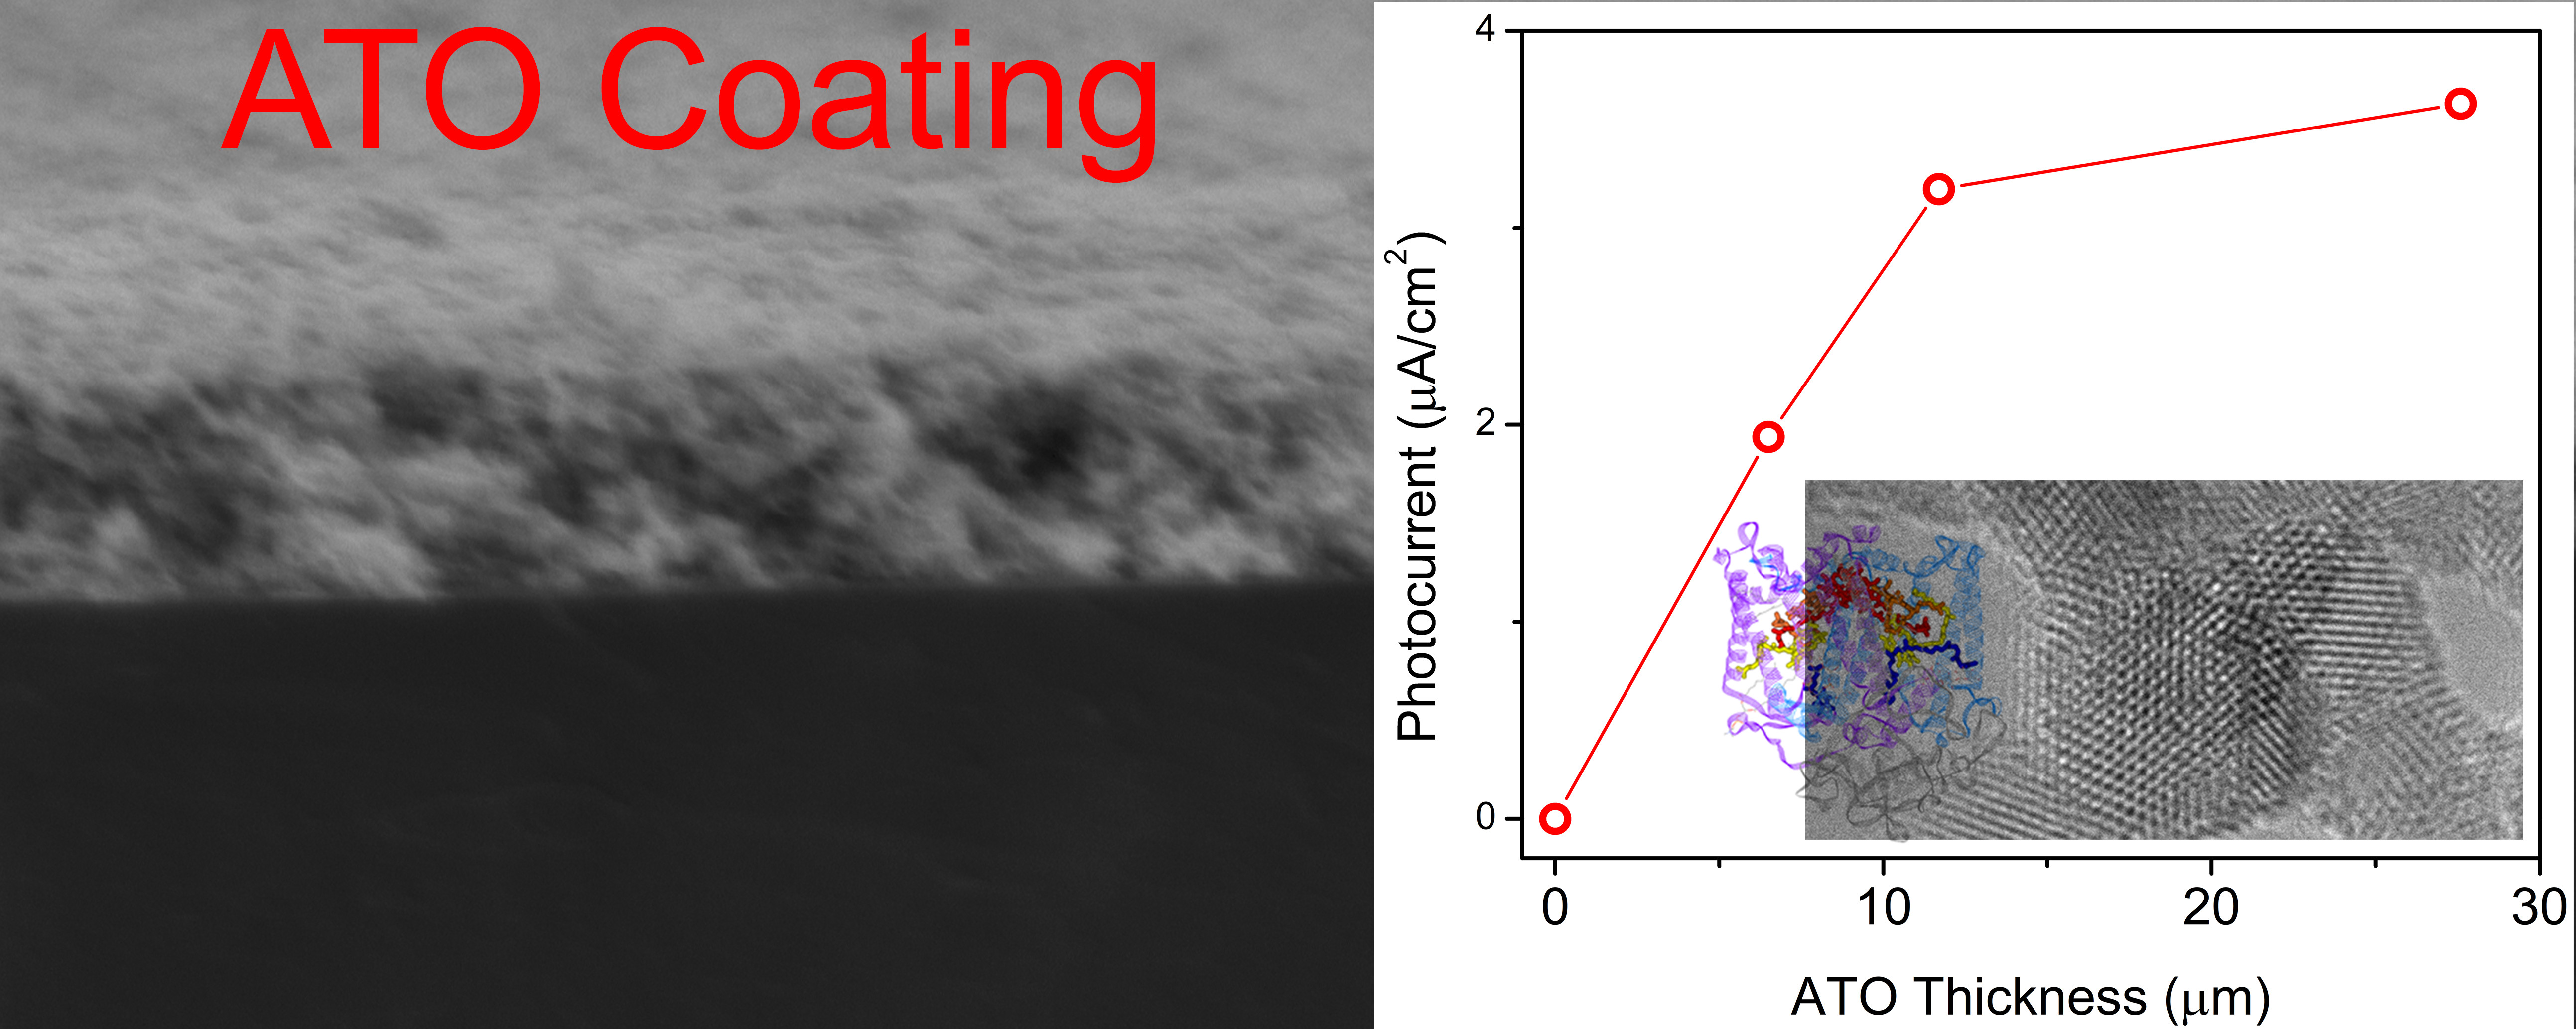
3.3. Biomacromolecule Modification and Electrochemical and Photovoltaic Studies

Cyclic voltammograms of meso-macroporous CB6.5–PEG5.6–ATO electrodes soaked in cyt c solution are shown in Figure 4a. Thicker coatings produce a higher current that is comprised of both the ATO coating and adsorbed cyt c; rinsed coatings also exhibit a stronger absorbance from cyt c, shown in Figure S4, which is not blank-subtracted although the blank spectra were negligible. The peaks located at 7 mV and at 22 mV are, respectively, attributed to the reduction and oxidation of the absorbed cyt c on the ATO surface which is in good agreement with the previous report using mesoporous ATO electrodes around [17]. The relatively small peak separation indicates that the protein retains its native functionality as it is adsorbed on the surface, although this behavior should be verified with slower voltage sweeps.
To understand how much of the cyt c is electroactive, cyclic voltammograms of the ATO substrates were approximated and subtracted from those in Figure 4a, and these corrected spectra are shown in Figure S5a. Additionally, the thickness of the 1× coating and the absorbance of the 3× coating were interpolated to calculate surface coverage of cyt c. Figure S5b shows the surface coverage of cyt c determined both electrochemically (circles) and spectroscopically (spheres) using an extinction coefficient of 106 mM−1·cm−1 at 410 nm [1,35]. While the data points are scattered, the comparison indicates that each tape layer adds ~840 pmol/cm2 to the surface coverage, and except for the 1× coating, the electrochemical method shows up to 25% lower surface coverage than the spectroscopic method. This discrepancy between the methods may be caused by cyt c that is present but not electroactive. Cyt c surface coverage on porous ATO electrodes has been reported as exceeding 1000 pmol/cm2 for ~400 nm thick mesoporous coatings [17,36]. Based on this previous work, the current meso-macroporous coatings provide roughly 10× lower surface coverage per thickness than mesoporous coatings, although the ability to fabricate thick coatings allows higher overall surface coverage. The cyt c modified coatings were further treated with RC, similarly to previous work, to produce photovoltaic electrodes [1].
Figure 4b summarizes the rate at which the total redox current (c, µA/cm2) increases with the increasing mask thickness. The equation c = −0.455x2 + 5.07x describes the relationship with R2 = 0.99. Although the thickness of the 1× coating was not confirmed by profilometry, the substantial redox current indicates that the coating adheres to the FTO glass in water. With respect to the measured thicknesses of the coatings, that is those using 2, 3 and 4 tape layers, the redox current increases linearly. Although further studies are needed such as electrode capacitance and elemental analysis with respect to thickness, this linearity indicates that the entire thickness of the coating is electrochemically accessible.
Figure S6 shows the absorbance spectra of the electrodes, whose characteristic peak positions and relative intensity ratios indicate that the conformation of the attached RC is not distorted. The maxima at 365 and 390 nm correspond to the Soret bands of the RC Bchls, while the peak at 408 nm corresponds to cyt c. As the thickness of the ATO is increased the absorption at 408 nm increases relative to the absorption by the RC, indicating that the relative amount of bound cyt c increases as the thickness of the ATO film is increased. There are no significant differences in the intensity at the absorption maxima relating to the RCs. This is likely because the spectra of these slides were collected prior to the measurement during which unbound RCs are washed away. Therefore, the absorbance indicates the total RC uptake rather than only RCs that are bound to incorporated cyt c molecules, that are responsible for generating photocurrent. Longer incubation times may result in greater incorporation of RCs into the deeper ATO pores and this should be explored. Since the measurements were performed in water, the transmittance of light in the visible range through the ATO coatings themselves was presumed to not be a limiting factor in the achievable photocurrent based on the observation that coatings in water are largely transparent (Figure S7).
The absorbed light was partially converted to a photocurrent, and the photoelectrochemical measurements under steady-state illumination conditions are summarized in Figure 5 for CB7–PEG6–ATO electrodes of varying thicknesses. Due to lack of an accurate thickness measurement of the 1× coating, the gray circle was placed using the observed linear relationship between coating thickness and tape layers. The photocurrent increased with the coating thickness, nearly linearly up to ~12 µm, and then with a diminishing gain for thicker coatings; the photocurrent seemed to level off approaching 4 µA/cm2, as the coating with ~12 µm thickness yielded 3.2 µA/cm2, and that with ~30 µm thickness yielded 3.6 µA/cm2 of photocurrent. Increasing the intensity of the light source resulted in a direct increase in the photocurrent, in that increasing the intensity by five times typically increased the photocurrent by 2–3 times. It is not clear to what extent the leveling-off of photocurrent with thicker coatings could be avoided by increasing the concentrations of RC and/or quinone, increasing the incubation time, or by increasing the intensity of the incident light. Another limitation may be that back-transfer of the electrons to the porous ATO electrode becomes more severe further from the FTO glass substrate. Along those lines, quantifying the uniformity of Sb:Sn through the thickness of the coating is important for performing more careful data analysis.

4. Conclusions

The acetylene black and PEG template mixture was systematically explored to determine the composition allowing for the fabrication of thick meso-macroporous coatings of ATO. With the reported template blend comprising 7 wt % acetylene black and 6 wt % PEG, coating thickness can be controlled up to ~25 µm, and with the blend comprising 6.5 wt % acetylene black and 5.5 wt % PEG the thickness can be controlled up to at least ~15 µm. The entire thickness is electrochemically accessible, revealed by the linear relationship between the thickness and the total current during cyclic voltammetry of cyt c modified electrodes. Photosynthetic reaction center was immobilized in the pores through cyt c, and photovoltaic measurements show the photocurrent reaching to almost 4 µA/cm2 under the experimental conditions. This new template system is translatable to a wide range of sol-gel systems to fabricate thick meso-macroporous coatings of various mixed metal oxides. Of particular interest is depositing meso-macroporous transparent conducting oxides that can be used for electrochemical communication with biomacromolecules, to be used both for fundamental studies and for advanced applications.

Supplementary Materials

The following are available online at https://www.mdpi.com/2079-6412/8/4/128/s1, Figure S1: Viscosity profiles of the template mixtures vs. shear rate, Figure S2: Viscosity profiles of the template mixtures vs. shear rate (Figure S1), and including the viscosity profile of the non-Newtonian sample CB5–PEG6, which also shows the instrument’s limit, Figure S3: Stylus profilometry measurements of meso-macroporous ATO coatings with tape layers of 1× (black), 2× (red), 3× (green) and 4× (blue), Figure S4: Absorbance spectra of cyt c soaked ATO coatings with tape layers of 1× (black), 2× (red), and 4× (blue), Figure S5: (a) Cyclic voltammograms from which the approximated ATO signal has been subtracted, and (b) Coverage of cyt c on the meso–macroporous electrodes calculated from cyclic voltammograms (circles) and by absorbance measurements (spheres), Figure S6: Absorbance spectra of the RC-treated ATO coatings, with tape layers of 1× (black), 2× (red), and 4× (blue), Figure S7: Photograph of 2× thick CB5–PEG10–ATO coatings on FTO glass, and onto the left coating has been dropped enough water to saturate the coating, Table S1: Precursor amounts to produce mixtures for viscosity measurement, and reaction mixtures for ATO coating deposition.

Acknowledgments

This work was funded by the DOD MURI Award W911NF-12-1-0420 and NSF Grant MCB-1157788.

Author Contributions

Dong-Kyun Seo and Alex Volosin proposed the initial work, Daniel Mieritz, Runli Liang and Dong-Kyun Seo conceived and designed the experiments; Daniel Mieritz and Runli Liang carried out the viscosity and synthesis experiments; Haojie Zhang and Anne-Marie Carey carried out the photoelectrochemical experiments, Shaojiang Chen performed characterizations, Su Lin and Neal Woodbury and Dong-Kyun Seo contributed the resources and provided guidance.

Conflicts of Interest

The authors declare no conflict of interest.

References

  1. Carey, A.-M.; Zhang, H.; Mieritz, D.; Volosin, A.; Gardiner, A.T.; Cogdell, R.J.; Yan, H.; Seo, D.-K.; Lin, S.; Woodbury, N.W. Photocurrent generation by photosynthetic purple bacterial reaction centers interfaced with a porous antimony-doped tin oxide (ATO) electrode. ACS Appl. Mater. Interfaces 2016, 8, 25104–25110. [Google Scholar] [CrossRef] [PubMed]
  2. Peters, K.; Lokupitiya, H.N.; Sarauli, D.; Labs, M.; Pribil, M.; Rathouský, J.; Kuhn, A.; Leister, D.; Stefik, M.; Fattakhova-Rohlfing, D. Nanostructured antimony-doped tin oxide layers with tunable pore architectures as versatile transparent current collectors for biophotovoltaics. Adv. Funct. Mater. 2016, 26, 6682–6692. [Google Scholar] [CrossRef]
  3. Jin, Q.; Li, Z.; Lin, K.; Wang, S.; Xu, R.; Wang, D. Synthesis of a hierarchically meso-macroporous TiO2 film based on UV light-induced in situ polymerization: Application to dye-sensitized solar cells. RSC Adv. 2014, 4, 44692–44699. [Google Scholar] [CrossRef]
  4. Seigo, I.; Keiji, I.; Ching-Ju, W.; Shoichiro, Y.; Tadashi, W. Dye-sensitized photocells with meso-macroporous TiO2 film electrodes. Bull. Chem. Soc. Jpn. 2000, 73, 2609–2614. [Google Scholar] [CrossRef]
  5. Tétreault, N.; Arsenault, É.; Heiniger, L.-P.; Soheilnia, N.; Brillet, J.; Moehl, T.; Zakeeruddin, S.; Ozin, G.A.; Grätzel, M. High-efficiency dye-sensitized solar cell with three-dimensional photoanode. Nano Lett. 2011, 11, 4579–4584. [Google Scholar] [CrossRef] [PubMed]
  6. Phadke, S.; Ho, J.; Birnie Iii, D.P. Emulsion templating to obtain dual-size-scale mesoporous titania coatings. Mater. Lett. 2009, 63, 2619–2621. [Google Scholar] [CrossRef]
  7. Phadke, S.; Du Pasquier, A.; Birnie, D.P. Enhanced electron transport through template-derived pore channels in dye-sensitized solar cells. J. Phys. Chem. C 2011, 115, 18342–18347. [Google Scholar] [CrossRef]
  8. Hong, J.-Y.; Bae, S.-E.; Won, Y.S.; Huh, S. Simple preparation of lotus-root shaped meso-/macroporous TiO2 and their DSSC performances. J. Colloid Interface Sci. 2015, 448, 467–472. [Google Scholar] [CrossRef] [PubMed]
  9. Ma, L.; Liu, M.; Peng, T.; Fan, K.; Lu, L.; Dai, K. Fabrication and properties of meso-macroporous electrodes screen-printed from mesoporous titania nanoparticles for dye-sensitized solar cells. Mater. Chem. Phys. 2009, 118, 477–483. [Google Scholar] [CrossRef]
  10. Schröder, M.; Sallard, S.; Böhm, M.; Einert, M.; Suchomski, C.; Smarsly, B.M.; Mutisya, S.; Bertino, M.F. An all low-temperature fabrication of macroporous, electrochemically addressable anatase thin films. Small 2014, 10, 1566–1574. [Google Scholar] [CrossRef] [PubMed]
  11. Kimura, T. Macroporous oxide platforms templated by non-close-packed spherical copolymer aggregates. Macromol. Rapid Commun 2013, 34, 423–430. [Google Scholar] [CrossRef] [PubMed]
  12. Nursam, N.M.; Wang, X.; Caruso, R.A. Macro-/mesoporous titania thin films: Analysing the effect of pore architecture on photocatalytic activity using high-throughput screening. J. Mater. Chem. A 2015, 3, 24557–24567. [Google Scholar] [CrossRef]
  13. Liu, W.; Wang, A.; Tang, J.; Chen, S.-L.; Yuan, G.; Zhao, K.; Li, C.; Liu, X. Preparation and photocatalytic activity of hierarchically 3D ordered macro/mesoporous titania inverse opal films. Microporous Mesoporous Mater. 2015, 204, 143–148. [Google Scholar] [CrossRef]
  14. Xu, J.; Yang, B.; Wu, M.; Fu, Z.; Lv, Y.; Zhao, Y. Novel N–F–Co doped TiO2 inverse opal with a hierarchical meso-/macroporous structure: Synthesis, characterization, and photocatalysis. J. Phys. Chem. C 2010, 114, 15251–15259. [Google Scholar] [CrossRef]
  15. Liu, Y.; Peters, K.; Mandlmeier, B.; Müller, A.; Fominykh, K.; Rathousky, J.; Scheu, C.; Fattakhova-Rohlfing, D. Macroporous indium tin oxide electrode layers as conducting substrates for immobilization of bulky electroactive guests. Electrochim. Acta 2014, 140, 108–115. [Google Scholar] [CrossRef]
  16. Chandra, D.; Bekki, M.; Nakamura, M.; Sonezaki, S.; Ohji, T.; Kato, K.; Kimura, T. Dye-sensitized biosystem sensing using macroporous semiconducting metal oxide films. J. Mater. Chem. 2011, 21, 5738–5744. [Google Scholar] [CrossRef]
  17. Kwan, P.; Schmitt, D.; Volosin, A.M.; McIntosh, C.L.; Seo, D.-K.; Jones, A.K. Spectroelectrochemistry of cytochrome c and azurin immobilized in nanoporous antimony-doped tin oxide. Chem. Commun. 2011, 47, 12367–12369. [Google Scholar] [CrossRef] [PubMed]
  18. Topoglidis, E.; Astuti, Y.; Duriaux, F.; Grätzel, M.; Durrant, J.R. Direct electrochemistry and nitric oxide interaction of heme proteins adsorbed on nanocrystalline tin oxide electrodes. Langmuir 2003, 19, 6894–6900. [Google Scholar] [CrossRef]
  19. Topoglidis, E.; Cass, A.E.G.; O’Regan, B.; Durrant, J.R. Immobilisation and bioelectrochemistry of proteins on nanoporous TiO2 and ZnO films. J. Electroanal. Chem. 2001, 517, 20–27. [Google Scholar] [CrossRef]
  20. Topoglidis, E.; Lutz, T.; Durrant, J.R.; Palomares, E. Interfacial electron transfer on cytochrome-c sensitised conformally coated mesoporous TiO2 films. Bioelectrochemistry 2008, 74, 142–148. [Google Scholar] [CrossRef] [PubMed]
  21. Li, Y.; Huang, K.; Liu, S.; Yao, Z.; Zhuang, S. Meso-macroporous Co3O4 electrode prepared by polystyrene spheres and carbowax templates for supercapacitors. J. Solid State Electrochem. 2011, 15, 587–592. [Google Scholar] [CrossRef]
  22. Moir, J.; Soheilnia, N.; O’Brien, P.; Jelle, A.; Grozea, C.M.; Faulkner, D.; Helander, M.G.; Ozin, G.A. Enhanced hematite water electrolysis using a 3D antimony-doped tin oxide electrode. ACS Nano 2013, 7, 4261–4274. [Google Scholar] [CrossRef] [PubMed]
  23. Arsenault, E.; Soheilnia, N.; Ozin, G.A. Periodic macroporous nanocrystalline antimony-doped tin oxide electrode. ACS Nano 2011, 5, 2984–2988. [Google Scholar] [CrossRef] [PubMed]
  24. Frasca, S.; Molero Milan, A.; Guiet, A.; Goebel, C.; Pérez-Caballero, F.; Stiba, K.; Leimkühler, S.; Fischer, A.; Wollenberger, U. Bioelectrocatalysis at mesoporous antimony doped tin oxide electrodes—Electrochemical characterization and direct enzyme communication. Electrochim. Acta 2013, 110, 172–180. [Google Scholar] [CrossRef]
  25. Mieritz, D.; Li, X.; Volosin, A.; Liu, M.; Yan, H.; Walter, N.G.; Seo, D.-K. Tracking single DNA nanodevices in hierarchically meso-macroporous antimony-doped tin oxide demonstrates finite confinement. Langmuir 2017, 33, 6410–6418. [Google Scholar] [CrossRef] [PubMed]
  26. Dong, R.; Wang, F.; Li, Z.; Chen, Z.; Zhang, H.; Jin, C. Honeycombed TiO2 films prepared by combining breath figure and sol gel methods. Surf. Coat. Technol. 2015, 276, 391–398. [Google Scholar] [CrossRef]
  27. Qi, L.; Birnie Iii, D.P. Templated titania films with meso- and macroporosities. Mater. Lett. 2007, 61, 2191–2194. [Google Scholar] [CrossRef]
  28. Park, J.T.; Lee, C.S.; Kim, J.H. One-pot synthesis of hierarchical mesoporous SnO2 spheres using a graft copolymer: Enhanced photovoltaic and photocatalytic performance. RSC Adv. 2014, 4, 31452–31461. [Google Scholar] [CrossRef]
  29. Nandiyanto, A.B.D.; Suhendi, A.; Kisakibaru, Y.; Ogi, T.; Okuyama, K. Generation of highly ordered porous antimony-doped tin oxide film by a simple coating method with colloidal template. IJCBS 2012, 6, 1142–1145. [Google Scholar]
  30. Aoki, Y.; Hatano, A.; Watanabe, H. Rheology of carbon black suspensions. I. Three types of viscoelastic behavior. Rheol. Acta 2003, 42, 209–216. [Google Scholar] [CrossRef]
  31. Aoki, Y. Rheological characterization of carbon black/polystyrene solution systems. J. Appl. Polym. Sci. 2008, 108, 2660–2666. [Google Scholar] [CrossRef]
  32. Dutta, P.K.; Levenberg, S.; Loskutov, A.; Jun, D.; Saer, R.; Beatty, J.T.; Lin, S.; Liu, Y.; Woodbury, N.W.; Yan, H. A DNA-directed light-harvesting/reaction center system. J. Am. Chem. Soc. 2014, 136, 16618–16625. [Google Scholar] [CrossRef] [PubMed]
  33. Aoki, Y. Rheology of carbon black suspensions. IV. Effect of suspending media on the sol–gel transition behavior. Rheol. Acta 2011, 50, 779–785. [Google Scholar] [CrossRef]
  34. Trappe, V.; Sandkühler, P. Colloidal gels—Low-density disordered solid-like states. Curr. Opin. Colloid Interface Sci. 2004, 8, 494–500. [Google Scholar] [CrossRef]
  35. Margoliash, E.; Frohwirt, N. Spectrum of horse-heart cytochrome c. Biochem. J. 1959, 71, 570–572. [Google Scholar] [CrossRef] [PubMed]
  36. Sharma, S.; Volosin, A.M.; Schmitt, D.; Seo, D.K. Preparation and electrochemical properties of nanoporous transparent antimony-doped tin oxide (ATO) coatings. J. Mater. Chem. A 2013, 1, 699–706. [Google Scholar] [CrossRef]
Figure 1. Viscosity measurements of various CB and PEG mixtures, where the blue data is without CB, green is with 3 wt % CB, and red is with 5 wt % CB.
Coatings 08 00128 g001
Figure 2. SEM micrographs of the 4× CB6–PEG7–ATO coatings: (a) an image of the coating on the sub-millimeter scale; and (b) a higher magnification image showing the hierarchal meso-macroporous structure.
Coatings 08 00128 g002
Figure 3. Stylus profilometry measurements of meso-macroporous antimony-doped tin oxide (ATO) coatings with tape layers of 1× (black), 2× (red), 3× (green) and 4× (blue).
Coatings 08 00128 g003
Figure 4. (a) Cyclic voltammograms of cyt c soaked meso-macroporous ATO coatings with varying thicknesses. (b) Mask thickness vs. total current of cyt c soaked slides.
Coatings 08 00128 g004
Figure 5. Photocurrent measurements of Rb. sphaeroides RC attached to cyt c modified ATO coatings with various thicknesses.
Coatings 08 00128 g005
Table 1. Viscous behavior of mixtures prepared with various carbon black (CB) and polyethylene glycol bisphenol A, epichlorohydrin copolymer (PEG) amounts. Samples indicated in bold are further discussed at more length in the text, and the compositional boundary between Newtonian and non-Newtonian behavior is shown by a line.
PEG Content0 wt % CB3 wt % CB5 wt % CB7 wt % CB
6 wt % PEG8.65 cP26.3 cPNon-NewtonianNon-Newtonian
10 wt % PEG21.6 cP58.5 cP108 cPNon-Newtonian
14 wt % PEG42.4 cP114 cP191 cPNon-Newtonian

