Article

Experimental Evaluation of Polyester and Epoxy–Polyester Powder Coatings in Aggressive Media

1
Faculty of Mechanical Engineering and Naval Architecture, University of Zagreb, Zagreb 10002, Croatia
2
Faculty of Mining, Geology and Petroleum Engineering, University of Zagreb, Zagreb 10002, Croatia
*
Author to whom correspondence should be addressed.
Coatings 2018, 8(3), 98; https://doi.org/10.3390/coatings8030098
Submission received: 13 February 2018 / Revised: 6 March 2018 / Accepted: 7 March 2018 / Published: 8 March 2018

Abstract

:
Protective coatings are the most widely used corrosion protection method for construction materials in different environmental conditions. They isolate metals from aggressive media, making the structure more durable. Today, alongside good anti-corrosive properties, coatings need to be safe for the environment and harmless to those who apply them. The high volatile organic compound (VOC) content in conventional solvent-borne coatings presents a huge ecological problem. A solution for indispensable solvent emission reduction is the application of powder coatings. This study evaluates the corrosion performance and surface morphology of polyester and epoxy–polyester powder coatings. Electrochemical impedance spectroscopy (EIS), open circuit potential (OCP) measurement, salt spray chamber and humidity chamber testing followed by adhesion testing were used to investigate the protective properties of powder coatings. Scanning electron microscope (SEM) with energy-dispersive X-ray spectroscopy (EDX) was used to analyse the surface morphology and chemical composition, whereas the microstructure and coating uniformity were determined by optical microscope examination. The research revealed a negative influence of coating surface texture on coating thickness and consequently a lack of barrier and adhesion properties. The epoxy–polyester powder coating showed a better performance than the polyester coating. All tested coatings showed uniform structure.

1. Introduction

Electrostatic powder coating originated in the USA in the 1950s. For years, it has been extensively used for painting processes in the automotive industry. Compared to traditional coatings, it provides even, uniform and reproducible coatings with less waste [1]. The electrostatic coating process starts by electrostatically charging the powder. At the spray gun exit, charged particles repel each other, and spread evenly [2] on the object which is oppositely charged or grounded. The electrostatic attraction between the powder particles and the object allows the powder to adhere to the surface, forming an even coating [3,4]. The application of the electrostatic powder coating is followed by a high-temperature curing process, which provides a smoothly-coated surface. The powder is charged using either a corona or tribo-charging spray gun [3]. In the case of corona-charging, the powder particles pass through an ion-rich area and become charged based on their permittivity. Tribo-charging is based on the frictional charging of powder that is transported through a pipe of a specific material, such as polytetrafluoroethylene (PTFE), metal or other powder particles [1,5]. The powder particles are more extensively spread and have a higher transfer efficiency at higher charge [6]. Since tribo-charging generates less charge on powder particles, corona-charging is generally used for electrostatic powder coating [1]. Today, thanks to the commercial success and wide application of powder coatings, extensive research is carried out in this field of study, in particular in the powder coating chemistry [5].
Compared to liquid paints, powder coatings feature several advantages including the absence of volatile organic content, the reduction in coating material loss (up to 68%), the reduction of dust formation (from 40% to 84%) [1], high utilization rates, fast curing, the minimal health risks involved, and the elimination of hazardous wastes [7]. However, a major disadvantage of electrostatic coating technology is that the curing of the powder coating requires a significant amount of heat energy. For this reason, the future of these technologies will include the development of low temperature curable (LTC) powder coatings, whose application will enable energy saving solutions and also the ability to coat heat-sensitive substrates [8]. The second disadvantage is the lack of coating uniformity in Faraday-cage areas. Aside from several challenges needing improvement, powder coating is an environmentally-friendly coating process with good performance properties.
There are numerous methods to evaluate the corrosion performance of powder coatings. Mafi et al. [5] investigated the protective behaviour of powder coatings in 3.5% w/w NaCl solution using electrochemical impedance spectroscopy (EIS) and open circuit potential (OCP) measurement, as well as differential scanning calorimetry (DSC) and dynamic mechanical thermal analysis (DMTA). Bhadu et al. [9] studied the properties of two polyester-based powder coatings using electrochemical impedance spectroscopy in 3.5% w/w NaCl solution, the salt spray test, and scanning electron microscope (SEM) analysis. Both papers [5,9] showed better protective properties of epoxy–polyester powder coating compared to polyester powder coating, which is attributed to the higher cross-linked density of the epoxy-based powder.
In this paper, the protective properties of two epoxy–polyester and two polyester powder coatings with rough and smooth surface textures were evaluated in different aggressive media, that is, in 4% w/w NaOH solution using the EIS method, evaluated in a humid and warm atmosphere using humidity chamber testing and in a marine environment using the salt spray chamber testing. The structure, morphology, and uniformity of powder coatings were analysed by SEM and EDX analysis. The results were discussed regarding the chemical composition of the binder and coating thickness, which was strongly affected by surface textures. The coatings were provided by four different manufacturers, and are commonly used in switch-gear cabinet production.

2. Materials and Methods

Mild steel plates with the dimensions 100 mm × 150 mm × 3 mm were chemically pre-treated using iron phosphating in a bath and a 0.5−2 µm thick Fe-phosphate coating was obtained. Subsequently, the epoxy–polyester and polyester powder coatings with different surface textures, used for indoor and outdoor exposure, were applied to the pre-treated samples using a PG1 electrostatic spray gun, with spraying parameters of 98 kV, 100 µA, and 17 kHz. The powder-coated samples were then cured in an oven for about 20 min at 185–200 °C. Table 1 presents technical data for the tested powder coatings.
The dry-film thickness (DFT) of the cured powder coated samples was measured with a non-destructive magnetic induction method using an Elcometer 456 instrument (Elcometer Limited, Manchester, UK), according to ISO 2808 [10]. Measurements were performed on ten different locations per sample. The coating adhesion was determined using the Zehntner cross-cut device (Zehntner GmbH Testing Instruments, Sissach, Switzerland), according to ISO 2409 [11].
The 240-h salt spray and humidity chamber tests were used as accelerated laboratory tests to predict the corrosion performance of the powder coatings [5,12,13]. The salt chamber testing was conducted in 5% neutral NaCl solution in an Ascott cabinet, model S450 (Ascott Analytical Equipment Limited, Staffordshire, UK), according to ISO 9227 [14]. The humidity test was conducted according to ISO 6270-2 [15]. The samples were periodically examined according to ISO 4628 [16] in order to evaluate the degradation of coatings [17]. The accelerated testing was performed on two samples per each powder coating.
The corrosion/stability tendency in the NaOH solution was assessed by measuring the open circuit potential (OCP) [5]. The open circuit potential of the polyester and epoxy–polyester powder-coated samples was measured against the saturated calomel electrode (SCE) as the reference electrode [5] in 4% w/w NaOH solution, pH = 12, at room temperature (23 ± 2) °C.
The protective properties of the powder coatings were investigated by electro-chemical impedance spectroscopy [9,18], with a VersaSTAT 3 Potentiostat/Galvanostat (AMETEK Scientific 131 Instruments, Princeton applied research, Berwyn, PA, USA). The measurements were carried out after one hour and after 100 h of immersion in 4% w/w NaOH solution, pH = 12, at room temperature (23 ± 2) °C. The impedance spectra were performed at open circuit potential (OCP) with a 10 mV sinusoidal amplitude. The frequency range was from 100 kHz to 100 mHz. A three-electrode cell including a coated metal sample as the working electrode, a saturated calomel electrode (SCE) as the reference electrode and graphite sticks as the auxiliary electrodes were used in the experiments [12]. The surface of the working electrode was 1 cm2. The EIS measurements were repeated three times for each sample. The Solartron Z-View 2.2 software was used to interpret data.
The surface morphology and the microstructure of the powder coatings were observed by an Olympus GX51 (Olympus Corporation, Tokyo, Japan) inverted metallurgical microscope and a Tescan scanning electron microscope (SEM) (TESCAN Brno, Brno, Czech Republic) equipped with Oxford Instruments energy dispersive spectroscopy (EDX) (Oxford Instruments, Belfast, UK). The energy used for analysis was 20 keV.

3. Results and Discussion

3.1. Coating Thickness Measurement

By measuring the coating thickness (ISO 2808), a large scatter of the results for the applied polyester coating with rough river surface texture (sample B) was found, with a minimum coating thickness of 40.4 µm. In other samples, greater variations in thickness were not determined. The average coating thickness was about 100 μm.

3.2. Chamber Testing Results

The accelerated corrosion tests in the salt spray (ISO 9227) and the humidity (ISO 6270-2) chamber for a period of 10 days (240 h) did not show any blistering and rusting of the undercoated surface, according to ISO 4628 [16]. Corrosion appeared only on the hole through which the samples were suspended on a metal hook for grounding. At the hole, the metal hook physically disabled the access for coating application. This is certainly a drawback of electrostatic powder coating application because such places need to be repaired additionally with a brush or spray. The corrosion on the edges of the samples was not taken into consideration.
After the corrosion test, samples BV 1 and BV 2, which were exposed to the humidity chamber, showed extremely poor adhesion—Gt = 5 (extreme flaking)—whereas the samples BS 1 and BS 2, after testing in the salt spray chamber, showed excellent adhesion—Gt = 0—according to ISO 2409 [11]. The samples tested in the salt spray chamber were protected with a greater coating thickness. The adhesion to the other tested samples in the salt spray chamber and the humidity chamber was classified as Gt = 0. The test revealed a strong negative influence of low coating thickness on the adhesion of powder coatings in a humid environment. Prior to the corrosion tests, all the samples had shown excellent adhesion Gt = 0 (no flaking). The chemical composition of the powder coating binder had no influence on the coating protection properties during 240 h of accelerated chamber testing.
The results of powder coating dry-film thickness and corrosion testing after 240 h in the salt spray chamber and the humidity chamber, as well as the subsequent adhesion tests, are provided in Table 2 and Table 3.

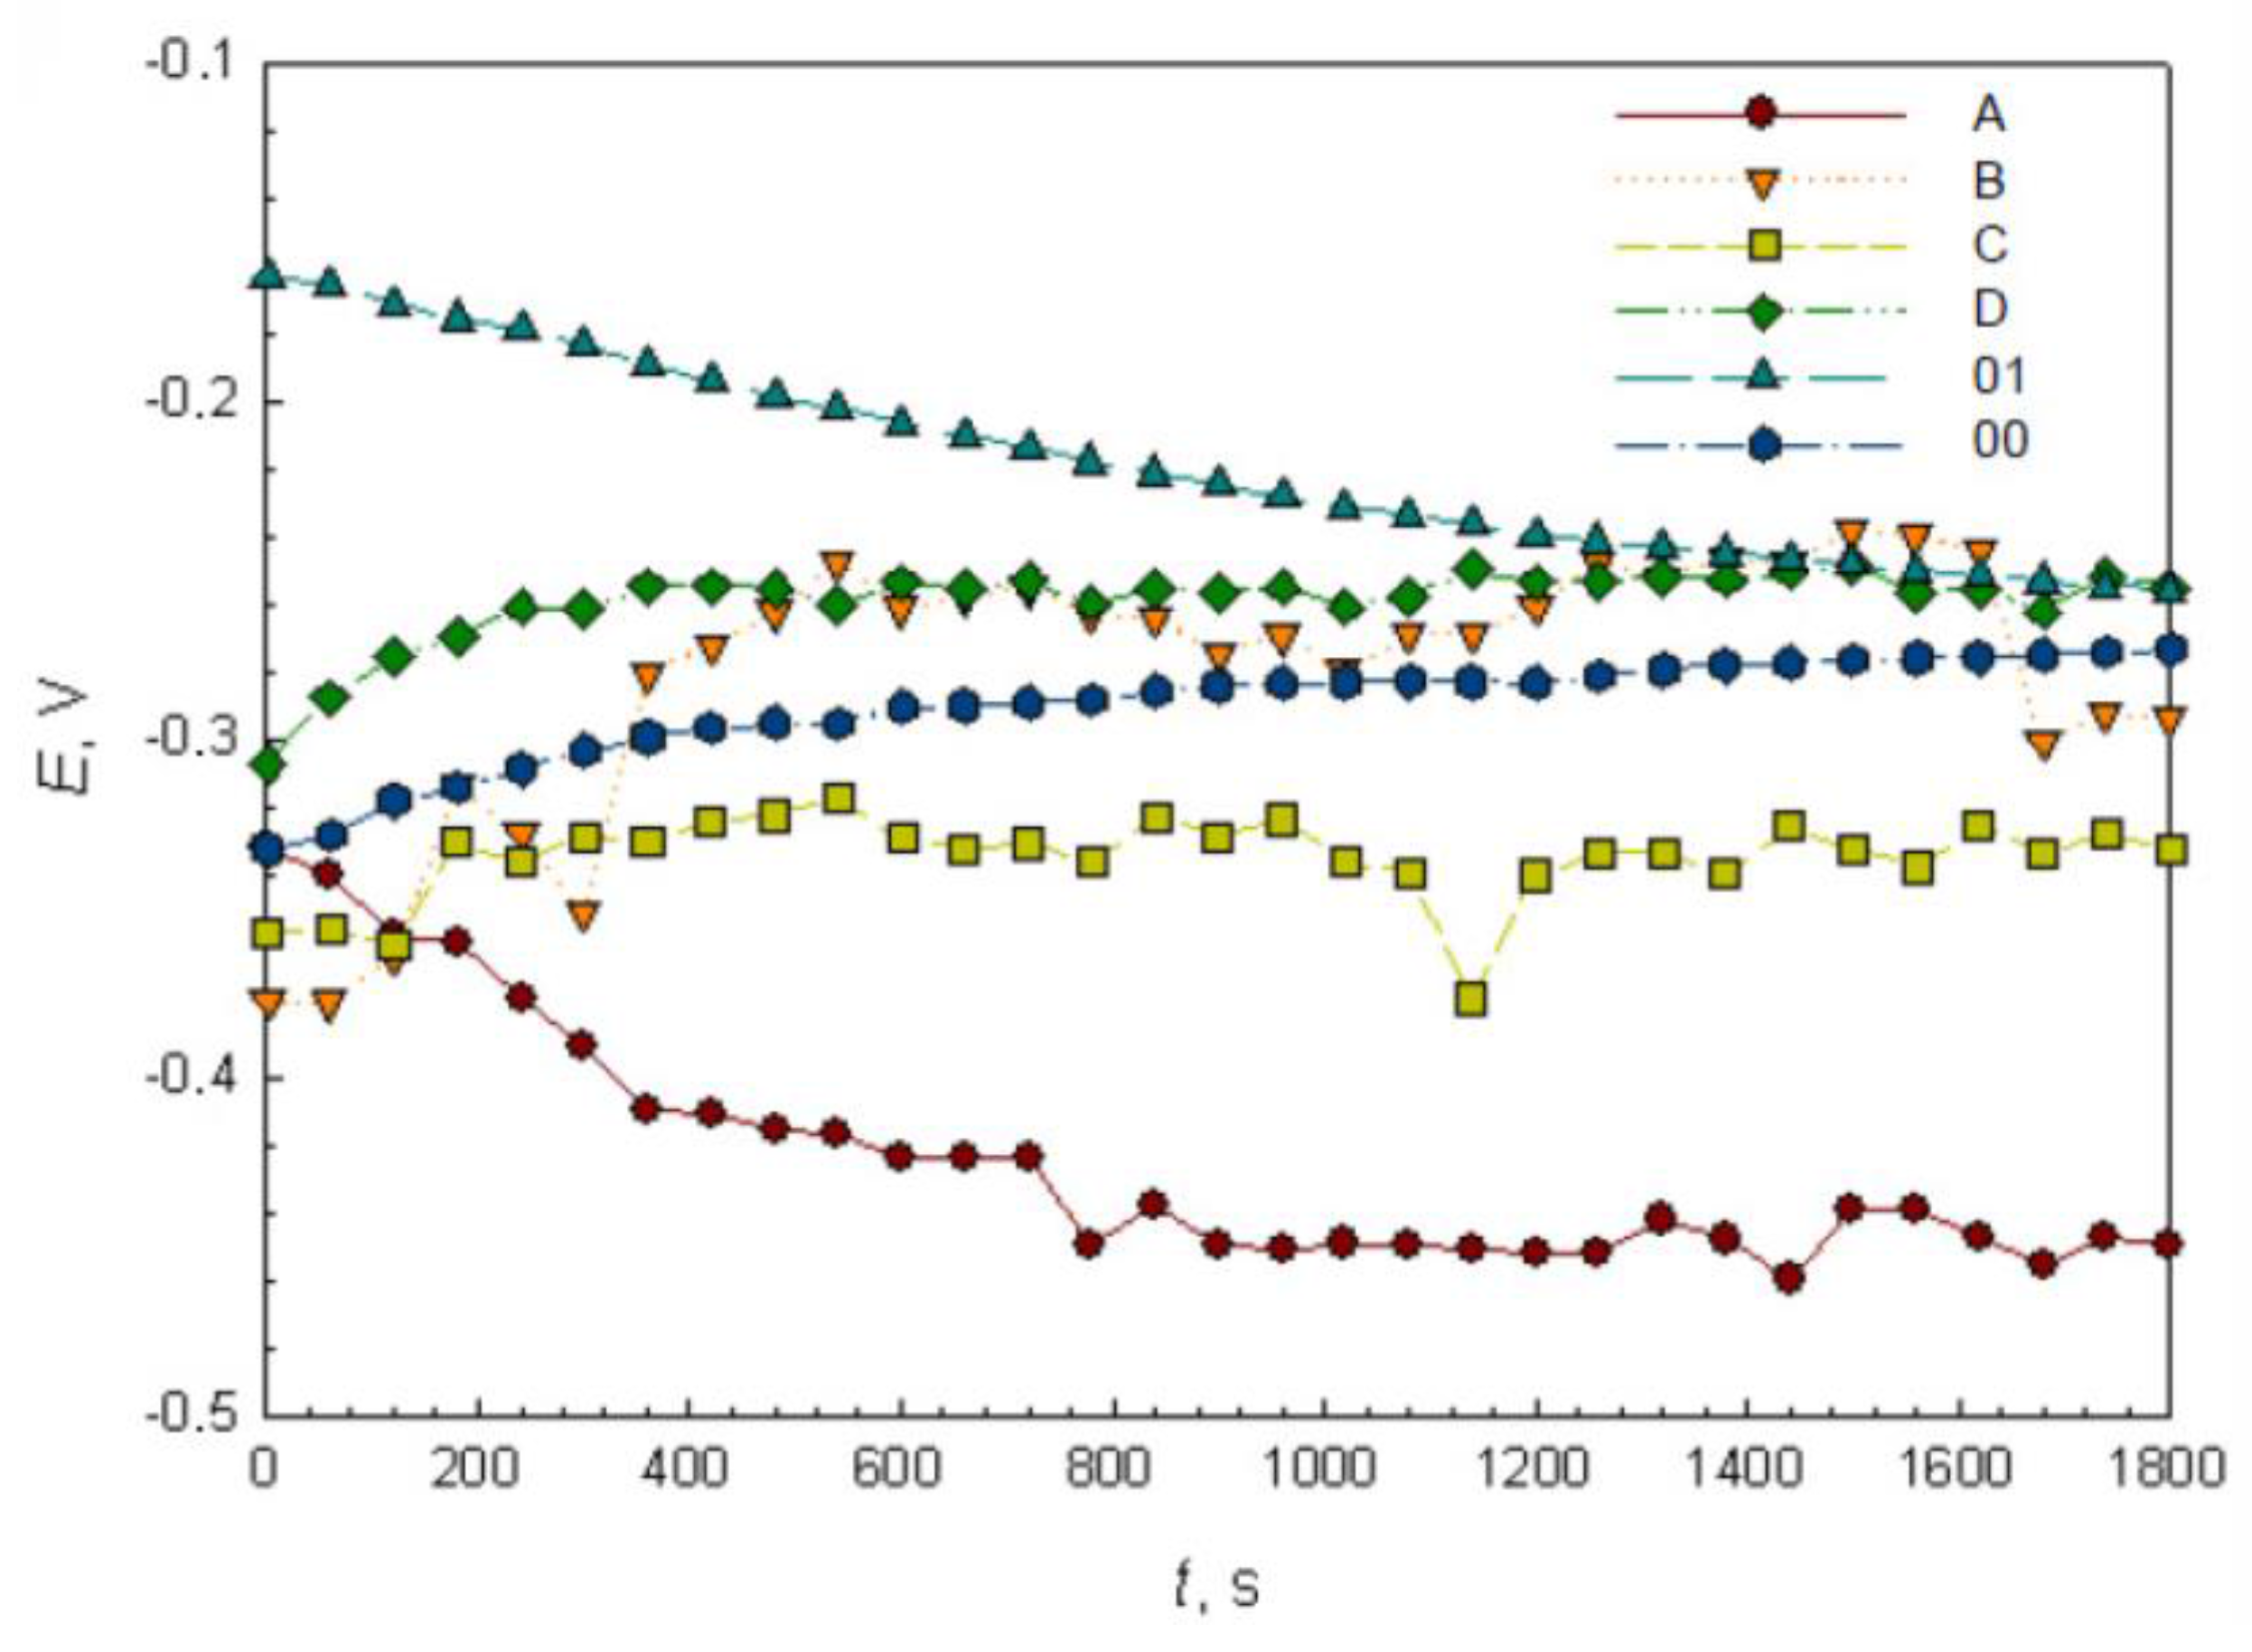
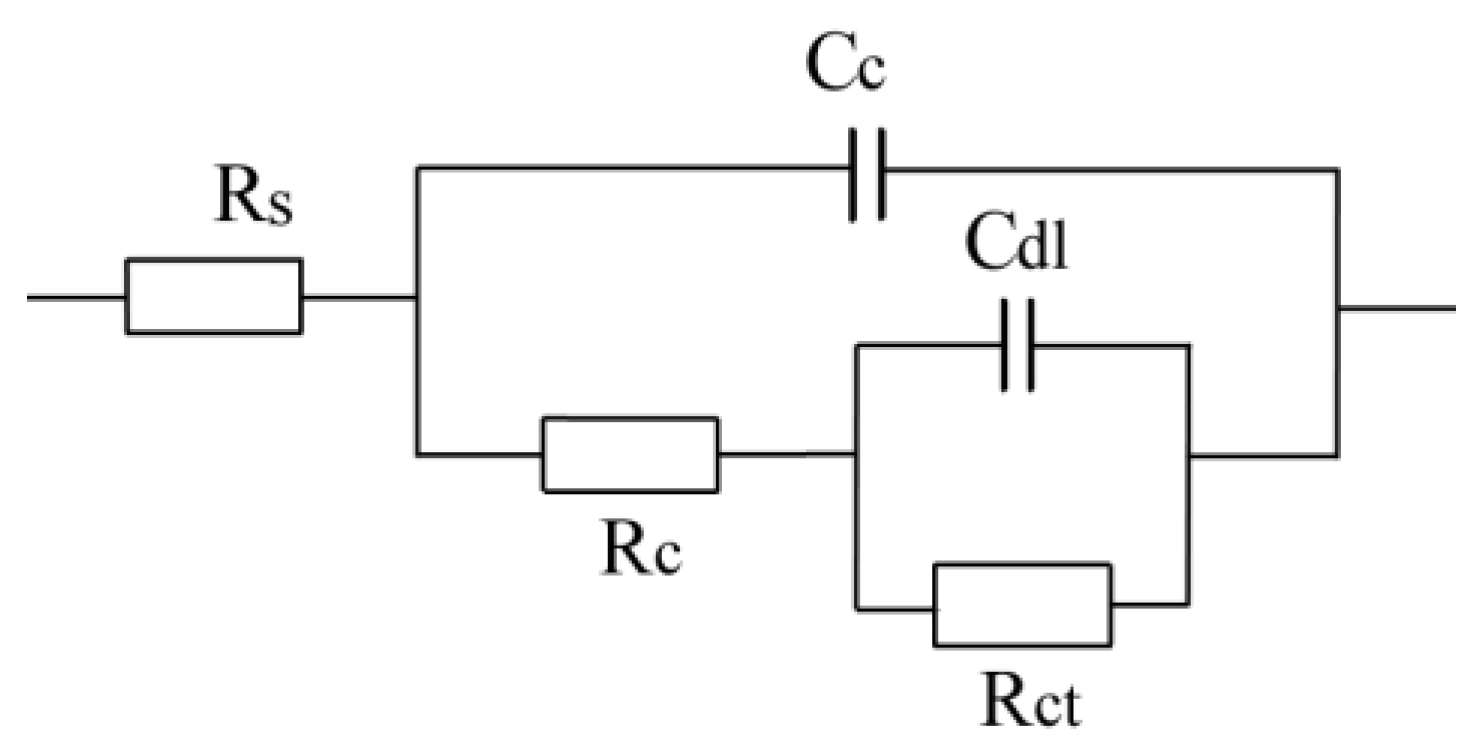
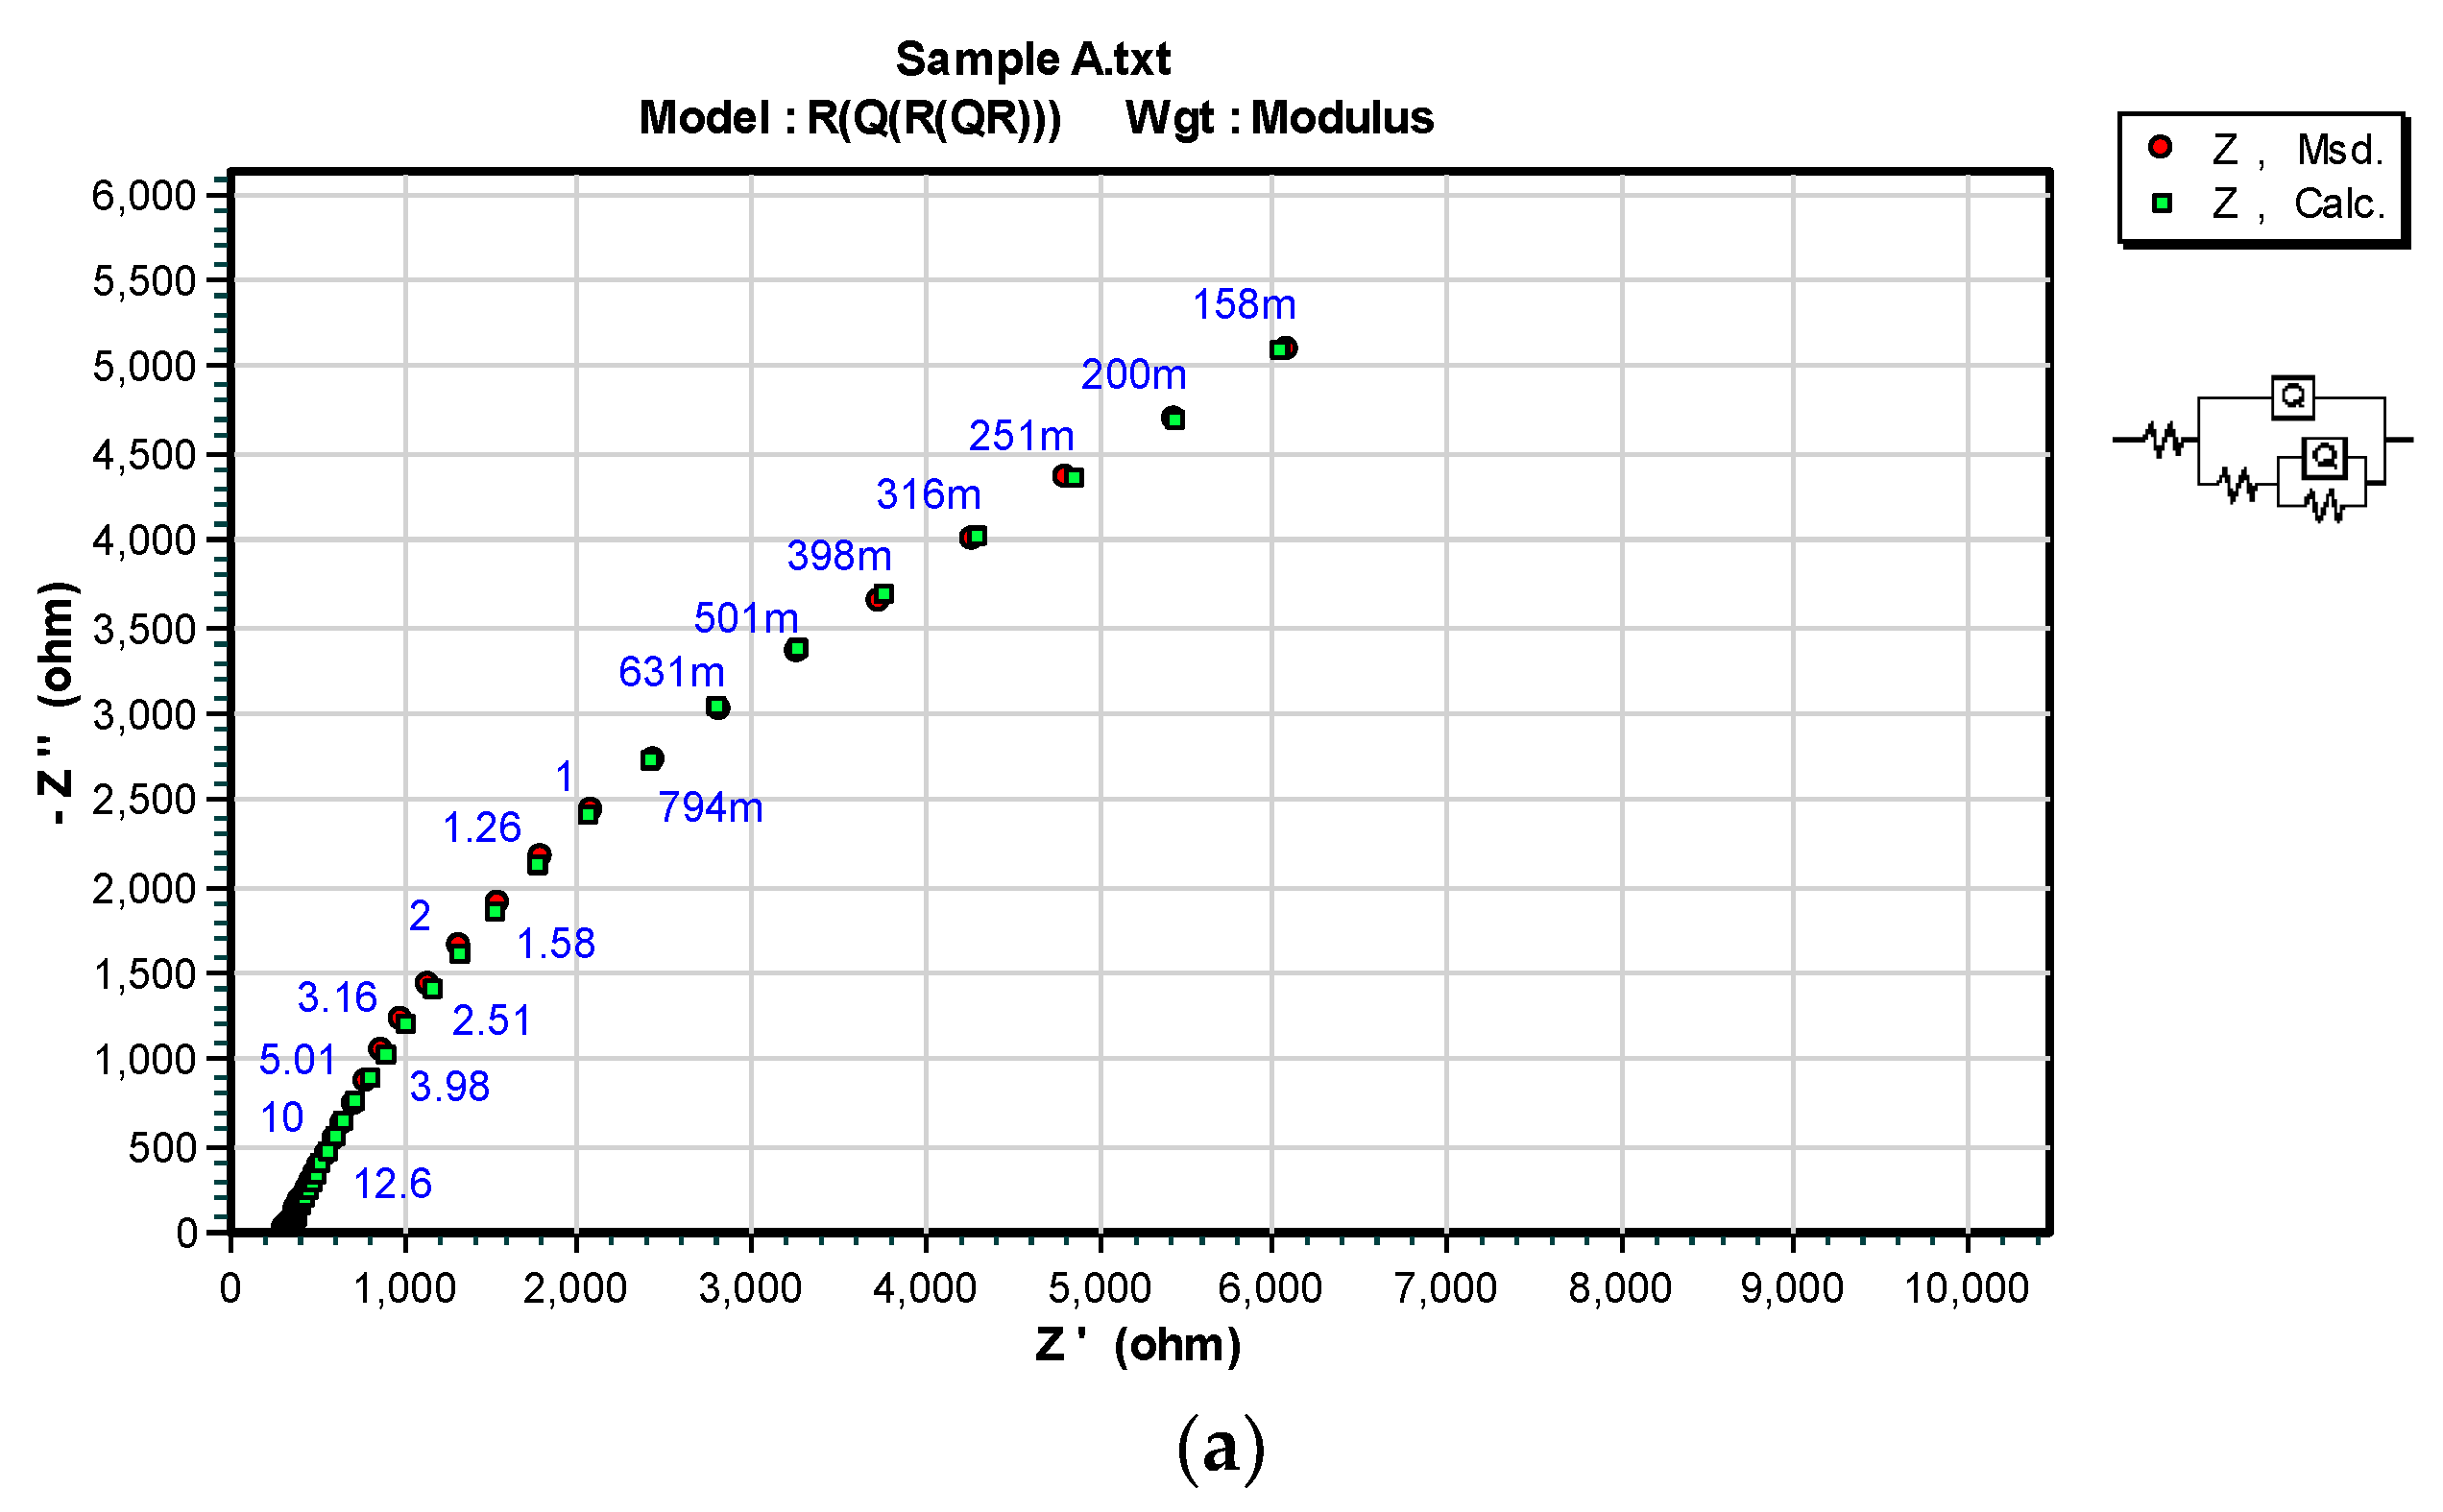
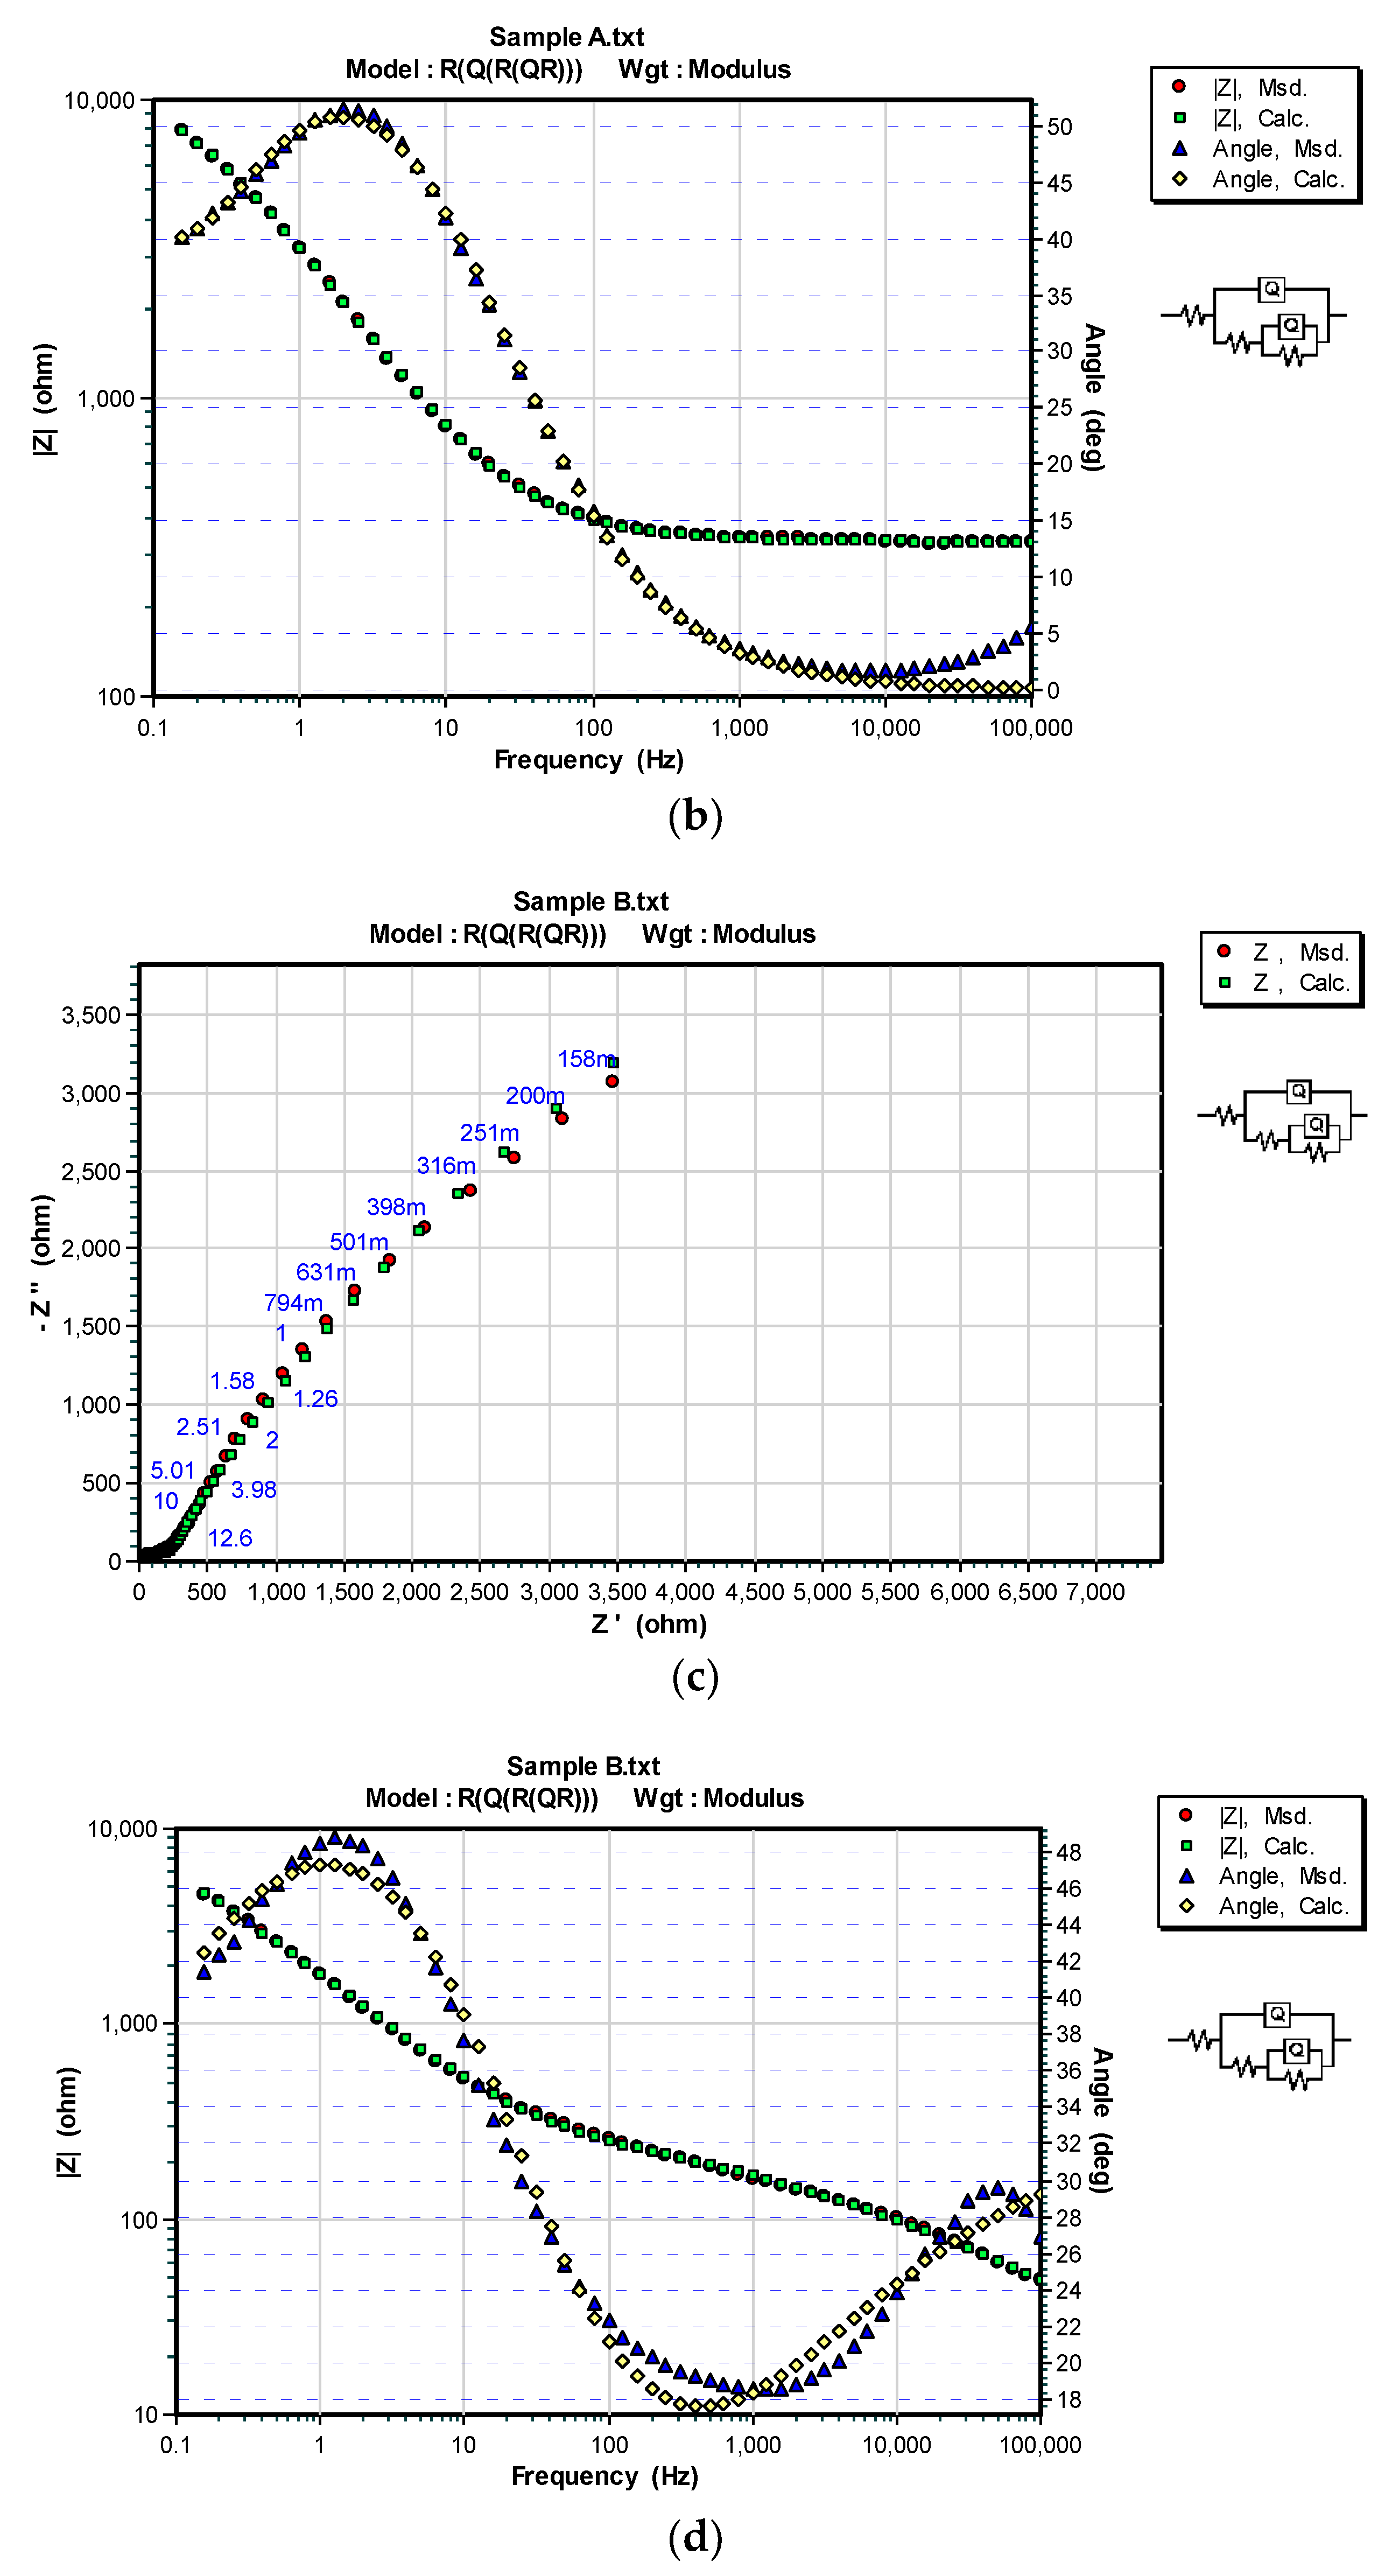
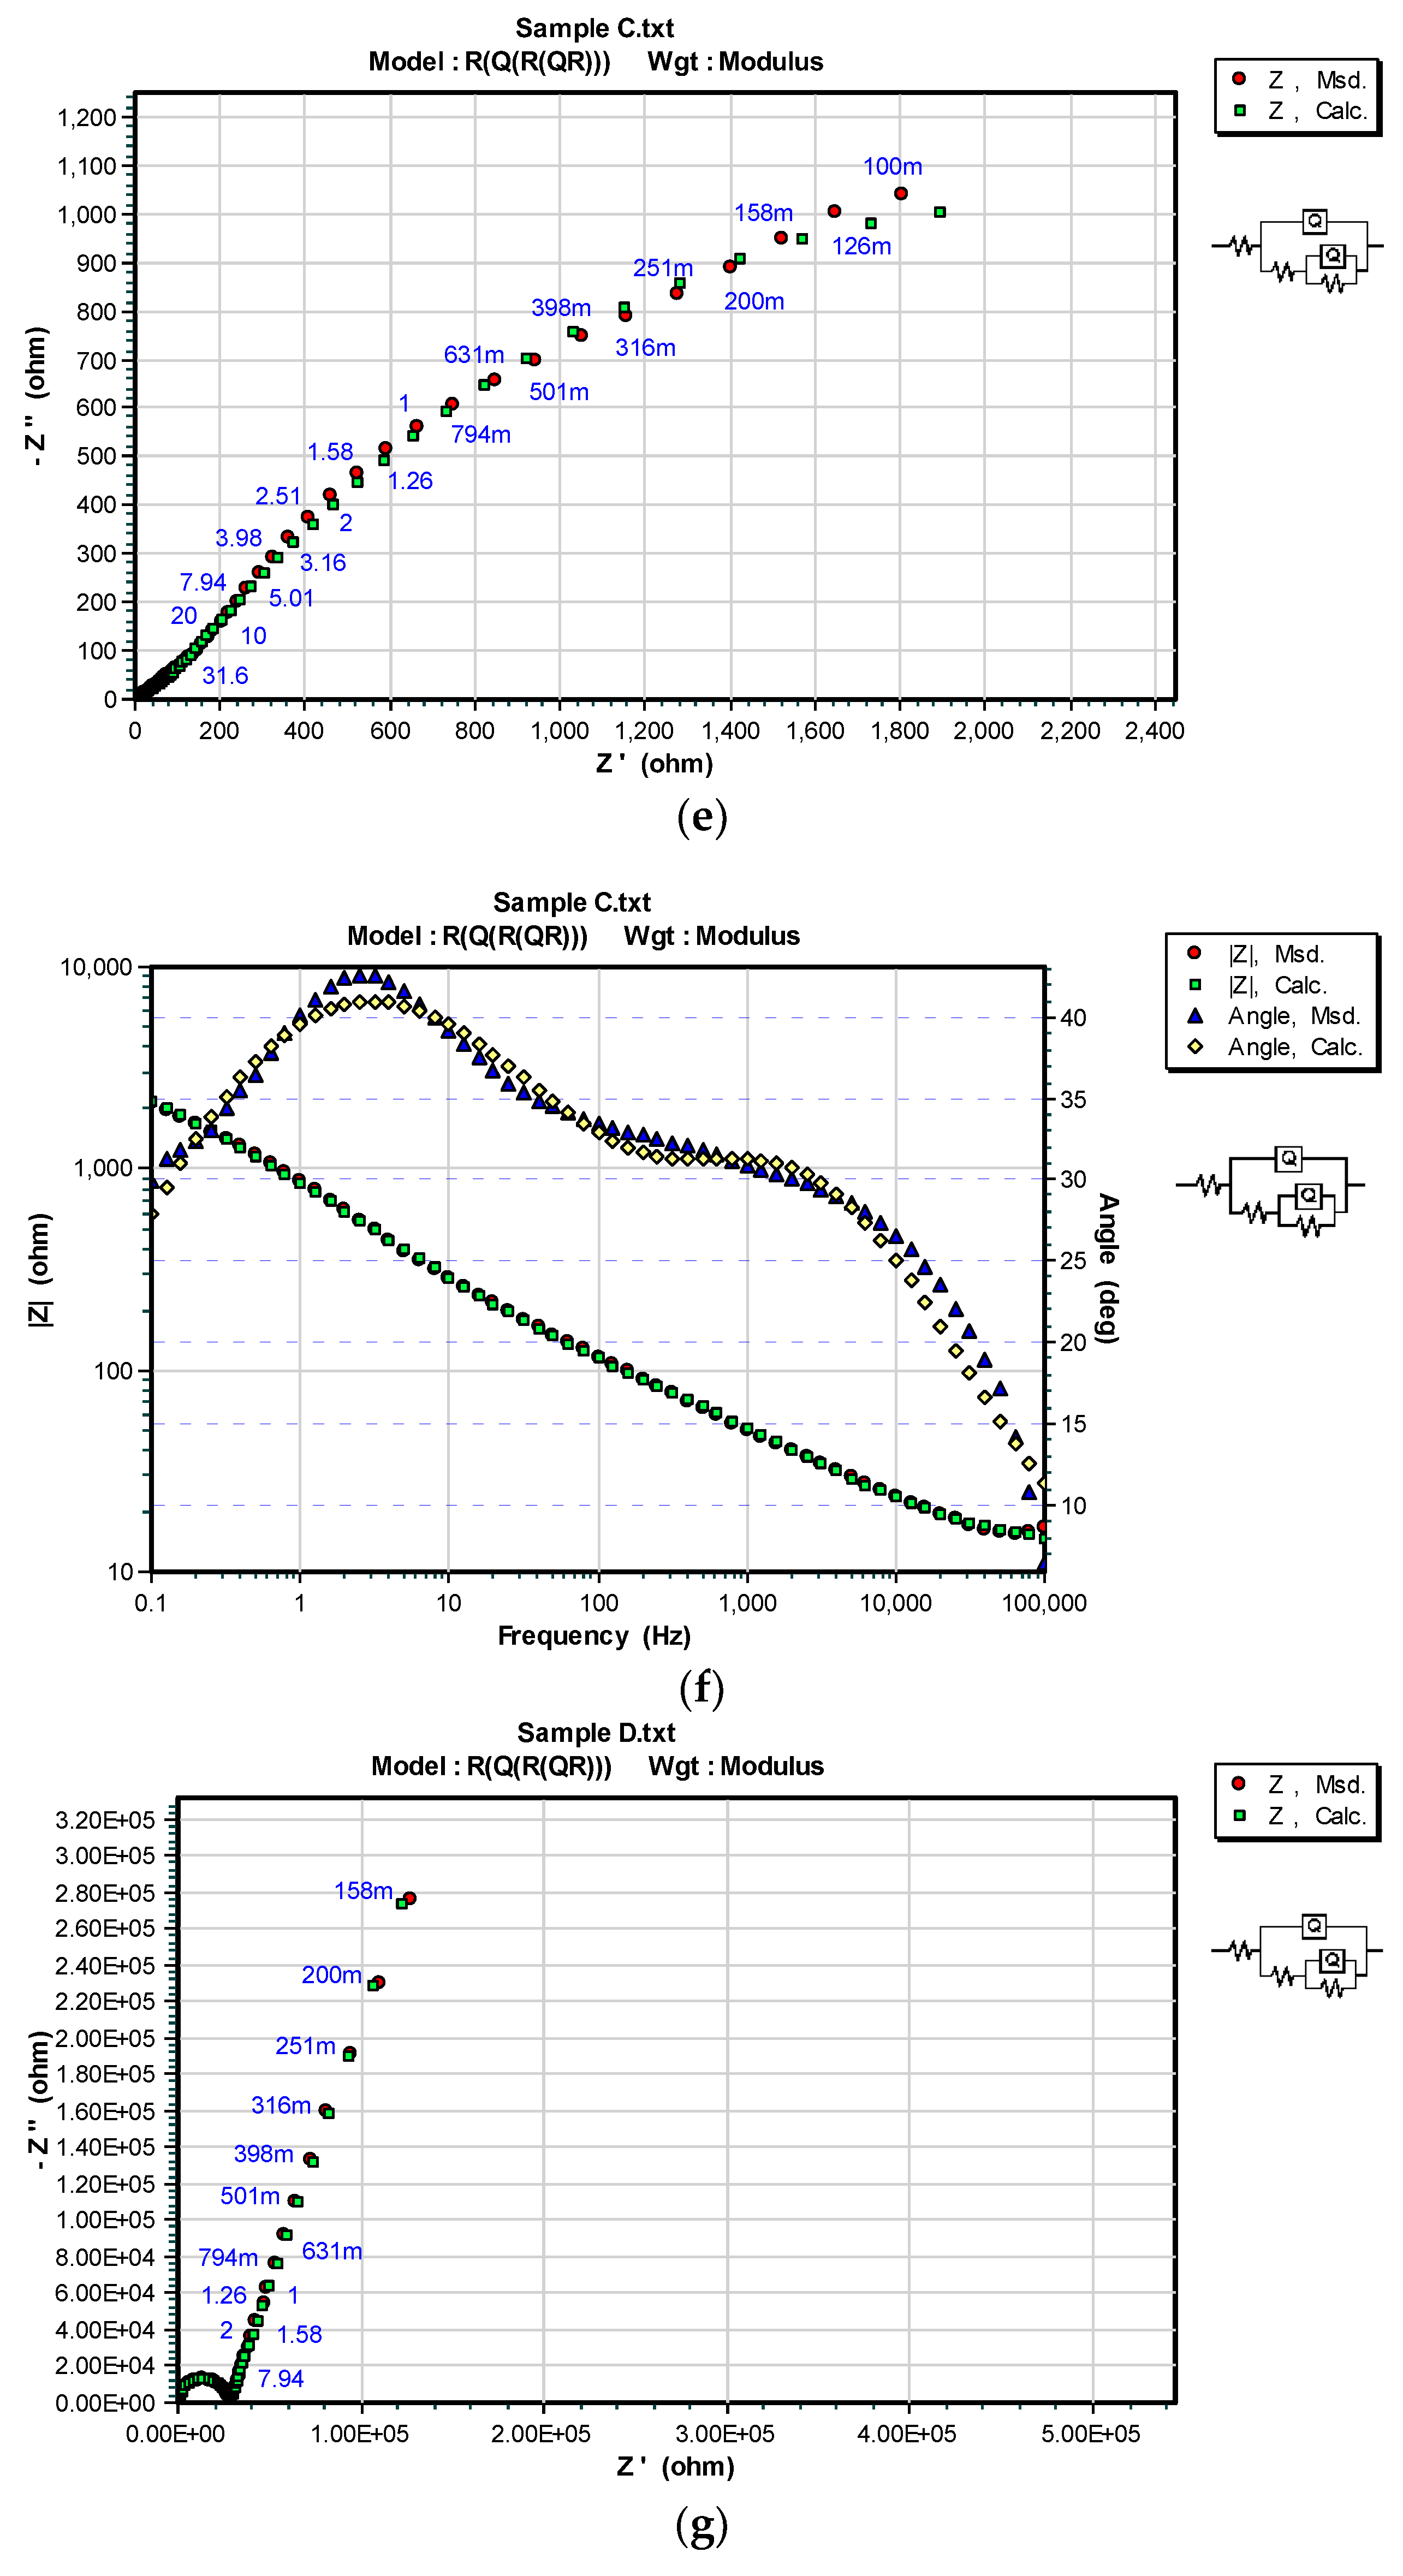
3.3. OCP and EIS Study

The open circuit potential (E/Ecorr) results after stabilization for 30 min in 4% w/w NaOH solution and the mean coating thickness (DFTmean) are provided in Table 4.
A diagram of the open circuit potential in NaOH solution is shown in Figure 1. The phosphate coating showed instability when exposed to the alkaline solution (sample 01), while the increase in the corrosion potential in time could be connected to the creation of a passive film on the mild steel substrate (sample 00). The epoxy–polyester coating D showed very good protective properties because of its potential corrosion stability over time.
The impedance data for the tested powder coatings at the beginning of exposure to 4% w/w NaOH solution were fitted by the Randles equivalent electric circuit for a single electro-chemical cell. The equivalent circuits consisted of the solution resistance, Rs, the polarisation resistance, Rp, and double-layer capacitance, Cdl, [19] shown in Figure 2. For modelling the interface of a metal surface in contact with an electrolyte, as well as to describe non-porous coating behaviour, the Randles equivalent circuit is often used [20].
After 100 h of exposure to a 4% w/w NaOH solution, the Nyquist diagram for all tested powder coatings showed a two-time constant spectrum, thus the impedance data were fitted with the equivalent electric circuit for porous coating. The equivalent circuit for porous coating consisted of the solution resistance, Rs, the coating resistance, Rc, the charge transfer resistance, Rct, the coating capacitance, Cc, and double-layer capacitance, Cdl, [5,21] shown in Figure 3.
The EIS analysis results at the beginning and after 100 h of exposure of powder coatings to a 4% w/w NaOH solution are given in Table 5. CPEdl is a constant phase element of the double layer showing its capacitive properties, which depend on the empirical constant ndl. The constant n is in the range from 0 to 1. If n = 0, the CPE acts as a resistor, and if n = 1, the CPE acts as a capacitor [22]. CPEcoat is a constant phase element of the coating, and ncoat is its empirical constant.
The results of the EIS analysis at the beginning of exposure to a 4% w/w NaOH solution showed that the polyester powder coating B (for outdoor use) had the weakest protective properties, that is, the lowest coating resistance (Rp = 1.372 × 10⁶ Ω). The biggest coating resistance was determined for epoxy–polyester coating A. The coating resistance features the ability to resist electrolyte penetration and is often used to assess coating protective performance [9,19].
After 100 h of immersion in 4% w/w NaOH solution, all the tested powder coatings showed a decrease in resistance, thus indicating a porous coating behaviour where the corrosive medium penetrated the metal–coating interface [5]. The lowest coating resistance after long-term immersion was determined for polyester powder coating C, whereas the best protective properties were established for epoxy–polyester powder coating D. Both powder coatings C and D were applied with similar thickness and had a smooth surface appearance. This suggests that the chemical composition of the powder coating binder was responsible for the corrosion protection behaviour rather than the thickness. Polyester resins are not resistant to alkaline hydrolysis [23], which has led to the degradation and lower resistance of the polyester powder coatings B and C compared to the hybrid epoxy-–polyester powder coating in the presence of NaOH. Alkaline hydrolysis resulted in a cleavage reaction of ester chains and a loss of polyester protective properties. The epoxy–polyester powder coating A was applied with higher mean thickness but showed slightly lower resistance than the epoxy–polyester powder coating D, due to an uneven texture film.
The impedance results, measured (Msd.) and fitted (Calc.), were expressed by the Nyquist and Bode diagrams shown in Figure 4.

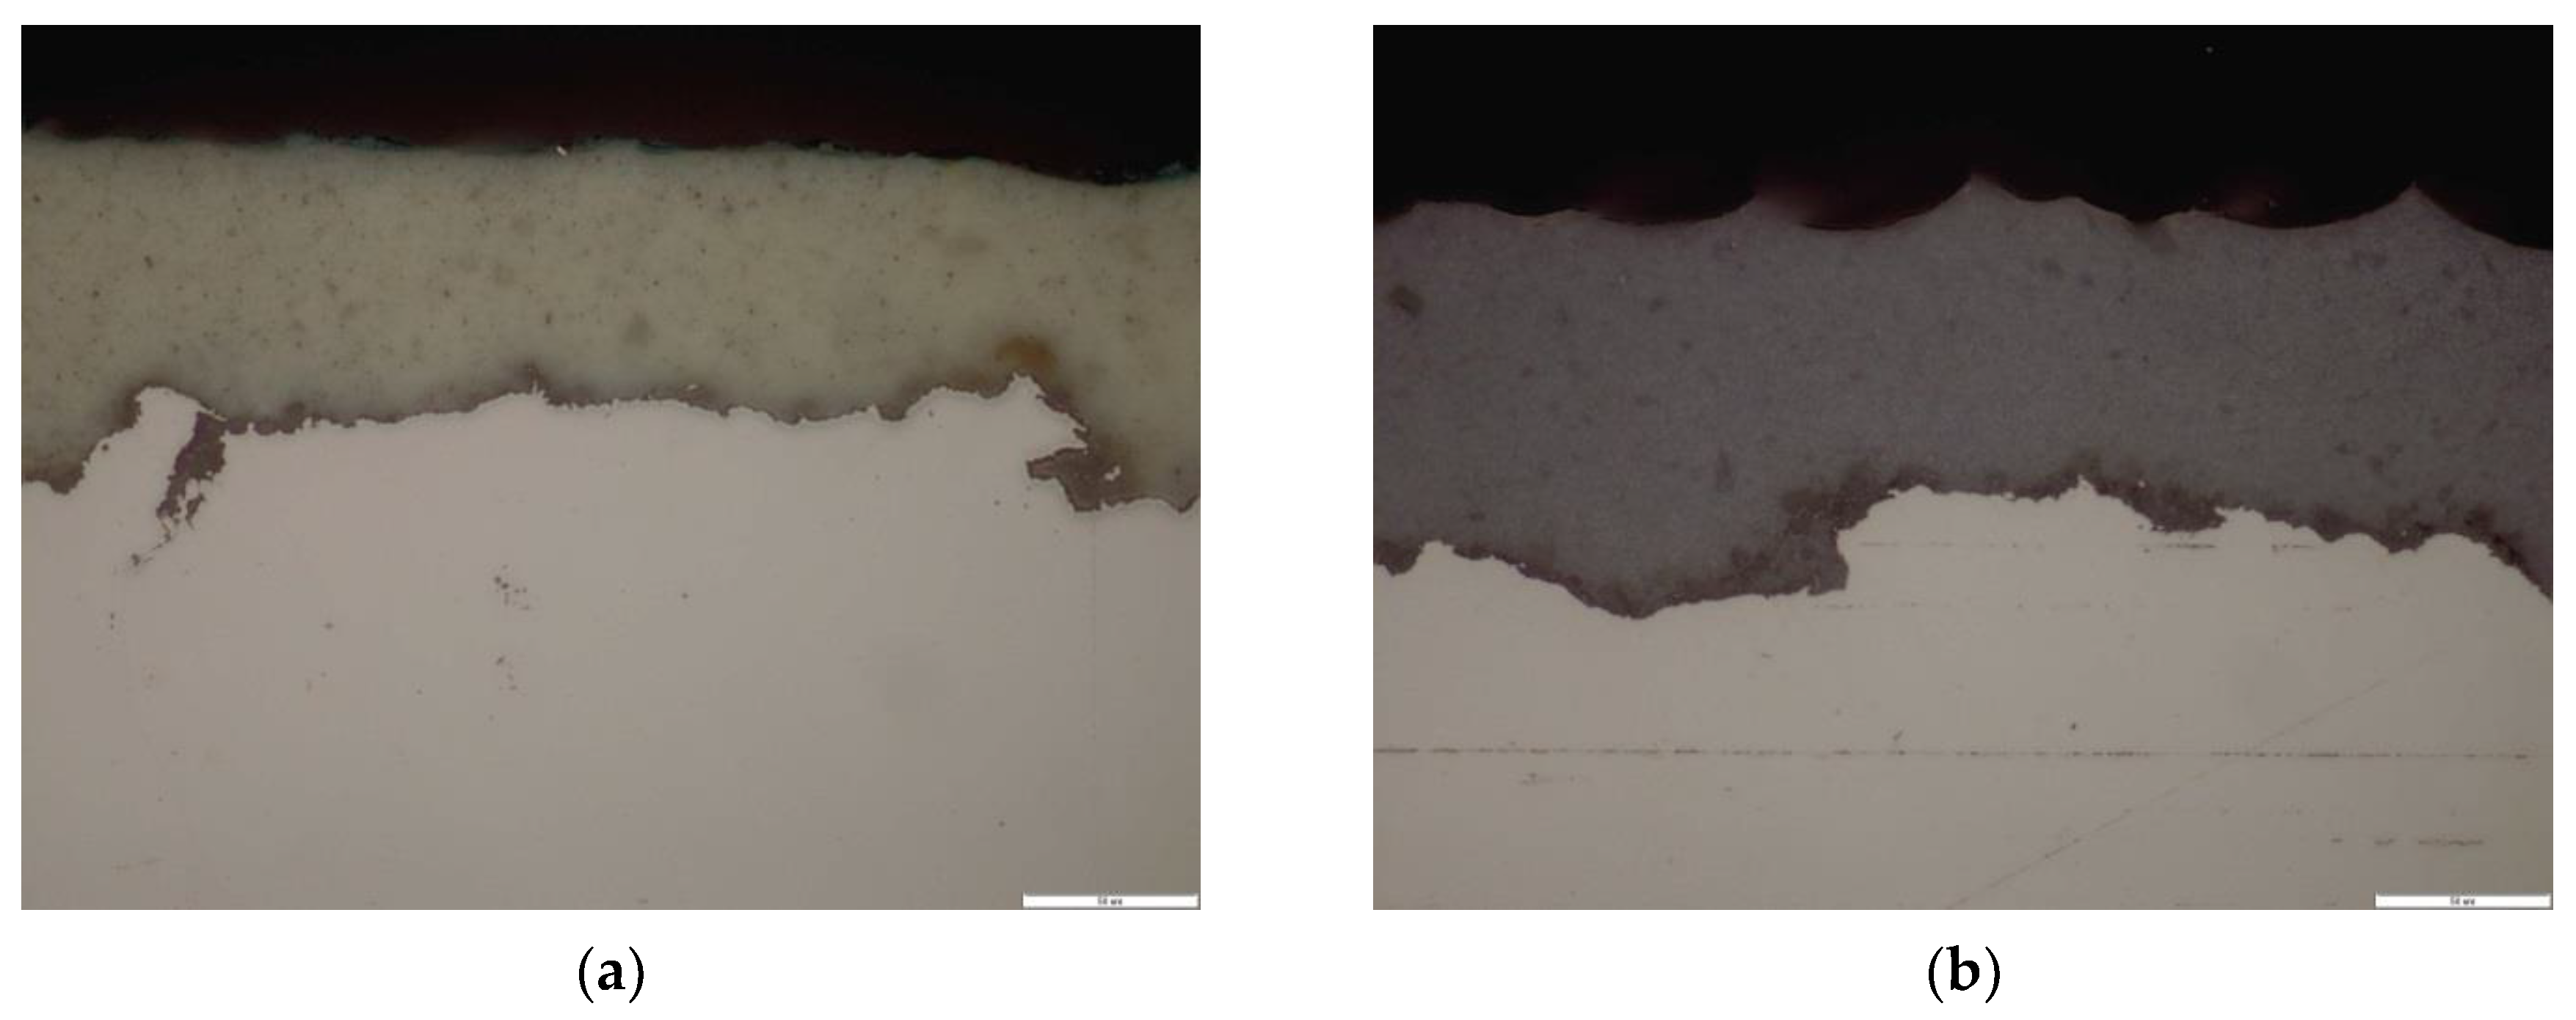
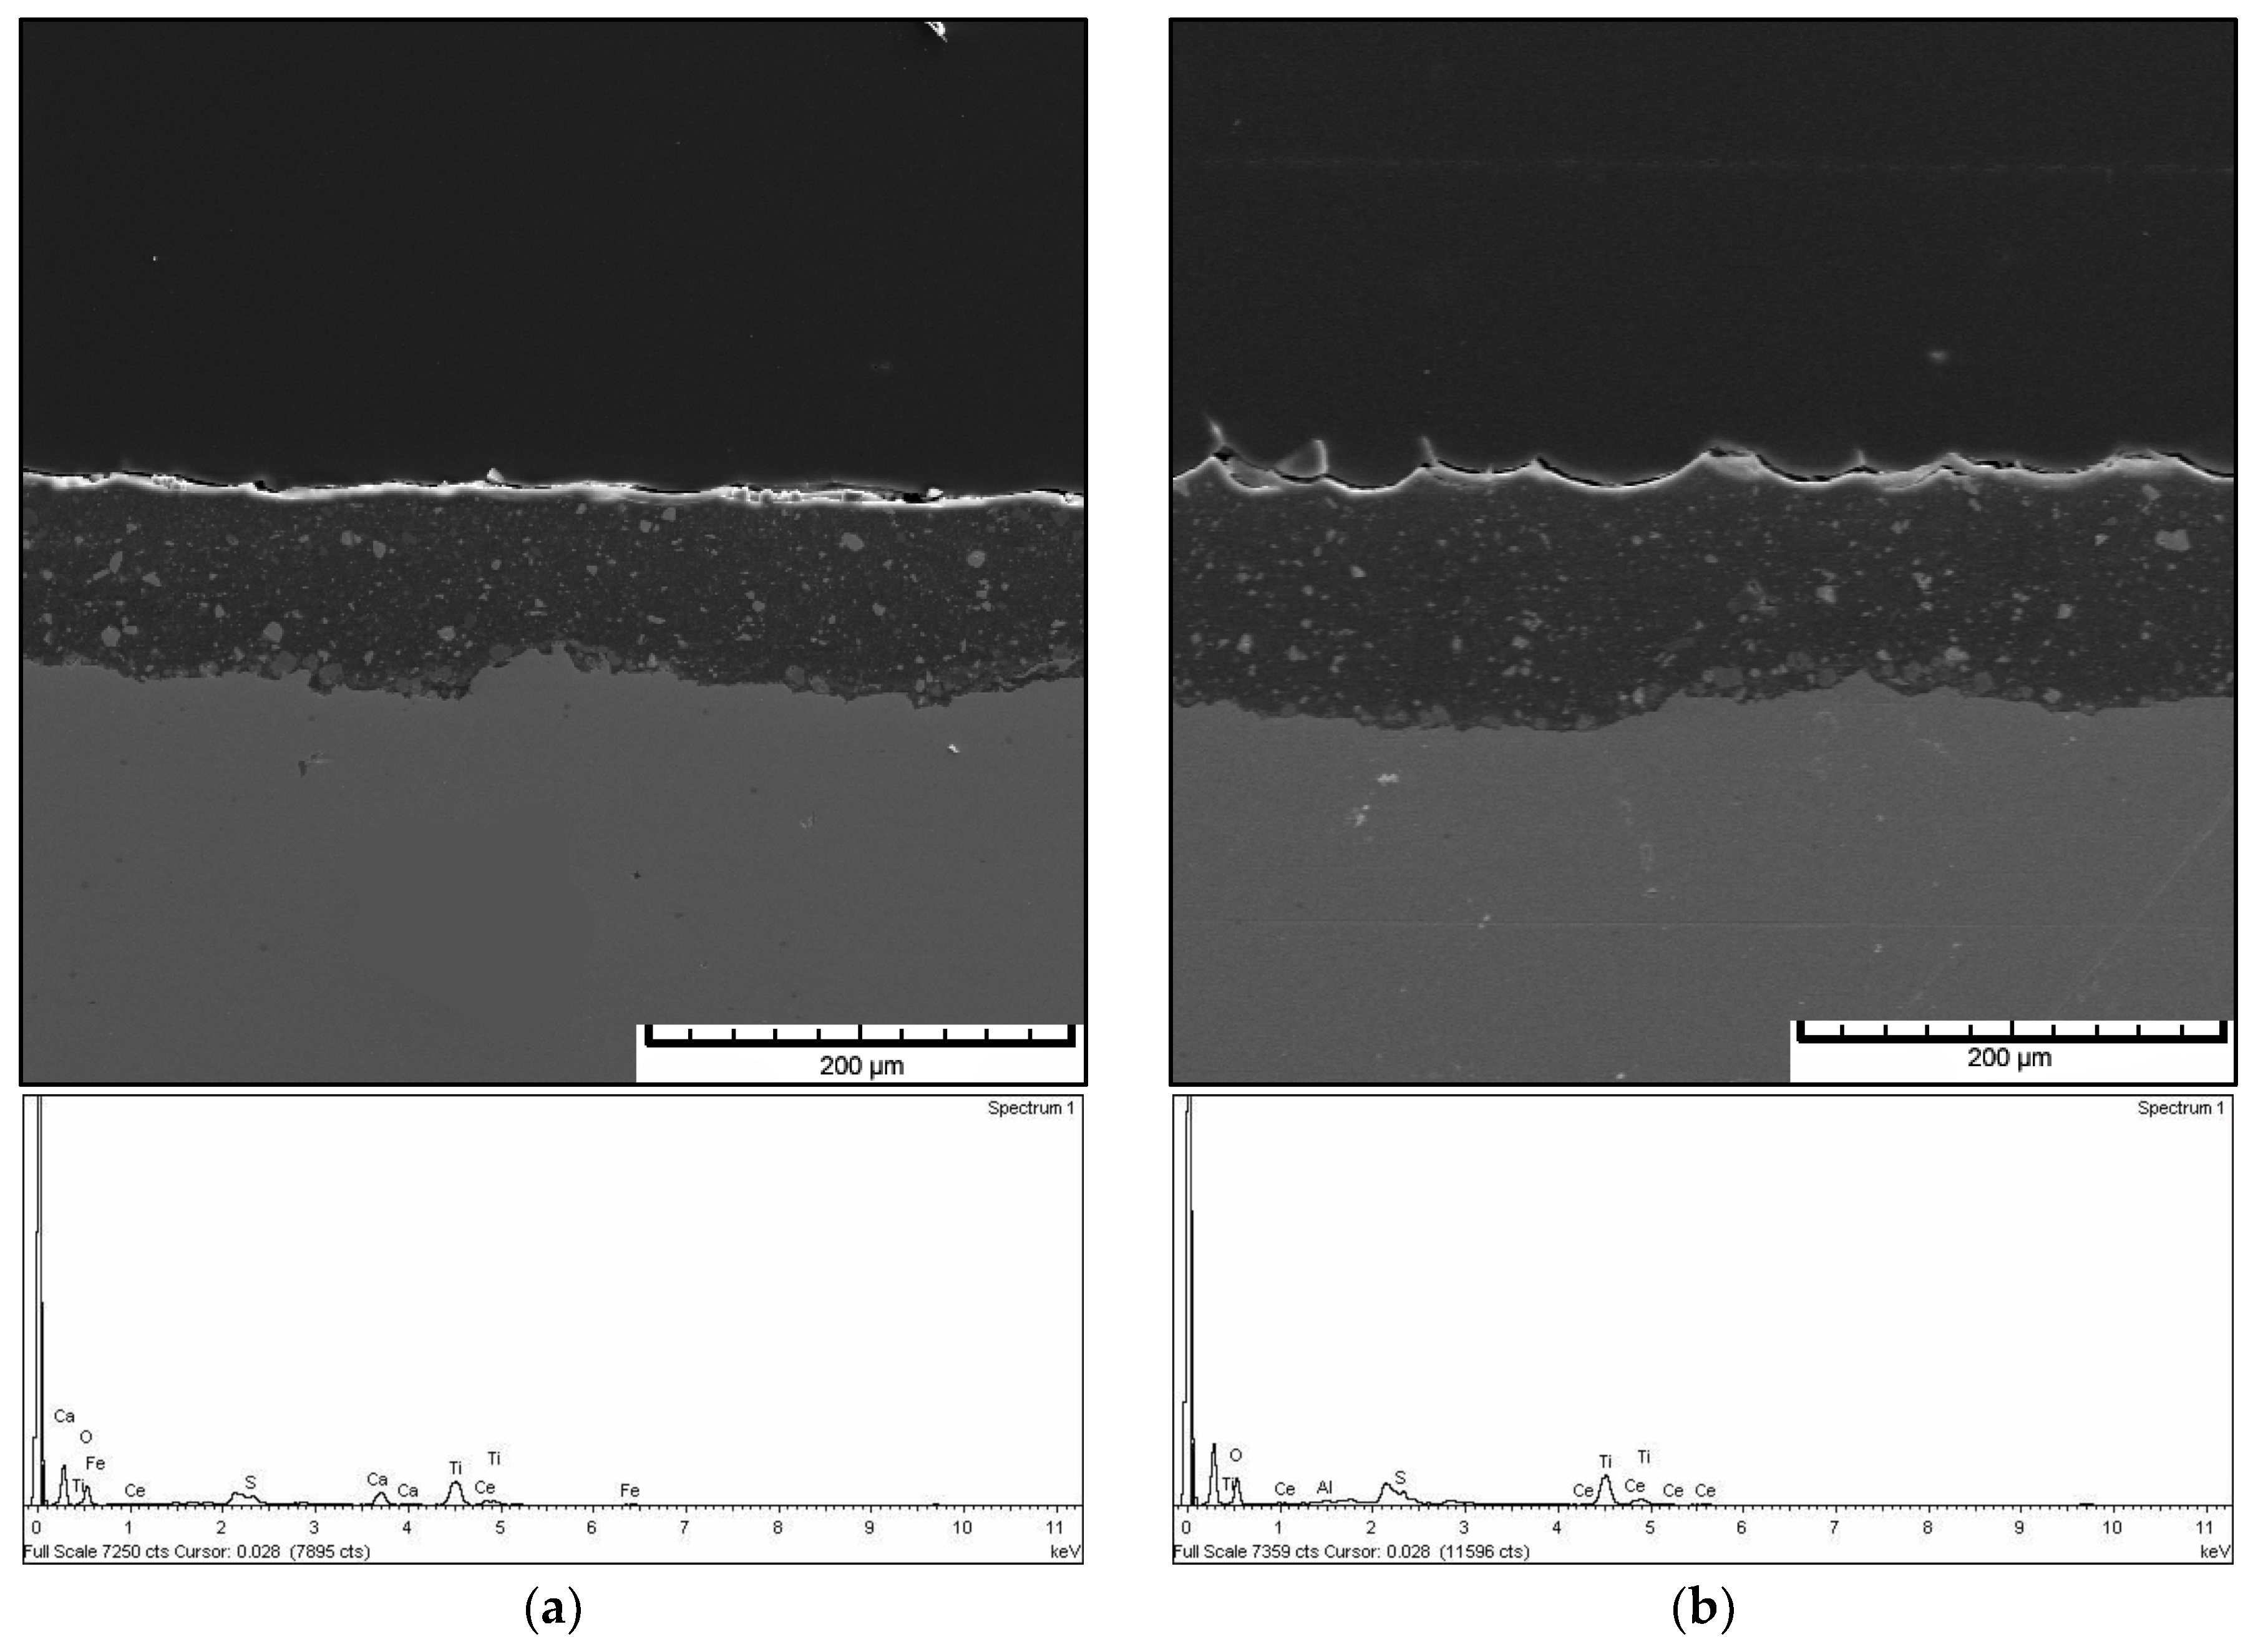
3.4. Morphology and EDX Spectra

The cross-section of the representative polyester and epoxy–polyester powder coatings on a phosphate steel surface are shown in Figure 5. It can be seen that the coatings applied on the samples appear to be adequately cured and uniform, with no defects and pores. A slightly higher coating thickness of the polyester coating C can be observed. The cracks and pores are not visible.
The SEM micrograph with an EDX spectrum is shown in Figure 6. The SEM micrograph indicated that the tested epoxy–polyester and polyester coating adhered firmly to the phosphate substrate following the morphology of the substrate. The peak of the Ti pigment materials on the EDX spectra was predominant in both cases.

4. Conclusions

The tests performed in this study showed that the powder coatings exhibited very good properties in humid and marine environments as well as in an alkali medium, but also displayed some failures. Extremely good protective properties were displayed in the epoxy–polyester coatings, which are intended for indoor use, while the worst performance was delivered by polyester powder coating B, intended for outdoor use, which lost of adhesion after exposure to the humid and warm atmosphere (ISO 6270-2). A possible cause of this adhesion loss was the distinct relief surface of coating B, for which insufficient coating thickness was determined (DFTmin = 40.4 µm), which led to an early penetration of water to the steel surface. The protective efficiency of an organic coating is generally achieved through the barrier mechanism, which confirms the strong influence of coating thickness on corrosion protection behaviour. Taking into account that the size of the particles in most powders used for electrostatic spraying is 30–50 µm, the coating thickness should exceed 50 µm to obtain a satisfactory protective film.
According to the EIS results, the coating resistance for all the tested coatings at the beginning of exposure showed an acceptable value (106 Ω·cm2) for protective coatings [19], but after 100 h in 4% w/w NaOH, this decreased for all tested coatings. The worst coating resistance was established for polyester coating sample C. The established difference in corrosive durability between the epoxy–polyester powder coating and the polyester powder coating determined by EIS can be related to the better corrosion properties and the higher cross-link density of the epoxy-based binder [5,9,13], as well as the instability of polyester to alkaline hydrolysis [23]. The cross-sectional examination showed that all tested coatings were fully cured with no cracks and pores and with good adhesion to the substrate.

Author Contributions

Ivan Stojanović and Vesna Alar conceived and designed the experiments; Ivan Stojanović and Vinko Šimunović performed the experiments and analysed the data; Frankica Kapor contributed with materials/analysis tools and to the experimental work; Ivan Stojanović wrote the paper; Vesna Alar revised the paper.

Conflicts of Interest

The authors declare no conflict of interest.

References

  1. Khan, M.K.I.; Schutyser, M.A.I.; Schroën, K.; Boom, R.M. Electrostatic powder coating of foods–State of the art and opportunities. J. Food Eng. 2012, 111, 1–5. [Google Scholar] [CrossRef]
  2. Amefia, A.; Abu-Ali, J.; Barringer, S. Improved functionality of food additives with electrostatic coating. Innov. Food Sci. Emerg. Technol. 2006, 7, 176–181. [Google Scholar] [CrossRef]
  3. Shah, U.; Zhu, J.; Zhang, C.; Senior, J.N. Numerical investigation of coarse powder and air flow in an electrostatic powder coating process. Powder Technol. 2006, 164, 22–32. [Google Scholar] [CrossRef]
  4. Luo, Y.; Zhu, J.; Ma, Y.; Zhang, H. Dry coating, a novel coating technology for solid pharmaceutical dosage forms. Int. J. Pharm. 2008, 358, 16–22. [Google Scholar] [CrossRef] [PubMed]
  5. Mafi, R.; Mirabedini, S.M.; Naderi, R.; Attar, M.M. Effect of curing characterization on the corrosion performance of polyester and polyester/epoxy powder coatings. Corros. Sci. 2008, 50, 3280–3286. [Google Scholar] [CrossRef]
  6. Meng, X.; Zhu, J.; Zhang, H. Influences of different powders on the characteristics of particle charging and deposition in powder coating processes. J. Electrostat. 2009, 67, 663–671. [Google Scholar] [CrossRef]
  7. Barletta, M.; Bellisario, D. Effects of IR pre-curing conditions on wear resistance of metal flake powder coatings. Prog. Org. Coat. 2011, 70, 273–286. [Google Scholar] [CrossRef]
  8. Mintsa, M.; Lecamp, L.; Bunel, C. A new UV-curable powder coating based on a α,ω-unsaturated copolyamide 6/11/12. Eur. Polym. J. 2009, 45, 2043–2052. [Google Scholar] [CrossRef]
  9. Bhadu, M.K.; Guin, A.K.; Singh, V.; Choudhary, S.K. Corrosion Study of Powder-Coated Galvanised Steel. ISRN Corros. 2013, 2013, 464710. [Google Scholar] [CrossRef]
  10. ISO 2808 Paints and Varnishes—Determination of Film Thickness; International Organization for Standardization: Geneva, Switzerland, 2007.
  11. ISO 2409 Paints and Varnishes—Cross-Cut Test; International Organization for Standardization: Geneva, Switzerland, 2013.
  12. Stojanović, I.; Juraga, I.; Alar, V. Influence of Drying Temperature on Protective Properties of Waterborne and Solventborne Epoxy Coatings. Int. J. Electrochem. Sci. 2014, 9, 2507–2517. [Google Scholar]
  13. Nikravesh, B.; Ramezanzadeh, B.; Sarabi, A.A.; Kasiriha, S.M. Evaluation of the corrosion resistance of an epoxy-polyamide coating containing different ratios of micaceous iron oxide/Al pigments. Corros. Sci. 2011, 53, 1592–1603. [Google Scholar] [CrossRef]
  14. ISO 9227 Corrosion Tests in Artificial Atmospheres—Salt Spray Tests; International Organization for Standardization: Geneva, Switzerland, 2017.
  15. ISO 6270-2 Paints and Varnishes—Determination of Resistance to Humidity—Part 2: Condensation (In-Cabinet Exposure with Heated Water Reservoir); International Organization for Standardization: Geneva, Switzerland, 2017.
  16. ISO 4628 Paints and Varnishes—Evaluation of Degradation of Coatings—Designation of Quantity and Size of Defects, and of Intensity of Uniform Changes in Appearance; International Organization for Standardization: Geneva, Switzerland, 2016.
  17. Vilche, J.R.; Bucharsky, E.C.; Giudice, C.A. Application of EIS and SEM to evaluate the influence of pigment shape and content in ZRP formulations on the corrosion prevention of naval steel. Corros. Sci. 2002, 44, 1287–1309. [Google Scholar] [CrossRef]
  18. Bierwagen, G.; Tallman, D.; Li, J.; He, L.; Jeffcoate, C. EIS studies of coated metals in accelerated exposure. Prog. Org. Coat. 2003, 46, 148–157. [Google Scholar] [CrossRef]
  19. Zhu, Y.; Xiong, J.; Tang, Y.; Zuo, Y. EIS study on failure process of two polyurethane composite coatings. Prog. Org. Coat. 2010, 69, 7–11. [Google Scholar] [CrossRef]
  20. Klüppel, I.; Schinkinger, B.; Grundmeier, G. In situ electrochemical studies of forming-induced defects of organic coatings on galvanised steel. Electrochim. Acta 2009, 54, 3553–3560. [Google Scholar] [CrossRef]
  21. Naderi, R.; Attar, M.M.; Moayed, M.H. EIS examination of mill scale on mild steel with polyester–epoxy powder coating. Prog. Org. Coat. 2004, 50, 162–165. [Google Scholar] [CrossRef]
  22. Jakovljević, S.; Alar, V.; Ivanković, A. Electrochemical Behaviour of PACVD TiN-Coated CoCrMo Medical Alloy. Metals 2017, 7, 231. [Google Scholar] [CrossRef]
  23. Alemdar, N.; Karagoz, B.; Erciyes, A.T.; Bicak, N. A method for polymethymetacrylate coating via self-curable unsaturated polyester primer on metal and glass surfaces. Prog. Org. Coat. 2007, 60, 69–74. [Google Scholar] [CrossRef]
Figure 1. The open circuit potential of powder coating as a function of time, in 4% w/w NaOH solution.
Coatings 08 00098 g001
Figure 2. The Randles equivalent circuit [12,19].
Coatings 08 00098 g002
Figure 3. The two-time constant electrical equivalent circuits for porous coating [5,12,21].
Coatings 08 00098 g003
Figure 4. The Nyquist diagram (a,c,e,g) and Bode diagram (b,d,f,h) of tested powder coatings after 100 h immersion in 4% w/w NaOH solution: (a,b) Sample A; (c,d) Sample B; (e,f) Sample C; (g,h) Sample D.
Coatings 08 00098 g004aCoatings 08 00098 g004bCoatings 08 00098 g004cCoatings 08 00098 g004d
Figure 5. Cross-sectional photographs of powder coatings: (a) Sample A (epoxy-polyester), coating thickness 60–100 µm; (b) Sample C (polyester), coating thickness 80–120 µm.
Coatings 08 00098 g005
Figure 6. The SEM micrograph with EDX spectra of the powder coatings: (a) Sample A (epoxy-polyester), good penetration of coating into the substrate, no visible cracks, and pores, Ti pigment is dominant; (b) Sample C (polyester), no visible cracks and pores, finely micro-rough appearance of upper layer surface, Ti pigment is dominant.
Coatings 08 00098 g006
Table 1. Technical data for tested powder coatings.
SampleChemical TypePurposeGlossSurface AppearanceParticle Size (µm)Specific Weight (kg dm−3)
Asaturated carboxylated polyester resin and solid epoxy resinfor indoor usesemi-glossytextured (rough)< 1001.6
Bsaturated carboxylated polyester resin cured with the β-hydroxyl-alkyl amide (HAA)for outdoor useglossyriver textured
(rough)
30–401.7
Csaturated carboxylated polyester resin cured with the β-hydroxyl-alkyl amide (HAA)for outdoor useglossysmooth< 1001.4-1.7
Dsaturated carboxylated polyester resin and solid epoxy resinfor indoor usesemi-glossysmooth30–401.65
Table 2. Assessment of coating protection properties after 240 h in the humidity chamber.
TestingSampleDFTmin (μm)DFTmax (μm)DFTmean (μm)BlisteringRustingCross-Cut Adhesion
Humidity chamberAV 183.6133104.01000
AV 2100152124.1000
BV 164.511487.98005
BV 240.413081.28005
CV 196.7116107.28000
CV 291.3134115.93000
DV 180.810694.74000
DV 283.310492.94000
Table 3. Assessment of the coating protection properties after 240 h in the salt spray chamber.
TestingSampleDFTmin (μm)DFTmax (μm)DFTmean (μm)BlisteringRustingCross-Cut Adhesion
Salt spray chamberAS 195115103.61000
AS 289.1123106.83000
BS 176150107.73000
BS 273.5154117.71000
CS 197.7119107.95000
CS 2101122113000
DS 182.710391.81000
DS 286.611896.57000
Table 4. The results of the open circuit potential after stabilization in 4% w/w NaOH solution.
SampleABCD0100
DFTmean (µm)126.6114.271.469.2
Ecorr vs SCE (V)−0.447−0.240−0.320−0.300−0.253−0.270
Table 5. The results of the EIS measurement at the begging (A, B, C, D) and after 100 h (A/100 h, B/100 h, C/100 h, D/100 h) immersion in 4% w/w NaOH solution.
SampleDFTmean (µm)Rs (Ω)CPEcoat (F)ncoatRcoat (Ω)CPEdl (F)ndlRp/Rct (Ω)
A126.6150.74.975 × 10−110.960162.8963 × 106
A/100 h331.27.665 × 10−50.73341.323 × 1042.584 × 10−411.527 × 10⁴
B114.2113.56.549 × 10−1°0.944671.372 × 106
B/100 h236.97.705 × 10−50.40122.856 × 1021.100 × 10−40.69172.882 × 104
C71.4467.86.452 × 10−110.961661.7562 × 106
C/100 h121.61.064 × 10−40.5856111.82.865 × 10−40.55694.252 × 103
D69.2672.37.321 × 10−110.940901.8189 × 106
D/100 h1002.702 × 10−90.96202.809 × 1043.462 × 10−60.78979.830 × 104

