Characterization of Electroless Ni–P Coating Prepared on a Wrought ZE10 Magnesium Alloy


Abstract
1. Introduction
2. Materials and Methods
3. Results and Discussion
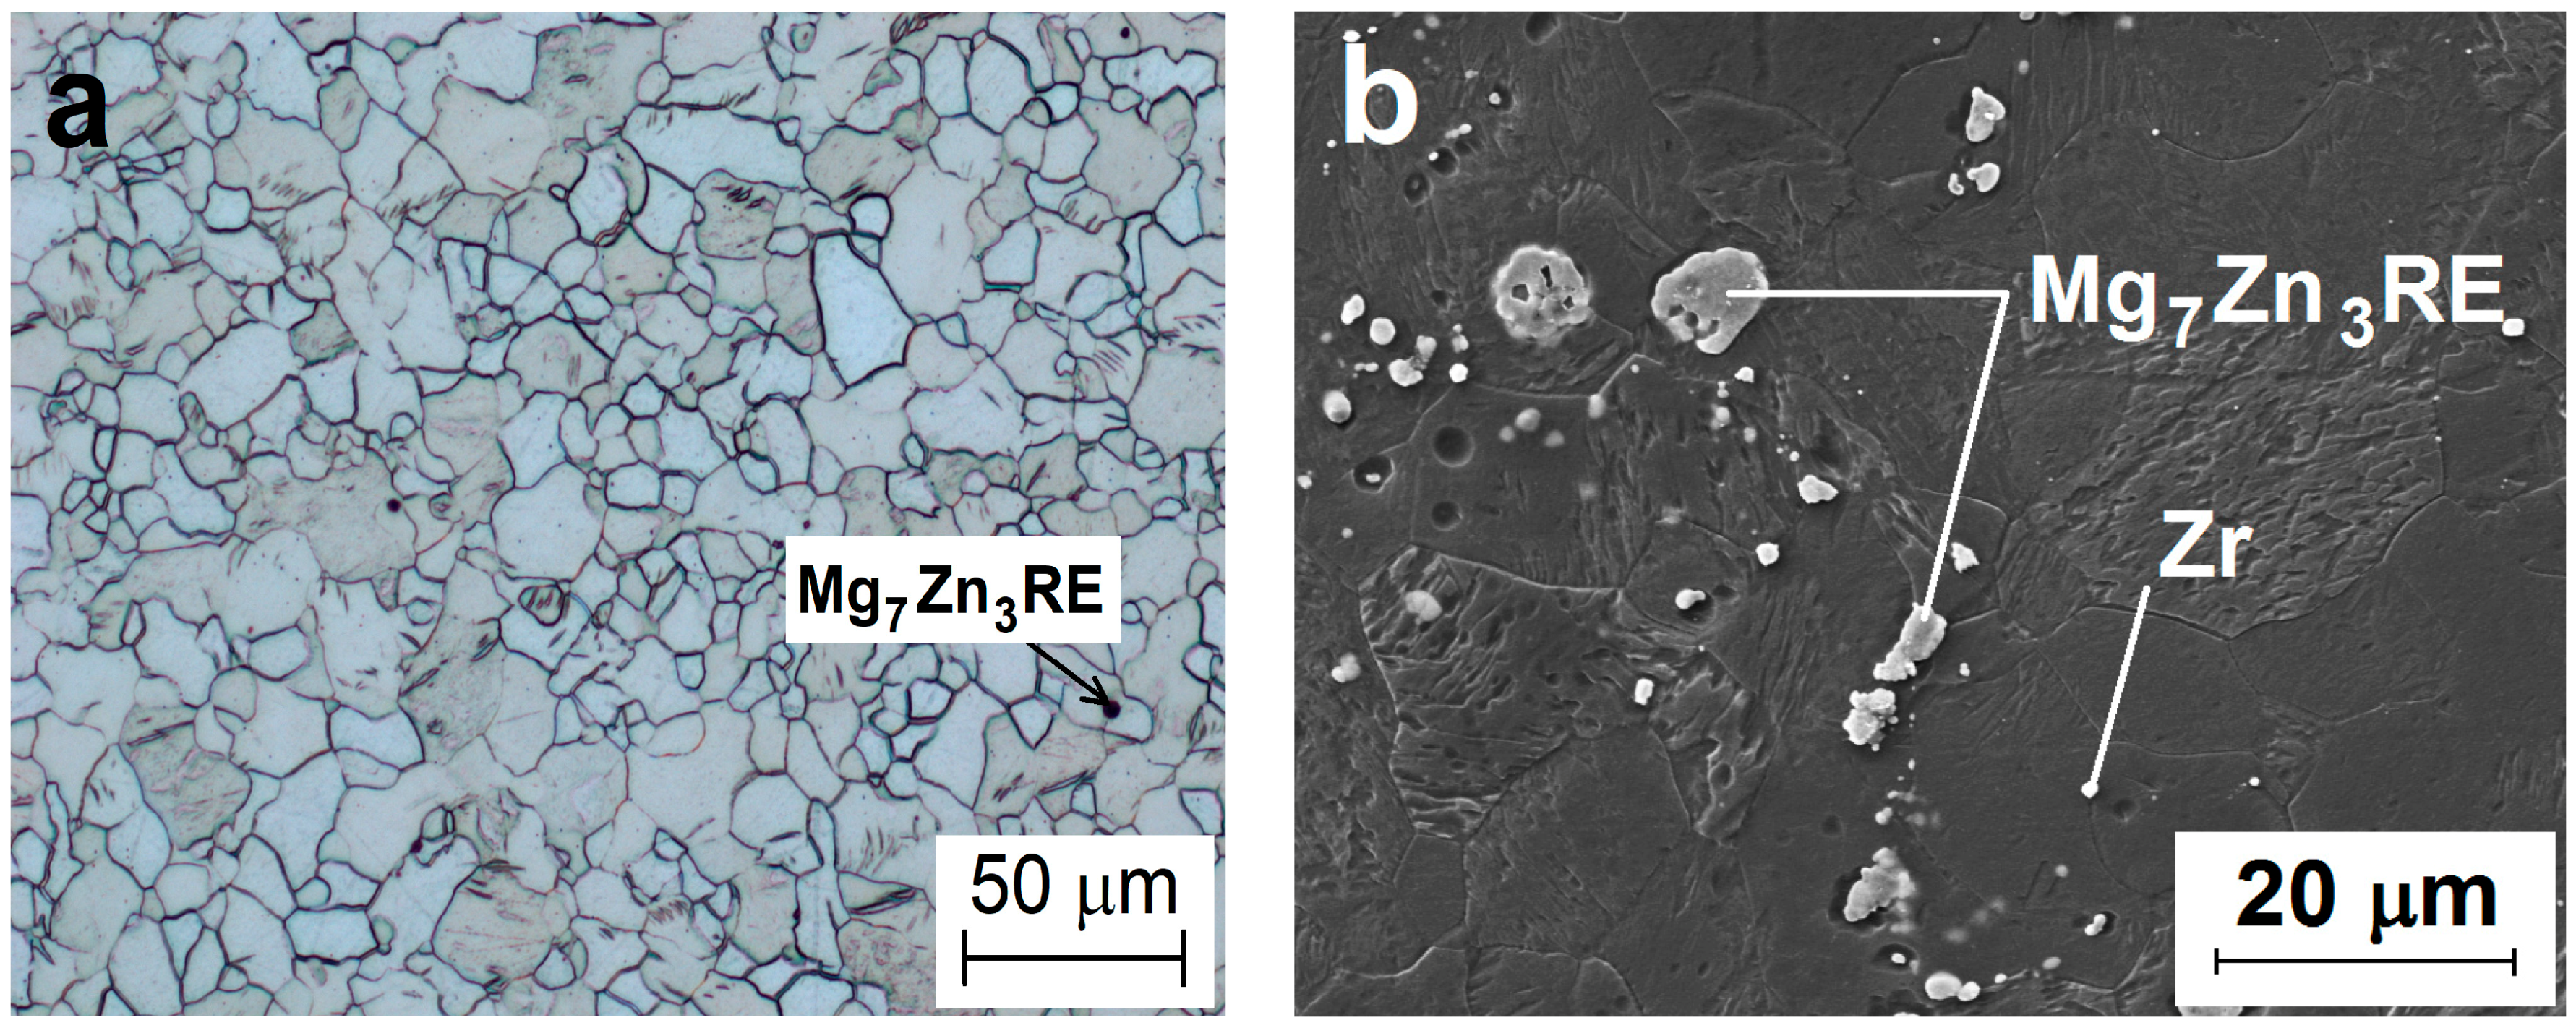
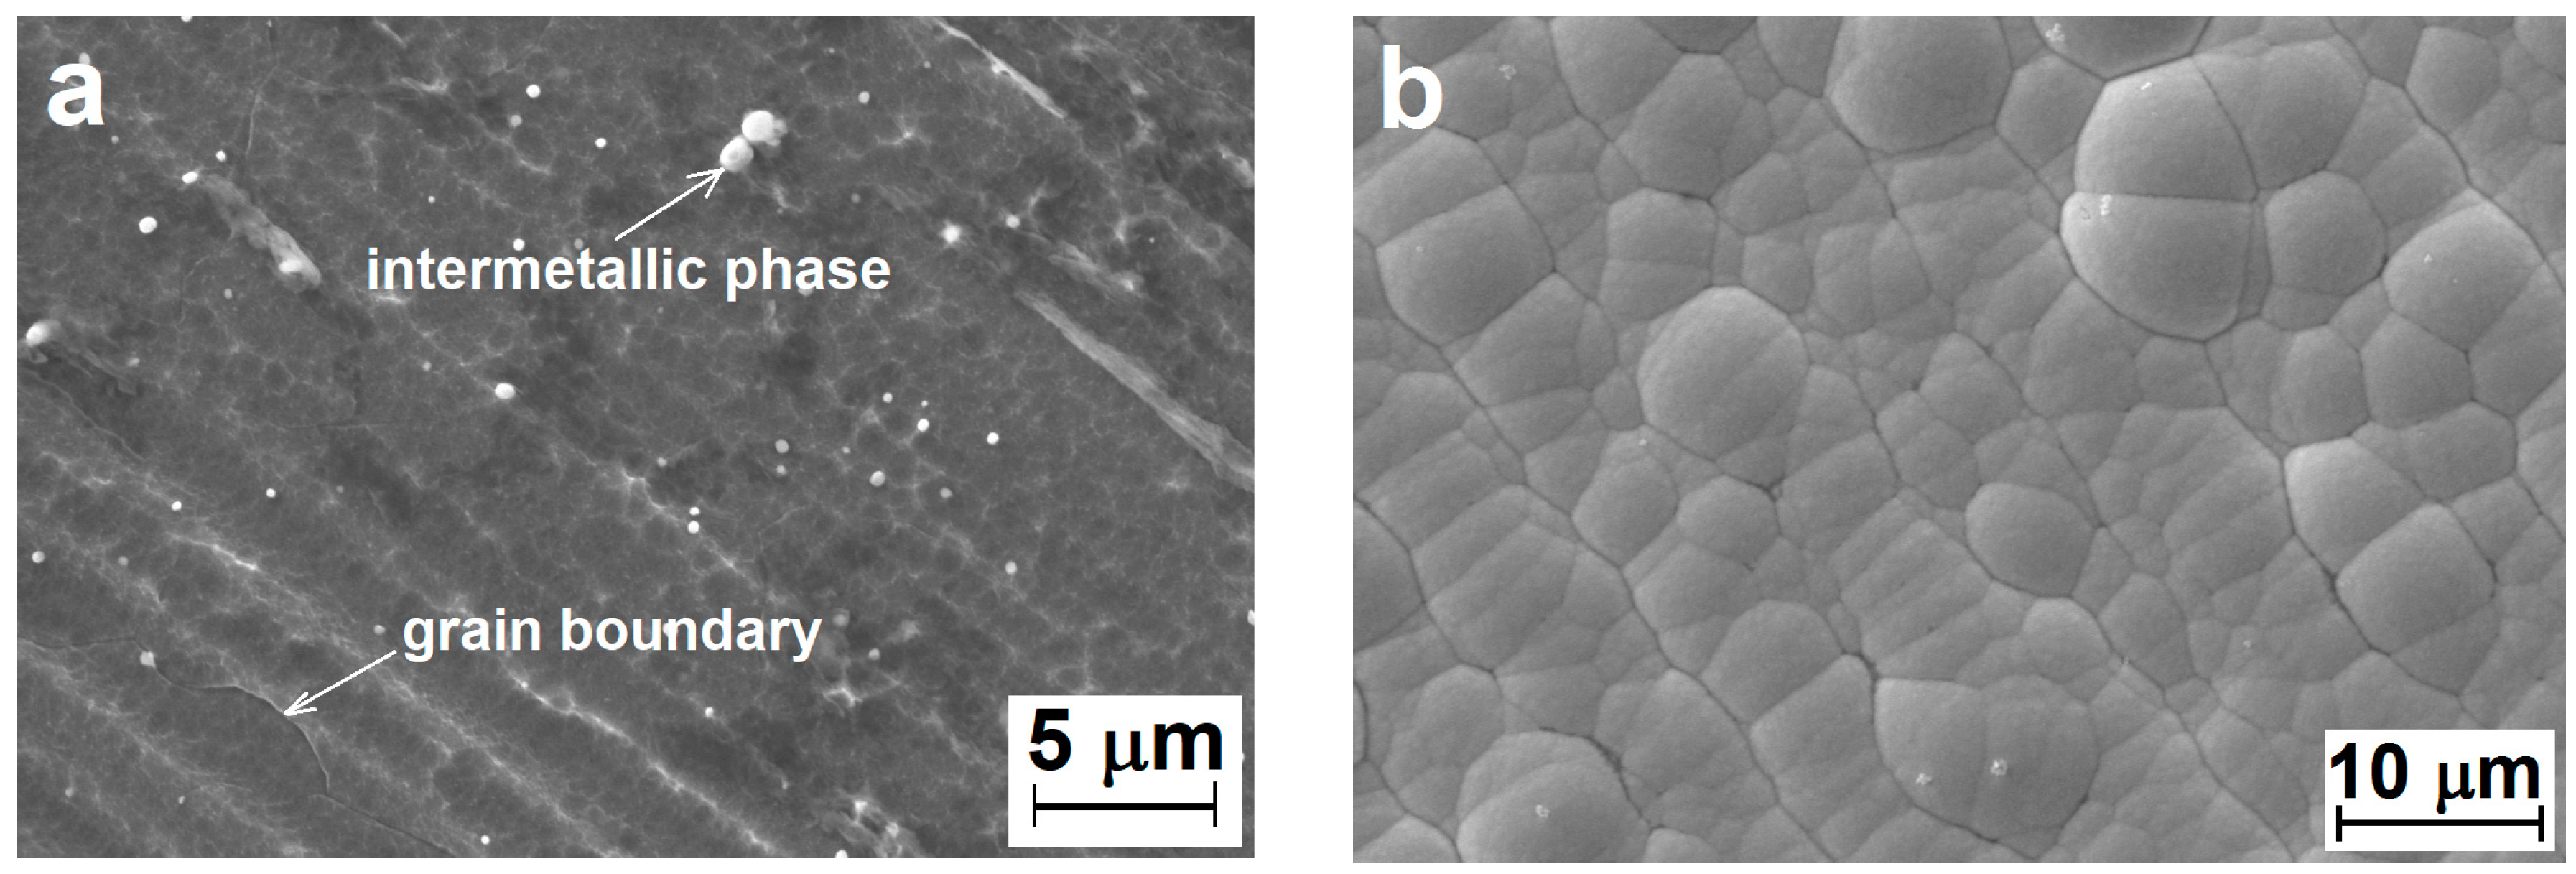
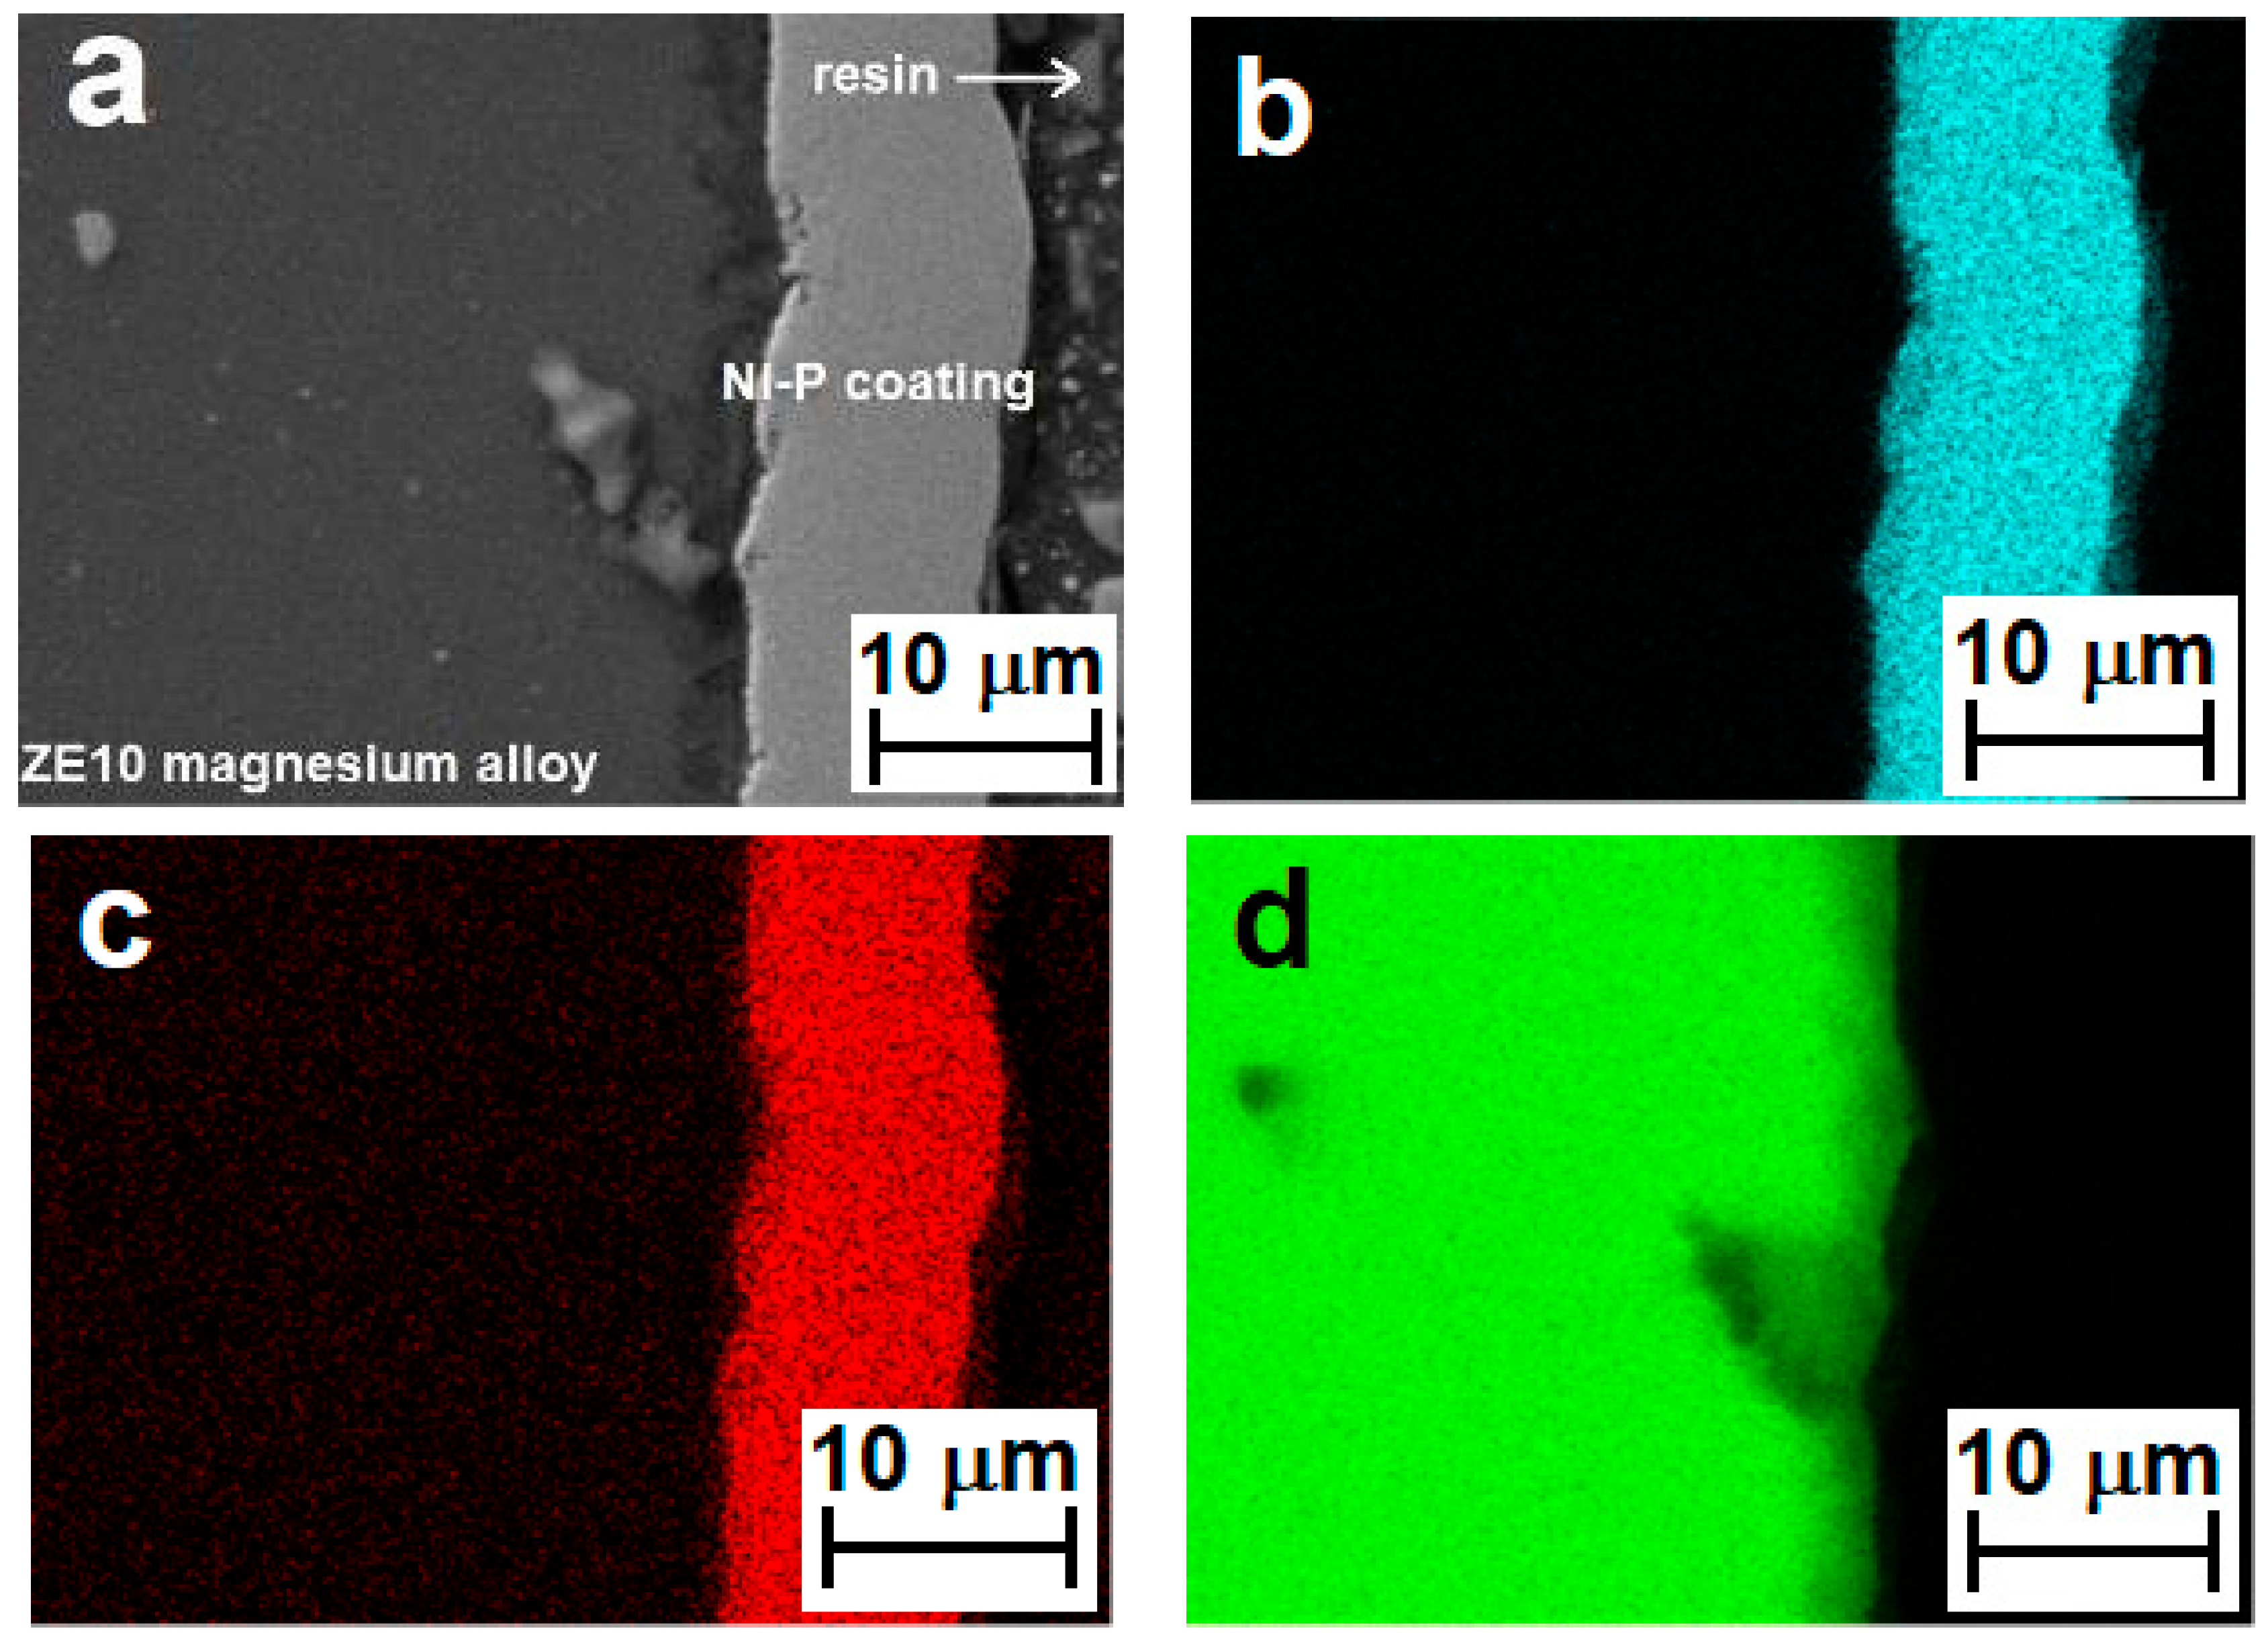
3.1. Ni–P Coating Morphology and Chemical Analysis
3.2. Ni–P Coating Microhardness Analysis
3.3. Analysis of the Physical Properties of the Ni–P Coating
3.4. The Electrochemical Corrosion Test in 0.1 M NaCl
3.5. The Immersion Test in 0.1 M NaCl
4. Conclusions
- Due to the proper pre-treatment, electroless low-phosphorus Ni–P coatings were successfully deposited on a ZE10 magnesium alloy in a nickel bath.
- The content of Ni in the deposited coatings was 95.6 wt %, and the content of P was 4.4 wt %, for coatings with average thickness ~10 µm (1 h of deposition).
- Deposited Ni–P coatings showed a high degree of homogeneity in the entire cross section.
- The microhardness of the deposited low-phosphorus Ni–P coating was 690 ± 30 HV 0.025, representing an 11-fold increase when compared to the plain ZE10 magnesium alloy.
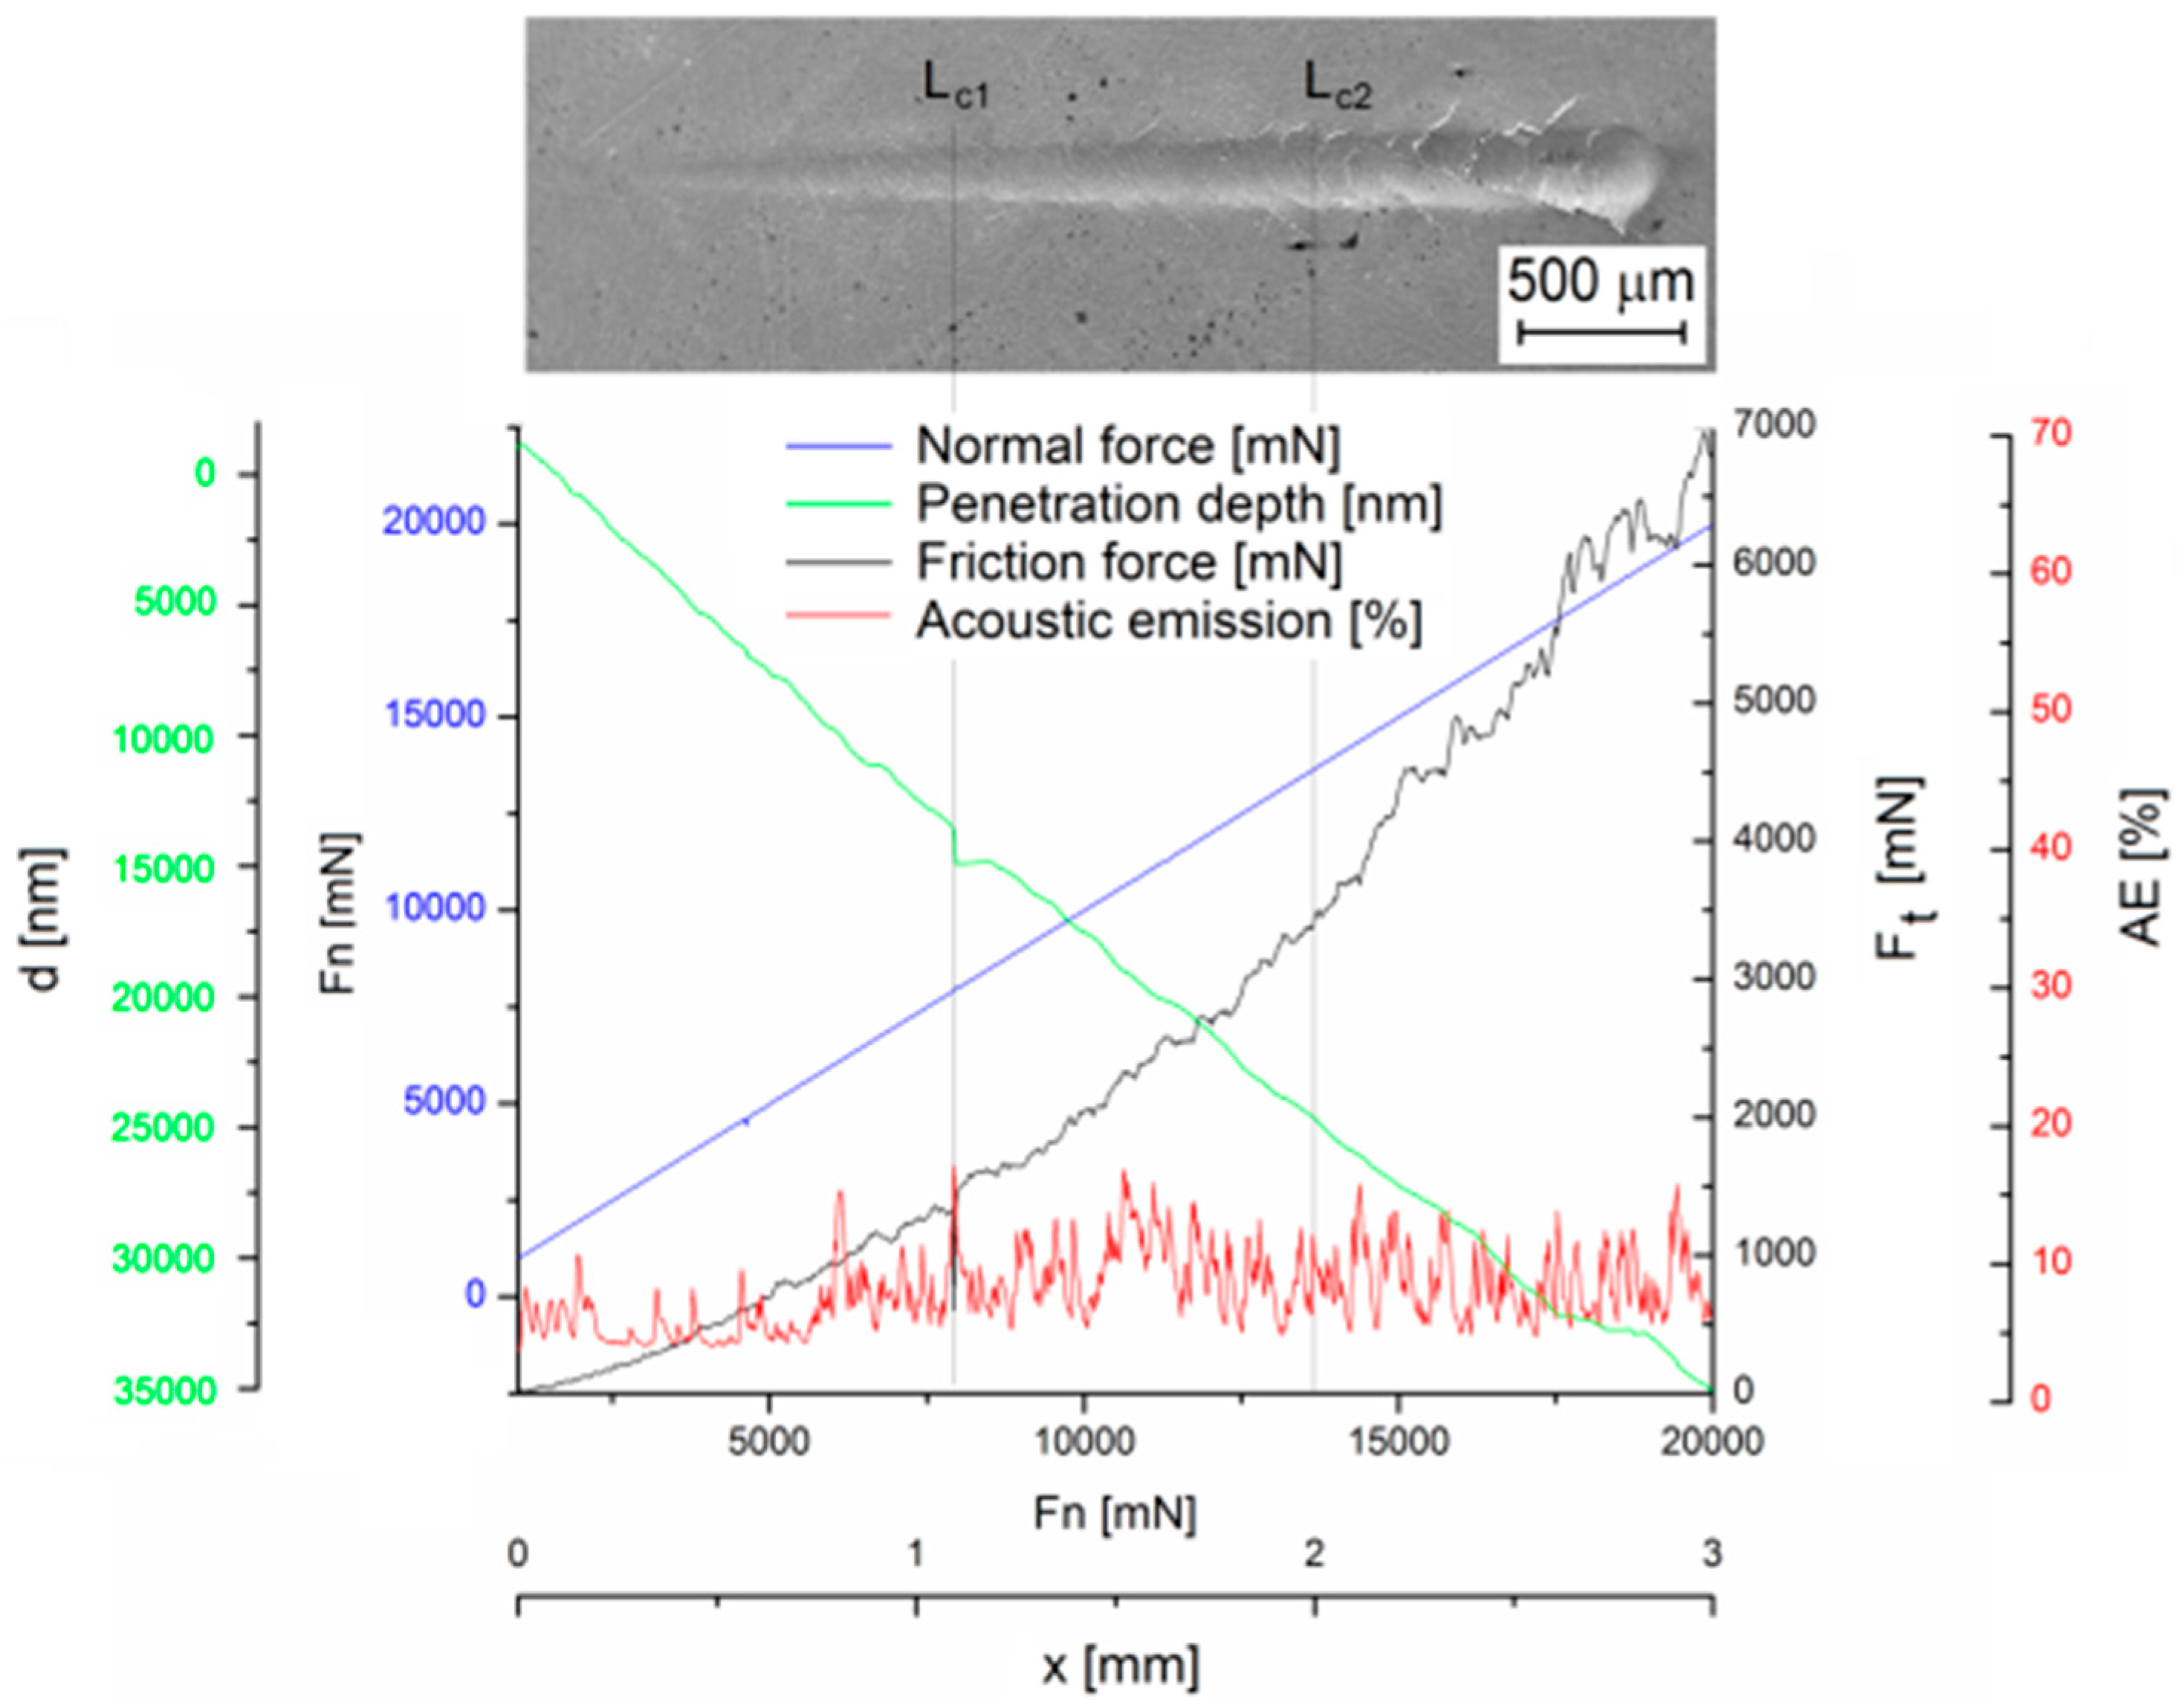
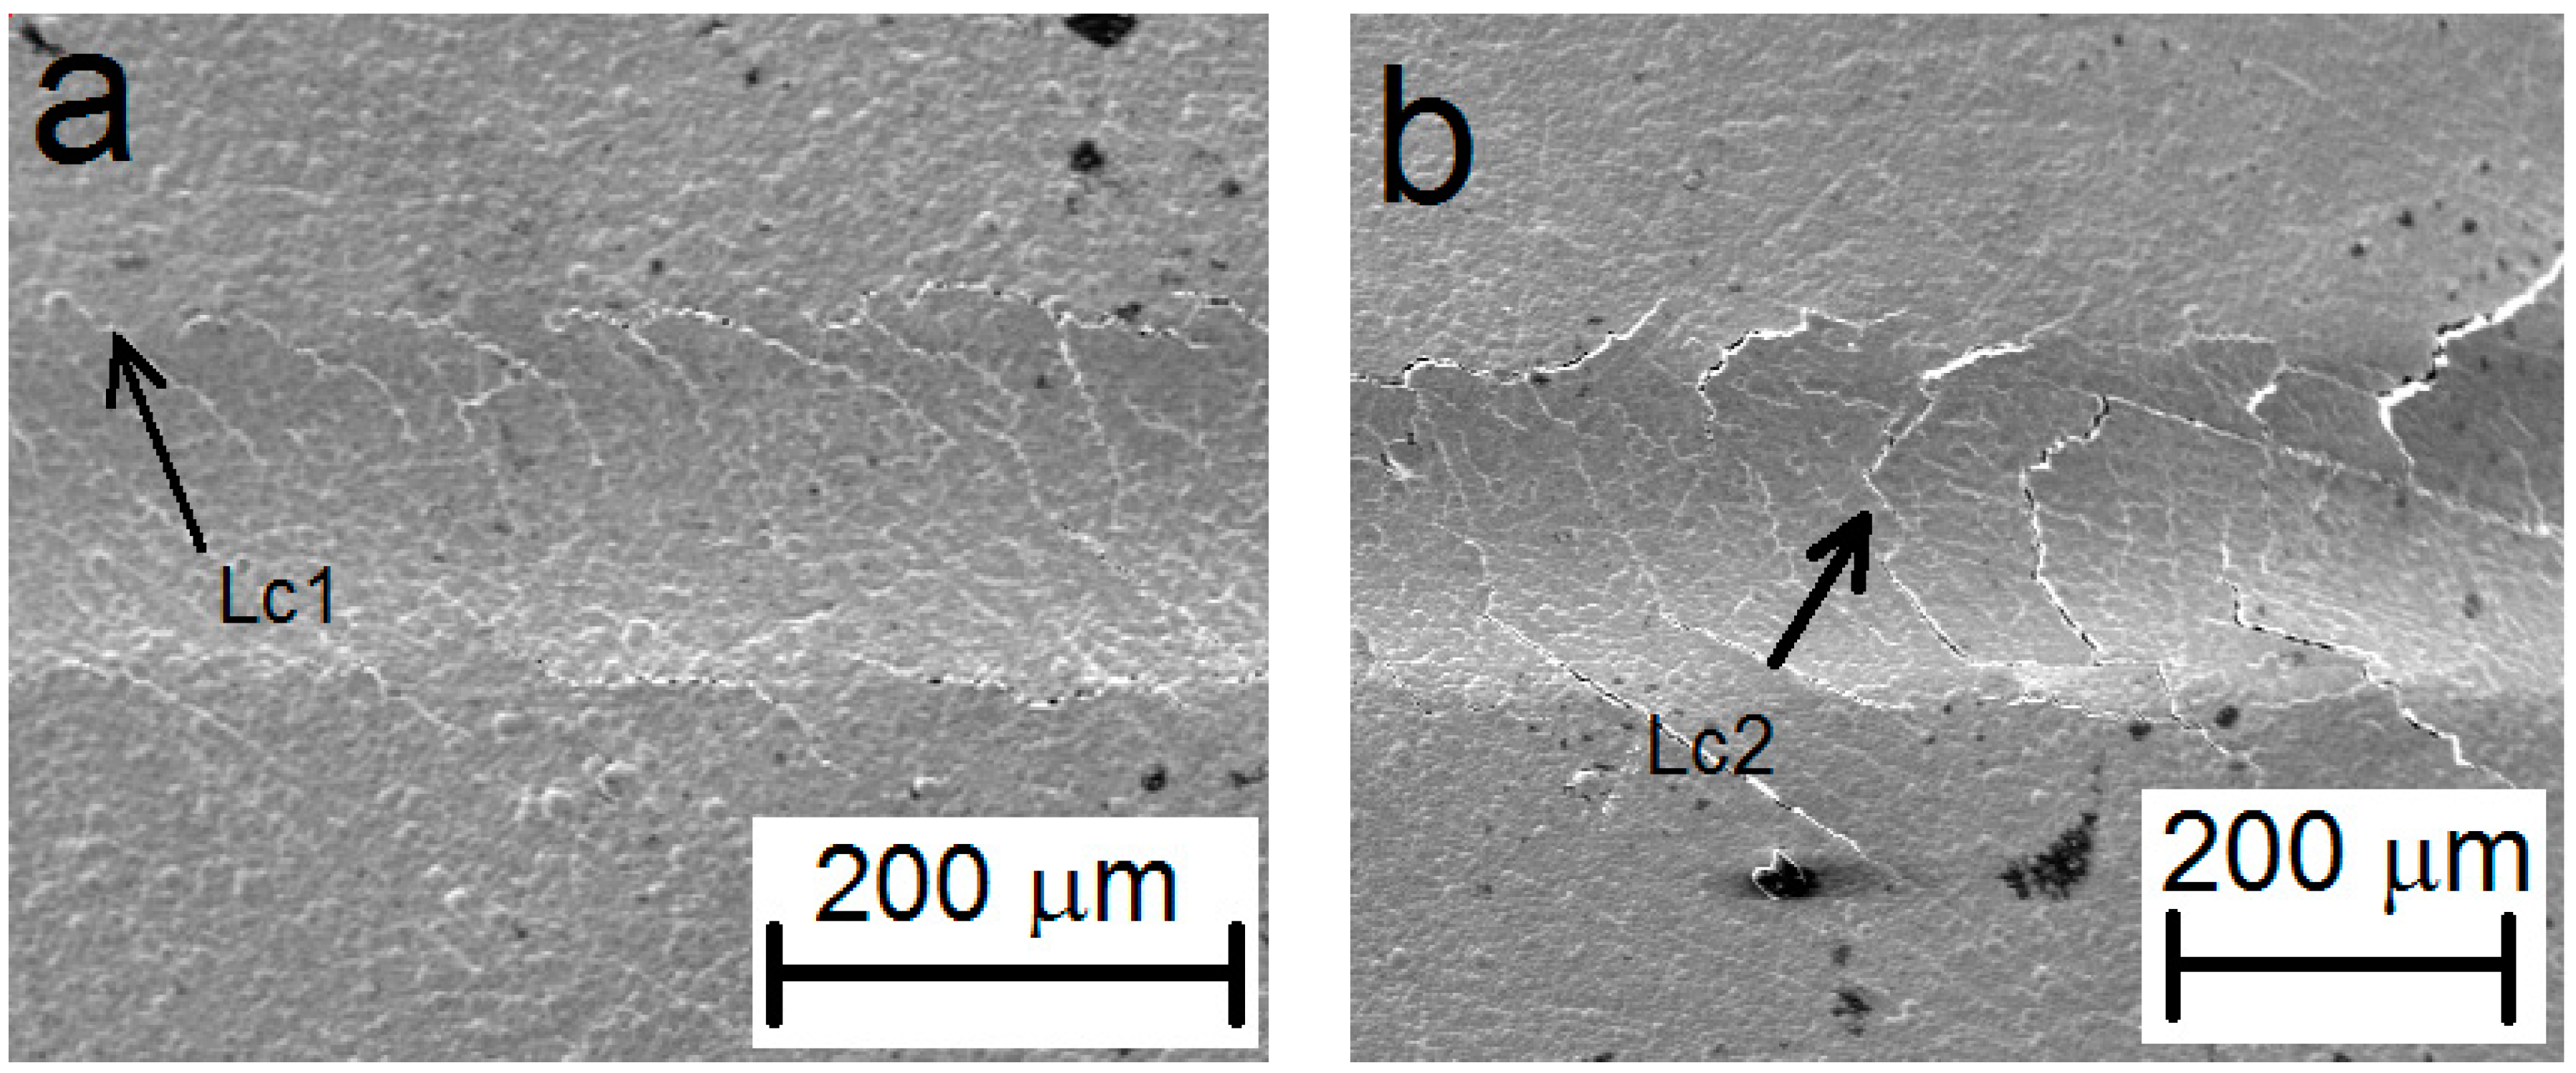
- The adhesion of the deposited Ni–P coating was determined from the appropriate critical normal forces Lc1 = 7.9 N, where i.e., oblique and parallel cracks are the primary failure—was observed, and Lc2 = 13.6 N, where the formation of transverse arch cracks was observed.
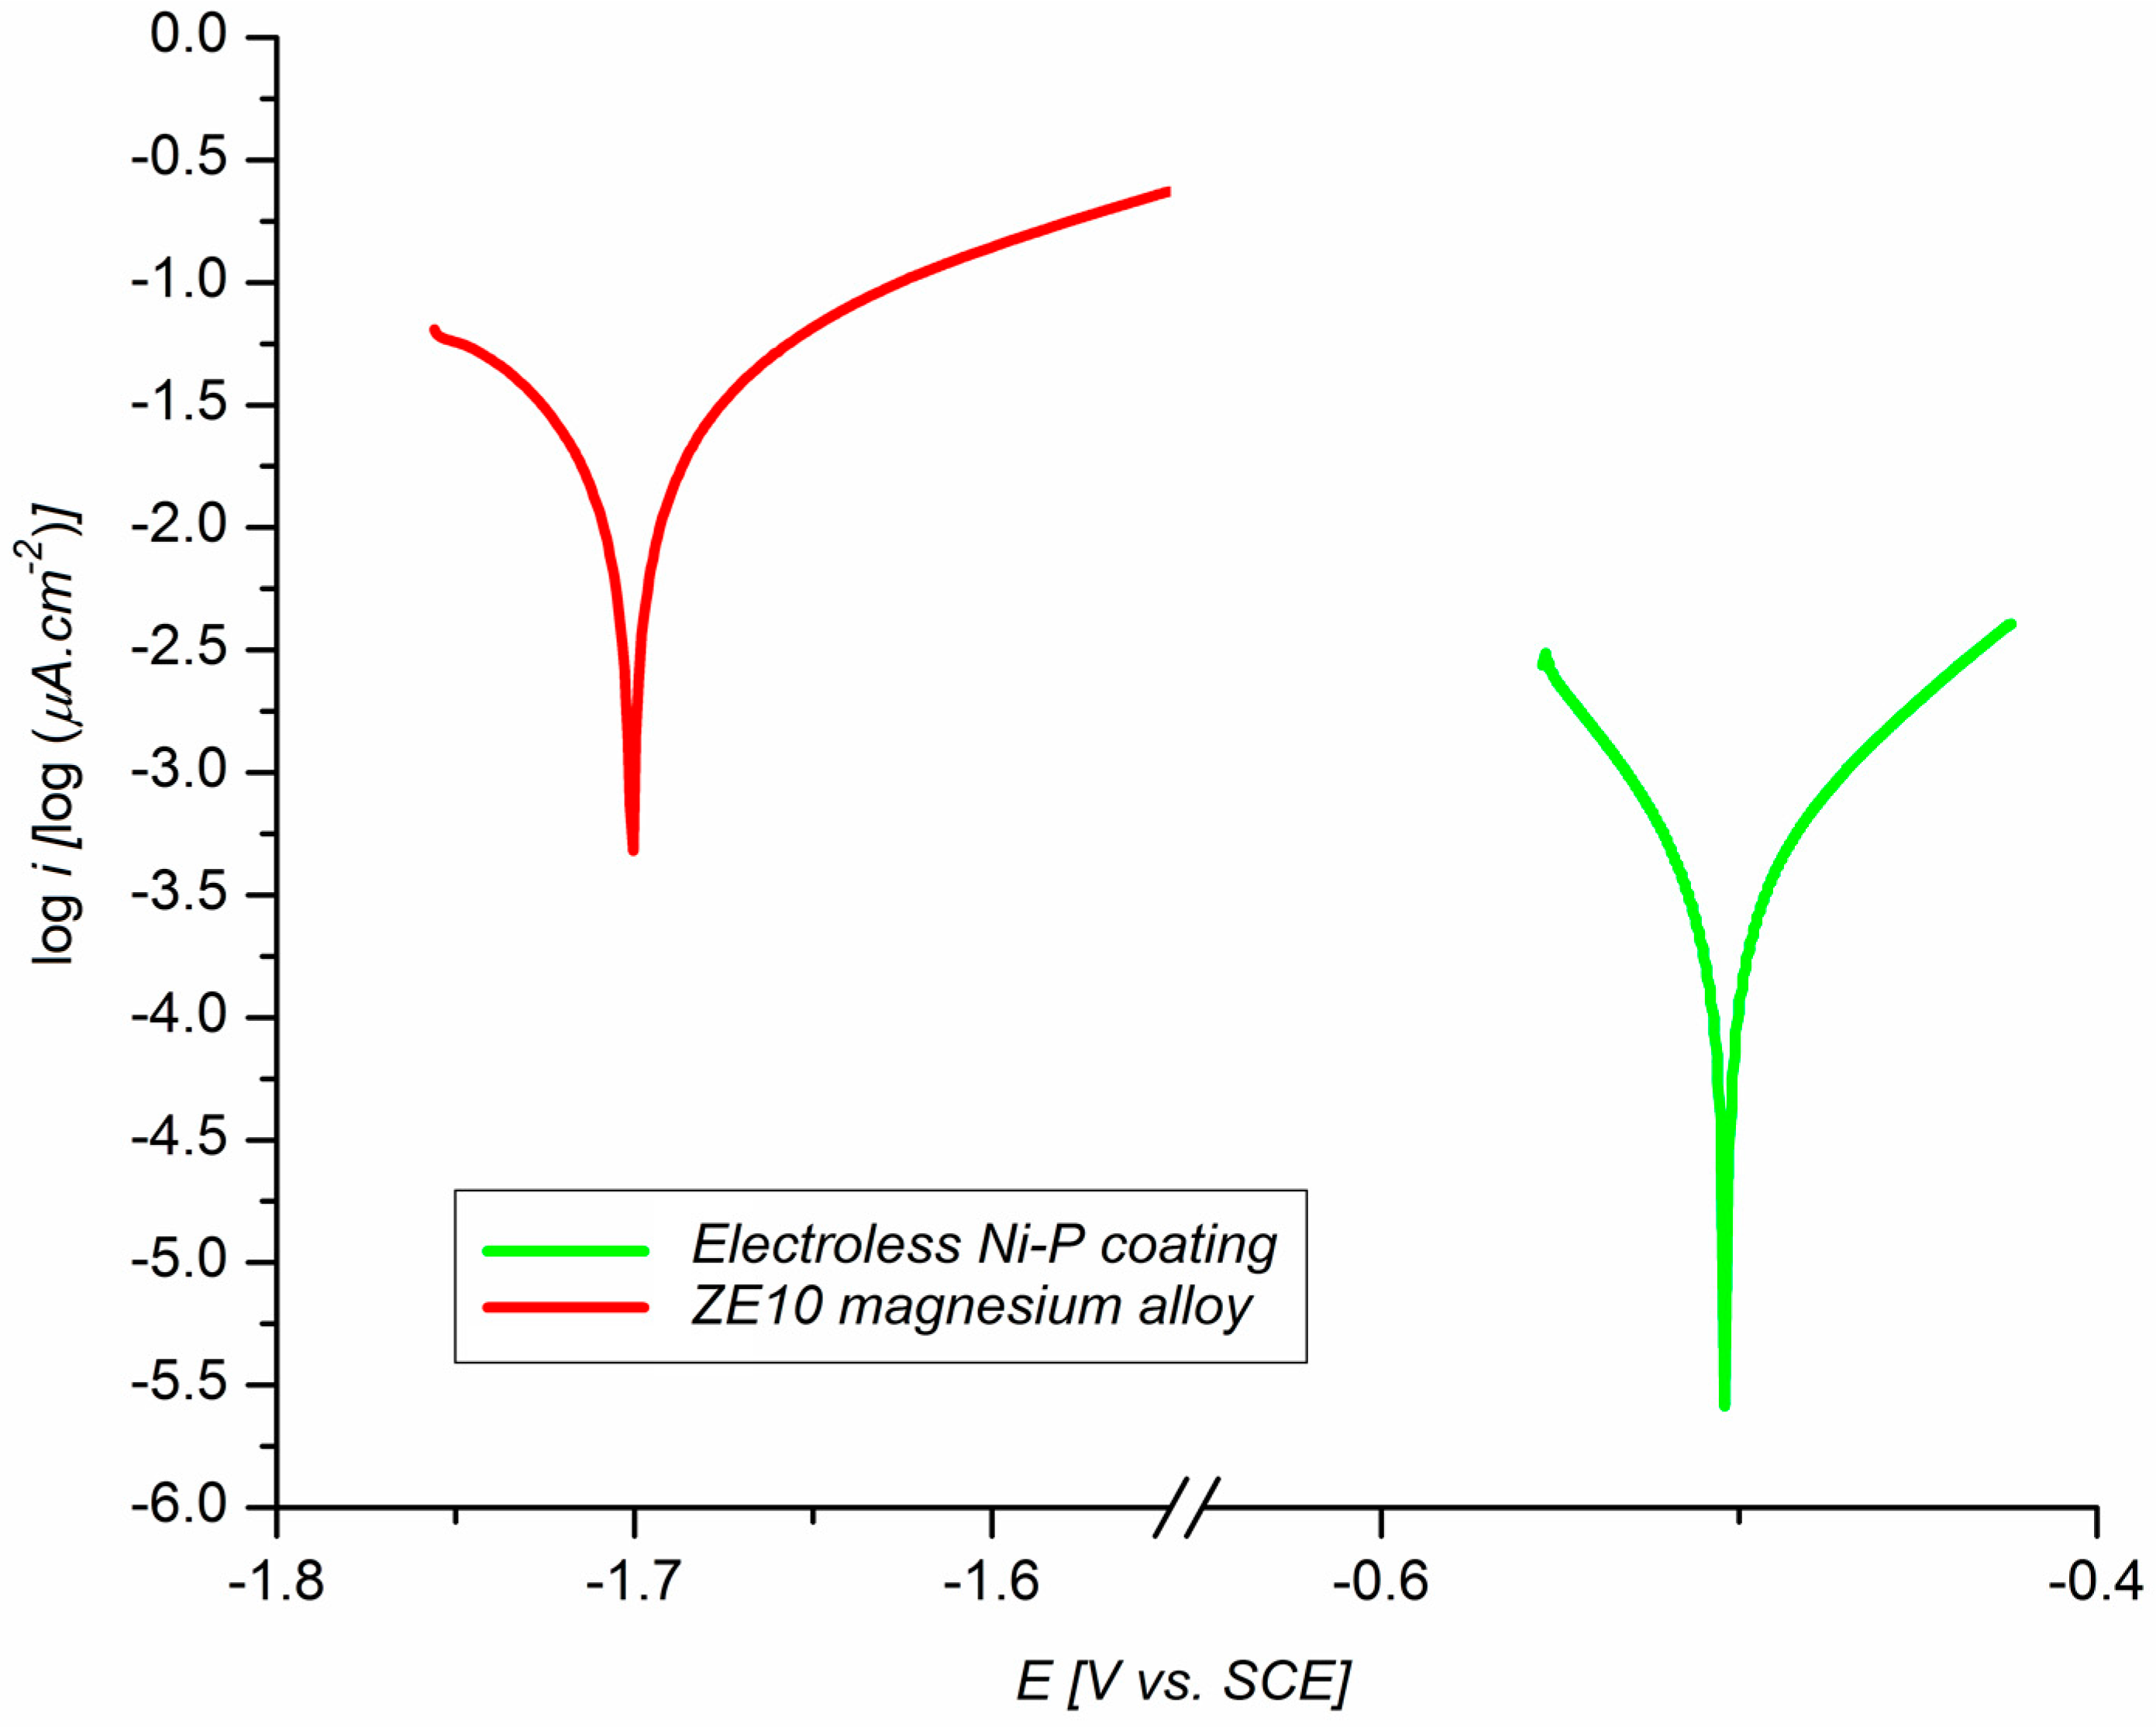
- Electrochemical polarization tests have shown an improvement in corrosion resistance via the deposition of Ni–P coating (Ecorr = −505 mV, icorr = 0.4 µA·cm−2, and vcorr = 8.95 µmpy) when compared to the ZE10 magnesium alloy (Ecorr = −1701 mV, icorr = 23.7 µA·cm−2, and vcorr = 530 µmpy).
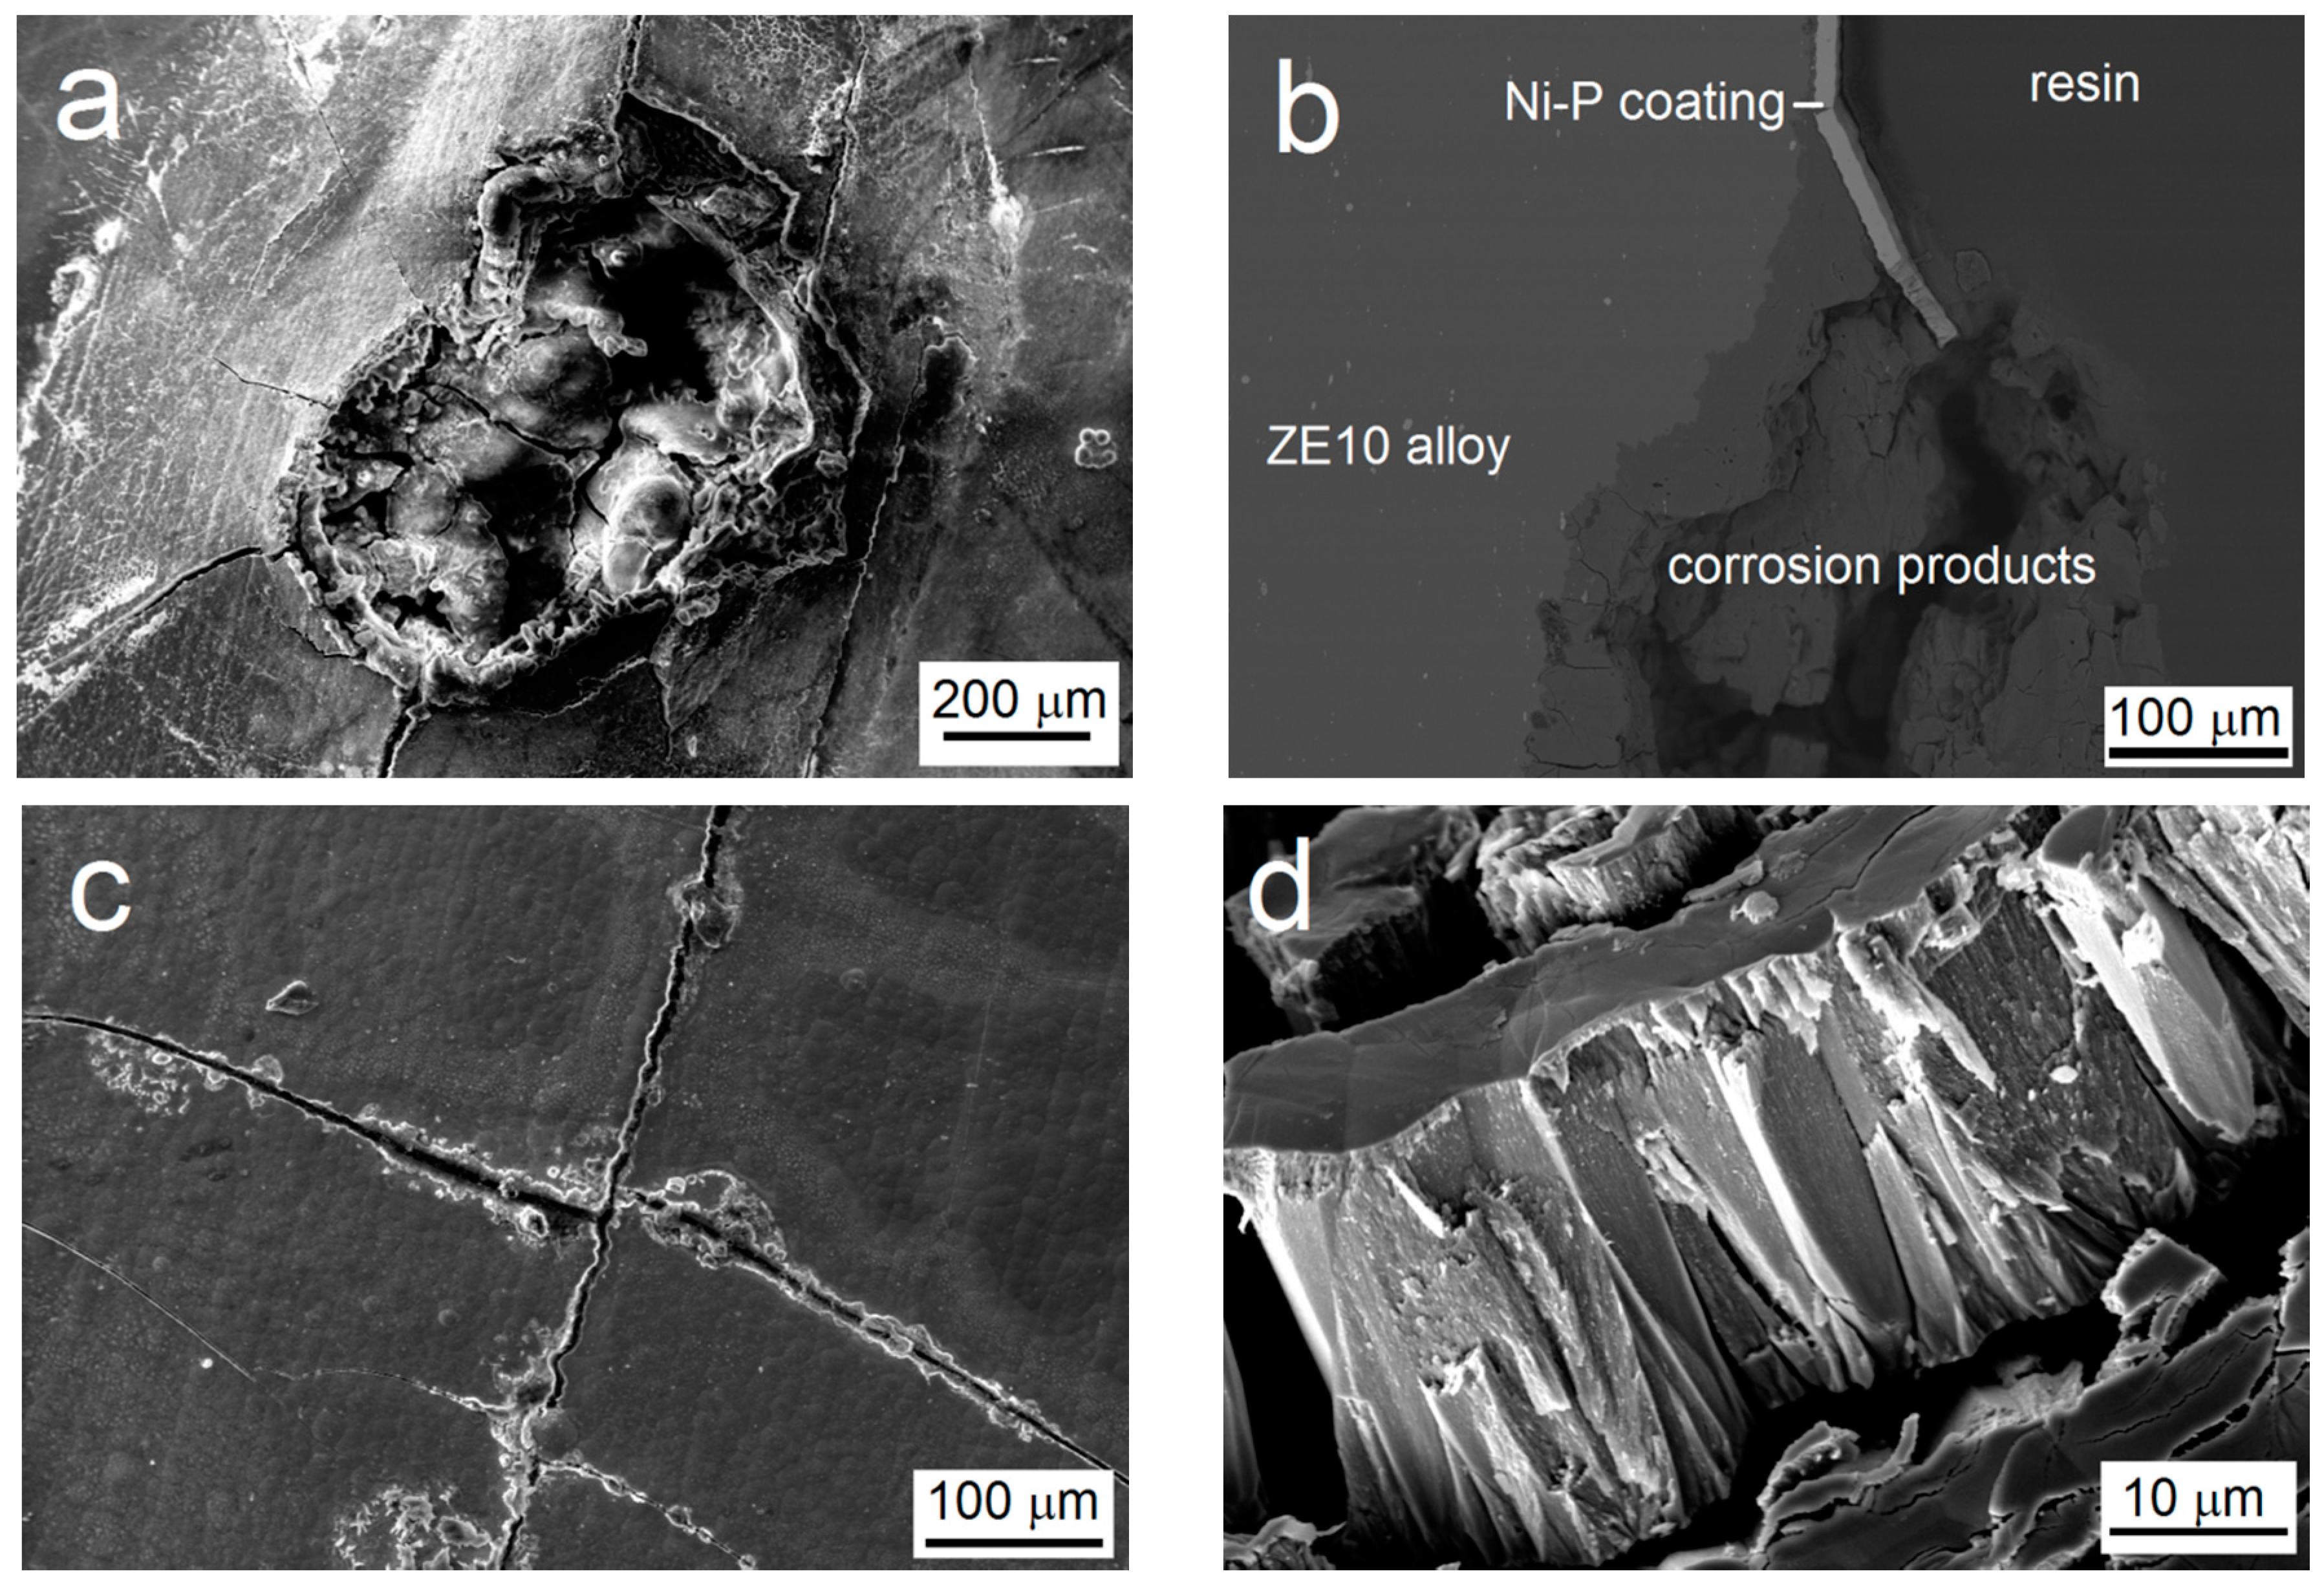
- Microcavities present in the coating and the columnar structure of the low-phosphorus Ni–P coating have a major influence on the process of the corrosion, acting as the channels between the corrosive environment and the substrate.
Acknowledgments
Author Contributions
Conflicts of Interest
References
- Friedrich, H. Alloys Containing Zirconium. In Magnesium Technology Metallurgy, Design Data, Automotive Applications; Mordike, B.L., Ed.; Springer: Berlin, Germany, 2004; pp. 140–141. [Google Scholar]
- ASM International Handbook Committee. Properties and Selection: Nonferrous Alloys and Special-Purpose Materials, 10th ed.; ASM International: Materials Park, OH, USA, 1990. [Google Scholar]
- Miao, X.; Li, X.; Hu, H.; Gao, G.; Zhang, S. Effects of the Oxide Coating Thickness on the Small Flaw Sizing Using an Ultrasonic Test Technique. Coatings 2018, 8, 69. [Google Scholar] [CrossRef]
- Shao, Z.; Cai, Z.; Hu, R.; Wei, S. The study of electroless nickel plating directly on magnesium alloy. Surf. Coat. Technol. 2014, 249, 42–47. [Google Scholar] [CrossRef]
- Liu, Y.; Li, W.; Li, Y. Microstructure and mechanical properties of ZE10 magnesium alloy prepared by equal channel angular pressing. Int. J. Min. Met. Mater. 2009, 16, 559–563. [Google Scholar] [CrossRef]
- Bettles, C.; Barnett, M. Advances in Wrought Magnesium Alloys: Fundamentals of Processing, Properties and Applications; Woodhead Publishing: Oxford, UK, 2012. [Google Scholar]
- Fauchais, P.L.; Heberlein, J.V.R.; Boulos, M.I. Thermal Spray Fundamentals: From Powder to Part; Springer: New York, NY, USA, 2013. [Google Scholar]
- Drábiková, J.; Fintová, S.; Tkacz, J.; Doležal, P.; Wasserbauer, J. Unconventional fluoride conversion coating preparation and characterization. Anti-Corros. Method Mater. 2017, 64, 613–619. [Google Scholar] [CrossRef]
- Riedel, W. Electroless Nickel Plating; ASM International: Metals Park, OH, USA, 1991. [Google Scholar]
- Mallory, G.O.; Hajdu, J.B. Electroless Plating: Fundamentals and Applications; Knoyes Publications/William Andrew Publishing: Norwich, NY, USA, 2009. [Google Scholar]
- Abrantes, L.M.; Fundo, A.; Jin, G. Influence of phosphorus content on the structure of nickel electroless deposits. J. Mater. Chem. 2001, 11, 200–203. [Google Scholar] [CrossRef][Green Version]
- Sankara Narayanan, T.S.N.; Baskaran, I.; Krishnaveni, K.; Parthiban, S. Deposition of electroless Ni–P graded coatings and evaluation of their corrosion resistance. Surf. Coat. Technol. 2006, 200, 3438–3445. [Google Scholar] [CrossRef]
- Curtis, J.M.; Polak, T.A.; Wilcox, G.D. Handbook of Surface Treatments and Coatings; Professional Engineering Publishing: London, UK, 2003. [Google Scholar]
- El Mahallawy, N.; Bakkar, A.; Shoeib, M.; Palkowski, H.; Neubert, V. Electroless Ni–P coating of different magnesium alloys. Surf. Coat. Technol. 2008, 202, 5151–5157. [Google Scholar] [CrossRef]
- Wu, L.; Zhao, J.; Xie, Y.; Yang, Z. Progress of electroplating and electroless plating on magnesium alloy. Trans. Nonferr. Metal. Soc. 2010, 20, 630–637. [Google Scholar] [CrossRef]
- Zhou, Y.; Zhang, S.; Nie, L.; Zhu, Z.; Zhang, J.; Cao, F.; Zhang, J. Electrodeposition and corrosion resistance of Ni–P–TiN composite coating on AZ91D magnesium alloy. Trans. Nonferr. Metal. Soc. Chin. 2016, 26, 2976–2987. [Google Scholar] [CrossRef]
- Chen, J.; Yu, G.; Hu, B.; Liu, Z.; Ye, L.; Wang, Z. A zinc transition layer in electroless nickel plating. Surf. Coat. Technol. 2006, 201, 686–690. [Google Scholar] [CrossRef]
- ASTM B90/B90M-15 Standard Specification for Magnesium-Alloy Sheet and Plate; ASTM International: West Conshohocken, PA, USA, 2015.
- Vander Voort, G.F. Metallography, Principles and Practice; ASM International: Materials Park, OH, USA, 1999. [Google Scholar]
- Tran, T.N.; Yu, G.; Hu, B.N.; Xie, Z.H.; Tang, R.; Zhang, X.Y. Effects of pretreatments of magnesium alloys on direct electroless nickel plating. Trans. IMF 2012, 90, 209–214. [Google Scholar] [CrossRef]
- ASTM E384-17 Standard Test Method for Microindentation Hardness of Materials; ASTM International: West Conshohocken, PA, USA, 2017.
- ASTM C1624-05(2015) Standard Test Method for Adhesion Strength and Mechanical Failure Modes of Ceramic Coatings by Quantitative Single Point Scratch Testing; ASTM International: West Conshohocken, PA, USA, 2015.
- Szewieczek, D.; Baron, A. Electrochemical corrosion and its influence on magnetic properties of Fe75.5Si13.5B9Nb3Cu1 alloy. J. Mater. Process. Technol. 2005, 164–165, 940–946. [Google Scholar] [CrossRef]
- Ambat, R.; Zhou, W. Electroless nickel-plating on AZ91D magnesium alloy: effect of substrate microstructure and plating parameters. Surf. Coat. Technol. 2004, 179, 124–134. [Google Scholar] [CrossRef]
- Wang, W.; Zhang, W.; Wang, Y.; Mitsuzak, N.; Chen, Z. Ductile electroless Ni–P coating onto flexible printed circuit board. Appl. Surf. Sci. 2016, 367, 528–532. [Google Scholar] [CrossRef]
- Yang, H.; Gao, Y.; Qin, W. Investigation of the Corrosion Behavior of Electroless Ni–P Coating in Flue Gas Condensate. Coatings 2017, 7, 16. [Google Scholar] [CrossRef]
- Mao, S.; Yang, H.; Li, J.; Huang, F.; Song, Z. Corrosion properties of aluminium coatings deposited on sintered NdFeB by ion-beam-assisted deposition. Appl. Surf. Sci. 2011, 257, 5581–5585. [Google Scholar] [CrossRef]
- Buchtík, M.; Kosár, P.; Wasserbauer, J.; Doležal, P. Characterization of Ni–P coating prepared on a wrought AZ61 magnesium alloy via electroless deposition. Mater. Tehnol. 2017, 51, 925–931. [Google Scholar] [CrossRef]
- Parkinson, R. Properties and Applications of Electroless Nickel; Technical paper 10081; Nickel Development Institute: Toronto, ON, Canada, 1997. [Google Scholar]
- Buchtík, M.; Kosár, P.; Wasserbauer, J.; Doležal, P. Characterization of Ni–P coating prepared via electroless deposition on AZ31 magnesium alloy. Koroze a ochrana materiálu 2017, 61, 1–6. [Google Scholar] [CrossRef][Green Version]
- Wang, H.-L.; Liu, L.-Y.; Dou, Y.; Zhang, W.-Z.; Jiang, W.-F. Preparation and corrosion resistance of electroless Ni–P/SiC functionally gradient coatings on AZ91D magnesium alloy. Appl. Surf. Sci. 2013, 286, 319–327. [Google Scholar] [CrossRef]
- Farzaneh, A.; Mohammadi, M.; Ehteshamzadeh, M.; Mohammadi, F. Electrochemical and structural properties of electroless Ni–P-SiC nanocomposite coatings. Appl. Surf. Sci. 2013, 276, 697–704. [Google Scholar] [CrossRef]
- Balaraju, J.N.; Sankara Narayanan, T.S.N.; Seshadri, S.K. Electroless Ni–P composite coatings. J. Appl. Electrochem. 2003, 33, 807–816. [Google Scholar] [CrossRef]
- Holmberg, K.; Matthews, A. Coatings Tribology Properties, Mechanisms, Techniques and Applications in Surface Engineering, 2nd ed.; Elsevier Science: Amsterdam, The Netherlands, 2009. [Google Scholar]
- Liu, Z.; Gao, W. Electroless nickel plating on AZ91 Mg alloy substrate. Surf. Coat. Technol. 2006, 200, 5087–5093. [Google Scholar] [CrossRef]
- Tamilarasan, T.R.; Rajendran, R.; Siva shankar, M.; Sanjith, U.; Rajagopal, G.; Sudagar, J. Wear and scratch behaviour of electroless Ni–P-nano-TiO2: Effect of surfactants. Wear 2016, 346–347, 148–157. [Google Scholar] [CrossRef]
- Elansezhian, R.; Ramamoorthy, B.; Kesavan Nair, P. Effect of surfactants on the mechanical properties of electroless (Ni–P) coating. Surf. Coat. Technol. 2008, 203, 709–712. [Google Scholar] [CrossRef]
- Tracton, A.A. Coatings Technology: Fundamentals, Testing, and Processing Techniques; CRC Press: Boca Raton, FL, USA, 2007. [Google Scholar]
- Tkacz, J.; Minda, J.; Fintová, S.; Wasserbauer, J. Comparison of Electrochemical Methods for the Evaluation of Cast AZ91 Magnesium Alloy. Materials 2016, 9, 925. [Google Scholar] [CrossRef] [PubMed]
- Chen, B.-H.; Hong, L.; Ma, Y.; Ko, T.-M. Effects of Surfactants in an Electroless Nickel-Plating Bath on the Properties of Ni−P Alloy Deposits. Ind. Eng. Chem. Res. 2002, 41, 2668–2678. [Google Scholar] [CrossRef]
- Valova, E.; Georgieva, J.; Armyanov, S.; Avramova, I.; Dille, J.; Kubova, O.; Delplancke-Ogletree, M.-P. Corrosion behavior of hybrid coatings: Electroless Ni–Cu–P and sputtered TiN. Surf. Coat. Technol. 2010, 204, 2775–2781. [Google Scholar] [CrossRef]
- Muraliraja, R.; Elansezhian, R.; Sudagar, J.; Raviprakash, A.V. Influence of a Zwitterionic Surfactant on the Surface Properties of Electroless Ni–P Coating on Mild Steel. J. Surfactants Deterg. 2016, 19, 1081–1088. [Google Scholar] [CrossRef]
- Latt, K.M. Effects of Surfactants on Characteristics and Applications of Electroless Nickel-Phosphorous Deposits. Master’s Thesis, National University of Singapore, Singapore, 2003. [Google Scholar]


| Zn | Zr | Mn | Fe | Mg | Others |
|---|---|---|---|---|---|
| 1.41 | 0.14 | 0.08 | 0.005 | balance | max. 0.30 |
| Source | Substrate | Coating | Lc1 [N] | Lc2 [N] | Ft1 at Lc1 [N] | Ft2 at Lc2 [N] |
|---|---|---|---|---|---|---|
| presented Ni–P coating | ZE10 | Ni–P | 7.9 | 13.6 | 0.6 | 3.4 |
| [30] | AZ31 | Ni–P | 7.3 | 12.3 | 1.1 | 2.6 |
| [28] | AZ61 | Ni–P | 6.9 | 11.9 | 0.8 | 2.2 |
| [35] | Polished AZ91 | Ni–P Ni–P (temp.: 523 K) Ni–P (temp.: 673 K) | – – – | 10.2 (Lc) 10.6 (Lc) 9.7 (Lc) | – – – | – – – |
| [35] | Blasted AZ91 | Ni–P Ni–P (temp.: 523 K) Ni–P (temp.: 673 K) | – – – | 14.0 (Lc) 16.5 (Lc) 14.8 (Lc) | – – – | – – – |
| [36] | AISI 1018 | plain Ni–P/TiO2 Ni–P/TiO2 with SDS Ni–P/TiO2 with DTAB | – – – | ~ 13 (Lc) ~ 19 (Lc) ~ 29 (Lc) | – – – | – – – |
| Sample | Ecorr [mV] | icorr [µA·cm−2] | vcorr [µmpy] |
|---|---|---|---|
| ZE10 alloy | −1701 | 23.7 | 530.00 |
| ZE10 + Ni–P coating | −505 | 0.4 | 8.95 |
© 2018 by the authors. Licensee MDPI, Basel, Switzerland. This article is an open access article distributed under the terms and conditions of the Creative Commons Attribution (CC BY) license (http://creativecommons.org/licenses/by/4.0/).
Share and Cite
Buchtík, M.; Kosár, P.; Wasserbauer, J.; Tkacz, J.; Doležal, P. Characterization of Electroless Ni–P Coating Prepared on a Wrought ZE10 Magnesium Alloy. Coatings 2018, 8, 96. https://doi.org/10.3390/coatings8030096
Buchtík M, Kosár P, Wasserbauer J, Tkacz J, Doležal P. Characterization of Electroless Ni–P Coating Prepared on a Wrought ZE10 Magnesium Alloy. Coatings. 2018; 8(3):96. https://doi.org/10.3390/coatings8030096
Chicago/Turabian StyleBuchtík, Martin, Petr Kosár, Jaromír Wasserbauer, Jakub Tkacz, and Pavel Doležal. 2018. "Characterization of Electroless Ni–P Coating Prepared on a Wrought ZE10 Magnesium Alloy" Coatings 8, no. 3: 96. https://doi.org/10.3390/coatings8030096
APA StyleBuchtík, M., Kosár, P., Wasserbauer, J., Tkacz, J., & Doležal, P. (2018). Characterization of Electroless Ni–P Coating Prepared on a Wrought ZE10 Magnesium Alloy. Coatings, 8(3), 96. https://doi.org/10.3390/coatings8030096