Evolution of the Three-Dimensional Structure and Growth Model of Plasma Electrolytic Oxidation Coatings on 1060 Aluminum Alloy


Abstract
1. Introduction
2. Materials and Methods
2.1. Materials and PEO Treatment
2.2. Specimen Characterization
3. Results
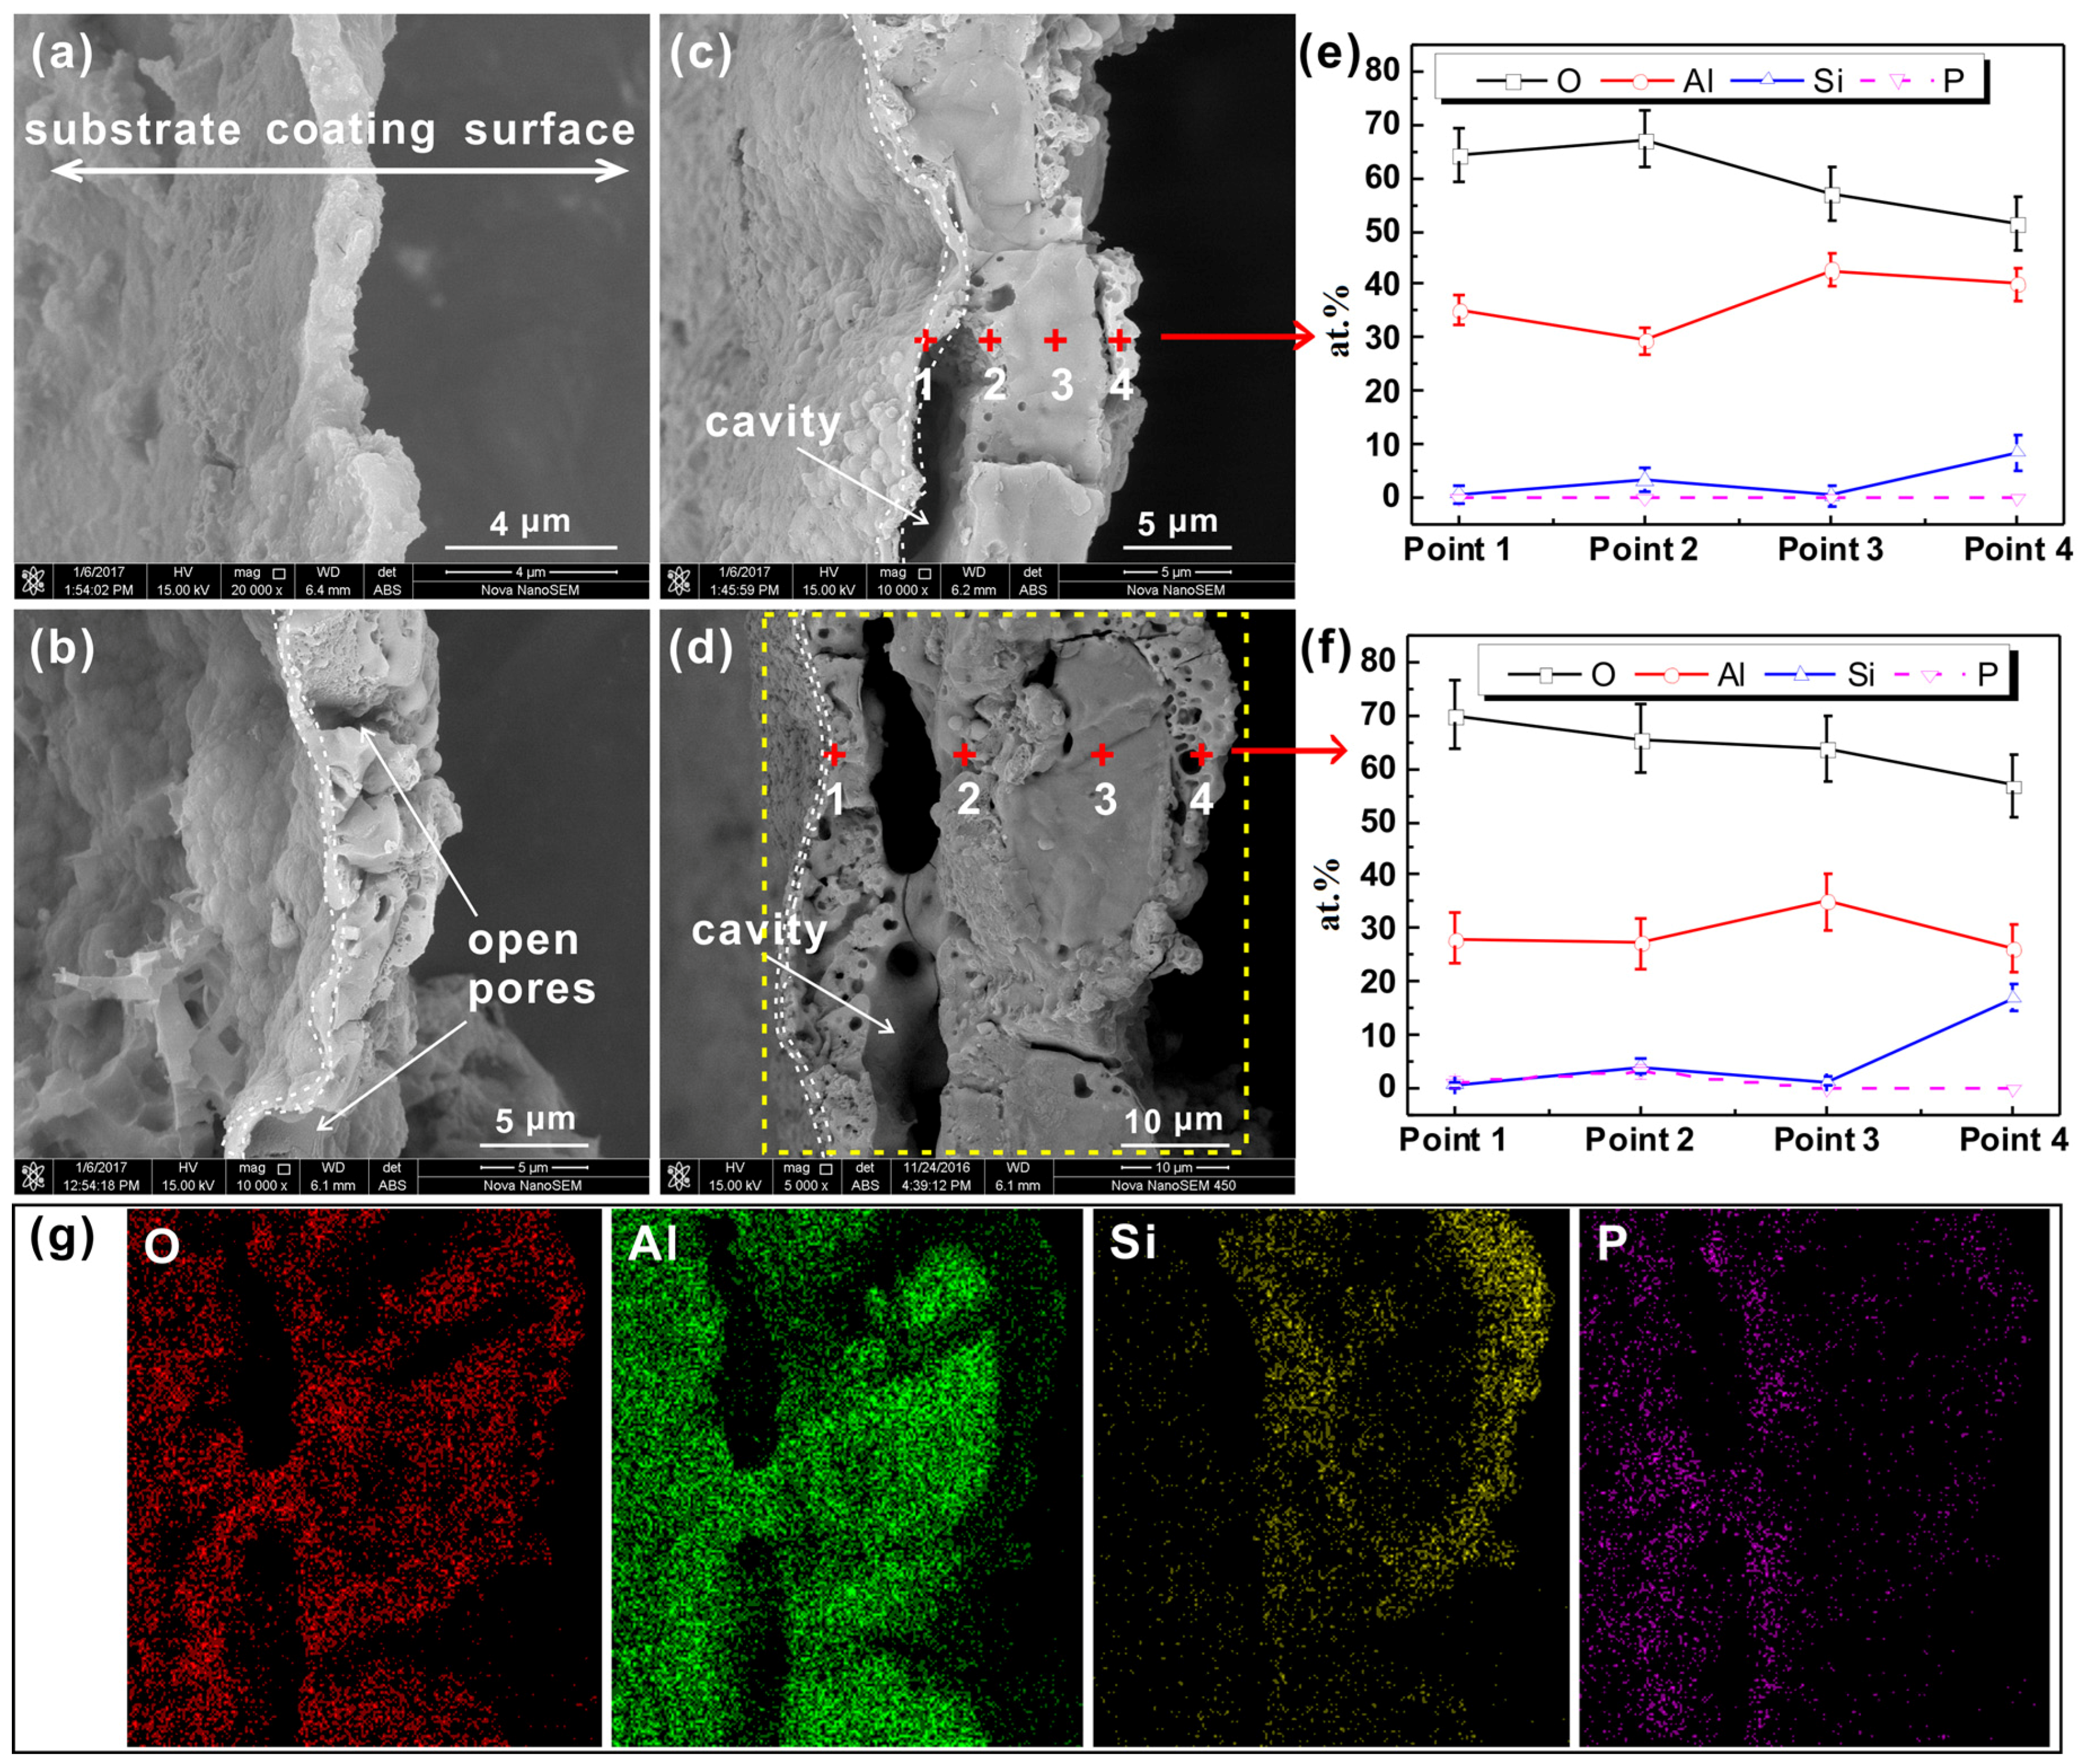
3.1. Fracture Cross-Sectional Morphology and Chemical Composition of the PEO Coating
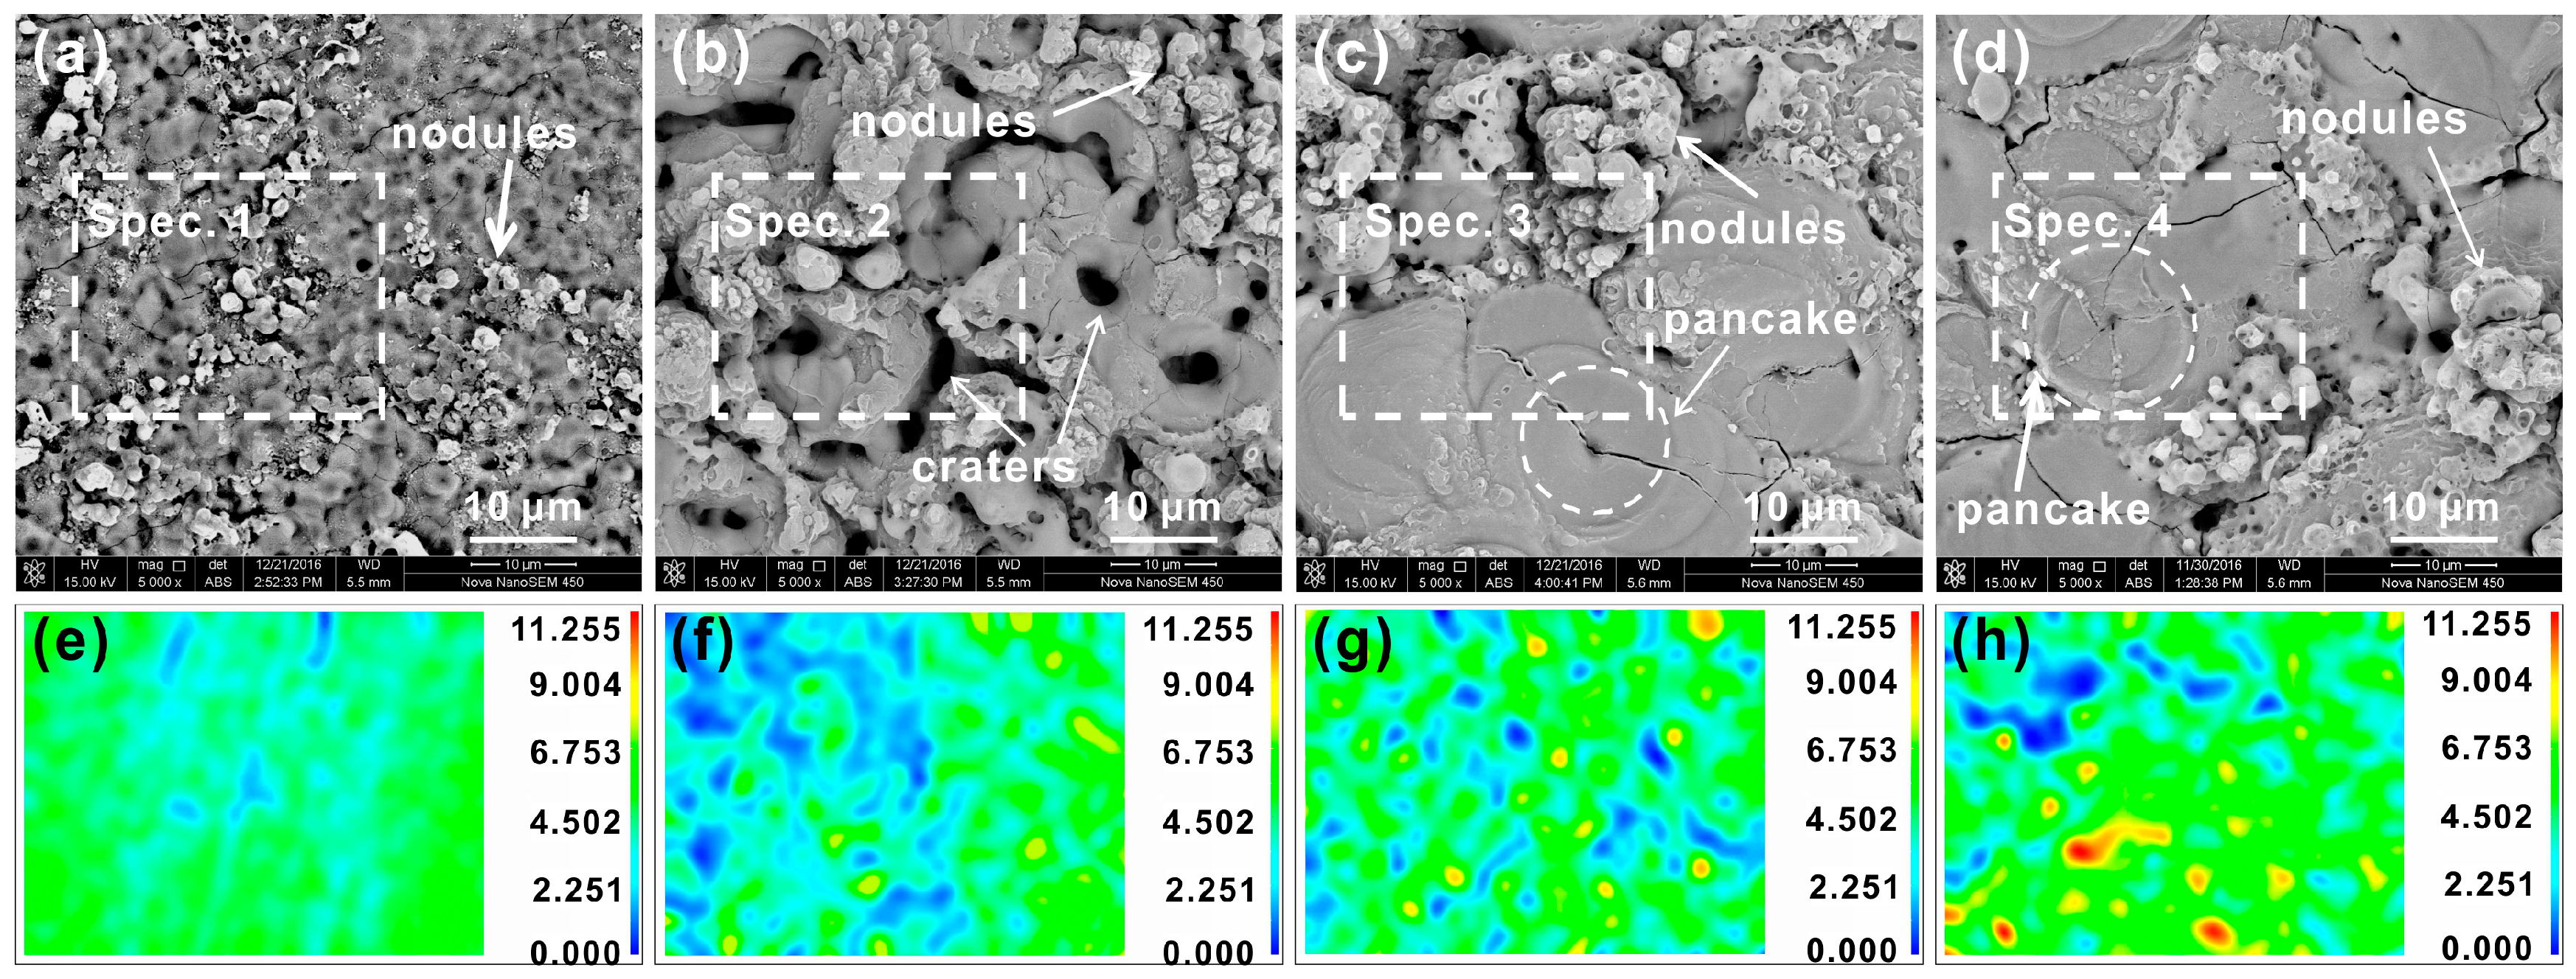
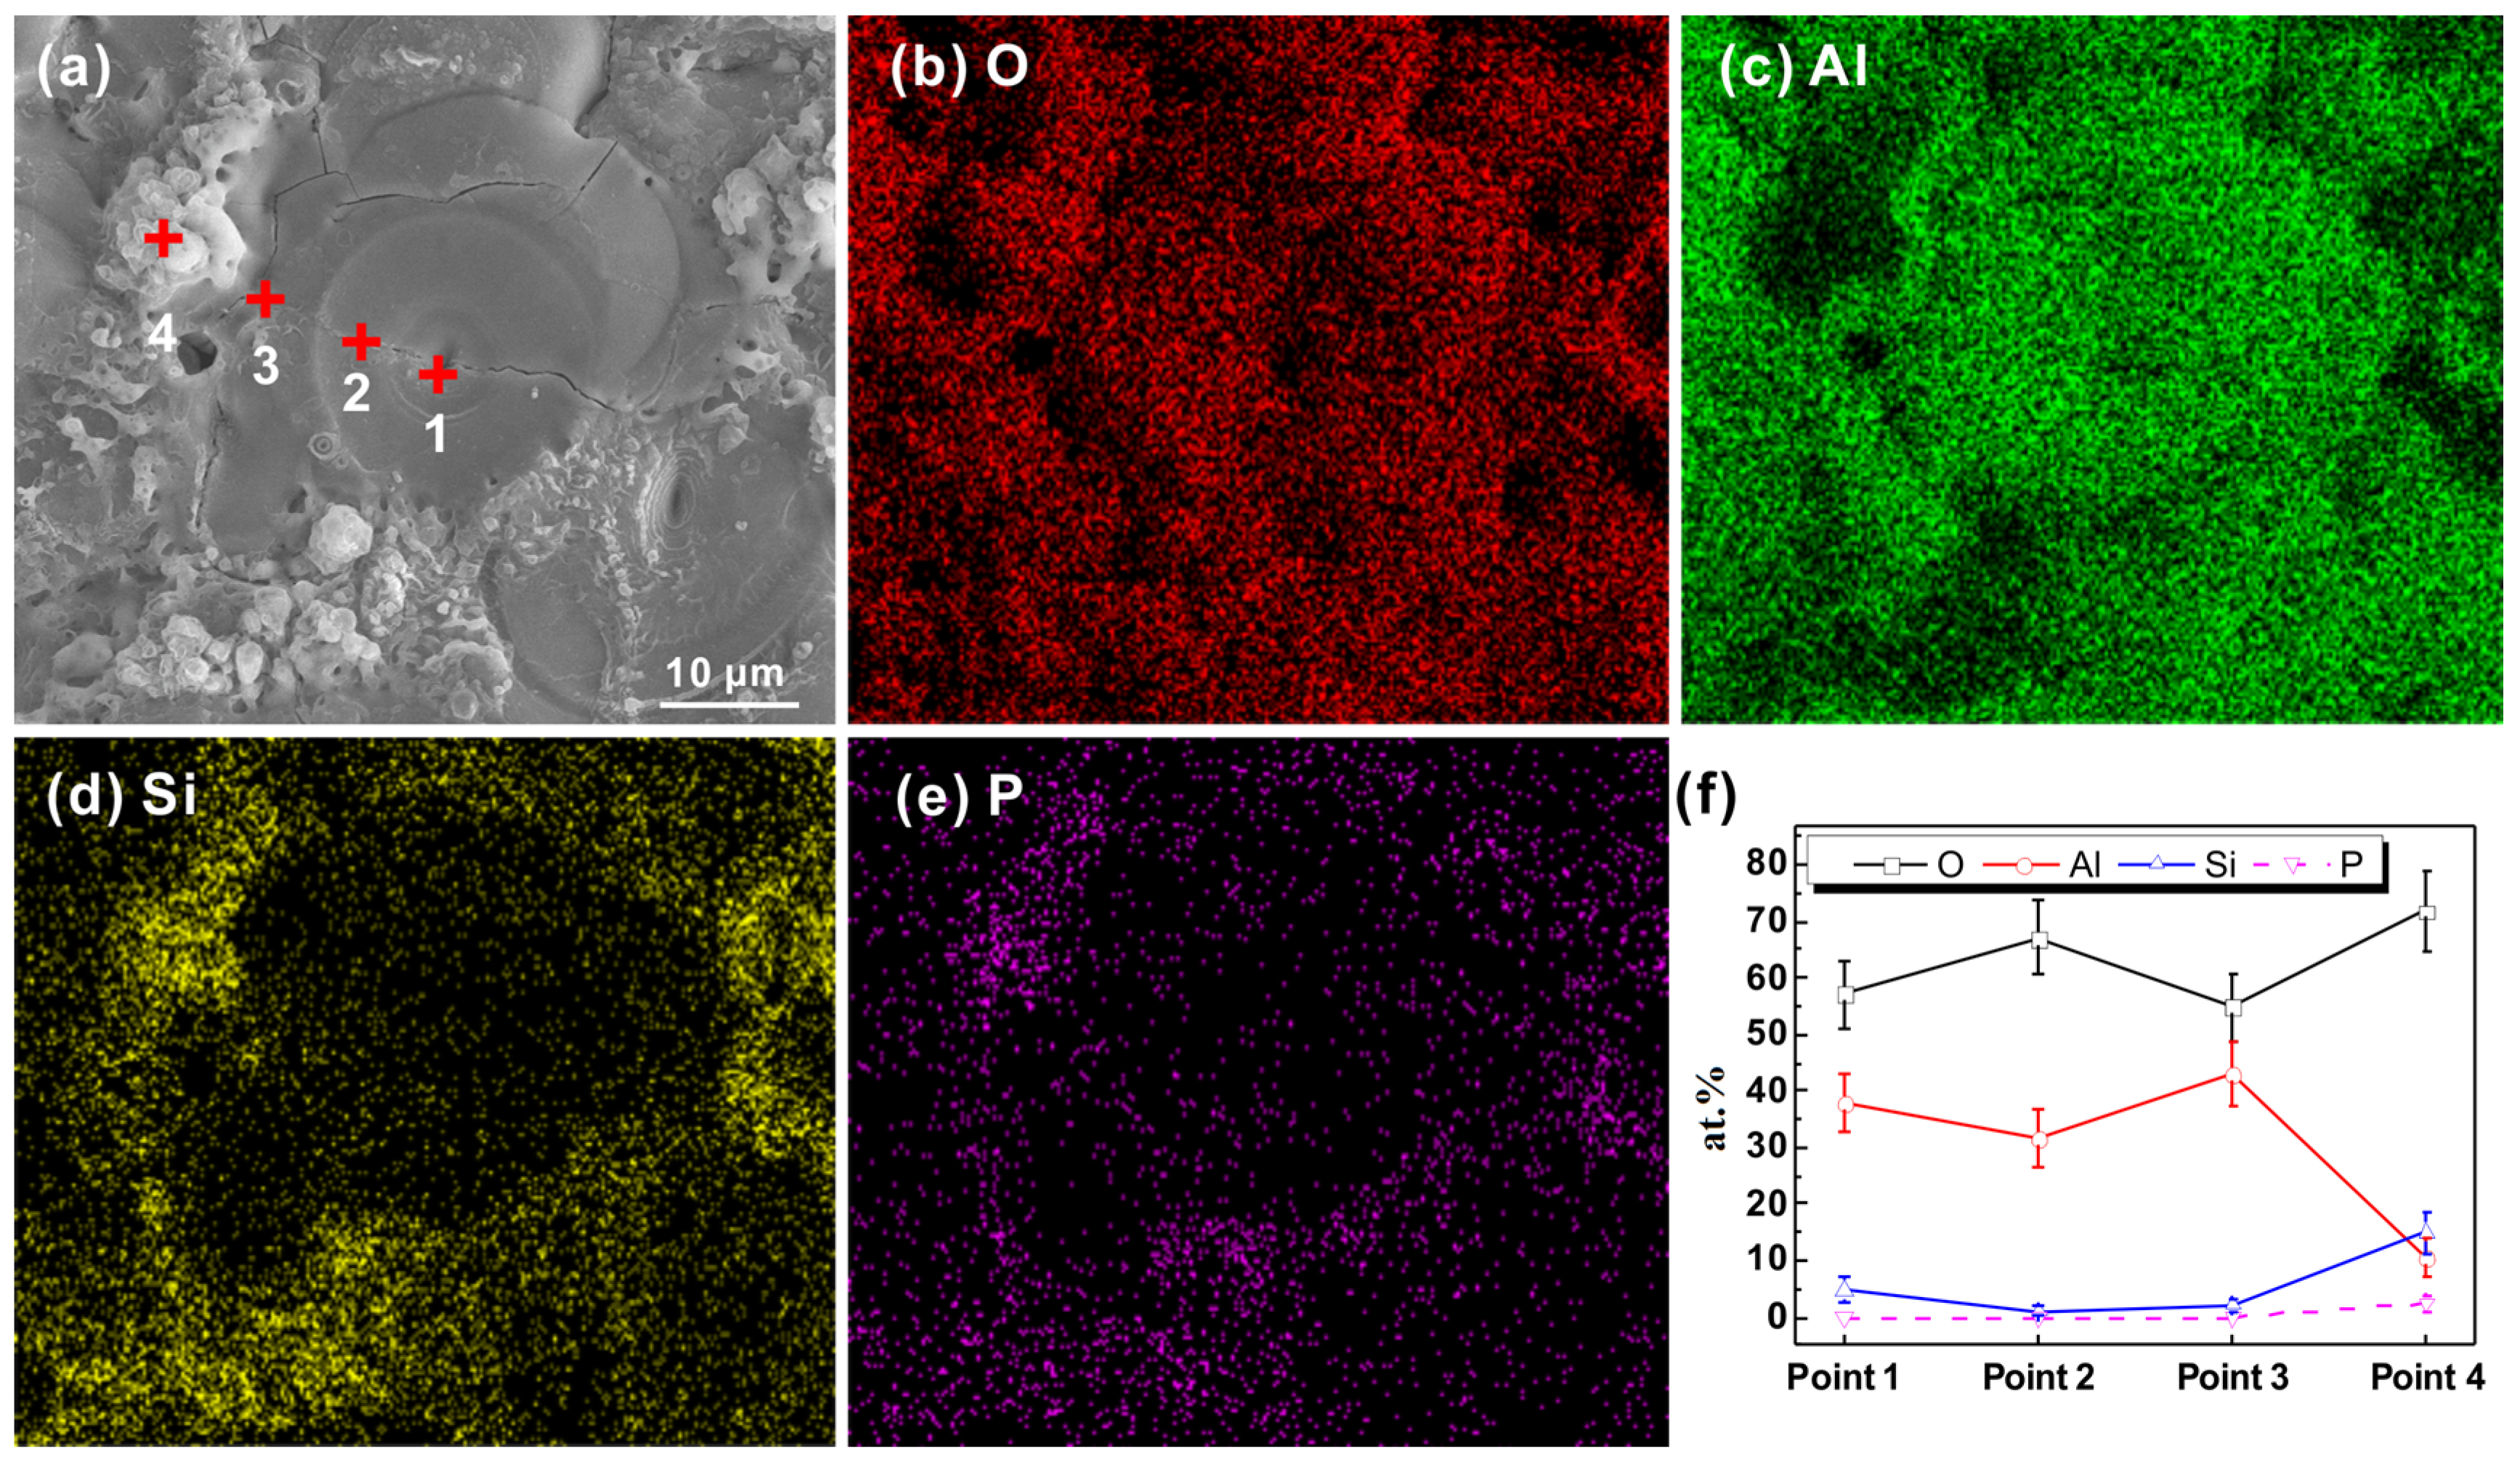
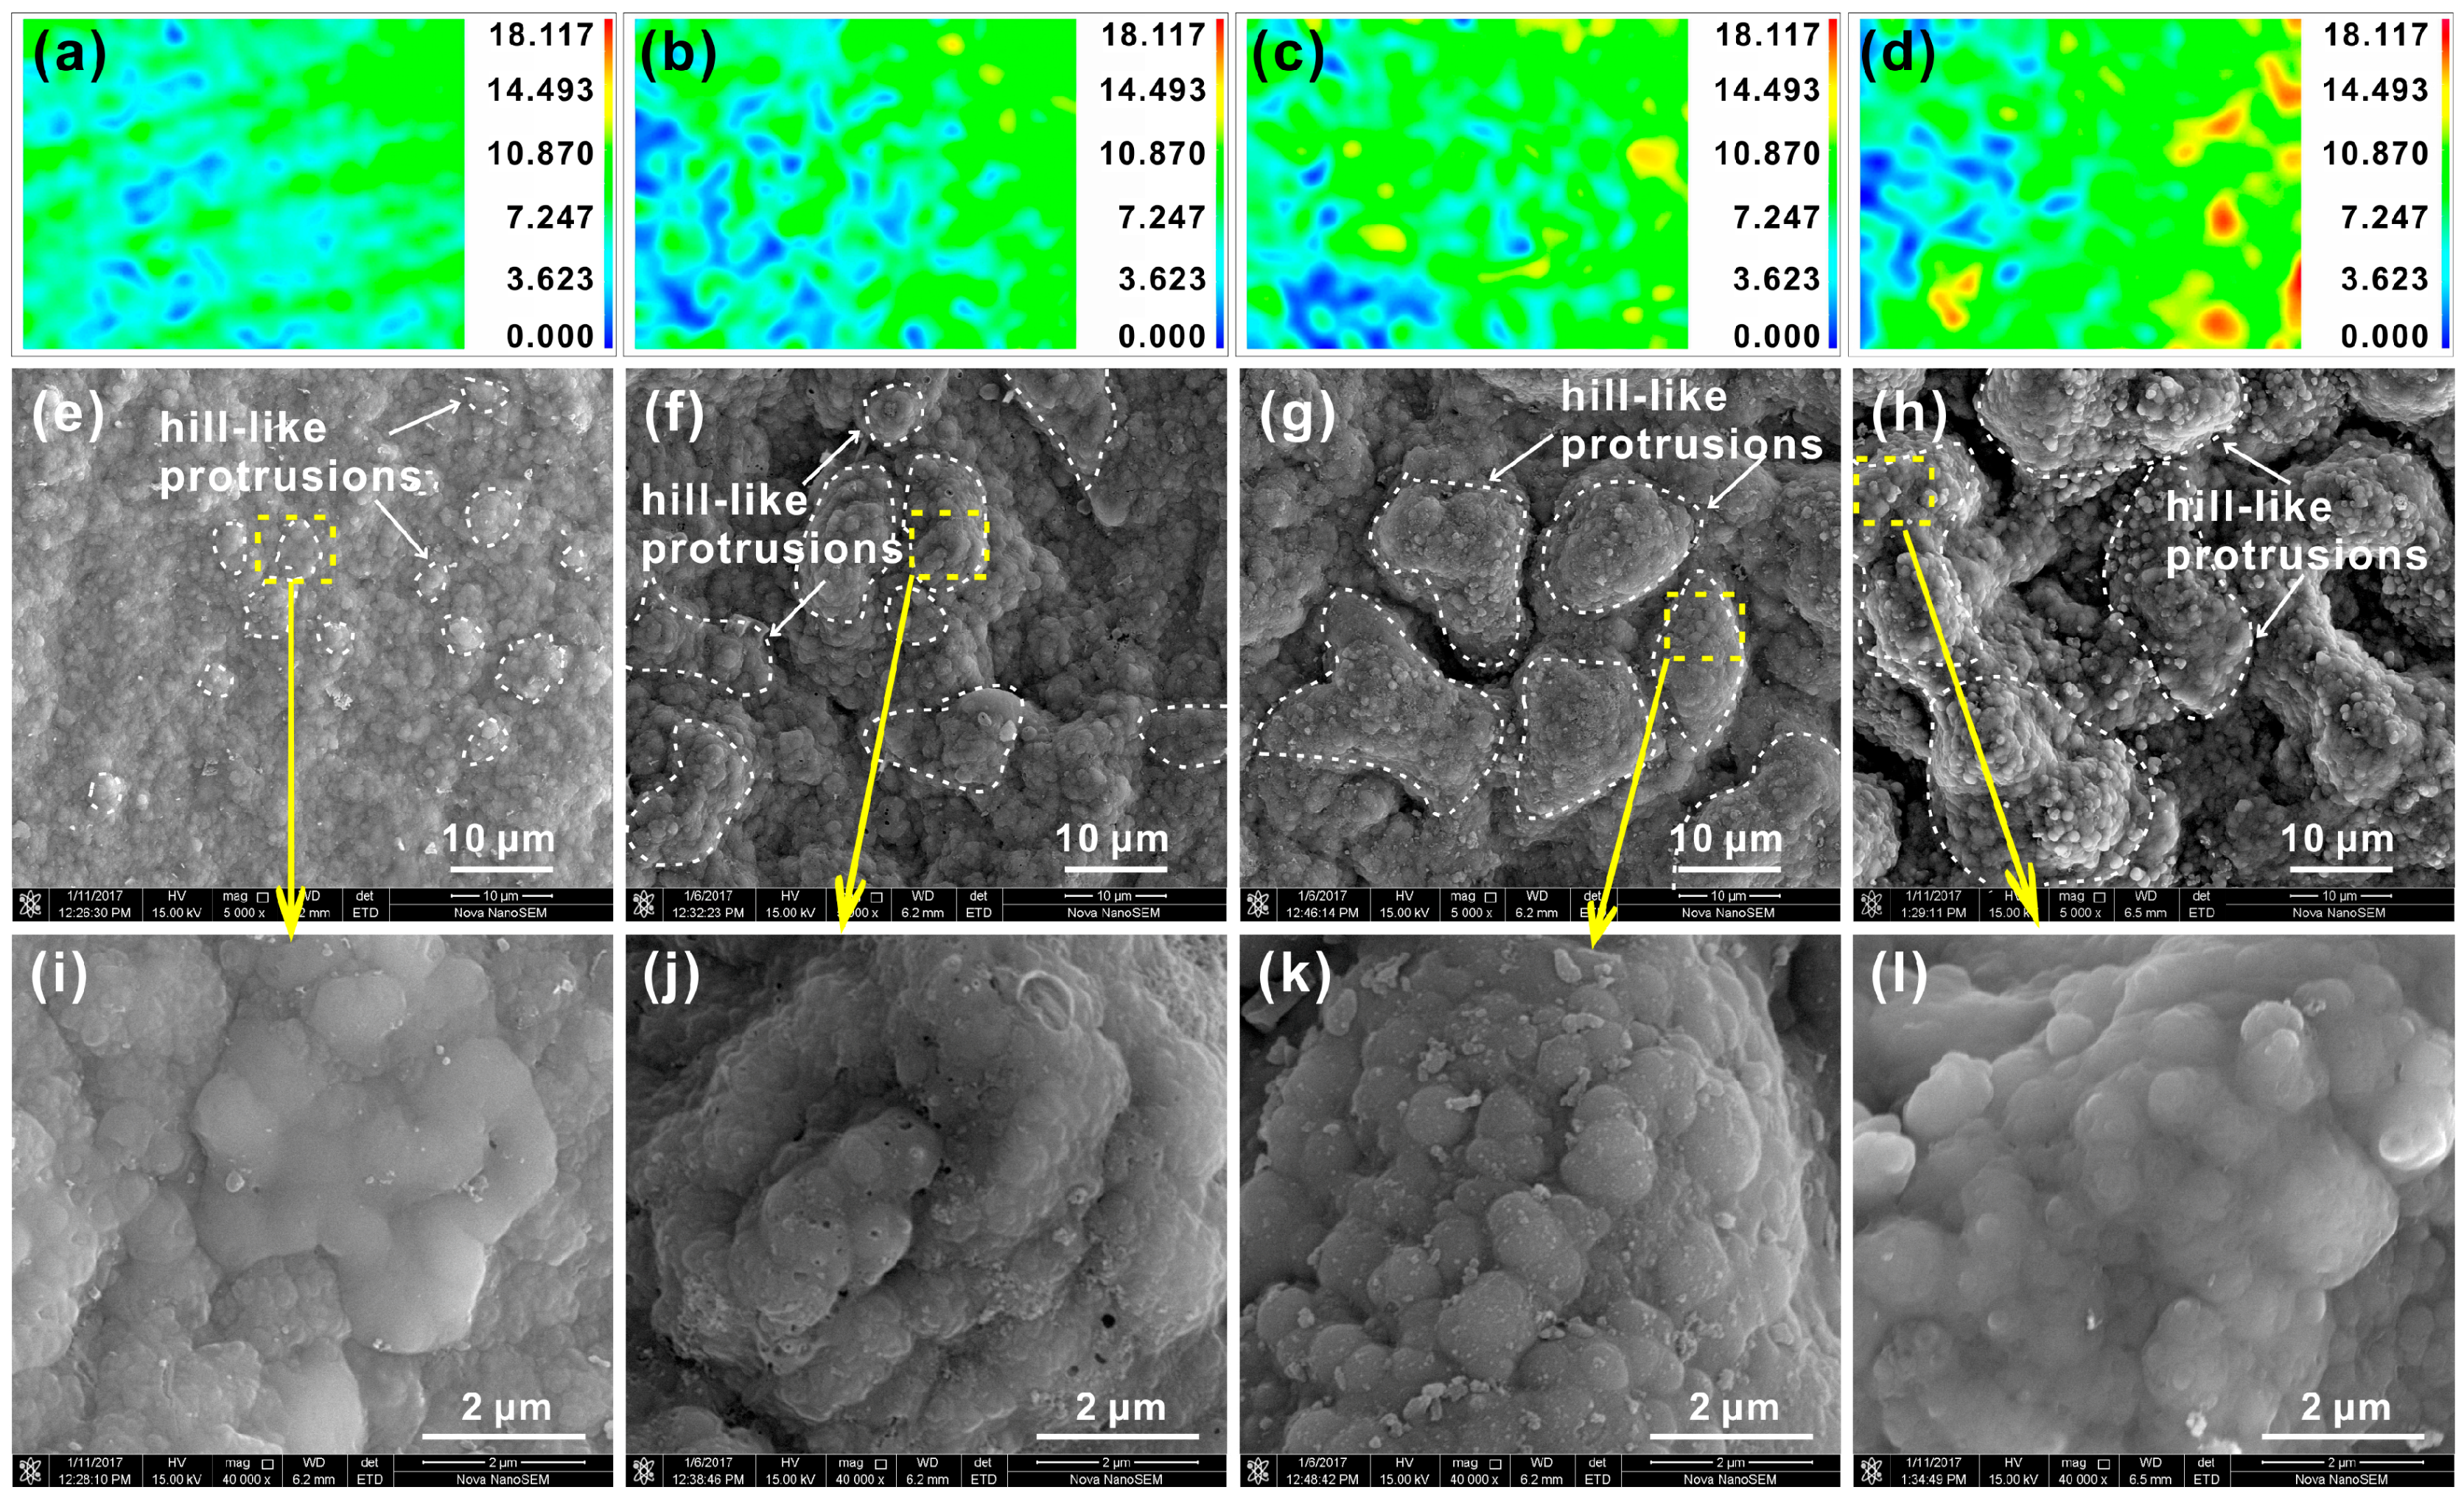
3.2. Surface Morphology and Chemical Composition of PEO Coating
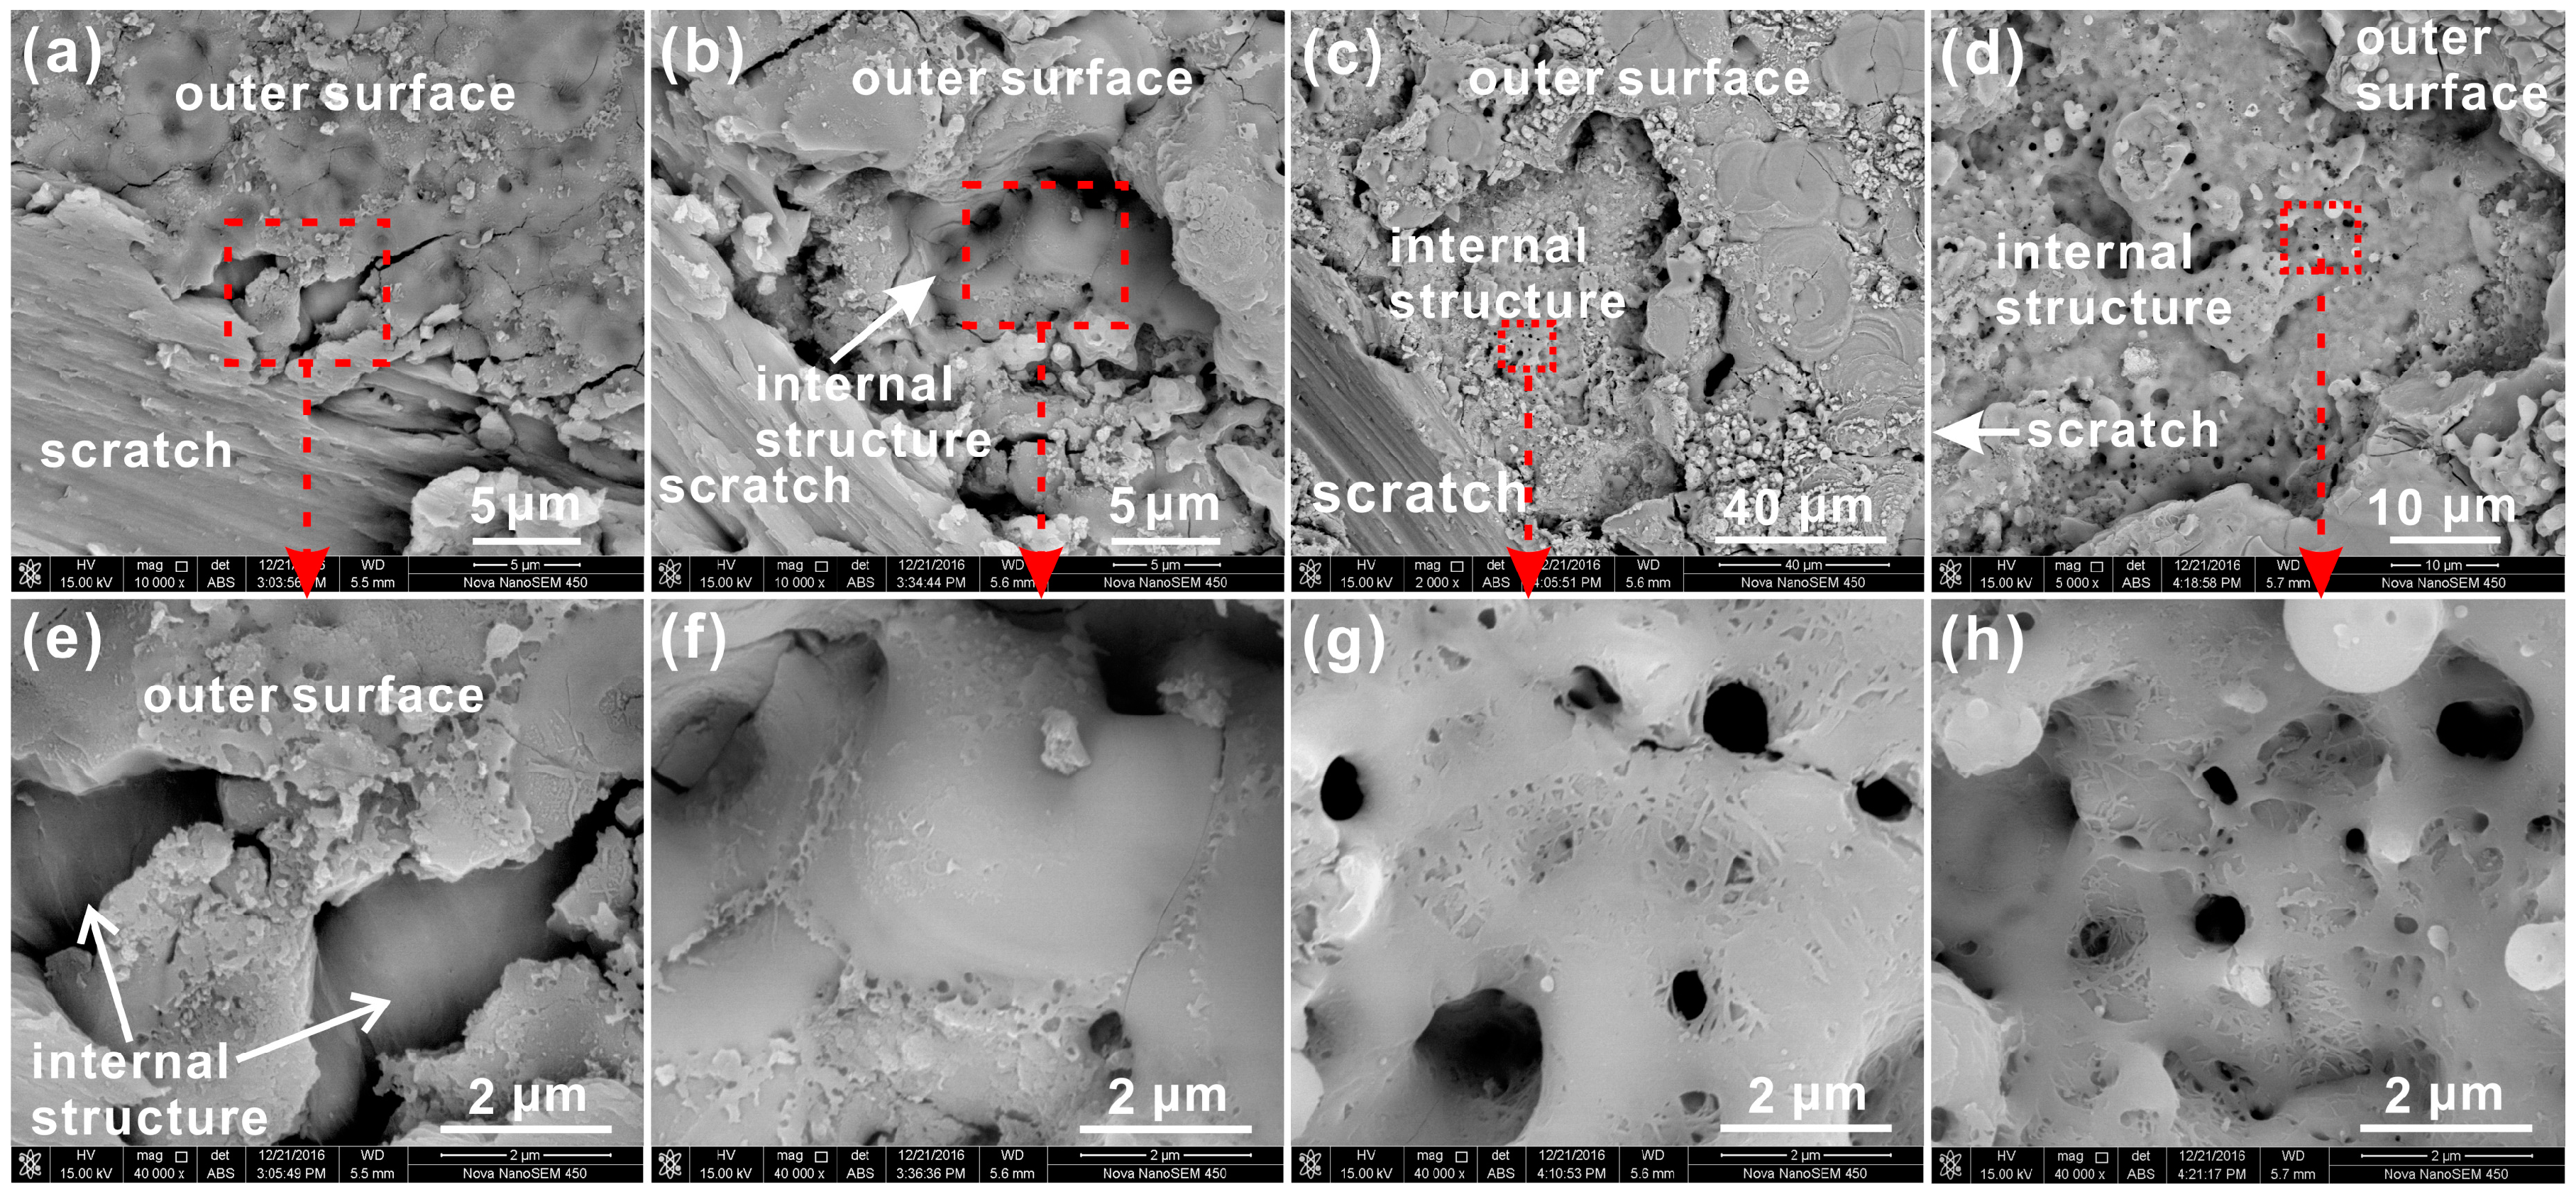
3.3. Internal Structure of PEO Coating
3.4. Aluminum/Coating Interface Morphology of PEO Coating
4. Discussion
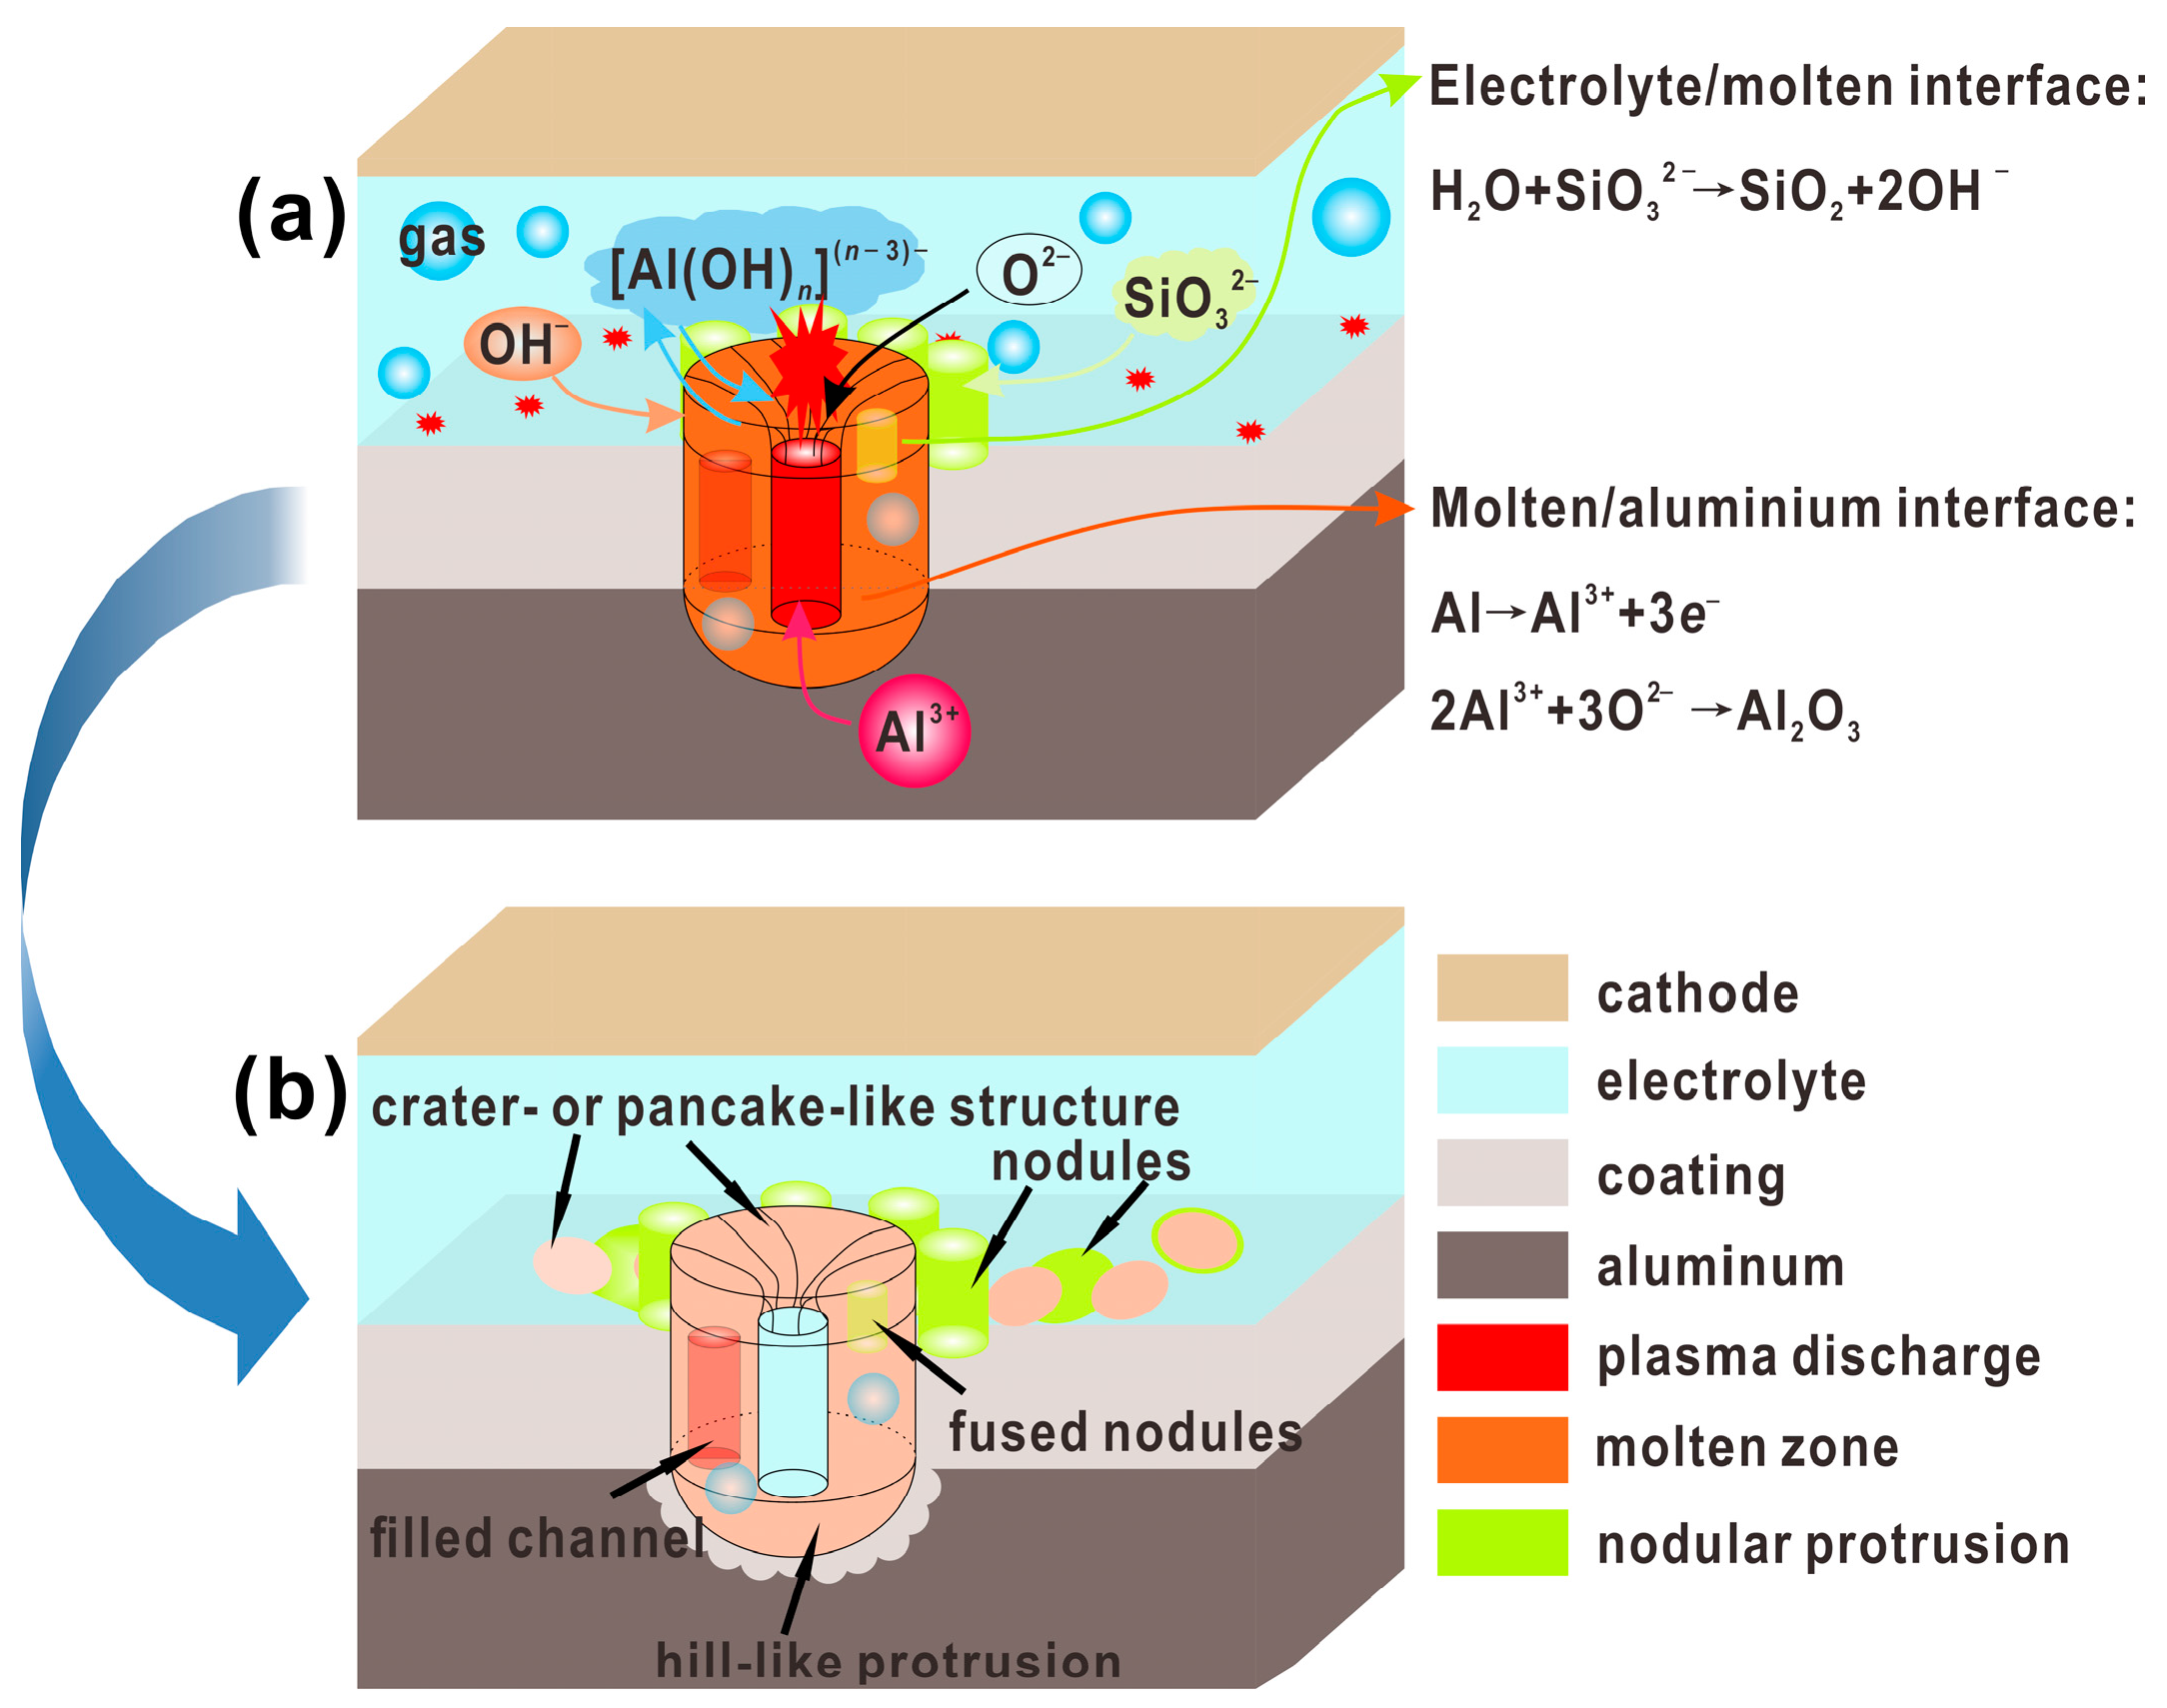
4.1. The Formation Process for 3D Structures of PEO Coating
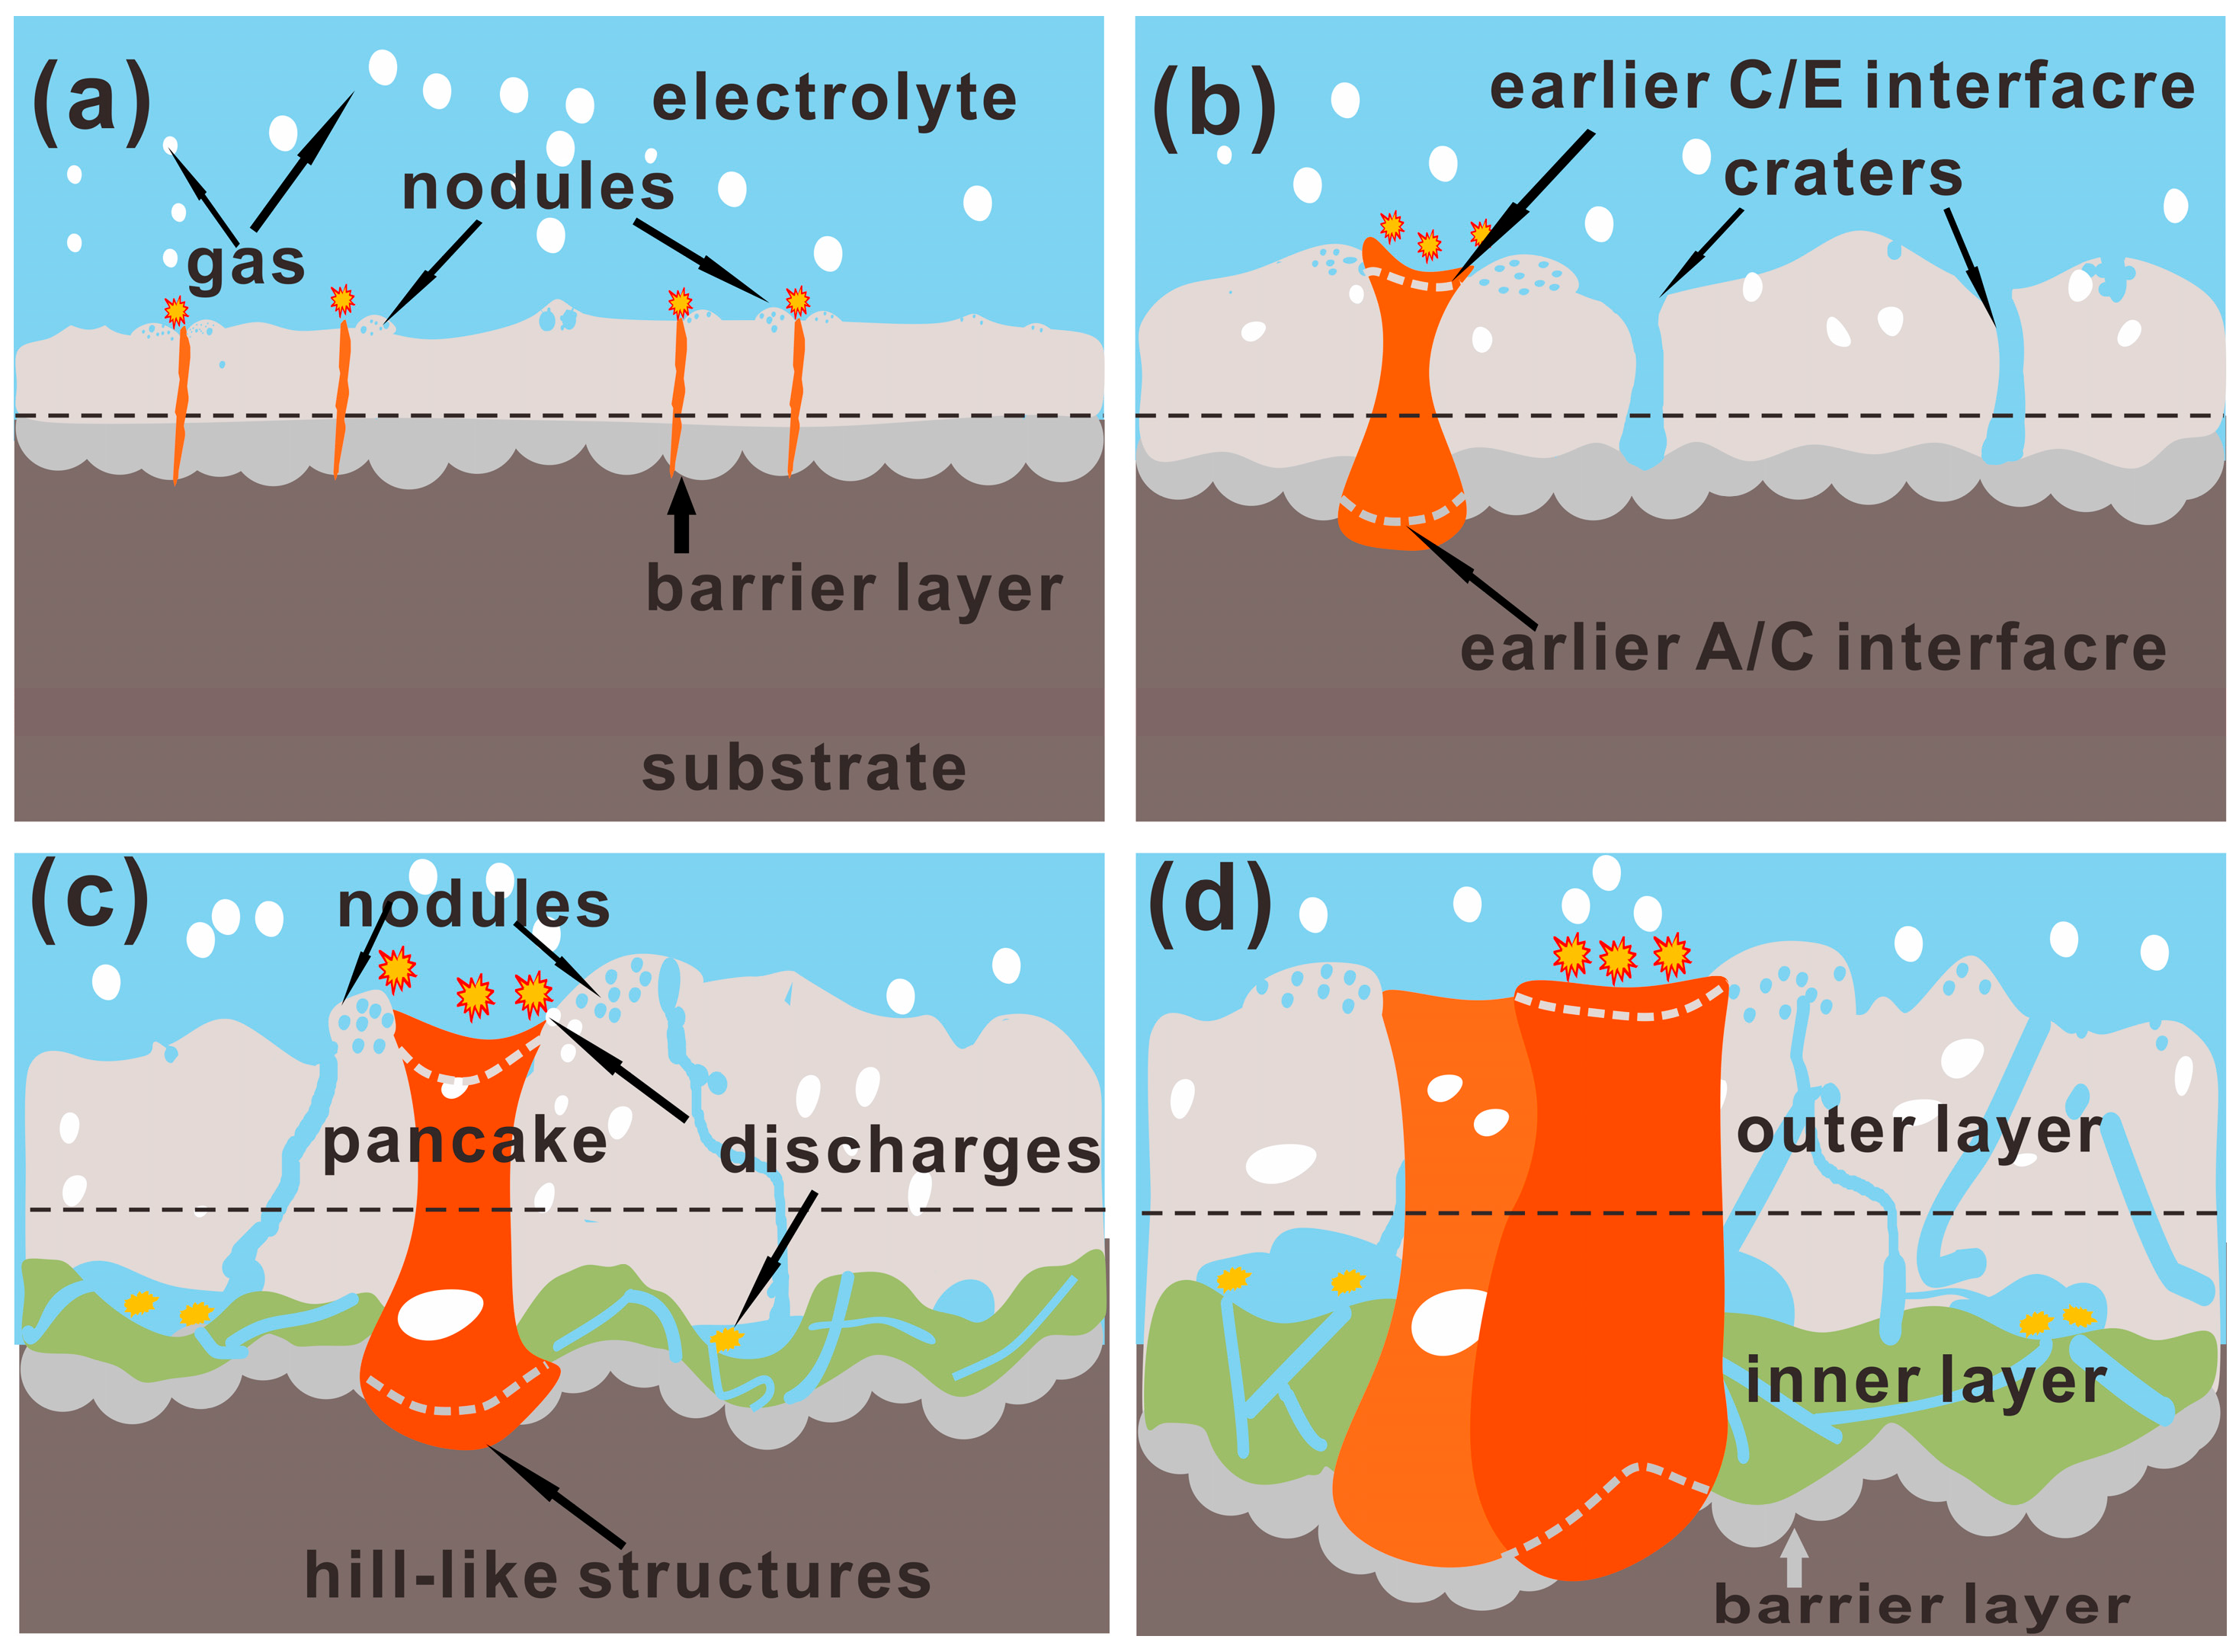
4.2. Growth Model of PEO Coating
5. Conclusions
Supplementary Materials
Acknowledgments
Author Contributions
Conflicts of Interest
References
- Hussein, R.O.; Northwood, D.O.; Nie, X. Coating growth behavior during the plasma electrolytic oxidation process. J. Vac. Sci. Technol. A 2010, 28, 766–773. [Google Scholar] [CrossRef]
- Sharifi, H.; Aliofkhazraei, M.; Darband, G.; Rouhaghdam, A.S. Characterization of PEO nanocomposite coatings on titanium formed in electrolyte containing atenolol. Surf. Coat. Technol. 2016, 304, 438–449. [Google Scholar] [CrossRef]
- Wang, S.; Zhao, Q.; Liu, D.; Du, N. Microstructure and elevated temperature tribological behavior of TiO2/Al2O3 composite ceramic coating formed by microarc oxidation of Ti6Al4V alloy. Surf. Coat. Technol. 2015, 272, 343–349. [Google Scholar] [CrossRef]
- Gowtham, S.; Hariprasad, S.; Arunnellaiappan, T.; Rameshbabu, N. An investigation on ZrO2 nano-particle incorporation, surface properties and electrochemical corrosion behaviour of PEO coating formed on Cp-Ti. Surf. Coat. Technol. 2017, 313, 263–273. [Google Scholar]
- Yang, J.; Lu, X.; Blawert, C.; Di, S.; Zheludkevich, M.L. Microstructure and corrosion behavior of Ca/P coatings prepared on magnesium by plasma electrolytic oxidation. Surf. Coat. Technol. 2017, 319, 359–369. [Google Scholar] [CrossRef]
- Zhang, X.; Aliasghari, S.; Němcová, A.; Burnett, T.; Kuběna, I.; Šmíd, M.; Thompson, G.; Skeldon, P.; Withers, P. X-ray computed tomographic investigation of the porosity and morphology of plasma electrolytic oxidation coatings. ACS Appl. Mater. Interfaces 2016, 8, 8801–8810. [Google Scholar] [CrossRef] [PubMed]
- Li, Q.; Liang, J.; Liu, B.; Peng, Z.; Wang, Q. Effects of cathodic voltages on structure and wear resistance of plasma electrolytic oxidation coatings formed on aluminium alloy. Appl. Surf. Sci. 2014, 297, 176–181. [Google Scholar] [CrossRef]
- Matykina, E.; Arrabal, R.; Skeldon, P.; Thompson, G.E. Incorporation of zirconia nanoparticles into coatings formed on aluminium by AC plasma electrolytic oxidation. J. Appl. Electrochem. 2008, 38, 1375–1383. [Google Scholar] [CrossRef]
- Tillous, K.; Toll-Duchanoy, T.; Bauer-Grosse, E.; Hericher, L.; Geandier, G. Microstructure and phase composition of microarc oxidation surface layers formed on aluminium and its alloys 2214-T6 and 7050-T74. Surf. Coat. Technol. 2009, 203, 2969–2973. [Google Scholar] [CrossRef]
- Curran, J.A.; Clyne, T.W. Porosity in plasma electrolytic oxide coatings. Acta Mater. 2006, 54, 1985–1993. [Google Scholar] [CrossRef]
- Curran, J.A.; Clyne, T.W. Thermo-physical properties of plasma electrolytic oxide coatings on aluminium. Surf. Coat. Technol. 2005, 199, 168–176. [Google Scholar] [CrossRef]
- Kasalica, B.; Radić-Perić, J.; Perić, M.; Petković-Benazzouz, M.; Belča, I.; Sarvan, M. Themechanism of evolution ofmicrodischarges at the beginning of the PEO process on aluminum. Surf. Coat. Technol. 2016, 298, 24–32. [Google Scholar] [CrossRef]
- Liu, C.; He, D.; Yan, Q.; Huang, Z.; Liu, P.; Li, D.; Jiang, G.; Ma, H.; Nash, P.; Shen, D. An investigation of the coating/substrate interface of plasma electrolytic oxidation coated aluminum. Surf. Coat. Technol. 2015, 280, 86–91. [Google Scholar] [CrossRef]
- Liu, C.; Liu, P.; Huang, Z.; Yan, Q.; Guo, R.; Li, D.; Jiang, G.; Shen, D. The correlation between the coating structure and the corrosion behavior of the plasma electrolytic oxidation coating on aluminum. Surf. Coat. Technol. 2016, 286, 223–230. [Google Scholar] [CrossRef]
- Tillous, E.K.; Toll-Duchanoy, T.; Bauer-Grosse, E. Microstructure and 3D microtomographic characterization of porosity of MAO surface layers formed on aluminium and 2214-T6 alloy. Surf. Coat. Technol. 2009, 203, 1850–1855. [Google Scholar] [CrossRef]
- Moon, S.; Arrabal, R.; Matykina, E. 3-Dimensional structures of open-pores in PEO films on AZ31 Mg alloy. Mater. Lett. 2015, 161, 439–441. [Google Scholar] [CrossRef]
- Yerokhin, A.L.; Lyubimov, V.V.; Ashitkov, R.V. Phase formation in ceramic coatings during plasma electrolytic oxidation of aluminium alloys. Ceram. Int. 1998, 24, 1–6. [Google Scholar] [CrossRef]
- Xue, W.; Deng, Z.; Chen, R.; Zhang, T. Growth regularity of ceramic coatings formed by microarc oxidation on Al–Cu–Mg alloy. Thin Solid Films 2000, 372, 114–117. [Google Scholar] [CrossRef]
- Liu, X.; Li, G.; Xia, Y. Investigation of the discharge mechanism of plasma electrolytic oxidation using Ti tracer. Surf. Coat. Technol. 2012, 206, 4462–4465. [Google Scholar] [CrossRef][Green Version]
- Sundararajan, G.; Krishna, L.R. Mechanisms underlying the formation of thick alumina coatings through the MAO coating technology. Surf. Coat. Technol. 2003, 167, 269–277. [Google Scholar] [CrossRef]
- Li, J.; Cai, H.; Xue, X.; Jiang, B. The outward–inward growth behavior of microarc oxidation coatings in phosphate and silicate solution. Mater. Lett. 2010, 64, 2102–2104. [Google Scholar] [CrossRef]
- Matykina, E.; Arrabal, R.; Scurr, D.J.; Baron, A.; Skeldon, P.; Thompson, G.E. Investigation of the mechanism of plasma electrolytic oxidation of aluminium using 18O tracer. Corros. Sci. 2010, 52, 1070–1076. [Google Scholar] [CrossRef]
- Gu, W.; Lv, G.; Chen, H.; Chen, G.; Feng, W.; Yang, S. Characterisation of ceramic coatings produced by plasma electrolytic oxidation of aluminum alloy. Mater. Sci. Eng. A 2007, 447, 158–162. [Google Scholar] [CrossRef]
- Li, W.; Qian, Z.; Liu, X.; Zhu, L.; Liu, H. Investigation of micro-arc oxidation coating growth patterns of aluminum alloy by two-step oxidation method. Appl. Surf. Sci. 2015, 356, 581–586. [Google Scholar] [CrossRef]
- Zhu, L.; Guo, Z.; Zhang, Y.; Li, Z.; Sui, M. A mechanism for the growth of a plasma electrolytic oxide coating on Al. Electrochim. Acta 2016, 208, 296–303. [Google Scholar] [CrossRef]
- Li, Q.; Yang, W.; Liu, C.; Wang, D.; Liang, J. Correlations between the growth mechanism and properties of micro-arc oxidation coatings on titanium alloy: Effects of electrolytes. Surf. Coat. Technol. 2017, 316, 162–170. [Google Scholar] [CrossRef]
- Monfort, F.; Berkani, A.; Matykina, E.; Skeldon, P.; Thompson, G.E.; Habazaki, H.; Shimizu, K. A tracer study of oxide growth during spark anodizing of aluminum. J. Electrochem. Soc. 2005, 152, C382–C387. [Google Scholar] [CrossRef]
- Cheng, Y.; Wang, T.; Li, S.; Cheng, Y.; Cao, J.; Xie, H. The effects of anion deposition and negative pulse on the behaviours of plasma electrolytic oxidation (PEO)—A systematic study of the PEO of a Zirlo alloy in aluminate electrolytes. Electrochim. Acta 2017, 225, 47–68. [Google Scholar] [CrossRef]
- Li, Q.; Liu, C.; Yang, W.; Liang, J. Growth mechanism and adhesion of PEO coatings on 2024Al alloy. Surf. Eng. 2017, 33, 760–766. [Google Scholar] [CrossRef]
- Hussein, R.O.; Nie, X.; Northwood, D.O.; Yerokhin, A.; Matthews, A. Spectroscopic study of electrolytic plasma and discharging behaviour during the plasma electrolytic oxidation (PEO) process. J. Phys. D-Appl. Phys. 2010, 43, 105203–105215. [Google Scholar] [CrossRef]
- Hussein, R.O.; Nie, X.; Northwood, D.O. An investigation of ceramic coating growth mechanisms in plasma electrolytic oxidation (PEO) processing. Electrochim. Acta 2013, 112, 111–119. [Google Scholar] [CrossRef]
- Cheng, Y.L.; Xue, Z.G.; Wang, Q.; Wu, X.Q.; Matykina, E.; Skeldon, P.; Thompson, G.E. New findings on properties of plasma electrolytic oxidation coatings from study of an Al–Cu–Li alloy. Electrochim. Acta 2013, 107, 358–378. [Google Scholar] [CrossRef]
- Dunleavy, C.S.; Golosnoy, I.O.; Curran, J.A.; Clyne, T.W. Characterisation of discharge events during plasma electrolytic oxidation. Surf. Coat. Technol. 2009, 203, 3410–3419. [Google Scholar] [CrossRef]
- Lee, S.; Kwon, S.; Lee, J.-C.; Lee, S.-W. Thermophysical properties of aluminum 1060 fabricated by equal channel angular pressing. Int. J. Thermophys. 2012, 33, 540–551. [Google Scholar] [CrossRef][Green Version]
- Yerokhin, A.L.; Snizhko, L.O.; Gurevina, N.L.; Leyland, A.; Pilkington, A.; Matthews, A. Discharge characterization in plasma electrolytic oxidation of aluminium. J. Phys. D-Appl. Phys. 2003, 36, 2110–2120. [Google Scholar] [CrossRef]
- Sobrinho, P.H.; Savguira, Y.; Ni, Q.; Thorpe, S.J. Statistical analysis of the voltage-time response produced during PEO coating of AZ31B magnesium alloy. Surf. Coat. Technol. 2017, 315, 530–545. [Google Scholar] [CrossRef]
- Nominé, A.; Troughton, S.C.; Nominé, A.V.; Henrion, G.; Clyne, T.W. High speed video evidence for localised discharge cascades during plasma electrolytic oxidation. Surf. Coat. Technol. 2015, 269, 125–130. [Google Scholar] [CrossRef]
- Dehnavi, V.; Luan, B.L.; Liu, X.Y.; Shoesmith, D.W.; Rohani, S. Correlation between plasma electrolytic oxidation treatment stages and coating microstructure on aluminum under unipolar pulsed DC mode. Surf. Coat. Technol. 2015, 269, 91–99. [Google Scholar] [CrossRef]
- Snizhko, L.O.; Yerokhin, A.L.; Gurevina, N.L.; Patalakha, V.A.; Matthews, A. Excessive oxygen evolution during plasma electrolytic oxidation of aluminium. Thin Solid Films 2007, 516, 460–464. [Google Scholar] [CrossRef]


| Coating | Location | O | Al | Si | P | Si/Al | P/Al |
|---|---|---|---|---|---|---|---|
| 5 min | Spec. 1 | 55.6 | 43.2 | 1.2 | – | 0.03 | – |
| 15 min | Spec. 2 | 62.6 | 30.9 | 5.4 | 1.1 | 0.17 | 0.04 |
| 45 min | Spec. 3 | 61.8 | 28.9 | 8.5 | ≤1 | 0.30 | ≤0.03 |
| 60 min | Spec. 4 | 62.9 | 29.2 | 7.6 | ≤1 | 0.26 | ≤0.03 |
© 2018 by the authors. Licensee MDPI, Basel, Switzerland. This article is an open access article distributed under the terms and conditions of the Creative Commons Attribution (CC BY) license (http://creativecommons.org/licenses/by/4.0/).
Share and Cite
Liu, X.; Wang, S.; Du, N.; Li, X.; Zhao, Q. Evolution of the Three-Dimensional Structure and Growth Model of Plasma Electrolytic Oxidation Coatings on 1060 Aluminum Alloy. Coatings 2018, 8, 105. https://doi.org/10.3390/coatings8030105
Liu X, Wang S, Du N, Li X, Zhao Q. Evolution of the Three-Dimensional Structure and Growth Model of Plasma Electrolytic Oxidation Coatings on 1060 Aluminum Alloy. Coatings. 2018; 8(3):105. https://doi.org/10.3390/coatings8030105
Chicago/Turabian StyleLiu, Xiaohui, Shuaixing Wang, Nan Du, Xinyi Li, and Qing Zhao. 2018. "Evolution of the Three-Dimensional Structure and Growth Model of Plasma Electrolytic Oxidation Coatings on 1060 Aluminum Alloy" Coatings 8, no. 3: 105. https://doi.org/10.3390/coatings8030105
APA StyleLiu, X., Wang, S., Du, N., Li, X., & Zhao, Q. (2018). Evolution of the Three-Dimensional Structure and Growth Model of Plasma Electrolytic Oxidation Coatings on 1060 Aluminum Alloy. Coatings, 8(3), 105. https://doi.org/10.3390/coatings8030105