New Electrospun Polystyrene/Al2O3 Nanocomposite Superhydrophobic Coatings; Synthesis, Characterization, and Application


 , and
, and
Abstract
:1. Introduction
2. Materials and Methods
Characterization Techniques
3. Results and Discussion
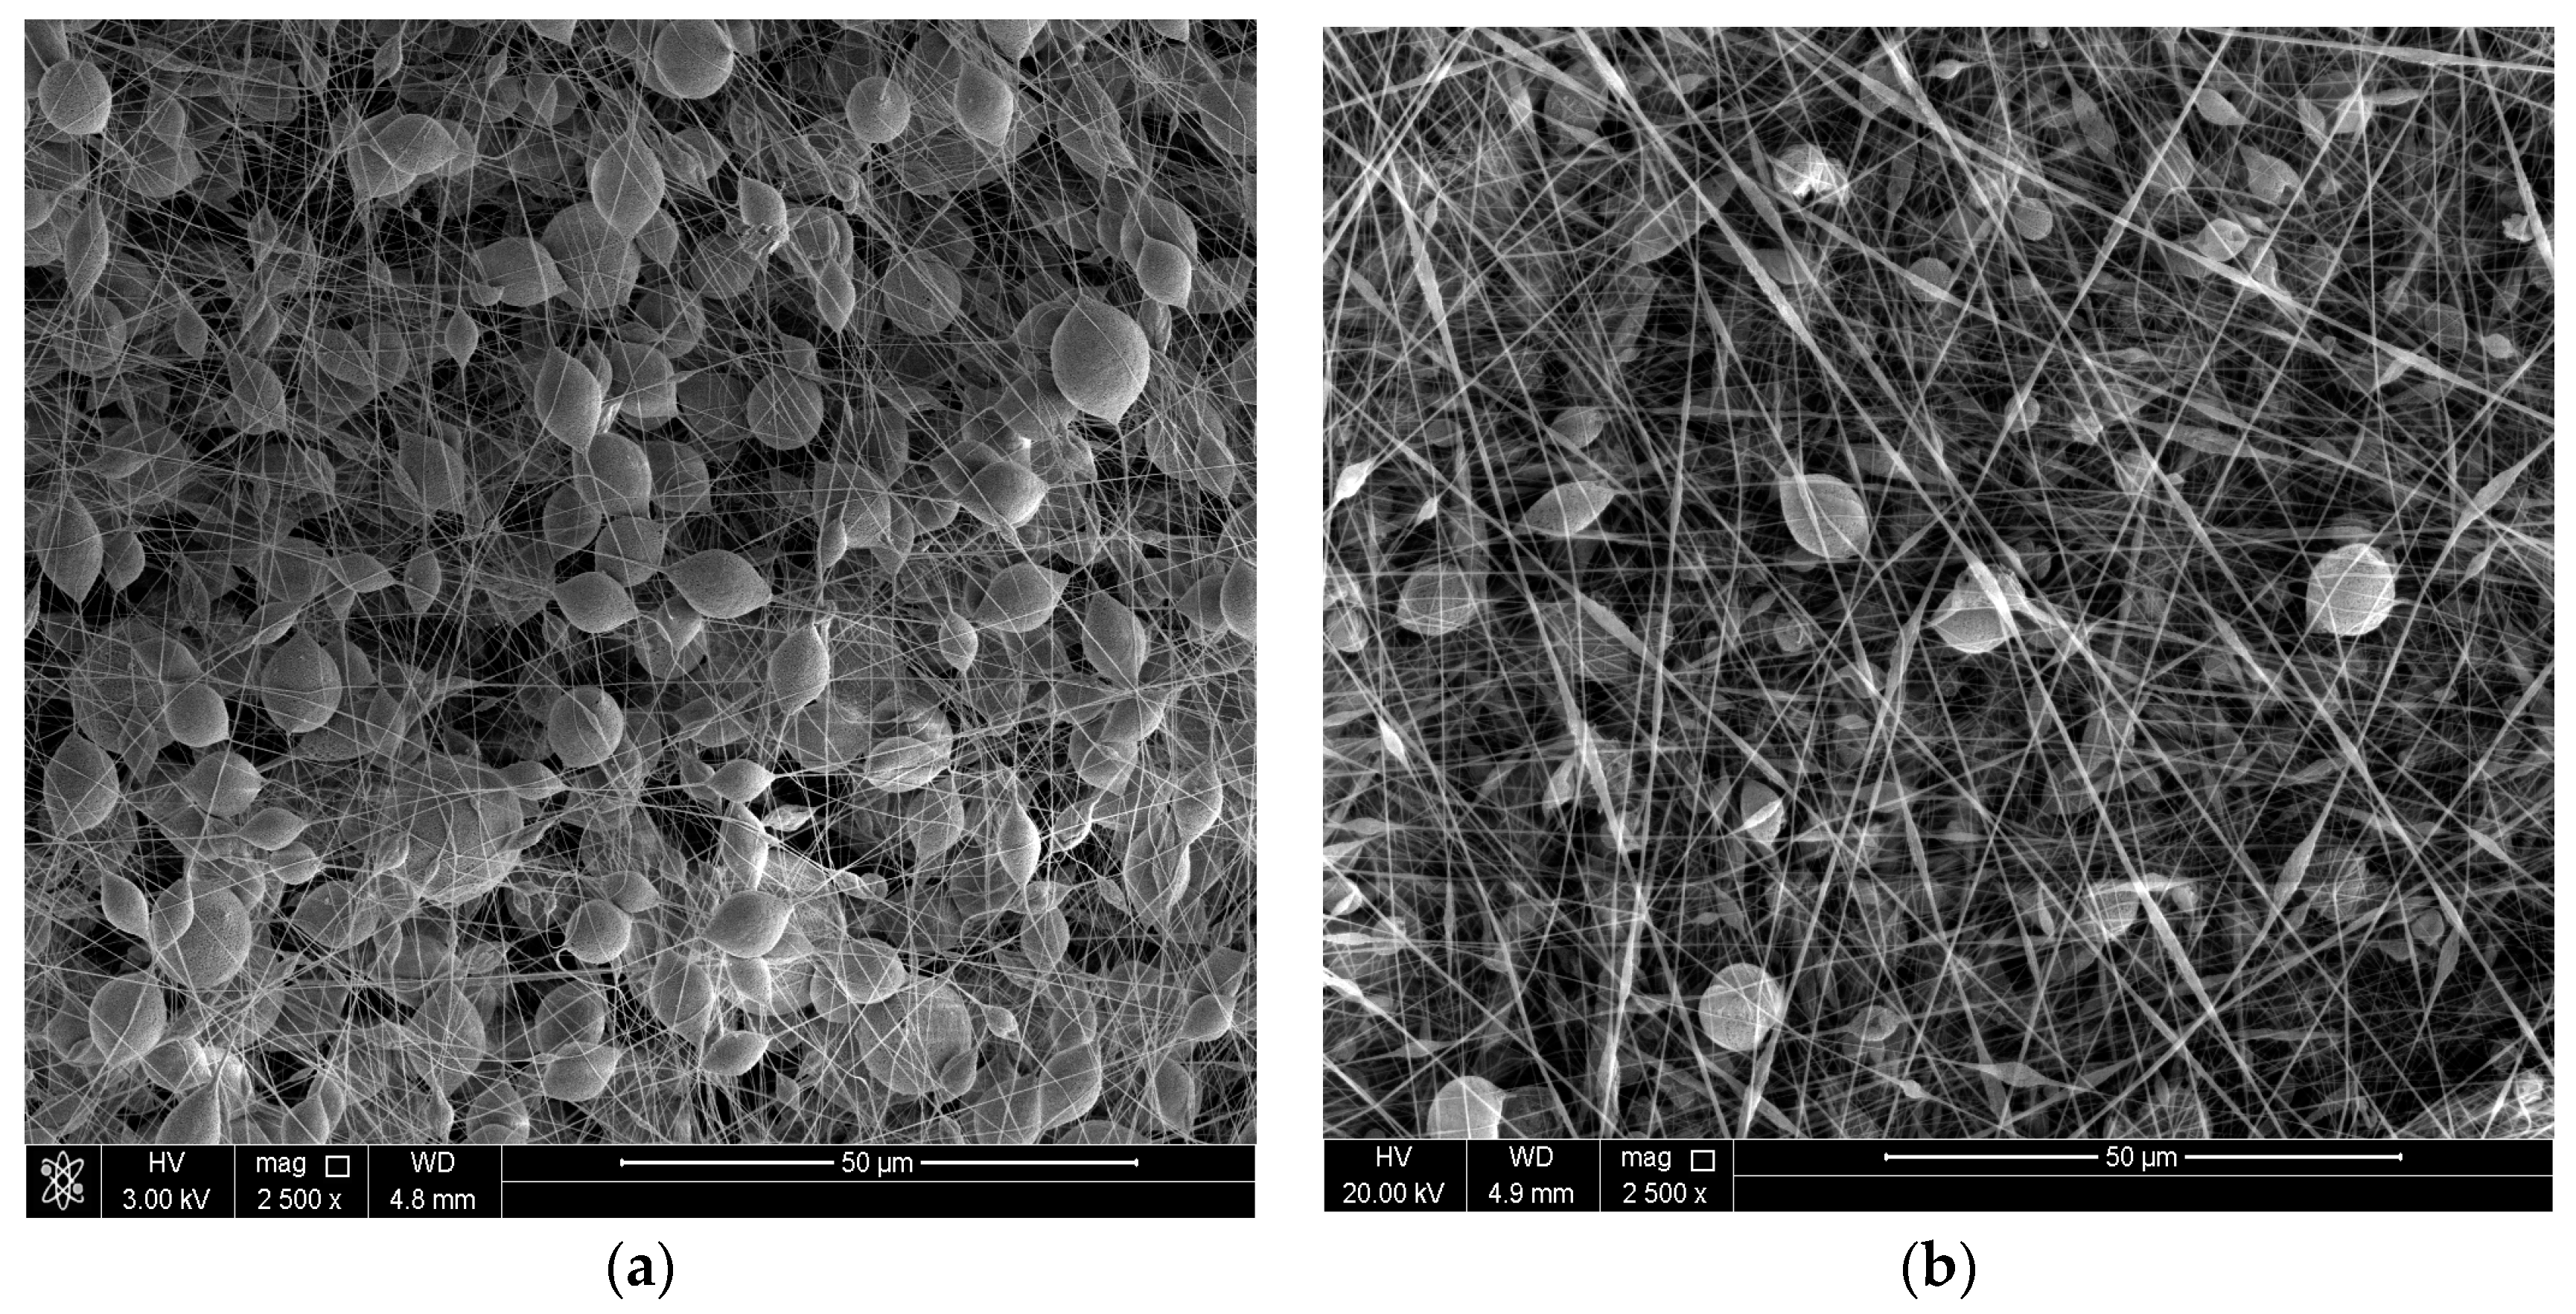
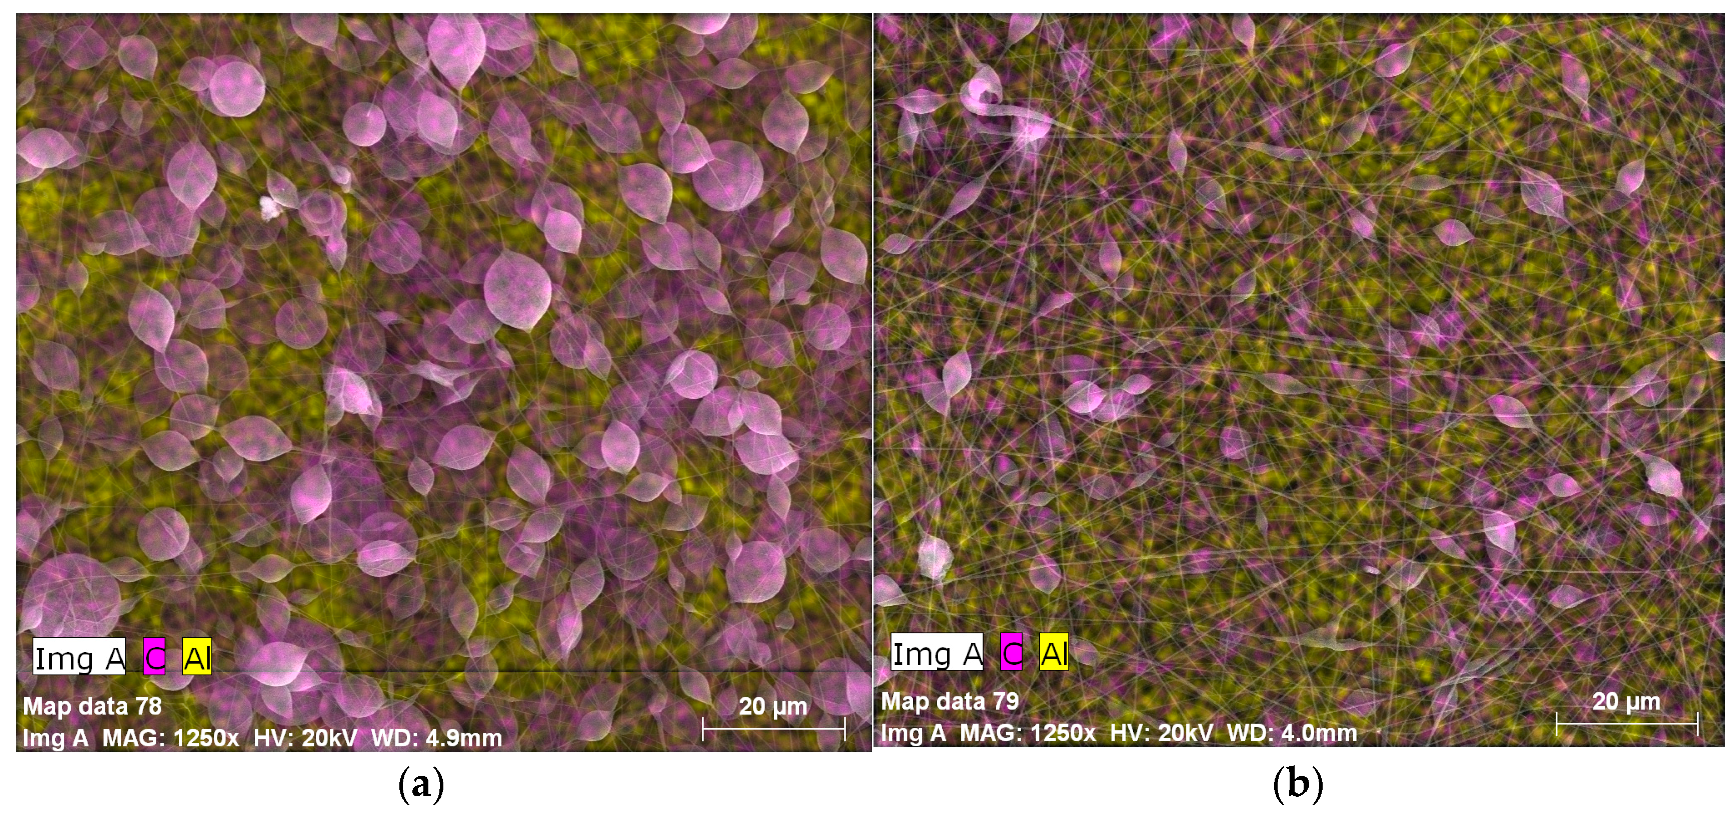
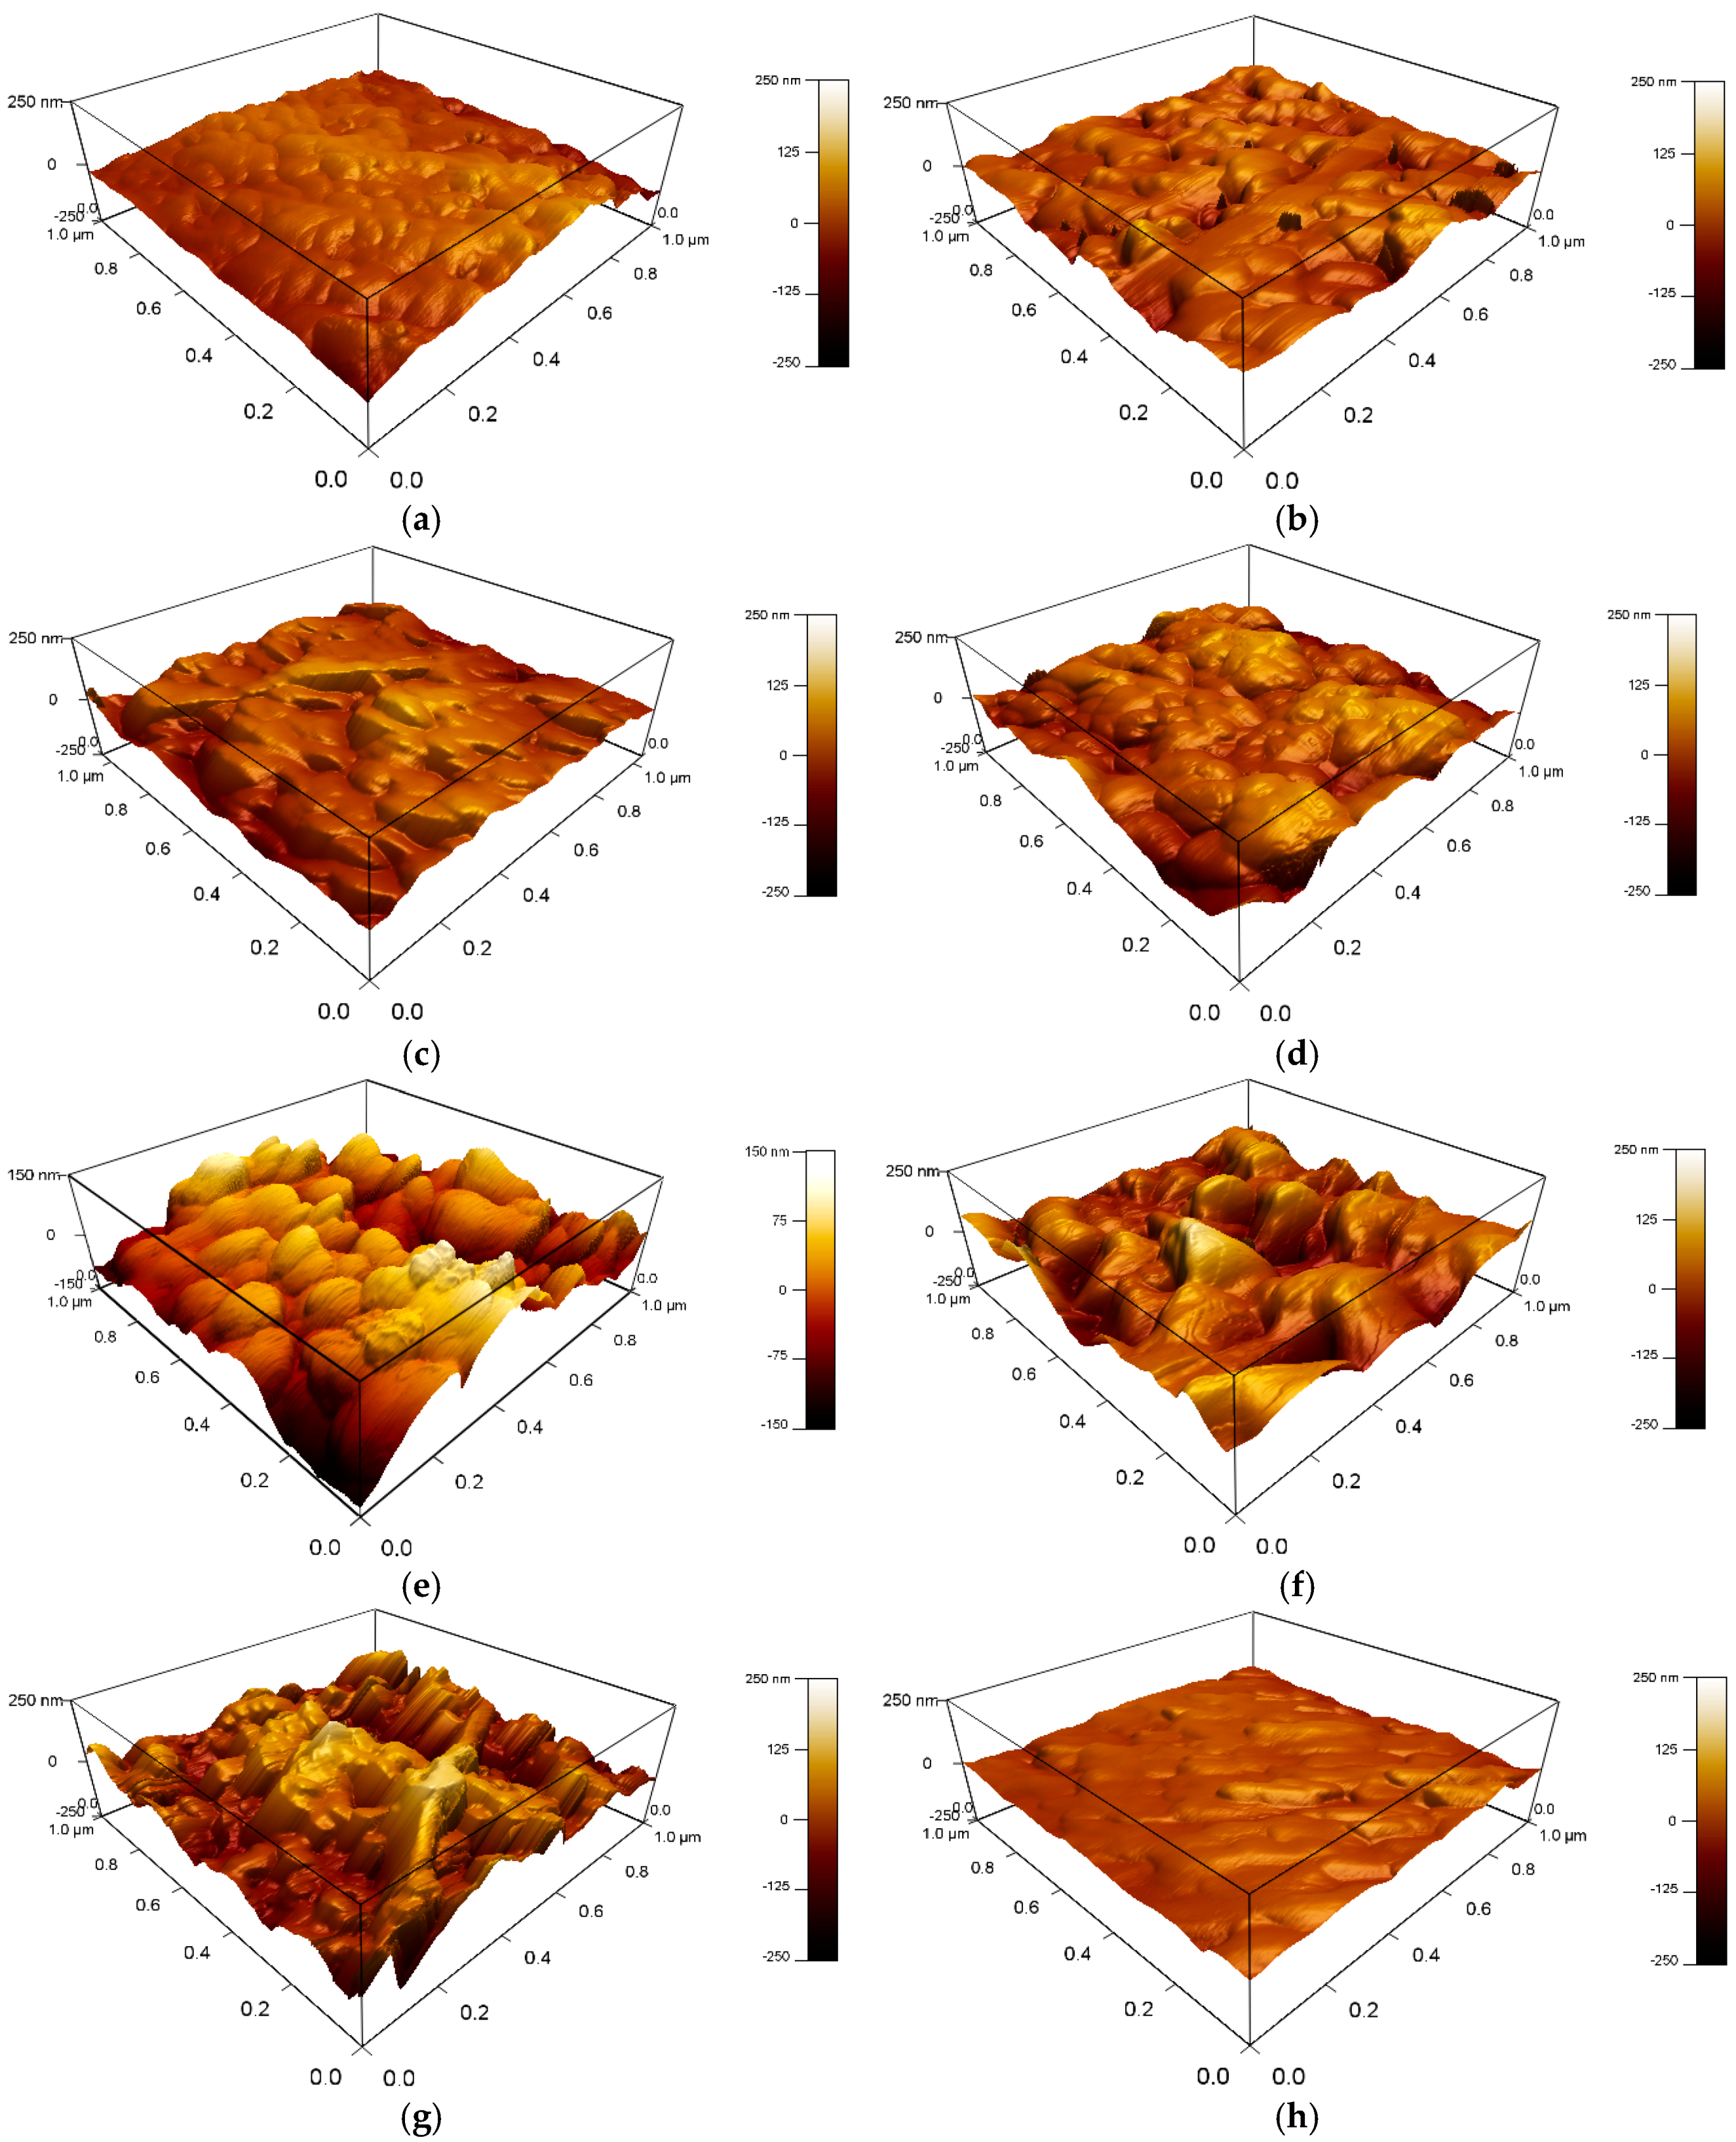
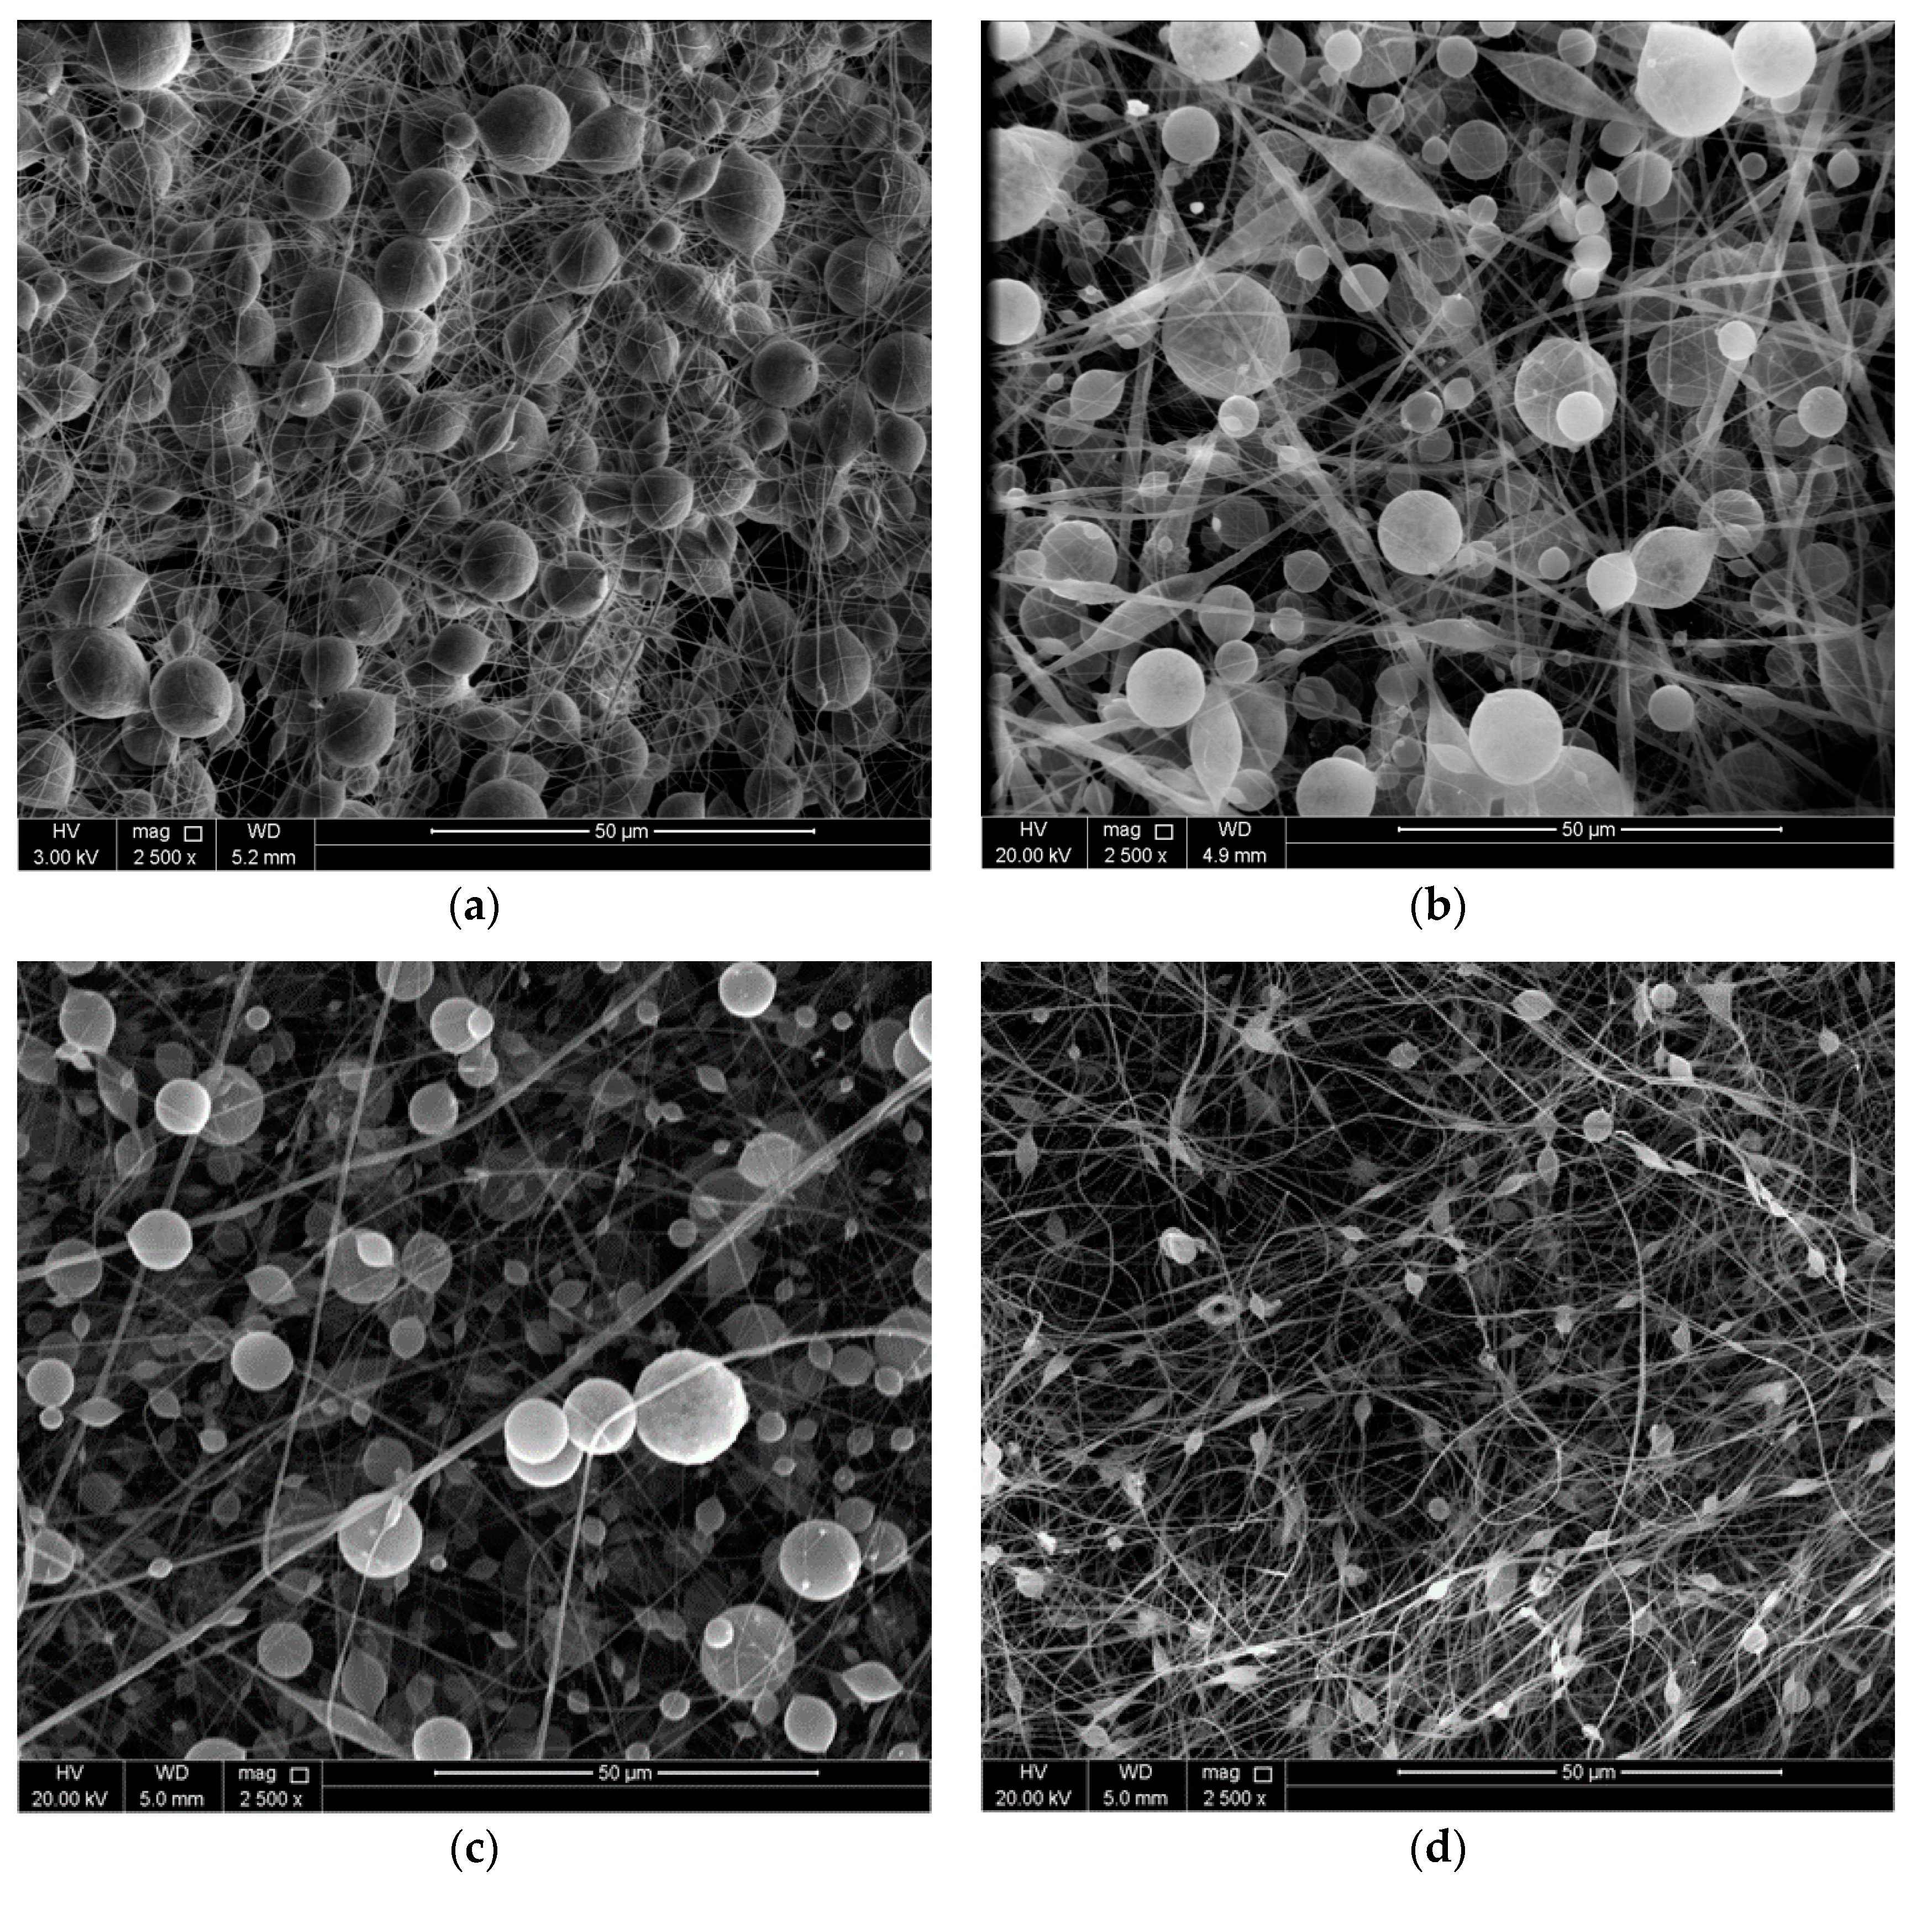
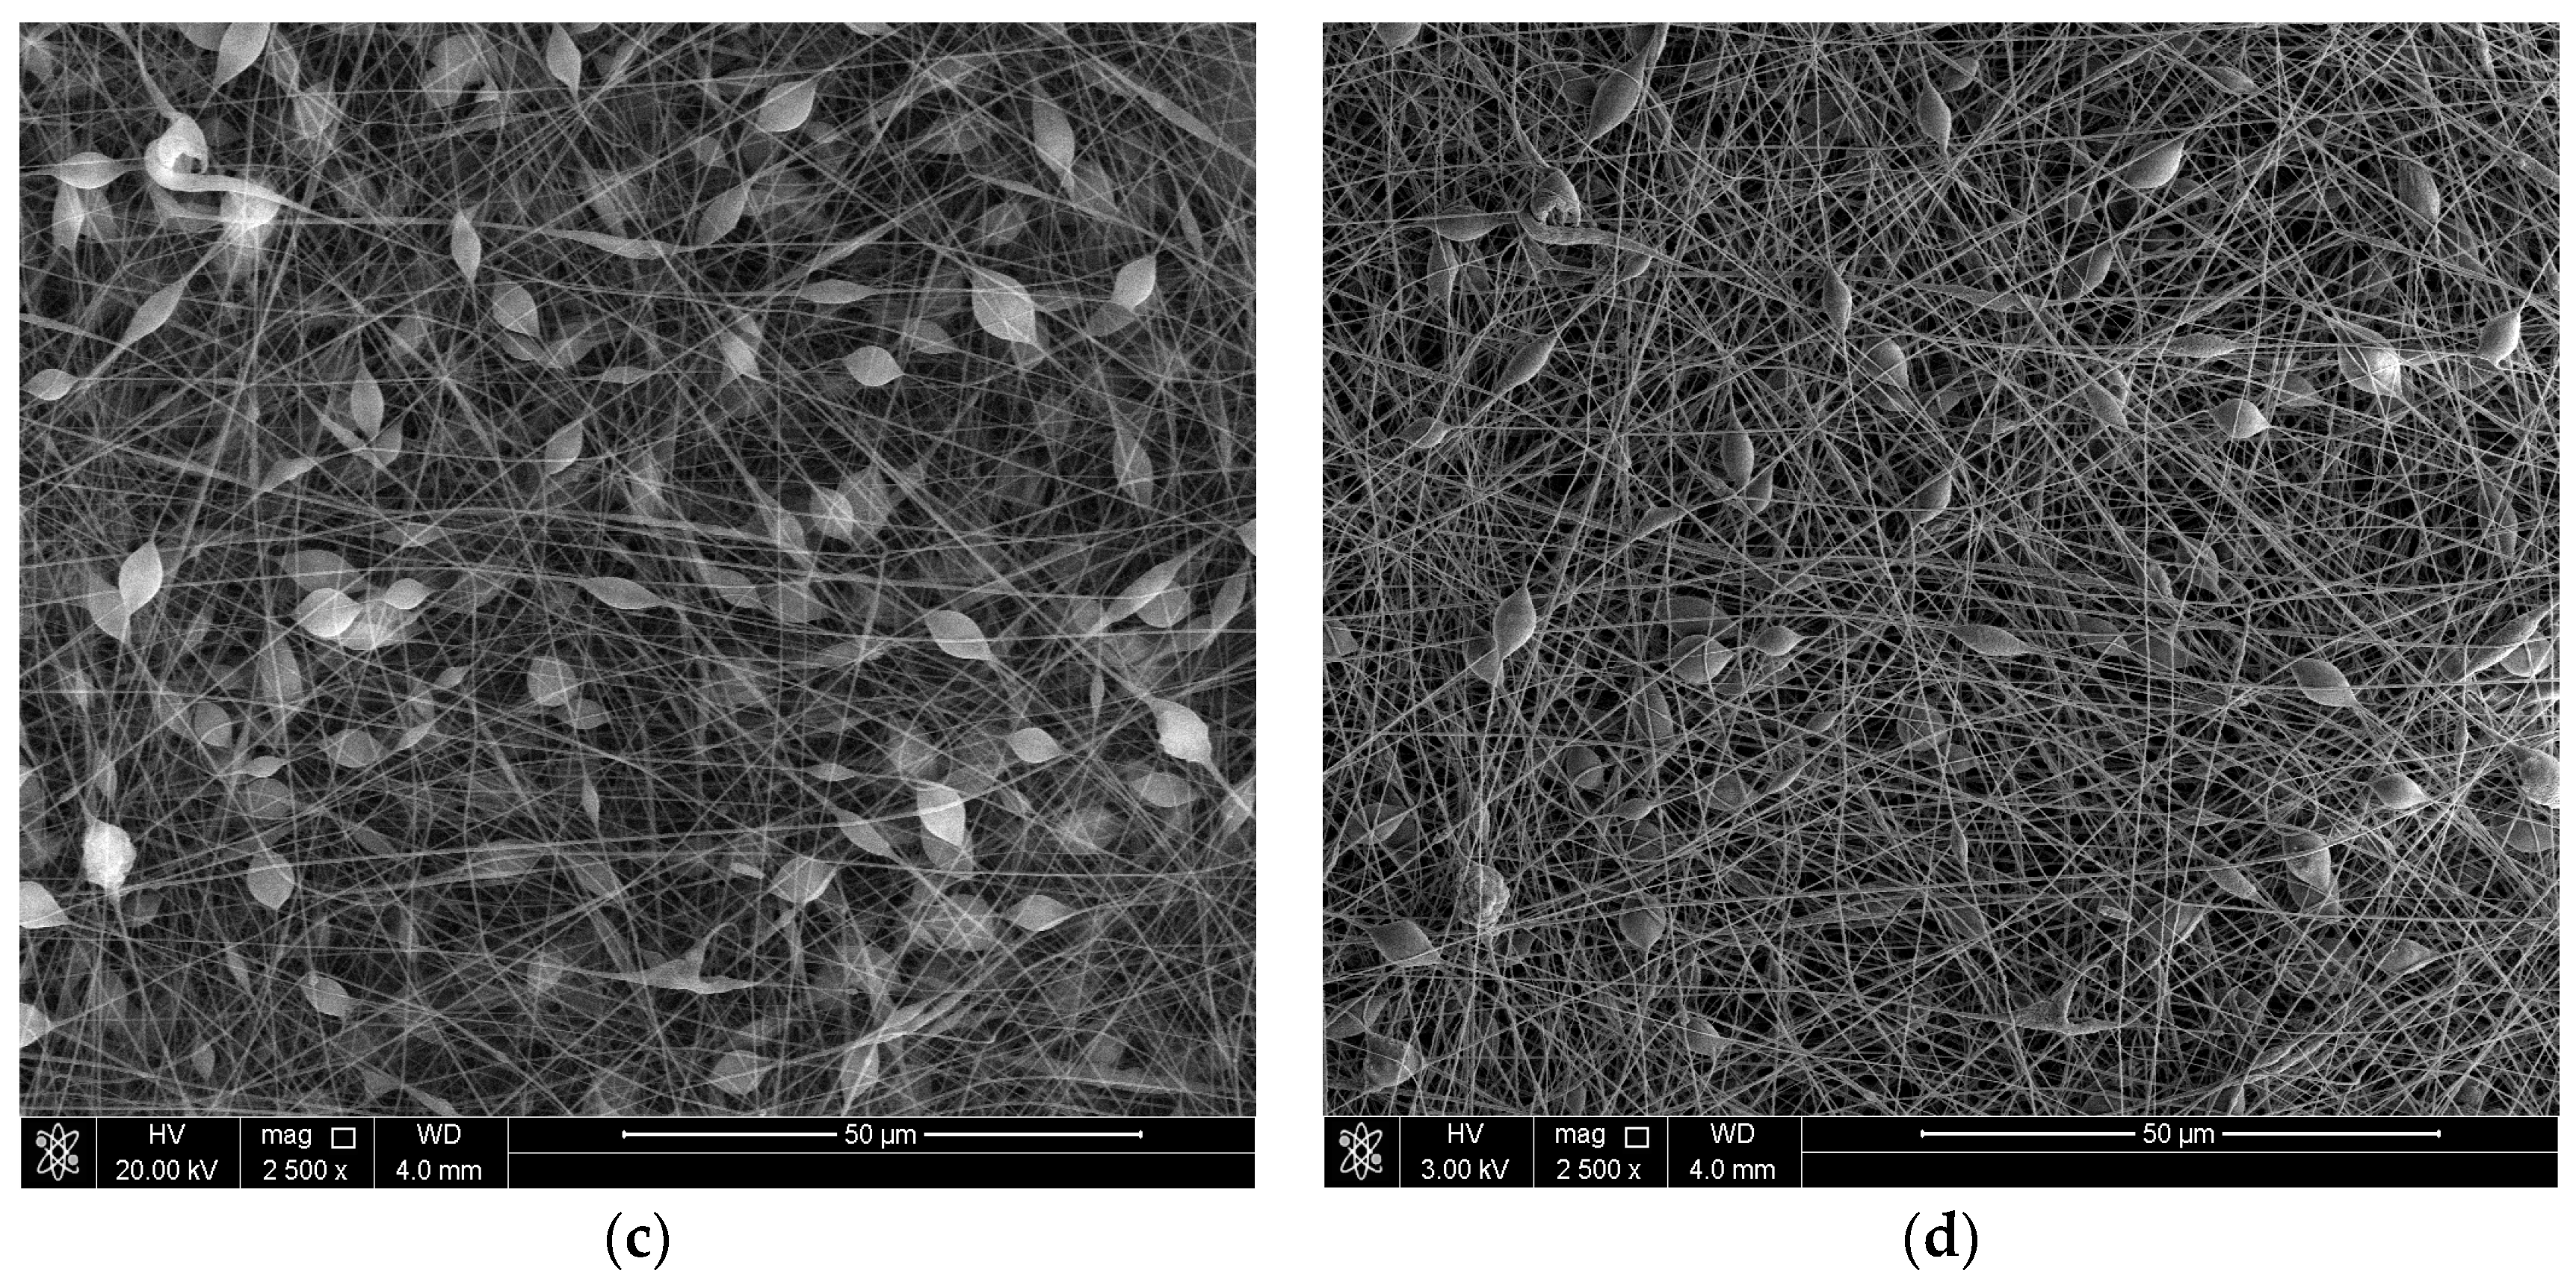
3.1. Surface Morphology of the Coatings
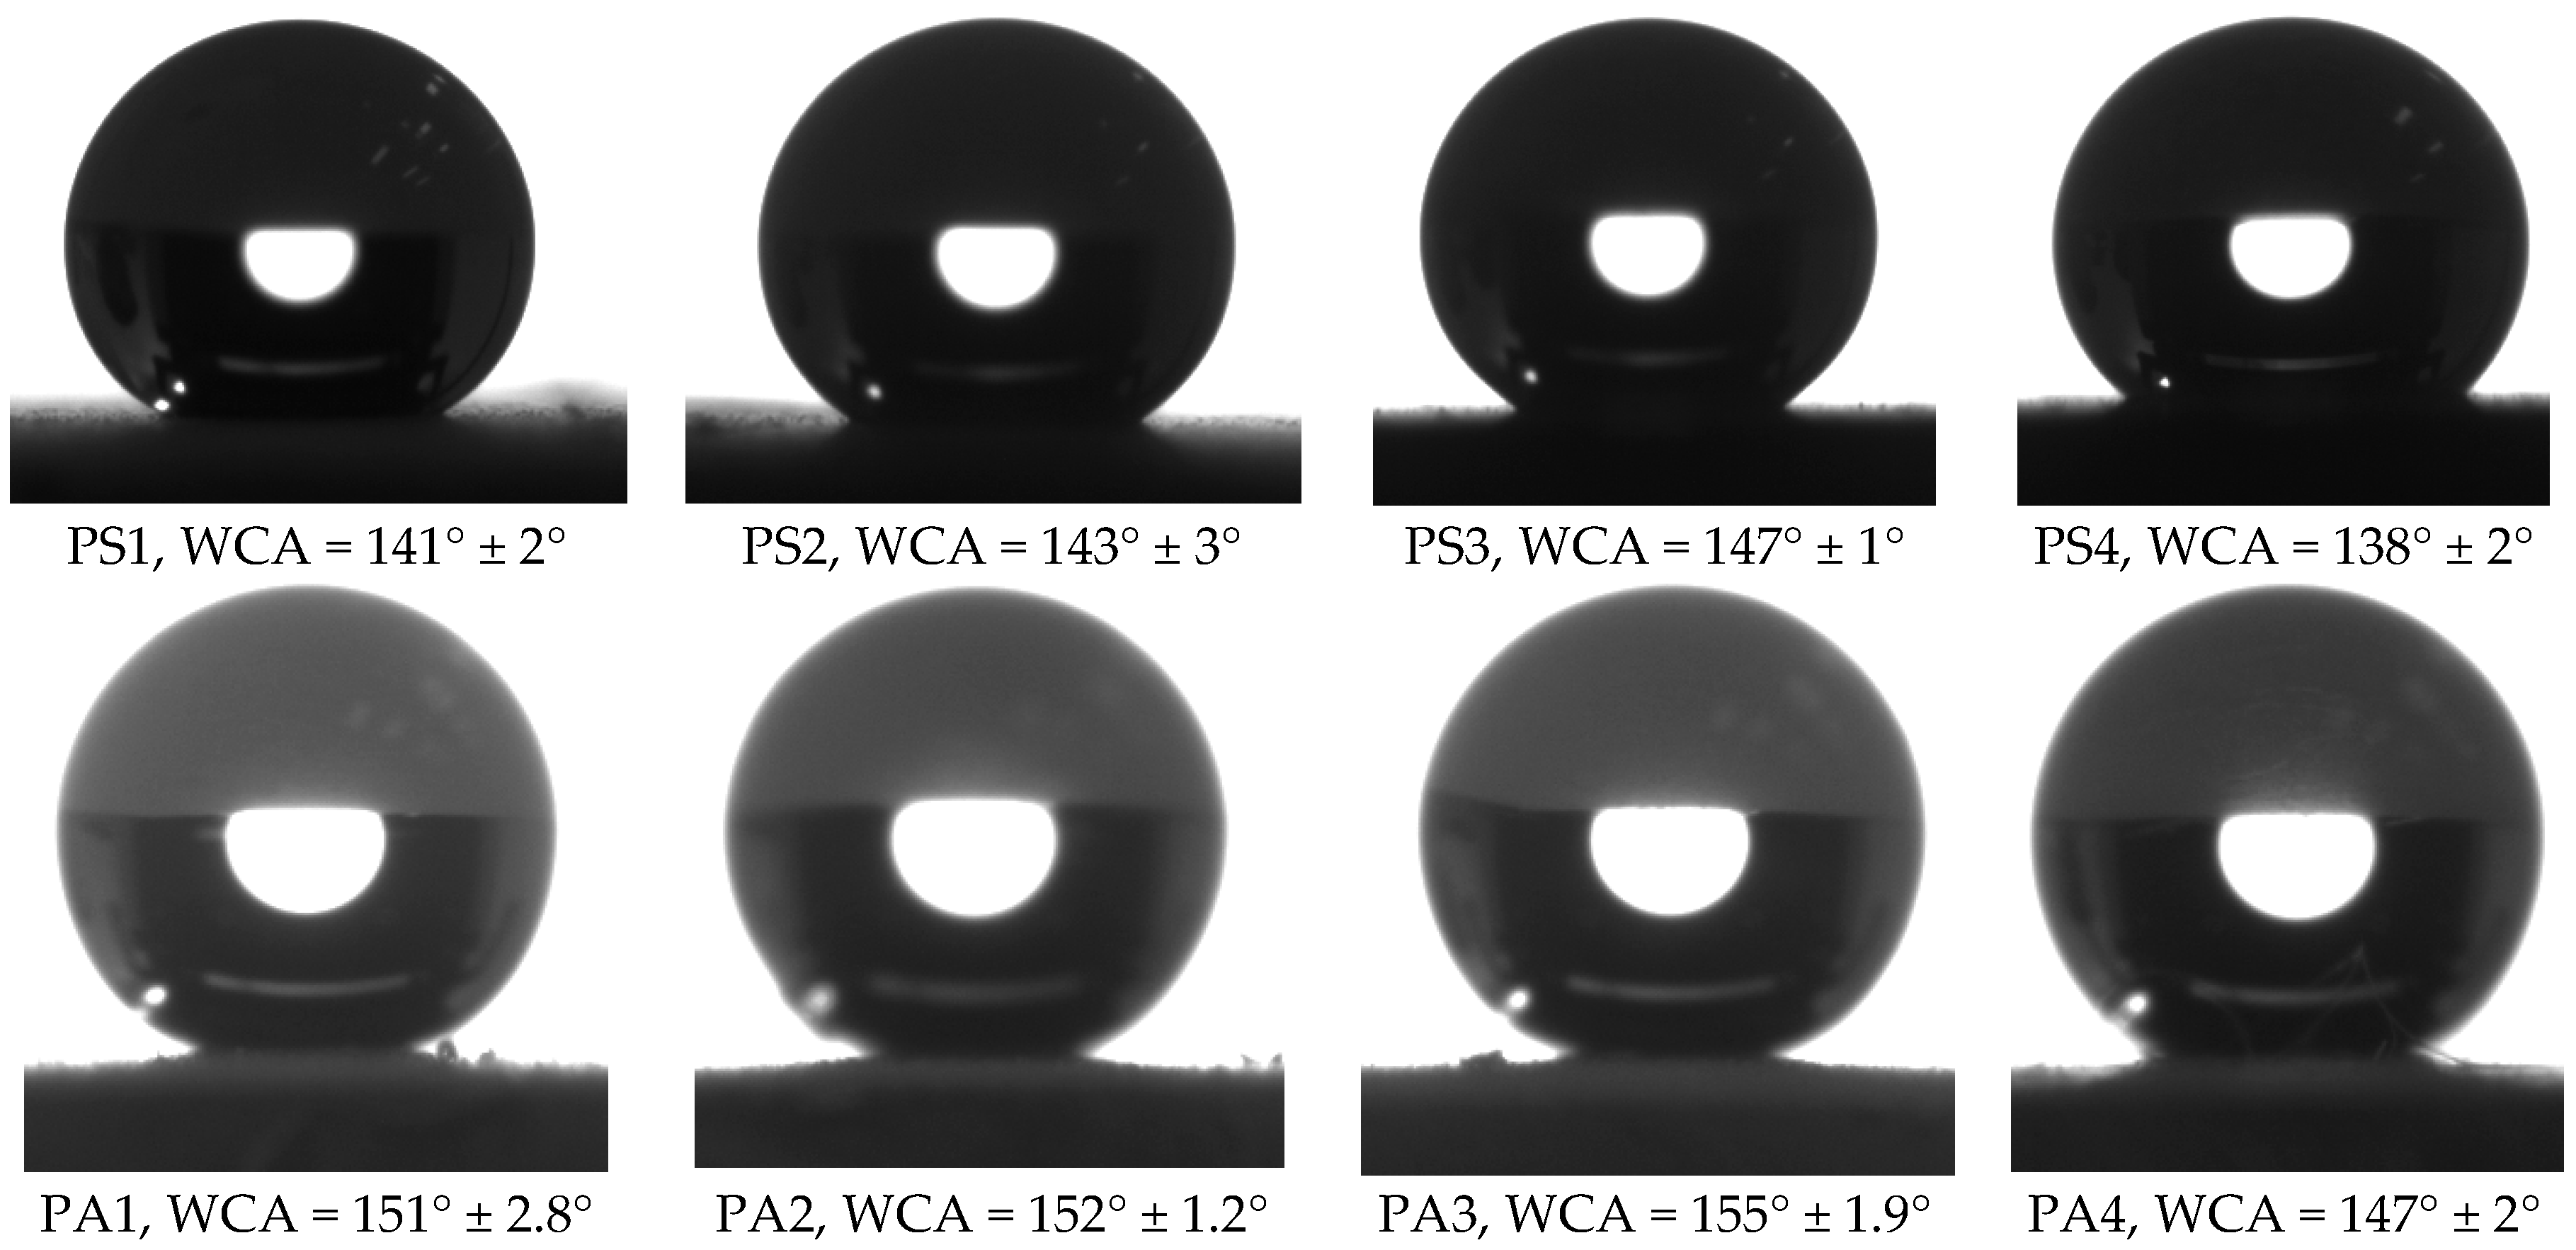
3.2. Wettability
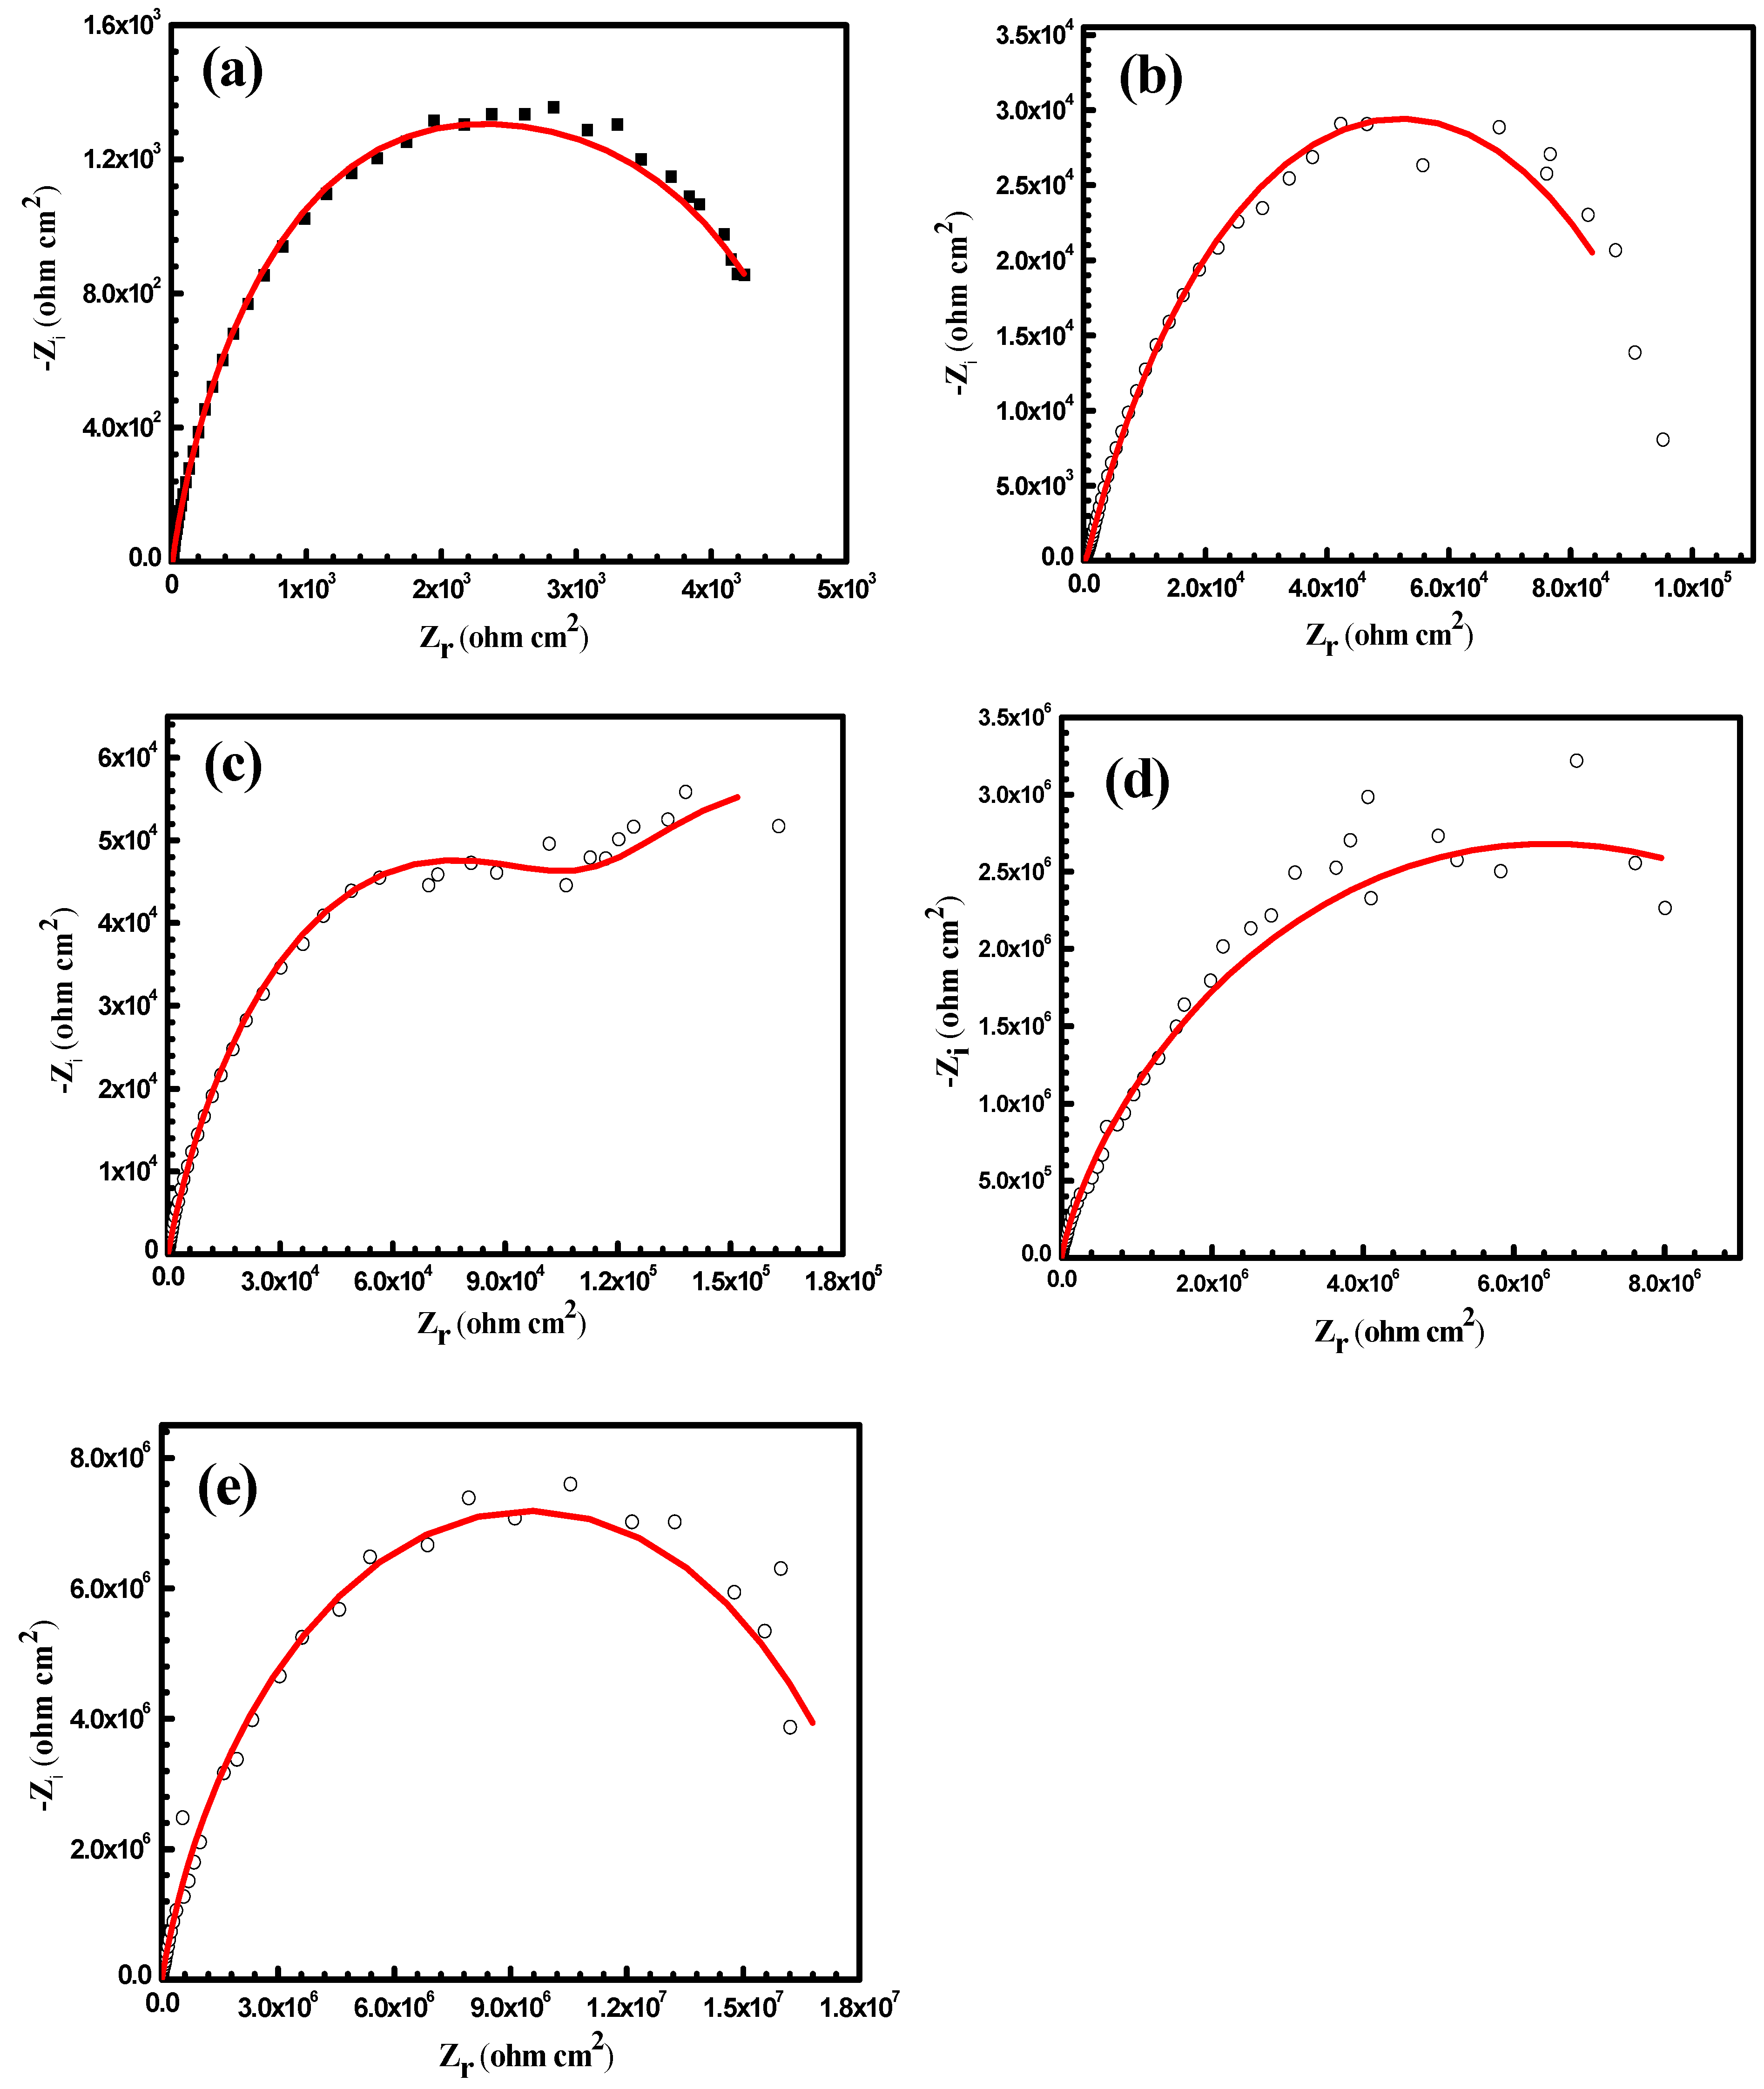
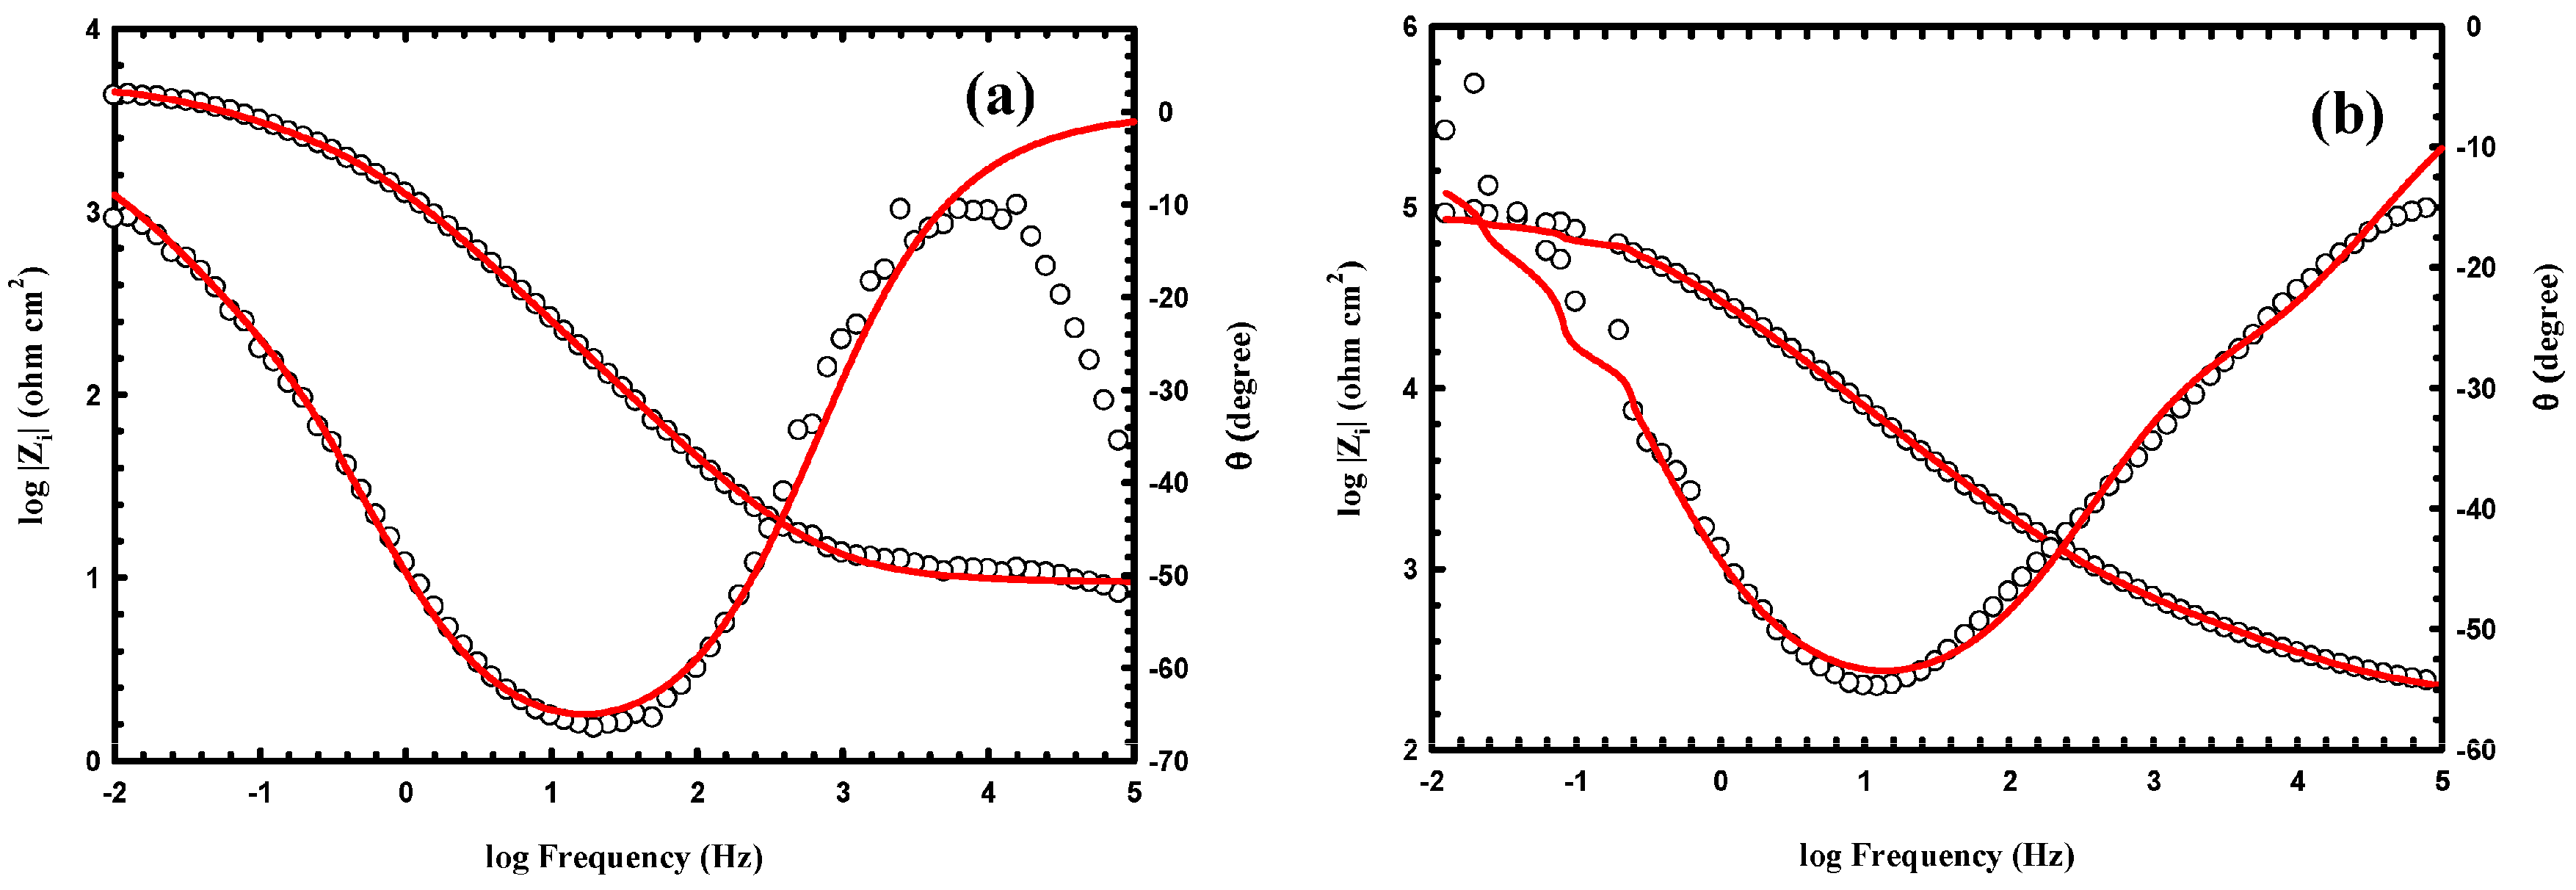
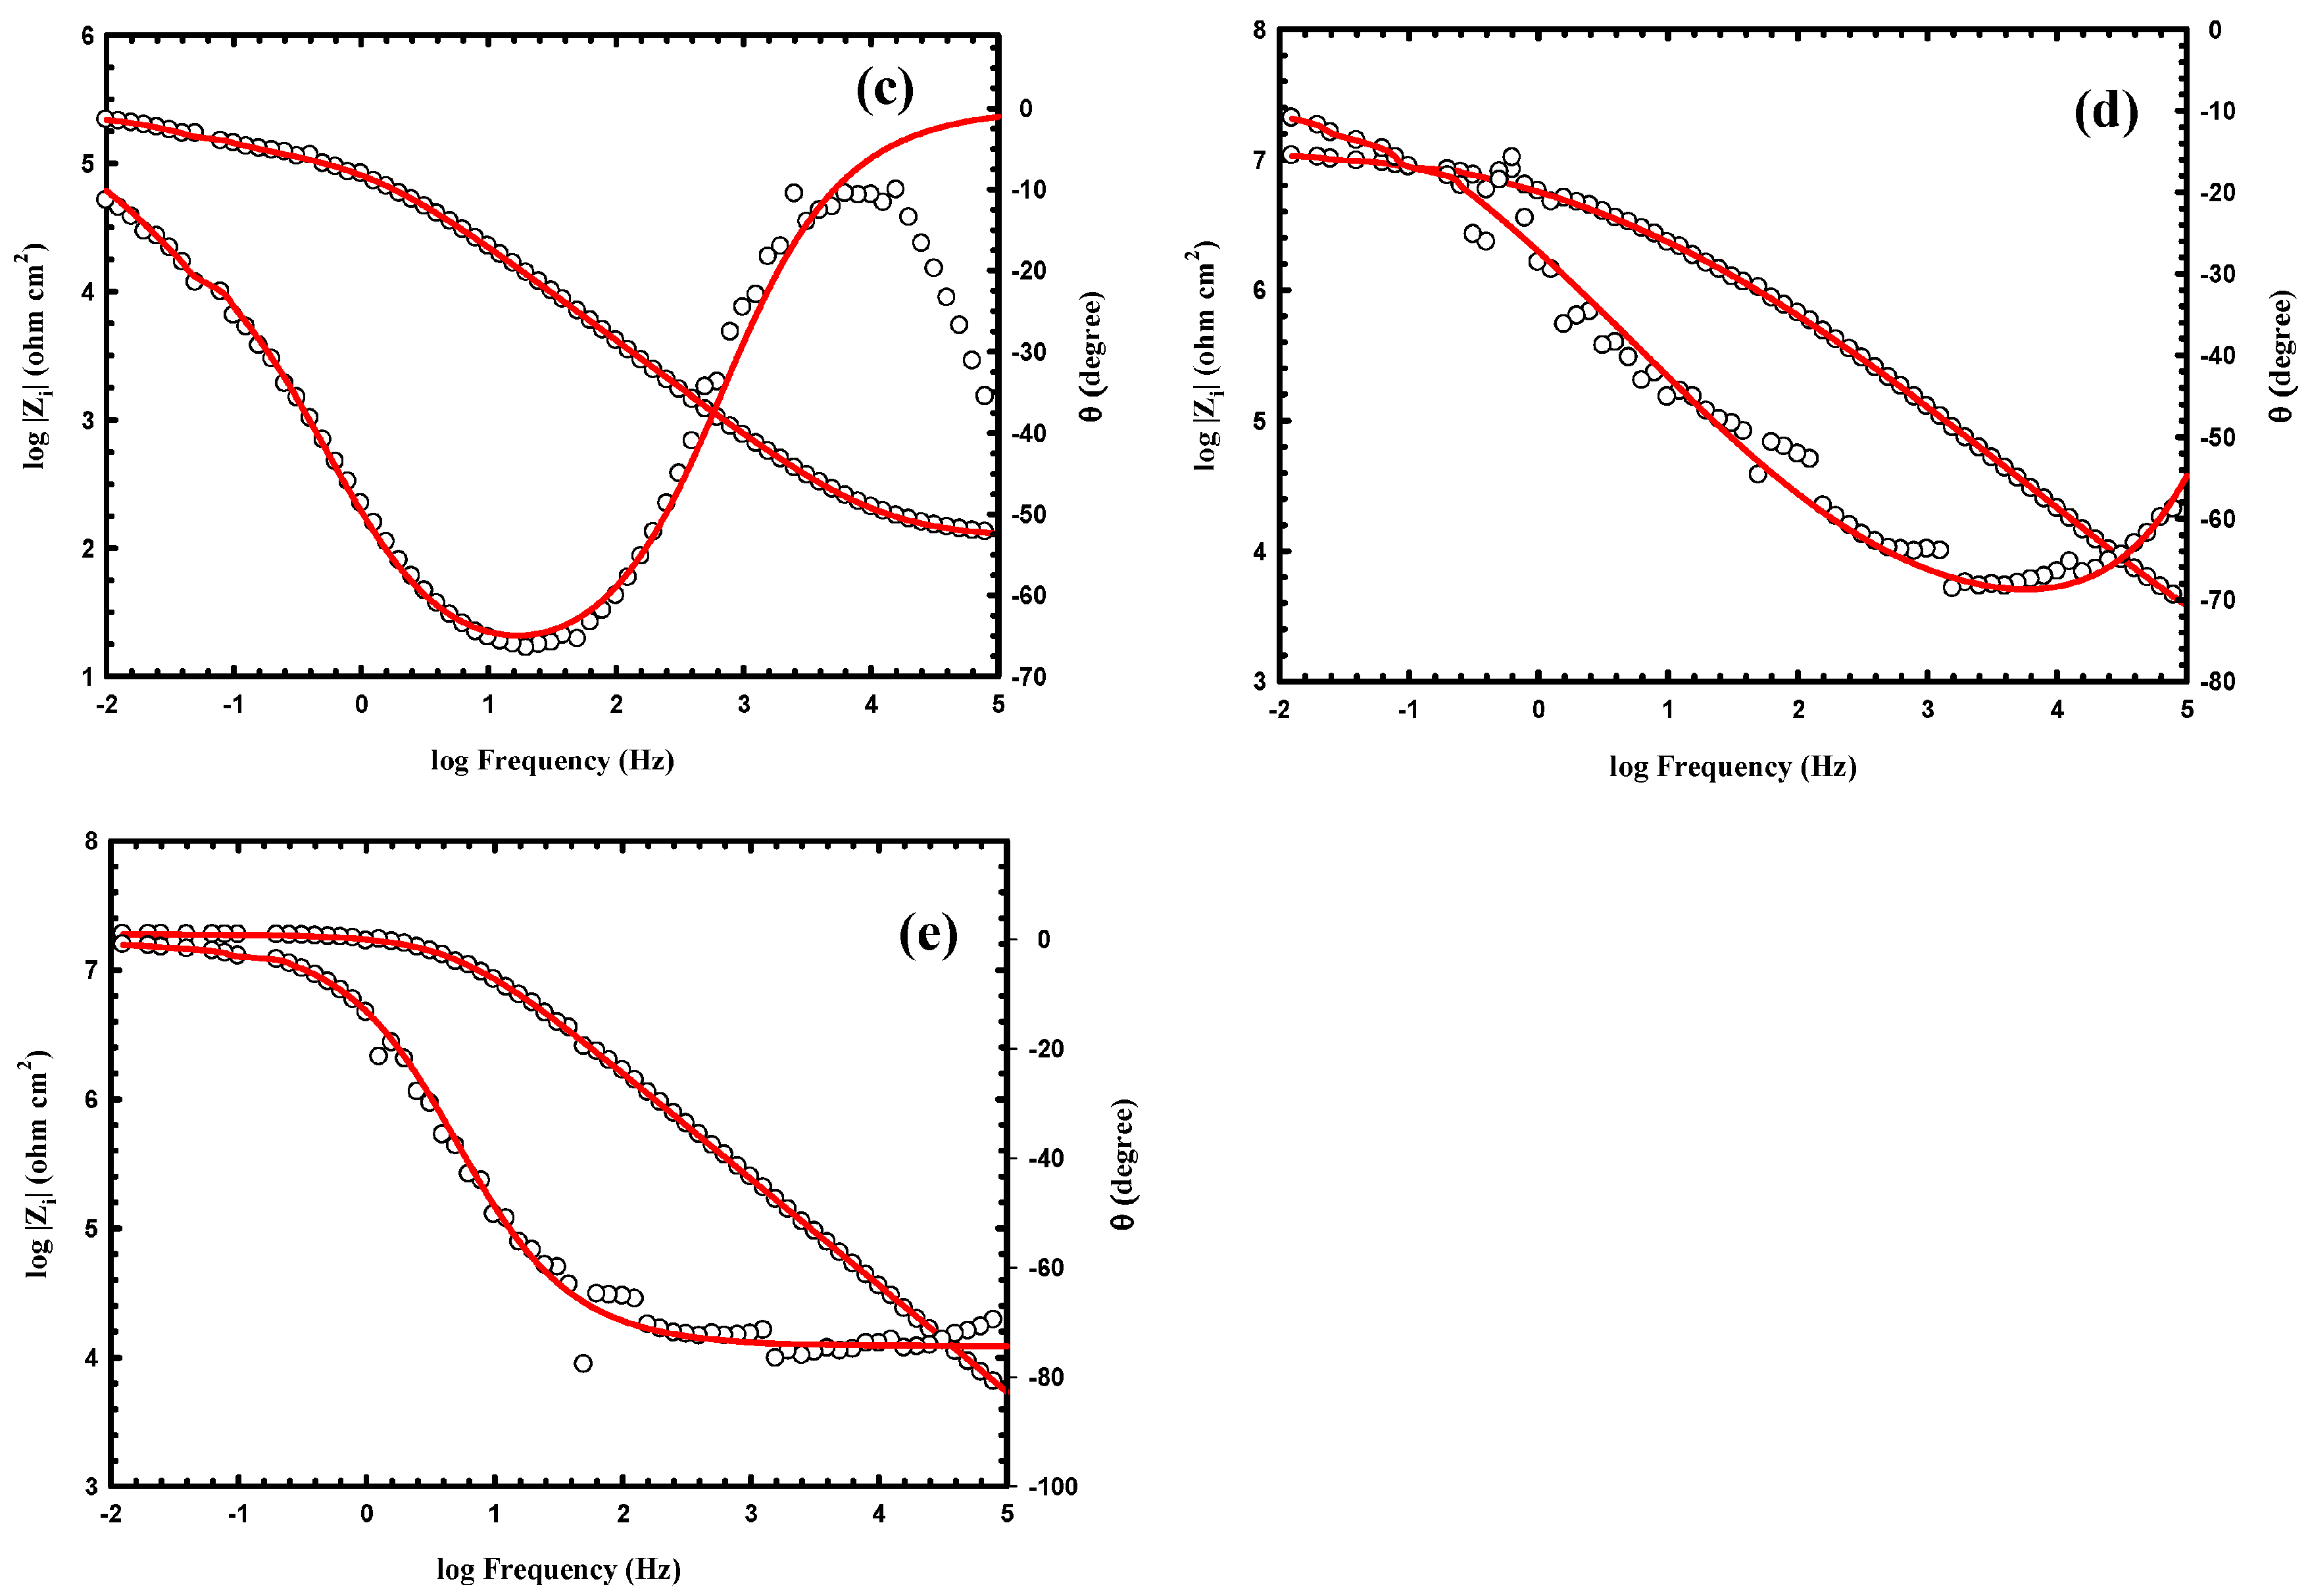
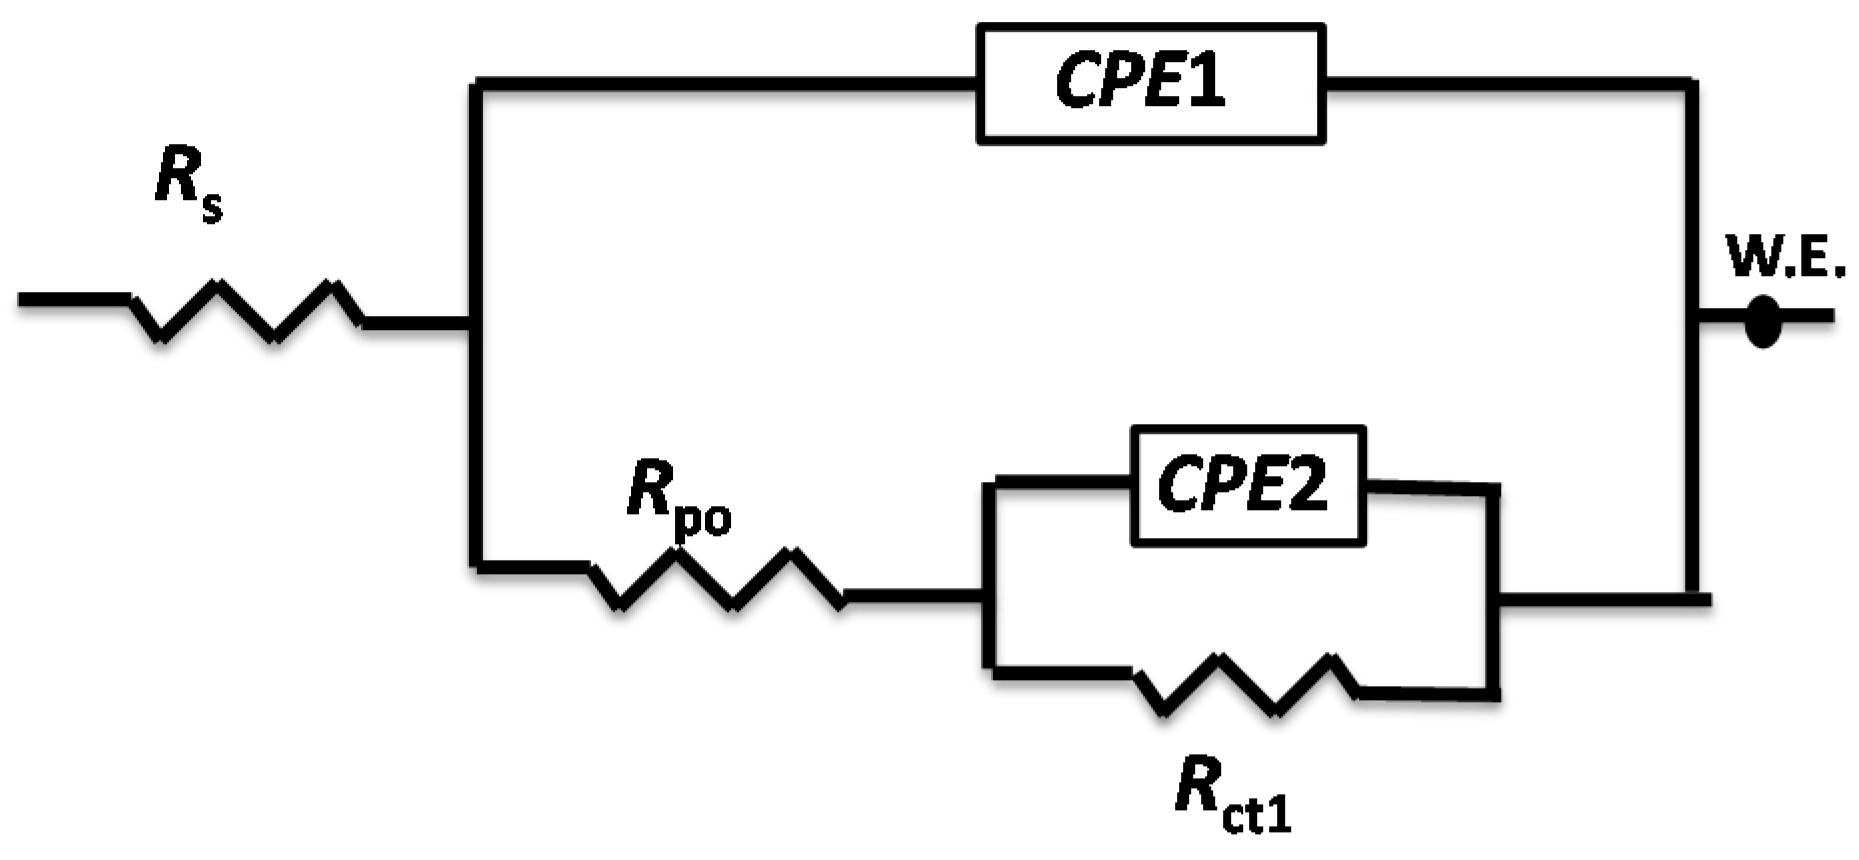
3.3. Anticorrosion Performance of the As-Prepared Nanocomposite Coatings
4. Conclusions
Acknowledgments
Author Contributions
Conflicts of Interest
References
- Nakajima, A.; Fujishima, A.; Hashimoto, K.; Watanabe, T. Preparation of transparent superhydrophobic boehmite and silica films by sublimation of aluminum acetylacetonate. Adv. Mater. 1999, 11, 1365–1368. [Google Scholar] [CrossRef]
- Schindelholz, E.; Kelly Robert, G. Wetting phenomena and time of wetness in atmospheric corrosion: A review. Corros. Rev. 2012, 30, 135–170. [Google Scholar] [CrossRef]
- Bhushan, B.; Jung, Y.C.; Koch, K. Self-cleaning efficiency of artificial superhydrophobic surfaces. Langmuir 2009, 25, 3240–3248. [Google Scholar] [CrossRef] [PubMed]
- Sun, T.; Tan, H.; Han, D.; Fu, Q.; Jiang, L. No platelet can adhere—Largely improved blood compatibility on nanostructured superhydrophobic surfaces. Small 2005, 1, 959–963. [Google Scholar] [CrossRef] [PubMed]
- Ishizaki, T.; Saito, N. Rapid formation of a superhydrophobic surface on a magnesium alloy coated with a cerium oxide film by a simple immersion process at room temperature and its chemical stability. Langmuir 2010, 26, 9749–9755. [Google Scholar] [CrossRef] [PubMed]
- Jin, S.; Choi, C. Superhydrophobic and Superoleophobic Nano Surfaces Used as Antifingerprint Touch Sensitive Screen. WO Patent Application No. 2012087352A2, 28 June 2012. [Google Scholar]
- Zhang, L.; Wu, J.; Hedhili, M.N.; Yang, X.; Wang, P. Inkjet printing for direct micropatterning of a superhydrophobic surface: Toward biomimetic fog harvesting surfaces. J. Mater. Chem. A 2015, 3, 2844–2852. [Google Scholar] [CrossRef]
- Zhou, Z.; Fa, W.X. Electrospinning superhydrophobic-superoleophilic fibrous PVDF membranes for high-efficiency water-oil separation. Mater. Lett. 2015, 160, 423–427. [Google Scholar] [CrossRef]
- Lapierre, F.; Harnois, M.; Coffinier, Y.; Boukherroub, R.; Thomy, V. Split and flow: Reconfigurable capillary connection for digital microfluidic devices. Lab Chip 2014, 14, 3589–3593. [Google Scholar] [CrossRef] [PubMed]
- Ivanova, E.P.; Hasan, J.; Webb, H.K.; Truong, V.K.; Watson, G.S.; Watson, J.A.; Baulin, V.A.; Pogodin, S.; Wang, J.Y.; Tobin, M.J.; et al. Natural bactericidal surfaces: Mechanical rupture of pseudomonas aeruginosa cells by cicada wings. Small 2012, 8, 2489–2494. [Google Scholar] [CrossRef] [PubMed]
- Gao, X.; Jiang, L. Biophysics: Water-repellent legs of water striders. Nature 2004, 432, 36. [Google Scholar] [CrossRef] [PubMed]
- Hu, D.L.; Bush, J.W.M. Meniscus-climbing insects. Nature 2005, 437, 733–736. [Google Scholar] [CrossRef] [PubMed]
- Liu, K.; Du, J.; Wu, J.; Jiang, L. Superhydrophobic gecko feet with high adhesive forces towards water and their bio-inspired materials. Nanoscale 2012, 4, 768–772. [Google Scholar] [CrossRef] [PubMed]
- Min, W.L.; Jiang, B.; Jiang, P. Bioinspired self-cleaning antireflection coatings. Adv. Mater. 2008, 20, 3914–3918. [Google Scholar] [CrossRef]
- Bayer, I. On the durability and wear resistance of transparent superhydrophobic coatings. Coatings 2017, 7, 12. [Google Scholar] [CrossRef]
- Heib, F.; Schmitt, M. Statistical contact angle analyses with the high-precision drop shape analysis (HPDSA) approach: Basic principles and applications. Coatings 2016, 6, 57. [Google Scholar] [CrossRef]
- Lee, K.-M.; Ngo, C.V.; Jeong, J.Y.; Jeon, E.-C.; Je, T.J.; Chun, D.M. Fabrication of an anisotropic superhydrophobic polymer surface using compression molding and dip coating. Coatings 2017, 7, 194. [Google Scholar] [CrossRef]
- Fontananova, E.; Jansen, J.C.; Cristiano, A.; Curcio, E.; Drioli, E. Effect of additives in the casting solution on the formation of pvdf membranes. Desalination 2006, 192, 190–197. [Google Scholar] [CrossRef]
- Anton, F. Process and Apparatus for Preparing Artificial Threads. U.S. Patent Application No. 1975504A, 2 October 1934. [Google Scholar]
- Huang, Z.M.; Zhang, Y.Z.; Kotaki, M.; Ramakrishna, S. A review on polymer nanofibers by electrospinning and their applications in nanocomposites. Compos. Sci. Technol. 2003, 63, 2223–2253. [Google Scholar] [CrossRef]
- Deitzel, J.M.; Kleinmeyer, J.; Harris, D.; Beck Tan, N.C. The effect of processing variables on the morphology of electrospun nanofibers and textiles. Polymer 2001, 42, 261–272. [Google Scholar] [CrossRef]
- Sukigara, S.; Gandhi, M.; Ayutsede, J.; Micklus, M.; Ko, F. Regeneration of bombyx mori silk by electrospinning—Part 1: Processing parameters and geometric properties. Polymer 2003, 44, 5721–5727. [Google Scholar] [CrossRef]
- Demir, M.M.; Yilgor, I.; Yilgor, E.; Erman, B. Electrospinning of polyurethane fibers. Polymer 2002, 43, 3303–3309. [Google Scholar] [CrossRef]
- Fong, H.; Chun, I.; Reneker, D.H. Beaded nanofibers formed during electrospinning. Polymer 1999, 40, 4585–4592. [Google Scholar] [CrossRef]
- Ondarçuhu, T.; Joachim, C. Drawing a single nanofibre over hundreds of microns. Europhys. Lett. 1998, 42, 215. [Google Scholar] [CrossRef]
- Feng, L.; Li, S.; Li, H.; Zhai, J.; Song, Y.; Jiang, L.; Zhu, D. Super-hydrophobic surface of aligned polyacrylonitrile nanofibers. Angew. Chem. Int. Ed. 2002, 41, 1221–1223. [Google Scholar] [CrossRef]
- Ma, P.X.; Zhang, R. Synthetic nano-scale fibrous extracellular matrix. J. Biomed. Mater. Res. 1999, 46, 60–72. [Google Scholar] [CrossRef]
- Liu, G.; Qiao, L.; Guo, A. Diblock copolymer nanofibers. Macromolecules 1996, 29, 5508–5510. [Google Scholar] [CrossRef]
- Doshi, J.; Reneker, D.H. Electrospinning process and applications of electrospun fibers. J. Electrostat. 1995, 35, 151–160. [Google Scholar] [CrossRef]
- Mohamed, M.A.; Abdullah, A.B.; Al-Maadeed, M.; Radwan, A.B. Fundamental, fabrication and applications of superhydrophobic surfaces fabrication and applications of superhydrophobic surfaces. In Research Perspectives on Functional Micro-and Nanoscale Coatings; Zuzuarregui, A., Morant-Miñana, M.C., Eds.; IGI Global: Hershey, PA, USA, 2016; pp. 341–368. [Google Scholar]
- Radwan, A.B.; Abdullah, A.B.; Alnuaimi, N.A. Recent advances in corrosion resistant superhydrophobic coatings. Corros. Rev. 2017. [Google Scholar] [CrossRef]
- Lee, K.H.; Kim, H.Y.; Bang, H.J.; Jung, Y.H.; Lee, S.G. The change of bead morphology formed on electrospun polystyrene fibers. Polymer 2003, 44, 4029–4034. [Google Scholar] [CrossRef]
- Maul, J.; Frushour, B.G.; Kontoff, J.R.; Eichenauer, H.; Ott, K.H.; Schade, C. Polystyrene and styrene copolymers. In Ullmann's Encyclopedia of Industrial Chemistry; Wiley-VCH Verlag GmbH & Co. KGaA: Weinheim, Germany, 2000. [Google Scholar]
- Jarusuwannapoom, T.; Hongrojjanawiwat, W.; Jitjaicham, S.; Wannatong, L.; Nithitanakul, M.; Pattamaprom, C.; Koombhongse, P.; Rangkupan, R.; Supaphol, P. Effect of solvents on electro-spinnability of polystyrene solutions and morphological appearance of resulting electrospun polystyrene fibers. Eur. Polym. J. 2005, 41, 409–421. [Google Scholar] [CrossRef]
- Acatay, K.; Simsek, E.; Ow-Yang, C.; Menceloglu, Y.Z. Tunable, superhydrophobically stable polymeric surfaces by electrospinning. Angew. Chem. Int. Ed. 2004, 116, 5322–5325. [Google Scholar] [CrossRef]
- Hou, W.; Wang, Q. Wetting behavior of a SiO2-polystyrene nanocomposite surface. J. Colloid Interface Sci. 2007, 316, 206–209. [Google Scholar] [CrossRef] [PubMed]
- Hou, W.; Wang, Q. UV-driven reversible switching of a polystyrene/titania nanocomposite coating between superhydrophobicity and superhydrophilicity. Langmuir 2009, 25, 6875–6879. [Google Scholar] [CrossRef] [PubMed]
- Xu, X.; Zhang, Z.; Guo, F.; Yang, J.; Zhu, X.; Zhou, X.; Xue, Q. Fabrication of bionic superhydrophobic manganese oxide/polystyrene nanocomposite coating. J. Bionic Eng. 2012, 9, 11–17. [Google Scholar] [CrossRef]
- Wang, Y.; Li, B.; Liu, T.; Xu, C.; Ge, Z. Controllable fabrication of superhydrophobic TiO2 coating with improved transparency and thermostability. Colloids Surf. A 2014, 441, 298–305. [Google Scholar] [CrossRef]
- Hart, L.D. Alumina Chemicals: Science and Technology Handbook; American Ceramic Society: Columbus, OH, USA, 1990. [Google Scholar]
- Keyvani, A.; Saremi, M.; Heydarzadeh Sohi, M. Microstructural stability of zirconia–alumina composite coatings during hot corrosion test at 1050 °C. J. Alloys Compd. 2010, 506, 103–108. [Google Scholar] [CrossRef]
- Zhan, N.; Li, Y.; Zhang, C.; Song, Y.; Wang, H.; Sun, L.; Yang, Q.; Hong, X. A novel multinozzle electrospinning process for preparing superhydrophobic PS films with controllable bead-on-string/microfiber morphology. J. Colloid Interface Sci. 2010, 345, 491–495. [Google Scholar] [CrossRef] [PubMed]
- Lee, J.S.; Choi, K.H.; Ghim, H.D.; Kim, S.S.; Chun, D.H.; Kim, H.Y.; Lyoo, W.S. Role of molecular weight of atactic poly(vinyl alcohol) (PVA) in the structure and properties of PVA nanofabric prepared by electrospinning. J. Appl. Polym. Sci. 2004, 93, 1638–1646. [Google Scholar] [CrossRef]
- Megelski, S.; Stephens, J.S.; Chase, D.B.; Rabolt, J.F. Micro- and nanostructured surface morphology on electrospun polymer fibers. Macromolecules 2002, 35, 8456–8466. [Google Scholar] [CrossRef]
- Baumgarten, P.K. Electrostatic spinning of acrylic microfibers. J. Colloid Interface Sci. 1971, 36, 71–79. [Google Scholar] [CrossRef]
- Kim, E.S.; Kim, S.H.; Lee, C.H. Electrospinning of polylactide fibers containing silver nanoparticles. Macromol. Res. 2010, 45, 215–221. [Google Scholar] [CrossRef]
- Tuberquia, J.C.; Nizamidin, N.; Robert, R.; Harl, R.R.; Albert, J.; Hunter, J.; Rogers, B.R.; Kane, G.J. Surface-Initiated Polymerization of Superhydrophobic Polymethylene. J. Am. Chem. Soc. 2010, 132, 5725–5734. [Google Scholar] [CrossRef] [PubMed]
- Wenzel, R.N. Resistance of solid surfaces to wetting by water. Ind. Eng. Chem. 1936, 28, 988–994. [Google Scholar] [CrossRef]
- Cassie, A.B.D.; Baxter, S. Wettability of porous surfaces. Trans. Faraday Soc. 1944, 40, 546–551. [Google Scholar] [CrossRef]
- Quere, D. Surface chemistry: Fakir droplets. Nat. Mater. 2002, 1, 14–15. [Google Scholar] [CrossRef] [PubMed]
- Conti, J.; De Coninck, J.; Ghazzal, M.N. Design of water-repellant coating using dual scale size of hybrid silica nanoparticles on polymer surface. Appl. Surf. Sci. 2018, 436, 234–241. [Google Scholar] [CrossRef]
- Karapanagiotis, I.; Manoudis, P.N.; Savva, A.; Panayiotou, C. Superhydrophobic polymer-particle composite films produced using various particle sizes. Surf. Interface Anal. 2012, 44, 870–875. [Google Scholar] [CrossRef]
- Manoudis, P.N.; Karapanagiotis, I. Modification of the wettability of polymer surfaces using nanoparticles. Prog. Org. Coat. 2014, 77, 331–338. [Google Scholar] [CrossRef]
- Wang, Y.; Suryanarayana, C.; An, L. Phase transformation in nanometer-sized γ-alumina by mechanical milling. J. Am. Ceram. Soc. 2005, 88, 780–783. [Google Scholar] [CrossRef]
- Ghezelbash, Z.; Ashouri, D.; Mousavian, S.; Ghandi, A.H.; Rahnama, Y. Surface modified Al2O3 in fluorinated polyimide/Al2O3 nanocomposites: Synthesis and characterization. Bull. Mater. Sci. 2012, 35, 925–931. [Google Scholar] [CrossRef]
- Radwan, A.B.; Mohamed, A.M.A.; Abdullah, A.M.; Al-Maadeed, M.A. Corrosion protection of electrospun pvdf–ZnO superhydrophobic coating. Surf. Coat. Technol. 2016, 289, 136–143. [Google Scholar] [CrossRef]
- Tang, C.; Stueber, M.; Seifert Hans, J.; Steinbrueck, M. Protective coatings on zirconium-based alloys as accident-tolerant fuel (ATF) claddings. Corros. Rev. 2017, 35, 141–165. [Google Scholar] [CrossRef]
- Kadapparambil, S.; Yadav, K.; Ramachandran, M.; Victoria Selvam, N. Electrochemical investigation of the corrosion inhibition mechanism of tectona grandis leaf extract for SS304 stainless steel in hydrochloric acid. Corros. Rev. 2017, 35, 111–121. [Google Scholar] [CrossRef]
- Kumar, R.; Chahal, S.; Dahiya, S.; Dahiya, N.; Kumar, S.; Lata, S. Experimental and theoretical approach to exploit the corrosion inhibition activity of 3-formyl chromone derivatives on mild steel in 1 M H2SO4. Corros. Rev. 2017, 35, 95–110. [Google Scholar] [CrossRef]
- Dahiya, S.; Lata, S.; Kumar, P.; Kumar, R. A descriptive study for corrosion control of low-alloy steel by aloe vera extract in acidic medium. Corros. Rev. 2016, 34, 241–248. [Google Scholar] [CrossRef]
- Fayyad, E.; Abdullah, A.; Hassan, M.; Mohamed, A.; Wang, C.; Jarjoura, G.; Farhat, Z. Synthesis, characterization, and application of novel Ni-P-carbon nitride nanocomposites. Coatings 2018, 8, 37. [Google Scholar] [CrossRef]
- Bai, Y.; Xing, J.; Guo, Y.; Li, J.; Huang, Q.; Gao, Y. Influence of 4 wt % Cr addition on the corrosion-wear synergistic effect for Al2O3/Fe(Al) composites. Corros. Rev. 2016, 34, 231–240. [Google Scholar] [CrossRef]
- Książek, M. Resistance to chemical attack of cement composites impregnated with a special polymer sulfur composite. Corros. Rev. 2016, 34, 211–229. [Google Scholar] [CrossRef]
- Yang, D.; Liu, S.H.; Shao, Y.P.; Di Xu, S.; Zhao, L.L.; Liao, Q.Q.; Ge, H.H. Electrochemical and XPS studies of alkyl imidazoline on the corrosion inhibition of carbon steel in citric acid solution. Corros. Rev. 2016, 34, 295–304. [Google Scholar] [CrossRef]


| Exp. Code | PS (wt %) | Al2O3 (wt %) | Potential (kV) | Flow Rate (mL·h−1) |
|---|---|---|---|---|
| PS1 | 2.5 | – | 20 | 1.5 |
| PS2 | 2.5 | – | 25 | 2 |
| PS3 | 2.5 | – | 25 | 1.5 |
| PS4 | 5 | – | 25 | 1.5 |
| PA1 | 2.5 | 0.25 | 20 | 1.5 |
| PA2 | 2.5 | 0.35 | 25 | 2 |
| PA3 | 2.5 | 0.25 | 25 | 1.5 |
| PA4 | 5 | 0.25 | 25 | 1.5 |
| PS Codes | Average Fiber Diameter (nm) | PA Codes (PS/Al2O3) | Average Fiber Diameter (nm) |
|---|---|---|---|
| PS1 | 340 ±27 | PA1 | 325 ±23 |
| PS2 | 328 ±29 | PA2 | 315 ±27 |
| PS3 | 320 ±21 | PA3 | 290 ±34 |
| PS4 | 433 ±15 | PA4 | 413 ±21 |
| Code | WCA | WCAH |
|---|---|---|
| PS1 | 141° ± 2° | 24° ± 3° |
| PS2 | 143° ± 3° | 20° ± 4° |
| PS3 | 147° ± 1° | 14° ± 3° |
| PS4 | 138° ± 2° | 32° ± 6° |
| PA1 | 151° ± 2.8° | 7° ± 2.3° |
| PA2 | 152° ± 1.2° | 5° ± 3.1° |
| PA3 | 155° ± 1.9° | 3° ± 4.2° |
| PA4 | 147° ± 2° | 13° ± 3° |
| Codes | Ra Values (nm) |
|---|---|
| PS1 | 22 ± 2 |
| PS2 | 26 ± 4 |
| PS3 | 32 ± 3 |
| PS4 | 17 ± 4 |
| PA1 | 53 ± 3 |
| PA2 | 61 ± 4 |
| PA3 | 82 ± 2 |
| PA4 | 27 ± 3 |
| Samples | WCA (°) | Rpo (kΩ·cm2) | Rct (kΩ·cm2) | Y01 (Ω−1·cm−2·sn) × 10−6 | n1 | Cdl1 (μF·cm−2) | Y02 (Ω−1·cm−2·sn) × 10−6 | n2 | Cdl2 (μF·cm−2) |
|---|---|---|---|---|---|---|---|---|---|
| uncoated Al alloy | 87 ± 2 | 0.7 | 4 | 1100 | 0.833 | 1500 | 148 | 0.763 | 120 |
| PS1 | 141 ± 2 | 77 | 102 | 28 | 0.735 | 41 | 4 | 0.701 | 2.7 |
| PS3 | 147 ± 1 | 220 | 140 | 8 | 0.714 | 8.3 | 1.8 | 0.697 | 0.98 |
| PA1 | 151 ± 2.8 | 530 | 8000 | 0.048 | 0.692 | 0.033 | 0.004 | 0.408 | 3.4 × 10⁻⁵ |
| PA3 | 155 ± 1.9 | 860 | 18000 | 0.013 | 0.585 | 0.0047 | 0.0012 | 0.263 | 2.5 × 10⁻⁸ |
© 2018 by the authors. Licensee MDPI, Basel, Switzerland. This article is an open access article distributed under the terms and conditions of the Creative Commons Attribution (CC BY) license (http://creativecommons.org/licenses/by/4.0/).
Share and Cite
Bahgat Radwan, A.; Abdullah, A.M.; Mohamed, A.M.A.; Al-Maadeed, M.A. New Electrospun Polystyrene/Al2O3 Nanocomposite Superhydrophobic Coatings; Synthesis, Characterization, and Application. Coatings 2018, 8, 65. https://doi.org/10.3390/coatings8020065
Bahgat Radwan A, Abdullah AM, Mohamed AMA, Al-Maadeed MA. New Electrospun Polystyrene/Al2O3 Nanocomposite Superhydrophobic Coatings; Synthesis, Characterization, and Application. Coatings. 2018; 8(2):65. https://doi.org/10.3390/coatings8020065
Chicago/Turabian StyleBahgat Radwan, Ahmed, Aboubakr M. Abdullah, Adel M. A. Mohamed, and Mariam A. Al-Maadeed. 2018. "New Electrospun Polystyrene/Al2O3 Nanocomposite Superhydrophobic Coatings; Synthesis, Characterization, and Application" Coatings 8, no. 2: 65. https://doi.org/10.3390/coatings8020065
APA StyleBahgat Radwan, A., Abdullah, A. M., Mohamed, A. M. A., & Al-Maadeed, M. A. (2018). New Electrospun Polystyrene/Al2O3 Nanocomposite Superhydrophobic Coatings; Synthesis, Characterization, and Application. Coatings, 8(2), 65. https://doi.org/10.3390/coatings8020065