Article

A Trial to Design γ/γ′ Bond Coat in Ni–Al–Cr Mode TBCs Aided by Phase-Field Simulation

State Key Laboratory of Powder Metallurgy, Central South University, Changsha 410083, China
*
Author to whom correspondence should be addressed.
Coatings 2018, 8(12), 421; https://doi.org/10.3390/coatings8120421
Submission received: 21 September 2018 / Revised: 14 November 2018 / Accepted: 19 November 2018 / Published: 23 November 2018
(This article belongs to the Special Issue Thermal Barrier Coatings)

Abstract

:
Phase-field modeling coupled with calculation of phase diagram (CALPHAD) database was utilized to perform a series of two-dimensional phase-field simulations of microstructure evolution in the γ + γ′/γ + γ′ Ni–Al–Cr mode bond coat/substrate systems. With the aid of phase-field simulated microstructure evolution, the relationship between the interdiffusion microstructure and the cohesiveness/aluminum protective property with different alloy compositions and bond coat thicknesses was fully discussed. A semi-quantitative tie-line selection criteria for alloy composition of the bond coat/substrate system with the identical elements, i.e., that the equilibrium Al concentrations of γ′ and γ phases in the bond coat should be similar to those in substrate, while the phase fraction of γ′ in the bond coat tends to be higher than that in the substrate, was then proposed to reduce the formation of polycrystalline structure and thermal shock from the temperature gradient.

Graphical Abstract

1. Introduction

Thermal barrier coatings (TBCs) with a thickness of 100–500 μm [1], consisting of a metallic bond coat, intervening thermal grown oxide (TGO) layer, and outside ceramic topcoat, are extensively used in turbine blades to improve the high temperature resistance. As a transition layer between the thermal grown oxide (TGO) scale and the substrate alloy, the sufficient aluminum content in the bond coat should be maintained to ensure the stable growth of the protective TGO layer of Al2O3. For a thin bond coating on a substrate, its lifetime is controlled not only by oxidation but also by diffusion of Al into the substrate [2,3]. When the Al content drops below a critical level, it may not be possible to form a continuous and stable surface alumina layer. Consequently, spallation and crackling of the TGO scale occurs. Another problem caused by the bond coat/substrate interdiffusion is the polycrystalline structure around the interdiffusion zone, which may aggravate crack propagation and intergranular fractures. Hence, the bond coat should have both good cohesiveness properties and Al preserved property simultaneously, i.e., that good compatibility with the substrate alloy and sufficient Al content should be satisfied concurrently. The failure of cohesiveness properties may originate from the two following factors: (i) phase transformation stress, stemming from the local variation of the volume, density and elastic modulus and; (ii) thermal stress caused by the temperature gradient, i.e., temperature difference, thermal expansion, etc.
Recently, a new generation of γ + γ′ two-phase bond coat [4,5,6,7] has attracted much attention due to the fact that it has better chemical compatibility with the Ni-based superalloy matrix and displays insignificant rumpling during the thermal circulation [4] compared with the previous two commonly used types of bond coats, i.e., Pt-modified nickel aluminide [8,9] (β-phase) and Ni–Co–Cr–Al–Y system (i.e., β-NiAl phase + γ-Ni solid solution [10,11,12], or β-NiAl phase + γ′-Ni3Al [13,14,15,16]), and thus it is widely used in aerospace industry. A series of recent investigations [5,6] also indicate that Pt-modified γ + γ′ alloys oxidize in an alumina scale at similar speeds compared to those growing on the traditional Pt-modified β-NiAl alloys. Considering the industrial significance of the γ + γ′ two-phase bond coat, there is a great need to design novel γ + γ′ bond coats with high performance, which usually depends on the microstructure evolution in service resulting from alloy composition, thickness, and service temperature. Thus, the quantitative description of the microstructure evolution in bond coat/substrate systems during service is the prerequisite for optimization of alloy composition, thickness, and service temperature, and later design of novel γ + γ′ two-phase bond coats.
Currently, one of the powerful methods to achieve the quantitative description of the microstructure evolution in materials during life time is the phase-field modeling [17,18,19,20,21,22,23,24,25,26]. Up to now, numerous studies have been devoted to the phase-field simulations of the microstructure evolution in Ni-based superalloy substrates [27,28,29,30,31,32,33]. As for the microstructure evolution in bond coat/substrate systems, only several phase-field research works are available in the literature [34,35,36,37,38,39,40,41]. Among those publications, Wu et al. [35,37,38] simulated the interdiffusion microstructure of γ + γ′ and γ + β phases in Ni–Al–Cr and Ni–Al–Pt systems. Very recently, the present authors [42] employed the multi-phase-field (MPF) model to perform two-dimensional phase-field simulations of the microstructure evolution in four types of representative Ni–Al–Cr bond coat/substrate systems with different phases (including β, γ and γ′ phases). Moreover, the effect of temperature gradients on the Ni–Al–Cr bond coat/substrate systems was also investigated by the same authors [42]. In order to achieve a quantitative description, reliable CALPHAD (calculation of phase diagram) thermodynamic and atomic mobility databases were coupled to the phase-field simulations via TQ (thermodynamic calculation) interface in [42].
As a continuous work of our previous publication [42], a similar strategy, i.e., phase-field modeling coupled with CALPHAD-type databases, is to be utilized in the current work to perform phase-field simulation of microstructure evolution in Ni–Al–Cr mode bond coat/substrate systems, with a focus on the effect of alloy composition, bond coat thickness, and temperature gradient. By establishing the relation between the interdiffusion microstructure and the cohesiveness, the aluminum protective property with different alloy compositions and bond coat thicknesses, a trial to design the bond coat composition and thickness is to be performed, as is the major task of this paper.

2. Multi-Phase-Field Model

Following our previous work [42], the multi-phase-field model is used for the current phase-field simulation, which originates from a total free energy, consisting of interfacial fintf, chemical fchem and elastic energy felast [17,18,19,43],
F = Ω f intf + f chem + f elast  
f intf = α , β = 1 , , N , α β 4 σ α β η α β { η α β 2 π 2 f α ϕ β + ϕ α ϕ β }  
f chem = α = 1 , , N h ( ϕ α ) f α ( c α i ) + μ ˜ i ( c i α = 1 N ϕ α c α i )  
f elast = 1 2 { α = 1 , , N h ( ϕ α ) ( ε ¯ α ε ¯ α * ) C ¯ α ( ε ¯ α ε ¯ α * ) }  
where the number of phases is represented by N and the constraint condition α = 1 , , N ϕ α = 1 should be satisfied. The phase field of α phase is represented by φα. σαβ is the interfacial energy between α and β, and ηαβ is the interfacial width. hα) is a monotonous coupling function. f α ( c α i ) is the free energy density of the α bulk phase, it is a function of phase concentrations c α i . μ ˜ i is the diffusion potential of component i introduced as a Lagrange multiplier to ensure the concentration conservation c i = α = 1 N ϕ α c α i . The Gibbs free energy densities are functions of the local phase composition fields. The phase compositions c α i are non-conserved parameters which are not independent parameters but are linked by the mass balance to the conserved and continuous mixture composition c, i.e., c i = α = 1 N ϕ α c α i . In order to treat the phase compositions as independent parameters, the model has integrated the mass balance into the functional by an additional Lagrange term to ensure the concentration conservation, as shown in Equation (3). Through a series of mathematical derivations, the Lagrange multiplier can be obtained as the diffusion potential [43]. ε ¯ α is the strain tensor of phase α, ε ¯ α * is the eigenstrain, and C ¯ α is the elastic stiffness coefficient.
The governing equations for the concentration ci, phase field φα and strain tensor ε ¯ α are derived based on the above free energy functional [17,18,19,43]:
ϕ ˙ α = β = 1 , , N μ α β { σ α β [ ϕ β 2 ϕ α ϕ α 2 ϕ β + π 2 2 η α β 2 ( ϕ α ϕ β ) ] + π η α β ϕ α ϕ β Δ G α β }  
c ˙ i = α = 1 , , N ϕ α M α μ ˜ α i
0 = α = 1 , , N ϕ α C ¯ α ( ε ¯ α ε ¯ α * )
where μαβ is the interfacial mobility and ΔGαβ is the driving force, split into the chemical driving force Δ G α β chem and the elastic driving force Δ G α β elast :
Δ G α β chem = f α ( c α i ) + f β ( c β i ) + μ ˜ i ( c α i c β i )  
Δ G α β elast = ( ε ¯ α * ε ¯ β * ) s ¯ α  
The chemical part Δ G α β chem can be linked to the real CALPHAD thermodynamic parameters [44]. s ¯ α = C ¯ α ( ε ¯ α ε ¯ α * ) is the stress tensor, where C ¯ α is the elastic stiffness coefficient matrix in phase α. Mα is the chemical mobility in phase α, and can be directly acquired from atomic mobility databases [45]. μ ˜ α i is the diffusion potential of component i in phase α, can be defined as the difference between the chemical potential of solute and the chemical potential of solvent according to the following expression:
μ ˜ α i = μ α i μ α 0 = ( g α c α i ) c α j i , T
of which the gradient determines the chemical driving force for solute diffusion within a phase. Here, this is called phase diffusion potential to distinguish it from chemical potential; the diffusion potential is the partial derivative of free energy density with respect to concentration, while the chemical potential is the partial derivative of free energy with respect to the number of moles.

3. CALPHAD Coupling and Materials Parameters

The reliable CALPHAD (calculation of phase diagram) thermodynamic and atomic mobility databases were linked to MICRESS (MICRostructure Evolution Simulation Software, 6.0) [46] via TQ interface [47], which is an application programming interface of Thermo-Calc, a general software package for multi-component phase equilibrium calculations. The thermodynamic properties and phase equilibrium data that can be obtained by using TQ. The chemical free energy used in the phase-field simulation is acquired from the thermodynamic parameters assessed by Huang and Chang [48]. The calculated isothermal sections of ternary Ni–Al–Cr system in Ni-rich region at 1373 and 1473 K is shown in Figure 1. The initial alloy compositions for different diffusion couples are also indicated. As shown in Figure 1, the green line indicates the tie line of γ + γ′ two-phase region. Along the tie line, every alloy composition has the same equilibrium phase compositions.
The initial constituents of diffusion couples, annealing temperature, as well as temperature gradient in the present phase-field simulations are given in Table 1.
The diffusion mobility data of γ phases in Ni–Al–Cr alloy is taken from the research of Engström and Ågren [49]. As for the diffusivity of γ′ phase in the Ni–Al–Cr system, it is acquired from the averaged experimental data [50], D Al γ = 1.06007 × 1 0 14 m2/s, D Cr γ = 8.58490 × 1 0 15 m2/s.
All the phases/grains are assumed to be isotropic. The γ/γ′ interfacial energy calculated by Kaptay’s method [51], 1.54 × 10⁻⁶ J/cm2, is used in the present simulations. The detailed calculation process can be referred to our previous work [42,52]. The interface mobility is estimated to be 4.0 × 10⁻¹⁰ cm4/J·s for γ/γ′ interface according to the work of Steinbach [17] to guarantee diffusion-controlled transformation. The lattice parameters, molar volume and elastic constants the same as the previous work [42,53,54,55,56] are listed in Table 2. Lattice mismatch of γ/γ′ phases is calculated as 0.0022497 according to δ = ( a γ a γ ) / a γ where aγ and aγ′ are the lattice constants of γ and γ′ phases [42,53,54,55,56].
For the sake of achieving quantitative phase-field simulation, the selected geometry and temperature gradients are consistent with the practical conditions in the industry [1]. The present phase-field simulations were performed in a 2-D domain with 1000 × 250 grids, 800 × 250 grids, and 660 × 250 grids (grid spacing (discretization size) of 0.2 μm, interface width of 1.0 μm). The thicknesses of bond coat are set as 80 μm, 40 μm, and 12 μm (left side), respectively. While that of substrate is uniformly set as 120 μm (right side), and the width is set as 50 μm. Thus, the real sizes of the simulation domains are 200 × 50 μm2, 160 × 50 μm2, 132 × 50 μm2, respectively.
The temperature decrease is set as 100 K across the current simulated domain based on the practical case [1]. For concentration field and phase field, the periodic condition is adopted at the bottom and top boundaries, the insulation boundary condition is set to the left and right side. The plane strain approximation is made for the current elastic field calculations in consideration of the geometry of the thermal barrier coatings.
The geometry, process and boundary conditions of the current simulation are shown in Figure 2.

4. Results and Discussion

4.1. Effect of Alloy Composition

Different types of interdiffusion microstructure will form due to the variation of alloy compositions in the bond coat and substrate for a given bond coat thickness. The thickness of the bond coat is set as 80 μm to investigate the effect of alloy composition on the cohesiveness and Al preserved property of bond coat. Four different types of structure are determined as follows:
● Structure Type 1
The common characteristic of No. 5 and 6 diffusion couples is that the equilibrium aluminum concentrations of γ′ and γ phases in bond coat are equal to those in substrate, i.e., corresponding to the composition points on the same tie-line in the isothermal section. Due to the similar structure existing for No. 5 and 6, the microstructure evolution of the No. 5 diffusion couple during the interdiffusion process at 1373 K and with temperature gradient are presented in Figure 3a,b. There is no γ′ polycrystalline structure formation around the interface between bond coat and substrate, and γ′ grains in the bond coat and substrate become cubical gradually with the action of coherent strain. The microstructure evolution around the interface of the diffusion couple during the interdiffusion process is actually a kinetic process, accompanied with the competence of the interfacial energy and the kinetic diffusion. In Figure 3, the phenomenon that the γ′ particles does not coarse and coalesce on the interface is dominated by the diffusion path, i.e., kinetic diffusion. The fundamental cause can be attributed to the equilibrium Al concentrations of γ′ and γ phases in bond coat that are identical or close to those in substrate according to the phase diagram, i.e., that concentration gradient can be negligible. It also means that the two initial composition points in bond coat and substrate almost locate along the tie line in the γ′ + γ two phase region. Consequently, the diffusion path determined by kinetic factor limits in the γ′ + γ two phase region, and never go into the γ′ or γ single phase region. The γ′ polycrystalline structure formation around the interdiffusion interface actually corresponding to the composition at that region has changed into γ′ single phase region, i.e., that diffusion path has entered into γ′ single phase region. Therefore, in the case shown in Figure 3, the corresponding thermodynamic, kinetic and interfacial factors have determined the feature of the microstructure in common. In contrast, under the condition of temperature gradient, γ′ phases dissolve in high temperature regions and γ phase regions with lower aluminum concentration extends to substrate, thus the recession distance increases along with interdiffusion. Meanwhile, another polycrystalline region forms at the bottom of substrate. The average composition line of No. 5 and 6 bond coat/substrate systems are also along the tie line and the equilibrium phase fraction of No. 5 at 1373 K is 60.4% γ′ and 39.6% γ, while that for 1473 K is 19.2% γ′ and 80.8% γ. Figure 4 presents the composition distribution of Al and Cr along the line scan in No. 5 γ + γ′/γ + γ′ bond coat/substrate system (Ni–18.5at.%Al–11.25at.%Cr/Ni–18at.%Al–12at.%Cr) annealed Figure 4a at 1373 K and Figure 4b with an effect of temperature gradient ΔG = 5000 K/cm at 805,000 s, which confirms the more obvious concentration gradient for both Al and Cr under an effect of a temperature gradient in the bond coat/substrate system. Additionally, Cr diffuses from the substrate alloy towards bond coat, while Al takes the opposite direction, resulting in the depletion of Al in the bond coat under the effects of the temperature gradient.
● Structure Type 2
The common characteristic of No. 1, 2 and 9 bond coat/substrate systems lies in the fact that the equilibrium aluminum concentrations of the γ′ and γ phases in the bond coat are all slightly higher than those in the substrate. The microstructure evolution of No. 1 diffusion couple during the interdiffusion process at 1373 K and with the effect of a temperature gradient are presented in Figure 5a,b. Similar to the case of No. 5, γ′ polycrystalline structure is observed around interface along with the extension into substrate at 1373 K, which shows the similar phenomenon as the experimental report in Ref. [6]. In comparison, the influence of the temperature gradient is significant, resulting in the dissolution of γ′ phases in high temperature regions. The recession distance increases along with interdiffusion. Moreover, the polycrystalline structure forms at the bottom of substrate and near the interface simultaneously. Therefore, the precipitation strengthening structure in the substrate is seriously destroyed, which is irresistible to the service environment with high temperature and complex stress. The average composition line of No. 1, 2 and 9 bond coat/substrate systems intersects with the tie line in the γ + γ′ binary region and the equilibrium phase fraction of No. 1 at 1373 K is 75.7% γ′ and 24.3% γ, while that for 1473 K is 42.4% γ′ and 57.6% γ. According to the thermodynamic calculation results based on the thermodynamic database of the Ni–Al–Cr system, the initial composition of No. 1 (Ni–18at.%Al–12at.%Cr/Ni–19at.%Al–5at.%Cr) corresponds to the equilibrium Al phase concentration: for bond coat, 20.8664 at.% Al in γ′ phase and 14.1416 at.% Al in γ phase; for substrate, 20.7580 at.% Al in γ′ phase and 13.9087 at.% Al in γ phase. The initial composition of No. 9 (Ni–20at.%Al–4at.%Cr/Ni–18at.%Al–12at.%Cr) corresponds to the equilibrium Al phase concentration: for bond coat, 21.0154 at.% Al in γ′ phase and 14.2065 at.% Al in γ phase; for substrate, 20.8664 at.% Al in γ′ phase and 14.1416 at.% Al in γ phase. For these two diffusion couples, the equilibrium Al concentrations of γ′ and γ phases in bond coat are all slightly higher than those in the substrate, thus the initial composition distribution in the phase diagram determines their diffusion path may go through the polycrystalline γ′ single phase region, and there will be a polycrystalline structure formation around the interface. That is the reason why the concentration behavior structure feature of samples No. 1 and 9 are similar. The composition distribution of Al and Cr shown in Figure 6 at 880,000 s along the line scan in the diffusion couple further verifies the above microstructure feature.
● Structure Type 3
The common characteristic of No. 3 and 4 bond coat/substrate systems lies in the fact that the equilibrium aluminum concentrations of γ′ and γ phases in the bond coat are all lower than those in the substrate, but the discrepancy is too small and thus can be negligible. Due to the similar structures for No. 3 and 4, the microstructure evolution of No. 3 diffusion couple during the interdiffusion process at 1373 K and with an effect of temperature gradient are presented in Figure 7a,b. There is no γ′ polycrystalline structure around interface, accompanied with a slight grain growth in the bond coat. It presents with a similar phenomenon to the previous structure types under the conditions of the temperature gradient. Whereas an obvious layered degradation phenomenon appears, in which the γ single phase region forms both in high temperature region area and near the interface, the similar phenomenon around the interface has also been observed in the experimental Pt-modified γ′ + γ bond coat [5,6]. The recession distance increases along with interdiffusion. The average composition line of No. 3 and 4 bond coat/substrate systems intersects with the tie line in the γ + γ′ binary region and the equilibrium phase fraction of No. 3 at 1373 K is 71.1% γ′ and 28.9% γ, while that for 1473 K is 33.7% γ′ and 66.3% γ. As shown in Figure 8., the composition distribution of Al and Cr in No. 3 γ + γ′/γ + γ′ bond coat/substrate system (Ni–20at.%Al–8at.%Cr/Ni–18at.%Al–12at.%Cr) annealed Figure 8a at 1373 K and Figure 8b with an effect of temperature gradient ΔG = 5000 K/cm at 510,000 s has been presented, which demonstrates the previous layered degradation microstructure feature in Figure 7, the γ single phase region with low Al concentration forms both in the high temperature region and near the interface with an effect of temperature gradient.
● Structure Types 4 and 5
The composition feature of No. 7 is similar to those of No. 3 and 4, while composition feature of No. 8 is similar to those of No. 1 and 2. As shown in Figure 9, the dissolution of γ′ phases in high temperature regions with the effect of the temperature gradient is similar to the previous ones. However, when annealed at a constant temperature, except for the γ′ polycrystalline structure around interface, a distinct phenomenon occurs; the recession of γ′ phases for No. 7 appears at the bottom of substrate, while that for No. 8 appears at the top of bond coat, which suggests a huge difference in phase fraction of the γ′ between the bond coat and substrate may lead to fast failure of the bond coat or substrate structure even when operating at a constant temperature. The temperature gradient will aggravate this destruction process. The composition distribution of Al and Cr in No. 7 and 8 bond coat/substrate system annealed at 1373 K and with an effect of temperature gradient ΔG = 5000 K/cm at 790,000 s and 600,000 s are shown in Figure 10. An obvious concentration gradient for both Al and Cr corresponding to the microstructure evolution feature in the two different bond coat/substrate systems has been further indicated more clearly.

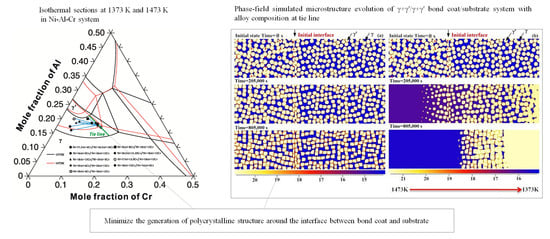
4.1.1. Cohesiveness Property

As mentioned above, the failure of cohesiveness property may originate from the two reasons; (i) phase transformation stress, stemming from the local variation of the volume, density and elastic modulus; and (ii) thermal stress caused by the temperature gradient, i.e., temperature difference, and thermal expansion. Therefore, the analysis of the cohesiveness property can be investigated based on the microstructure evolution. According to a comprehensive analysis about the simulation results in Figure 3, Figure 4, Figure 5, Figure 6, Figure 7, Figure 8, Figure 9 and Figure 10, because no difference exits in bond coat thickness, the characteristics of microstructure evolution are similar, indicating that alloy composition and interdiffusion microstructure follow a certain regularity, i.e., when the equilibrium aluminum concentrations of γ′ and γ phases in bond coat are all dramatically higher or lower than those in substrate, i.e., there exists significant concentration gradient, the γ′ polycrystalline structure will form in the vicinity of the interdiffusion interface along with extension to both sides simultaneously annealed at constant temperature. The initial mechanical engagement then transforms into a metallurgical bonding state. Whereas, the grain boundary is a rapid diffusion channel with a high density of defects, which is more easily oxidized. Therefore, intergranular fracture and crack propagation are usually inclined to generate in the polycrystalline structure. When the equilibrium Al concentrations of γ′ and γ phases in bond coat are identical or close to that in substrate, i.e., the concentration gradient is negligible, the feature of the microstructure evolution is shown in Figure 3. Grains of the γ′ phase become more cubical and form raft structures along with interdiffusion under the effect of coherent strain. The grain spacing is also appropriate, and thus the creep resistance and alloy performance are relatively good. With an effect of temperature gradient, the dissolution of γ′ phases in high temperature region is the common phenomenon. Destruction of the γ/γ′ precipitation strengthening structure is serious, i.e., that the creep resistance decreases. The layered degradation phenomenon in No. 3, 4, 7 and 9 systems is observed, in which the γ single phase area with low Al concentration appears in both interface and high temperature regions. Such phenomenon retards the degradation process. The common features of No. 3, 4, 7 and 9 systems lie in that equilibrium γ′ phase fractions in bond coat at target temperature are all slightly higher than those of substrate. Thus it can be concluded that the layered degradation phenomenon under the effect of temperature gradient is determined by the higher γ′ phase fraction in bond coat than that in substrate.
To summarize, the alloy compositions with which the equilibrium Al concentrations of γ′ and γ phases in bond coat are identical or close to those in substrate are more preferable, which can minimize the generation of polycrystalline structure. Meanwhile, the γ′ phase fraction in the bond coat should be higher than that in substrate to reduce the thermal shock due to the effect of the temperature gradient (layered degradation structure). Thus, alloy composition falling in between structure type 1 (No. 5) and structure type 3 (No. 3) is preferential for improving the cohesiveness property.

4.1.2. Preserved Property of Al

The failure of the Al preserved property is mainly caused by the depletion of Al concentration in the bond coat, which cannot ensure the stability and durability of the TGO scale. Therefore, the Al preserved property can be analyzed based on the surface average Al concentration profile in the bond coat. To avoid contingency factor of a single point, the surface Al concentration in bond coat is subject to the average value of evenly spaced points in bond coat (as shown in Figure 3, Figure 5 and Figure 7), 5 × 5 = 25 points. No. 1, 2, 3, 5 and 7 diffusion couples were chosen to plot the average surface concentrations profile of component Al. As shown in Figure 11a,b, the surface Al concentrations profile in the bond coat varies gently, and there is no significant distinction among different systems. While Al concentrations decrease rapidly with the effect of the temperature gradient, the drop rate of No. 1 and 2 (structure type 2) is largest and levels off first. No. 3 and 7 have the similar drop rates. The curve slope of No. 5 declines most slowly. As shown in Figure 12, the recession distances of γ′ phase after interdiffusion for 485,000 s with an effect of temperature gradient for different types are shown. As can be seen, No. 3 (structure type 3) is shortest (35 μm) due to the largest γ′ phase fraction in bond coat. No. 2 (67 μm) and No. 5 (75 μm) come second, and the degradation of structure type 4 (90 μm) is fastest. Therefore, the Al preserved property of No. 3 and 5 are superior to those of No. 1 and 7.
Above all, considering the effect of alloy composition on the Al preserved property, the same conclusion is obtained, the alloy composition falls in between structure type 1 (No. 5) and structure type 3 (No. 3) is preferential.

4.2. Effect of Bond Coat Thickness

The thickness of the bond coat has direct impacts on the average alloy composition of the entire bond coat/substrate system, and thus affects the interdiffusion microstructure. Therefore, three sets of bond coat thickness (12 μm, 40 μm, 80 μm) are employed in the present simulations to study its effect on the cohesiveness and Al preserved property of the bond coat. The thickness of the substrate is uniformly set as 120 μm, so the corresponding ratio of the bond coat to substrate is 1/10, 1/3, 2/3, respectively, where 1/10 corresponds to the industrial case (appropriately 150 μm:1500 μm).
Two typical structure types described above, i.e., No. 3 and 9, are chosen to investigate the effect of the bond coat thickness on the interdiffusion microstructure. As shown in Figure 13 and Figure 14, the bond coat/substrate systems with different thicknesses have similar microstructure evolution characteristics. There is no polycrystalline structure formation in the vicinity of the interface for the No. 3 bond coat/substrate system at 1373 K due to the similar equilibrium aluminum concentration of the γ′ and γ phases in the bond coat and substrate. While for the No. 9 bond coat/substrate system, the equilibrium aluminum concentrations of the γ′ and γ phases in the bond coat are all slightly higher than those in the substrate, consequently, the large concentration gradient contributes to the polycrystalline structure around the interface accompanied with extension into the bond coat. It should be noted that the width of the polycrystalline region ascends as the thickness increases. In contrast, the effects of the temperature gradient is a significant and general phenomenon, irrespective of the bond coat thickness, and can be observed, i.e., the γ′ phase dissolves in high temperature regions and the polycrystalline structure forms at the bottom of substrate. In addition, there is an obvious layered degradation phenomenon around the interface in the No. 9 system. Both simulation results demonstrate that the degradation rate of γ′ phases in bond coat decreases as the bond coat thickness increases.
From the perspective of cohesiveness, the thickness of the bond coat should be mediate, as a thicker bond coat results in large amounts of polycrystalline structure, which is inclined to stress concentration. The thinner bond coat is irresistible to thermal shock, i.e., the bond coat wears off rapidly.
In order to make a comparison among the bond coats with various thickness, the average surface aluminum concentrations in bond coat with different thicknesses under an effect of the temperature gradient (ΔG = 5000 K/cm) are also shown in Figure 15 (5 × 5 = 25 points for 80 μm, 5 × 2 = 10 points for 40 μm, 5 points for 12 μm). As indicated in Figure 15a,b, the surface aluminum concentration profiles of No. 3 and 9 bond coat/substrate systems present similar features. The drop rate of surface Al concentration with thickness as 40 μm is the lowest for both No. 3 and 9 systems. While the recession distance of γ′ phases in substrate after interdiffusion for 210,000 s is inversely proportional to the bond coat thickness in Figure 16.

4.3. Design of γ/γ′ Bond Coat Based on a Semi-Quantitative Structure–Property Relationship

The conclusions drawn from the present work can be generalized for the practical case: When designing the alloy composition of bond coat, one should make sure accordingly that the equilibrium aluminum concentrations of the γ′ and γ phases in the bond coat at a target temperature are identical or close to those in substrate as much as possible, i.e., that the concentration gradient should be controlled to be as small as possible. This can reduce the generation of the polycrystalline structure. Meanwhile, the γ′ phase fraction in the bond coat at target temperatures should be higher than that in the substrate, thus slowing the effect of thermal shock from the temperature gradient.
While multi-component Ni-based superalloys are usually selected as a substrate in industrial conditions, the composition of γ + γ′ bond coat is primarily made up of NiCrAlPt. A good compatibility between top coat and substrate should be maintained. It is difficult to apply the above conclusion to the industrial case directly because superalloys usually consist of more than eight elements. As the equilibrium aluminum composition may locate in the single-phase region of the ternary phase diagram for the bond coat system. There exists a huge composition gradient across the whole system, which can explain the polycrystalline structure observed in most of the reported experiments during the interdiffusion process.
Considering that the Ni-based superalloys are usually complex multicomponent systems, the refractory elements, such as W, Mo and Re etc., may contribute to the formation of detrimental TCP (topologically close-packed) precipitates around the interface region, which makes the failure conditions much more complicated. Thus, in order to give a preliminary qualitative evaluation based on the present work, a simplification that the effect of other phases (TCP phases) and components are not considered in the design of the bond coat is made. According to the previous analysis, the preferential alloy composition in the bond coat and substrate should be along the same tie line, we assume the pending alloy composition in bond coat as y Bond Coat ele 1 , y Bond Coat ele 2 , y Bond Coat ele 3 ……, the known alloy composition in the substrate as x Substrate ele 1 , x Substrate ele 2 , x Substrate ele 3 ……, the equilibrium element composition in γ and γ′ phases calculated based on the composition in the substrate are x γ ele 1 , x γ ele 1 , x γ ele 2 , x γ ele 2 , x γ ele 3 , x γ ele 3 ,……, equilibrium phase fraction in bond coat and substrate are f γ Bond Coat , f γ Bond Coat , f γ Substrate and f γ Substrate , then the following Equation (10) and constraint conditions should be satisfied:
f γ Bond Coat = y Bond Coat ele 1 x γ ele 1 x γ ele 1 x γ ele 1 = y Bond Coat ele 2 x γ ele 2 x γ ele 2 x γ ele 2 = y Bond Coat ele 3 x γ ele 3 x γ ele 3 x γ ele 3 s.t. { f γ Bond Coat f γ Substrate y Bond Coat ele 1 x γ ele 1 x γ ele 1 x γ ele 1 x Substrate ele 1 x γ ele 1 x γ ele 1 x γ ele 1 f γ Bond Coat f γ Substrate y Bond Coat ele 2 x γ ele 2 x γ ele 2 x γ ele 2 x Substrate ele 2 x γ ele 2 x γ ele 2 x γ ele 2   f γ Bond Coat f γ Substrate y Bond Coat ele 3 x γ ele 3 x γ ele 3 x γ ele 3 x Substrate ele 3 x γ ele 3 x γ ele 3 x γ ele 3   x γ ele 1 y Bond Coat ele 1 x γ ele 1 x γ ele 2 y Bond Coat ele 2 x γ ele 2 x γ ele 3 y Bond Coat ele 3 x γ ele 3  
Thereby, alloy composition of bond coat can be obtained through a rough estimation according to above Equation (10).
In summary of the above comprehensive analysis, a preliminary conclusion can be drawn as follows:
  • The optimal alloy composition of the bond coat can be chosen by means of a semi-quantitative design for the bond coat/substrate system with the identical elements.
  • For the second case, the elements in the bond coat are less than those in the substrate alloys, the above tie line method is not applicable, but the γ′ phase fraction in the bond coat should be higher than that in the substrate.
  • Besides considering the weight of turbine blades and stress conditions, the thickness of the bond coat should be thick enough to lower destruction from the temperature gradient.

5. Conclusions

  • A group of 2-D phase field simulations coupled with CALPHAD-type databases were performed to investigate the γ + γ′ Ni–Al–Cr mode bond coat/substrate systems, aiming to investigate the influence of the alloy composition, bond coat thickness and temperature gradient on the cohesiveness and aluminum preserved properties of the bond coat during the interdiffusion process at high temperatures.
  • A semi-quantitative tie-line selection criteria for alloy composition of the bond coat/substrate system is proposed, i.e., equilibrium Al concentrations of γ′ and γ phases in the bond coat should be similar to that in the substrate, and the phase fraction of γ′ in the bond coat tends to be higher than that in the substrate, so as to reduce the formation of polycrystal structures and thermal shock from the temperature gradient.
  • The present methods for studying the interdiffusion phenomenon in the Ni–Al–Cr bond coat-substrate system can be easily extended to the multicomponent industrial alloy system.

Author Contributions

Methodology, N.T. and L.Z.; Formal Analysis, N.T.; Investigation, N.T.; Writing—Original Draft Preparation, N.T.; Writing—Review and Editing, N.T., L.Z. and Y.D.; Supervision, L.Z. and Y.D.; Project Administration, N.T. and L.Z.; Funding Acquisition, N.T. and L.Z.

Funding

This research was funded by the Hunan Provincial Science and Technology Program of China—Huxiang Youth Talent Plan (No. 2017RS3002), the Youth Talent Project of Innovation-driven Plan at Central South University (No. 2019CX027), the Innovation Foundation for Postgraduate and Fundamental Research Funds of Central South University (No. 1053320171074).

Conflicts of Interest

The authors declare no conflict of interest.

References

  1. Padture, N.P.; Gell, M.; Jordan, E.H. Thermal barrier coatings for gas-turbine engine applications. Science 2002, 296, 280–284. [Google Scholar] [CrossRef] [PubMed]
  2. Smialek, J.L.; Lowell, C.E. Effects of diffusion on aluminum depletion and degradation of NiAl Coatings. J. Electrochem. Soc. 1974, 121, 800–805. [Google Scholar] [CrossRef]
  3. Le Vine, S.R. Reaction diffusion in the NiCrA1 and CoCrA1 system. Metall. Trans. A 1978, 9, 1237–1250. [Google Scholar] [CrossRef]
  4. Zhao, X.; Liu, J.; Rickerby, D.S.; Jones, R.J.; Xiao, P. Evolution of the interfacial toughness of thermal barrier system with a Pt-diffused γ + γ′ bond coat. Acta Mater. 2011, 59, 6401–6411. [Google Scholar] [CrossRef]
  5. Hayashi, S.; Wang, W.; Sordelet, D.J.; Gleeson, B. Interdiffusion behavior of Pt-modified γ-Ni + γ′-Ni3Al alloys coupled to Ni-Al-based alloys. Metall. Mater. Trans. A 2005, 36, 1769–1775. [Google Scholar] [CrossRef]
  6. Terock, M.; Fleischmann, E.; Hochmuth, C.; Völkl, R.; Glatzel, U. Synthesis and characterization of a Pt–Al–Cr–Ni γ/γ′-coating on the Ni-based superalloy CMSX-4. Surf. Coat. Technol. 2013, 236, 347–352. [Google Scholar] [CrossRef]
  7. Gleeson, B.; Wang, W.; Hayashi, S.; Sordelet, D.J. Effects of platinum on the interdiffusion and oxidation behavior of Ni-Al-based alloys. Mater. Sci. Forum 2004, 461, 213–222. [Google Scholar] [CrossRef]
  8. Nicholls, J.R. Advances in coating design for high-performance gas turbines. MRS Bull. 2003, 28, 659–670. [Google Scholar] [CrossRef]
  9. Kim, H.J.; Walter, M.E. Characterization of the degraded microstructures of a platinum aluminide coating. Mater. Sci. Eng. A 2003, 360, 7–17. [Google Scholar] [CrossRef]
  10. Xu, T.; Faulhaber, S.; Mercer, C.; Maloney, M.; Evans, A. Observations and analyses of failure mechanisms in thermal barrier systems with two phase bond coats based on NiCoCrAlY. Acta Mater. 2004, 52, 1439–1450. [Google Scholar] [CrossRef]
  11. Rangaraj, S.; Kokini, K. Fracture in single-layer zirconia (YSZ)-bond coat alloy (NiCoCrAlY) composite coatings under thermal shock. Acta Mater. 2004, 52, 455–465. [Google Scholar] [CrossRef]
  12. Alam, M.Z.; Parlikar, C.; Chatterjee, D.; Das, D.K. Comparative tensile behavior of freestanding γ-γ′ and β-(Ni,Pt)Al bond coats and effect on tensile properties of coated superalloy. Mater. Des. 2017, 114, 505–514. [Google Scholar] [CrossRef]
  13. Wang, B.; Gong, J.; Sun, C.; Huang, R.F.; Wen, L.S. The behavior of MCrAlY coatings on Ni3Al-base superalloy. Mater. Sci. Eng. A 2003, 357, 39–44. [Google Scholar] [CrossRef]
  14. Achar, D.R.G.; Munoz-Arroyo, R.; Singheiser, L.; Quadakkers, W.J. Modelling of phase equilibria in MCrAlY coating systems. Surf. Coat. Technol. 2004, 187, 272–283. [Google Scholar] [CrossRef]
  15. Liu, Y.Z.; Hu, X.B.; Zheng, S.J.; Zhu, Y.L.; Wei, H.; Ma, X.L. Microstructural evolution of the interface between NiCrAlY coating and superalloy during isothermal oxidation. Mater. Des. 2015, 80, 63–69. [Google Scholar] [CrossRef]
  16. Li, M.H.; Sun, X.F.; Hu, W.Y.; Guan, H.R. Thermal shock behavior of EB-PVD thermal barrier coatings. Surf. Coat. Technol. 2007, 201, 7387–7391. [Google Scholar] [CrossRef]
  17. Steinbach, I. Phase-field models in materials science. Model. Simul. Mater. Sci. Eng. 2009, 17, 073001. [Google Scholar] [CrossRef] [Green Version]
  18. Wang, Y.; Li, J. Phase field modeling of defects and deformation. Acta Mater. 2010, 58, 1212–1235. [Google Scholar] [CrossRef]
  19. Karma, A.; Tourret, D. Atomistic to continuum modeling of solidification microstructures. Curr. Opin. Solid State Mater. Sci. 2016, 20, 25–36. [Google Scholar] [CrossRef] [Green Version]
  20. Bellemans, I.; Moelans, N.; Verbeken, K. Phase-field modelling in extractive metallurgy. Crit. Rev. Solid State Mater. Sci. 2017, 1–38. [Google Scholar] [CrossRef]
  21. Steinbach, I.; Zhang, L.; Plapp, M. Phase-field model with finite interface dissipation. Acta Mater. 2012, 60, 2689–2701. [Google Scholar] [CrossRef]
  22. Zhang, L.; Steinbach, I. Phase-field model with finite interface dissipation: Extension to multi-component multi-phase alloys. Acta Mater. 2012, 60, 2702–2710. [Google Scholar] [CrossRef]
  23. Wei, M.; Zhang, L.; Yang, M.; Li, K.; Liu, S.; Zhao, P.; Du, Y. Phase-field simulation of the solidified microstructure in a new commercial 6××× aluminum alloy ingot supported by experimental measurements. Int. J. Mater. Res. 2018, 109, 91–98. [Google Scholar] [CrossRef]
  24. Chang, K.; Chen, L.Q.; Krill, C.E.; Moelans, N. Effect of strong nonuniformity in grain boundary energy on 3-D grain growth behavior: A phase-field simulation study. Comput. Mater. Sci. 2017, 127, 67–77. [Google Scholar] [CrossRef]
  25. Britson, J.; Gao, P.; Pan, X.; Chen, L.Q. Phase field simulation of charged interface formation during ferroelectric switching. Acta Mater. 2016, 112, 285–294. [Google Scholar] [CrossRef] [Green Version]
  26. Zheng, Y.; Williams, R.E.A.; Wang, D.; Shi, R.; Nag, S.; Kami, P.; Sosa, J.M.; Banerjee, R.; Wang, Y.; Fraser, H.L. Role of ω phase in the formation of extremely refined intragranular α precipitates in metastable β-titanium alloys. Acta Mater. 2016, 103, 850–858. [Google Scholar] [CrossRef] [Green Version]
  27. Wang, Y.; Khachaturyan, A.G. Shape instability during precipitate growth in coherent solids. Acta Metall. Mater. 1995, 43, 1837–1857. [Google Scholar] [CrossRef]
  28. Zhu, J.Z.; Wang, T.; Ardell, A.J.; Zhou, S.H.; Liu, Z.K.; Chen, L.Q. Three-dimensional phase-field simulations of coarsening kinetics of γ′ particles in binary Ni-Al alloys. Acta Mater. 2004, 52, 2837–2845. [Google Scholar] [CrossRef]
  29. Wen, Y.H.; Wang, B.; Simmons, J.P.; Wang, Y. A phase-field model for heat treatment applications in Ni-based alloys. Acta Mater. 2006, 54, 2087–2099. [Google Scholar] [CrossRef]
  30. Warnken, N.; Ma, D.; Drevermann, A.; Reed, R.C.; Fries, S.G. Steinbach I. Phase-field modeling of as-cast microstructure evolution in nickel-based superalloys. Acta Mater. 2009, 57, 5862–5875. [Google Scholar] [CrossRef]
  31. Zhou, N.; Shen, C.; Mills, M.J.; Wang, Y. Contributions from elastic inhomogeneity and from plasticity to γ′ rafting in single-crystal Ni-Al. Acta Mater. 2008, 56, 6156–6173. [Google Scholar] [CrossRef]
  32. Ta, N.; Zhang, L.; Du, Y. Design of the precipitation process for Ni-Al alloys with optimal mechanical properties: A phase-field study. Metall. Mater. Trans. A 2014, 45, 1787–1802. [Google Scholar] [CrossRef]
  33. Cao, D.; Ta, N.; Zhang, L. Unit-cell design for two-dimensional phase-field simulation of microstructure evolution in single-crystal Ni-based superalloys during solidification. Prog. Nat. Sci. Mater. Sci. 2017, 27, 678–686. [Google Scholar] [CrossRef]
  34. Zhang, Y.; Wang, J.; Yang, Y.; Yang, G.; Zhou, Y. Phase field simulation of the effect of interaction among ordered domains on interdiffusion in Ni–Al–Cr alloys. Chin. Phys. B 2009, 18, 4407–4412. [Google Scholar]
  35. Wu, K.; Chen, S.; Zhang, F.; Chang, Y.A. Integrating CALPHAD into phase field simulations for practical applications. J. Phase Equilib. Diff. 2009, 30, 571–576. [Google Scholar] [CrossRef]
  36. Pan, X.; Zhou, N.; Morral, J.E.; Wang, Y. Microstructural stability in multi-alloy systems: Nanostructured two-phase, dual alloy multilayers. Acta Mater. 2010, 58, 4149–4159. [Google Scholar] [CrossRef]
  37. Wu, K.; Zhou, N.; Pan, X.; Morral, J.E.; Wang, Y. Multiphase Ni–Cr–Al diffusion couples: A comparison of phase field simulations with experimental data. Acta Mater. 2008, 56, 3854–3861. [Google Scholar] [CrossRef]
  38. Wu, K.; Chang, Y.A.; Wang, Y. Simulating interdiffusion microstructures in Ni–Cr–Al diffusion couples: A phase field approach coupled with calphad database. Scr. Mater. 2004, 50, 1145–1150. [Google Scholar] [CrossRef]
  39. Mohanty, R.R.; Sohn, Y.H. Phase-field investigation of multicomponent diffusion in single-phase and two-phase diffusion couples. J. Phase Equilib. Diff. 2006, 27, 676–683. [Google Scholar] [CrossRef]
  40. Mohanty, R.R.; Sohn, Y.H. Microstructural stability of fcc-γ + B2-β coatings on γ substrate in Ni–Cr–Al system—A phase field model study. Surf. Coat. Technol. 2008, 203, 407–412. [Google Scholar] [CrossRef]
  41. Qiao, X. Interdiffusion Microstructure in γ + β/γ + γ′ Diffusion Couples. Master Thesis, University of Connecticut, Storrs, CT, USA, 1998. [Google Scholar]
  42. Ta, N.; Zhang, L.; Tang, Y.; Chen, W.; Du, Y. Effect of temperature gradient on microstructure evolution in Ni-Al-Cr bond coat/substrate systems: A phase-field study. Surf. Coat. Technol. 2015, 261, 364–374. [Google Scholar] [CrossRef]
  43. Eiken, J.; Böttger, B.; Steinbach, I. Multiphase-field approach for multicomponent alloys with extrapolation scheme for numerical application. Phys. Rev. E 2006, 73, 066122. [Google Scholar] [CrossRef] [PubMed]
  44. Anderson, J.O.; Helander, T.; Höglund, L.; Shi, P.; Sundman, B. Thermo-Calc & DICTRA, computational tools for materials science. Calphad 2002, 26, 273–312. [Google Scholar]
  45. Borgenstam, A.; Engström, A.; Höglund, L. DICTRA, a tool for simulation of diffusional transformations in alloys. J. Phase Equilib. 2000, 21, 269. [Google Scholar] [CrossRef]
  46. Welcome to Micress®. Available online: http://web.micress.de (accessed on 19 November 2018).
  47. Thermodynamic Calculation Interface TQ-Interface V8.0; Thermo-Calc Software AB: Stockholm, Sweden, 2013; Available online: https://www.thermocalc.com/media/6030/tq8_usersguide.pdf.
  48. Huang, W.; Chang, Y.A. Thermodynamic properties of the Ni–Al–Cr system. Intermetallics 1999, 7, 863–874. [Google Scholar] [CrossRef]
  49. Engström, A.; Ågren, J. Assessment of diffusional mobilities in face-centered cubic Ni–Cr–Al alloys. Z. Metallkd 1996, 87, 2. [Google Scholar]
  50. Campbell, C.E. Assessment of the diffusion mobilites in the γ′ and B2 phases in the Ni–Al–Cr system. Acta Mater. 2008, 56, 4277–4290. [Google Scholar] [CrossRef]
  51. Kaptay, G. On the interfacial energy of coherent interfaces. Acta Mater. 2012, 60, 6804–6813. [Google Scholar] [CrossRef]
  52. Zhou, J.; Zhong, J.; Chen, L.; Zhang, L.; Du, Y.; Liu, Z.K.; Mayrhofer, P.H. Phase equilibria, thermodynamics and microstructure simulation of metastable spinodal decomposition in c–Ti1−xAlxN coatings. Calphad 2017, 56, 92–101. [Google Scholar] [CrossRef]
  53. Ul-Haq, I.; Booth, J.G. Magnetic and structural properties of Ni3Al based alloys. J. Magn. Magn. Mater. 1986, 62, 256–268. [Google Scholar] [CrossRef]
  54. Hornbogen, E.; Roth, M. Die verteilung kohärenter teilchen in nickellegierungen. Z. Metallkd 1967, 58, 842–855. [Google Scholar]
  55. Simmons, G.; Wang, H. Single Crystal Elastic Constants and Calculated Aggregate Properties: A Handbook; The MIT Press: Cambridge, MA, USA, 1971. [Google Scholar]
  56. Kim, D.E.; Shang, S.L.; Liu, Z.K. Effects of alloying elements on elastic properties of Ni3Al by first-principles calculations. Intermetallics 2010, 18, 1163–1171. [Google Scholar] [CrossRef]
Figure 1. Isothermal sections at 1373 and 1473 K in Ni-rich region of ternary Ni–Al–Cr system calculated according to the thermodynamic parameters reported by [48]. The initial alloy compositions for γ + γ′/γ + γ′ bond coat/substrate systems are appended in the figure, while the green line indicates the tie line of γ + γ′ two-phase region.
Coatings 08 00421 g001
Figure 2. Schematic diagram for the procedure, geometry and boundary conditions for the present phase-field simulation.
Coatings 08 00421 g002
Figure 3. Phase-field simulated microstructure evolution of No. 5 γ + γ′/γ + γ′ bond coat/substrate system (Ni–18.5at.%Al–11.25at.%Cr/Ni–18at.%Al–12at.%Cr) annealed (a) at 1373 K and (b) with an effect of temperature gradient ΔG = 5000 K/cm. The color bar scale indicates the mole fraction of Al in atom percent.
Coatings 08 00421 g003
Figure 4. Composition distribution of Al and Cr in No. 5 γ + γ′/γ + γ′ bond coat/substrate system (Ni–18.5at.%Al–11.25at.%Cr/Ni–18at.%Al–12at.%Cr) annealed (a) at 1373 K and (b) with an effect of temperature gradient ΔG = 5000 K/cm at 805,000 s.
Coatings 08 00421 g004
Figure 5. Phase-field simulated microstructure evolution of No. 1 γ + γ′/γ + γ′ bond coat/substrate system (Ni–18at.%Al–12at.%Cr/Ni–19at.%Al–5at.%Cr) annealed (a) at 1373 K and (b) with an effect of temperature gradient ΔG = 5000 K/cm. The color bar scale indicates the mole fraction of Al in atom percent.
Coatings 08 00421 g005
Figure 6. Composition distribution of Al and Cr in No. 1 γ + γ′/γ + γ′ bond coat/substrate system (Ni–18at.%Al–12at.%Cr/Ni–19at.%Al–5at.%Cr) annealed (a) at 1373 K and (b) with an effect of temperature gradient ΔG = 5000 K/cm at 880,000 s.
Coatings 08 00421 g006
Figure 7. Phase-field simulated microstructure evolution of No. 3 γ + γ′/γ + γ′ bond coat/substrate system (Ni–20at.%Al–8at.%Cr/Ni–18at.%Al–12at.%Cr) annealed (a) at 1373 K and (b) with an effect of temperature gradient ΔG = 5000 K/cm. The color bar scale indicates the mole fraction of Al in atom percent.
Coatings 08 00421 g007
Figure 8. Composition distribution of Al and Cr in No. 3 γ + γ′/γ + γ′ bond coat/substrate system (Ni–20at.%Al–8at.%Cr/Ni–18at.%Al–12at.%Cr) annealed (a) at 1373 K and (b) with an effect of temperature gradient ΔG = 5000 K/cm at 510,000 s.
Coatings 08 00421 g008
Figure 9. Phase-field simulated microstructure evolution of No. 7 γ + γ′/γ + γ′ bond coat/substrate system (Ni–18at.%Al–12at.%Cr/Ni–16at.%Al–5at.%Cr) annealed (a) at 1373 K and (b) with an effect of temperature gradient ΔG = 5000 K/cm; Phase-field simulated microstructure evolution of No. 8 γ + γ′/γ + γ′ bond coat/substrate system (Ni–16at.%Al–5at.%Cr/Ni–18at.%Al–12at.%Cr) annealed (c) at 1373 K and (d) with an effect of temperature gradient ΔG = 5000 K/cm. The color bar scale indicates the mole fraction of Al in atom percent.
Coatings 08 00421 g009
Figure 10. Composition distribution of Al and Cr in No. 7 γ + γ′/γ + γ′ bond coat/substrate system (Ni–18at.%Al–12at.%Cr/Ni–16at.%Al–5at.%Cr) annealed (a) at 1373 K and (b) with an effect of temperature gradient ΔG = 5000 K/cm at 790,000 s; Composition distribution of Al and Cr in No. 8 γ + γ′/γ + γ′ bond coat/substrate system (Ni–16at.%Al–5at.%Cr/Ni–18at.%Al–12at.%Cr) annealed (c) at 1373 K and (d) with an effect of temperature gradient ΔG = 5000 K/cm at 600,000 s.
Coatings 08 00421 g010
Figure 11. Surface Al concentration evolution of γ/γ′ bond coat annealed (a) at constant temperature (1373 K) and (b) with the effect of temperature gradient ΔG = 5000 K/cm.
Coatings 08 00421 g011
Figure 12. Recession distances of γ′ phase in different diffusion couple systems after interdiffusion for 485,000 s with the effect of temperature gradient.
Coatings 08 00421 g012
Figure 13. Interdiffusion microstructure evolution of No. 3 bond coat/substrate system (Ni–20at.%Al–4at.%Cr/Ni–18at.%Al–12at.%Cr) with different bond coat thickness at constant temperature 1373 K and with an effect of temperature gradient (ΔG = 5000 K/cm): (a) 12 μm, (b) 40 μm, and (c) 80 μm. The color bar scale indicates the mole fraction of Al in atom percent.
Coatings 08 00421 g013
Figure 14. Interdiffusion microstructure evolution of No. 9 bond coat/substrate system (Ni–20at.%Al–4at.%Cr/Ni–18at.%Al–12at.%Cr) with different bond coat thicknesses at constant temperature (1373 K) and with an effect of temperature gradient (ΔG = 5000 K/cm): (a) 12 μm, (b) 40 μm, and (c) 80 μm. The color bar scale indicates the mole fraction of Al in atom percent.
Coatings 08 00421 g014
Figure 15. Average surface concentration evolution of component Al for bond coat/substrate systems with different thickness with an effect of temperature gradient (ΔG = 5000 K/cm): (a) No. 3, and (b) No. 9.
Coatings 08 00421 g015
Figure 16. Recession distance of γ′ phase to substrate in bond coat/substrate system with different thickness with an effect of temperature gradient (ΔG = 5000 K/cm).
Coatings 08 00421 g016
Table 1. List of the constituents of γ + γ′/γ + γ′ bond coat/substrate systems at annealing temperature 1373 K, with temperature gradient 5000 K/cm in the present phase-field simulations.
No.Composition of Bond Coat (at.%)Composition of Substrate (at.%)
1Ni–18Al–12CrNi–19Al–5Cr
2Ni–17.3Al–4CrNi–18.5Al–10Cr
3Ni–20Al–8CrNi–18Al–12Cr
4Ni–19Al–6CrNi–18Al–12Cr
5Ni–18.5Al–11.25CrNi–18Al–12Cr
6Ni–17Al–13.5CrNi–18Al–12Cr
7Ni–18Al–12CrNi–16Al–5Cr
8Ni–16Al–5CrNi–18Al–12Cr
9Ni–20Al–4CrNi–18Al–12Cr
Table 2. Lattice parameters, molar volume and elastic constants adopted in the present simulations.
Phase PairLattice Constants (nm)Molar Volume (cm3/mol)Elastic Constants (GPa)References
C11C12C44
γ0.35526.7446261151132[53,55,56]
γ′0.35606.7906248.7155.2155.2[54,55,56]

