Article

Rheology and Screen-Printing Performance of Model Silver Pastes for Metallization of Si-Solar Cells

1
Group Applied Mechanics (AME), Institute for Mechanical Process Engineering and Mechanics, Karlsruhe Institute of Technology, 76131 Karlsruhe, Germany
2
Heraeus Deutschland GmbH & Co. KG, 63450 Hanau, Germany
*
Author to whom correspondence should be addressed.
Coatings 2018, 8(11), 406; https://doi.org/10.3390/coatings8110406
Submission received: 4 October 2018 / Revised: 30 October 2018 / Accepted: 14 November 2018 / Published: 15 November 2018

Abstract

:
Further strong growth of solar energy conversion based on PV (photovoltaic) technology requires constant improvement to increase solar cell efficiency. The challenge in front-side metallization of Si-solar cells is to print uniform fine lines with a high aspect ratio to achieve higher efficiencies simultaneously with a reduced consumption of raw materials. An in-depth understanding of the relationship between paste composition, rheology and screen-printed line morphology is essential. Three model pastes with similar silver content and corresponding vehicles differing in their thixotropic agent content were investigated. Rheological properties (yield stress, viscosity, wall slip velocity, structural recovery, and fracture strain) were determined using steady and oscillatory shear, as well as elongational flow rheometry. Pastes were screen-printed at various speeds through a layout screen including line widths between 20 and 55 µm. Dried fingers were analyzed with respect to line width, aspect ratio (AR) and cross-sectional area. Our investigations reveal that minor changes of thixotropic agent result in substantial variations of the paste’s flow properties. However, this only weakly affects the line morphology. Irrespective of printing speed or finger opening, AR is slightly increasing; i.e., the screen-printing process is robust against changes in paste rheology.

1. Introduction

Screen-printing is a traditional and versatile printing method [1,2]. It is well established, not only in textile or poster printing, but also in the fabrication of all kinds of electronic devices, such as printed circuit boards [3,4], thin film transistors [5], displays, touch panels [6], low temperature co-fired ceramic devices [7,8], and photovoltaic cells [9,10]. Screen-printing is easy to implement and allows for high through-put, and is thus economically attractive for high-volume products like silicon (Si) solar cells. Today, essentially all commercial Si-solar cells are metallized via screen-printing [11] and this technology was one of the key factors enabling recent improvements in efficiency. A further substantial increase of solar energy conversion is required to meet increasing global electric power demand, as well as the challenges of climate change. However, about 7.5% of global silver production is currently employed in the metallization of solar cells [12]. A constant, significant reduction of silver consumption per wafer is necessary for a further expansion of PV installation. This drives perpetual efforts to decrease the width and increase the aspect ratio and uniformity of the finger lines making up the front contacts of Si-solar cells, aiming at higher cell efficiency and lower silver consumption [13]. Besides an optimized wafer surface treatment, adapted printing parameters and an appropriate screen design, this requires a carefully adjusted silver paste formulation. Two key features, namely, the wetting and the flow properties of the paste, are decisive to achieve high-performance printed fingers. From flooding of the screen to snap-off of the screen from the wafer and drying of the printed features, the paste is exposed to complex loads, including a broad range of shear rates and stresses. In addition, resistance to elongational deformation during snap-off, structural recovery after being squeezed through the screen openings, and slip at the boundaries of these openings, also have to be considered [14,15,16,17,18,19,20,21,22,23]. Rheological characterization of up-to-date commercial silver pastes for front-side metallization is a particular challenge. Rheological measurements are limited by wall slip and shear banding phenomena, and sample spill is strongly dependent on the employed experimental set up, and particularly on the surface energy and roughness of the sample fixtures, and the details of the experimental protocol. Recently, we have presented detailed experimental protocols allowing for a meaningful, comprehensive characterization of paste flow properties addressing all of the aspects mentioned above [24]. Silver pastes for solar cell metallization consist of silver particles, which finally provide the conductivity of the printed and sintered structures, as well as glass frits opening the passivation layer during sintering [25]. The particles are usually suspended in a mixture of organic solvents and so-called thixotropic agents, with binders added as polymeric, non-volatile organic ingredients to control the flow behavior of the paste and to provide the appropriate cohesive and adhesive properties of the dry layer [17,26,27,28]. Hydrogenated castor oils and diamines are often used as thixotropic agents, whereas synthetic acrylate polymers or ethyl cellulose are frequently added as binders.
The flow properties of screen-printing silver pastes and concepts relating to the control of yield stress and shear thinning behavior via the above-mentioned polymeric additives have been discussed in various studies [27,28,29,30]. It is generally accepted that screen-printing pastes should exhibit a substantial degree of shear thinning [16,17].
A comprehensive rheological characterization of a commercial silver paste for front-side metallization of solar cells was provided by [16]. However, a direct comparison to printed electrode properties was not made. In [21], four commercial silver pastes characterized as suggested in [16] were used to develop screen design strategies for an optimized front-side metallization of solar cells. A thick emulsion over mesh (EOM) layer enabled printing of fingers with a high aspect ratio, whereas a thin EOM layer limited paste spreading. Differences in wetting properties among the pastes were not addressed in this study. Recently, the effect of paste rheology during the screen-printing process was directly investigated in a combined rheological and high-speed video imaging study [30]. Screen-printing ZnO pastes, including different types and concentrations of thixotropic agent and binder, on a glass substrate confirmed that the length of the pre-injection zone is inversely proportional to the yield stress, whereas the length of the cling zone was linearly related to the filament rupture strain. The printed electrode width turned out to be inversely proportional to the product of the yield stress and high shear viscosity. In this study, the spreading process was limited to a period of 100 ms after the squeegee had passed.
Two recent studies revealed that wall slip of silver pastes can have a significant impact on paste transfer and line shape [22,23]. A higher slip velocity resulted in a higher silver laydown and a higher aspect ratio of the printed lines, as well as in a narrower intersection of busbar and fingers. The gain of scientific insight in such studies trying to correlate paste rheology and printing performance is limited when pastes with different compositions, not only with respect to rheology but also in terms of their substrate wetting properties, are investigated [21,23].
Therefore, we choose a model system comprising silver particles, a mixture of organic solvent, and a thixotropic agent, as well as ethyl cellulose as binder. The silver content and the total amount of non-volatile organic additives were kept constant. The mixing ratio of thixotropic agent and binder, however, was varied in a certain, narrow range. This resulted in a substantial change of several rheological parameters, including yield stress, shear modulus, low shear viscosity, structural recovery and elongational fracture strain, without affecting the wetting behavior. Pastes were printed using a standard commercial lab-scale screen printer. A layout screen with finger opening width varying between 20 and 55 µm was used and different printing speeds (70–210 mm s−1) close to technical conditions were employed. The resulting finger lines were analyzed with respect to cross-sectional area, line width and height, as well as fluctuations of these quantities along the printed structures, allowing for a direct correlation to the above-mentioned rheological parameters.

2. Materials

Three model silver pastes (M1–M3) based on three corresponding vehicle formulations (V1–V3) were characterized in this study. All vehicles were made from the same organic solvent (a mixture of four parts diethylenglycoldibutylether and one part terpineol), thixotropic agent (Thixatrol Max), and organic binder (ethyl cellulose). They differed in their concentration ratio of Thixatrol Max (T-Max) and ethyl cellulose (EC) binder as shown in Table 1. Since these polymeric additives are not surface active [31] and their amount was varied only in a small range, we can safely assume that the surface tension and wetting behavior were similar for all investigated model systems. The changes in vehicle composition were in a range typical for commercial silver pastes.
Diethylenglycoldibutylether and terpineol were mixed and EC binder was dissolved using a tempered dissolver (DISPERMAT® LC, VMA-Getzmann GmbH, Reichshof, Germany) at 60 ± 10 °C until the solution became clear. After, T-Max was dissolved using the same equipment at 70 ± 10 °C.
Spherical silver particles with a mean diameter x50 = 1.5 µm, according to Fraunhofer diffraction, were dispersed in these vehicles at a concentration of 80 wt % to formulate printable silver pastes. A three-roll mill (EXAKT 80E, EXAKT Advanced Technologies GmbH, Norderstedt, Germany) and a non-contact planetary mixer (SpeedMixerTM, Hauschild GmbH, Hamm, Germany) were used to manufacture homogeneous pastes free of agglomerates as confirmed by the low fineness of grind value (FOG) ≈ 8 ± 2 µm. All vehicles and silver pastes were prepared by Heraeus Deutschland GmbH & Co. KG in Hanau, Germany as described above.

3. Experimental Methods

A series of rheological and screen-printing experiments were performed to correlate flow properties and screen-printing results of model vehicles (V1, V2, and V3) and model pastes (M1, M2, and M3). Experimental investigations were separated into two parts. The first consisted of the rheological investigations performed at the Institute for Mechanical Engineering and Mechanics at KIT (Karlsruhe Institute of Technology) in Karlsruhe, Germany. A thorough rheological characterization was performed, including steady and oscillatory rotational shear rheometry, capillary viscometry and filament stretching elongational rheometry, as described in [24]. Secondary flow effects, such as wall slip, shear banding and sample spillage, were carefully considered. The second part included printing tests of model pastes. We conducted screen-printing experiments with a half-automatic gadget at the laboratories of Heraeus Deutschland GmbH & Co. KG in Hanau, Germany. All experiments were conducted at 23 °C.

3.1. Rheological Measurements

Yield stress measurements were performed using a stress-controlled rheometer setup (Haake RS150, Thermo Fisher Scientific, Karlsruhe, Germany) equipped with a vane-and-cup fixture. We performed the measurements in a stepwise controlled stress mode. The shear stress was varied from 1 to 5000 Pa, in 41 steps, equally separated on a logarithmic scale, and each stress was applied for 30 s. Yield stress values were determined from the measured deformation using the tangent intersection point method [24,32,33].
A rotational rheometer with parallel-plate measuring system (Physica MCR501, Anton Paar Germany GmbH, Ostfildern, Germany) and a customized capillary rheometer (Göttfert Rheograph 2000, Göttfert Werkstoff-Prüfmaschinen GmbH, Buchen, Germany) were used for viscosity measurements to cover paste behavior at low and high shear rates. Choosing a plate roughness of Rq = 2–4 µm avoided wall slip effects and/or plug flow in the measuring gap by video imaging of the gap edge described in [24]. The measuring gap height was h = 1 mm and the plate diameter, dplate = 25 mm. Rotational rheometer measurements were taken using a stepwise controlled rate adjustment. The shear rate was varied from 0.01 to 1000 s−1 in 41 steps, equally separated on a logarithmic scale, and each shear rate was applied for 30 s. Capillary rheometry was undertaken using a capillary nozzle with diameter, dnozzle = 0.5 mm, and length, Lnozzle = 40 mm. The paste was filled into a feed reservoir with diameter, Dreservoir = 20 mm, and pushed through the nozzle at the center of the reservoir bottom at velocities between 0.05 and 20 mm s−1, corresponding to shear rates between 720 and 3 × 10⁵ s−1. The corresponding pressure drop was recorded using a 500-bar pressure transducer (Gefran Deutschland GmbH, Seligenstadt, Germany). Sample viscosity was calculated from this pressure drop and the corresponding flow rate. The Rabinowitsch–Weissenberg correction was performed to obtain true shear rates taking into account deviations from the parabolic flow profile in the nozzle [34].
Wall slip velocity was determined in a parallel-plate rheometer (Haake RS150). The measuring gap height was h = 1 mm and plate radius, r = 10 mm. A smooth upper plate (Rq = 1 µm) and a rough bottom plate (Rq = 9 µm) were used to assure that slip takes place at the upper plate and that the rest of the sample remained undeformed [22]. The slip velocity could then be calculated as vslip = 2πnr, where n is the rotational speed of the upper plate. Experiments were done at shear stresses between τ = 200 Pa and the yield stress τy of the respective paste.
Sample spillage is known to limit the shear rate range for flow curve measurements. Spillage shows up as a downward kink in apparent viscosity versus shear rate data, and the critical rotational speed for the onset of spillage was determined at various plate separations between 0.2 and 2 mm for plates with different roughness 1 µm < Rq < 9 µm.
Oscillatory shear experiments were conducted using a rotational rheometer (Physica MCR501) with a parallel-plate measuring system (dplate = 25 mm, Rq = 2–4 µm, h = 1 mm). Measurements with varying strain amplitude ( γ ^ = 0.001%–100%, in 35 steps, equally separated on a logarithmic scale) at constant frequency f = 1 Hz allowed for determination of the plateau modulus G0, defined as the value of the storage modulus G’ in the linear viscoelastic regime (LVE) where G’ and G’’ were independent of the strain amplitude, as well as for determination of the crossover-stress τ ^ c at which G’ = G’’, with the loss modulus G’’. The frequency dependence of G’ and G’’ was examined at constant amplitude γ ^ = 25% covering the frequency range f = 100–0.001 Hz in a downward mode.
Information about structural recovery of model vehicles and silver pastes was obtained from oscillatory time interval tests as described in [16,24]. The measurement protocol comprised three sections with different deformation, but constant frequency f = 1 Hz, to mimic the paste deformation during the screen-printing process. The deformation applied in Sections I and III was γ ^ = 0.05%, i.e., in the LVE regime, to represent the behavior during pre-print and at rest, after the paste was pushed through the finger opening. Measuring times were selected as 400 s for the first step and 20 min for the third recovery step. In Section II we applied the deformation γ ^ = 90% to simulate the paste transfer through the finger opening. This measurement period lasted for 150 s.
A capillary breakup elongation rheometer (CaBER) (HAAKE CaBER1, Thermo Fisher Scientific, Karlsruhe, Germany) was used to perform filament stretching experiments. Therefore, the measuring gap (height h0 = 1 mm) between two pistons (diameter dpiston = 6 mm) was filled with the sample, and the upper piston was moved from h0 = 1 mm to the end position hend = 16 mm, at constant stretching velocity vstretch = 110 mm s−1. A high-speed camera (Photron FastCam-X1024 PCI, Photon, Pfullingen, Germany) was used to record the change in filament shape at 250 fps during stretching. The filament breakage length hbreak and the fracture strain ε = (hbreakh0)/h0 were determined from corresponding video image sequences.

3.2. Screen-Printing Tests and Morphology Observation of Printed Electrodes

Screen-printing tests were performed with a half-automatic EKRA X1-SL screen printer (EKRA Screen Printing Technologies, ASYS Group, Dornstadt, Germany). A stainless-steel screen mesh (360 meshes per inch with a layout of about 50 µm down to 20 µm finger opening, 16 µm thread diameter and 13 µm emulsion over mesh (EOM) thickness) was used to perform printing tests. An RKS® squeegee (200 mm length) (RK Siebdrucktechnik GmbH, Rösrath, Germany) with a 65 shore hardness and forming a 60° angle with the screen was used for printing. The printing speed was varied between 70 and 210 mm s−1. Snap-off distance between the screen mesh and the substrate was fixed at hsnap-off = 1.5 mm. The monocrystalline (Cz) Si wafers were weighed before and after the printing process to determine the paste laydown on the substrate. In the final step, printed substrates were dried in a drying chamber at 150 °C for about 10 min.
The morphology of dried finger profiles obtained from 25, 30, and 50 µm finger line openings were examined with a 3D laser scanning microscopy (VK-X100 Laser Microscope, Keyence Deutschland GmbH, Neu-Isenburg, Germany). Therefore, we selected finger lines located at the same position on five different Si wafers for each paste and each finger line opening to assure that these fingers were printed through the same screen area. Self-programmed MATLAB-code (MATLAB R2017a) was used to characterize the finger width wf and finger height hf. The cross-sectional area Af of printed finger lines was calculated by integration of the finger profile perpendicular to the printing direction. The aspect ratio AR was given by AR = hfwf−1 The average and standard deviation values for these quantities were calculated from the respective data obtained for the five different wafers.

4. Results and Discussion

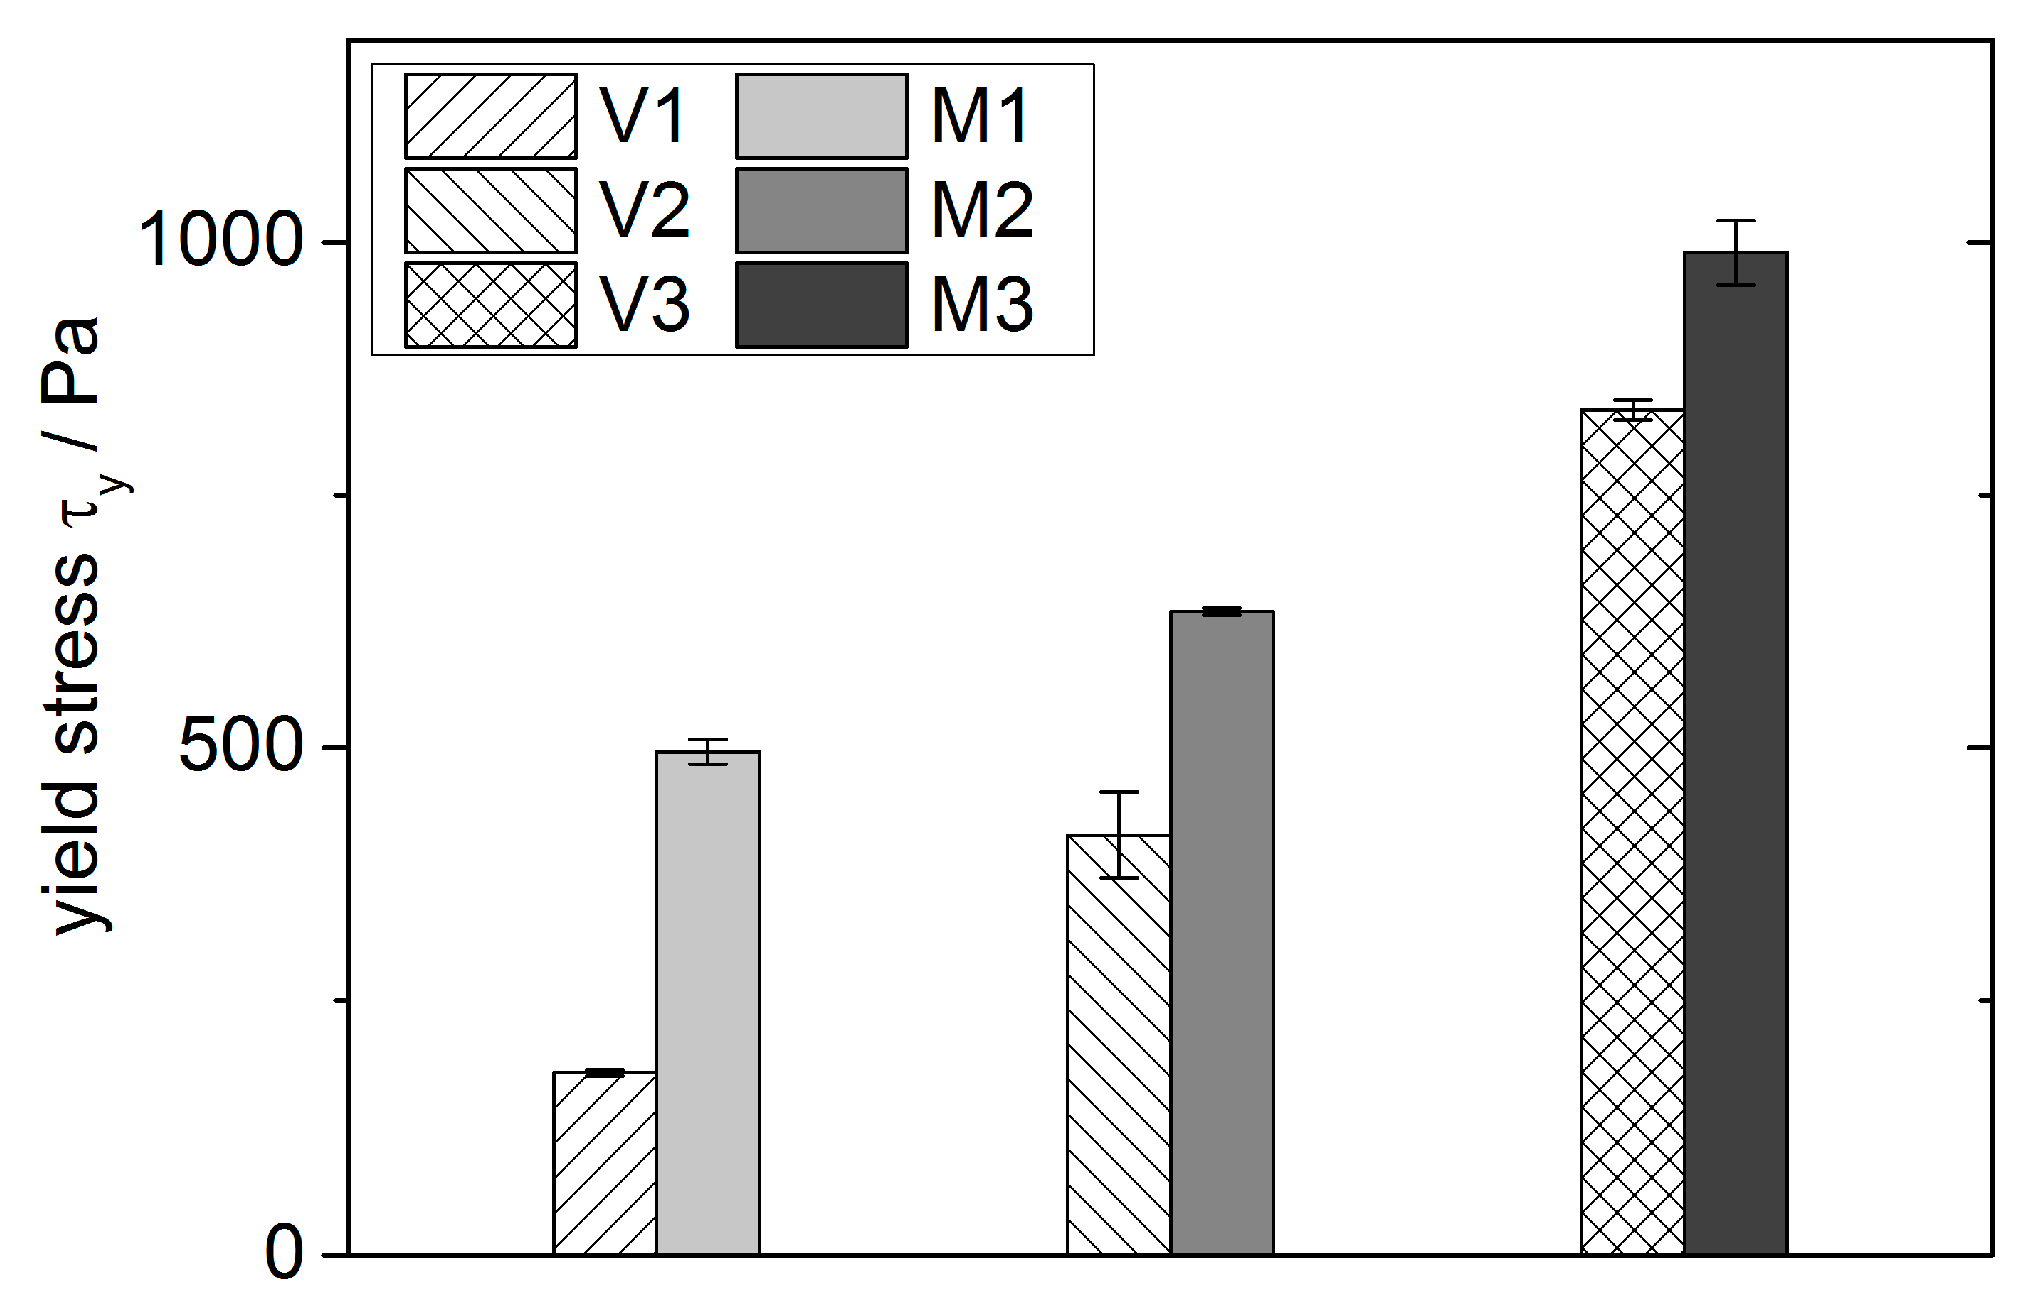
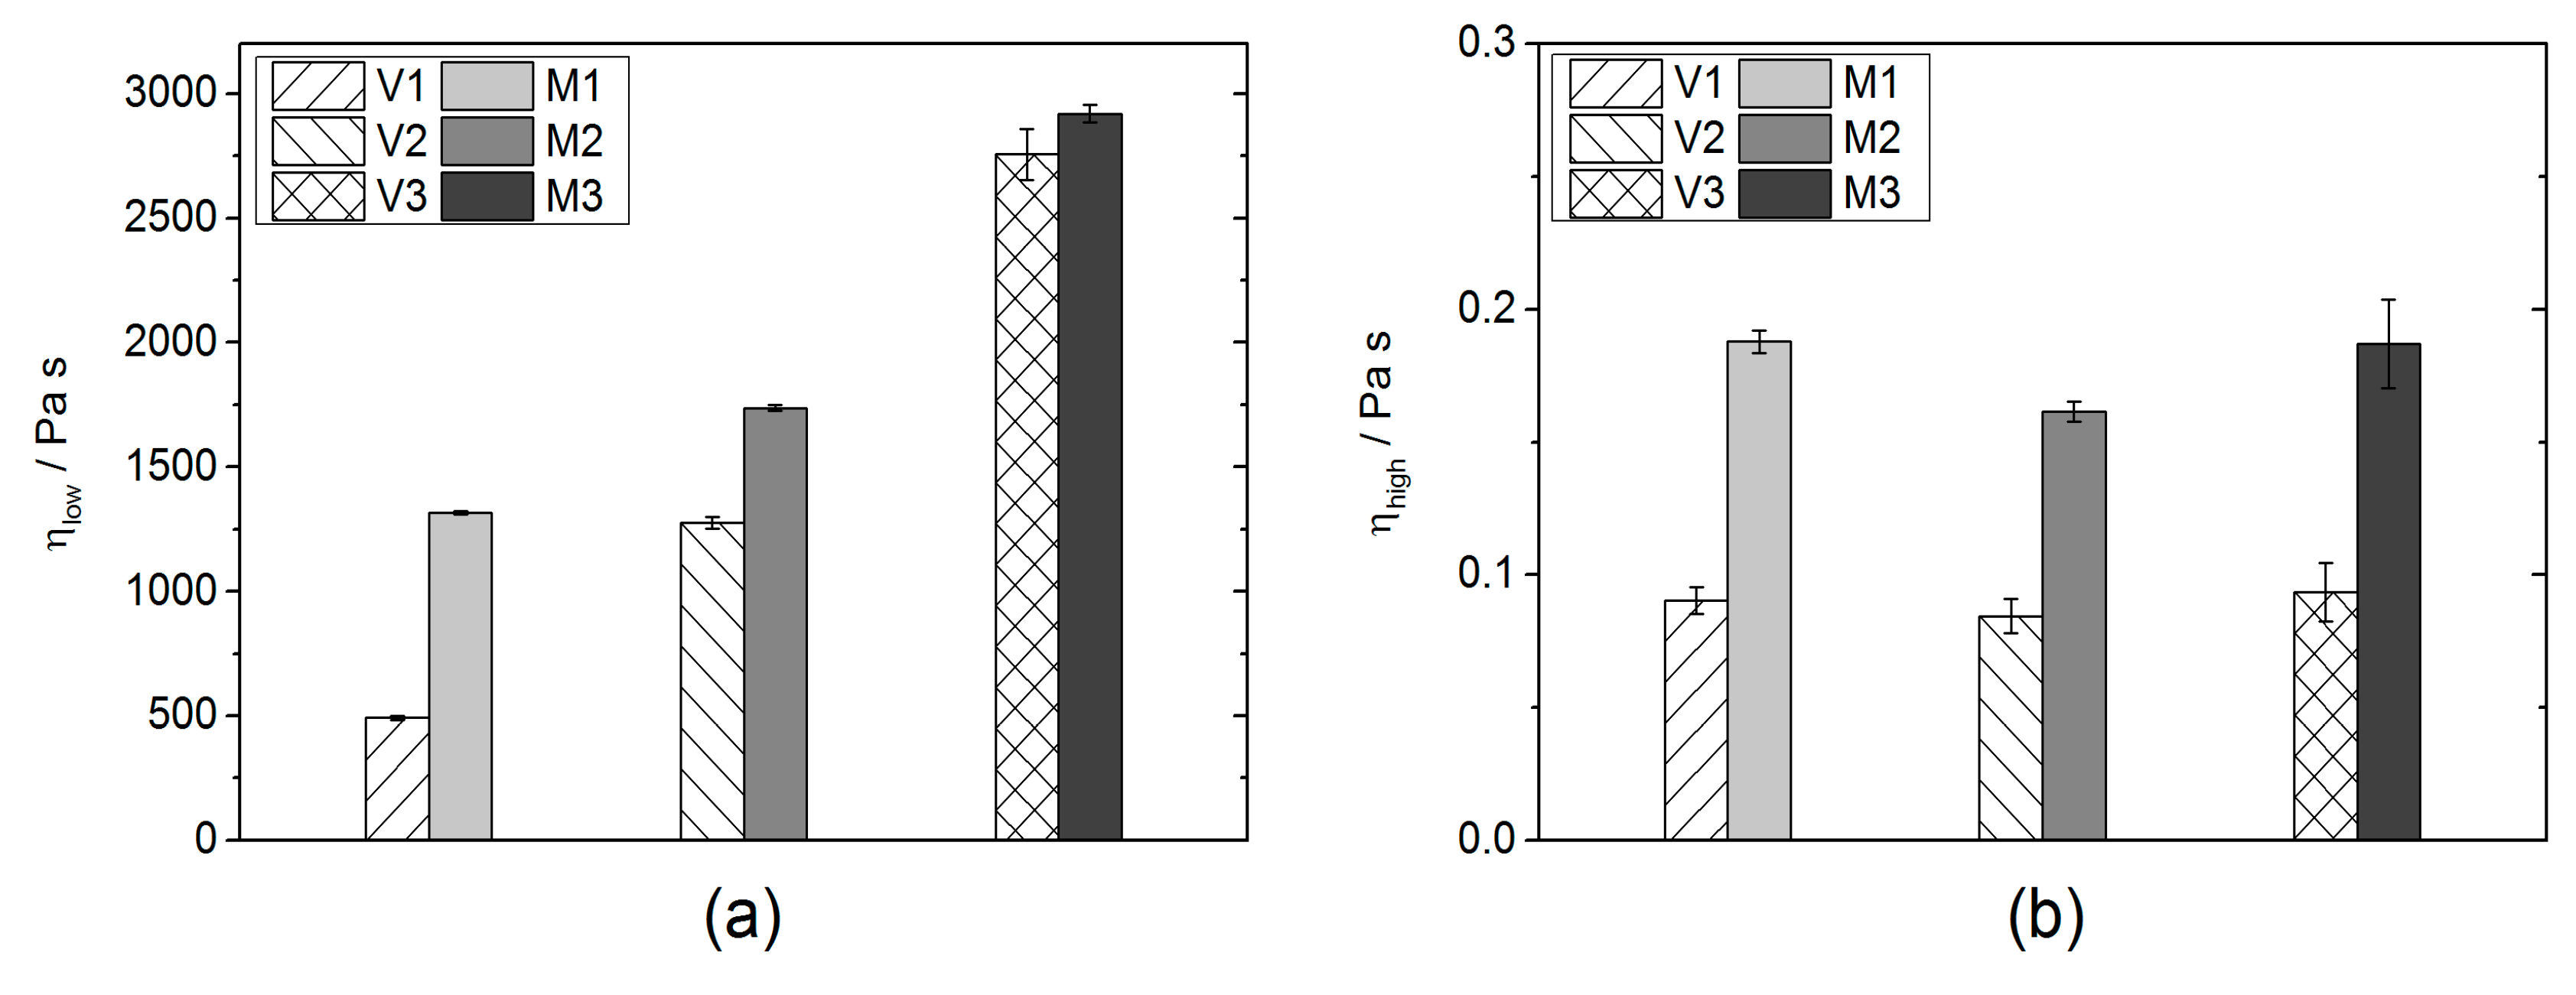
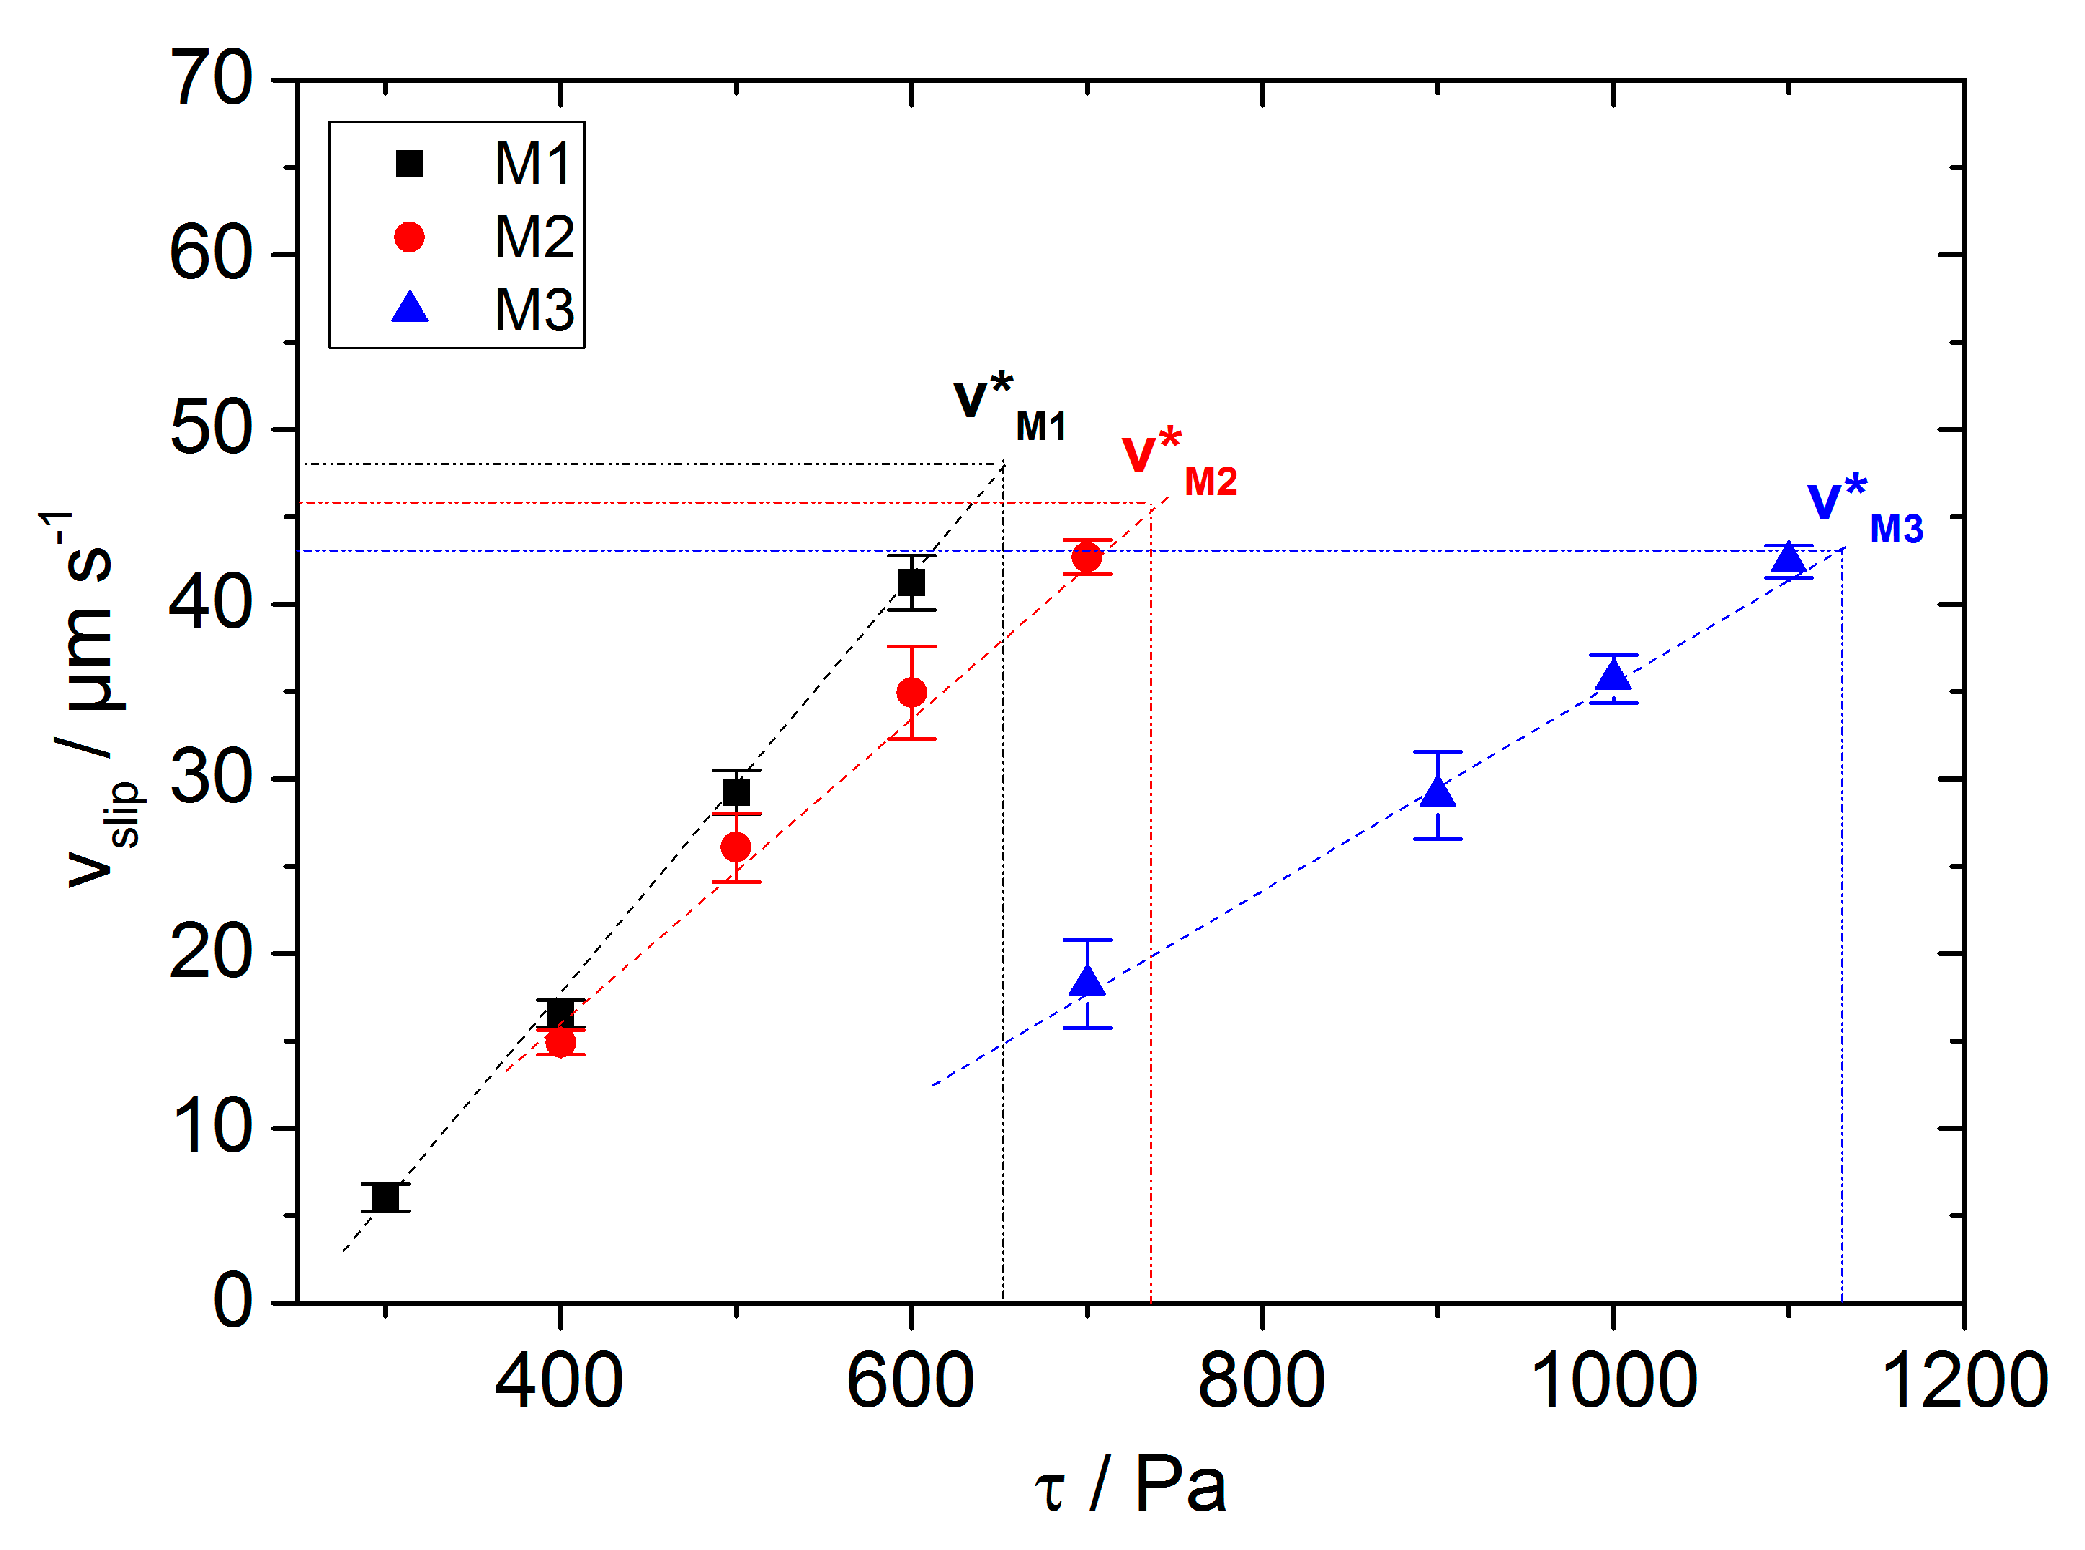
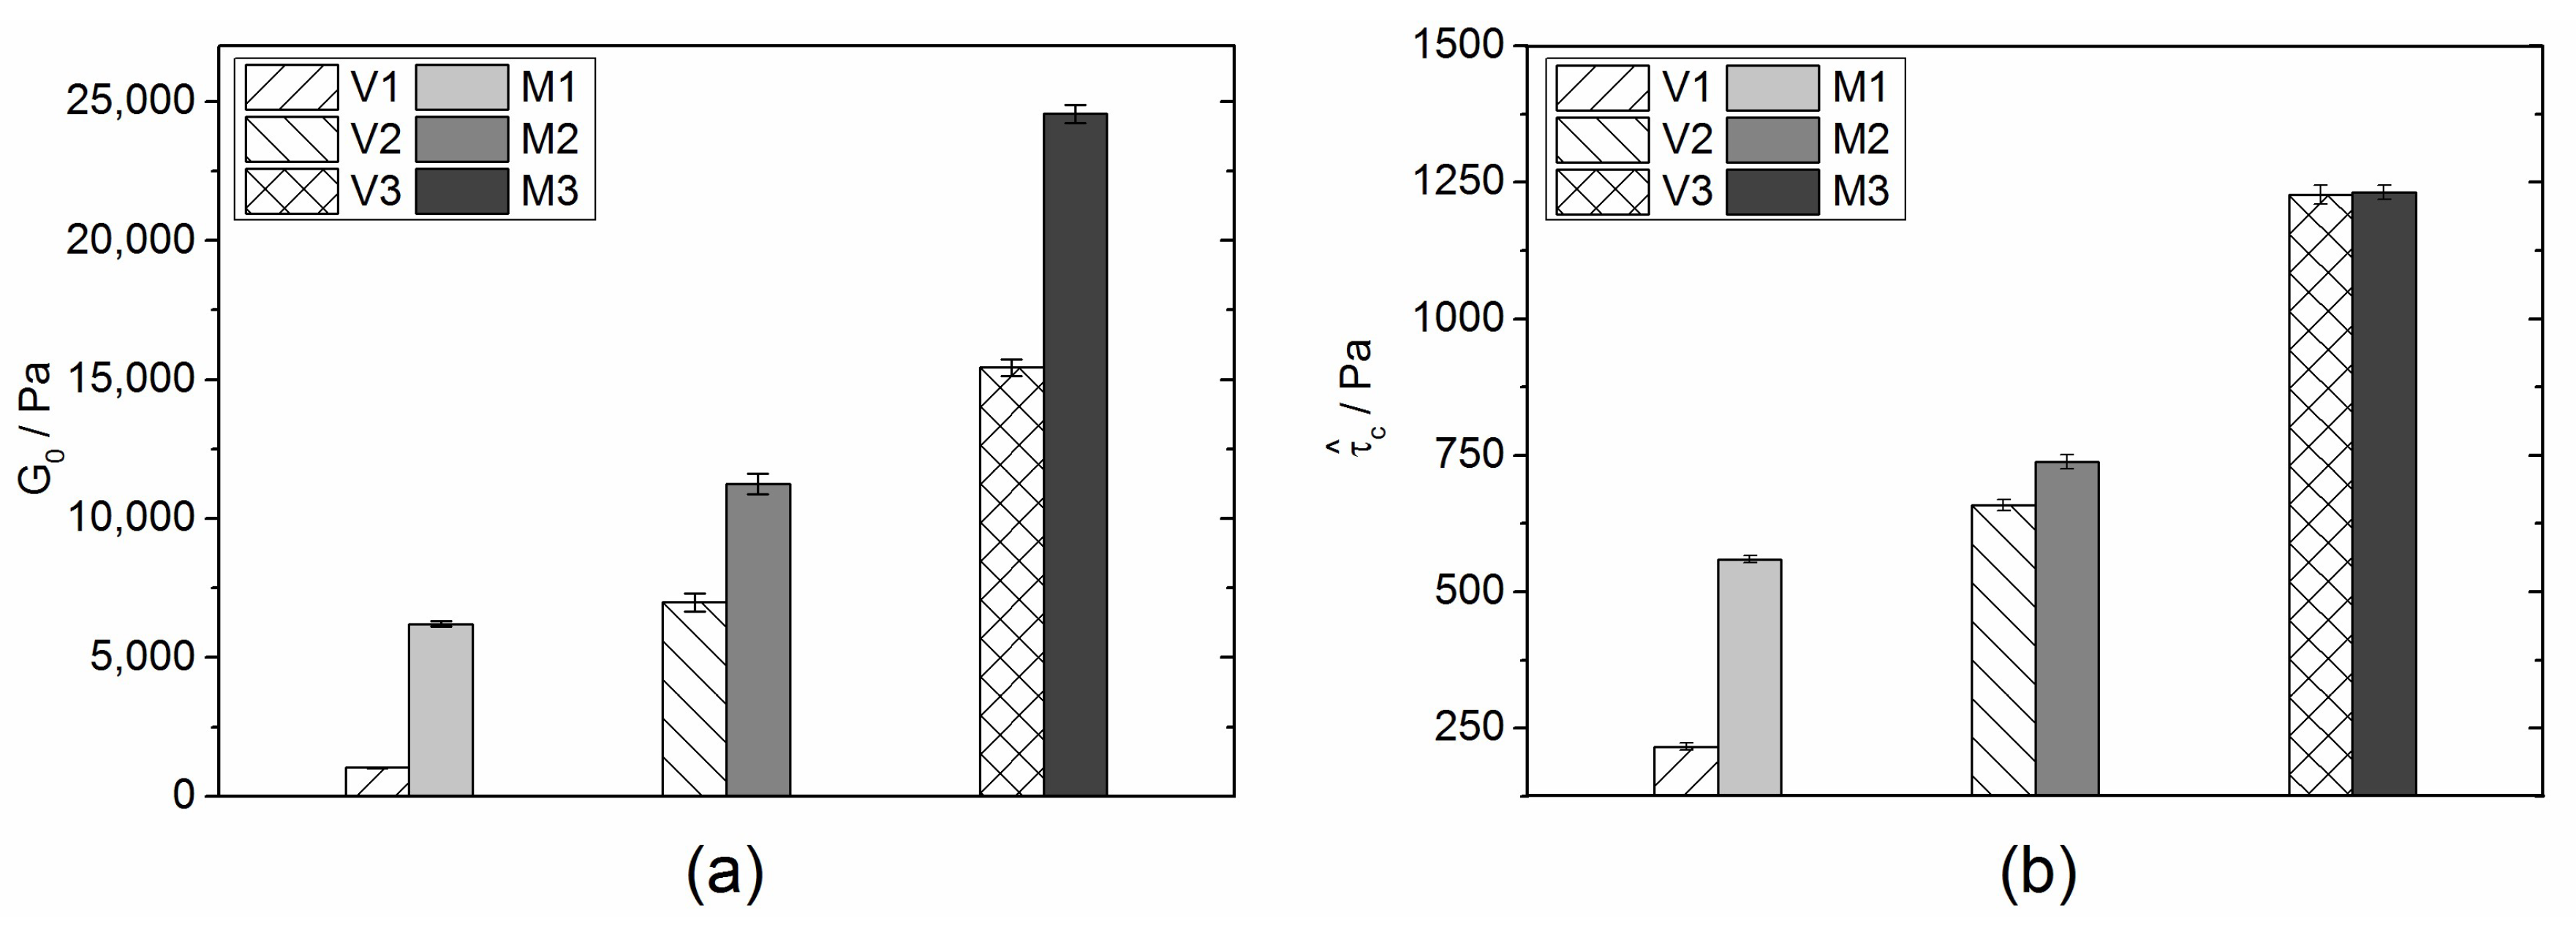
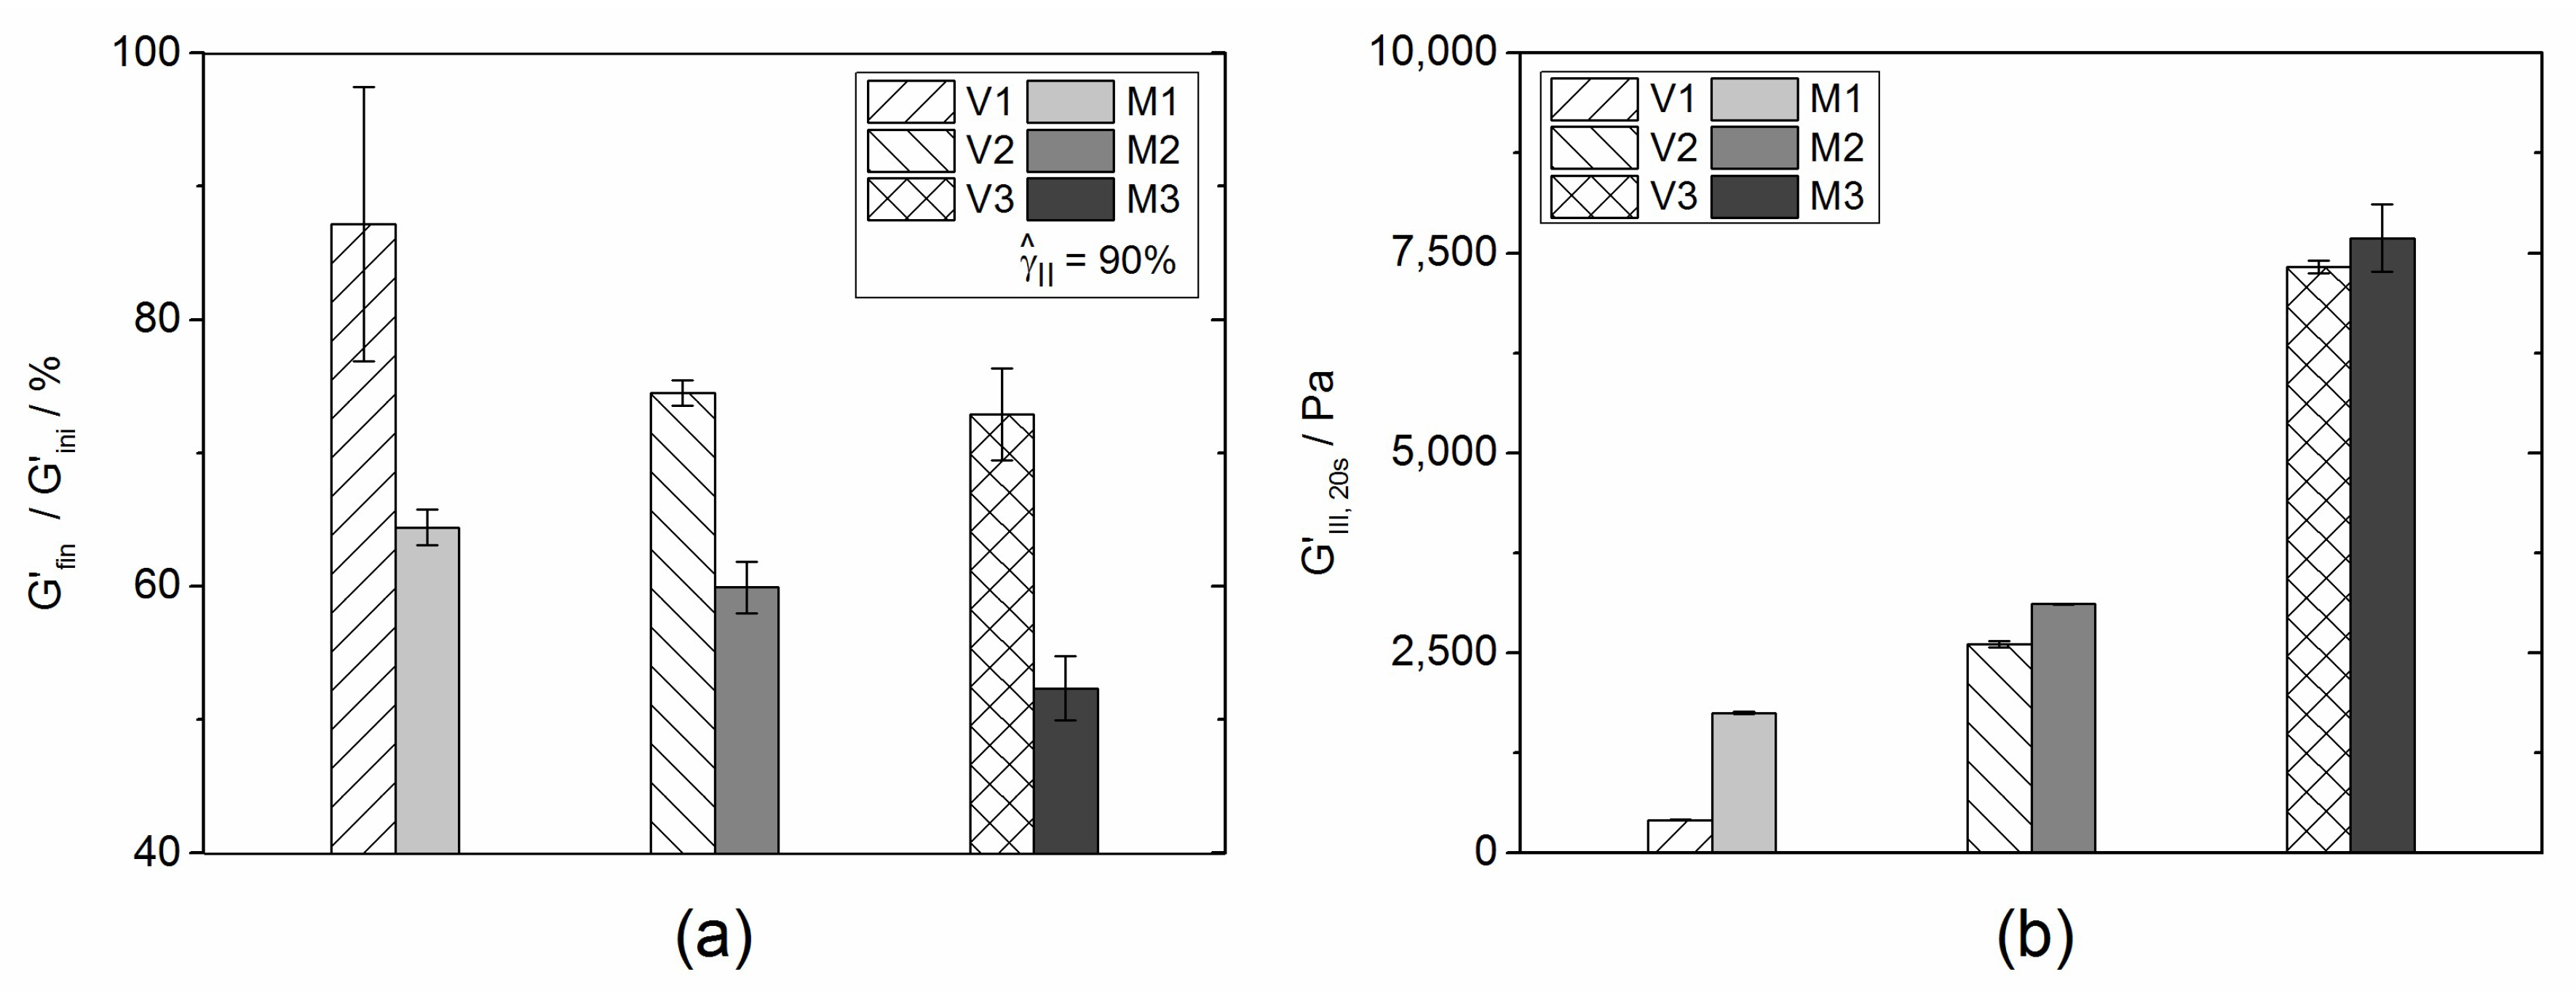
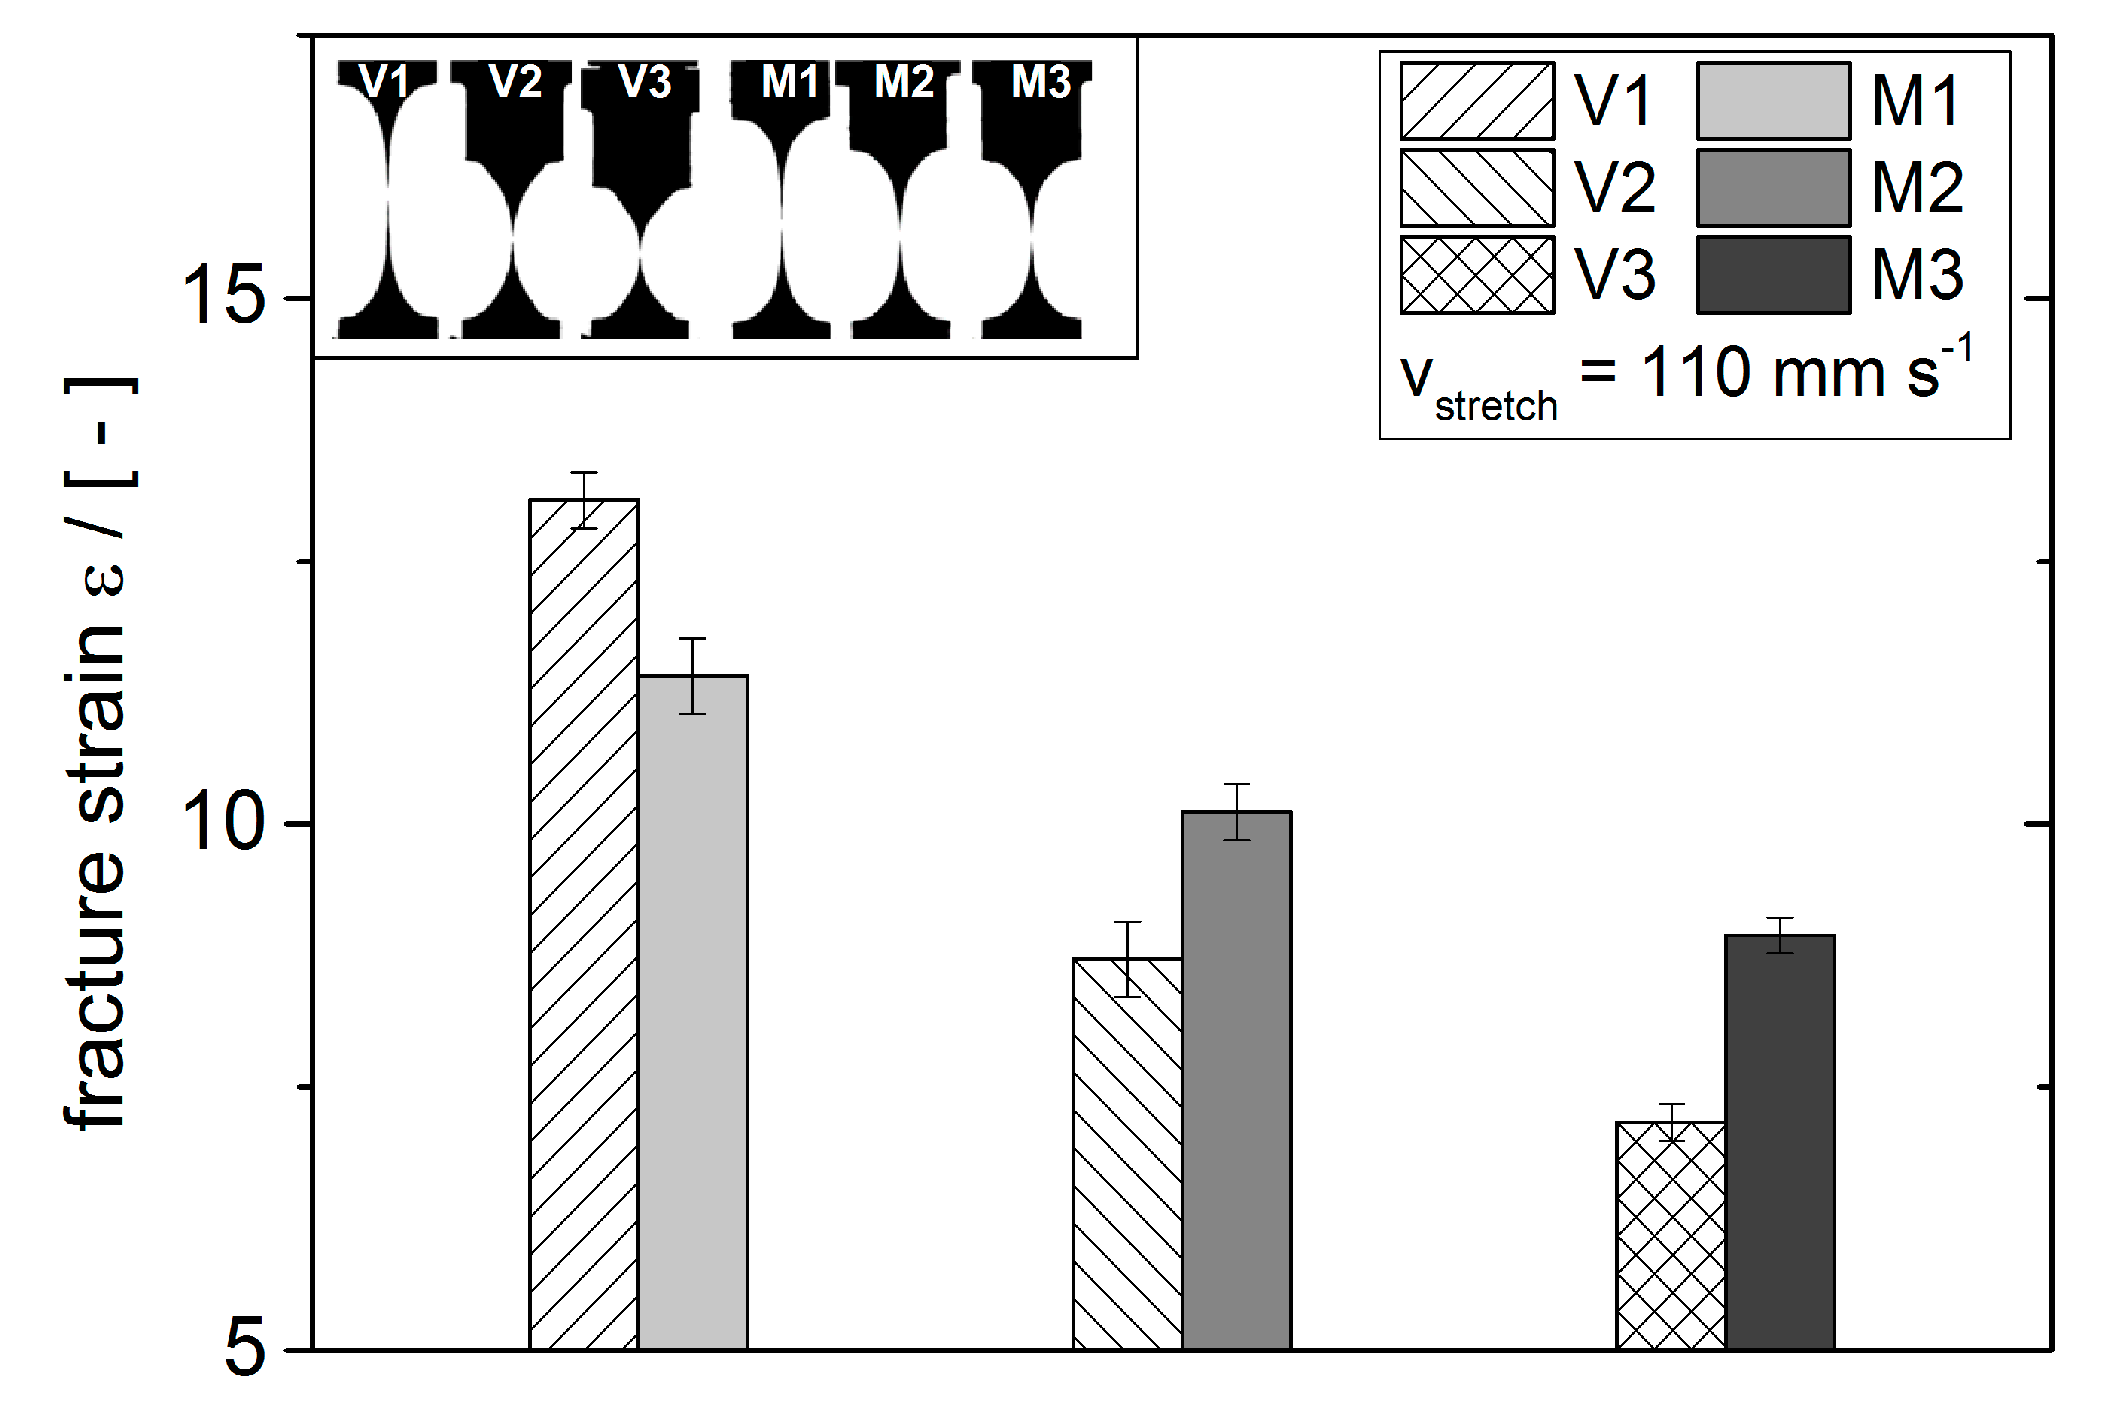
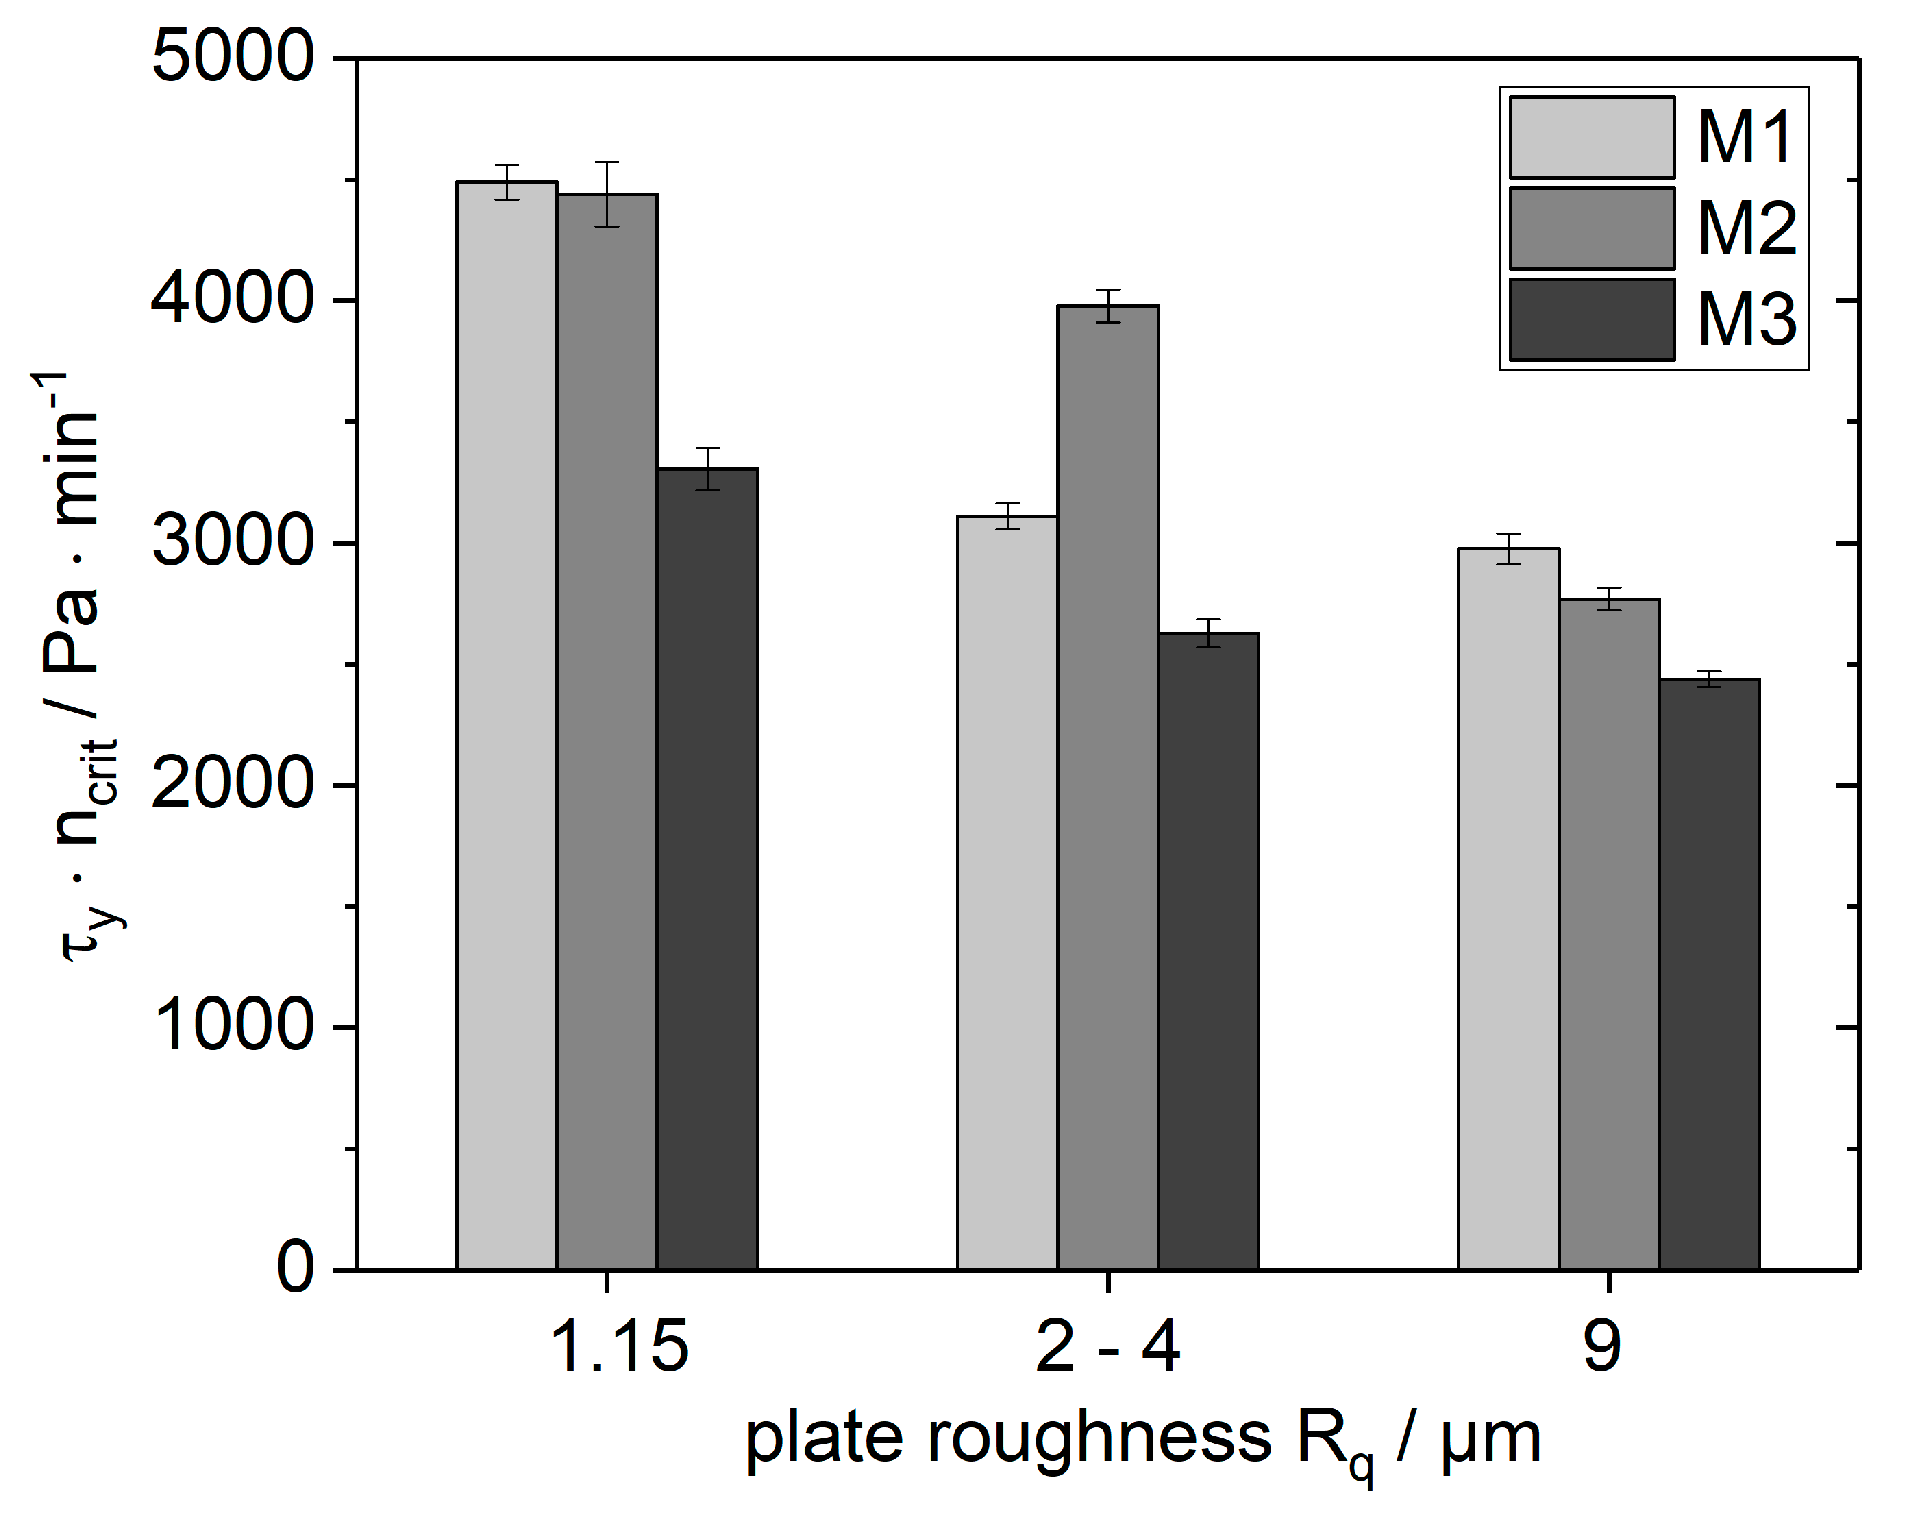
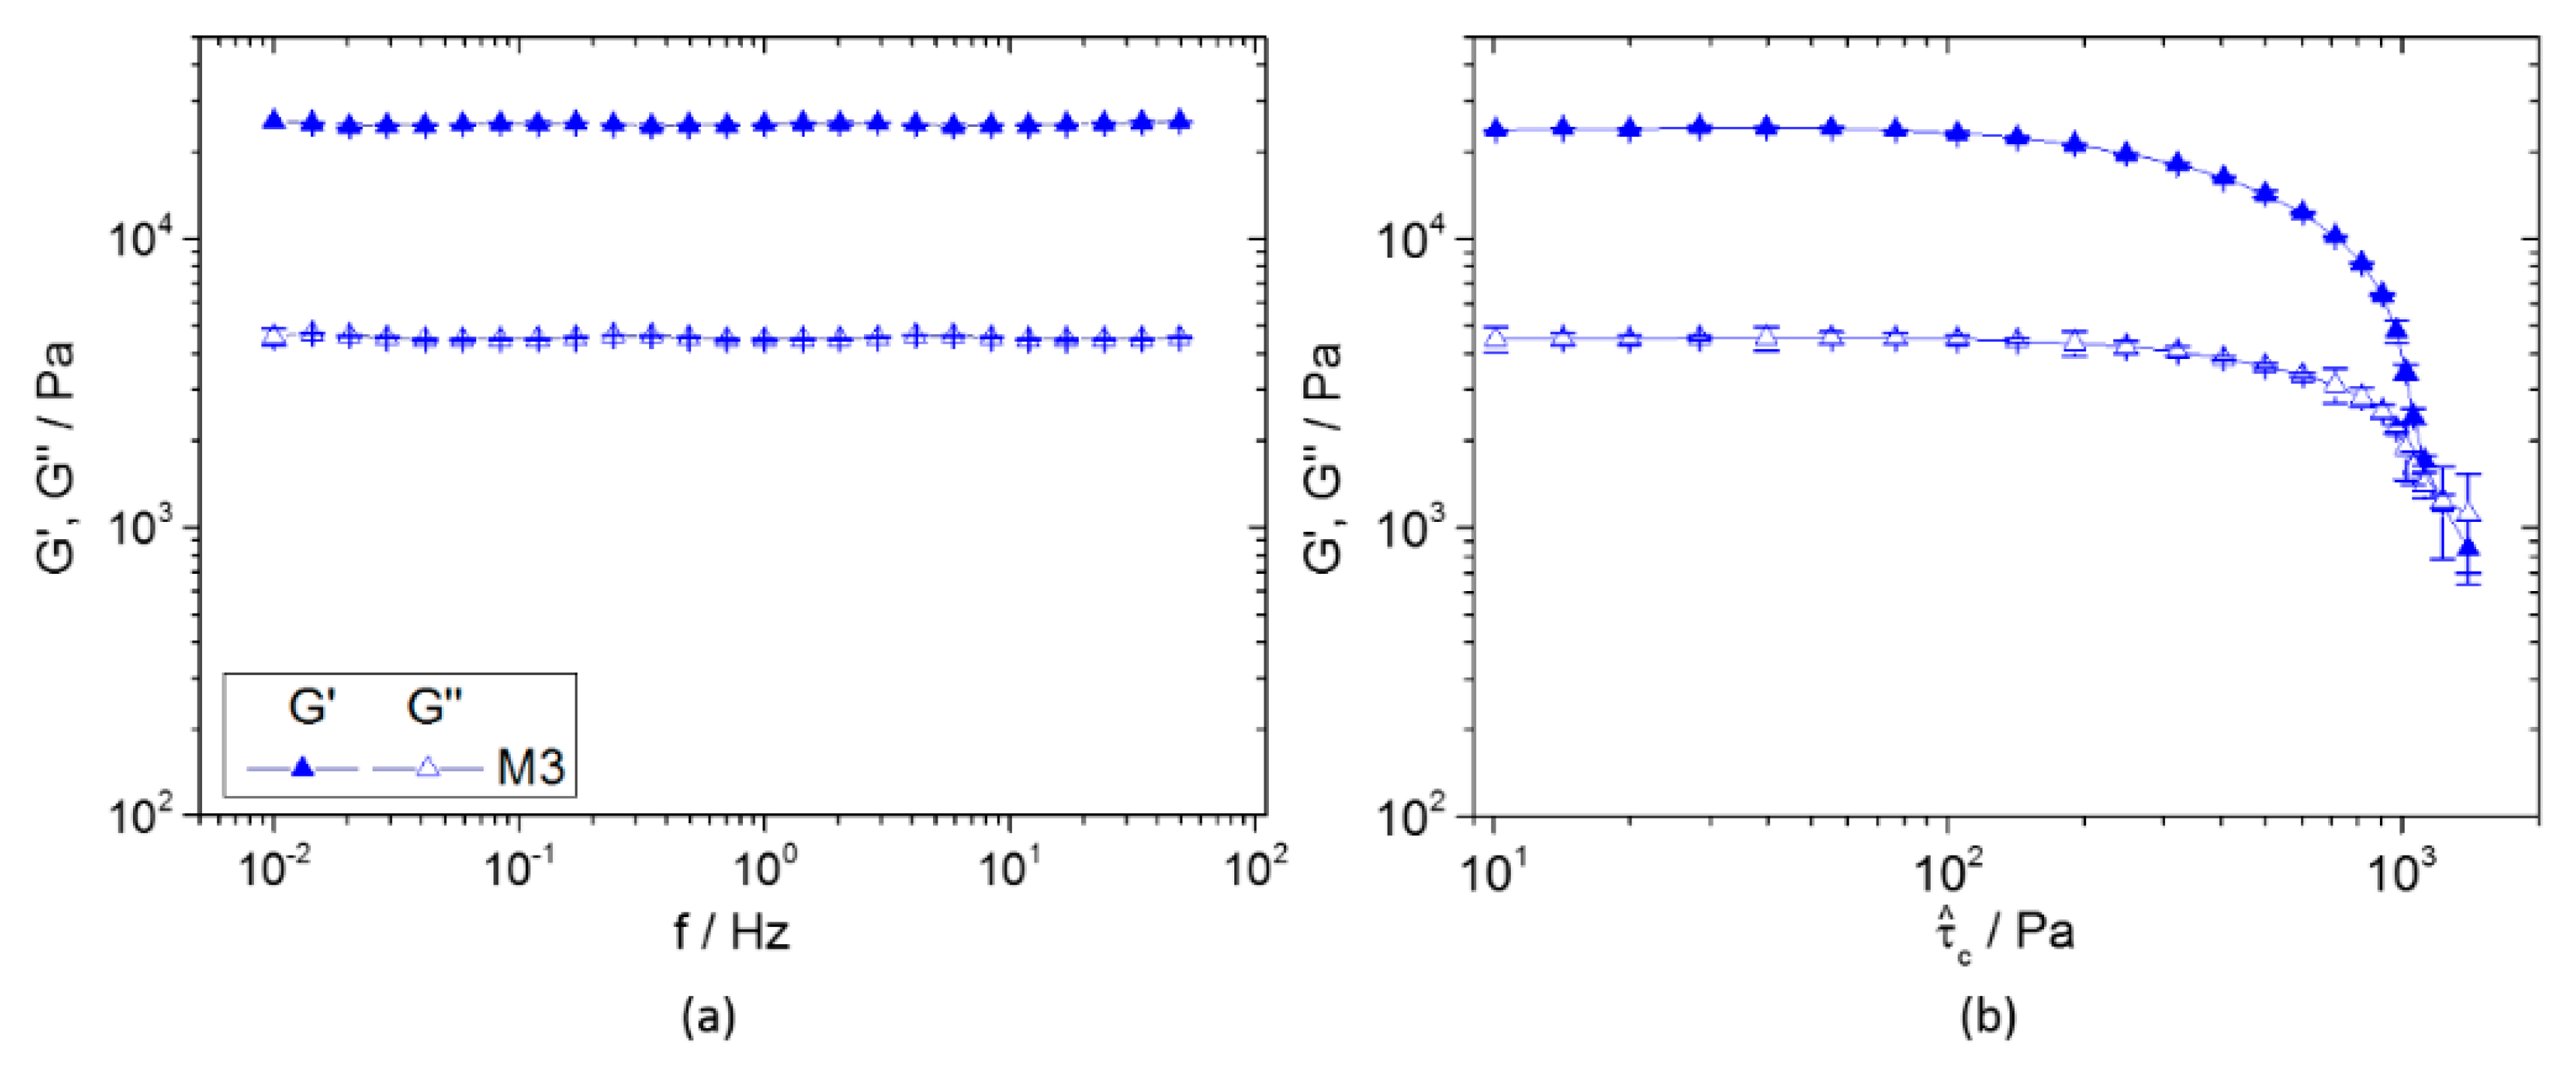
4.1. Rheological Properties of Model Vehicles and Model Silver Pastes

All samples investigated in this work exhibit a yield stress τy which is the minimum stress required to force the sample to flow due to stress-induced structural rearrangements or breakdown of the sample’s network structure. Yield stress data for model vehicles and silver pastes are shown in Figure 1.
The yield stress increases from V1 to V3, and, respectively, from M1 to M3. The yield stress of the vehicles and the silver pastes is mainly controlled by the strong sample spanning structure formed by T-Max during organic medium preparation, which prevents phase separation and ensures long storage periods [17,26]. In the silver pastes, van der Waals interactions among particles and depletion attraction triggered by free (nonadsorbing) ethyl cellulose may additionally contribute to reinforce the network structure [26,35]. In our model vehicle series, the slight increase in T-Max from 11.73 wt % to 13.49 wt % resulted in a four-fold increase in τy from 180 to 830 Pa. For the silver pastes, however, the same relative rise in T-Max only led to a doubling of the yield stress from 495 to 990 Pa. The vehicle without T-Max does not exhibit yield stress at all. The paste without T-Max has a very small, hardly measurable yield stress (~10 Pa) and exhibits rapid phase separation (data not shown). The yield stress of the pastes including T-Max therefore cannot be assumed to be a simple superposition of a T-Max network structure and a particle network, but has to be rationalized as the result of a reinforcement of the T-Max structure by the particles. The ratio of paste and vehicle yield stress decreases with increasing T-Max content, indicating that the structure formed by the thixotropic agent is partly destroyed by the silver particles or that the silver particles cannot reinforce the denser structure at higher levels of T-Max content completely.
Yield stress is considered to be one of the key parameters controlling screen-printing behavior. However, viscosity at low and high shear rates may also affect the paste behavior during the printing process. A low high shear viscosity is reported to ease paste transfer through the screen and subsequent release from the screen [17,20], and a high low shear viscosity is reported to ensure finger line stability [23]. A certain degree of shear thinning is furthermore required to push the paste through the screen opening during squeegee movement [16,17].
Viscosity curves of all samples investigated here clearly exhibit shear thinning behavior (data not shown). Results obtained at the low shear rate γ ˙ = 0.5 s−1 are shown in Figure 2a. Figure 2b displays corresponding data obtained at γ ˙ = 3 × 10⁵ s−1.
As for yield stress, we observe a strong increase in low shear viscosity due to the slightly increased T-Max content. For the vehicle, this increase is five-fold whereas the low shear viscosity of the silver pastes only doubles. This again indicates that the structure formed by the thixotropic agent is partly destroyed by the silver particles.
The viscosity values at γ ˙ = 3 × 10⁵ s−1 are about four orders of magnitude smaller than the corresponding values at γ ˙ = 0.5 s−1. This is true for the vehicles as well as for the pastes and demonstrates the high degree of shear thinning of these systems. This strong viscosity drop is due to the breakdown of the T-Max structure and the high shear viscosity of the vehicles is determined by the solvent mixture, as well as the dissolved EC binder. Since the binder concentration hardly varies among the investigated samples and the solvent mixture is the same in all cases, the high shear viscosity is essentially the same for all three vehicles, as well as for the pastes. The paste viscosity is about twice as high as the vehicle viscosity. For a suspension with 36.4 vol % particle loading, as investigated here, a relative viscosity ηr = ηpastevehicle ≈ 6 would be expected [36]. This discrepancy shows that the thixotropic agent T-Max is partly de-activated upon addition of silver particles as already indicated by the lower change of τy and ηlow upon T-Max variation when comparing pastes and corresponding vehicles.
The rheological characterization of highly loaded silver pastes in a parallel-plate rotational rheometer is limited regarding higher shear rates due to sample spillage [24,28]. We investigate this gap drainage phenomenon for different values of plate roughness Rq between 1 and 9 µm. Sample spillage occurs at a certain rotational speed ncrit which increases with decreasing plate roughness and sample yield stress (see Figure A1 in Appendix A). Spillage is a phenomenon occurring in silver pastes with a high-density difference between disperse and continuous phases, but does not occur in pure vehicles. Therefore, we assume that it is an inertia-driven phenomenon and a minimum energy input (τ γ ˙ ) is required to drain the gap. This energy transfer is higher for samples with higher τy and when rough plates prevent slip, i.e., the sample is exposed to higher shear rates.
Previous work revealed that wall slip promotes paste transfer and leads to improved finger line/busbar connections [22]. Wall slip effects often disturb the rheological characterization of highly filled pastes or suspensions, and viscosity data may be blurred if slip is not taken into account adequately. No indication for wall slip was found for the vehicles investigated here. The pastes’ slip velocity vslip is displayed as a function of shear stress τ (Figure 3). Slip velocity increases linearly with increasing shear stress. The applied stress was varied between τ = 200 Pa and τy of the respective paste. For a given τ the wall slip velocity decreases with increasing T-Max content. The characteristic slip velocity V* [37] is obtained at the yield stress τy of the respective paste, but is independent of sample composition. It should be kept in mind that the slip velocities found here are more than an order of magnitude lower than those reported earlier [22], i.e., wall slip is of minor relevance for the pastes investigated here.
Oscillatory shear measurements are not limited due to sample spillage or wall slip effects occurring in steady shear experiments. Frequency sweep experiments demonstrate the dominating elastic properties of the vehicles as well as the pastes, i.e., G’ is independent of frequency and G’ >> G’’, in the linear response regime (see Figure A2a in Appendix A). Figure 4a shows the corresponding G0 = G’ (f = 1 Hz) data for all investigated samples.
As for τy and ηlow, we find a strong increase in G0 with increasing T-Max content and again this increase is more pronounced for the vehicle than for the paste. Amplitude sweep experiments (at a fixed frequency f = 1 Hz) were performed to determine the critical stress amplitude τ ^ c at which G’ = G’’ (see Figure A2b in Appendix A). This crossover indicates a structural breakdown and this kind of oscillatory shear test is considered as an alternative approach to determine τy [38]. Corresponding τ ^ c data for all investigated vehicles and silver pastes are displayed in Figure 4b. As expected, τ ^ c increases with increasing T-Max content and this effect is less pronounced for the pastes than for the vehicles. The absolute τ ^ c values agree fairly well with the corresponding τy data.
A three-interval shear test as suggested in [16] and later used in [17,21,24,30] was performed to characterize the structural recovery after large shear deformation. Here, the degree of recovery is calculated as the ratio of Gfin obtained as the limiting G’ value in Section III and Gini determined in Section I. In the second interval, a shear deformation amplitude γ ^ = 90% is applied for 150 s to assure extensive structural breakdown, and to achieve good paste transfer across the screen [16]. Corresponding data shown in Figure 5a reveal that the paste structure is irreversibly damaged during high shear in Section II. Similar results have been previously reported for silver [24] and ZnO pastes [30]. The degree of irreversible damage is generally controlled by the interactions among solid particles, thixotropic agent and binder [39]. Here, this change in structure is more pronounced for the pastes than for the vehicles and increases with increasing T-Max content as already reported for ZnO pastes [30].
Additionally, we have determined the modulus G’ in Section III, 20 s after cessation of high shear deformation. This time period approximately corresponds to the interval between the solar cell printing step and the drying step [21]. As shown in Figure 5b GIII,20 s increases with increasing T-Max content. This is again true for the vehicles as well as for the pastes, and obviously the irreversible damage of the paste structure, which also increases with increasing T-Max content, does not compensate for this effect. It should be kept in mind, however, that the characterization of structural recovery relies on oscillatory shear deformation data obtained on a time scale of several tenths of seconds. By contrast, printing and spreading of silver lines in solar cell metallization happens in less than 0.1 s based on high-speed camera observations [30] and may not be related to the long term rheological changes characterized by this kind of three-interval thixotropy test [16,17,21,24].
Filament breakage length, respectively fracture strain ε, was determined in uniaxial extension to understand the paste behavior during snap-off in the printing process. Paste sticking to the substrate or the screen experiences a tensile stress when the screen detaches from the wafer. We used a commercial CaBER device to determine the fracture strain ε. A constant stretching velocity vstretch = 110 mm s−1 was chosen and the corresponding ε values are shown in Figure 6. Obviously, fracture strain decreases with increasing T-Max content. Again, this effect is more pronounced for the vehicles than for the pastes. Similar behavior was observed earlier for ZnO pastes with different T-Max content [30]. The sample spanning network structure provided by this thixotropic agent cannot withstand strong tensile stresses and exhibits brittle failure.
In summary, this section provides a comprehensive rheological characterization of silver pastes and corresponding vehicles essentially differing in the amount of included thixotropy agent T-Max. The parameters τy, τ ^ c, G0, and ηlow are tightly related, and all increase strongly with T-Max concentration. However, this effect is more pronounced for the vehicles than for the pastes, indicating that the structure provided by the thixotropic agent is partly disturbed by the added silver particles. The fracture strain ε in uniaxial extension is another, independent paste rheology parameter. This quantity decreases substantially with increasing T-Max content. The structure provided by the thixotropic agent is destroyed during high shear deformation and only partly recovers after cessation of flow. The degree of irreversible damage increases with increasing T-Max content. Furthermore, the slip on steel surfaces (determined at stresses below τy) decreases with increasing T-Max content. Finally, high shear viscosity is a rheological quantity which, in contrast to all other rheological parameters mentioned above, does not vary with the thixotropy agent content. It should also be noted that the wetting properties of the silver pastes are not affected by the thixotropy agent. In the next section, we will discuss how the distinct differences in flow behavior of the prepared silver pastes are seen in the properties of finger lines obtained via screen-printing.

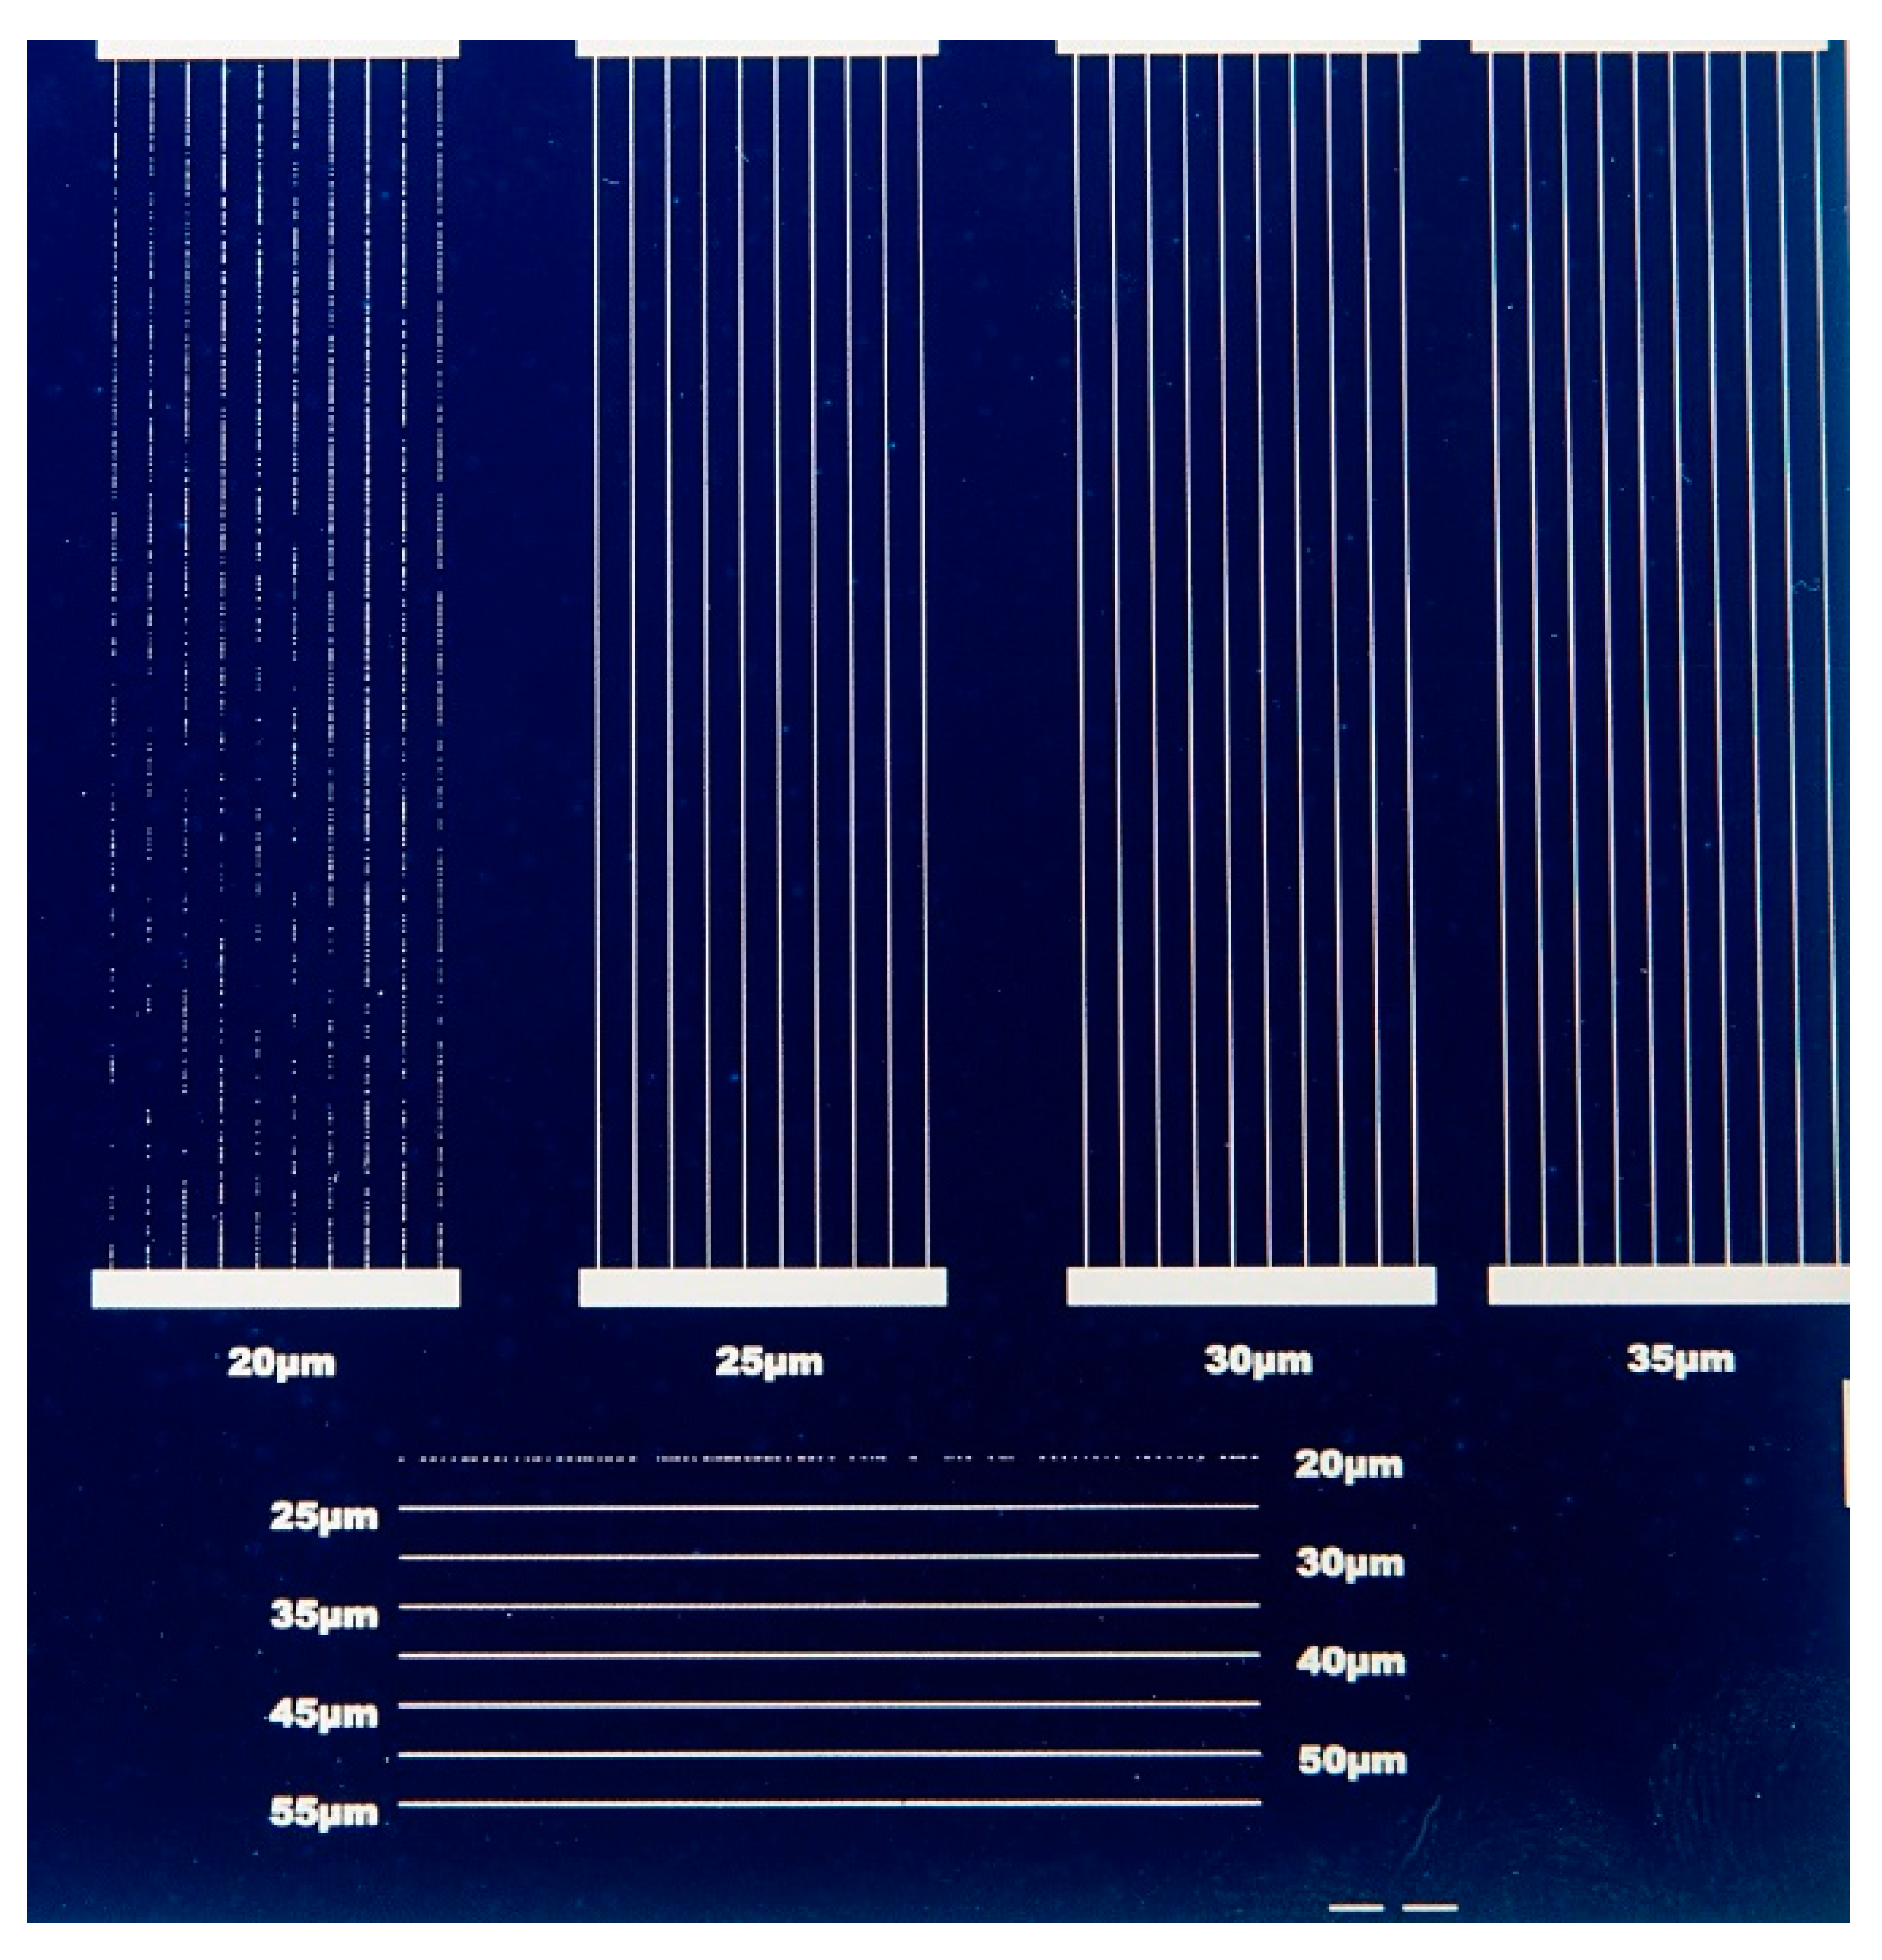
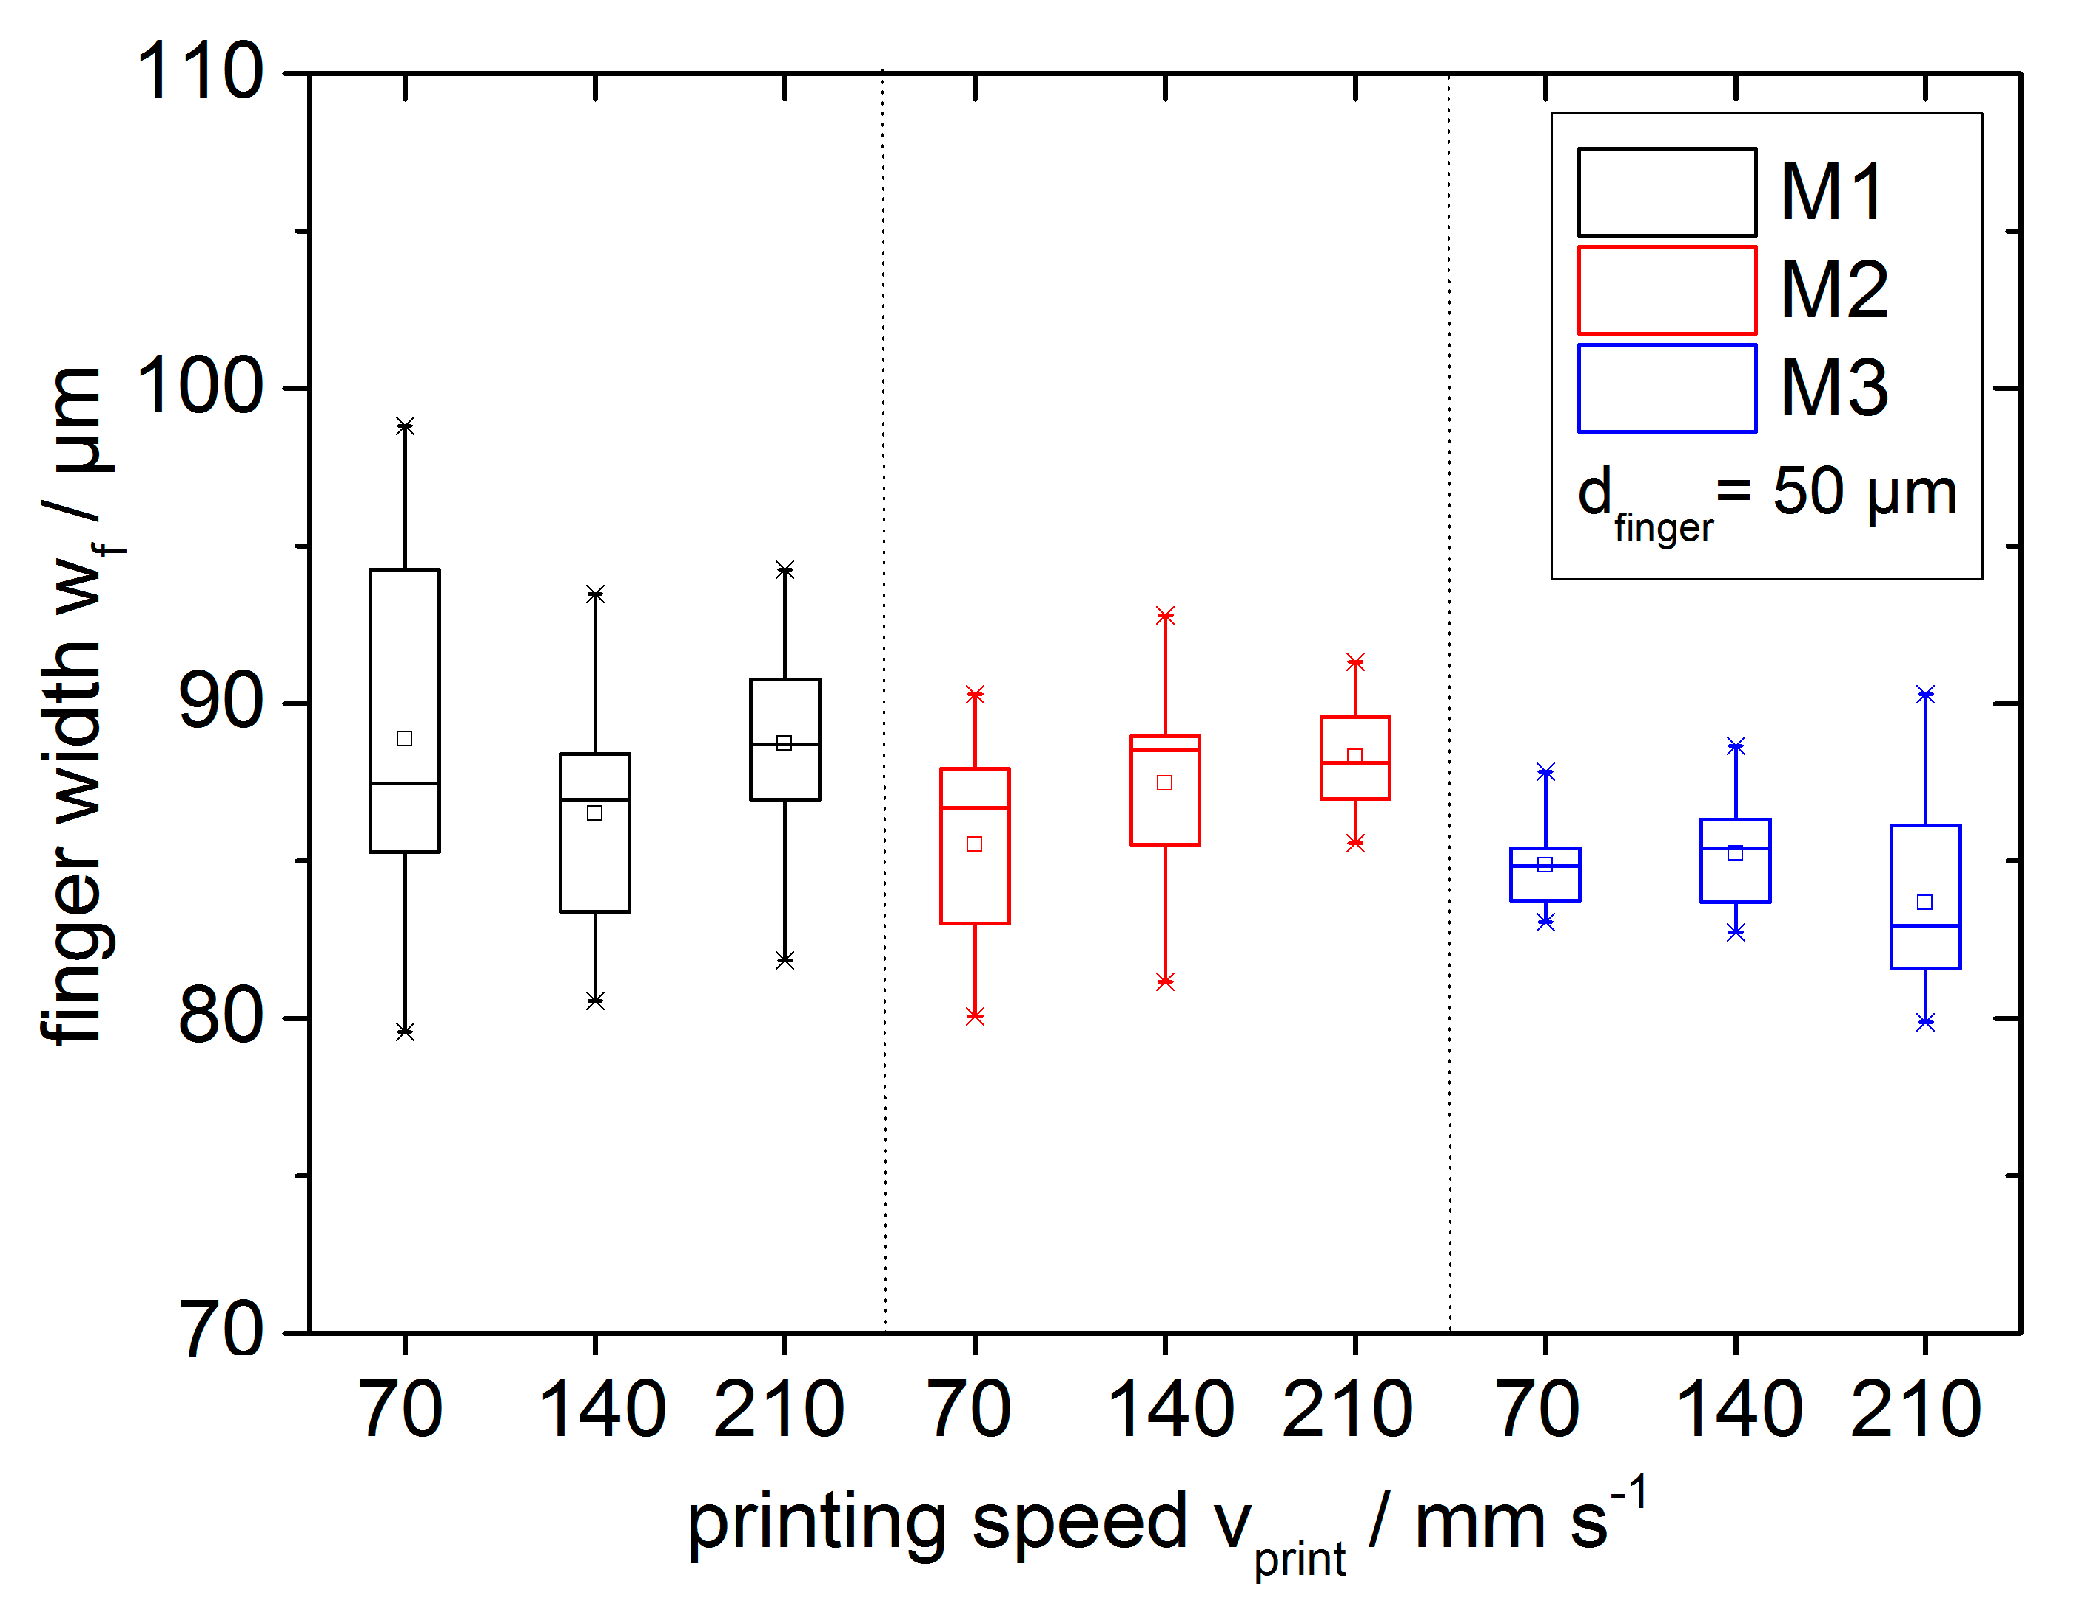
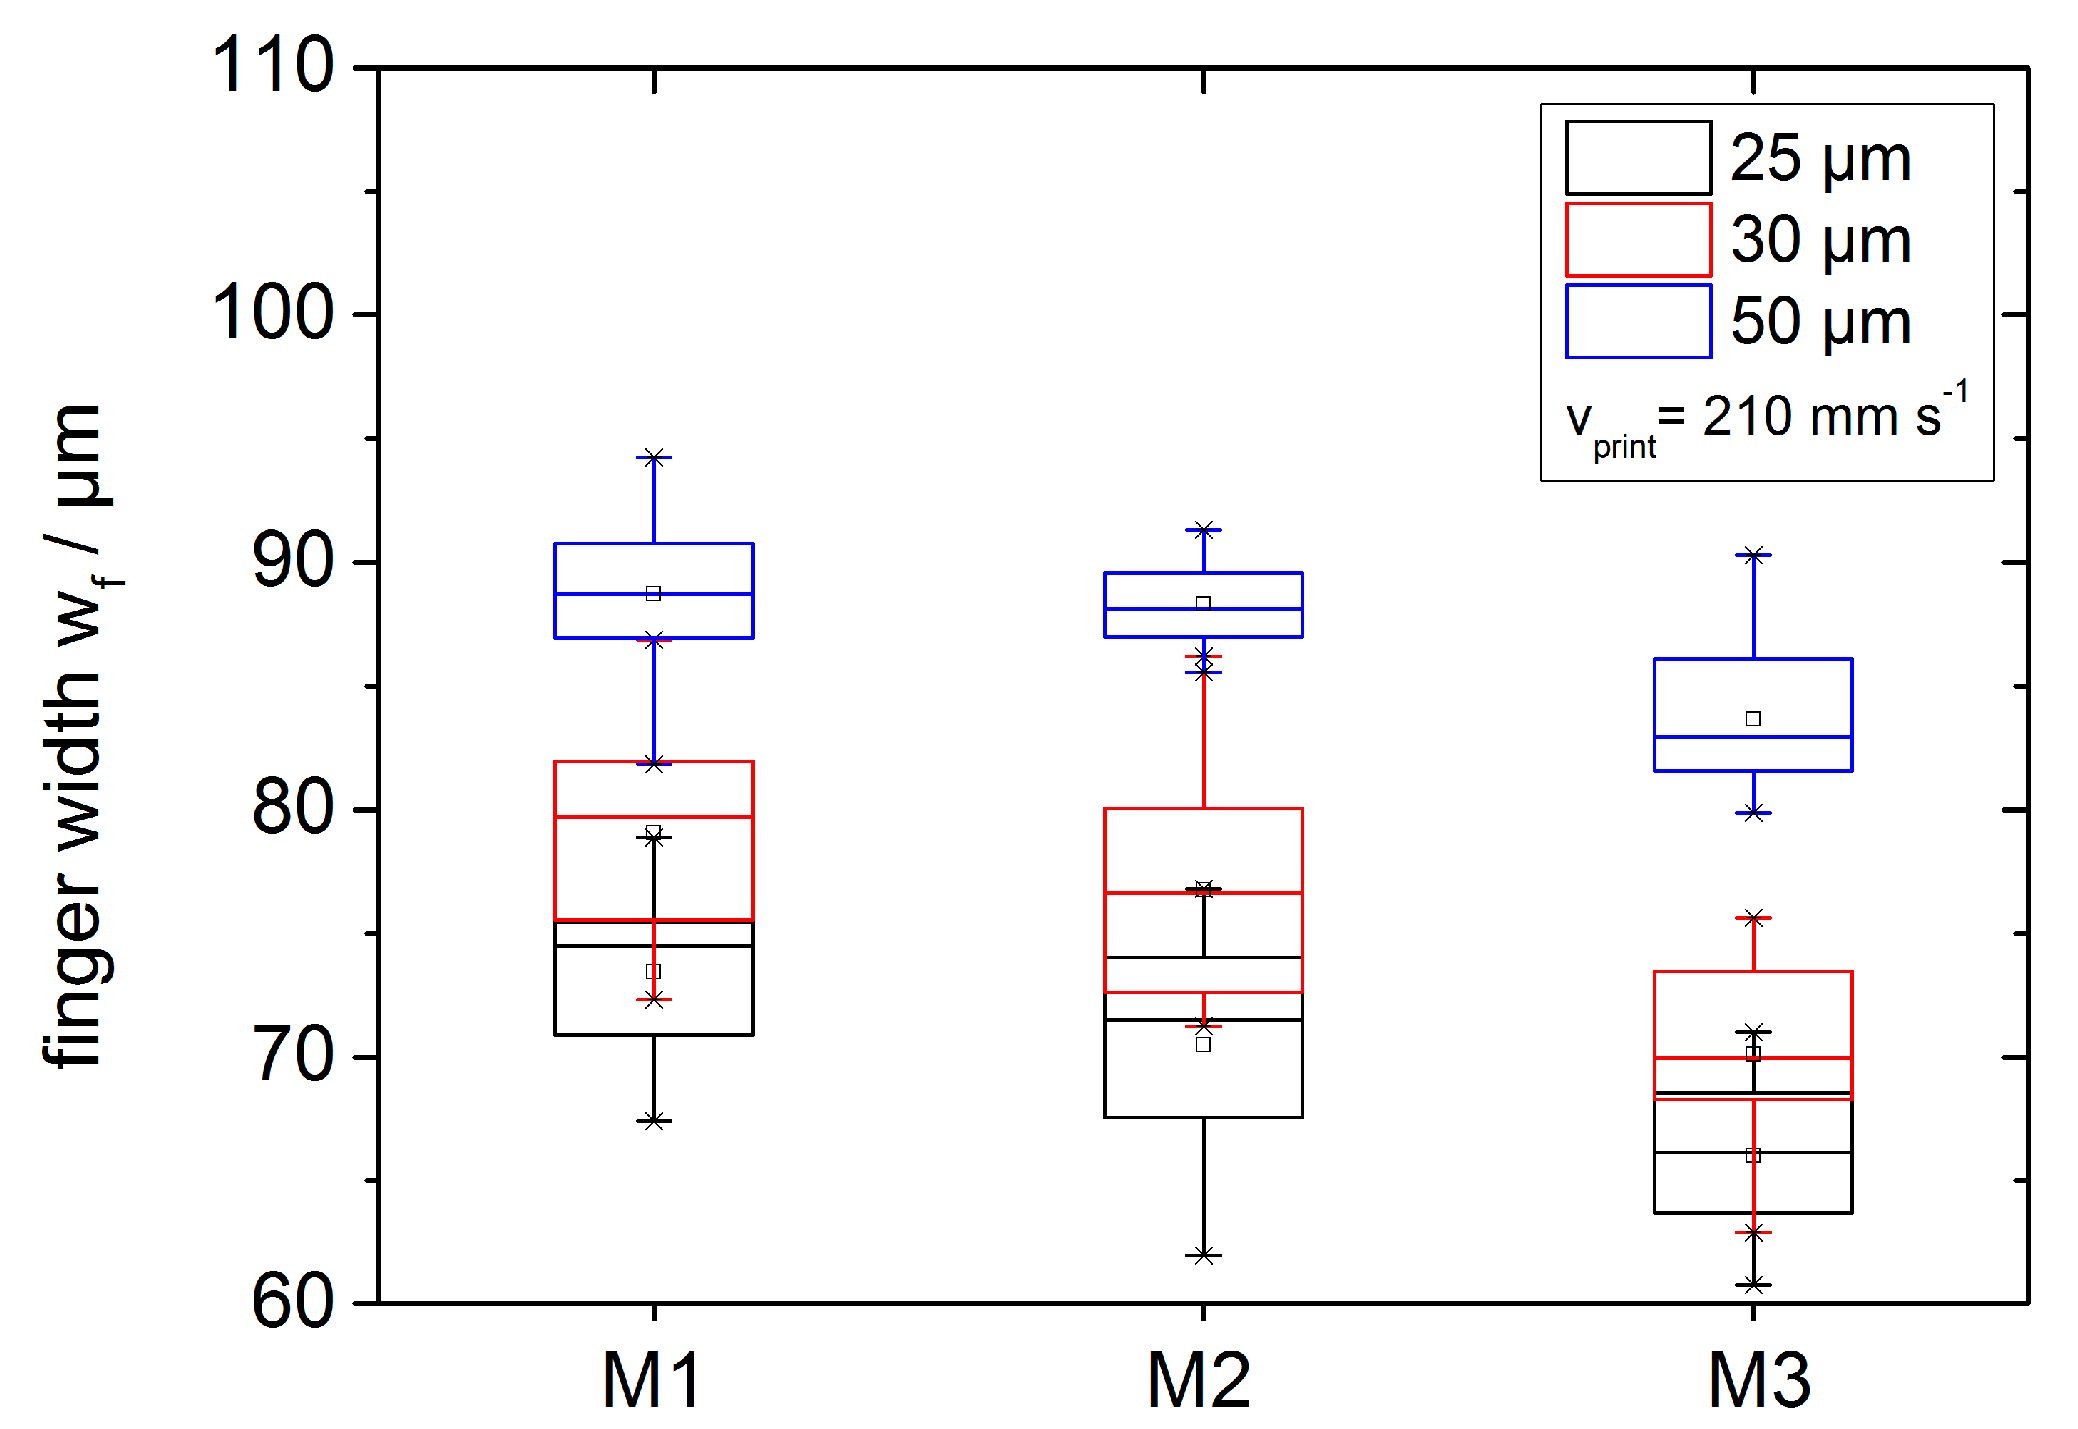
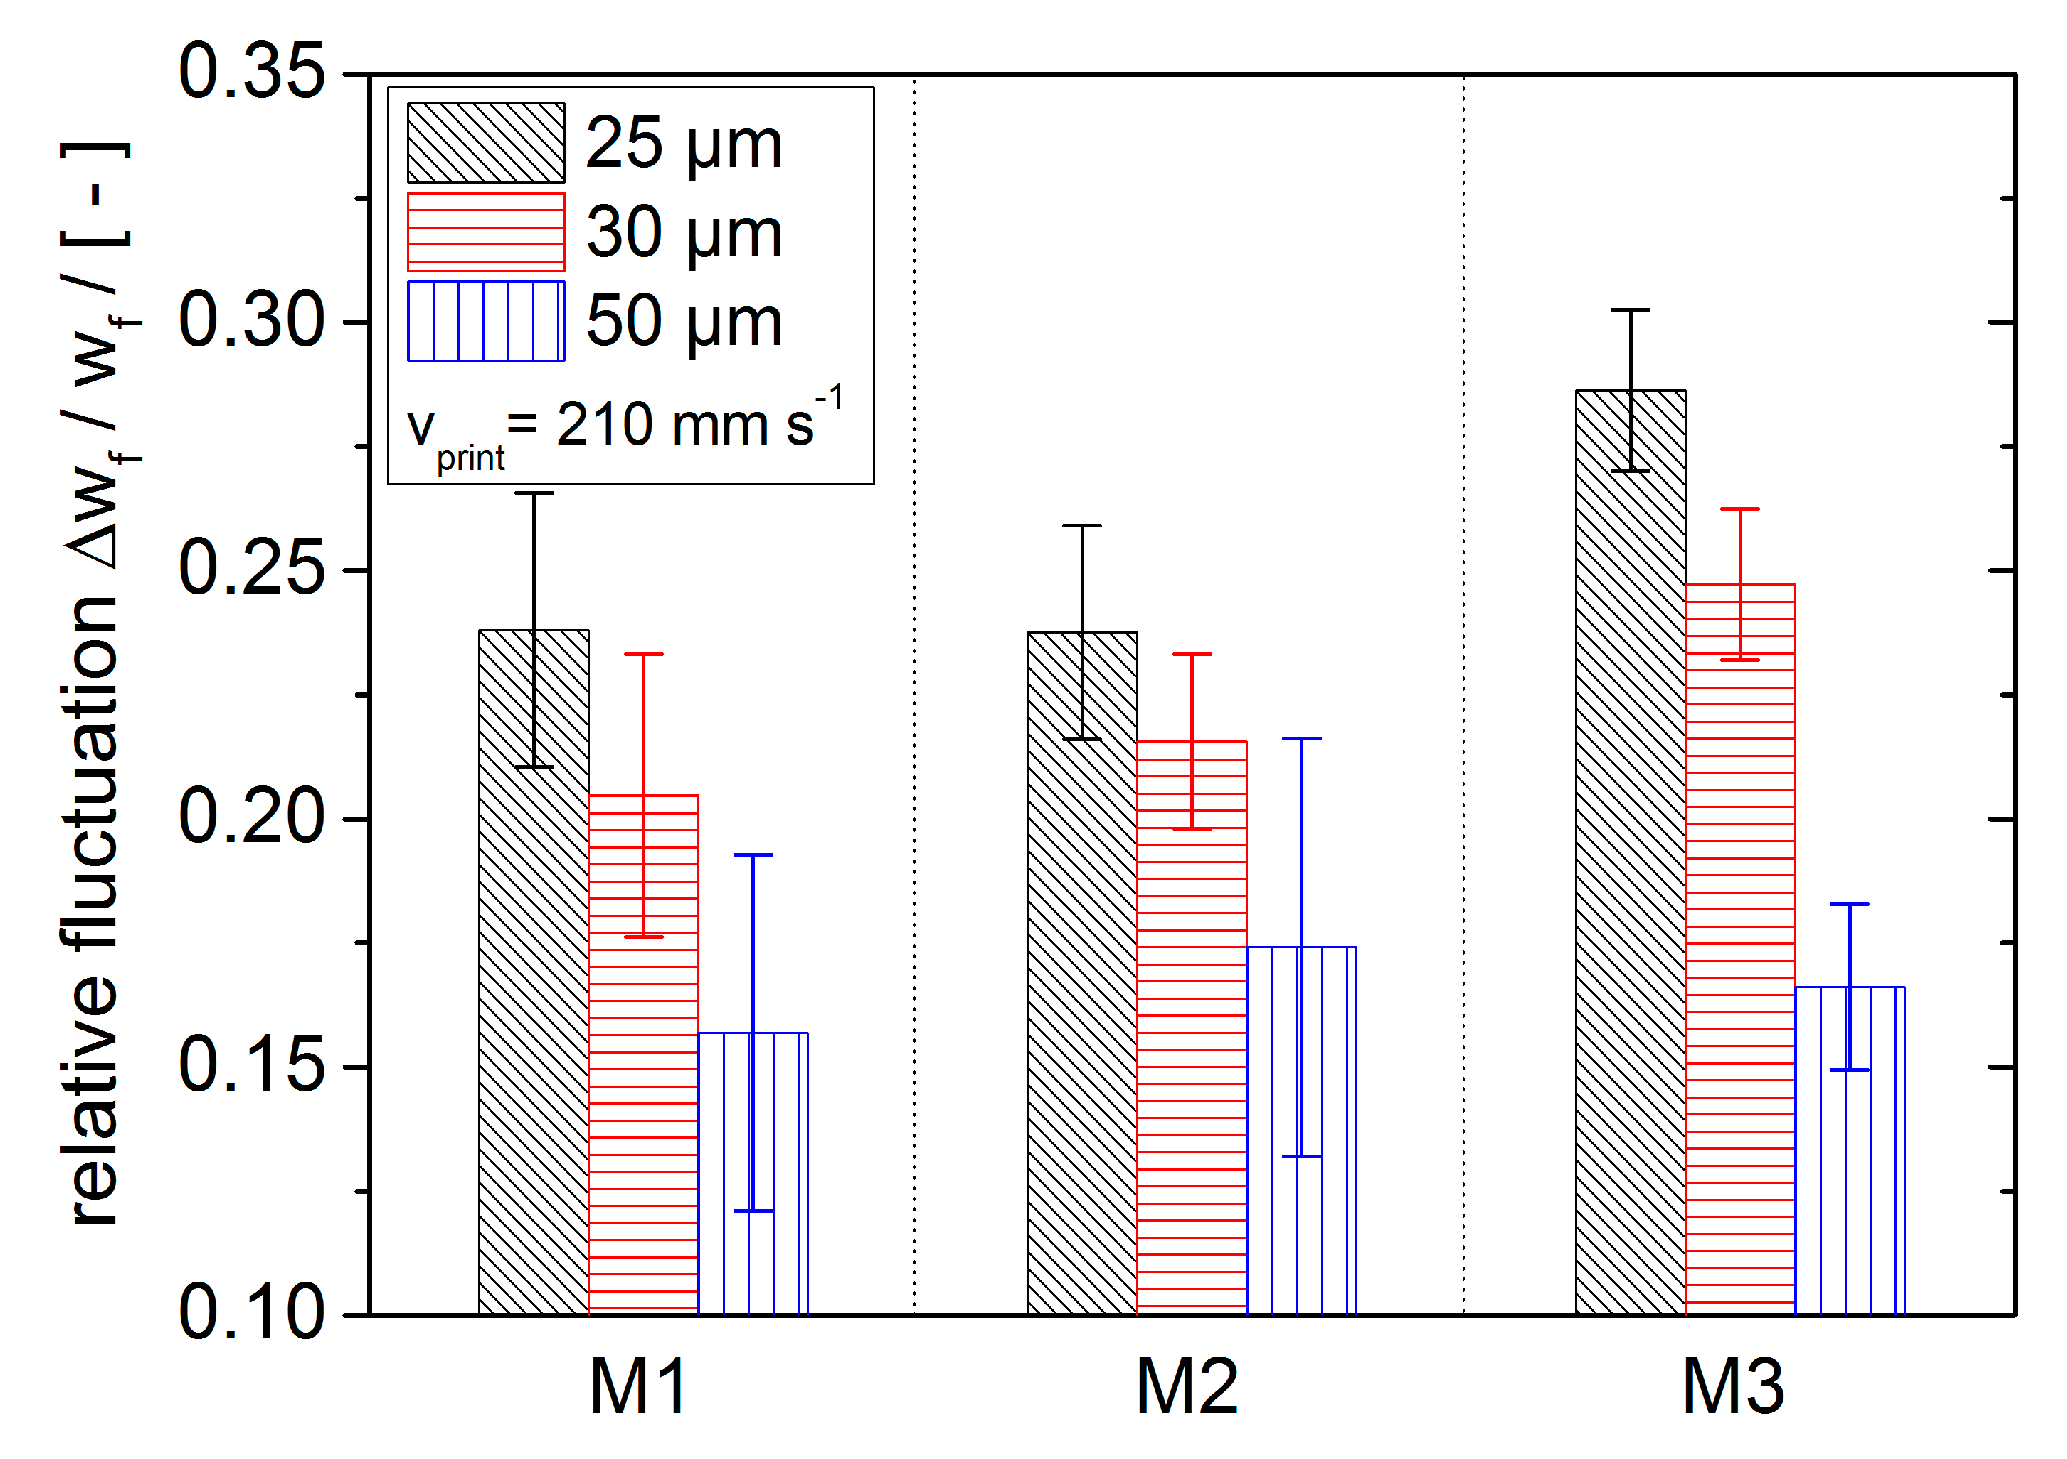
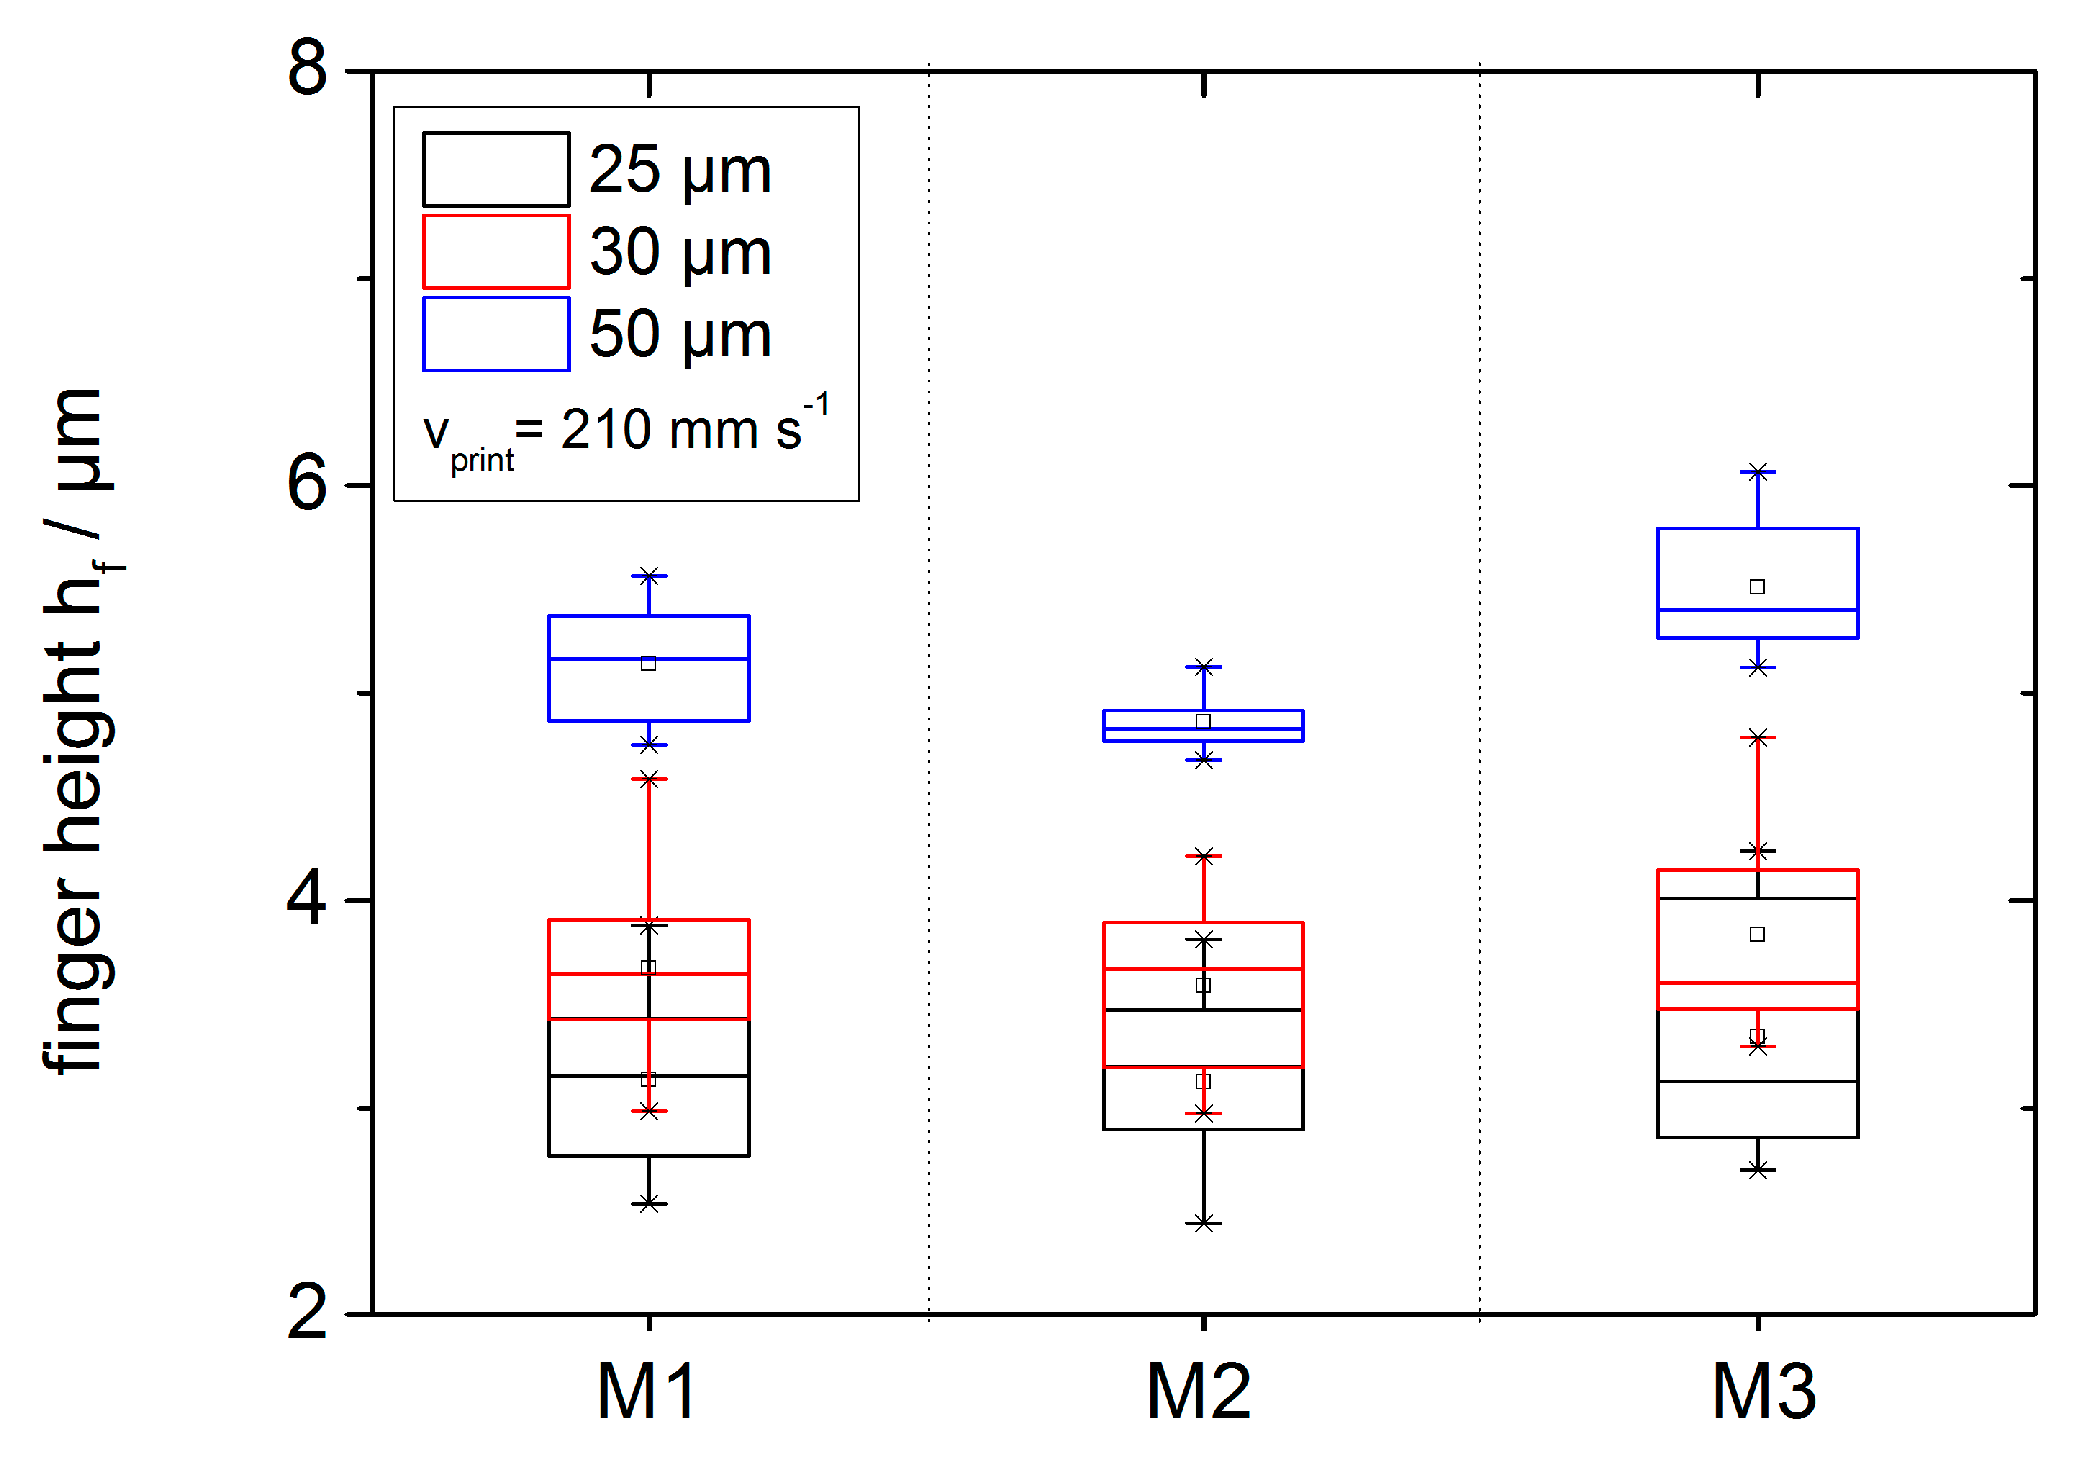
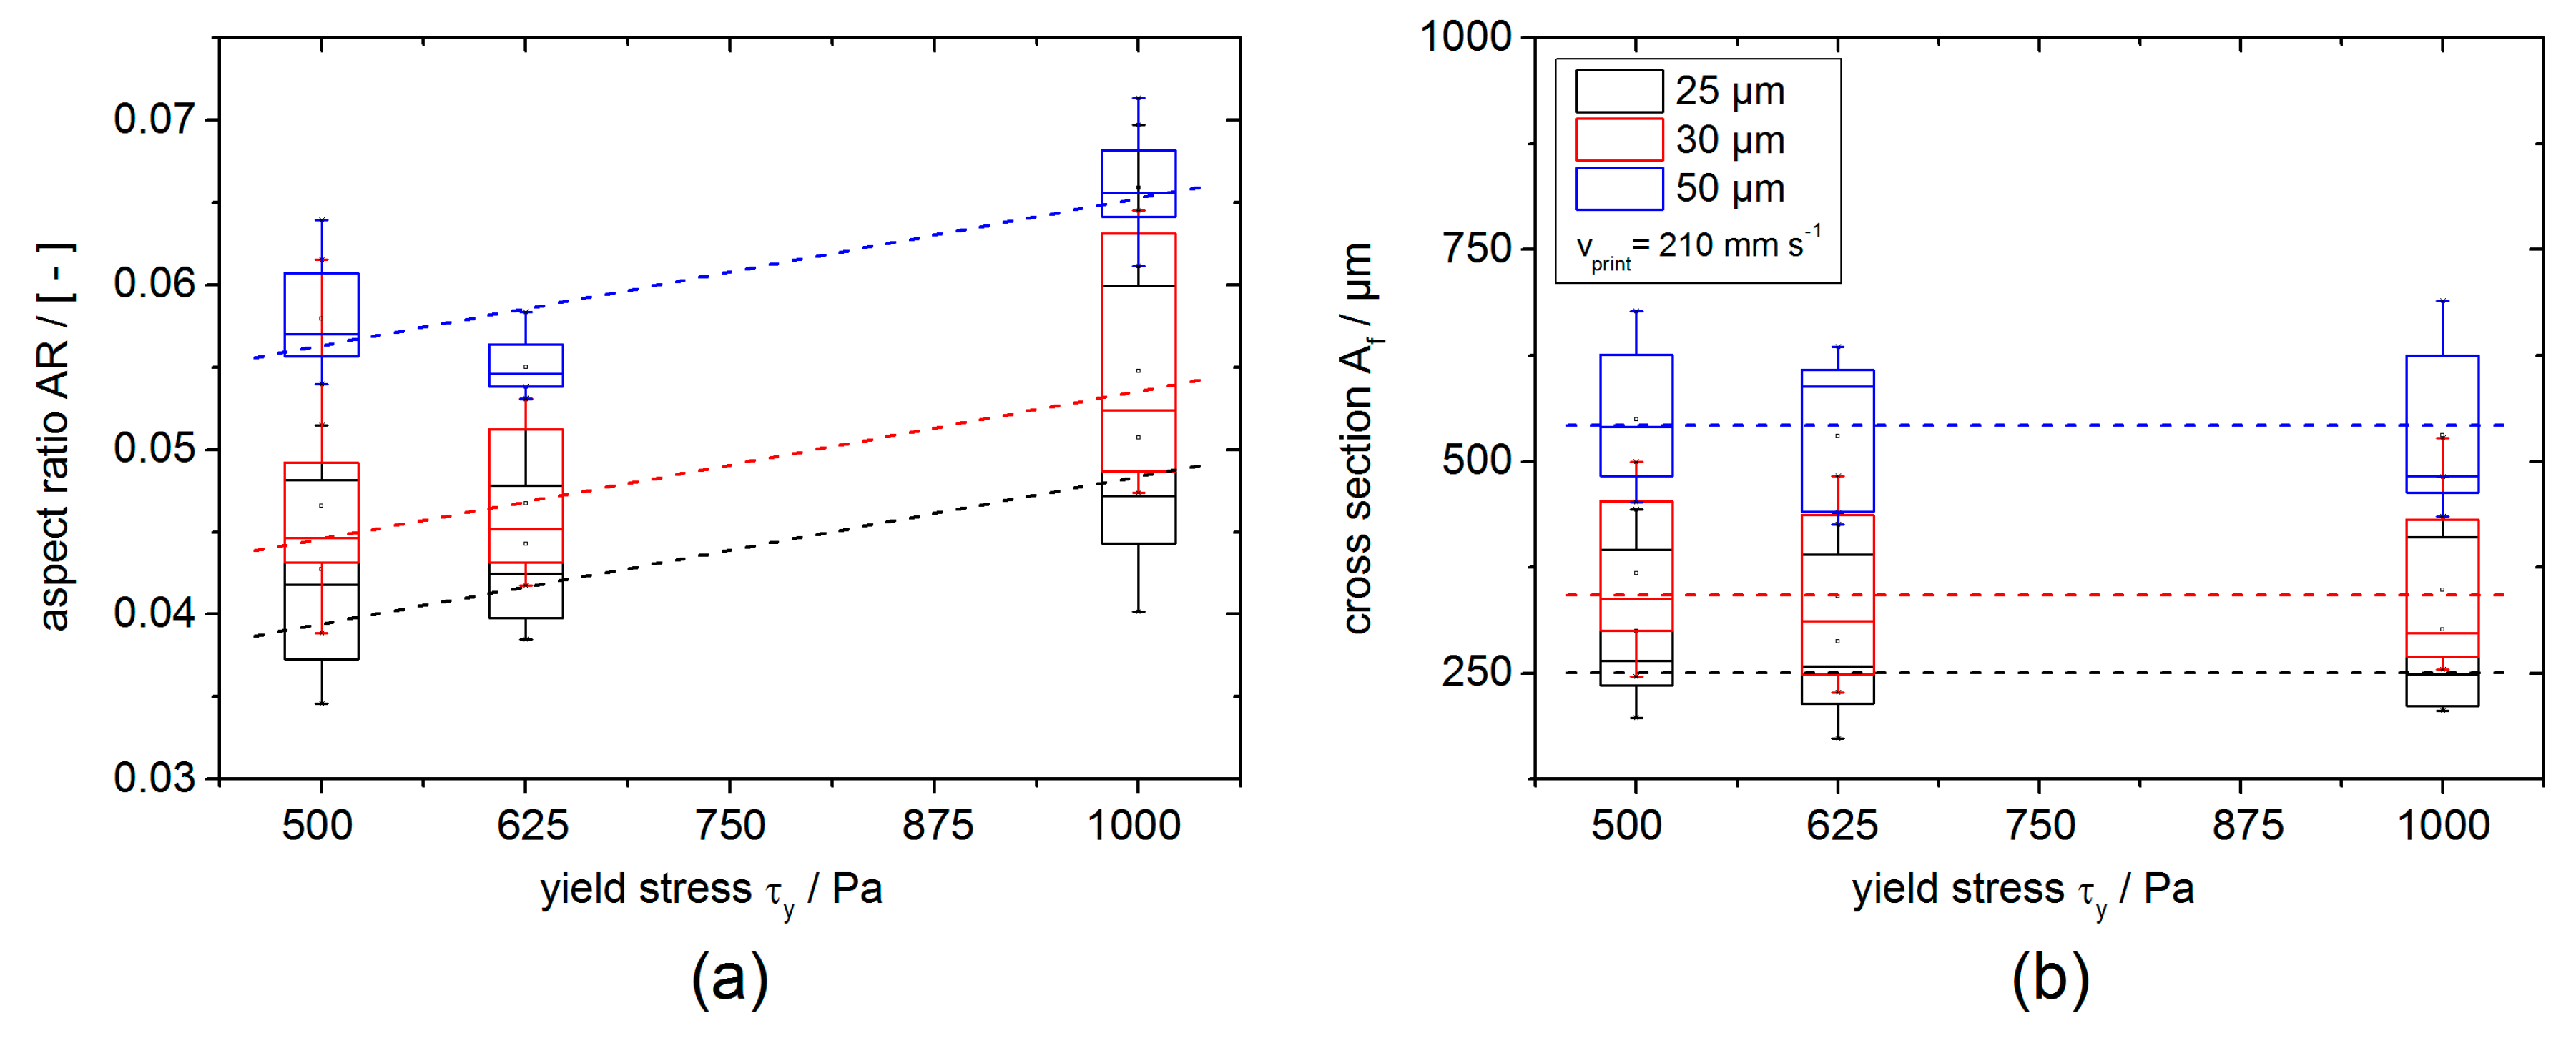
4.2. Printed Finger Morphology Characterization

An overview of our 156 × 156 mm2 test layout pattern printed on monocrystalline (Cz) Si-solar cell at speed of 210 mm s−1 is represented in Figure 7. Here we used paste M1, but similar results were obtained for M2 and M3. This test layout contains eight finger openings from 20 to 55 µm. Based on this example, uniform, interruption-free printed finger lines can be observed down to 25 µm finger opening. It should be noted that our layout screen includes a 13 µm thick emulsion over mesh (EOM) layer. Interruption-free printing through a 20 µm finger opening would require an EOM layer thickness below 10 µm, as is typically used in fine line printing [21,40,41]. In general, print results are not only affected by paste rheology or wetting properties, but also by the printer hardware, such as the screen (design of steel mesh and EOM type and layer thickness), and printer settings (e.g., squeegee angle, squeegee speed, snap-off distance and the magnitude of the force that presses the squeegee against the screen and substrate) [20].
However, our focus is the characterization of finger lines printed through 25, 30, and 50 µm finger openings at various printing velocities vprint = 70, 140, and 210 mm s−1. For the layout screen used here, these finger openings provide uniform interruption-free finger lines suitable for a systematic study of the influence of paste composition, as well as printing speed on the morphology of printed lines. Paste transfer, or laydown, is a characteristic feature of a printing process not only for metallization of solar cells. Results for pastes M1–M3 obtained with the above-mentioned layout screen at different printing speeds for a 50 µm finger opening are summarized in Table 2. Essentially the same paste laydown of about 53 mg is achieved, irrespective of paste composition and printing speed; however, at low printing speeds paste M3 enables a slightly higher transfer of 56 mg.
The differences in wall slip previously shown to have a strong effect on paste transfer [22,23] do not show up here and we attribute this to the low absolute slip velocity values measured on a smooth steel plate (Section 4.1) indicating that slip is of minor relevance for the pastes investigated.
Key characteristic parameters of printed electrodes are finger width wf and its fluctuation, finger height hf, and the corresponding cross-sectional area Af and aspect ratio AR. Evaluation of these parameters is carried out using a 3D laser scanning microscope. In Figure 8, finger width results are plotted in a box plot diagram versus printing speed for electrode lines printed through dfinger = 50 µm finger opening. Results for pastes M1–M3 are separated into three groups. Our results confirm that the variation of printing speed has no significant effect on finger width, and wf seems to decrease slightly with increasing T-Max content. However, this effect is more pronounced at lower mesh openings and will be discussed below. During the screen-printing process pastes are exposed to high shear rates, especially when pushed through the finger openings [18,20]. Since the high shear viscosity is the same for all investigated pastes, a variation in wf is not expected. In all printing trials, the finger width is about 75% higher than the finger opening. This is attributed to the low absolute value of the viscosity in the high shear regime. A finger width wf closer to the finger opening can be achieved using pastes with substantially higher viscosity at high shear rates [30].
Since printing speed has no influence on finger width here, we decide to characterize further geometrical parameters of printed lines only for printing speed vprint = 210 mm s−1, which is close to the state-of-the-art in front-side metallization of Si-solar cells. The results of finger lines printed through 25, 30, and 50 µm finger openings are shown in Figure 9. Finger width is obviously smaller for a narrower finger opening but the deviations between resulting finger width wf and finger opening are even more pronounced for smaller openings; e.g., for the 25 µm finger opening, the obtained true line width is almost three times larger than the opening of the screen. Overall, there is a small effect of sample composition on line width and wf decreases from M1 to M3, i.e., with increasing T-Max content. We attribute this to the two-fold increase in τy. The weak dependence of wf on the inverse of the product (τyηhigh) reported in [30] for two series of ZnO pastes with varying content of T-Max or EC binder, respectively, also appears to be revealed here.
In all cases we observe severe fluctuations in line width. The electrical properties of printed electronic devices are not only determined by the printed line width but also by the homogeneity of the obtained structures in terms of width and height. Therefore, the degree of fluctuation in finger width is determined for 10 lines, each 40 mm in length. The width is evaluated at each pixel position. Afterwards, the standard deviation ∆wf is calculated to characterize the fluctuations of the printed electrode width. In Figure 10 the relative fluctuation ∆wf/wf is plotted for each paste printed through 25, 30, and 50 µm finger openings.
The relative fluctuations in line width clearly decrease strongly with increasing finger opening, although the absolute values of wf are fairly close and much larger than the used finger opening. Paste spreading and hence line width, as well as line width fluctuations, depend on the wetting properties of the paste on the substrate and also the paste rheology, especially at high shear rates. Neither the wetting behavior or ηhigh vary among the pastes investigated here and, hence, it seems to be reasonable that ∆wf/wf does not vary much with paste composition. For smaller finger openings, relative finger width fluctuations seem to increase slightly with increasing yield stress. It should also be noted that the characteristic length scale of the pyramidal wafer surface texture is much smaller than the observed line width fluctuations.
Finger height hf results obtained for pastes M1–M3 printed through 25, 30, and 50 µm finger openings at printing speed vprint = 210 mm s−1 are shown in Figure 11. These data suggest that hf weakly increases with T-Max concentration, i.e., with increasing yield stress. An opposite trend was observed for wf (see Figure 9) and, accordingly, the aspect ratio AR = hfwf−1, shown in Figure 12a, clearly increases with increasing τy. On the other hand, the cross-sectional area Afwfhf is independent of sample composition due to the opposing effects of τy on wf and hf (Figure 12b). This is consistent with the initially stated paste transfer independent of paste composition. As expected, the absolute value of Af, and, hence, the paste transfer increases with increased finger opening.
The variations in paste transfer and also in finger cross-sectional area are small since high shear viscosity and substrate wetting behavior are similar for all pastes, and the differences in wall slip velocity do not affect paste transfer because the overall contribution of slip to paste transport through the finger opening is supposed to be small. However, the aspect ratio AR increases significantly with increasing T-Max content due to its impact on yield stress and low shear viscosity. This should finally show up in an improved cell efficiency ηel which is proportional to the short circuit current density JSC increasing with AR corresponding to reduced shading losses. Grid and line resistance, however, solely depend on Af (and its fluctuations) and hence should not be affected here, since Af is independent of paste composition.

5. Conclusions

We have thoroughly investigated the rheological properties of three silver pastes suitable for front-side metallization of Si-solar cells, and corresponding vehicles mainly differing with respect to the concentration of thixotropic agent Thixatrol Max. Even minor changes in T-Max concentration led to drastic changes in rheological response. This effect is more pronounced for the vehicles than for the pastes, indicating that the network structure formed by this hydrogenated castor oil is partly disturbed by the suspended silver particles.
Increasing the T-Max concentration by only 15% leads to a twofold (at least) increase of yield stress, low shear viscosity and storage modulus in the pastes. At the same time, the fracture strain in uniaxial extension drops by about one-third. These T-Max based vehicles and pastes are sensitive to high shear deformation and an irreversible damage of the structure was found in widely used, so-called three-interval thixotropy tests. Wall slip on smooth steel plates was observed for the pastes, however, the absolute slip velocity values were small compared to other silver paste formulations. Finally, it should be noted that the high shear viscosity of the samples obtained at a shear rate of 3 × 10⁵ s−1 was independent of T-Max concentration; obviously, the network structure breaks down at such high shear rates.
We screen-printed these pastes using a layout screen with different finger openings at various printing speeds in order to elucidate how the substantial changes in paste rheology show up in the printed finger line morphology. We focused on finger openings between 25 and 50 µm and varied printing speeds between 70 and 210 mm s−1. In all cases the observed true line width was much larger than the finger opening and we attribute this to the low high shear viscosity of the pastes since the EC binder content was kept constant at a low level.
The observed strong fluctuations in line width were mostly independent of finger opening and paste composition. We assume this phenomenon is mainly controlled by wetting properties, which are not affected by the thixotropic agent and can be safely assumed to be the same for all investigated pastes. However, finger width wf and height hf turned out to depend weakly on paste composition. Whereas wf decreases, hf increases slightly with increasing T-Max concentration, i.e., with increasing yield stress τy. Accordingly, the aspect ratio AR = hfwf−1 exhibits a distinct dependence on τy, whereas the cross-sectional area Af is independent of sample composition (i.e., τy) consistent with the gravimetric paste transfer determination revealing that paste laydown is independent of T-Max content. As pointed out earlier, paste transfer strongly depends on wall slip and this feature is mainly controlled by particle loading and solvent wetting properties not modified here. Our results do not support the hypothesis that fracture strain significantly affects snap-off and hence paste transfer. We also do not see that differences in structural recovery or degree of irreversible structural damage as characterized in three-interval oscillatory shear tests are manifested in the printing results.
In summary, the screen-printing process was found to be robust against changes in paste rheology. A twofold increase in τy induces a 15%–20% increase in finger line aspect ratio AR without affecting the total laydown. This observed increase in AR should have a significant impact on electrical cell properties due to reduced shading losses obtained from finer line-widths at a given cross-sectional area.

Author Contributions

Conceptualization, C.Y., M.K. and N.W.; Methodology, C.Y., M.K. and N.W.; Investigation, C.Y.; Writing—Original Draft Preparation, C.Y. and N.W.; Writing—Review & Editing, C.Y., N.W. and M.K.; Visualization, C.Y.; Supervision, N.W.

Funding

This research was funded by the Federal Ministry for Economic Affairs and Energy (0325775G) and the 100 prozent erneuerbar stiftung.

Acknowledgments

The authors would like to thank to Heraeus Deutschland GmbH & Co. KG for their support and supply of model vehicles and model pastes, especially A. Grumbach for his help performing the printing experiments in their laboratories in Hanau Germany and for fruitful discussions. Special thanks go to G. Klotz for experimental support in rheological characterization of vehicles.

Conflicts of Interest

The authors declare no conflict of interest.

Appendix A

Figure A1. Product of yield stress τy and critical rotational speed ncrit obtained from sample spill investigation at varied plate roughness for M1, M2, and M3.
Coatings 08 00406 g0a1
Figure A2. (a) Frequency sweep experiment demonstrated for M3: G’, G’’ vs. frequency f at fixed stress amplitude c = 25 Pa. (b) Amplitude sweep experiment demonstrated for M3: G’, G’’ vs. stress amplitude τ ^ c at fixed frequency f = 1 Hz. Pastes M1 and M2 behave similarly.
Coatings 08 00406 g0a2

References

  1. Ralph, E.L. Recent advancements in low cost solar cell processing. In Proceedings of the 11th Photovoltaic Specialists Conference, Scottsdale, AZ, USA, 6–8 May 1975; pp. 315–316. [Google Scholar]
  2. Field, M.B.; Scudder, L.R. Application of thick-film technology to solar cell fabrication. In Proceedings of the 12th Photovoltaic Specialists Conference, Baton Rouge, LA, USA, 15–18 November 1976; pp. 303–308. [Google Scholar]
  3. Eshkeiti, A.; Reddy, A.S.G.; Emamian, S.; Narakathu, B.B.; Joyce, M.; Joyce, M.; Fleming, P.D.; Bazuin, B.J.; Atashbar, M.Z. Screen printing of multilayered hybrid printed circuit boards on different substrates. IEEE Trans. Compon. Packag. Manuf. Technol. 2015, 5, 415–421. [Google Scholar] [CrossRef]
  4. Ostfeld, A.E.; Deckman, I.; Gaikwad, A.M.; Lochner, C.M.; Arias, A.C. Screen printed passive components for flexible power electronics. Sci. Rep. 2015, 5, 15959. [Google Scholar] [CrossRef] [PubMed] [Green Version]
  5. Kim, J.; Kim, J.; Lee, G.J.; Jeong, J.; Byeongdae, C. Screen-printed cu source/drain electrodes for a-InGaZnO thin-film transistors. Mol. Cryst. Liq. Cryst. 2013, 586, 161–167. [Google Scholar] [CrossRef]
  6. Tam, S.K.; Fung, K.Y.; Ng, K.M. Copper pastes using bimodal particles for flexible printed electronics. J. Mater. Sci. 2016, 51, 1914–1922. [Google Scholar] [CrossRef]
  7. Schwanke, D.; Pohlner, J.; Wonisch, A.; Kraft, T.; Geng, J. Enhancement of fine line print resolution due to coating of screen fabrics. J. Microelectron. Electron. Packag. 2009, 6, 13–19. [Google Scholar] [CrossRef]
  8. Faddoul, R.; Reverdy-Bruas, N.; Blayo, A. Formulation and screen printing of water based conductive flake silver pastes onto green ceramic tapes for electronic applications. Mater. Sci. Eng. B Solid State Mater. Adv. Technol. 2012, 177, 1053–1066. [Google Scholar] [CrossRef]
  9. Kumar, P.; Pfeffer, M.; Willsch, B.; Eibl, O.; Koduvelikulathu, L.J.; Mihailetchi, V.D.; Kopecek, R. N-type single-crystalline Si solar cells: Front side metallization for solar cells reaching 20% efficiency. Sol. Energy Mater. Sol. Cells 2016, 157, 200–208. [Google Scholar] [CrossRef]
  10. Wehmeier, N.; Nowack, A.; Lim, B.; Brendemühl, T.; Kajari-schröder, S.; Schmidt, J.; Brendel, R.; Dullweber, T. 21.0%-efficient screen-printed n-PERT back-junction silicon solar cell with plasma-deposited boron diffusion source. Sol. Energy Mater. Sol. Cells 2016, 158, 50–54. [Google Scholar] [CrossRef]
  11. Cheek, G.C.; Mertens, R.P.; van Overstraeten, R.; Frisson, L. Thick-film metallization for solar cell applications. IEEE Trans. Electron Devices 1984, 31, 602–609. [Google Scholar]
  12. International Technology Roadmap for Photovoltaic (ITRPV). Results 2017 Including Maturity Report 2018. Available online: www.itrpv.net/.cm4all/uproc.php/0/ITRPV Ninth Edition 2018 including maturity report 20180904.pdf?cdp=a&_=165a39bbf90 (accessed on 14 November 2018).
  13. Fellmeth, T.; Clement, F.; Biro, D. Analytical modeling of industrial-related silicon solar cells. IEEE J. Photovolt. 2014, 4, 504–513. [Google Scholar] [CrossRef]
  14. Durairaj, R.; Mallik, S.; Seman, A.; Ekere, N.N. Investigation of wall-slip effect on lead-free solder paste and isotropic conductive adhesives. Sadhana 2009, 34, 799–810. [Google Scholar] [CrossRef] [Green Version]
  15. Durairaj, R.; Man, L.W.; Ekere, N.N.; Mallik, S. The effect of wall-slip formation on the rheological behaviour of lead-free solder pastes. Mater. Des. 2010, 31, 1056–1062. [Google Scholar] [CrossRef]
  16. Hoornstra, J.; Weeber, A.W.; de Moor, H.H.C.; Sinke, W.C. The Importance of Paste Rheology in Improving Fine Line, Thick Film Screen Printing of Front Side Metallization; Netherlands Energy Research Foundation ECN: Petten, The Netherlands, 1997. [Google Scholar]
  17. Hsu, C.P.; Guo, R.H.; Hua, C.C.; Shih, C.-L.; Chen, W.-T.; Chang, T.-I. Effect of polymer binders in screen printing technique of silver pastes. J. Polym. Res. 2013, 20, 277. [Google Scholar] [CrossRef]
  18. Larry, J.R.; Rosenberg, R.M.; Uhler, R. Thick-film technology: An introduction to the materials. IEEE Trans. Compon. Hybrids Manuf. Technol. 1980, 3, 211–225. [Google Scholar] [CrossRef]
  19. Reichl, H. Hybridintegration: Technologie und Entwurf von Dickschichtschaltungen; Hüthig Verlag: Heidelberg, Germany, 1986. (In German) [Google Scholar]
  20. Riemer, D.E. The theoretical fundamentals of the screen printing process. Microelectron. Int. 1989, 6, 8–17. [Google Scholar] [CrossRef]
  21. Thibert, S.; Jourdan, J.; Bechevet, B.; Chaussy, D.; Reverdy-Bruas, N.; Beneventi, D. Influence of silver paste rheology and screen parameters on the front side metallization of silicon solar cell. Mater. Sci. Semicond. Process. 2014, 27, 790–799. [Google Scholar] [CrossRef]
  22. Xu, C.; Fieß, M.; Willenbacher, N. Impact of wall slip on screen printing of front-side silver pastes for silicon solar cells. IEEE J. Photovolt. 2017, 7, 129–135. [Google Scholar] [CrossRef]
  23. Zhou, Y.; Tong, H.; Liu, Y.; Yuan, S.; Yuan, X.; Liu, C.; Zhang, Y.; Chen, G.; Yang, Y. Rheological effect on screen-printed morphology of thick film silver paste metallization. J. Mater. Sci. Mater. Electron. 2017, 28, 5548–5553. [Google Scholar] [CrossRef]
  24. Yüce, C.; Willenbacher, N. Challenges in rheological characterization of highly concentrated suspensions—A case study for screen-printing silver pastes. J. Vis. Exp. 2017, 122, 55377. [Google Scholar] [CrossRef]
  25. Ballif, C.; Huljić, D.M.; Willeke, G.; Hessler-Wyser, A. Silver thick-film contacts on highly doped n-type silicon emitters: Structural and electronic properties of the interface. Appl. Phys. Lett. 2003, 82, 1877–1880. [Google Scholar] [CrossRef]
  26. Qin, J.; Zhang, W.; Liu, Z.; Bai, S. Effects of polymer binder on rheological properties of silver pastes for screen printing front electrode films of solar cells. Int. J. Mod. Phys. B 2015, 29, 1540027. [Google Scholar] [CrossRef]
  27. Qin, J.; Bai, S.; Zhang, W.; Liu, Z.; Wang, H. Effects of organic medium on rheological properties of silver pastes for crystalline silicon solar cells. Circuit World 2016, 42, 77–83. [Google Scholar] [CrossRef]
  28. Jiang, J.-S.; Liang, J.-E.; Yi, H.-L.; Chen, S.-H.; Hua, C.-C. Rheological fingerprints of time-evolving polymer-particle interaction and sol-gel transition in silver pastes. J. Polym. Res. 2015, 22, 144. [Google Scholar] [CrossRef]
  29. Lin, H.-W.; Chang, C.-P.; Hwu, W.-H.; Ger, M.-D. The rheological behaviors of screen-printing pastes. J. Mater. Process. Technol. 2008, 197, 284–291. [Google Scholar] [CrossRef]
  30. Xu, C.; Willenbacher, N. How rheological properties affect fine-line screen printing of pastes: A combined rheological and high-speed video imaging study. J. Coat. Technol. Res. 2018, 15, 1401–1412. [Google Scholar] [CrossRef]
  31. Holmberg, K.; Jönsson, B.; Kronberg, B.; Lindmann, B. Surfactants and Polymers in Aqueous Solutions, 2nd ed.; John Wiley & Sons, Ltd.: Hoboken, NJ, USA, 2003. [Google Scholar]
  32. Anthony, H.; Nguyen, Q.D. Rotating vane rheometry—A review. J. Nonnewton. Fluid Mech. 2001, 98, 1–14. [Google Scholar]
  33. Barnes, H.A.; Carnali, J.O. The vane-in-cup as a novel rheometer geometry for shear thinning and thixotropic materials. J. Rheol. 1990, 34, 841–866. [Google Scholar] [CrossRef]
  34. Macosko, C.W. Rheology: Principles, Measurements, and Applications; Wiley-VCH: Weinheim, Germany, 1994. [Google Scholar]
  35. Asakura, S.; Oosawa, F. Interaction between particles suspended in solutions of macromolecules. J. Polym. Sci. 1958, 126, 183–192. [Google Scholar] [CrossRef]
  36. Mewis, J.; Wagner, N.J. Colloidal Suspension Rheology; Cambridge University Press: Cambridge, UK, 2012. [Google Scholar]
  37. Meeker, S.P.; Bonnecaze, R.T.; Cloitre, M. Slip and flow in pastes of soft particles: Direct observation and rheology. J. Rheol. 2004, 48, 1295–1320. [Google Scholar] [CrossRef]
  38. Martinie, L.; Buggisch, H.; Willenbacher, N. Apparent elongational yield stress of soft matter. J. Rheol. 2013, 57, 627–646. [Google Scholar] [CrossRef]
  39. Shih, W.Y.; Aksay, I.A.; Kikuchi, R. Reversible-growth model: Cluster-cluster aggregation with finite binding energies. Phys. Rev. A 1987, 36, 5015–5020. [Google Scholar] [CrossRef]
  40. Drabczyk, K.; Panek, P. Influence of screen printing parameters on the front metallic electrodes geometry of solar cells. Circuit World 2014, 40, 23–26. [Google Scholar] [CrossRef]
  41. Erath, D.; Filipovic, A.; Retzlaff, M.; Goetz, A.K.; Clement, F.; Biro, D.; Preu, R. Advanced screen printing technique for high definition front side metallization of crystalline silicon solar cells. Sol. Energy Mater. Sol. Cells 2010, 94, 57–61. [Google Scholar] [CrossRef]
Figure 1. Yield stress values of vehicles and silver pastes determined from rotational rheometry (vane-and-cup fixture). Patterned bars represent the model vehicles (V1–V3) and filled bars the model pastes (M1–M3) containing 80 wt % silver particles.
Coatings 08 00406 g001
Figure 2. (a) Low shear viscosity values determined from rotational rheometry (parallel-plate geometry, dplate = 25 mm, Rq = 2–4 µm, h = 1 mm) at γ ˙ = 0.5 s−1; (b) High shear viscosity results determined using a capillary rheometer (Lnozzle = 40 mm, dnozzle = 0.5 µm) at γ ˙ = 3 × 10⁵ s−1. Patterned bars correspond to vehicles, filled bars represent silver pastes.
Coatings 08 00406 g002
Figure 3. Slip velocity of model pastes on steel rheometer plate with roughness Rq = 1 µm as a function of applied shear stress, vslip, determined as described in Section 3.1. The characteristic slip velocity V* occurs at the yield stress of the paste.
Coatings 08 00406 g003
Figure 4. (a) Plateau modulus G0 = G’ (f = 1 Hz) determined in the LVE regime; (b) Critical stress amplitude τ ^ c determined from the crossover of G’ and G’’ in amplitude sweep experiments performed at f = 1 Hz. Patterned bars correspond to vehicles, filled bars represent silver pastes.
Coatings 08 00406 g004
Figure 5. (a) Degree of structural recovery for vehicles and silver pastes represented as Gfin/Gini determined from oscillatory three-interval thixotropy tests. The applied oscillatory amplitude in Sections I and III is in each case γ ^ I,III = 0.05% and in Section II γ ^ II = 90%; (b) Absolute degree of recovery GIII,20 s after 20 s rest time in section III at γ ^ III = 0.05%. Patterned bars correspond to vehicles, filled bars represent silver pastes.
Coatings 08 00406 g005
Figure 6. Fracture strain ε results obtained from sample stretching experiments measured with the capillary breakup elongation rheometer (CaBER) device at vstretch = 110 mm s−1 stretching speed. Exemplary pictures of stretched and broken filaments for vehicles and silver pastes are shown inset. Patterned bars correspond to vehicles, filled bars represent silver pastes.
Coatings 08 00406 g006
Figure 7. Model silver paste M3 printed on a (Cz) Si wafer using a test layout pattern with eight different finger openings between 20 and 55 µm at printing speed vprint = 210 mm s−1.
Coatings 08 00406 g007
Figure 8. Resulting finger widths wf printed through a 50 µm finger opening are plotted versus printing speed vprint (70, 140, and 210 mm s−1) for model silver pastes M1, M2, and M3.
Coatings 08 00406 g008
Figure 9. Finger width values for M1, M2, and M3 printed through 25, 30, and 50 µm finger openings at vprint = 210 mm s−1.
Coatings 08 00406 g009
Figure 10. Degree of fluctuation in dried finger line width after screen-printing at vprint = 210 mm s−1.
Coatings 08 00406 g010
Figure 11. Finger height hf results for M1, M2, and M3 printed through 25, 30, and 50 µm finger openings at vprint = 210 mm s−1.
Coatings 08 00406 g011
Figure 12. (a) Aspect ratio AR determined for M1, M2, and M3 at 25, 30, and 50 µm finger openings and 210 mm s−1 printing speed in relation to the yield stress; (b) Finger cross sections Af obtained for M1, M2, and M3 at 25, 30, and 50 µm finger openings and vprint = 210 mm s−1 as a function of yield stress.
Coatings 08 00406 g012
Table 1. Overview of investigated model vehicles (V1, V2, and V3) and model silver pastes (M1, M2, and M3). Vehicles included thixotropic agent and ethyl cellulose binder at varying mixing ratios. Model silver pastes additionally contained 80 wt % (corresponding to 36.4 vol %) spherical silver particles (x50 = 1.5 µm).
SampleSilver Particles (wt %)Thixotropic Agent (wt %)Ethyl Cellulose Binder (wt %)Organic Solvent (wt %)
V1011.735.6182.65
V2011.805.0583.14
V3013.495.5081.00
M1802.351.1216.53
M2802.361.0116.63
M3802.701.1016.20
Table 2. Paste transfer for model silver pastes M1, M2, and M3 obtained through 50 µm finger opening at different printing velocities 70, 140, and 210 mm s−1.
Printing SpeedPaste Laydown (mg)
M1M2M3
70 mm s−152.00 ± 0.8553.60 ± 0.9856.10 ± 1.06
140 mm s−152.30 ± 0.5353.80 ± 0.1456.00 ± 0.12
210 mm s−152.90 ± 0.1453.20 ± 0.6453.50 ± 0.64

