1. Introduction
Lasers can be used in a lot of different technical applications. While in measuring technologies the specific characteristic of this type of light is important, in production processes the extremely high energy density makes it a crossover technology which is used for laser-assisted tape laying of thermoplastic prepregs [
1] as well as for cutting thick metal sheets, or even surface structuring.
Martensitic laser hardening has been one of the first industrial laser processes used. Compared with other laser surface treatments it requires a relatively low intensity. However, for hardening large areas in a single step usually a lot of power is required. While an intensity between 10 and 100 W/mm² [
2,
3] is usually sufficient, laser sources with an average power between 2 kW and 5 kW are necessary depending on the size of the area. When lasers were first introduced into production, CO
2 lasers were the only affordable laser sources supplying enough power. The main disadvantage of CO
2 lasers, besides their high maintenance costs, is the long wavelength of about 10 µm. The absorption of electromagnetic radiation in steel is very low (<15%) at higher wavelengths and therefore it has been necessary to use carbon coatings to increase absorption [
4].
Today this additional process step can be dropped. Developments in semiconductor technology have enabled high power diode lasers (HPDL) with several kW laser power [
5]. These are usually associated with low beam quality and therefore low intensity [
3]. However the intensity level is high enough, not only for hardening, but also for cladding and other processes [
2]. Combined with the feasibility of light guiding through a coupled fiber and their low maintenance costs they are nowadays the-state-of-the-art laser source for hardening [
2]. Even in overall energy efficiency they became competitive to induction hardening [
6]. To achieve the necessary power density most HPDL need a superposition of several laser beams provided by so called diode stacks. Current research points that in the future direct emitting laser diodes will reach high enough power densities to actually emit light directly onto the surface [
7]. Besides other benefits the intensity distribution of these sources can be easily adjusted by switching individual diode arrays of the stacks on and off.
Until this technology will be available, optical elements such as mirrors, lenses or fibers have to be used which guide the light from the laser sources to the work piece. The easiest way to achieve this is by using one or two lenses between the laser source and the work piece. Most systems have complex optics which not only project the laser spot onto the work piece but also change the shape or even the power density distribution [
8,
9,
10]. The usage of such optics has been investigated in the following research.
To harden a surface, a laser has to heat up the material above the austenite temperature. After holding this temperature long enough for the carbon to diffuse, the surface has to be cooled down fast. Thereby the carbon cannot diffuse and is trapped in the ferritic matrix, distorting it to hard martensite.
Although laser hardening has been in industrial usage for more than 40 years, there are still some unsolved issues. The optimization of the microstructure as well as the thermal stresses [
3,
11] and the deformation are still ongoing investigations. Also the reduction of the tempering effect that appears when several hardening tracks are placed next to each other is a main challenge [
8,
12,
13]. The enabler to enhance all of these factors is the temperature field [
14] that is caused by the intensity distribution of the laser as well as the feed rate, spot size and temperature regulation. A lot of research has been done to predict the outcome of these parameters by simulation [
12,
15,
16,
17]. Kunc et al. [
18], for example, predicted multitrack hardening of the investigated 42CrMo4 (AISI 4140). Bailey et al. [
11] added a diffusion model to a thermal finite element method (FEM) analysis to predict the hardness as well as the stresses of laser hardened 42CrMo4 (AISI 4140). Mioković et al. [
19] researched the effect of the austenitisation process as well as the martensitic kinetics. Tobar et al. [
14] implemented an even more complex model of the metallurgical effect in laser hardening. Leung et al. [
20] described the effect of an optimized intensity distribution caused by a diffractive optical kinoform. The following excursus shall explain some of the effects that appear with commonly used intensity distributions. Therefore, an analytical model has been used to illustrate the resulting temperature field in the work piece.
1.1. Excursus on Laser Intensity Distributions
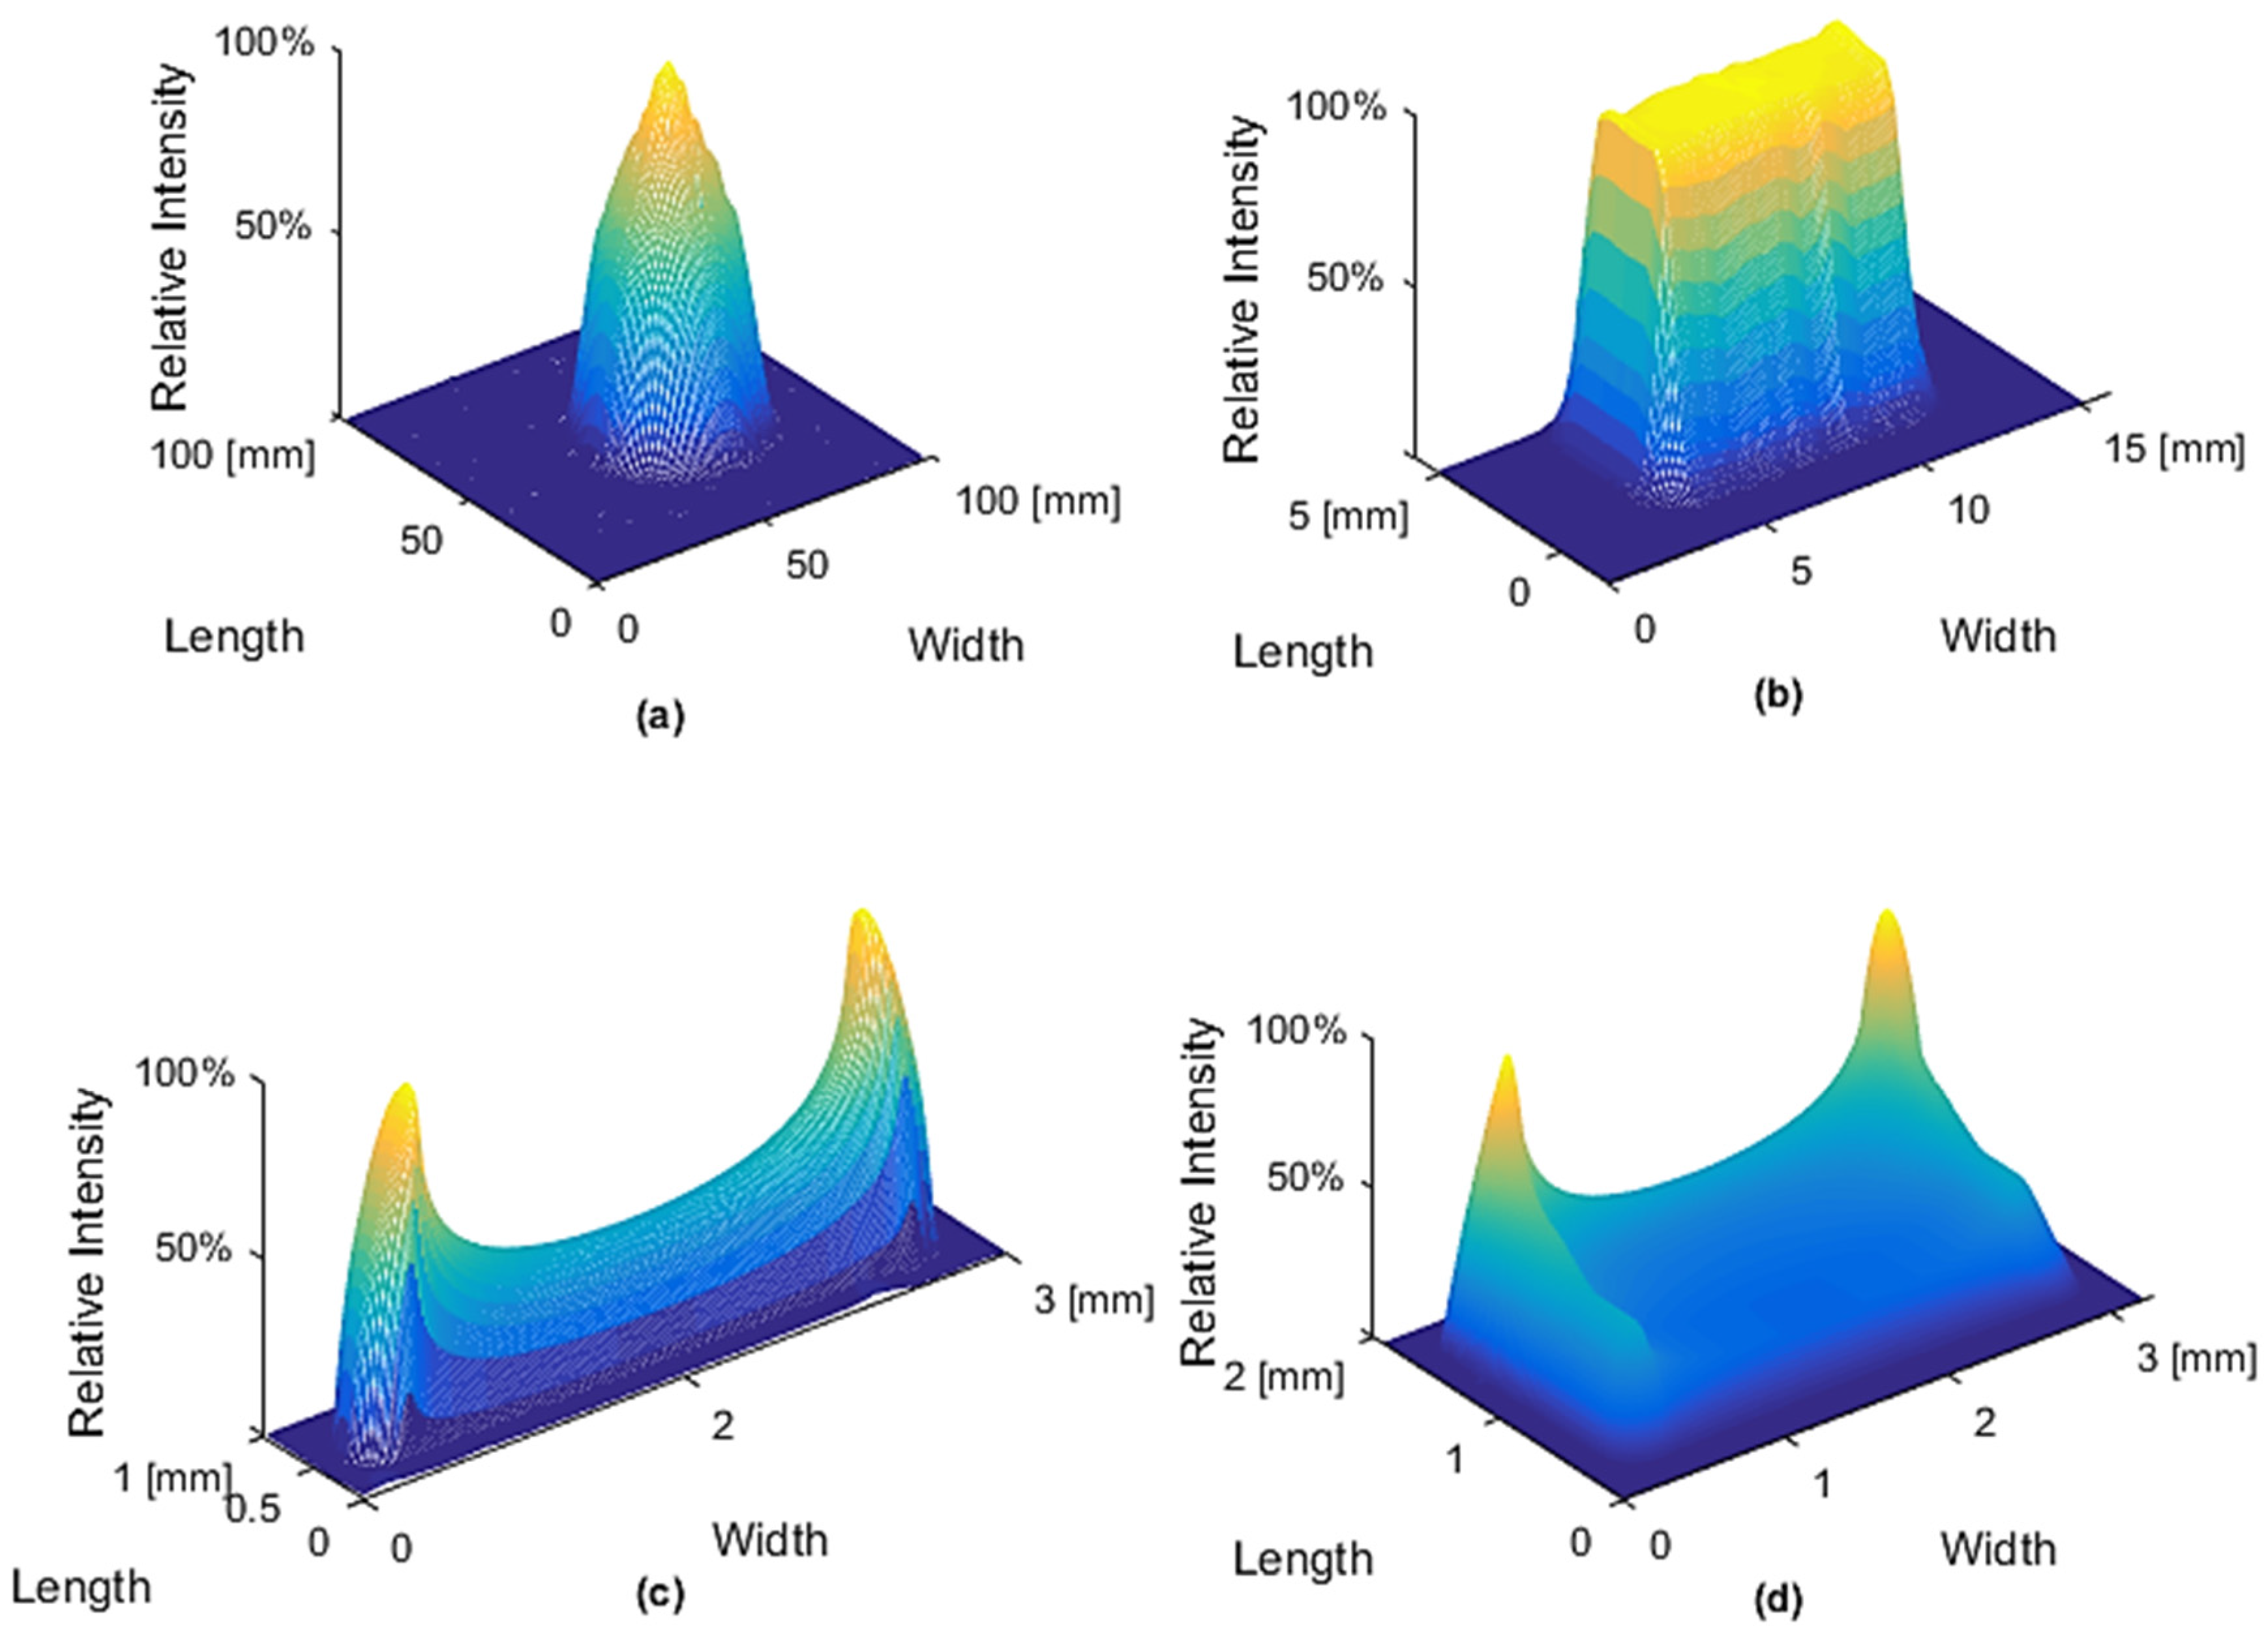
Four commonly-used laser intensity distributions exist for laser hardening, two of which can be generated with static optical elements, which are the defocused, round top-hat profile and the rectangular top-hat profile. With scanning mirrors, the intensity profile might be generated by a harmonic oscillation or the optimized intensity distributions which was calculated by Burger [
10]. To show the effects of these intensity distributions on the thermal field on the work piece, thermal simulations have been executed. Input for running these simulations have been measured and pre-calculated intensity distributions. The profiles can be seen in
Figure 1, while the simulation of the thermal field caused by these profiles is shown in
Figure 2 and
Figure 3. The thermal simulation was set up using a semi analytical approach.
Based on Green’s function the thermal profiles of individual heat sources can be summed up [
21]. This technique was pretty common in the past when computing power was more expensive, and therefore it was used by Geissler [
13] as well as Rudlaff [
9] and Burger [
10]. Compared with FEM it is beneficial that the solution does not depend on the size of the calculated grid but only on the size of the intensity data. Also, the calculation of high-resolution in a plane is way faster than with a FEM approach. The temperature range can be changed by a linear transformation of the solution. The major disadvantage of this method is that the solution is only valid for certain boundary conditions upon which the analytical solution is based. These conditions are for example an infinite body and a stationary status. The dependency of the specific values of the temperature cannot be taken into account. Therefore, a certain error has to be considered [
22]. In this introduction the simulation shall not be used for a numerical approach but to visualize the effect of different intensity distributions.
The thermal fields that are caused by these intensity distributions were calculated based on superposition of the moving point source described by Formula (1) [
21]. Formula (2) shows the superposition at a certain point and Formula (3) the radius which has to be calculated for each element of the intensity matrix. According to the formulas, the temperature (
T) at the point
x,
y,
z is determined by the laser power (
PL), the material parameters (ρ
0,
cp, κ), the travel speed (
v) and the distance to the center of the individual point source (Δ
xkx, Δ
yky,
z). The intensity distribution can be described by the normalized factor (μ
kxky) and the number of elements in the intensity matrix (
ny,
nx). The grid size was set to 10 × 10 µm² and the depth of the plane shown was 100 µm. The temperature was normalized to 1225 °C at the hottest spot and the material properties of 42CrMo4 (AISI 4140) at room temperature had been used.
The first laser profile in
Figure 1a represents the measured beam of a defocused Laserline 4.5 kW diode laser source with 33 mm mrad. In the focal plane, the laser beam had a 1 mm spot diameter and in the defocused plane about 40 mm. While the density distribution in the focal plane can be described as top-hat, defocusing leads to a Super-Gaussian profile. Therefore, the following text also applies for Gaussian profiles. As can be seen in the thermal simulation in
Figure 2a the properties of a beam like this are far from being optimal. The temperature reaches the highest value in the center. By the process, these are restricted to 1225 °C so the melting temperature cannot be reached. To the edges of the processing area, the temperature goes down steadily. For a better visualization the temperature of 850 °C, at which the material is austenitized, is highlighted in the figure by the dashed line. Looking into the depth, the heated and hardened zone will be characterized by an undesired round cross section. The main benefit, the high resolution of the thermal input of a laser process, is lost due to defocusing. Although this negative effect of defocusing is well known, in practice this procedure is still common as no complex and therefore cost intensive optical elements have to be used and the spot size can be adapted easily [
8]. Especially with CO
2 lasers defocusing was usually preferred, because transparent optics were problematic for the wavelength of 10.6 µm. For instance, defocusing was used by Yang at al. [
23] and also described by Burger [
10].
The second and by far most commonly used beam shape is a top-hat intensity distribution of a homogenized rectangular laser beam. Therefore homogenizer is often used, which usually project the laser spot to an array of spots, but other techniques are also common [
24]. By the integration of several spots, the intensity distribution is homogenized and the outer shape can be changed, for example to a rectangle. As optical elements, arrays of cylindrical lenses, facetted mirrors and kaleidoscopes can be used [
25]. Kaleidoscopes usually have an efficiency loss due to reflection of 20% [
25]. The intensity distribution shown in
Figure 1b is generated by a commercially available optic of the company Laserline, which is transforming the round laser spot of the fiber to a rectangular spot of 16 × 4 mm². This spot has also been used in the upcoming experimental section. Although this density distribution is commonly used, the resulting temperature field in
Figure 2 points out the restrictions. The center of the laser spot is overheating and a lens effect will occur due to the higher heat conduction on the side of the hardened zone. The size of the spot in most cases is fixed, but it can be adapted by changing the lenses in a modular system. Even an online adjustment is possible using zoom optics [
3].
While the first two intensity distributions have been generated with a static optic, laser scanners allow a way higher flexibility. This is one of the main advantages of laser hardening [
15]. High feed rates of the laser spot on the surface can be reached with oscillating mirrors. The speed of the heat conduction into the work piece is limited. That is why normally the laser scanner is only used to generate a local intensity distribution pattern. The main feed to process the surface is realized by the movement of the axis of a robot or another handling system. If the speed of the spot on the surface is way higher than the heat conduction, it can be assumed that the intensity distribution generated on the work piece is equal to the integration of the movement in one time period [
9,
10].
The intensity profiles, which can be generated using a laser scanner (
Figure 1c,d), had been calculated as numerical integration of a measured, round laser spot. The laser spot had a diameter of 1 mm. The laser was a fiber laser from the company IPG with a total power of 6 kW.
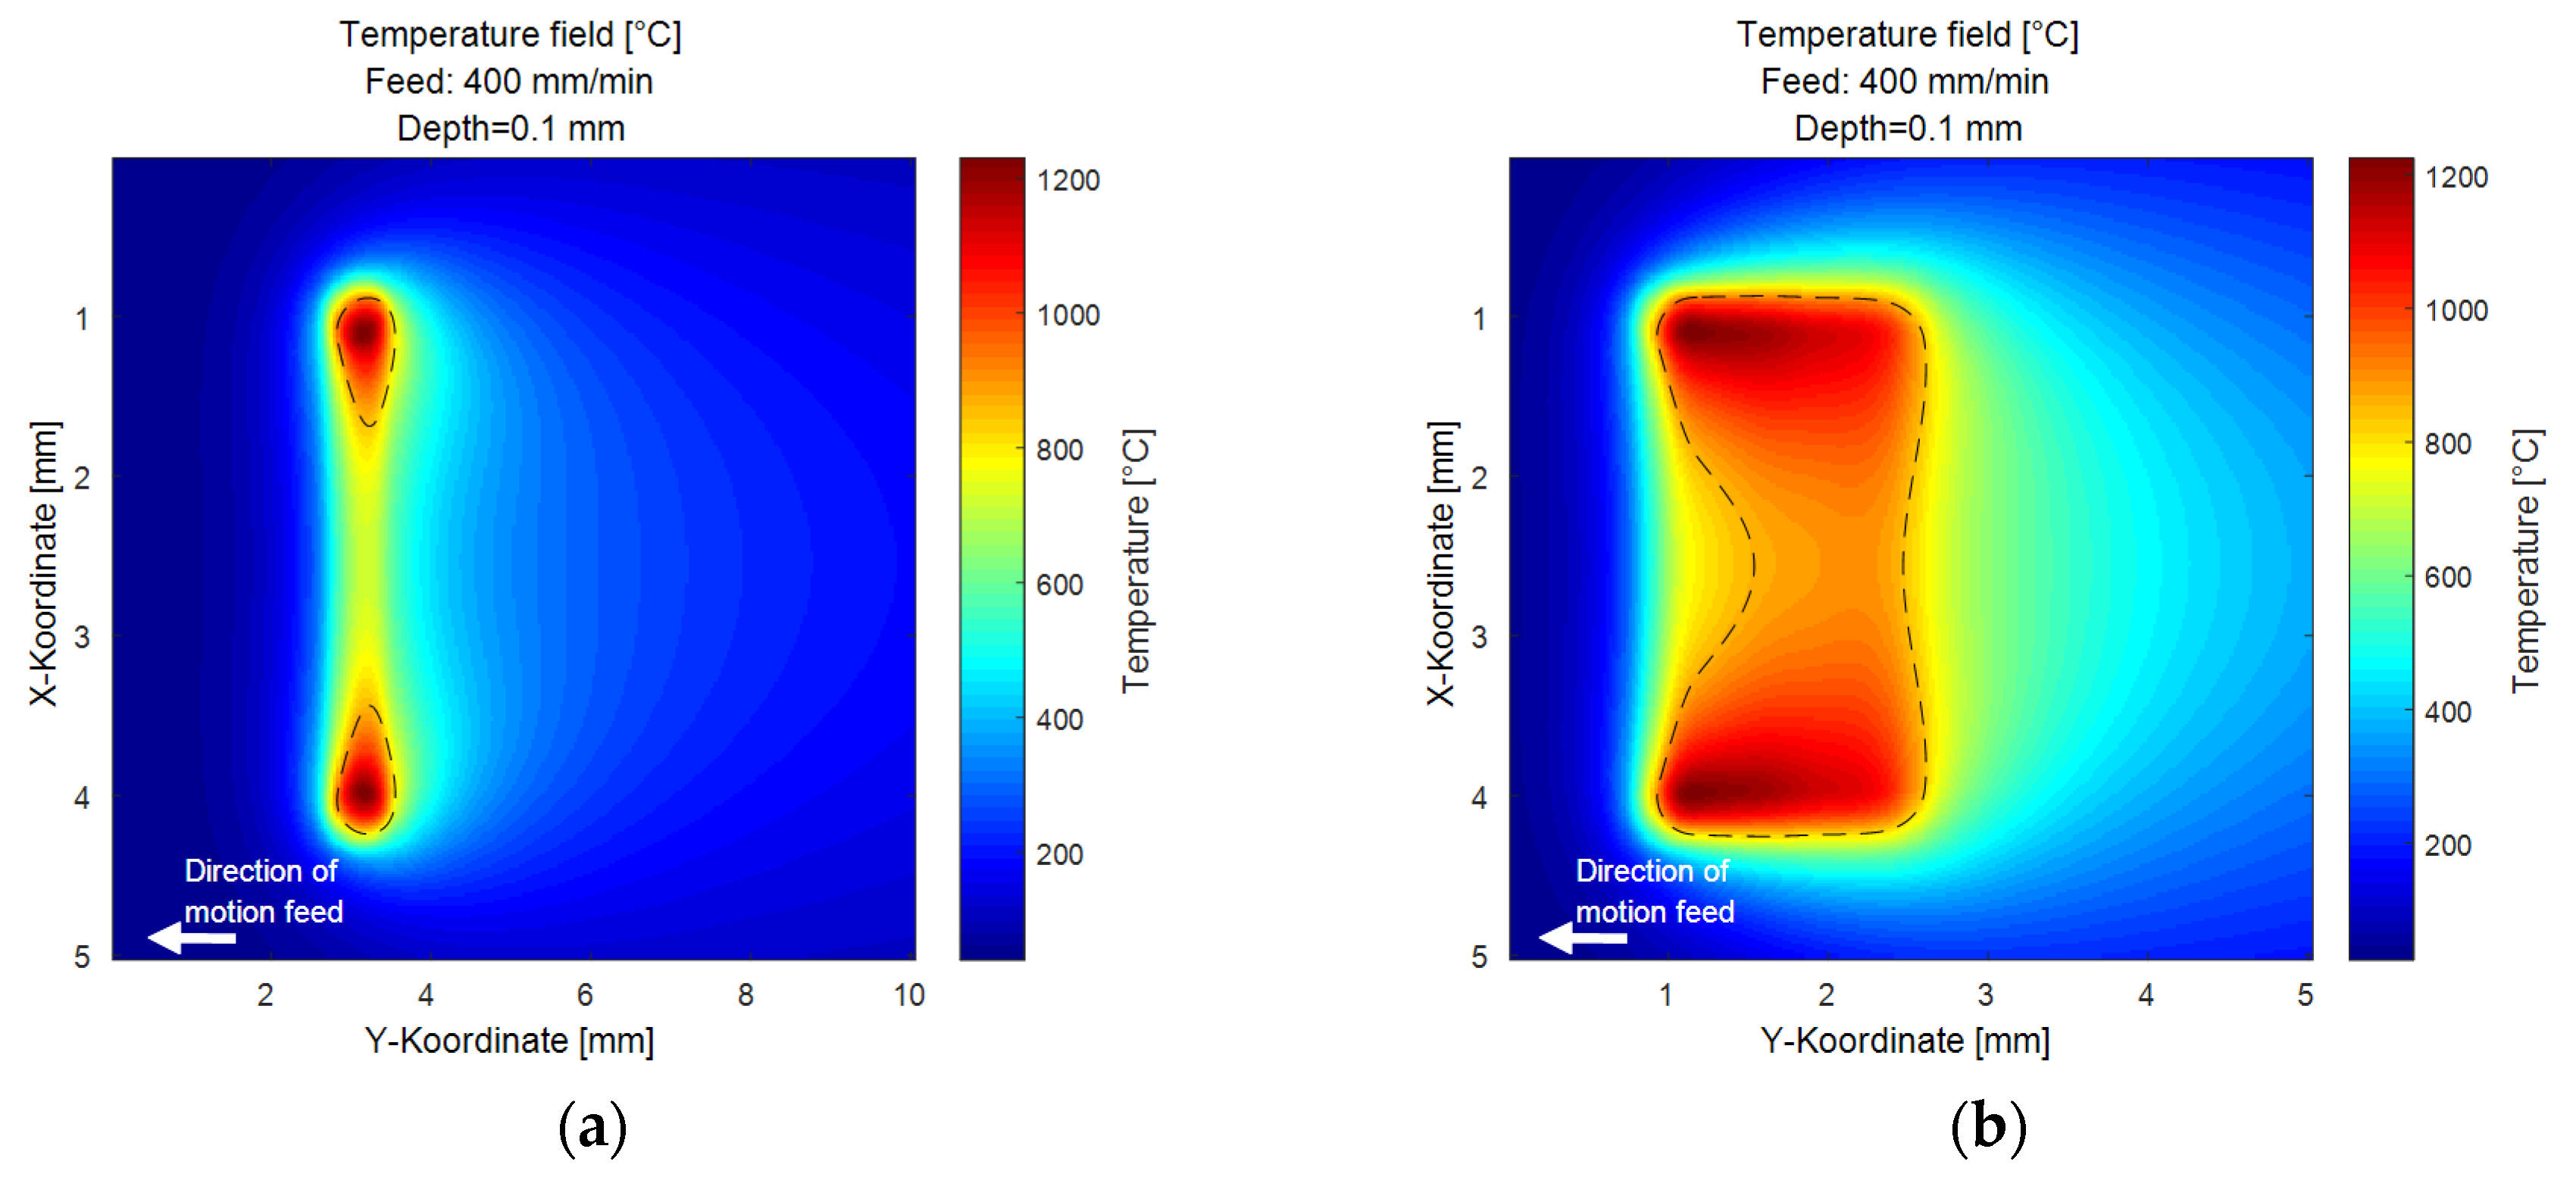
For the first distribution calculated, it was assumed that the scanner mirror moved only in a harmonic oscillation. This oscillation mode allows the highest frequencies. However, it has a major drawback: Due to the deceleration at the turnaround points, the distribution shows, in
Figure 3a, the appearing thermal overheating on the edges of the track. The whole thermal affected zone in direction of the movement is very slim and in the middle of the track the temperature does not reach the austenite temperature.
With a second scanning mirror, more complex intensity distributions can be generated, such as so-called Lissajous curves. To overcome the restriction of the harmonic oscillator, Burger researched a laser intensity profile for efficient hardening. The profile which he developed often is called the “armchair” profile after its recognizable shape [
9,
10]. The distribution is realized by adding a triangular movement to the harmonic oscillation. The peaks at the beginning of the intensity profile and the slightly higher edge peaks are able to compensate the higher thermal conduction on the sides of the laser spot. While using this distribution, a homogenous top-hat temperature field can be achieved. The second temperature field in
Figure 3b shows temperature distributions if the scanning strategy is not adapted properly to the material properties (e.g. heat conductivity). Although again the edges are overheated, it still seems to be the best among the profiles discussed, because it generates sharp edges and a zone in the middle of the beam where the temperature is above austenite temperature for long enough to enable the diffusion process. The adaption to generate a homogeneous temperature distribution and optimize the profile can either be realized by calculating the inverse heat conducting problem [
26] or by trial and error experiments [
25].
1.2. The Benefits of Freeform Optics
Although the laser scanning systems have the ability to change the intensity distribution easily, they have some significant disadvantages; for example, the cost of the system as well as the vulnerability of moving high precision optical elements in a harsh production environment. By a rough calculation, Burger [
10] evaluated that a scanning frequency of more than 1 kHz is required to get the beneficial effects of the optimized temperature profile. Rudlaff confirmed this estimation with a simulation [
9]. With increasing beam quality the frequency gets higher, which is necessary to prevent melting on the surface [
10,
25]. Although 27 years have gone by since Burger made these first calculations, oscillating frequencies above 1 kHz are still challenging for galvanometric scanners, especially when the size of the mirrors has to be large to resist the necessary high laser power and when the amplitude of the tracks gets larger [
27].
Freeform mirrors are an alternative approach to customize the intensity distribution to a certain process requirement. In principle, they work quite similarly to a faceted reflector, which is used for the homogenizer. But instead of projecting the laser light on a discrete surface, they project the light continuously changing the intensity distribution.
Although the manufacturing of metallic mirrors to focus the laser is a known technique, there are several reasons why they became less popular. First, mirrors were more common for CO
2 lasers, because the transparent materials for 10 µm were rather complicated to handle. With the lower wavelength of diode lasers, glass can be used which can be processed to reach the necessary surface quality. The optical surface quality, which is needed for the mirrors on the other hand is depending on the wavelength. Therefore, because of the factor of ten between the wavelengths, the manufacturing process for metallic mirrors becomes more expensive making non-parabolic reflectors uneconomical. For non-spherical and even non-aspherical optics, the manufacturing of glass becomes challenging due to its brittleness, and metallic mirrors become an alternative again [
28].
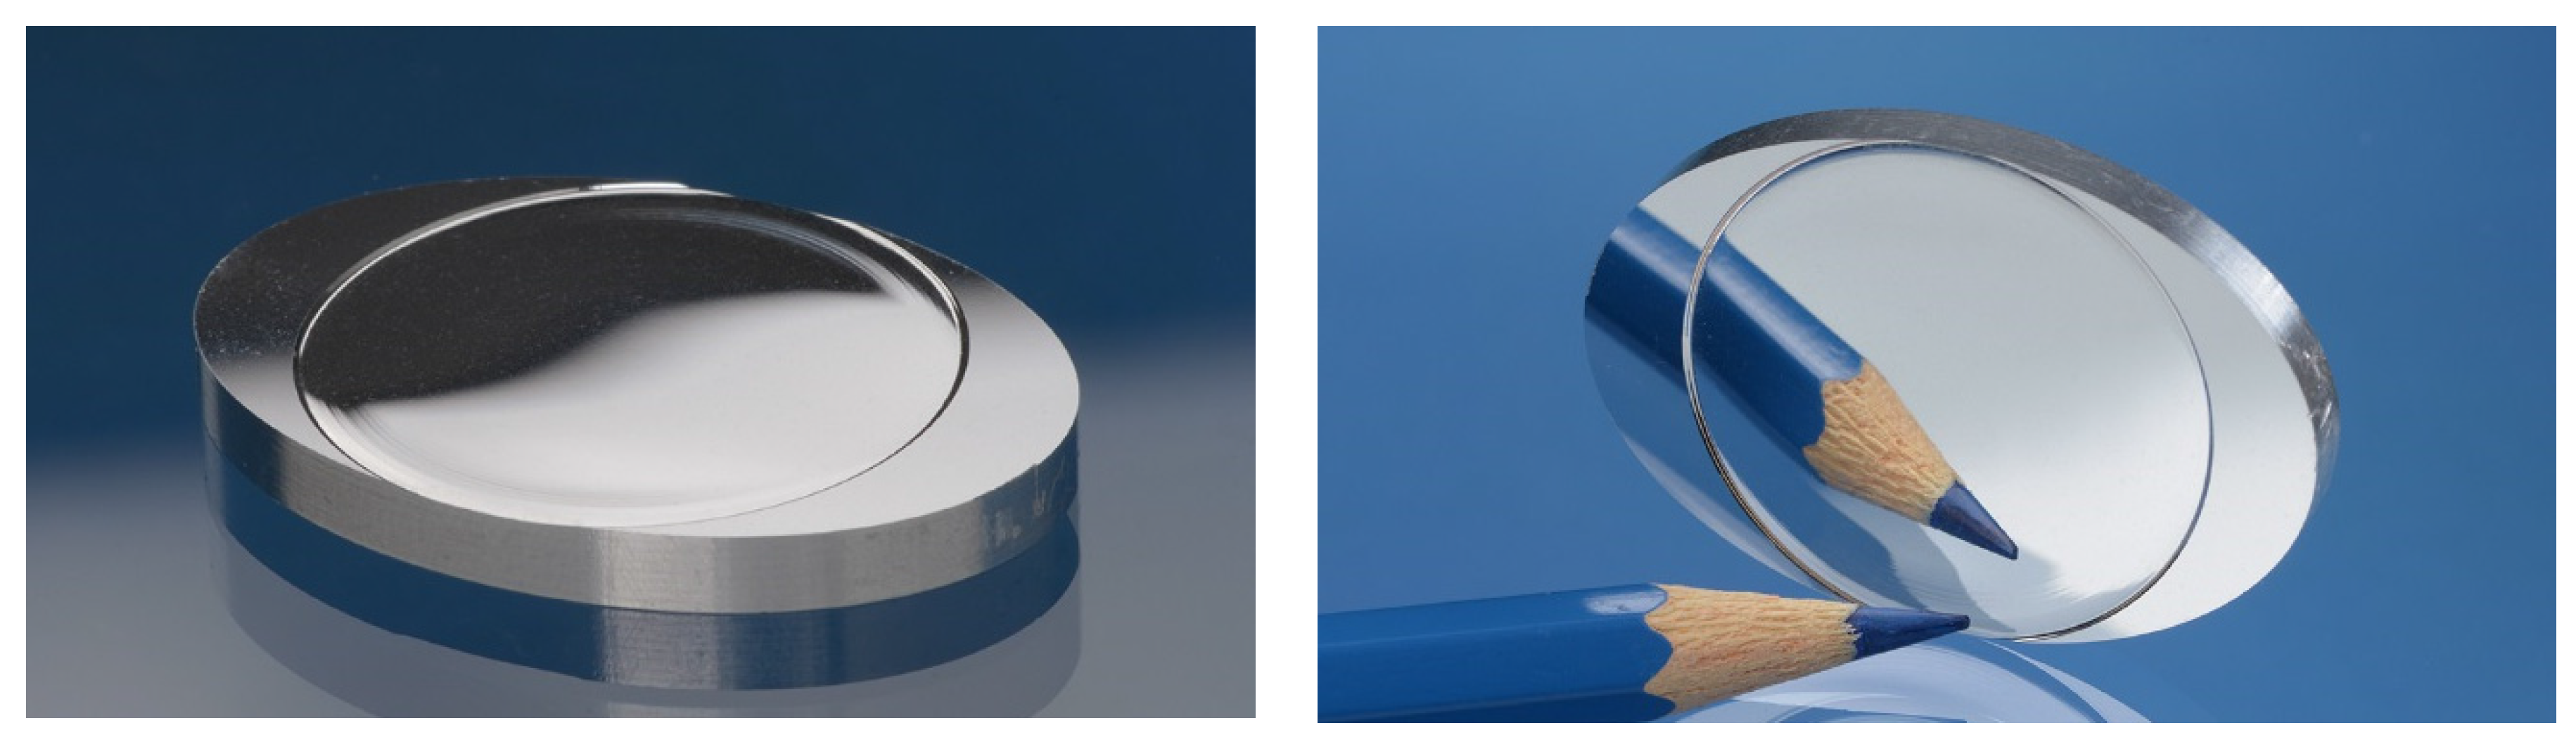
In recent years, due to progress in the development of ultrahigh precision machining, it is possible to manufacture metallic mirrors more effectively. Currently this technique is able to generate any necessary freeform surface with an extreme high optical surface quality, making any post processing steps like polishing dispensable [
28]. For the experimental part of this paper the mirror was manufactured by the company Innolite. It can be seen in
Figure 4. The mirror has been made out of aluminum and later was covered with a silver coating to enhance the reflectivity.
2. Materials and Methods
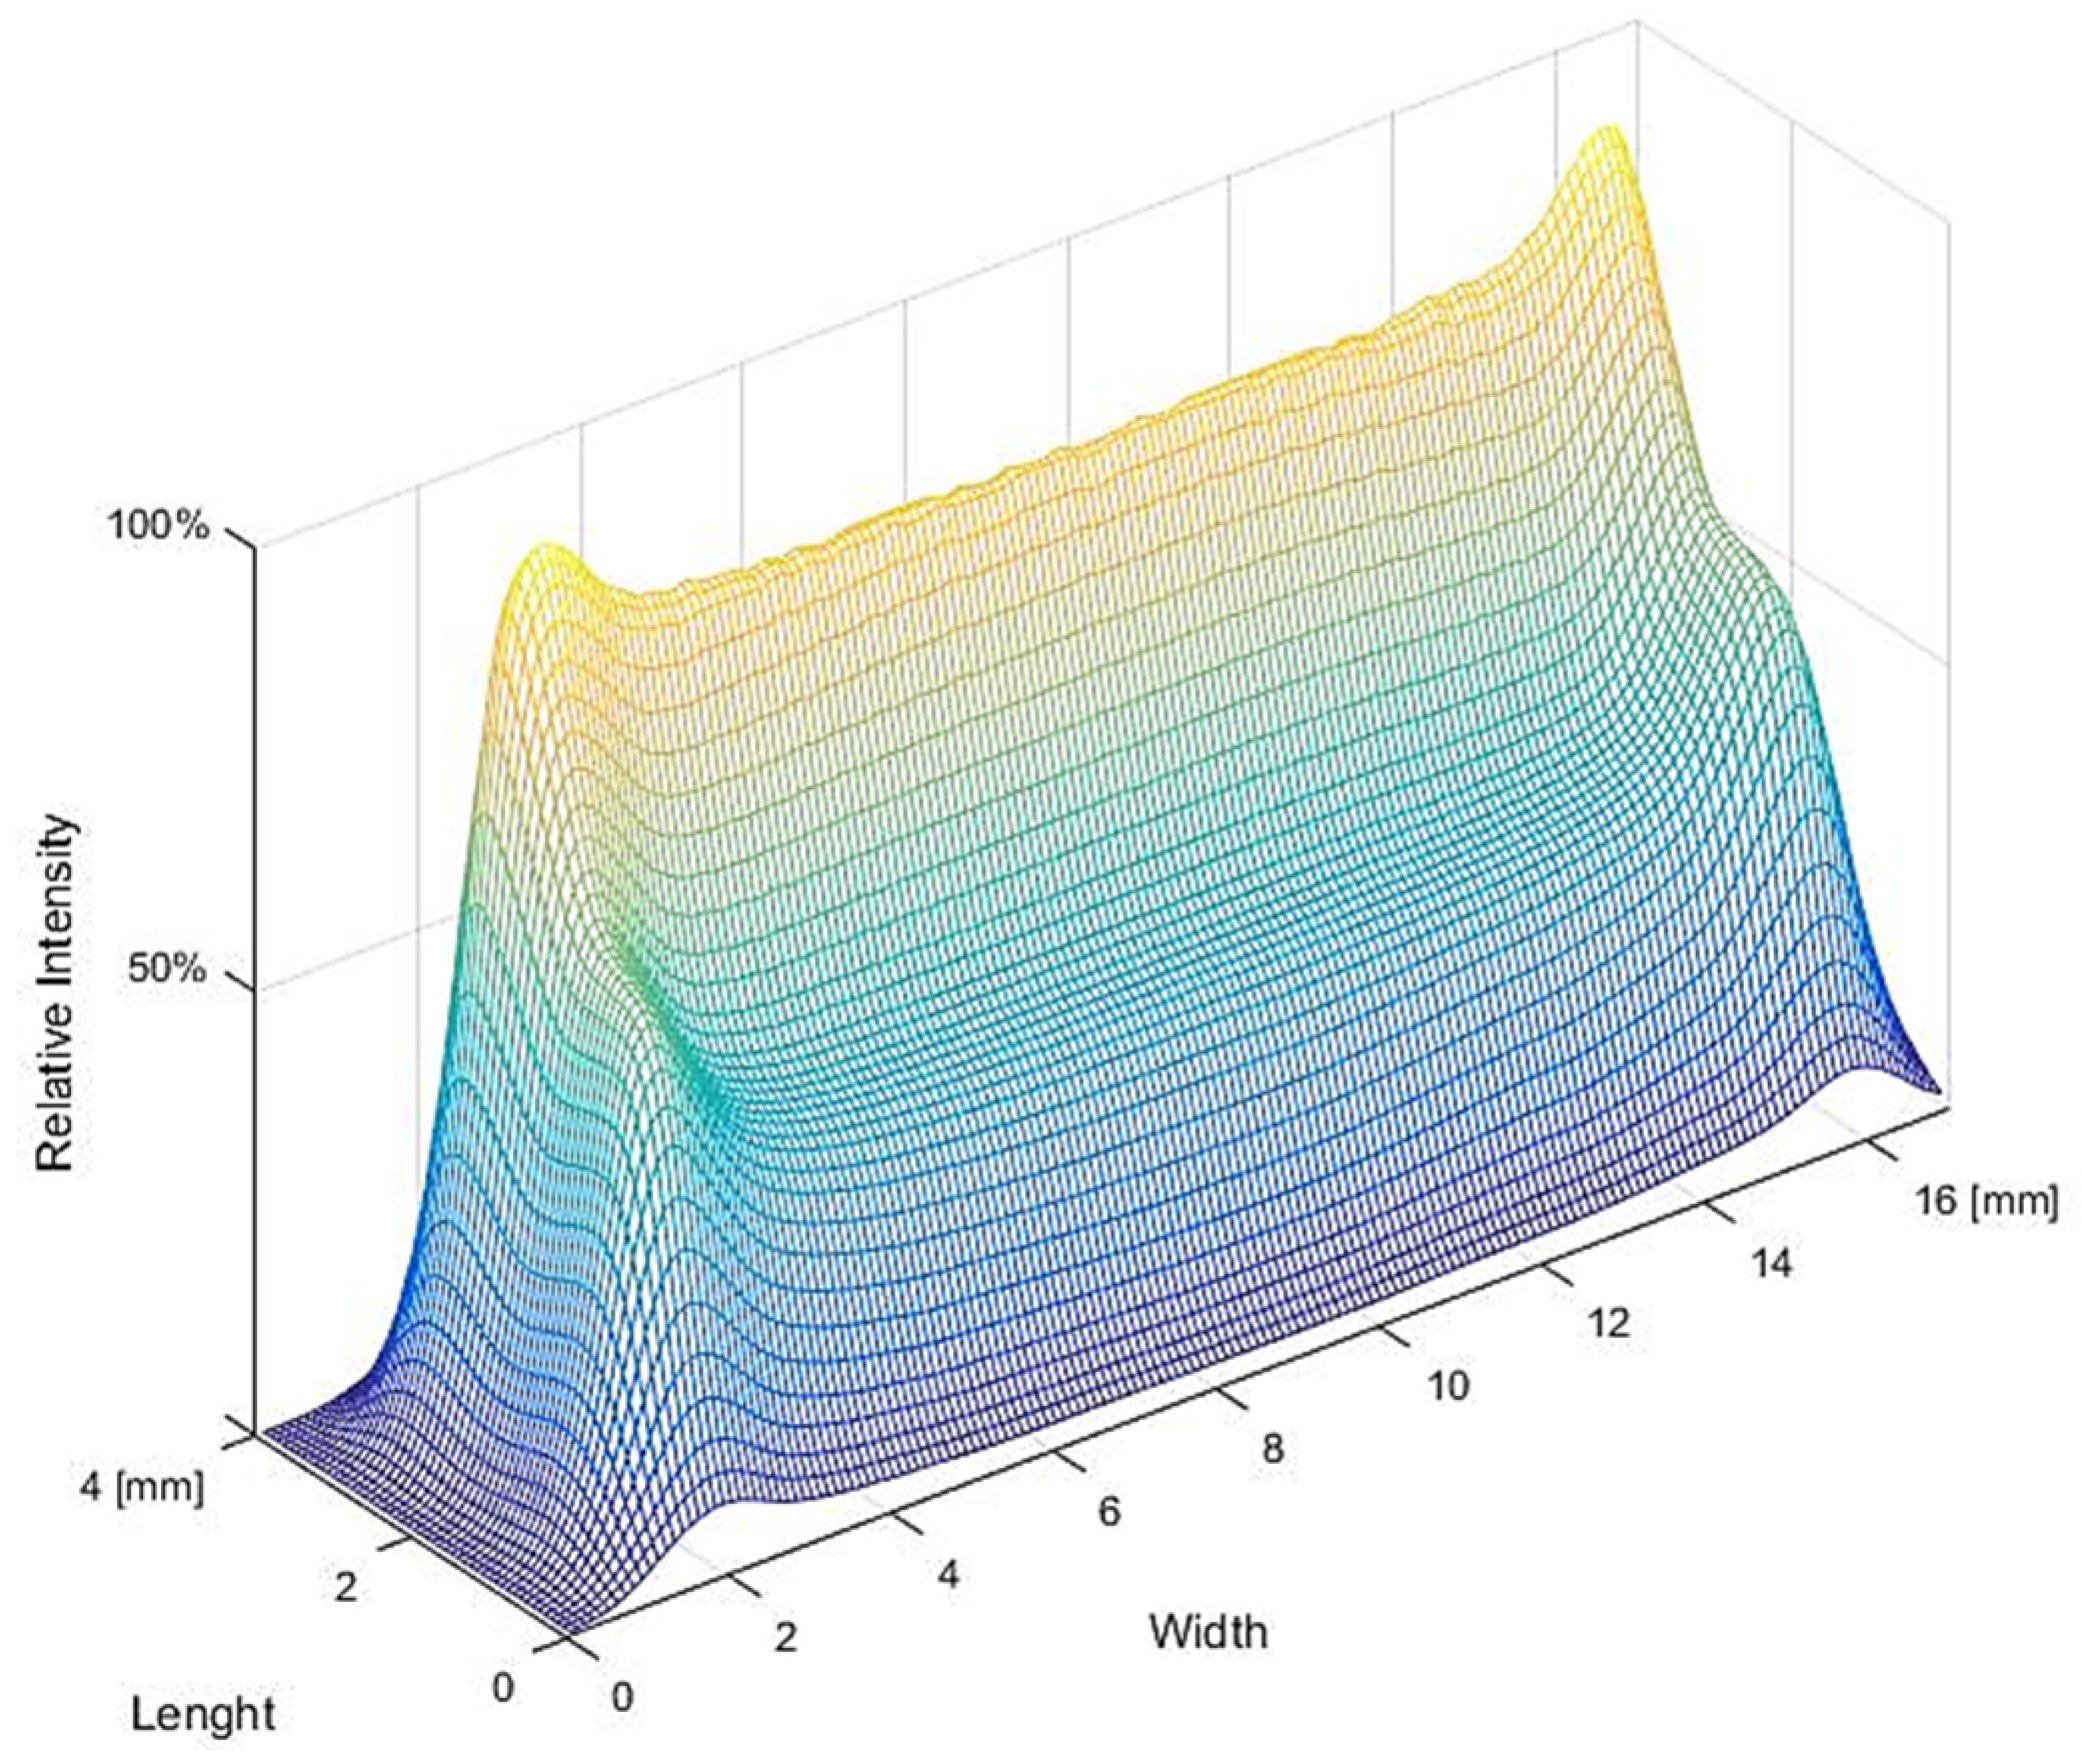
Shafts with a diameter of 50 mm made of 42CrMo4 (AISI 4140) have been hardened on the lateral area using a homogenized top-hat laser spot with a spot size of 16 × 4 mm² and an optimized intensity distribution. The profile was optimized to generate a top-rectangular temperature field. To achieve this, the inverse heat conduction problem was numerically solved by the Chair for Technology of Optical Systems (TOS) of the RWTH Aachen University [
26]. Further information on the methods which were used to solve the problem may be found in “Computing specific intensity distributions for laser material processing by solving an inverse heat conduction problem” [
26]. Afterwards the mirror, which can be seen in
Figure 4, was designed. The mirror enables the calculated intensity distribution illustrated in
Figure 5. The intensity distribution was calculated for the code case of a feed of 400 mm/min. The spot size had been set equal to the 16 × 4 mm² spot of the top-hat beam. The typical shape of the armchair profile, which was described before, can be seen.
To investigate the effect of speed on the optimized distribution, the speed was set to 300, 400 and 500 mm/min in the trials. The temperature on the surface was regulated by a pyrometer to 1225 °C. The temperature was measured in the center of the laser spot. Probes of each track for metallographic analysis were taken on the opposite side of the starting position to assure that a stationary state was reached. The initial material was hardened and tempered to increase the toughness and reduce the hardness. This is the typical heat treatment for shafts, which afterwards might be hardened with a laser on the surface to increase the wear resistance. The thermal treatment has a large effect on the mechanical characteristics of 42CrMo4 (AISI 4140) [
29]. The tempered condition of the shafts results in short diffusions lengths for the carbon [
30] and therefore in a good hardenability.
The hardness as well as the microstructure of each track had been analyzed. The required hardened depth was defined to 0.6 mm and the minimum hardness to 600 HV0.2. The specimens were polished and etched with Nital 1% for 15 s. The good hardenability resulted in a well-defined martensitic phase, which can be identified by analyzing the contrast after etching. Therefore, a Matlab script was programmed and used to calculate the area as well as the depth of the area every 2 mm. The script also predicted the total width of the track and the width in which a martensitic transformation in a pre-defined depth of 0.6 mm was reached. Additionally, the hardening depth was confirmed by measuring the Vickers hardness every 0.1 mm.
For laser hardening, the energy conversion efficiency can be defined as a factor between hardened volume and laser power multiplied with the process time. This factor includes the optical losses and the heat conducted into the work piece [
4]. As a different factor, a geometric efficiency factor for surface hardening shall be defined as the quotient of the area in which the hardened depth reaches a predefined value and the total hardened area. The factor shall be called as µ. This factor describes the part of the track that is processed without contributing to the necessary area. It is mainly influenced by the shape of the track.
3. Results
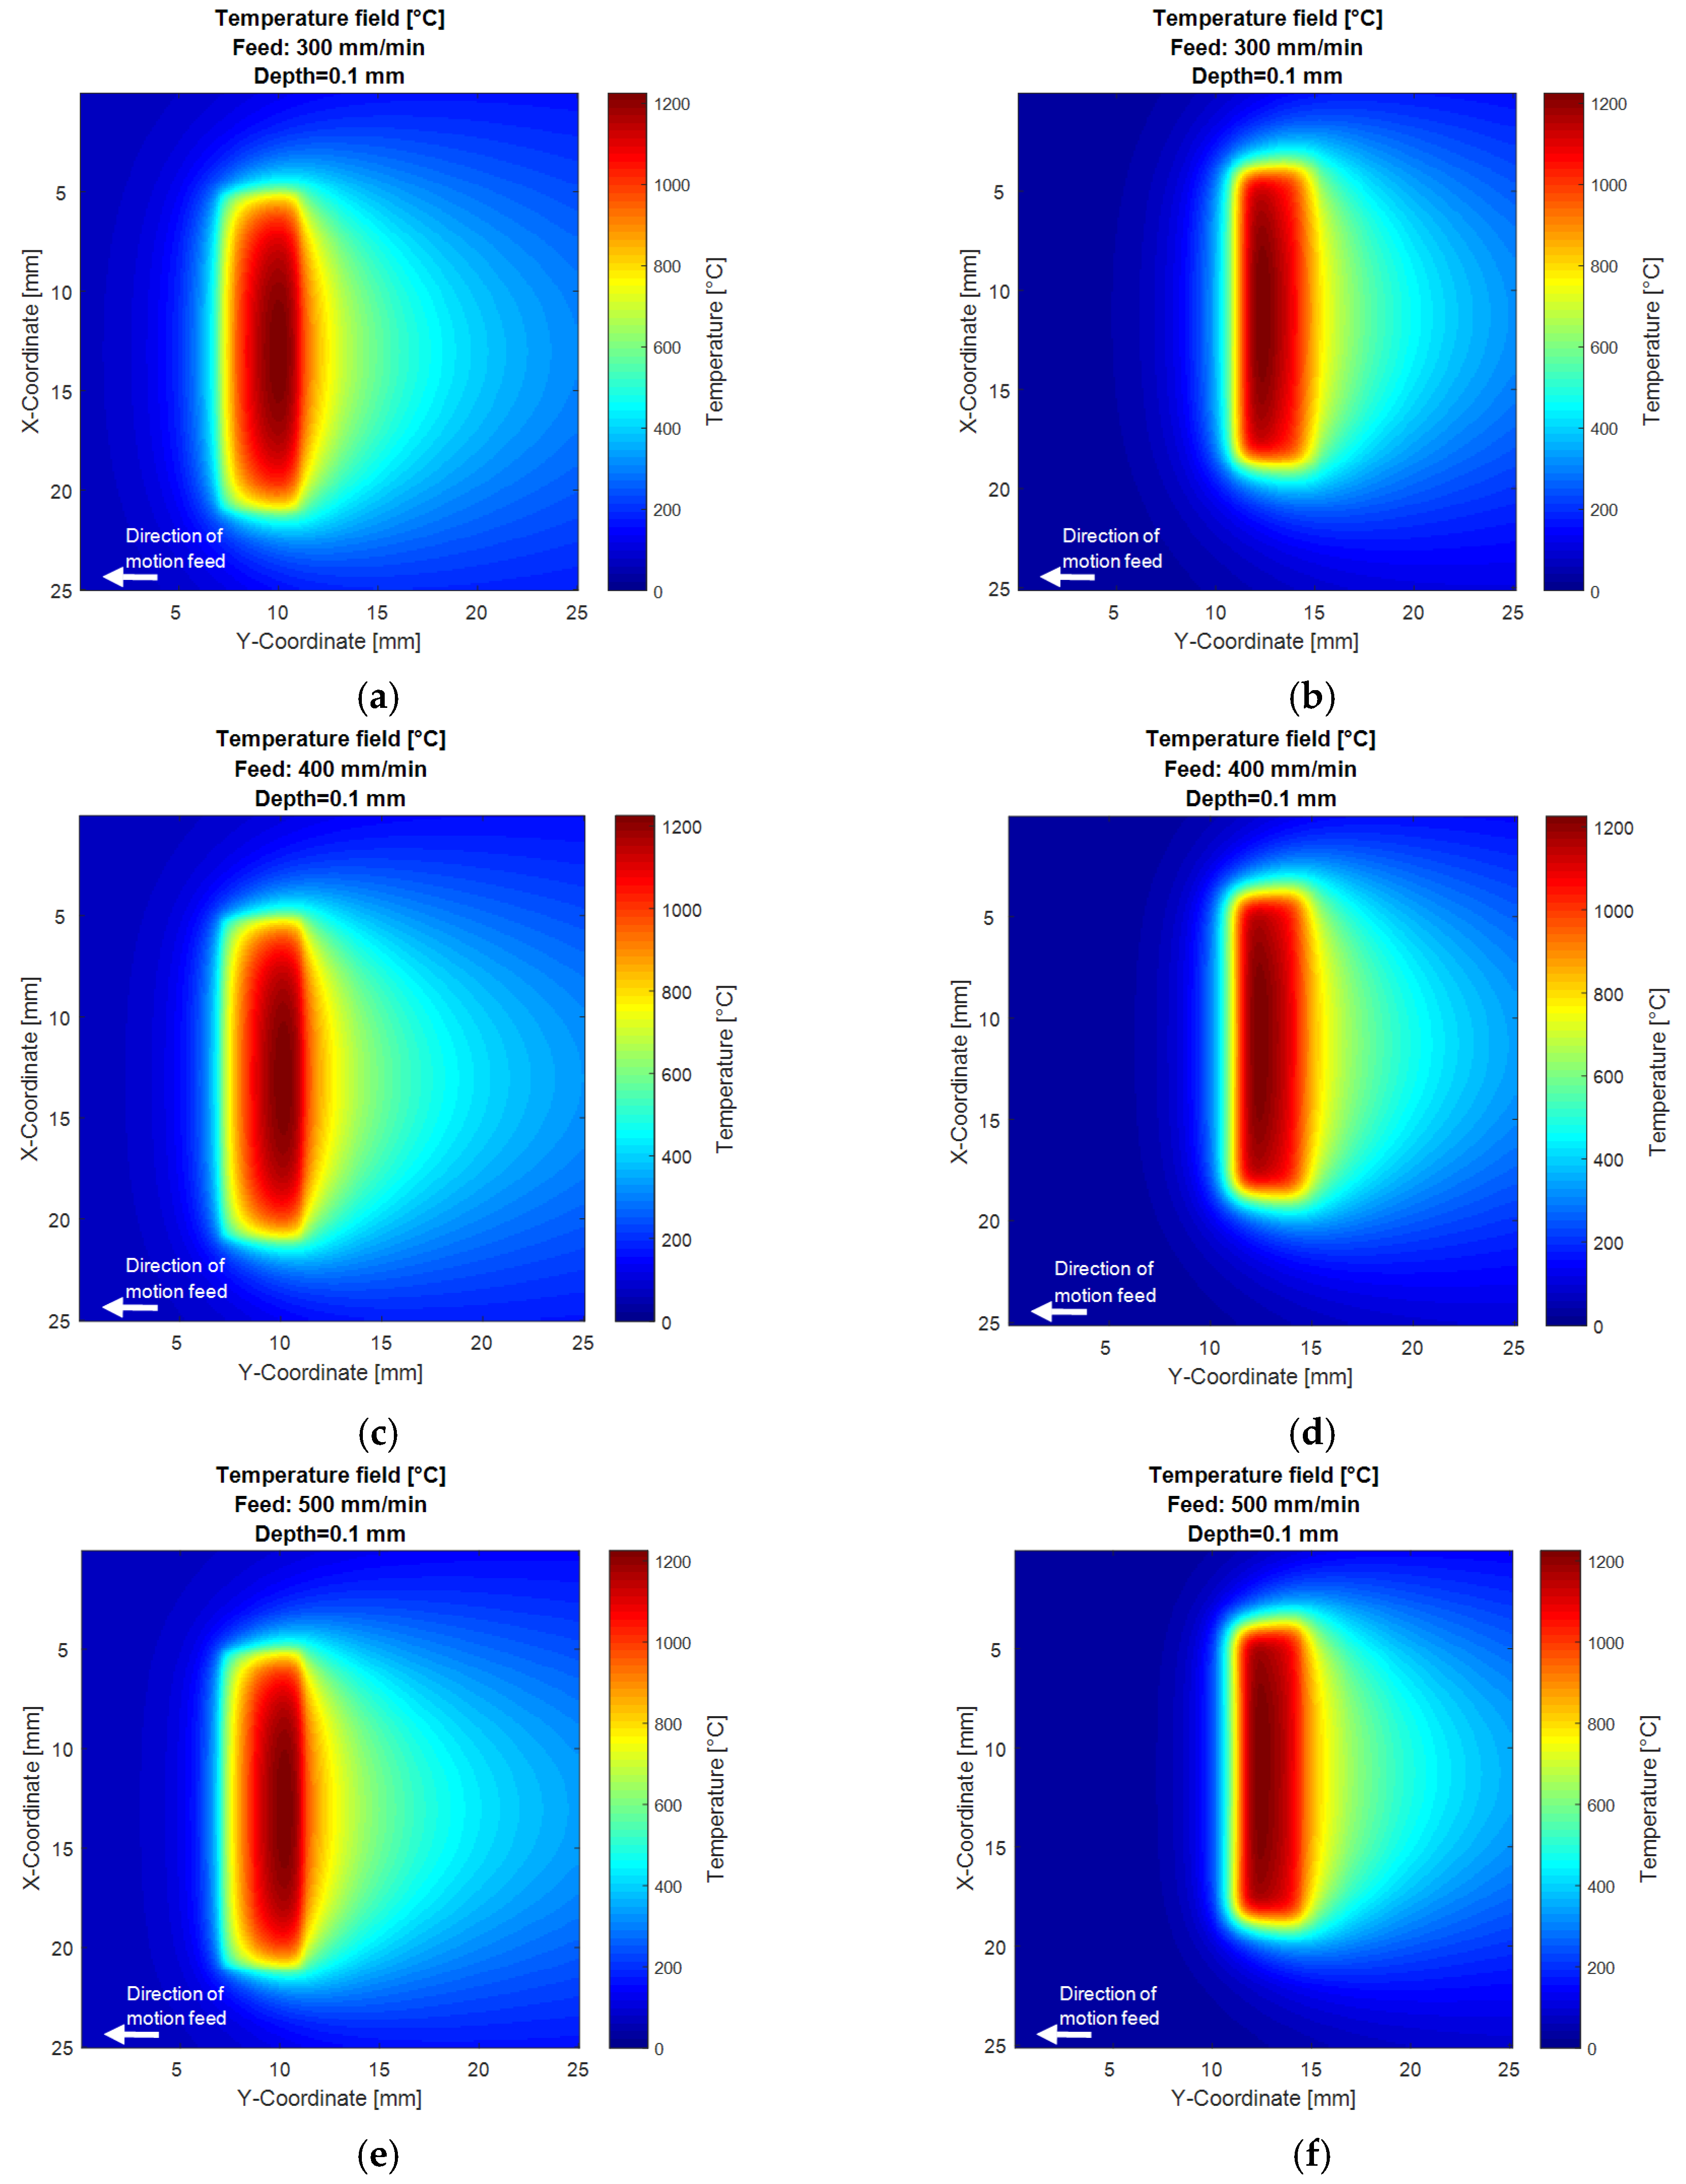
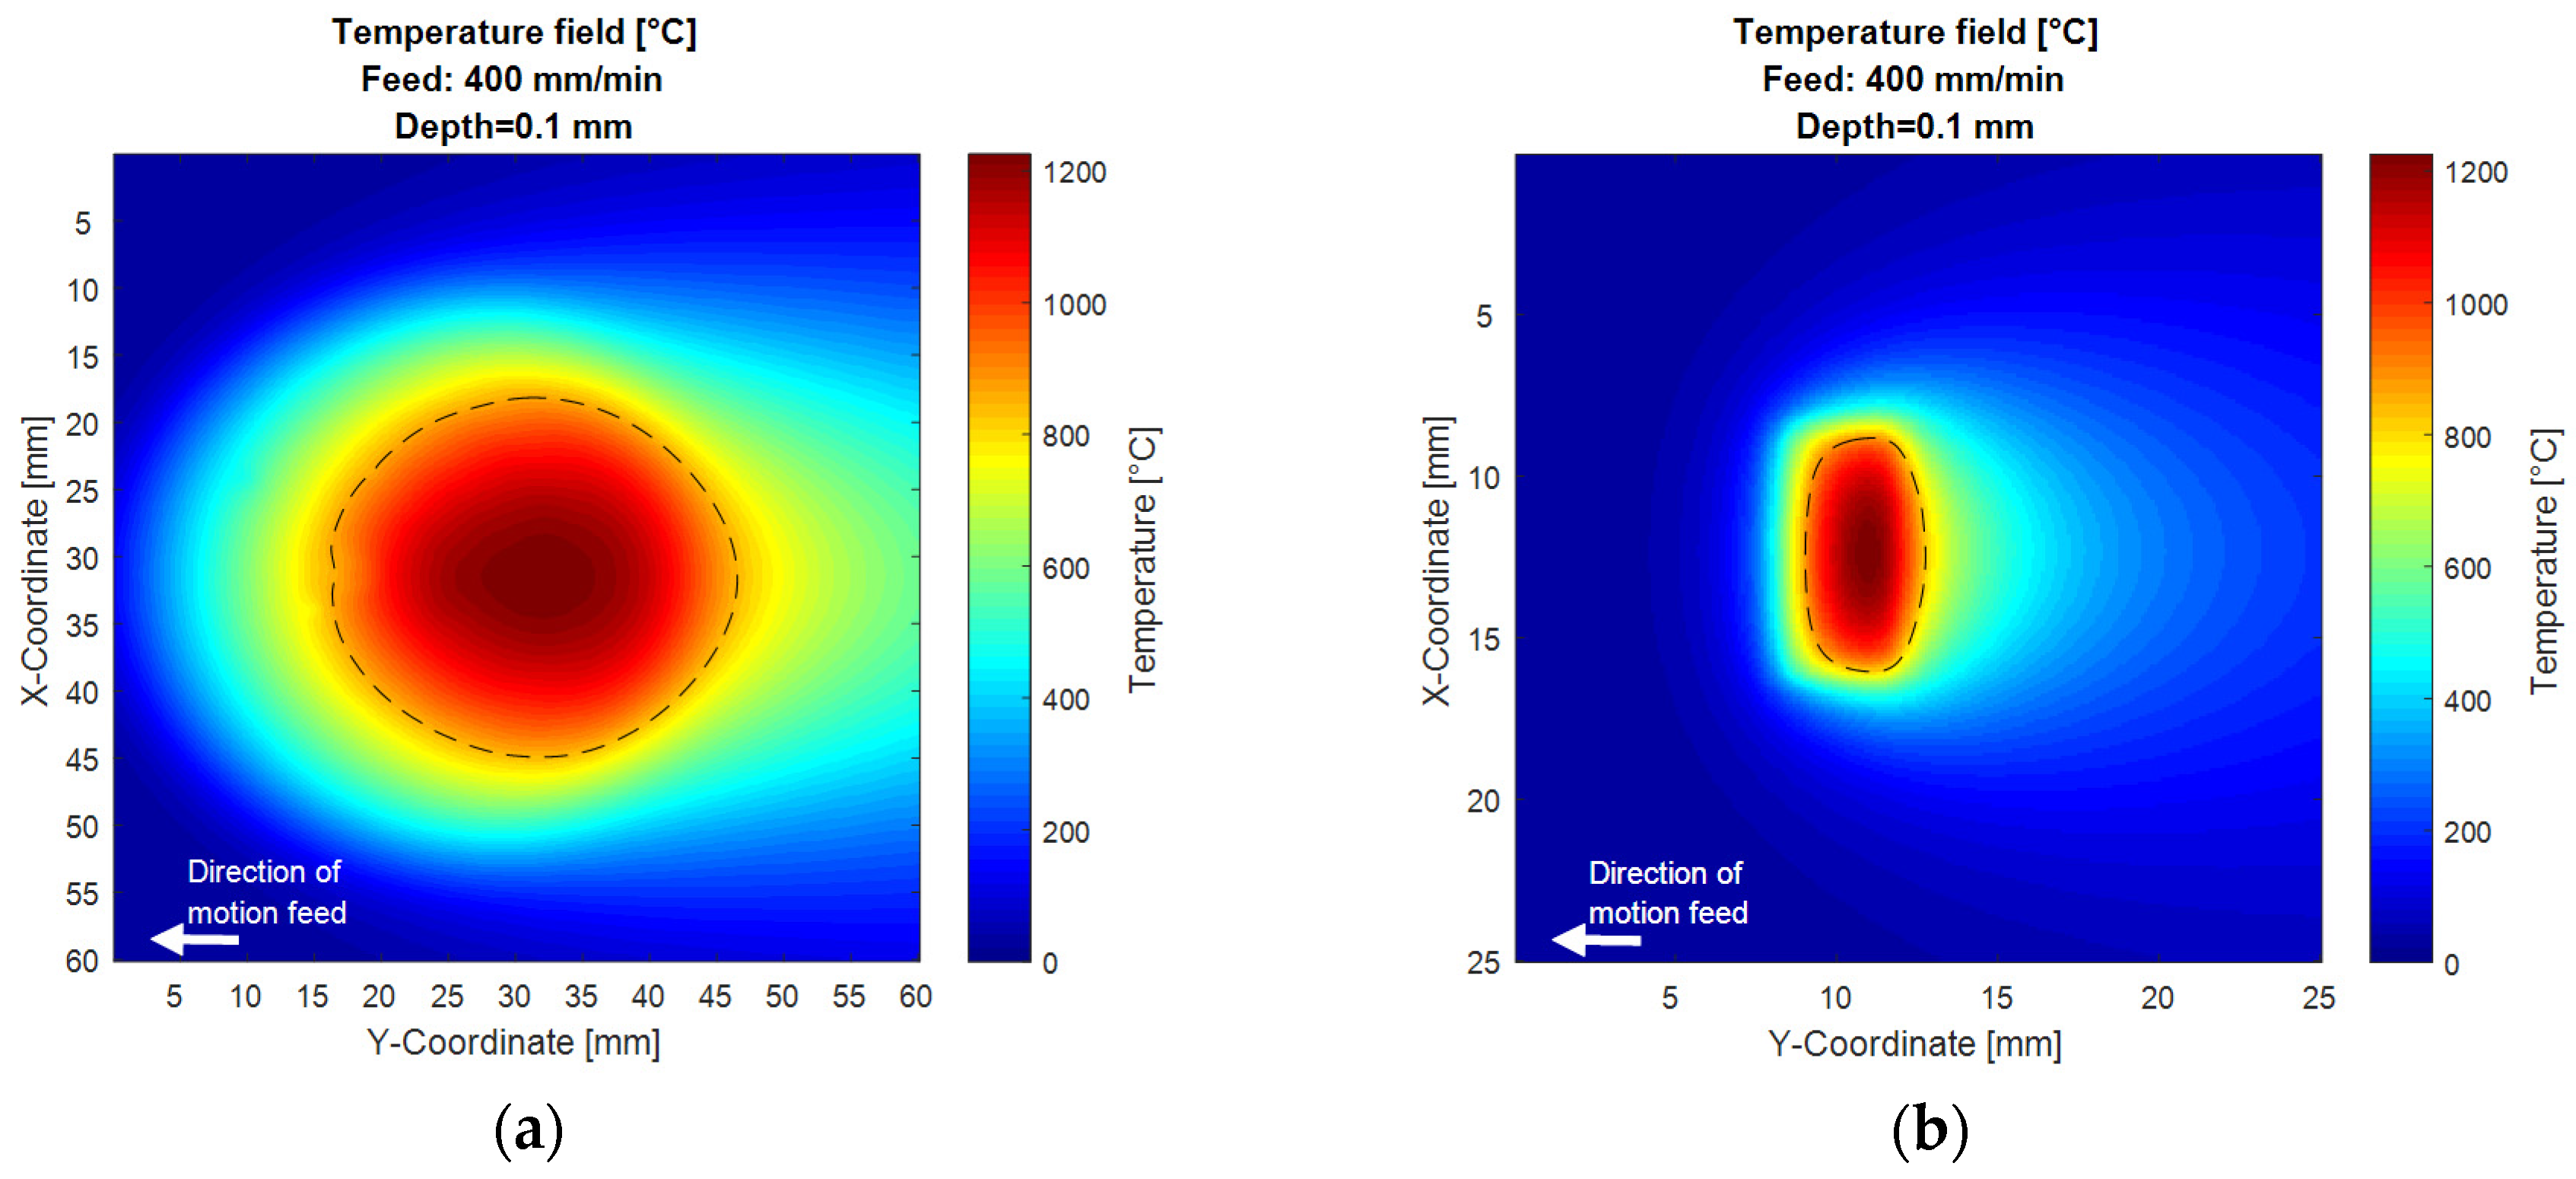
For the interpretation of the archived results on the shaft, initially the theoretically generated temperature field is illustrated. The top-hat distribution used is based on a Dirac delta function, while the temperature distribution is based on the calculation already shown in
Figure 5. The temperature is adjusted to 1225 °C. This normalization is similar to the regulation effect of a pyrometer.
Figure 6 shows the simulated temperature distribution in a depth of 0.1 mm for the top-hat profile as well as for the optimized temperature distribution. Generally, it can be observed that the temperature fields on the surface are not very dependent on the speed. Only slight changes are visible. At higher speeds the temperature field is more defined, resulting in the sharper edges and contours. It can be seen that the temperature of the top-hat intensity profile shows a peak in the middle of the tracks at all speeds. This is the reason for the lens shape of tracks hardened with a top-hat distribution, as discussed before. With the optimized profile, due to the higher intensities in the front of the profile, the spot with the highest temperature shifts in the direction of the feed motion. In comparison to this, the highest temperature is reached at the end of the illuminated interaction zone in case of the top-hat profile.
After the temperature profile is discussed based on the thermal simulation, the results of the metallurgical investigations will now be presented.
In
Figure 7 the cross-section of the top-hat laser hardened probe is shown. The martensitic zone forms the typical lens shape. Due to the thermal gradient in the work piece, the grain structure near the surface is coarse and gets finer in the depth, which is typical for laser hardening [
11,
31].
With the slower feed of the laser beam, the interaction time between laser spot and surface raises. For this reason, the heat has more time to conduct into the work piece, reaching deeper and changing to a rounder hardened area. At 300 mm/min the track reaches a depth of 0.32 mm on the first 2 mm. For the higher speeds the level goes down to 0.61 mm. At the deepest point, the track reaches about 1.5 mm. For 400 mm/min the maximum depth is about 1 mm. At the highest speed of 500 mm/min the maximum depth is only 0.72 mm. This depth is only 0.1 mm above the requirement. From 300 mm/min to 500 mm/min the efficiency factor µ, which describes the relationship between the areas in which the required 0.6 mm hardening depth is reached to the total hardened area, increases by 23% to 0.69. Although the spot size on the surface is always 16 mm, the hardened area on the surface decreases with increasing speed. While this area decreases by 6%, the area in which 0.6 mm hardening depth is reached gets significantly smaller with increasing speed. At 500 mm/min the required hardened depth of 0.6 mm only is reached on 10 mm width. This is only 2/3 of the width that was hardened with 300 mm/min.
Looking at the microstructure of the probes in
Figure 8, the slower feed leads to several disadvantages. The grain structure on the surface gets very coarse. At 300 mm/min the grain growth reaches a level in which the surface structure of the shaft manufacturing process disappears. It can only be seen on the edges of the track, which do not appear in the figure. For higher speeds the grain structure becomes finer. This change in the grain structure will not have an effect on the hardness, but on the toughness and therefore potentially on the fatigue load of the work piece [
32].
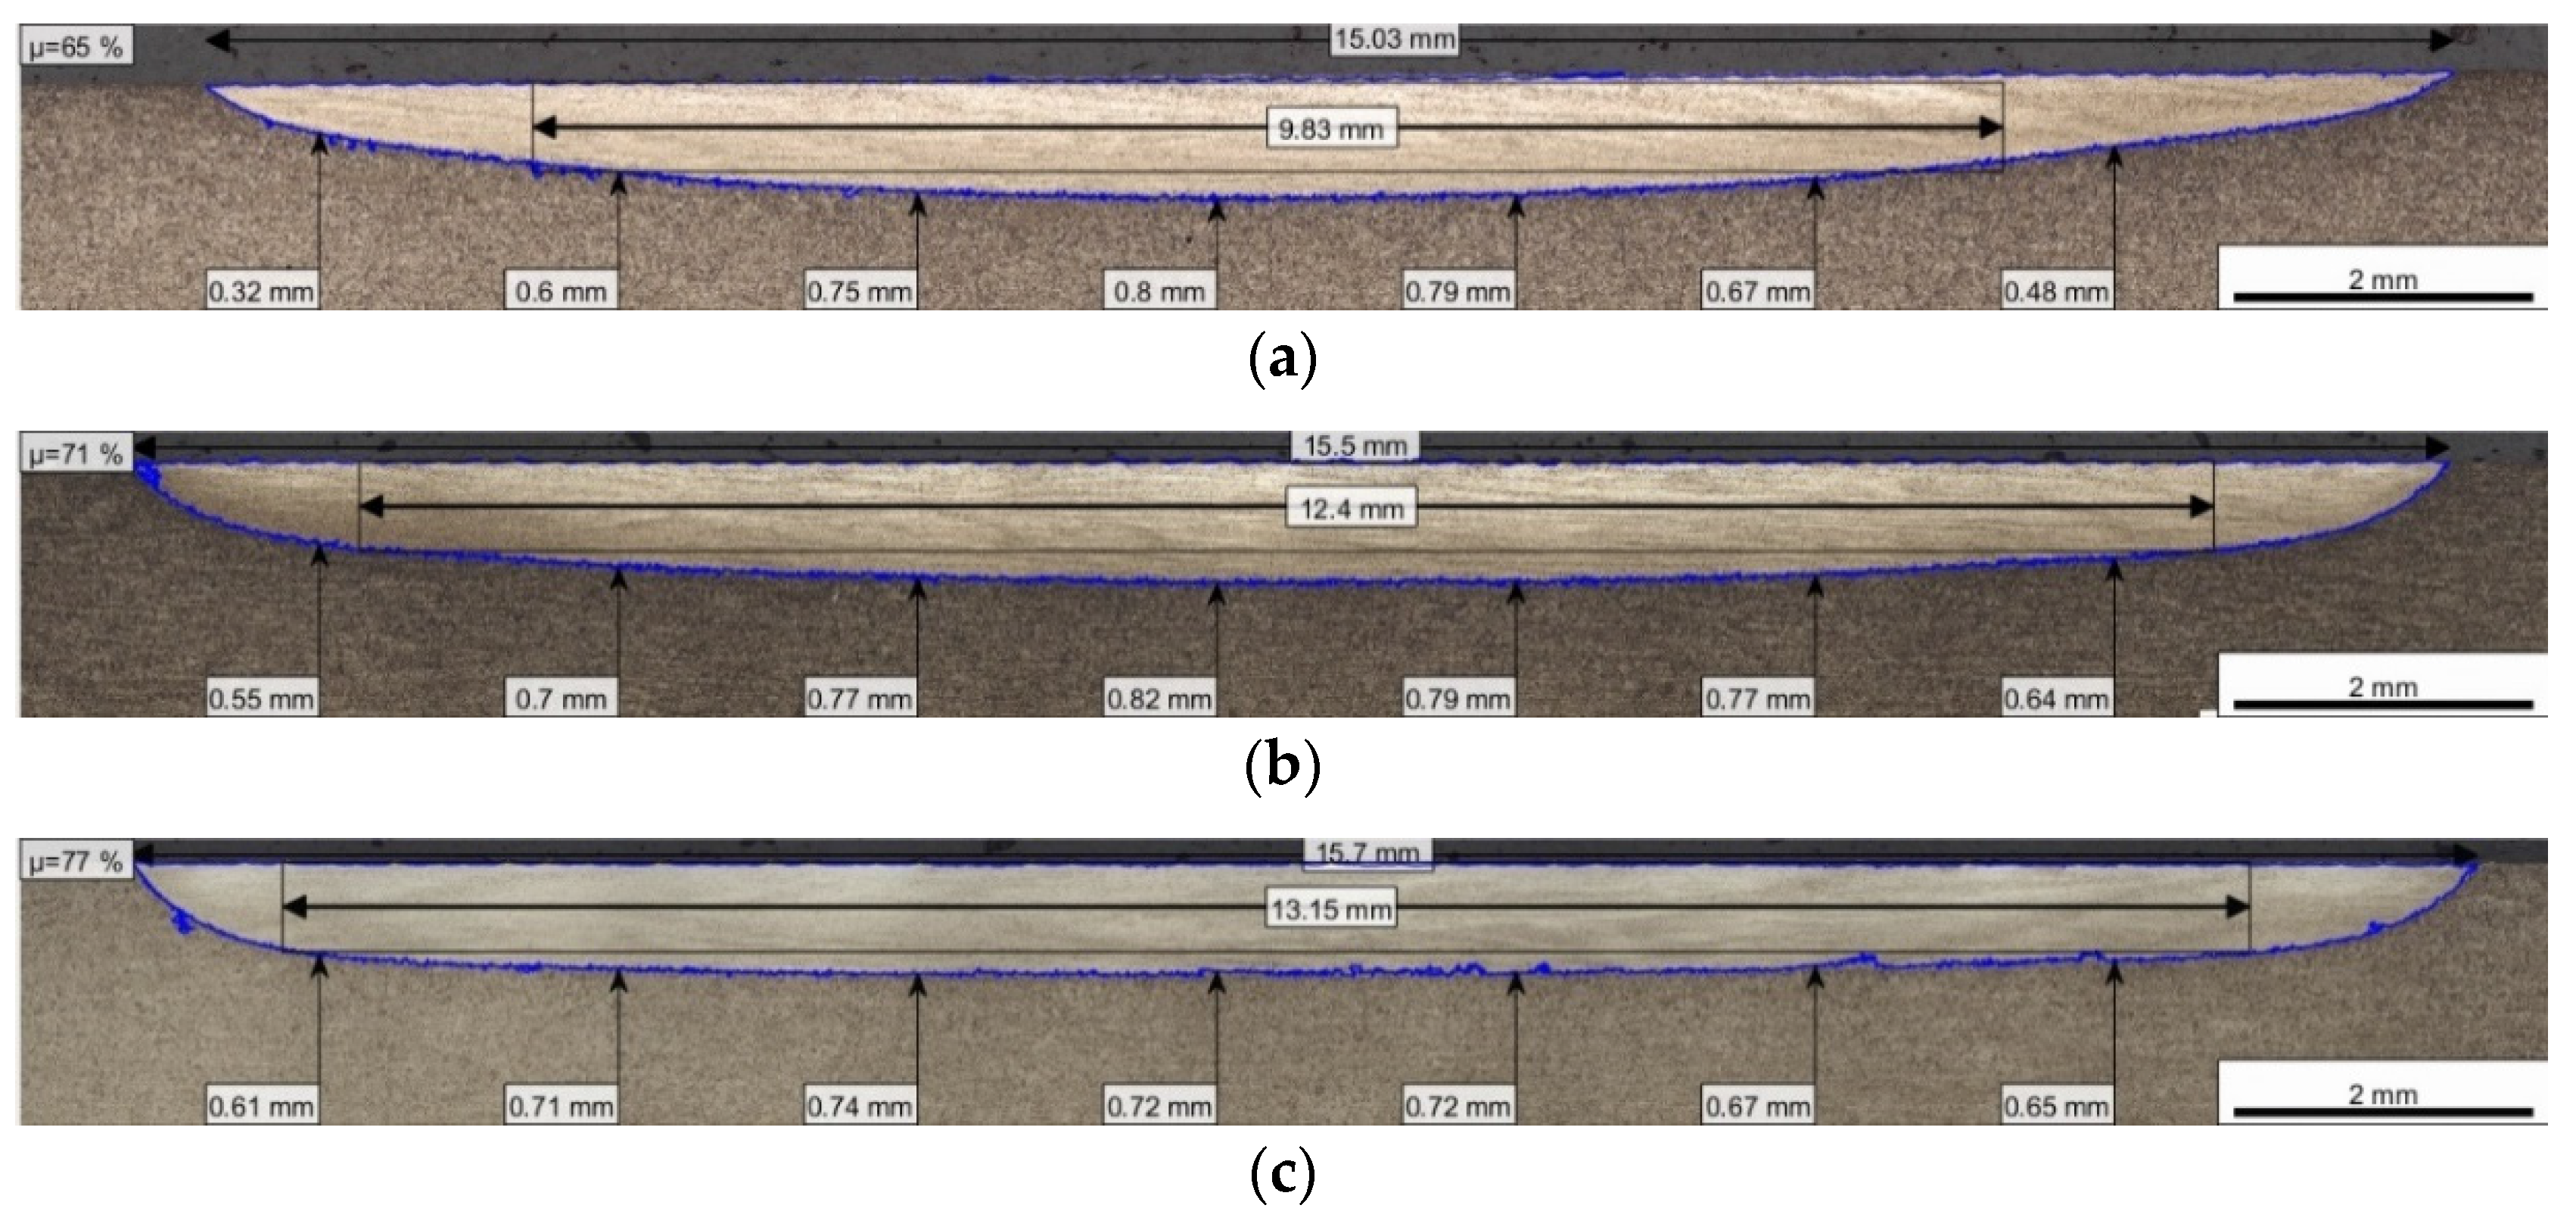
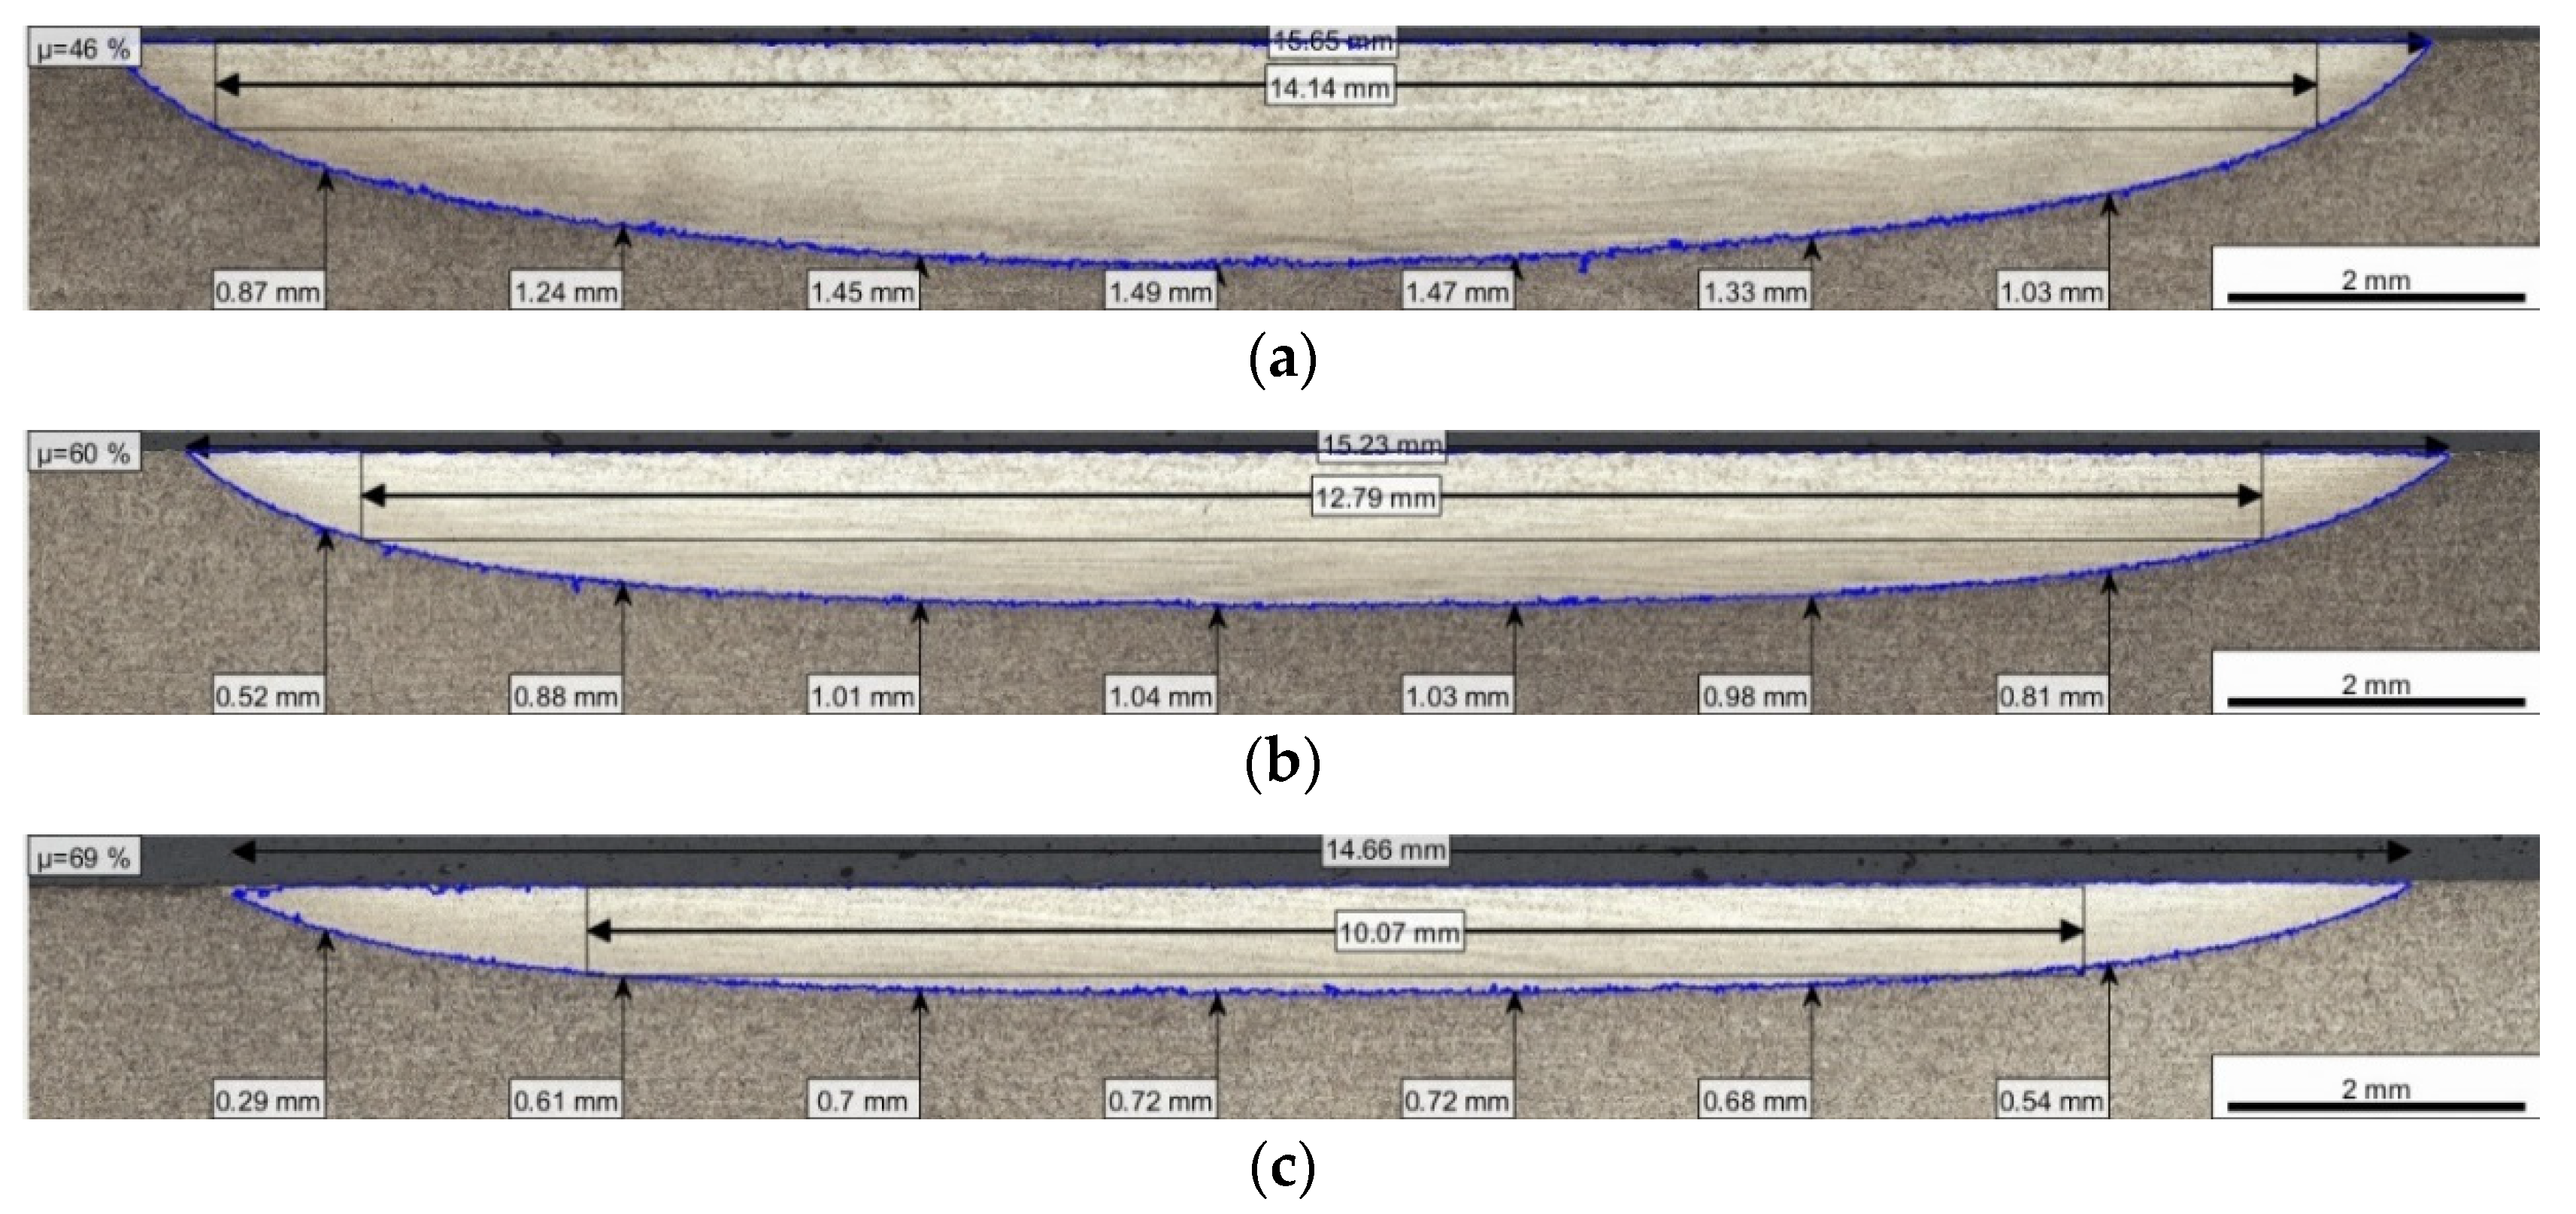
The tracks achieved with the optimized heat distribution can be seen in
Figure 9. At 300 mm/min the shape of the track is quite similar to the shape of the tracks of top-hat profiles at 400 and 500 mm/min. A deep penetration of the temperature into the work piece cannot be seen. At higher speeds the hardened tracks are less lens-shaped. Instead the edges are sharper and the lower track level is nearly straight. It is remarkable that the most rectangular-shaped profile is not the code case of 400 mm/min but of 500 mm/min. In the first 2 mm the depth of the hardened area for 400 mm/min and 500 mm/min is higher than the requirement. For 500 mm/min the deviation on the every 2 mm measurement is only 0.1 mm. The maximum depth for the 500 mm/min only reaches 0.72 mm/min. This circumstance has a positive effect on the geometric efficiency factor, which reaches a very high level of 77%. The useful width for the 0.6 mm hardening depth requirement is for all speeds in between 9.83 and 13.15 mm. Unlike in case of the top-hat profile, the area increases by increasing speed.
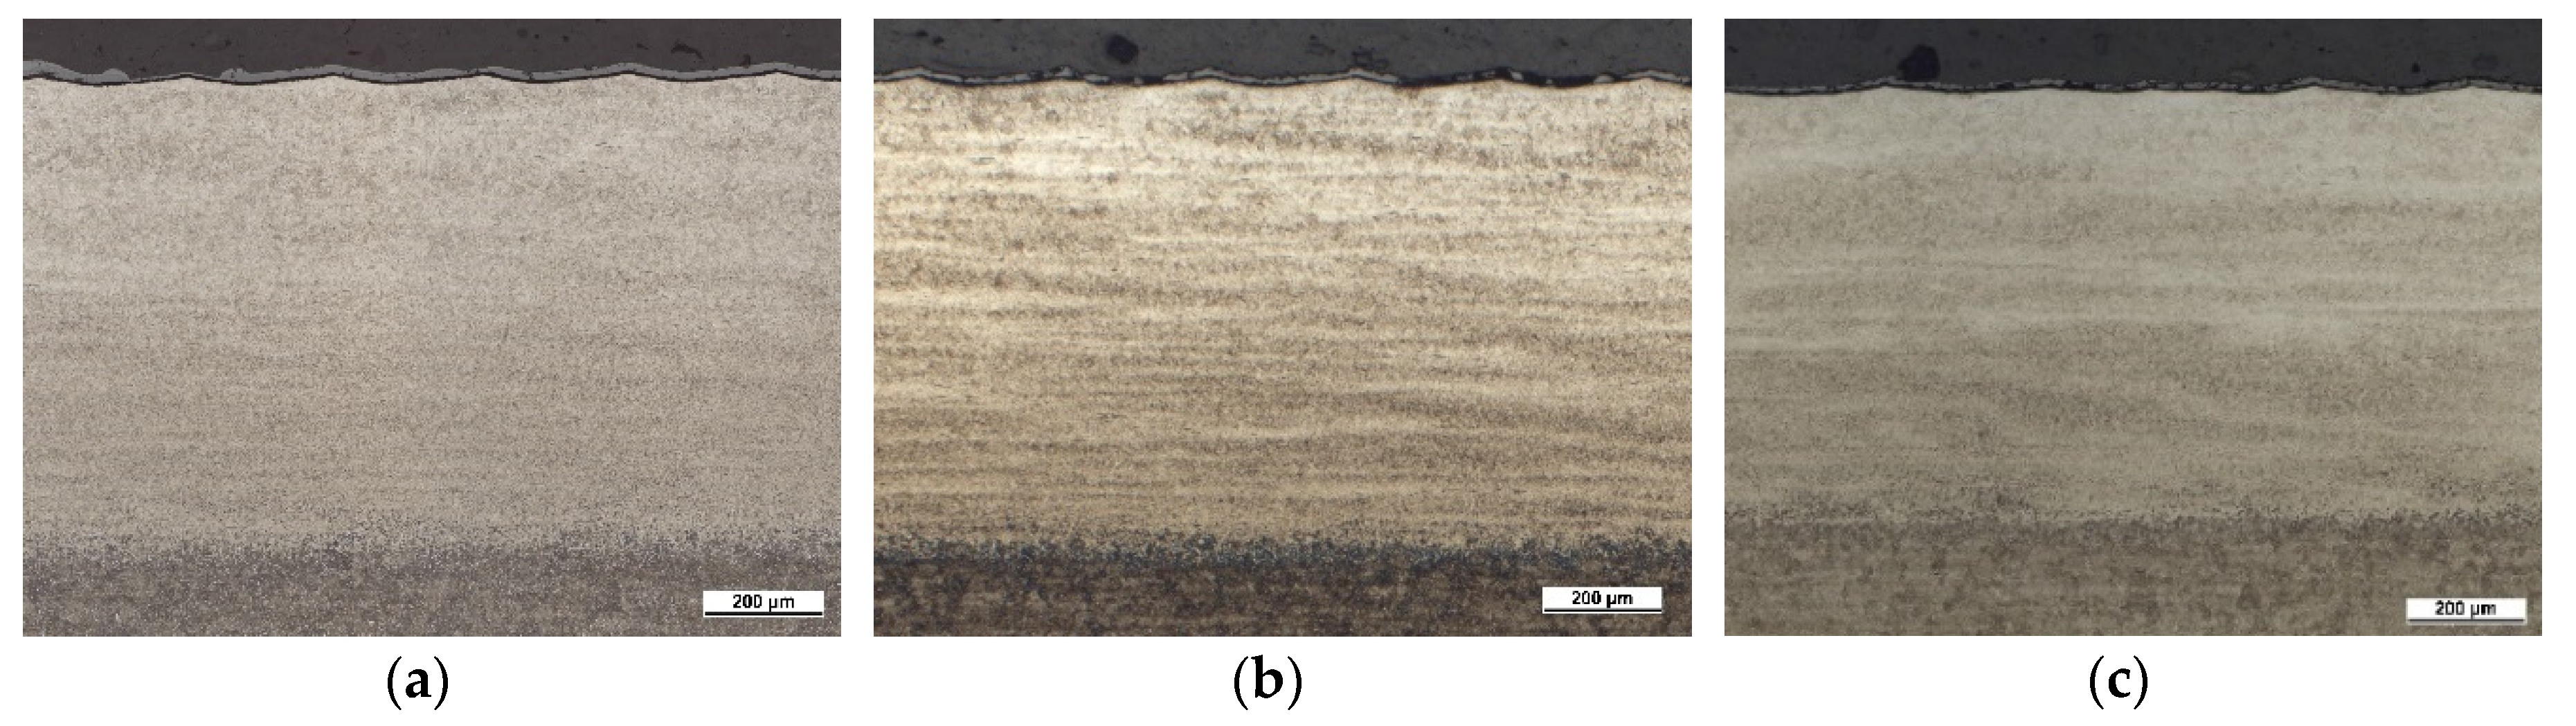
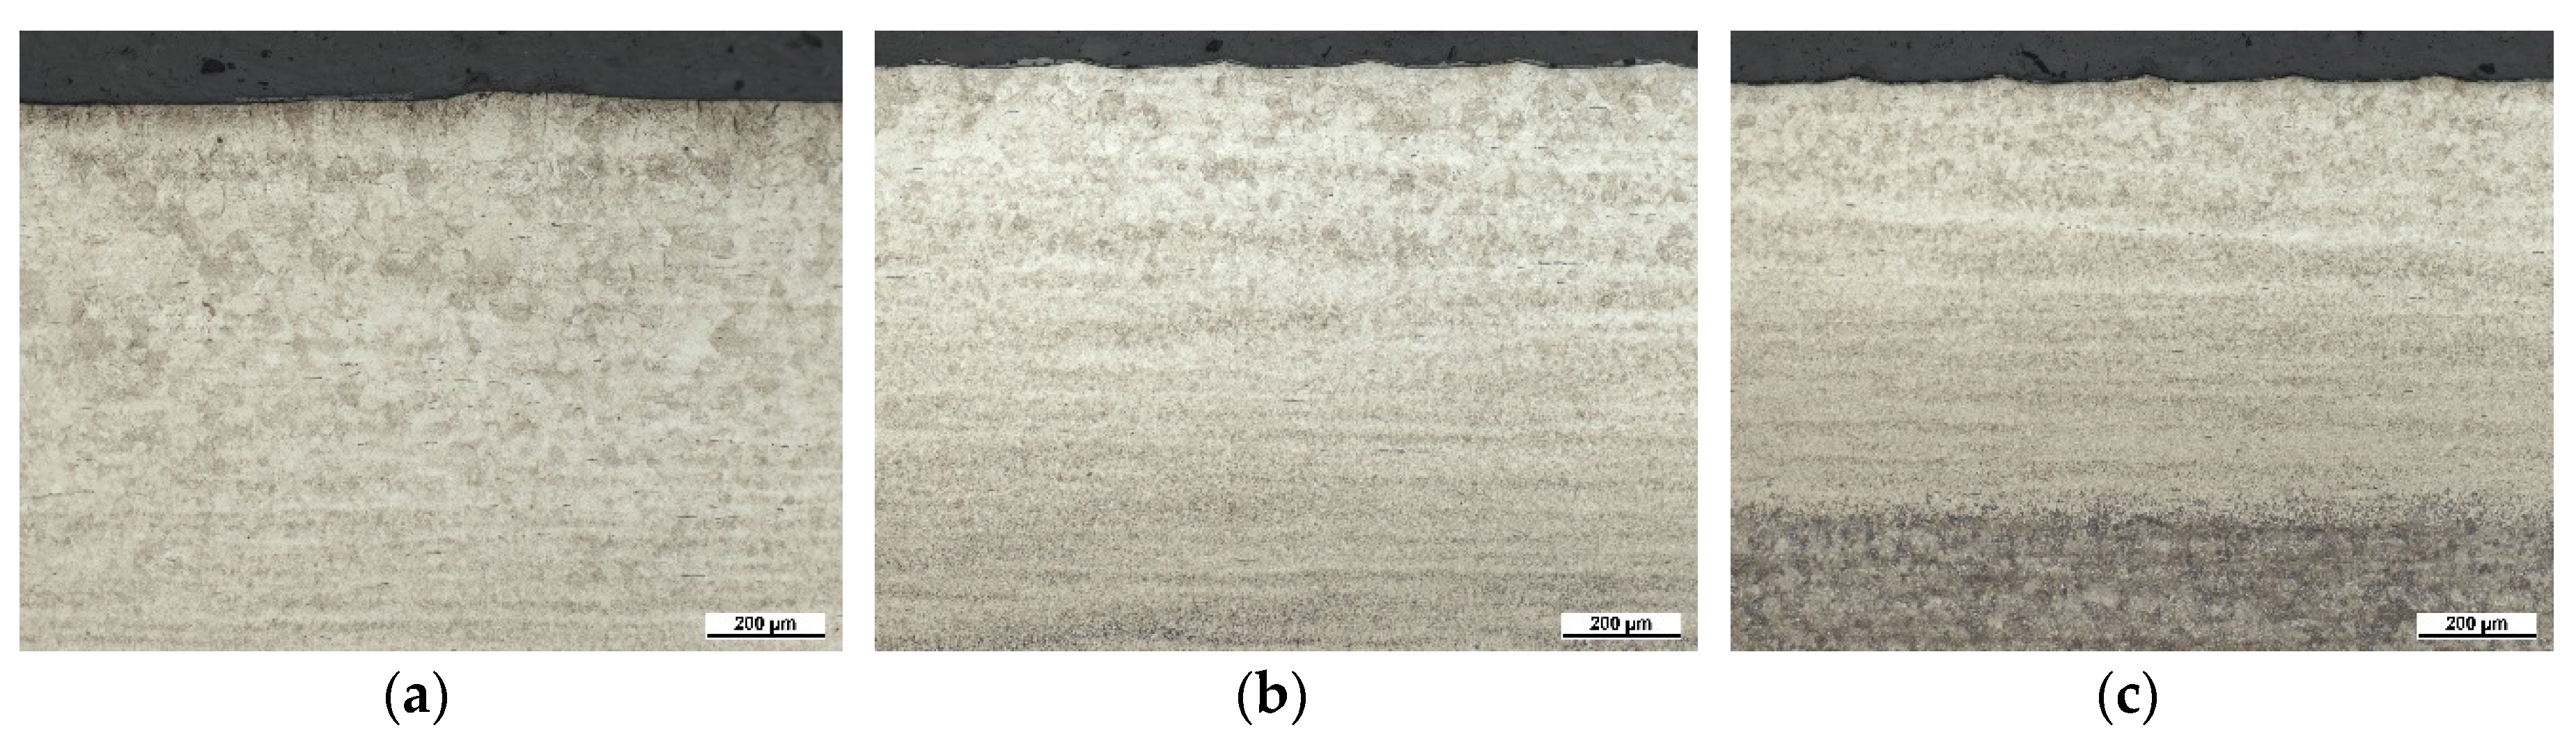
It is apparent that the grain structure of the optimized temperature profile, which can be seen in
Figure 10, is more homogeneous than before. The coarse grains, which appeared at 300 mm/min with the top-hat profile, are not recognizable. The surface structure of the manufacturing process is still existent. In
Figure 10 it can also be seen that the hardening depth is not dependent on the feed of the laser. All pictures show nearly the same hardening depth. In the transition zone, a thin layer can be spotted. This effect is already known and described by Mioković [
19]. This kind of layer is a result of the transformation kinetics.
The laser-hardened specimens are shafts made from hardened and tempered AISI 4240 (42CrMo4). AISI 4240 (42CrMo4) has a good hardenability and the resulting hardness should be in between 600 and 700 HV with only a few variations [
8,
33]. It is reported by Mioković et al. that the hardness of hardened AISI 4240 (42CrMo4) above a certain cooling rate is independent from the cooling rate and therefore independent from the speed [
34].
From the microstructure images in
Figure 8 and
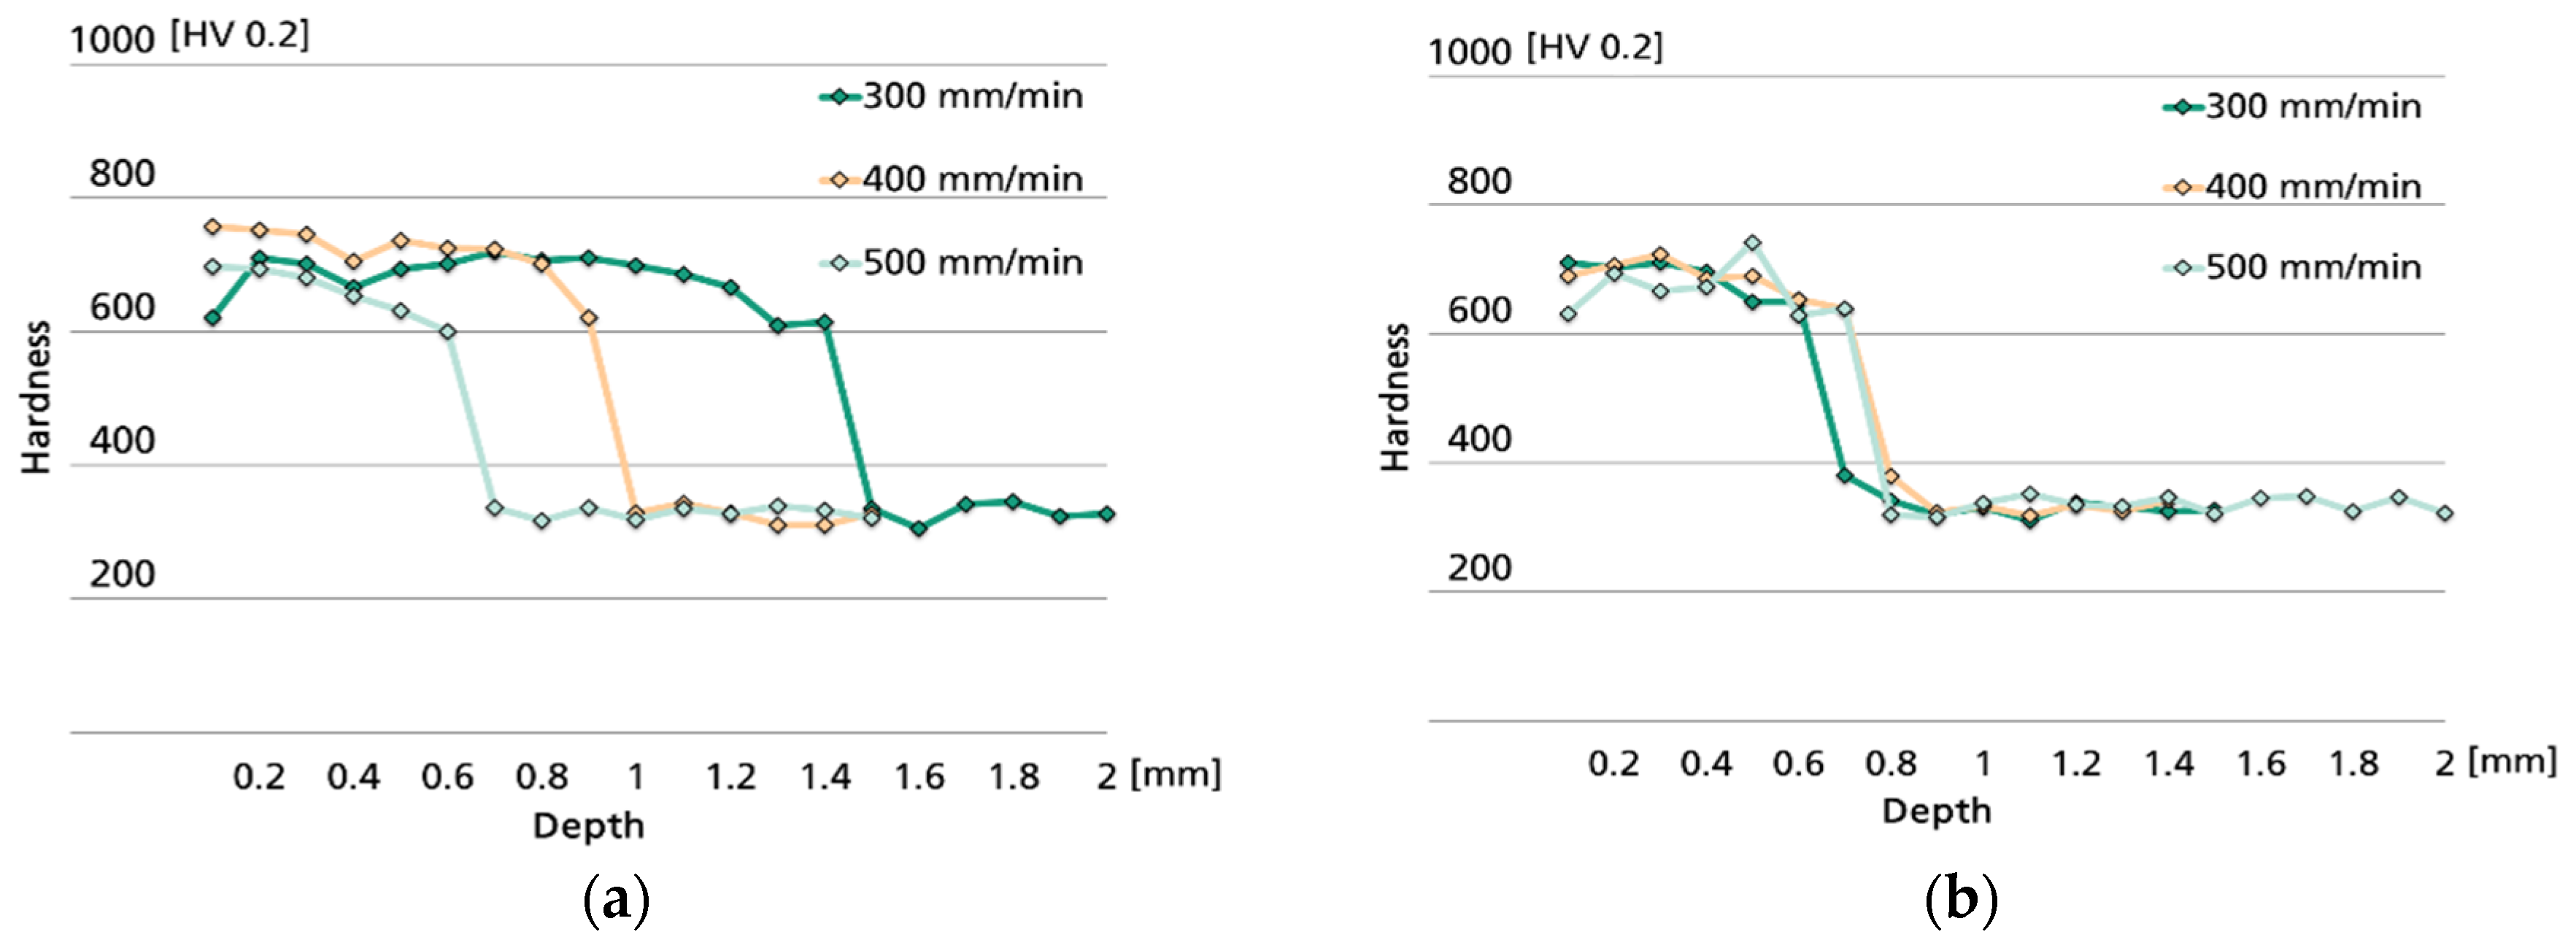
Figure 10 it can be seen that these estimations seem to be right and no changes in the microstructure can be identified except for the slowest feed with a top-hat profile. As can be seen in
Figure 11, there is no change of the hardness detectable, independent of the intensity profile or speed. The penetration depth depends only on the parameters. This result corresponds very well with the values presented in the
Figure 7 and
Figure 9, which are based on the contrast of the etched probes.
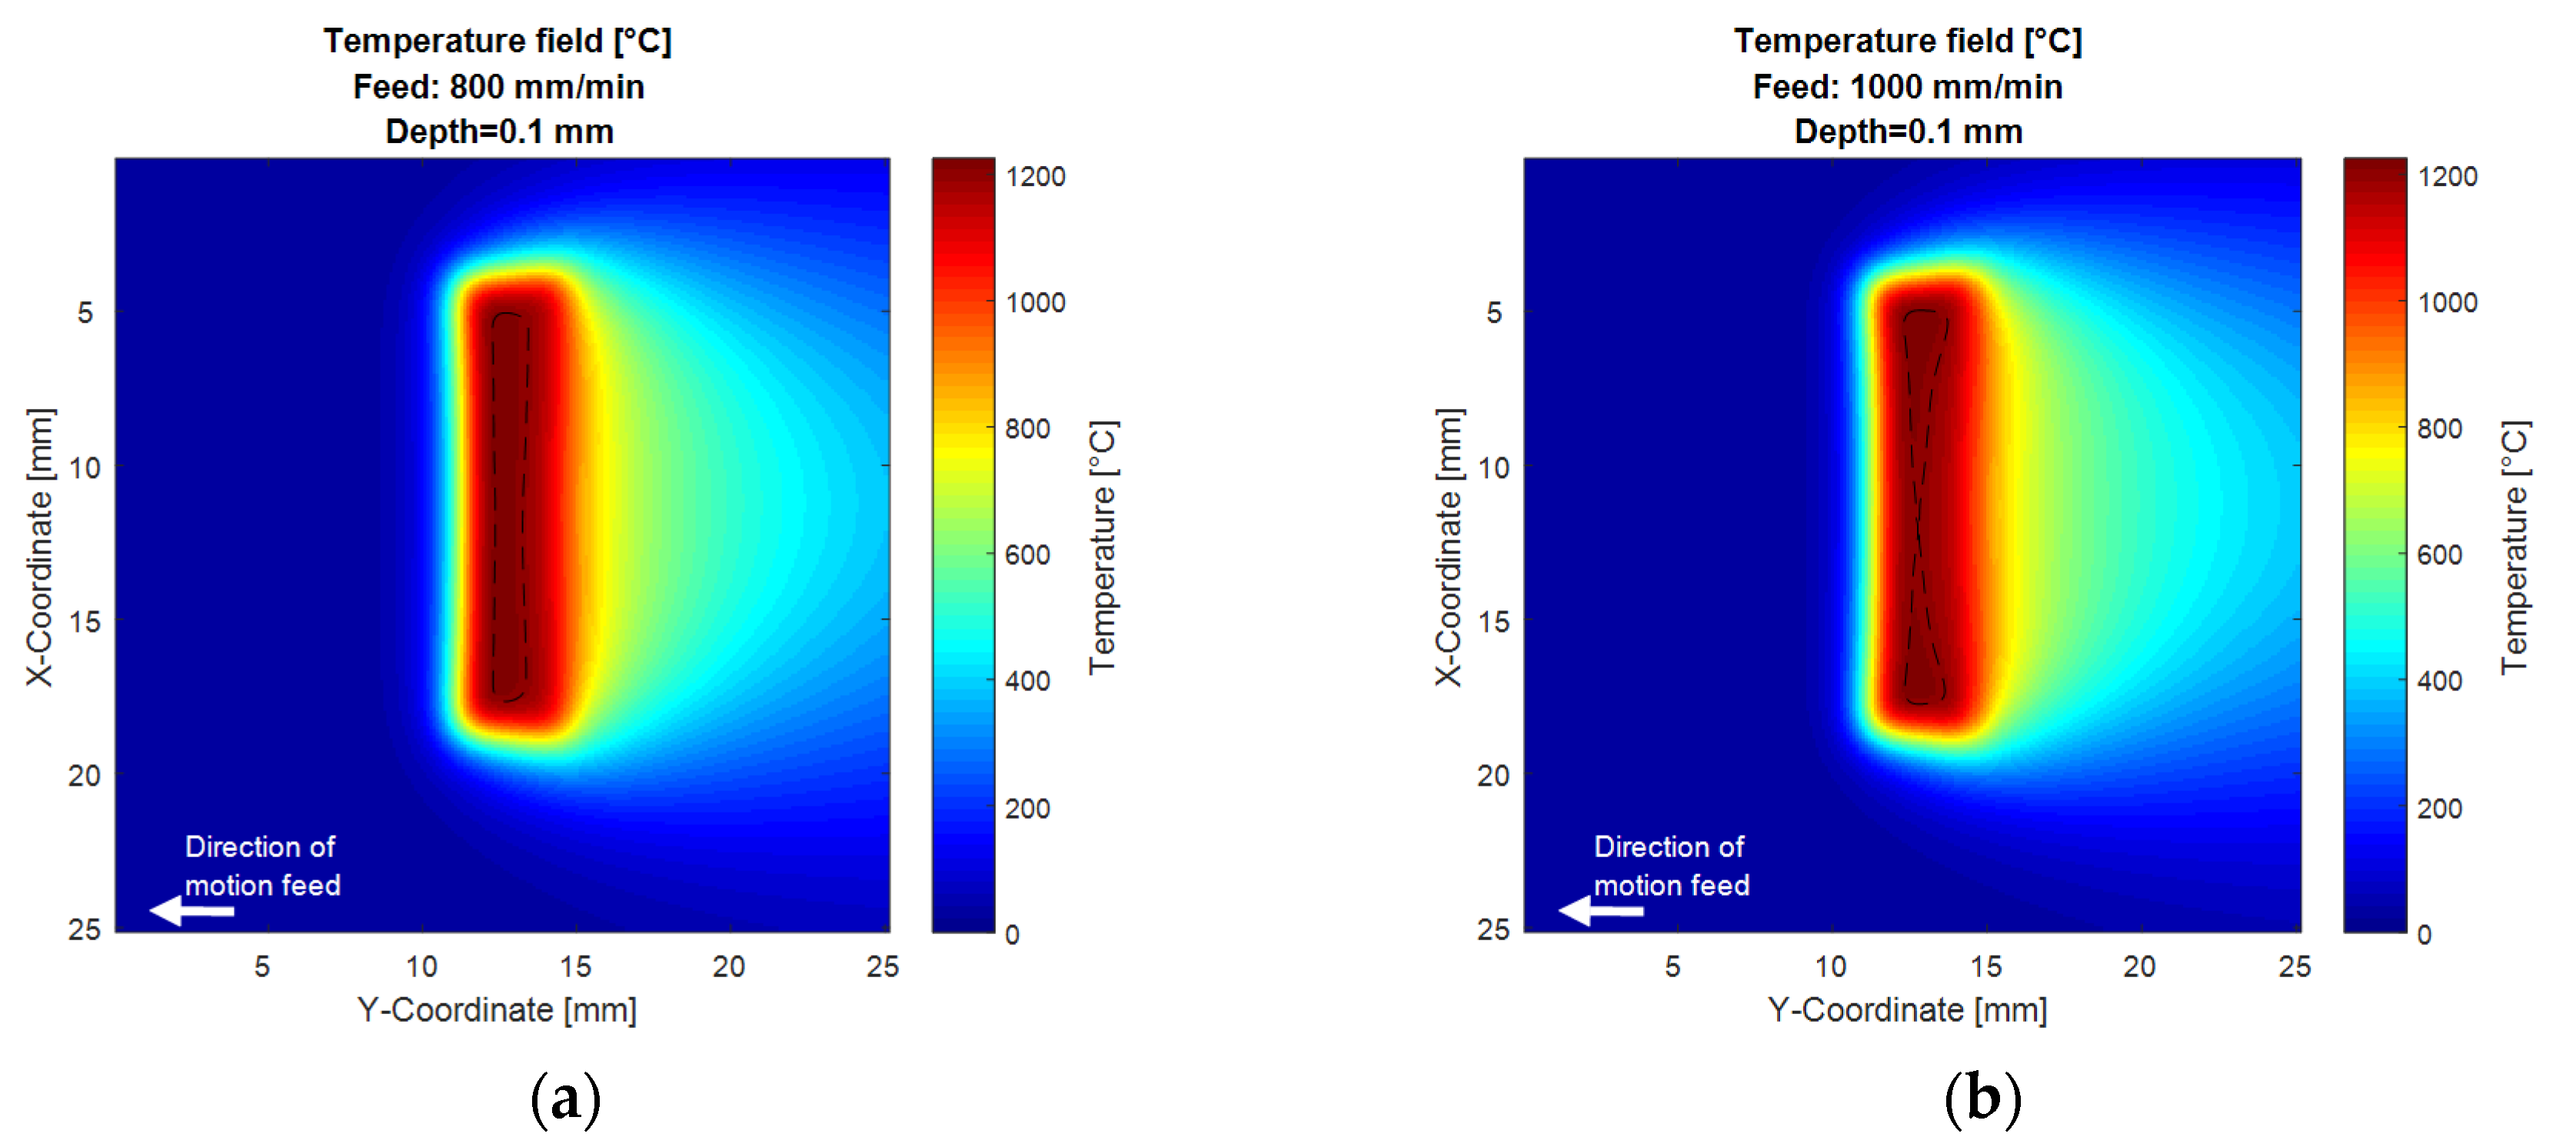
Figure 12 shows the thermal simulation of the optimized profile at higher laser feed. It can be seen that the optimizing effect is not dependent on the feed. In agreement with the metallographic analysis, higher speeds show a more defined distribution. While at 800 mm/min the temperature still is homogeneous, overheating appears on the edges at 1000 mm/min. To point out this effect, the dashed line marks the 1200 °C isotherm. This wide range applicability of the optimized profile is surprising and might be provoked by two effects. While the intensity distribution is calculated for an ideal laser beam, the actual used laser has a beam spread angle. Therefore, the intensity distribution is slightly blurred. This was already considered within the design process. The simulated blurring was showing that the effect does only have a small impact on the heat conduction at 400 mm/min, which also could be assured by the experiment. However, this blurring might be the reason why the distribution is also a proper solution for the inverse heat conduction problem at higher speeds. The second effect is that the laser interaction time becomes less at higher speeds and therefore the hardened track becomes steeper, because the heat conduction has no time to blur the thermal distribution of the surface.
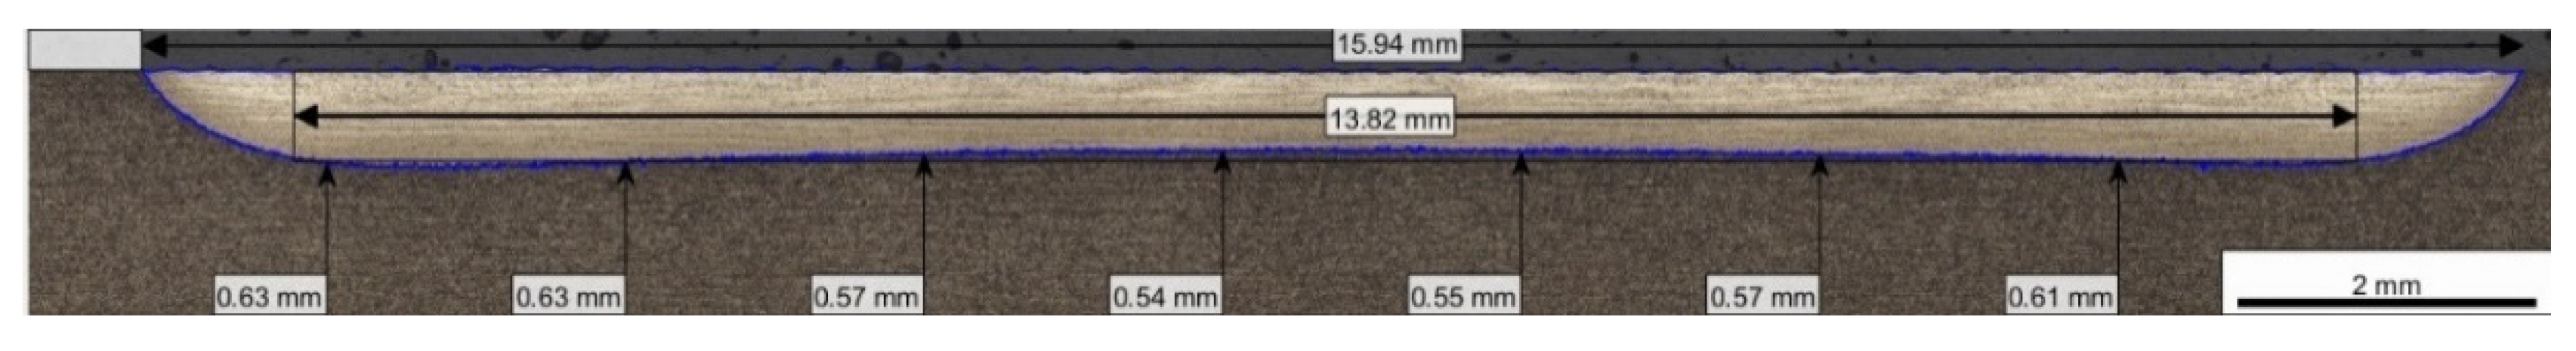
Figure 13 shows a hardened track using the optimized intensity profile at a feed of 1000 mm/min. This speed is 2.5 times higher than the code case. At this speed the higher intensity on the edges, which should compensate the higher gradient to the cold surrounding material, overcompensates. This leads to a w-shaped hardened profile, which has also been described by Hagino et al. [
35]. This result is consistent with the thermal simulation (
Figure 12). It is worth to mention that the depth at the corners of the track slightly reduces to 0.63 mm, while in the middle the depth is about 0.06 mm less than the required 0.6 mm. Therefore, the geometric efficiency factor cannot be calculated. This result supports the thesis that at least for the edges of the intensity distribution, the solution of the inverse heat conduction is not sensitive to the speed.
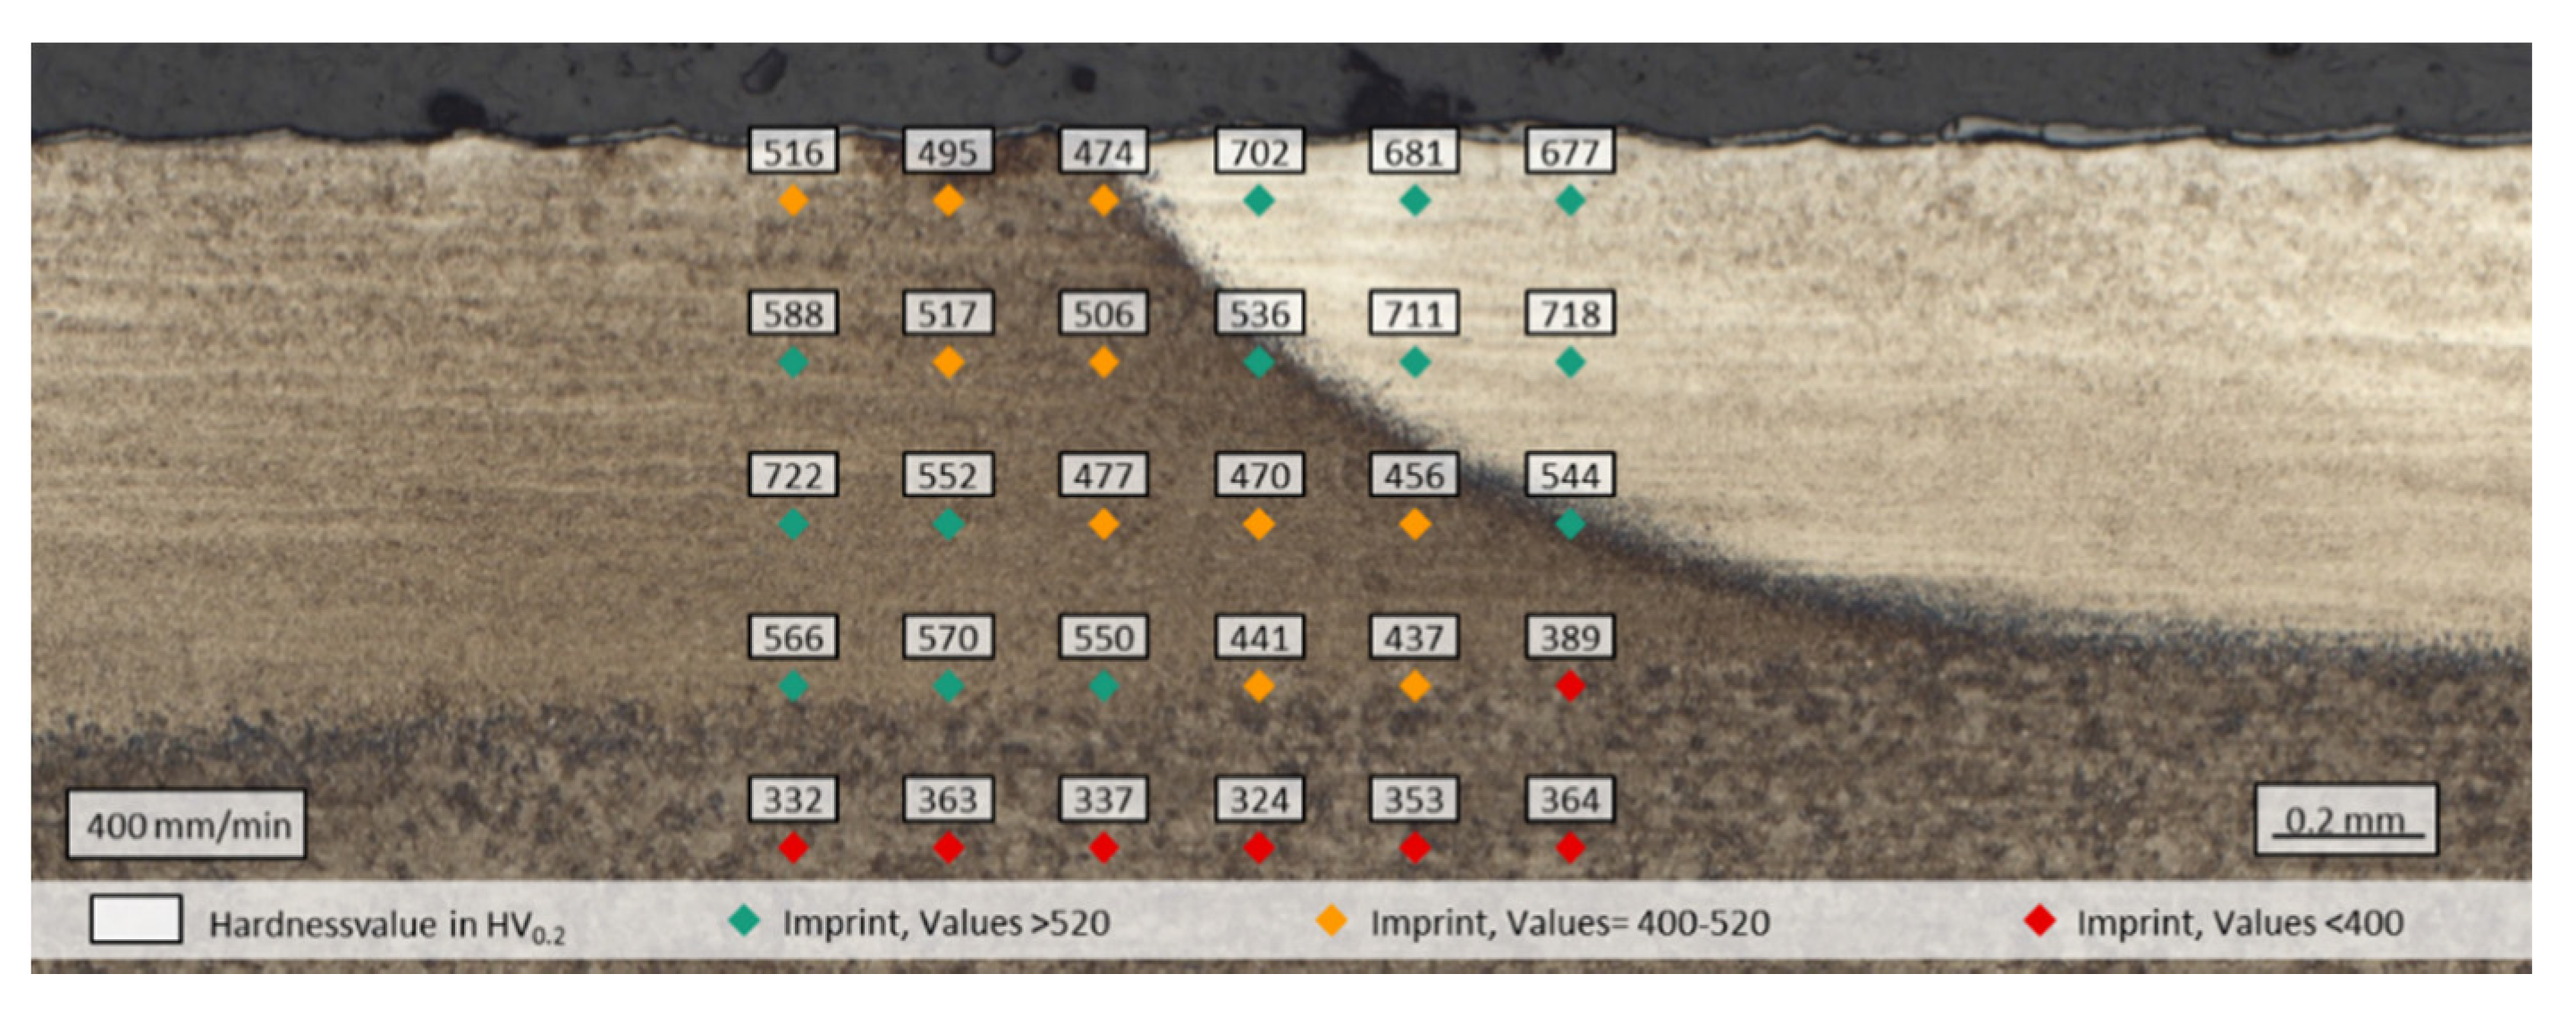
As mentioned before another main challenge of the laser hardening process is the tempering effect. This effect occurs when individual tracks are placed next to each other to harden a larger area. The conducted heat of the second track raises the temperature in the already-hardened first track above tempering temperature, which reduces the hardness in the overlapping region. By minimizing the heat that is conducted, the effect should be reduced. To investigate whether the optimized profile can contribute to decrease this problem, two tracks were placed next to each other with the feed of the code case 400 mm/min. The overlap of the tracks was 2 mm. The optical microscope image of the etched probes can be seen in
Figure 14. The hardness values were measured in a matrix over the overlapping region. The values above 520 HV
0.2 are colored green, the values below 400 HV
0.2 are colored red, while the values in between are colored orange. The critical hardness value of 520 HV
0.2 was related to DIN EN 10328, in which hardening depth is defined as the depth where hardness is below 80% of the minimum hardness. In the current case, this minimum value is 600 HV
0.2. It easily can be seen that the tempered zone, visualized by the yellow colored values, still exists. However, the values do not reach the lower values, related to the hardness of the base material. Only on the right side one value below 400 HV
0.2 occurs, but this outlier might be caused by its placement in the transition zone. It can be concluded that although the tempering effect is still existent, it has been weakened.
4. Discussion and Conclusions
The results of laser hardening using a top-hat intensity profile indicate the commonly described characteristics of laser hardening processes reported in practice and documented in literature. The tracks form the typical lens shape of surface heat sources. With increasing feed, the shape of the lens gets flatter and the width decreases. If the temperature and the power distribution is fixed through the laser and a static optic, the only way to adjust the process to specific requirements is by adjusting the feed speed. Therefore, depending on the required width, a round hardening track, or a process strategy which involves placing more than one track, has to be taken into account.
Compared to the results of the top-hat profile, the results with an optimized temperature profile are impressive, especially when it is taken into account that for a non-isotropic material and without cooling the best possible shape for a surface heat source would be a rectangle with two radial quadrants on each side. Therefore, the best possible value for the geometric efficiency factor µ for a 16 mm width hardened track with a hardening depth of 0.6 mm is 94%. For this optimized profile the highest value of the width, in which 0.6 mm hardening depth is reached, is 14.8 mm.
With the optimized intensity distribution at 500 mm/min, the width reaches 13.15 mm and is only about 1 mm below the ideal geometric length. Compared with a top-hat distribution at 500 mm/min, the hardened area raised by 20%. With 77% the geometric efficiency value is very high. If it is taken into account that the deviation of the depth values are below 0.13 mm and a certain safety factor should be considered, this is an excellent result. Although the simulation and the probes at 1000 mm/min indicate that it might be possible to optimize the shape of the tracks by increasing the speed. The simulation points that an optimum might be reached at 800 mm/min.
For the code case, the geometric efficiency factor of the freeform is about ten percent points higher than the top-hat distribution. However, the 500 mm/min travel speed hardens a wider track with a higher efficiency. Therefore, it is evident that the tracks with 500 mm/min are more economical for industrial use, because process time can be reduced by 20%. Although it has to be confirmed, first results indicate that even a 800 mm/min feed might be possible to reach a hardening depth of 0.6 mm. If this is possible, the process time can be reduced to 50% compared to the code case.
In the investigations no restriction in the hardness or the microstructure appear at the higher speed. Instead the zone in which the grains start to grow has been reduced and the microstructure is more homogeneous. This shows that with the optimized distribution nearly ideal track shapes can be generated with a reduction of energy loss and process time.
The investigation on placing more than one track next to each other showed that the tempering effect is reduced, but not eliminated. Therefore, instead of laying more than one track next to each other, the optic should be adapted to the right size of the hardening area to get perfect results.
If the optimized profile will show the same beneficial results for other materials, this will be investigated in future work. Therefor a similitude theory will be undertaken. Although relatively high independence of the speed of hardening with the optimized profile might indicate that the effects can be adjusted only slightly by changing the process parameter. Also, whether comparable results can be achieved for more complex tool steels has to be checked. Finally, the current mirror only optimizes the temperature profile to be more homogeneous. It is not optimizing according to requirements of the metallurgy or construction design as, for example, a tailored hardening depth. Therefore, further potential will still be unlocked.

