1. Introduction
Laser cladding technology forms a metallurgical bond between the substrate and the cladding layer by using a high-energy laser beam to melt alloy powders on the substrate surface, forming a reinforced coating. It can significantly improve the wear resistance, corrosion resistance, and fatigue resistance of parts and is widely used in aerospace, automotive manufacturing, mold repair, and other fields [
1,
2,
3,
4,
5]. Especially in the repair of shaft parts, laser cladding can not only restore the geometric dimensions but also endow the parts with better service performance through the design of functional coatings. The quality and performance of the coating are highly dependent on the control of process parameters. Among them, the dilution rate is a core index for measuring the degree of metallurgical bonding at the interface and it directly affects the hardness, residual stress, and bonding strength of the coating [
6,
7,
8,
9,
10,
11,
12].
The dilution rate is defined as the mixing proportion of substrate material in the cladding layer. Its control requires a balance between energy input and heat diffusion effects. An excessively high dilution rate can cause the coating composition to deviate from the designed value, thereby reducing surface performance, while an excessively low dilution rate may weaken the bonding strength at the interface [
13,
14,
15,
16]. Existing studies mainly calculate the dilution rate through geometric methods and elemental migration methods. The geometric method calculates through cross-sectional morphology measurement, which is simple but easily affected by the fuzzy interface [
9]. The elemental method is based on elemental diffusion analysis, with high accuracy but relying on complex equipment [
17]. In addition to the above methods, the emergence of numerical simulation methods has made the calculation of the dilution rate easier, as they can predict the dilution rate by simulating the laser cladding process [
18,
19,
20,
21]. First, existing studies predominantly rely on single-method approaches for dilution rate calculation, lacking multi-method collaborative verification [
22,
23,
24]. For example, Zhu et al. [
25] combined finite element and machine learning to optimize the dilution rate, but did not consider the thermal delay effect of large-sized substrates; Hoffmann et al. [
26] developed a real-time control strategy by correlating the size of the molten pool with the dilution rate, ensuring the quality and efficiency of the coating. Second, the critical threshold effects of substrate size on dilution rate dynamics remain unexplored. Most investigations focus on standard-sized specimens without considering the nonlinear thermal accumulation effects that occur when substrate diameters exceed certain critical values. Third, the synergistic relationship between dilution rate and hardness under varying substrate sizes lacks a comprehensive understanding, particularly regarding the physical mechanisms governing microstructural evolution and mechanical property optimization.
To address these fundamental limitations, this study aims to: (1) systematically reveal the threshold effects of substrate size on dilution rate through comprehensive experimental investigation; (2) establish a multi-method collaborative framework integrating geometric, elemental, and numerical approaches for enhanced prediction accuracy; (3) elucidate the coupling mechanisms between dilution rate and hardness under diverse substrate conditions; and (4) develop physics-driven parameter optimization strategies for industrial laser cladding applications. The ultimate goal is to transform empirical trial-and-error approaches into scientifically guided process design, enabling predictable control of coating quality for shaft component repair and remanufacturing.
2. Materials and Methods
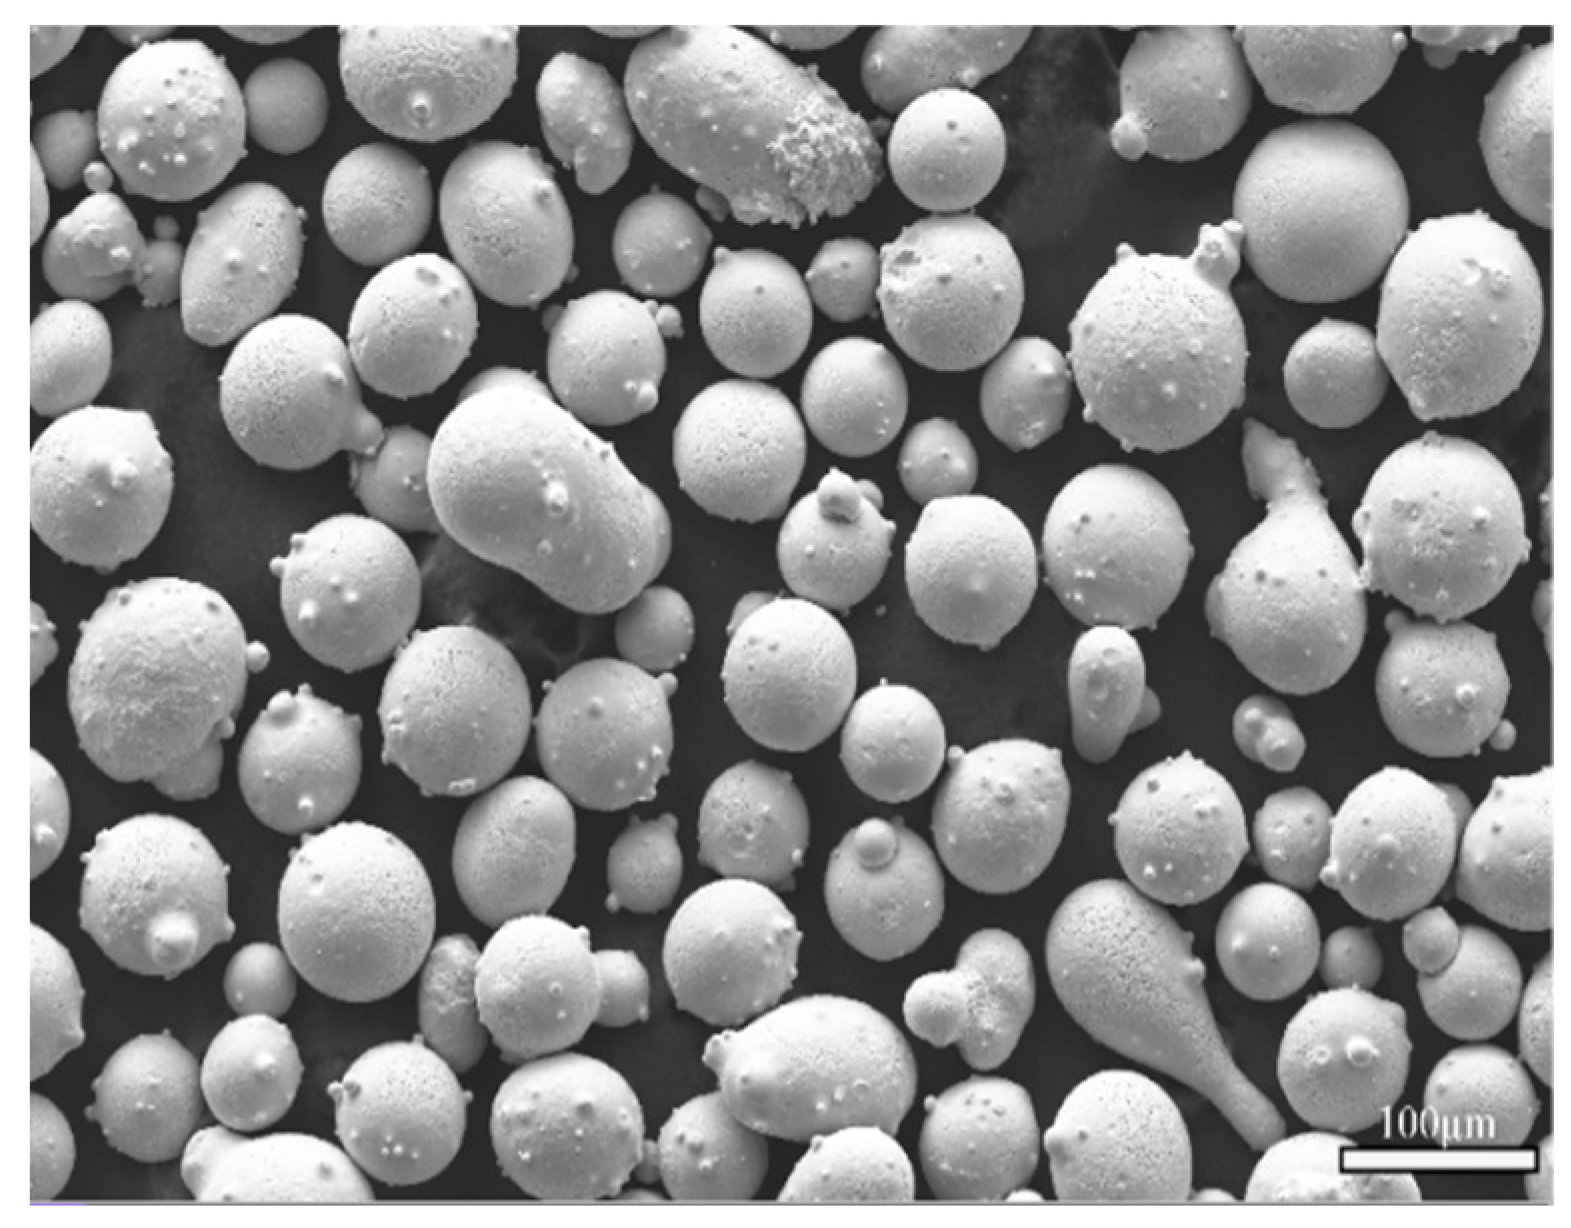
Known for its excellent mechanical properties and wide applications, 45 steel (Luoyang Leishuo Additive Manufacturing Co., Ltd., Luoyang, China) was selected as the substrate material, and iron-based powder, which has outstanding wear resistance and corrosion resistance (Höganäs Co., Ltd., Shanghai, China), was used as the primary coating material [
27,
28,
29], as summarized in
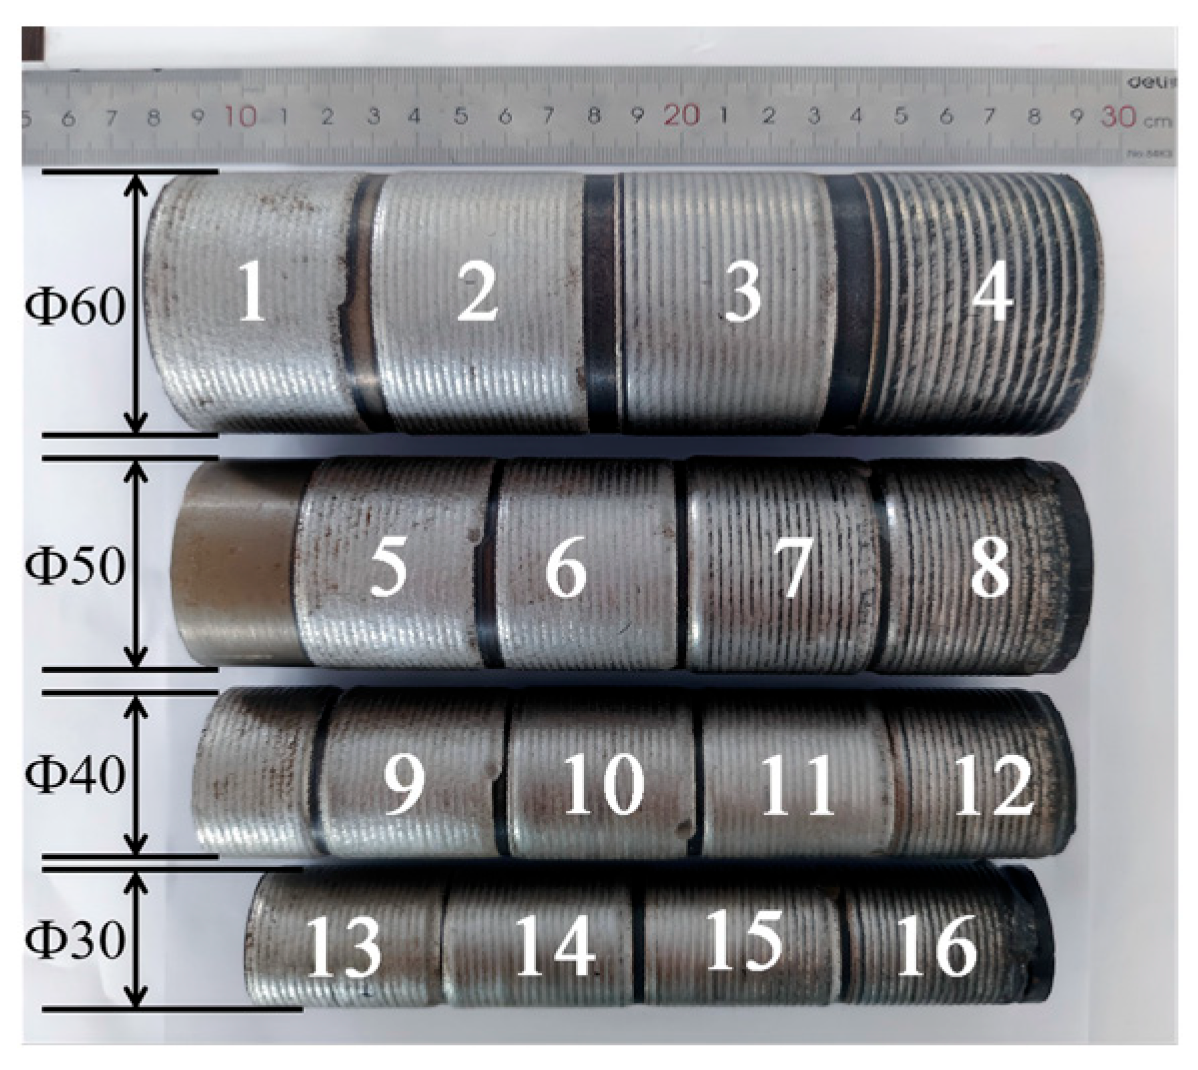
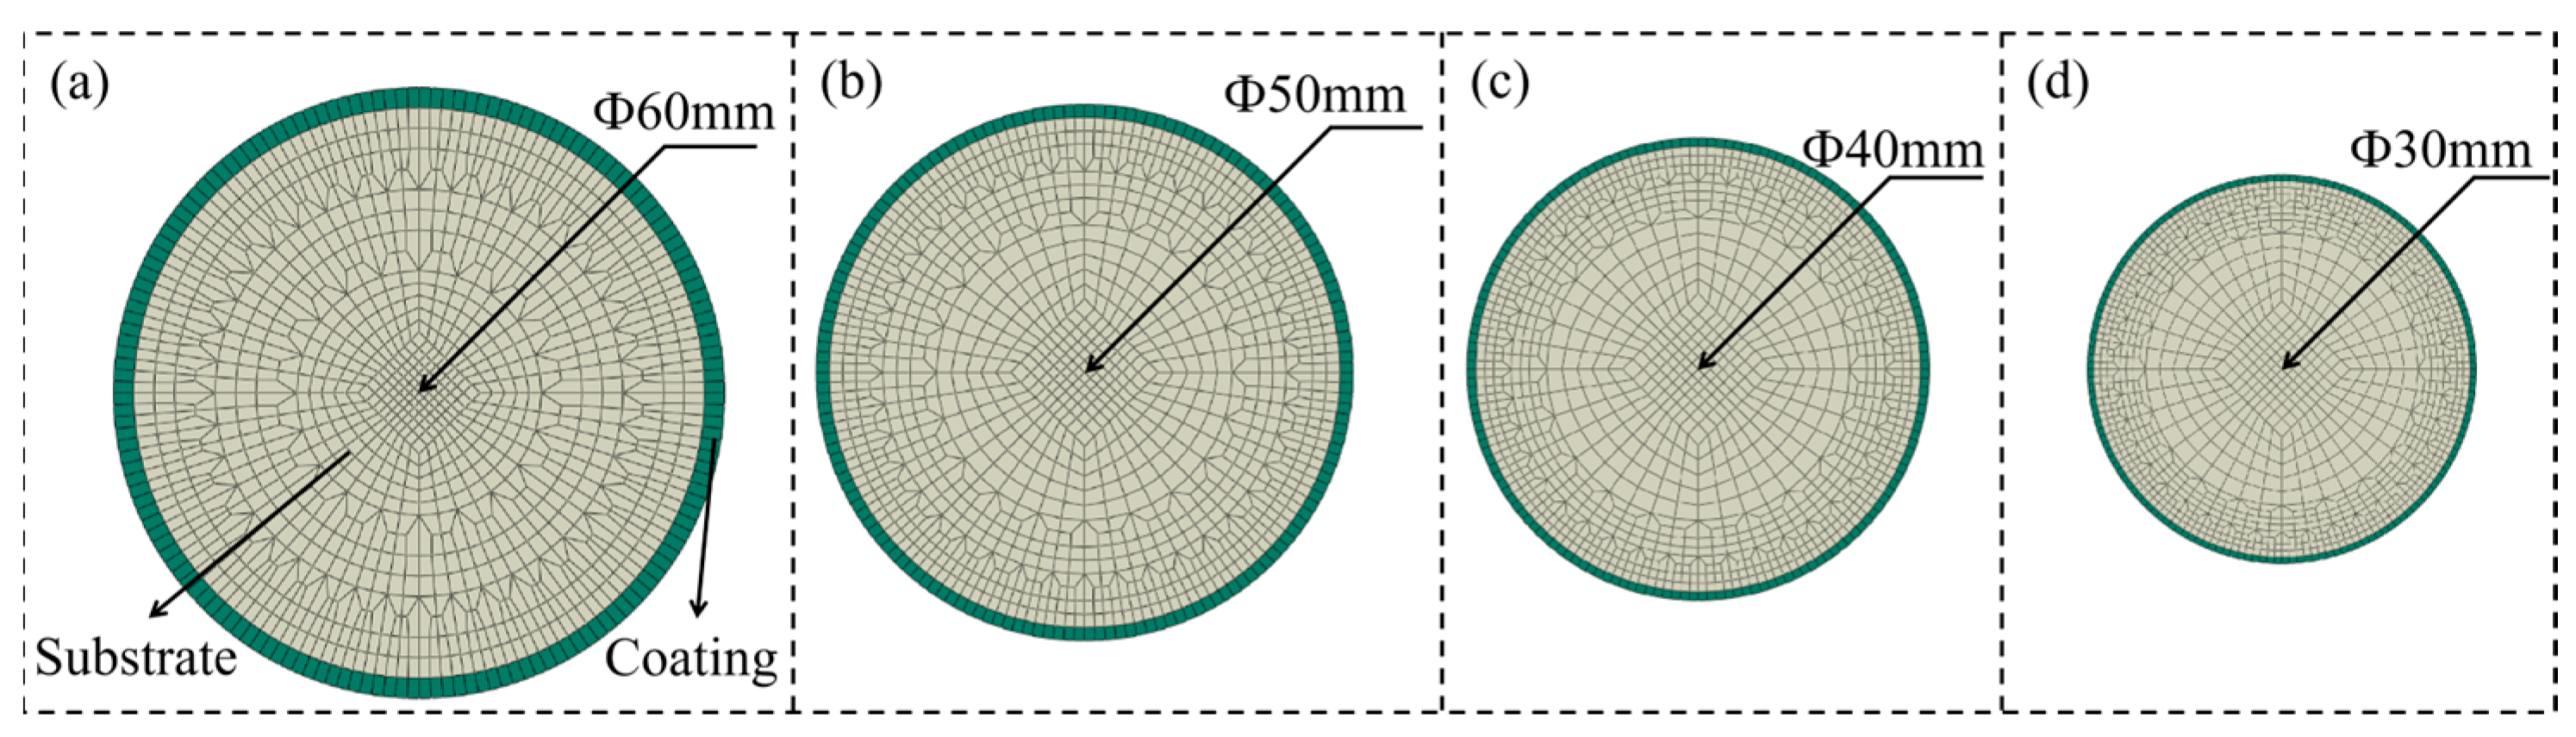
Figure 1. Specimens with diameters of 30 ± 0.2 mm, 40 ± 0.2 mm, 50 ± 0.2 mm, and 60 ± 0.2 mm were prepared from these two materials and cleaned with alcohol prior to the experiments. Energy dispersive spectroscopy (EDS) analysis revealed the detailed compositions of the materials, as summarized in
Table 1.
The material properties of 45 steel [
30] and the iron-based powder [
31], obtained from the literature review, are summarized in
Table 2, and these data were used for numerical simulation.
In this study, an L16 (4
3) orthogonal experimental design was adopted as a parameterization strategy to account for substrate size-dependent thermal effects, as shown in
Table 3. This design methodology was implemented based on the influence of substrate size on heat transfer behavior during laser cladding. Equation (1) defines the energy density calculation, while Equation (2) represents the thermal diffusion time constant. For the substrate sizes investigated, the thermal diffusion time constants were: 18.6 s for 30 mm substrates, 23.1 s for 40 mm substrates, 26.8 s for 50 mm substrates, and 31.2 s for 60 mm substrates. This quadratic relationship demonstrates that as substrate size increases, the time required for heat diffusion within the substrate is significantly prolonged, thereby influencing molten pool formation and dilution rate control, demonstrated by the following:
where
P represents the laser power (W);
V represents the cladding speed (mm/min), and
where
is the material density,
is the specific heat capacity,
D is the substrate diameter, and
kk is the thermal conductivity.
To maintain comparable thermal cycles and process stability across different substrate sizes, the energy density range was proportionally adjusted in the experimental design. For large-diameter substrates (50–60 mm), lower energy densities (1.43–2.67 J/mm2) were employed to prevent excessive heat accumulation and substrate overmelting. Conversely, higher energy densities (1.91–2.92 J/mm2) were applied to smaller-diameter substrates (30–40 mm) to counteract rapid heat dissipation effects and ensure sufficient metallurgical bonding. In this study, the laser spot diameter was fixed at 5 mm.
Figure 2 illustrates the laser cladding apparatus used in this study. In this experiment, a series of high-end equipment was employed, including the ZKZM-12000 model high-speed cladding fiber laser, a 15-m transmission fiber, the ZKZM-Z1 model coaxial powder feeding high-speed cladding head, the ZKZM-DF model powder feeder (separate type), the ZKZM-JCB-35 (enclosed) model high-speed cladding machine tool, and the V1.0 model intelligent processing system for high-speed laser cladding device failures (ZKZM, Shaanxi Zhongke Zhongmei Laser Technology Co., Ltd., Xi’an, China). Additionally, the cooling system consisted of CWFL-12000EN and CW-6100AN model chillers (Guangzhou TeYu, Guangzhou, China) to ensure the stable operation of the equipment. As summarized in
Figure 3, an iron-based powder coating with different dilution rates was prepared on the 45 steel substrate using laser cladding technology.
Samples were extracted from the fabricated coatings through the wire electrical discharge machining technique, followed by embedding and grinding processes. The stress layer was eliminated from the sample surfaces through electrolytic polishing for microstructural observation. The study utilized the SEM (Crossbeam 350, Zeiss, Oberkochen, Germany), coupled with the EDS, to examine the elemental distribution within the samples. The coating’s grain size was examined using the attached EBSD. The experimental data was scrutinized utilizing Channel 5, a sophisticated data analysis software that significantly aids in the processing and interpretation of EBSD data. It provides enhanced visualization capabilities, accurate measurements of grain boundaries, and a robust statistical analysis of the microstructural characteristics. The microhardness of the clad layer was measured using a micro-Vickers hardness tester (HV-1000TPTA, Weihai Huate Instrument, Weihai, China) with a load of 1.96 N (200 gf) and a dwell time of 10 s. According to the ISO 4545-1:2023 standard [
32], ≥5 independent measurements were performed per test point at 0.5 mm intervals to avoid mutual interference, and the average value was calculated to ensure statistical reliability.
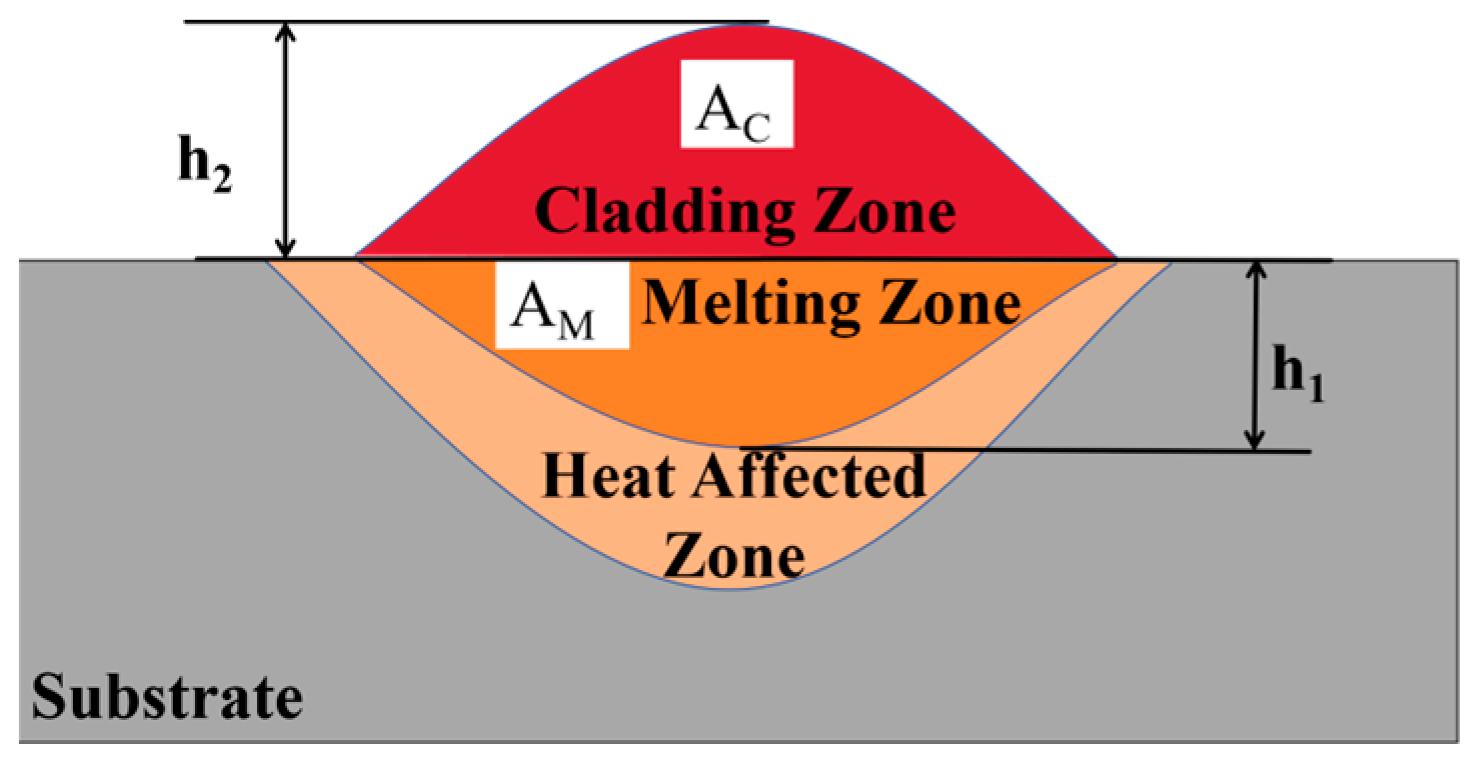
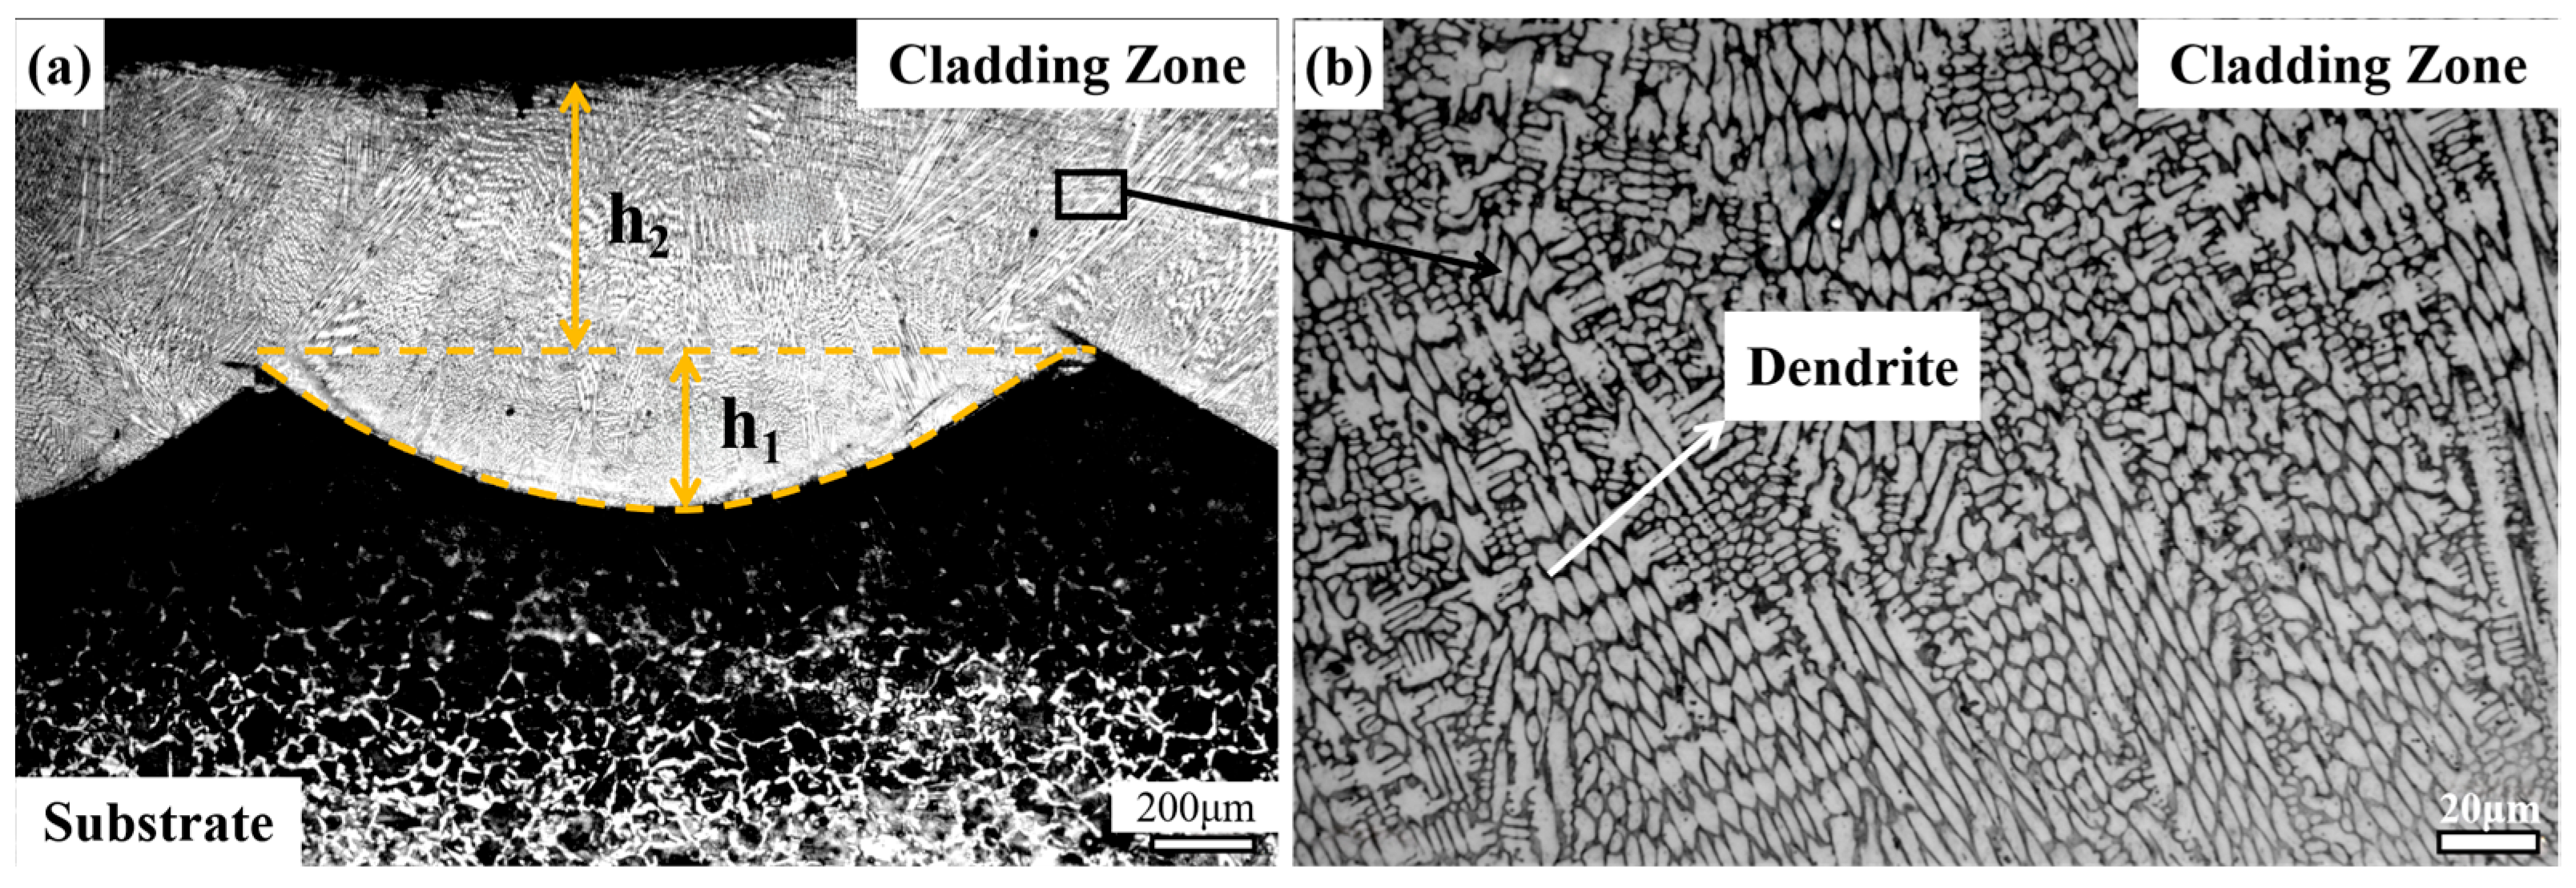
The dilution ratio of the specimen is determined by measuring the size of the cladding layer and the melting area.
Figure 4 shows the results after cladding. The dilution ratio is calculated by the formula in Equation (3)
where η
1 denotes the dilution rate, with A
C representing the cladding area and A
M the melting area. Additionally, h
1 indicates the melting zone’s height, while h
2 signifies the cladding layer zone’s height.
To accurately assess the chemical makeup within the cladding, an additional method involves using EDS to ascertain the Fe concentration within it. Utilizing the elemental distribution data acquired from the EDS analysis, the dilution rate is subsequently recalculated through the elemental analysis method, as illustrated in Equation (4).
Here, η
2 denotes the dilution rate, while
and
are the densities of the melted powder and substrate, respectively.
and
represent the weight percentages of element X in the powder and substrate, respectively.
is the weight percentage of element X in the entire coating, and
is the combined weight percentage of element X in the powder and the substrate material [
33].
The finite element model in this study is based on the following key assumptions:
- (1)
Molten Pool Simplification: The molten pool is considered as a uniformly mixed liquid metal phase, neglecting convection patterns and the Marangoni effect;
- (2)
Phase Transition Simplification: Phase change processes are simplified to occur at fixed temperatures, ignoring dynamic mushy zone evolution;
- (3)
Interface Behavior: Surface tension and wetting behavior are not explicitly modeled, assuming perfect metallurgical bonding at interfaces;
- (4)
Laser Source Idealization: The laser beam is idealized as a circular heat source with Gaussian distribution, disregarding beam quality variations and absorption coefficient fluctuations;
- (5)
Material Properties: Material properties are treated as temperature-constant within individual phases, although this may introduce errors under extreme thermal gradients, ensuring computational efficiency.
These assumptions enable the model to capture dominant heat transfer mechanisms while maintaining computational tractability for process optimization studies.
The fundamental heat transfer equation for the laser cladding process is the transient heat conduction equation
where
T is the temperature (K)
t is time (s)
is the material density (kg/m3)
is the specific heat capacity (J/kg·K)
is the thermal conductivity (W/m·K)
is the heat source term (W/m3)
The laser heat source is modeled using a Gaussian heat flux distribution as follows:
where
is the laser absorption efficiency (typically 0.3–0.8 for iron-based materials)
P is the laser power (W)
r0 is the effective laser beam radius (mm)
v is the cladding speed (mm/s)
(x, y) are the spatial coordinates
The boundary conditions applied to the model include:
Heat convection at the surface:
Combined convection and radiation:
where:
is the convective heat transfer coefficient (W/m2·K)
is the ambient temperature (K)
is the surface emissivity
is the Stefan-Boltzmann constant (5.67 × 10⁻⁸ W/m2·K4)
is the outward normal direction
Equations (5)–(9) describe the transient heat transfer model for laser cladding, governed by the transient heat conduction equation (Equation (5)), incorporating a Gaussian heat source (Equation (6)) for laser energy distribution, and addressing surface heat dissipation via convective (Equation (7)), radiative (Equation (8)), and combined (Equation (9)) boundary conditions.
A numerical simulation using Abaqus software 2023 observes heat transfer during laser cladding, predicting dilution rate fluctuations verified by actual data. RSM models and fits experimental data to establish a correlation between the dilution rate, hardness, and cladding parameters. Control equations derived elucidate the correlation involving dilution rate and hardness in response to various cladding parameters, providing a theoretical foundation and practical guidance for optimizing the laser cladding process to achieve optimal results.
3. Results and Discussion
3.1. Sectional Morphology Analysis and Geometric Method Calculation of Cladding Layer
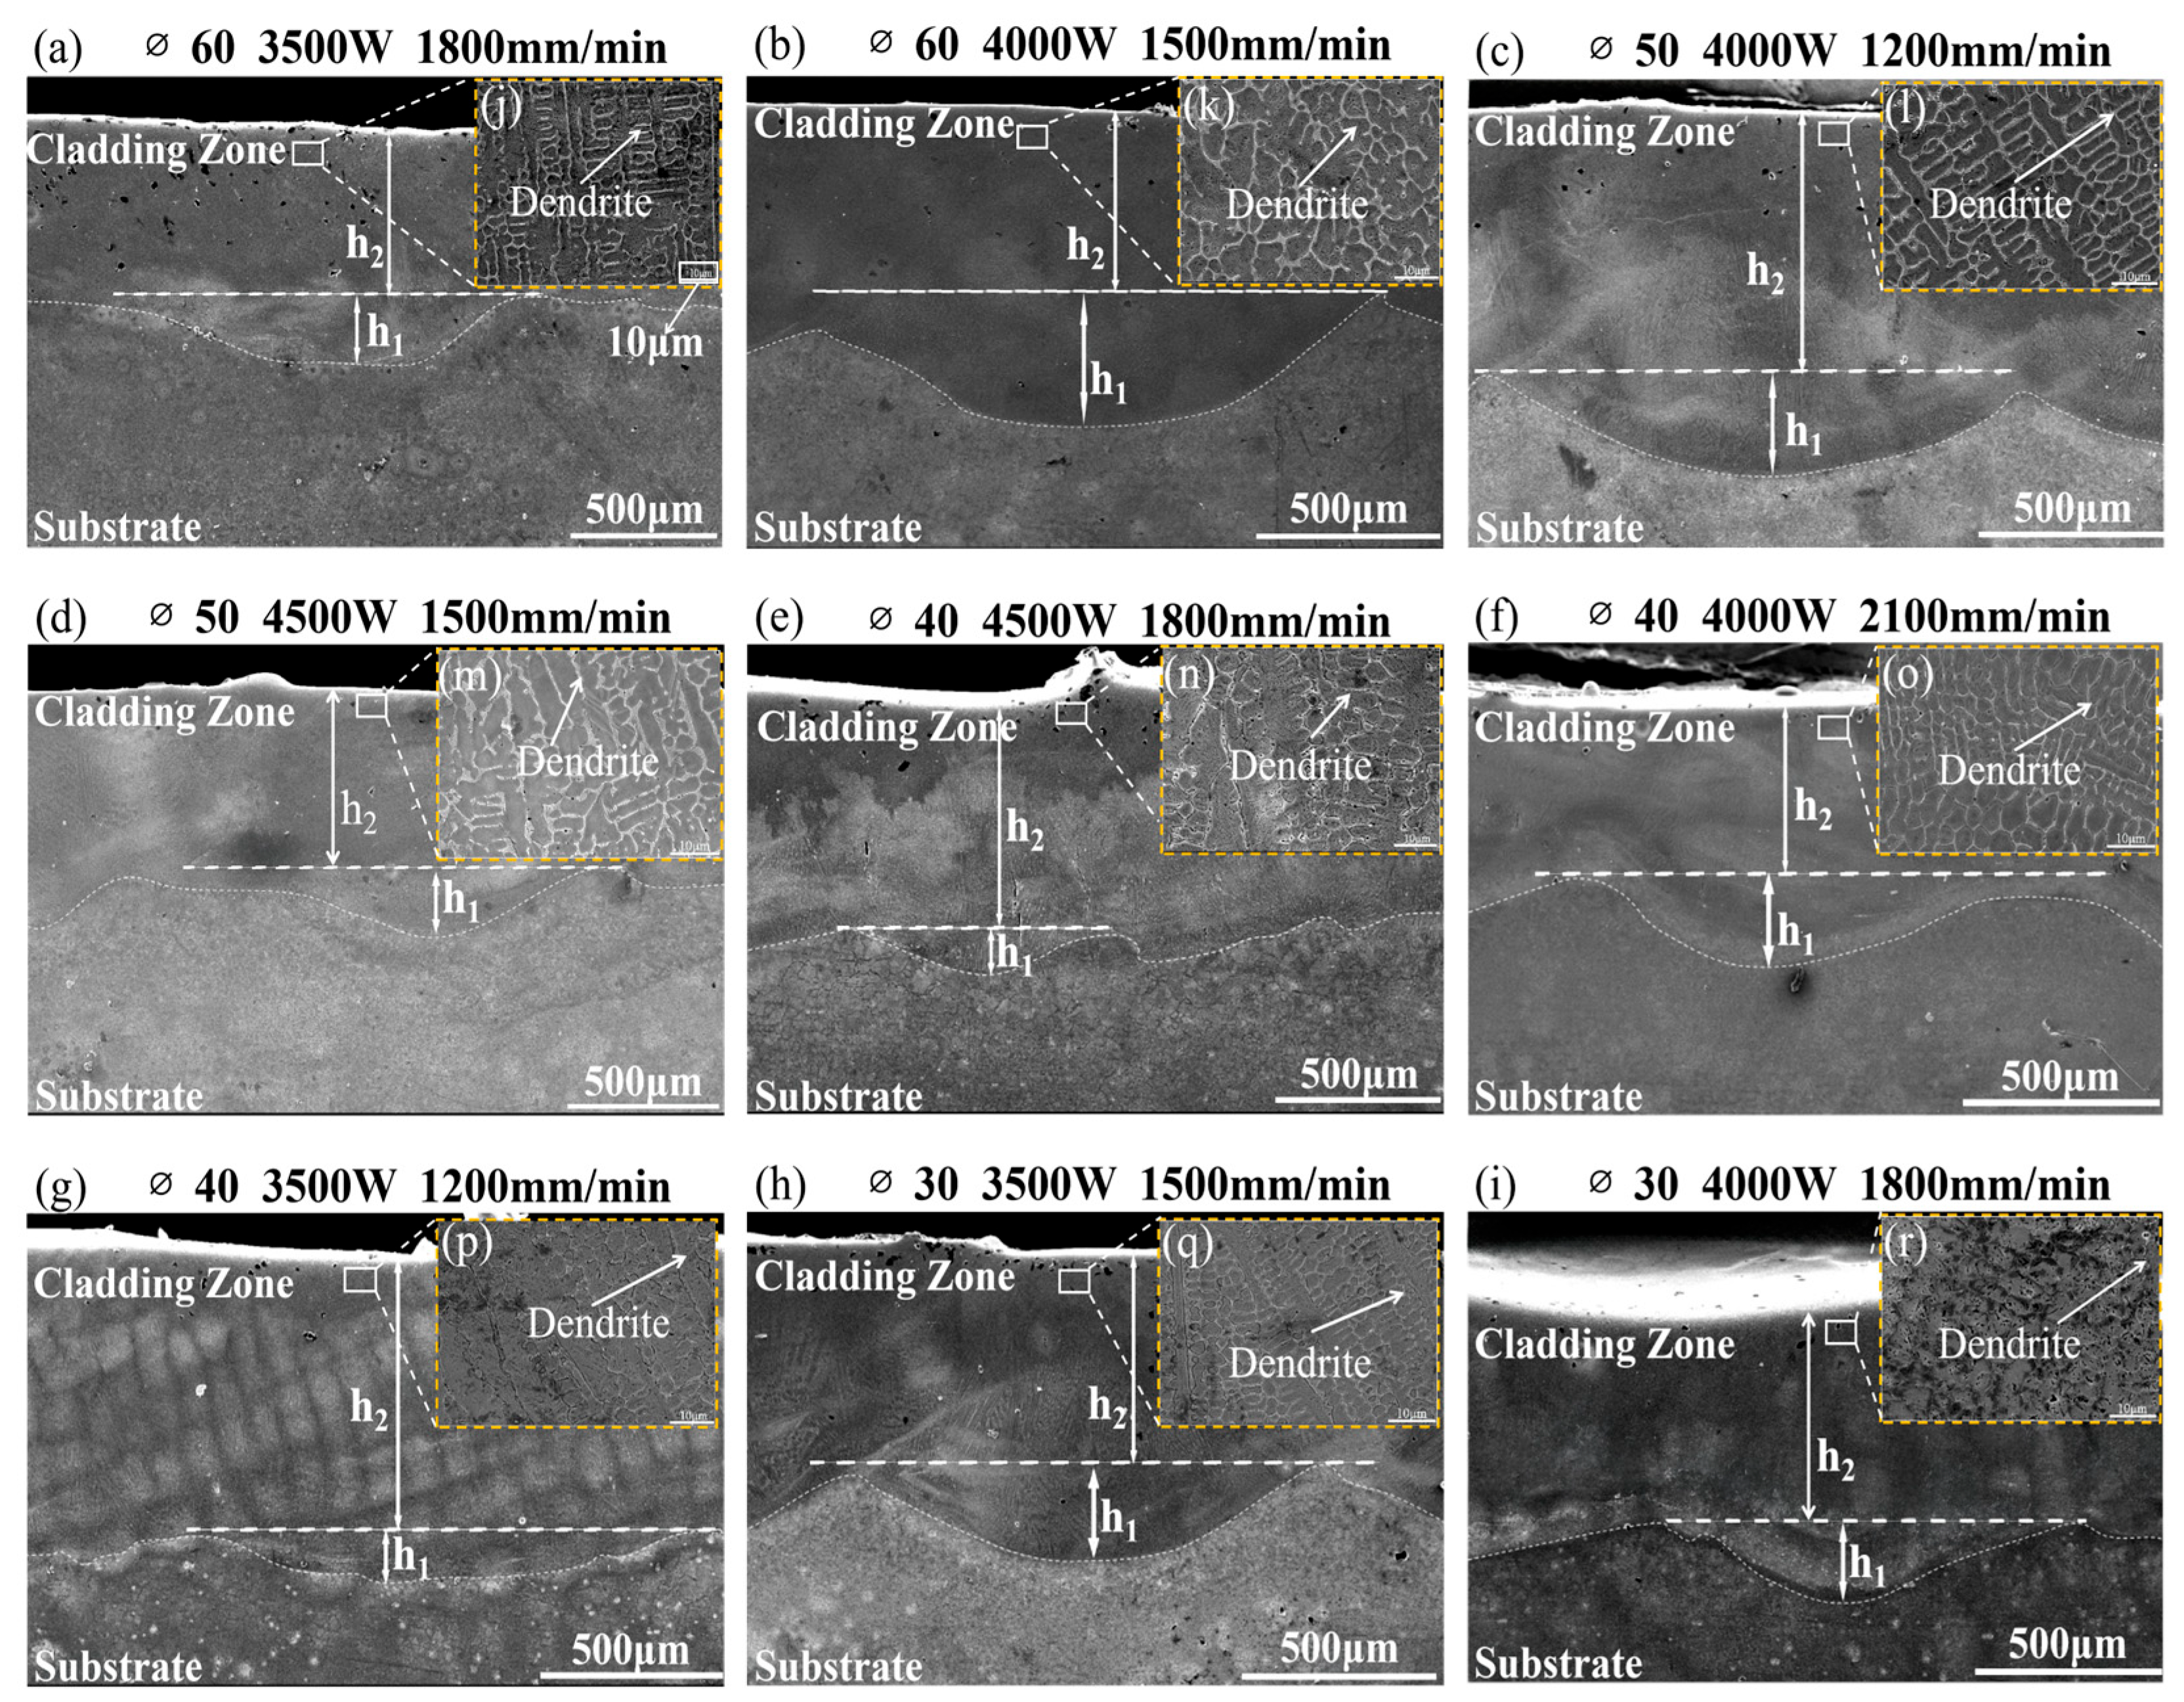
The microstructure of the cladding layer is shown in
Figure 5, exhibiting a typical dendritic morphology. This kind of structure is usually formed during rapid cooling, indicating a high cooling rate during the cladding process [
34]. The characteristics of dendrites are that they grow like tree branches from the solidification front, which significantly affects the microstructural features and macroscopic properties of the material. Moreover, the formation of dendrites may be accompanied by a non-uniform distribution of chemical composition, indicating the presence of segregation. By adjusting the cladding process parameters, such as cladding temperature and cooling rate, and systematically changing the laser power, substrate diameter, and cladding speed, the growth of dendrites can be controlled, and the changes in microstructure under different conditions can be observed, thereby optimizing the overall performance of the cladding layer. The experimental summary found that increasing the laser power will lead to an enlarged molten pool and increased molten pool size, thereby accelerating the growth rate of dendrites and forming longer dendritic structures, as shown in
Figure 5i–m. The formation of dendrites is due to the higher energy input increasing the temperature gradient in the molten pool, thereby promoting rapid crystal growth. In addition, by reducing the cladding speed, a slower cooling rate can be achieved, which promotes the formation of larger grain sizes and increases the dendrite spacing, as shown in
Figure 5o,p. Grain size is closely related to the microstructural characteristics of the material, and its increase will affect the hardness and toughness properties of the material.
Figure 6a,b shows the EBSD images of sample 6 (diameter 50 mm, energy density 1.67 J/mm
2) and sample 13 (diameter 30 mm, energy density 2.50 J/mm
2), respectively. As can be seen from
Figure 5, the cladding layer mainly consists of ferrite (α-Fe, BCC) and austenite (γ-Fe, FCC) phases, with the γ-Fe phase being dominant. In materials containing the γ-Fe phase, a higher dilution rate means that more substrate material is introduced into the cladding layer, thereby affecting the final microstructure and hardness. During the entire laser cladding process, a phase transformation occurs in the material, that is, from FCC to BCC. These structural changes take place under different dilution rates and affect the hardness of the material. The thermal stress and phase transformation stress generated during the laser cladding process also affect the hardness. A higher dilution rate tends to reduce residual stress because the variation in thermal expansion coefficients between the substrate and the cladding material is minimized. In addition, for the sample in
Figure 6b, the proportion of high-angle grain boundaries reached 88.2%, while it was only 75% for the sample in
Figure 6a. The reason is that factors such as laser power, cladding speed, and diameter directly affect the temperature distribution in the molten pool, the cooling rate, and the conditions under which crystallization occurs. These factors, in turn, affect the development of high-angle grain boundaries. As a specific type of grain boundary, high-angle grain boundaries can hinder the free movement of dislocations, thereby increasing the hardness of the material.
Based on the observed morphology of the coating in
Figure 5, the dilution rate can be determined using the geometric method by calculating the height of the coating through Formula (3). The values of h
1 and h
2 were measured using Photoshop software 2024, and the dilution rate was calculated. The findings are presented in
Table 4.
As evidenced by
Table 4, the dilution rate calculated by the geometric method varies significantly under different process parameters. For example, for the sample with a diameter of 60 mm, the dilution rate increased from 27.0% to 30.5%, suggesting that elevated energy input intensifies the melting of the substrate and the mixing with the cladding layer. However, some data are anomalous. For instance, for the sample with a diameter of 50 mm, the dilution rate was only 20.8% at an energy density of 3.00 J/mm
2, but increased to 26.7% at 3.33 J/mm
2. This suggests that the coupling effect between substrate diameter and energy input can lead to a nonlinear response in the molten pool dynamics. Moreover, for the small-diameter substrate (30 mm) at high energy density (2.50 J/mm
2), the dilution rate remained low at 15.6%, which is related to the rapid cooling that inhibits the melting of the substrate.
In addition, although the geometric method is intuitive, measurement errors may increase when the interface is blurred or the molten pool morphology is complex. For such cases, another calculation method needs to be introduced, that is, to compensate for the shortcomings of the geometric method through elemental distribution analysis to ensure the accuracy of the dilution rate calculation.
3.2. Calculation of Dilution Rate by Elemental Migration Method
Figure 7 shows the SEM images of some samples after laser cladding, where no clear melting zone was observed at the interface between the cladding layer and the substrate. This phenomenon is mainly caused by the synergistic effect of process parameters and material properties. First, high energy density (such as 3.75 J/mm
2 for No. 4) and large-diameter substrates (such as 60 mm for No. 1 and No. 4) significantly affect the expansion behavior of the molten pool. Large-diameter substrates, due to slow heat dissipation, lead to thermal accumulation, a high growth rate of molten pool depth, and an expanded volume of substrate melting, which promotes full interdiffusion between the substrate and the cladding layer and reduces the elemental gradient at the interface. In contrast, small-diameter substrates (such as 30 mm for No. 16) under high power (4500 W) and high speed (2100 mm/min) cool rapidly, suppressing the differences in the interface microstructure. In addition, the chemical compositions of the substrate and the cladding powder are similar. After interdiffusion, the difference in Fe content is small, resulting in insufficient contrast at the interface in the SEM images, and the geometric method cannot accurately measure the height of the melting zone.
To address this issue, the study adopted the elemental migration method. Since iron is a key component of 45 steel, its content variation can reflect the mixing and reaction conditions during the cladding process. Cr, as a dilution rate indicator, is sensitive to substrate mixing and suitable for low-dilution scenarios, but oxidation or carbide formation under high energy density may cause deviations in measured values. Ni is applicable for high-dilution validation but requires eliminating molten pool convection disturbances. Both should be selected based on process-specific characteristics. Therefore, iron is an ideal indicator for assessing the degree of mixing between the cladding material and the substrate. Using iron as an indicator can simplify the calculation and avoid confusion from changes in the content of other elements. EDS analyzed the average mass fraction of elements on the surface of the cladding layer, as shown in
Figure 8. The average content of each element is shown in
Table 5. These data reflect the mixing degree of different samples with the substrate during the cladding process, enabling us to calculate the dilution rate of each sample using the element migration method, to evaluate the quality and consistency of the coating. The use of Formula (4) to calculate the dilution rate and the corresponding data are summarized in
Table 6.
According to
Table 6, for the substrate with a diameter of 60 mm, when the energy density increases from 1.43 J/mm
2 to 3.75 J/mm
2, the dilution rate rises from 16.2% to 25.4%, and the Fe content increases from 78.12% to 80.47%. This indicates that high energy input extends the duration of the molten pool, accelerating the diffusion of Fe from the substrate into the coating. For the substrate with a diameter of 30 mm, even with an energy density of only 2.14 J/mm
2, the dilution rate still reaches 21.2%. This is because the small-diameter substrate has limited heat capacity, and local thermal accumulation leads to non-linear growth in the depth of the molten pool. Additionally, for the substrate with a diameter of 40 mm at a moderate energy density of 2.00 J/mm
2, the dilution rate is 13.7%, indicating that the dynamic balance between the heat diffusion path and energy input effectively suppresses excessive melting of the substrate. This verifies the applicability of the elemental migration method in scenarios where the interfacial element gradient is blurred.
3.3. Calculation of Dilution Rate by Finite Element Method
Compared with the geometric method (large errors due to unclear interfaces) and the elemental method (time-consuming EDS analysis), the finite element method for temperature field simulation can dynamically analyze the laser energy transfer and molten pool heat diffusion process, and calculate the dilution rate under different parameter conditions. On the one hand, it can break through the dependence of experimental measurement on interface morphology. On the other hand, its full-parameter-domain prediction capability can reduce the cost of industrial trial and error.
In this study, 2D modeling was used because the determination of dilution ratio fundamentally depends on the cross-sectional measurement of bath depth and cladding height. Since these geometric parameters are typically measured and analyzed through metallographic cross-sections perpendicular to the cladding direction, the 2D simulation approach directly corresponds to the experimental measurement methodology. This dimensional reduction significantly enhances computational efficiency while maintaining the essential physics needed for dilution rate prediction, allowing for extensive parametric analysis across multiple substrate diameters and energy densities.
The simulation employs the element birth–death technique to model progressive material deposition during the laser cladding process. As shown in
Table 2, the thermal properties of the material were described in detail, including thermal conductivity, specific heat capacity, density, and other related characteristics. Initial conditions set both substrate and deactivated cladding elements at ambient temperature (25 °C). The laser heat source is applied as a moving concentrated heat flux with a Gaussian distribution, using laser power values from
Table 3 and an absorption efficiency of 0.35 [
35]. Convective boundary conditions apply a film coefficient of 15 W/(m
3·K) to all exposed surfaces, while radiation heat transfer uses an emissivity of 0.7 from
Table 2. The substrate bottom surface maintains fixed temperature boundary conditions to simulate heat sink effects. Cladding elements are progressively activated based on temperature criteria corresponding to material melting points, synchronized with experimental cladding speeds to accurately represent the deposition timeline and thermal accumulation effects that become significant for larger substrate diameters.
To improve the efficiency and accuracy of the solution, meshing was performed using Hypermesh, as shown in
Figure 9, The mesh check results indicate 1300 quadrilateral elements with a minimum angle of 30.69°, maximum angle of 147.55°, worst aspect ratio of 4.71, no warnings/errors, meeting standard engineering analysis requirements. Throughout the solution process, the D3D8T type of mesh was selected.
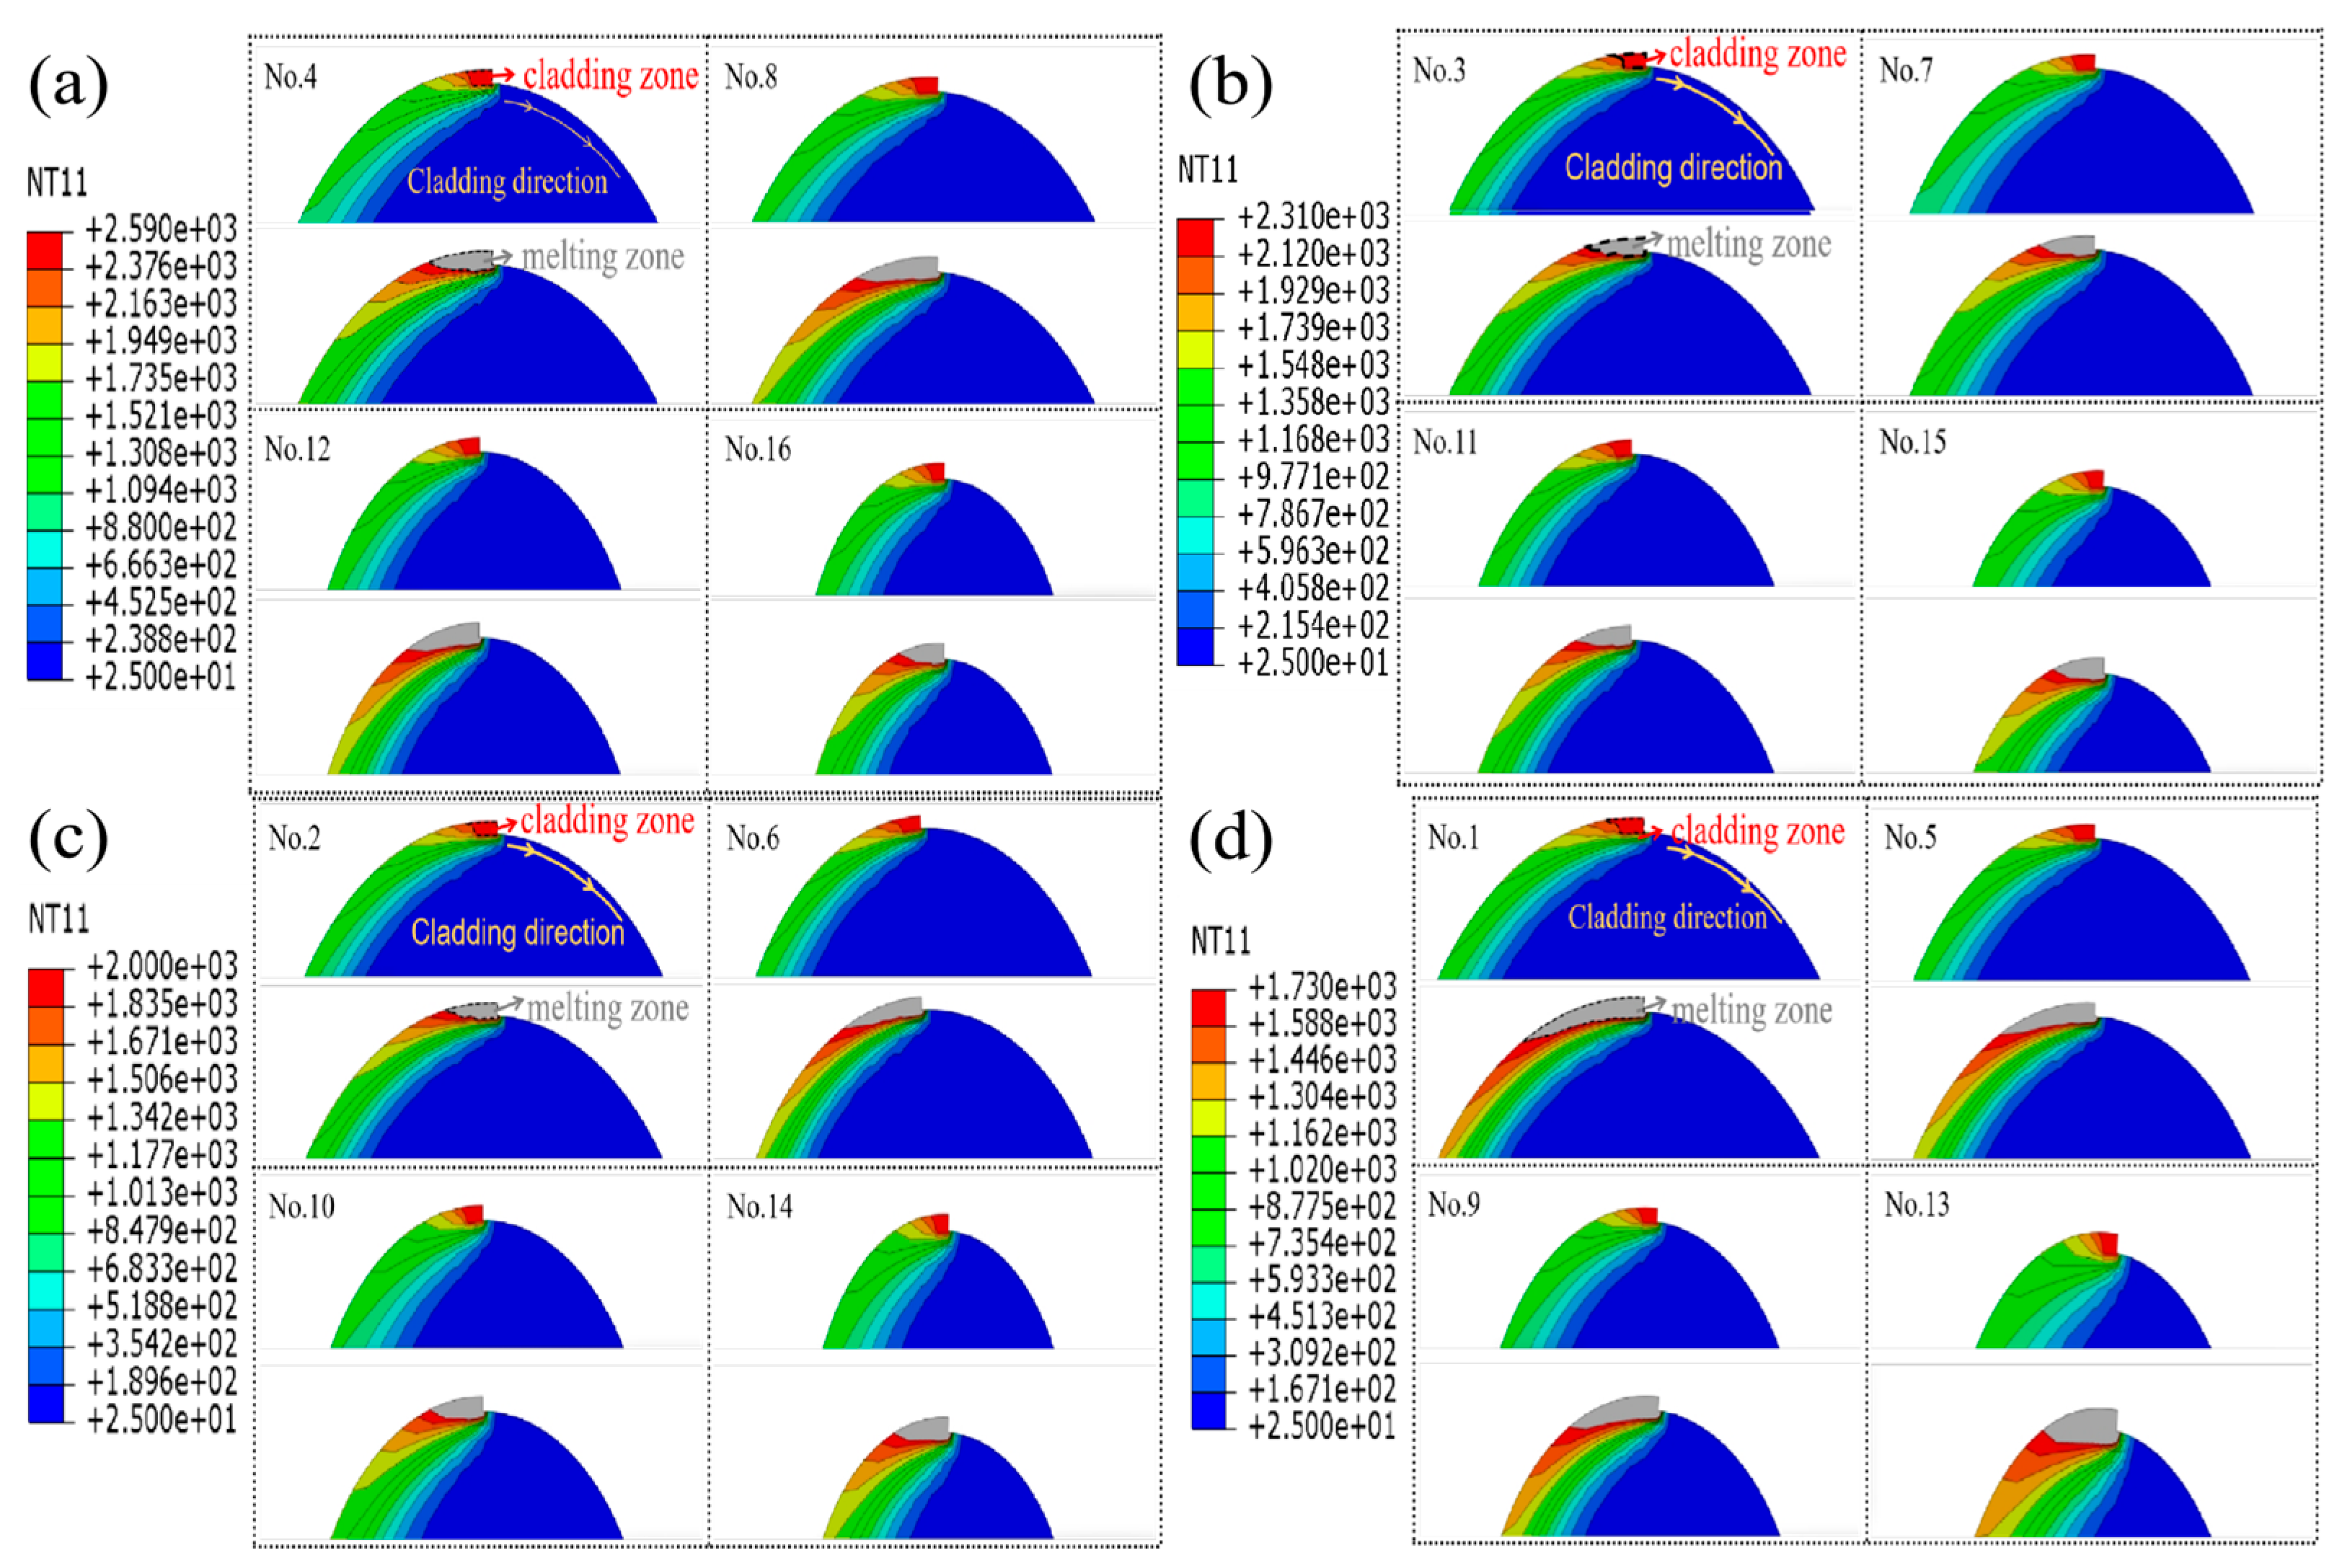
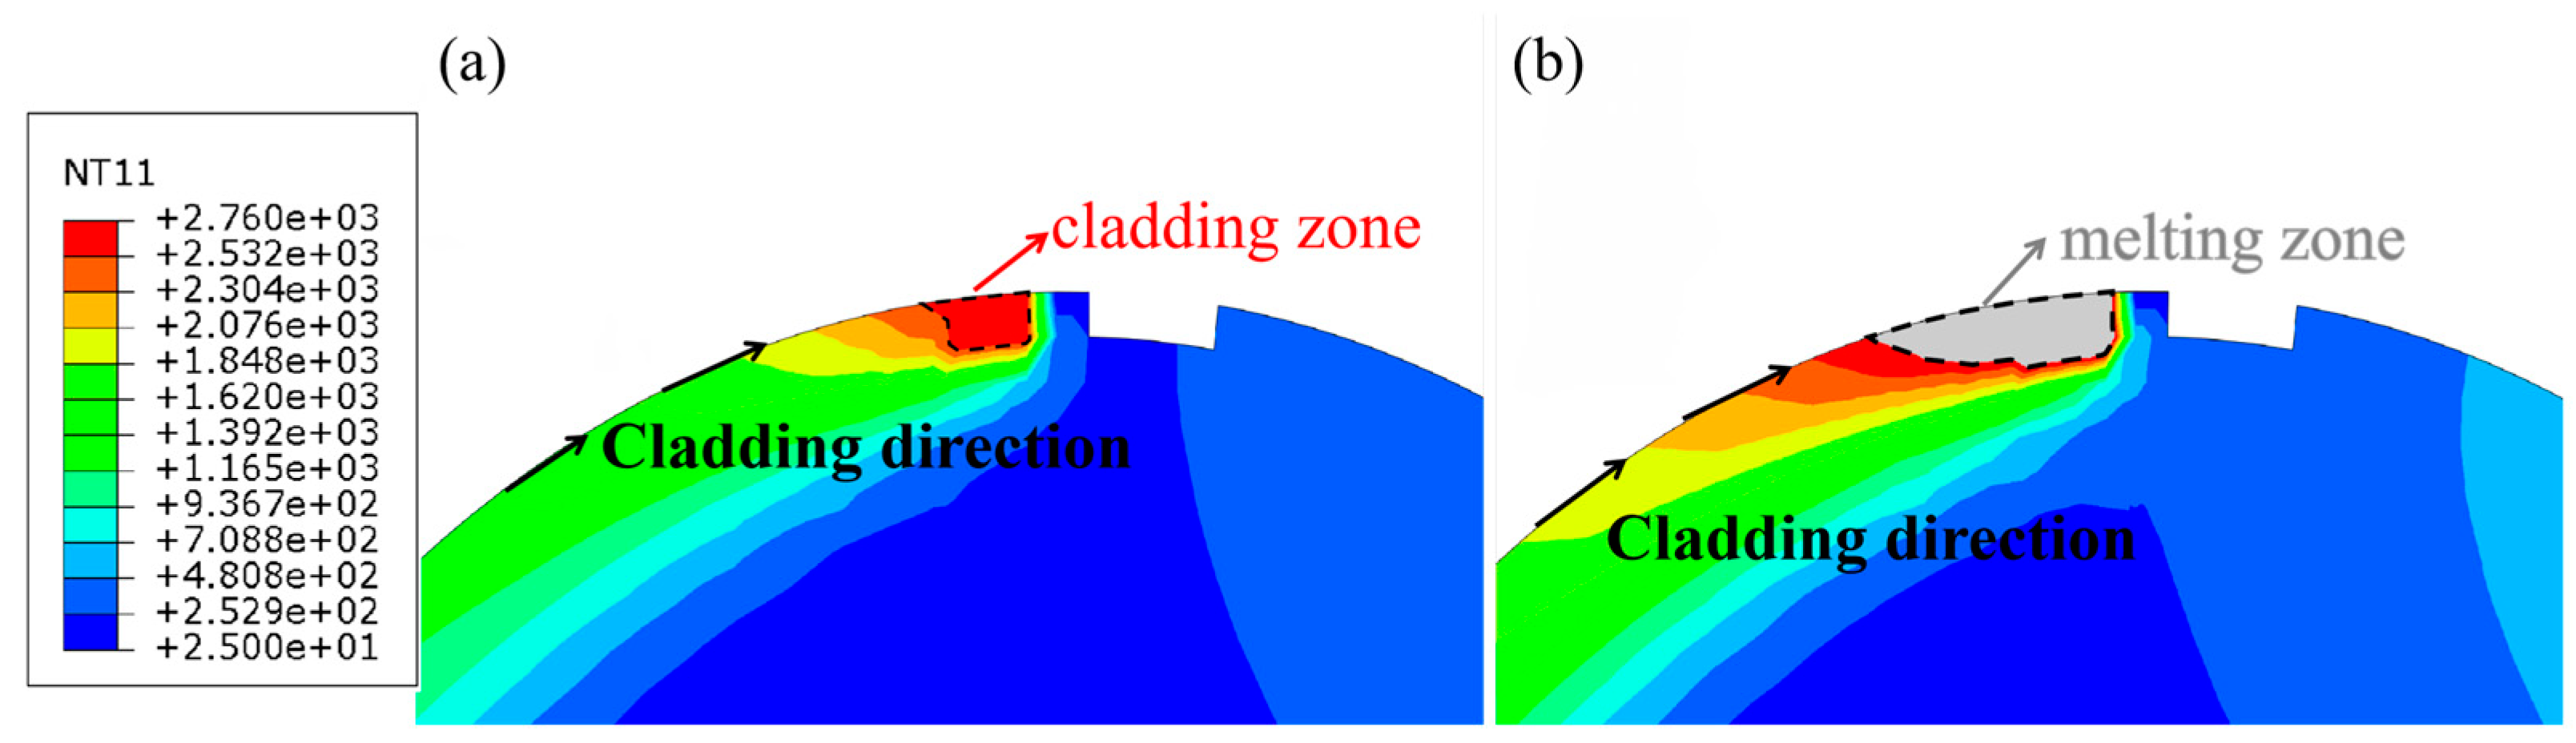
After the simulation was completed, the obtained temperature field is shown in
Figure 10, which clearly displays the temperature distribution under different conditions. By modifying the temperature settings, simulations were conducted on samples subjected to different power treatments during the laser cladding process.
Therefore, the results provide temperature distribution maps of the melted zone and the cladding zone. In the Abaqus software, the boundaries of these two regions were extracted from the simulation results, and their areas were calculated using Photoshop software. Subsequently, the dilution rate was calculated using the area calculation method of Formula (3), and the obtained results are detailed in
Table 7.
To verify the accuracy of the simulation results, they were compared with the dilution rates measured in actual experiments. By comparing the dilution rates obtained from the Abaqus simulation with those measured experimentally, it was found that the percentage error between the two was within 5%. This result validates the reliability of the simulation method. Error analysis indicates that the errors may originate from numerical discretization in the simulation process, uncertainties in experimental measurements, and minor variations in material properties. Although some errors exist, by considering the sources of errors in both simulation and experiments and taking appropriate error control measures, the accuracy of the dilution rate calculation can be ensured within an engineering acceptable range. This provides a solid theoretical basis for optimizing the welding process.
The combined use of three dilution rate calculation methods can enhance the accuracy and reliability of the results. The geometric calculation method provides a basis for experimental data, the elemental migration method reveals the interactions between materials, and the finite element simulation method offers theoretical guidance for process optimization. Moreover, the combination of these three methods can also help predict and improve the performance of laser-deposited layers.
3.4. Influence of Process Parameters on Dilution Rate
In this study, to explore the influence of diameter and energy per unit length on the dilution rate during the welding process, linear regression analysis was employed. A model was constructed as follows:
where
represents the intercept,
and
are the coefficients indicating the effects of energy per unit length and diameter on the dilution rate, respectively, and
denotes the error term.
The results of the regression analysis show a significant positive correlation between energy per unit length and the dilution rate, with a coefficient of 6.95. This means that for every 1 J/mm2 increase in energy per unit length, the dilution rate increases by an average of about 6.95%. Meanwhile, there is a negative correlation between diameter and dilution rate, with a coefficient of −0.23, indicating that for every 1 mm increase in diameter, the dilution rate decreases by an average of about 0.23%.
Based on the data in
Table 4,
Table 6 and
Table 7, it has been demonstrated that substrate diameter and energy density can affect the dilution rate. First, there is a significant threshold effect in the regulation of dilution rate by substrate diameter. The substrate diameter directly affects the heat diffusion path and the size of the molten pool. When the diameter is greater than 50 mm, the extended heat diffusion path leads to reduced heat conduction efficiency (
, where
k is the thermal conductivity,
is the density, and
CP is the specific heat capacity), and local thermal accumulation is intensified. The depth of the molten pool increases exponentially with energy density. Finite element simulations and the data in
Table 7 show that for a substrate with a diameter of 60 mm, the growth rate of the molten pool depth is 0.41 μm, which is 46% higher than that of a 50 mm substrate (0.28 μm), and the melting volume of the substrate increases by 1.7 times. For substrates with smaller diameters (e.g., 30 mm), their limited heat capacity means that laser energy is more concentrated in the local area, resulting in a shallower molten pool and reduced substrate melting, thereby lowering the dilution rate. In contrast, for substrates with larger diameters (e.g., 60 mm), the increased heat diffusion area allows the molten pool to penetrate deeper into the substrate, promoting mixing between the coating and the substrate, and thus increasing the dilution rate. For a substrate with a diameter of 30 mm, even at a relatively high energy density (2.50 J/mm
2), the dilution rate remains at a low level (15.6%). However, when the substrate diameter increases to 40 mm, the effect of energy density on the dilution rate becomes more significant. For example, at an energy density of 2.00 J/mm
2, the dilution rate is 13.7%, but it rises to 31.7% at 2.92 J/mm
2. However, for a substrate with a diameter of 40 mm, the dilution rate is unexpectedly high at 31.7% under a lower energy density (1.91 J/mm
2). This anomaly may be due to local energy density fluctuations causing an uneven temperature distribution within the molten pool, thereby increasing the dilution rate. Samples with a diameter of 50 mm also show a similar trend, with the dilution rate increasing from 15.8% at an energy density of 1.667 J/mm
2 to 26.7% at 3.333 J/mm
2. For the largest diameter samples of 60 mm, the dilution rate rises from 16.2% at an energy density of 1.429 J/mm
2 to 30.5% at 3.750 J/mm
2. The data indicate that although higher energy density generally leads to a higher dilution rate—since greater energy input makes the molten pool deeper and larger, thereby enhancing the mixing of the substrate and cladding materials—the increase in substrate diameter does not significantly raise the dilution rate under low energy density conditions. Instead, under high energy density conditions, the expansion of the molten pool area leads to a more significant increase in the dilution rate.
3.5. Hardness of Cladding Layers for Samples with Different Parameters
To evaluate the hardness of the deposited layers, Vickers hardness tests were conducted on the upper surfaces, and the results represented the hardness characteristics of the cladding layers, as shown in
Table 8. The hardness was determined using the following formula:
where
F represents the applied force (in Newtons), and
d represents the average size of the diagonal of the indentation (in millimeters). The final hardness value is determined by the average of multiple readings to ensure precision.
The analysis of
Figure 5 and
Table 8 reveals the correlation between the coating microstructure and its hardness. Specifically, the EBSD results show that the proportion of high-angle grain boundaries varies between 75% and 88.2% for different samples. For example, sample 6 has a high-angle grain boundary proportion of 75% (see
Figure 5a), with a hardness of 420 HV, while sample 13 has a proportion of 88.2% (see
Figure 5b), with a hardness of 343 HV. Further analysis indicates a significant positive correlation between the proportion of high-angle grain boundaries and hardness. When the proportion of high-angle grain boundaries increases from 75% to 88.2%, the hardness value rises from 420 HV to 738 HV (sample 16, with a dilution rate of 21.2% and hardness reaching 738 HV, as shown in
Table 8). This finding suggests that high-angle grain boundaries can effectively hinder dislocation movement, thereby increasing the material’s hardness. Additionally, for large-diameter (>50 mm) substrates under high energy density conditions, the cooling rate of the molten pool decreases from 10
4 K/s to 5 × 10
3 K/s, and the proportion of γ-Fe phase increases from 75% to 88%. The reduced driving force for phase transformation leads to intensified grain boundary migration, accelerating the interdiffusion of elements between the substrate and the coating. This process, combined with the thermal diffusion delay effect, significantly increases the dilution rate while reducing the hardness due to grain coarsening (for example, for a 60 mm substrate at 3.75 J/mm
2, the hardness is 426.5 HV, as shown in
Table 8).
The hardness data indicate that the relationship between dilution rate and hardness has a significant non-monotonic characteristic: for a small-diameter (30 mm) substrate at an energy density of 2.143 J/mm
2, although the dilution rate is only 21.2%, the hardness reaches 738 HV. This is mainly due to the ultra-fine dendritic structure (grain boundary spacing < 1 μm) formed by rapid solidification (cooling rate > 1.5 × 10
4 K/s), which significantly strengthens the material through the Hall-Petch relationship. In contrast, for a 50 mm substrate at an energy density of 3.333 J/mm
2, although the dilution rate is 26.7%, the hardness is only 557.5 HV. This is mainly associated with the increase in oxidation defects or porosity in the molten pool due to thermal accumulation, leading to stress concentration. Further analysis reveals significant differences in the hardness evolution of substrates with different diameters, as shown in
Figure 11, for substrates with diameters of 40–60 mm, the hardness first increases and then decreases with the increase in energy density per unit length, reaching a peak (>650 HV) in the range of 1.43–2.14 J/mm
2. At this time, the thermal diffusion time constant (τ = 18.6–26.8 s) forms a dynamic balance with the energy input, and the cooling rate of the molten pool (5 × 10
3–1 × 10
4 K/s) promotes a fine-grained structure dominated by the γ-Fe phase (grain size < 5 μm). However, when the energy density exceeds 3.0 J/mm
2, thermal accumulation leads to grain coarsening (>20 μm) and a sudden increase in the dilution rate (>30%), resulting in a 15%–40% decrease in hardness. In contrast, for the 30 mm substrate, due to the shortened thermal diffusion path (τ = 18.6 s), ultra-high hardness (738 HV) is achieved through extremely rapid solidification (cooling rate > 1.5 × 10
4 K/s) at low energy density (<1.67 J/mm
2). However, as the energy density increases, the collapse of the thermal gradient hinders the austenite phase transformation (the proportion of γ-Fe decreases by 15%), reduces the grain boundary density, and leads to a linear decay in hardness (ΔHV ≈ −185/ J/mm
2). This different mechanism reveals the threshold regulation of substrate size on the thermo-mechanical coupling behavior, providing a dual criterion for process optimization: large-diameter substrates need to control energy density to avoid grain coarsening, while small-diameter substrates can break through the traditional hardness limit through ultra-rapid cooling.
The apparent contradictory trends observed for 50 mm and 60 mm diameter substrates in
Figure 11 can be attributed to the complex interplay of thermal diffusion dynamics and molten pool evolution mechanisms. When substrate diameter exceeds the critical threshold of 50 mm, the thermal diffusion time constant τ undergoes a nonlinear increase from 18.6 s to 26.8 s (46% increment), fundamentally altering the heat dissipation pathways. This extended thermal diffusion path creates a bifurcation in the hardness–energy density relationship: at moderate energy densities (1.43–2.14 J/mm
2), large-diameter substrates benefit from prolonged thermal exposure that promotes complete austenite transformation and fine γ-Fe phase formation, achieving optimal hardness levels. However, as energy density increases beyond 2.5 J/mm
2, the thermal accumulation effect becomes dominant, leading to grain coarsening (>20 μm) and reduced cooling rates (from 10
4 K/s to 5 × 10
3 K/s). Simultaneously, the molten pool geometry transitions from hemispherical to ellipsoidal configurations in large-diameter substrates, altering the solidification front dynamics and creating heterogeneous temperature gradients. This explains why 60 mm diameter substrates exhibit peak hardness at relatively low energy densities, contradicting the conventional expectation that larger substrates require higher energy input. The phenomenon is further complicated by the substrate size-dependent convection patterns within the molten pool, which were simplified in the current thermal model but likely contribute to the observed hardness variations. These findings underscore the necessity of the proposed power-diameter coupling control formula (ΔP = −12.7 D + 865.3) to compensate for the thermal retardation effects and maintain predictable hardness control across varying substrate dimensions.
3.6. Response Surface Analysis of Dilution Rate and Hardness
The response surface methodology was utilized to investigate the impact of three factors—diameter, laser power, and cladding speed—on the dilution rate and hardness [
36]. The Design Expert 13 software was employed to import data, setting up the levels and total number of experimental groups based on the existing experimental data, followed by importing the corresponding experimental data. In
Table 9, A denotes the diameter, B represents the laser power, and C represents the cladding speed.
The response surface method was used to fit the data, and a cubic regression model was derived. The model aims at the dilution rate and hardness, and takes the diameter, laser power, and cladding speed as variables.
The variance analysis findings for each of the two regression models are presented in
Table 9 and
Table 10, respectively. First, a
p-value test is conducted. A term with a
p-value ranging from 0.01 to 0.05 is considered significant within the regression equation; a
p-value below 0.01 signifies that the term is highly significant to the model, whereas a
p-value exceeding 0.1 implies the term’s insignificance. Yet, for a stringent evaluation of the regression equation’s reliability and precision, this study deems a term insignificant if its
p-value surpasses 0.05.
Both models demonstrate significant model terms, as indicated by their “Significant” designation. Both the diameter and laser power have a significant impact on both research objectives, while the cladding speed does not show an important influence on the dilution rate and hardness, suggesting that changes in cladding speed within this range cannot greatly alter the size of the dilution rate and hardness or produce a more regular influence on them. In addition, the diameter, welding power, and cladding speed are all significant terms, indicating that both research objectives are well-fitted to the quadratic regression model.
Next, the F-value test is conducted. The larger the mean square of each term, the higher its corresponding F-value. Therefore, the F-value can reflect the proportion of that term in the entire regression equation; the greater the value, the more significant the weight of that term in the regression equation, which means it is more significant for the research indicator. The main purpose of comparing the F-values is to compare the significance of the three factors on the dilution rate and hardness (not the significance). Therefore, for these two research indicators, the order of significance for the three factors is diameter > laser power > cladding speed.
The fitting information statistics of the two regression models are summarized in
Table 11. The more important parameters in the table are the dispersion coefficient, determination coefficient, and precision. It is generally believed that when the dispersion coefficient is less than 10, the degree of data dispersion is not high and is more reasonable. The dispersion coefficients of the two regression models fitted in this section are all less than 10, which proves that the fitting is good. The determination coefficients R
2, adjusted determination coefficient R
2Adj, and predictive determination coefficient R
2Pre for the two research objectives are as high as 0.9775, 0.9437, 0.8081, and 0.9611, 0.9028, 0.8049, respectively. The closer the coefficient of determination approaches 1, the more accurately the regression model aligns. The determination coefficients of both models are above 0.95, indicating that more than 95% of the two research objectives are influenced by these three factors. Moreover, the difference between the adjusted determination coefficient R
2Adj and the predictive determination coefficient R
2Pre is less than 0.15 and 0.1, respectively (generally, a difference less than 0.2 indicates reasonableness), proving that the regression model has good predictability. The precision is as high as 15.1157 and 13.9559, respectively. Typically, a value exceeding 4 signifies that the regression model’s precision fulfills the criteria. Nevertheless, the regression models for these two objectives exhibit a precision exceeding 13, which suggests that the model not only possesses strong predictive power but also delivers predictions with a highly satisfactory level of accuracy.
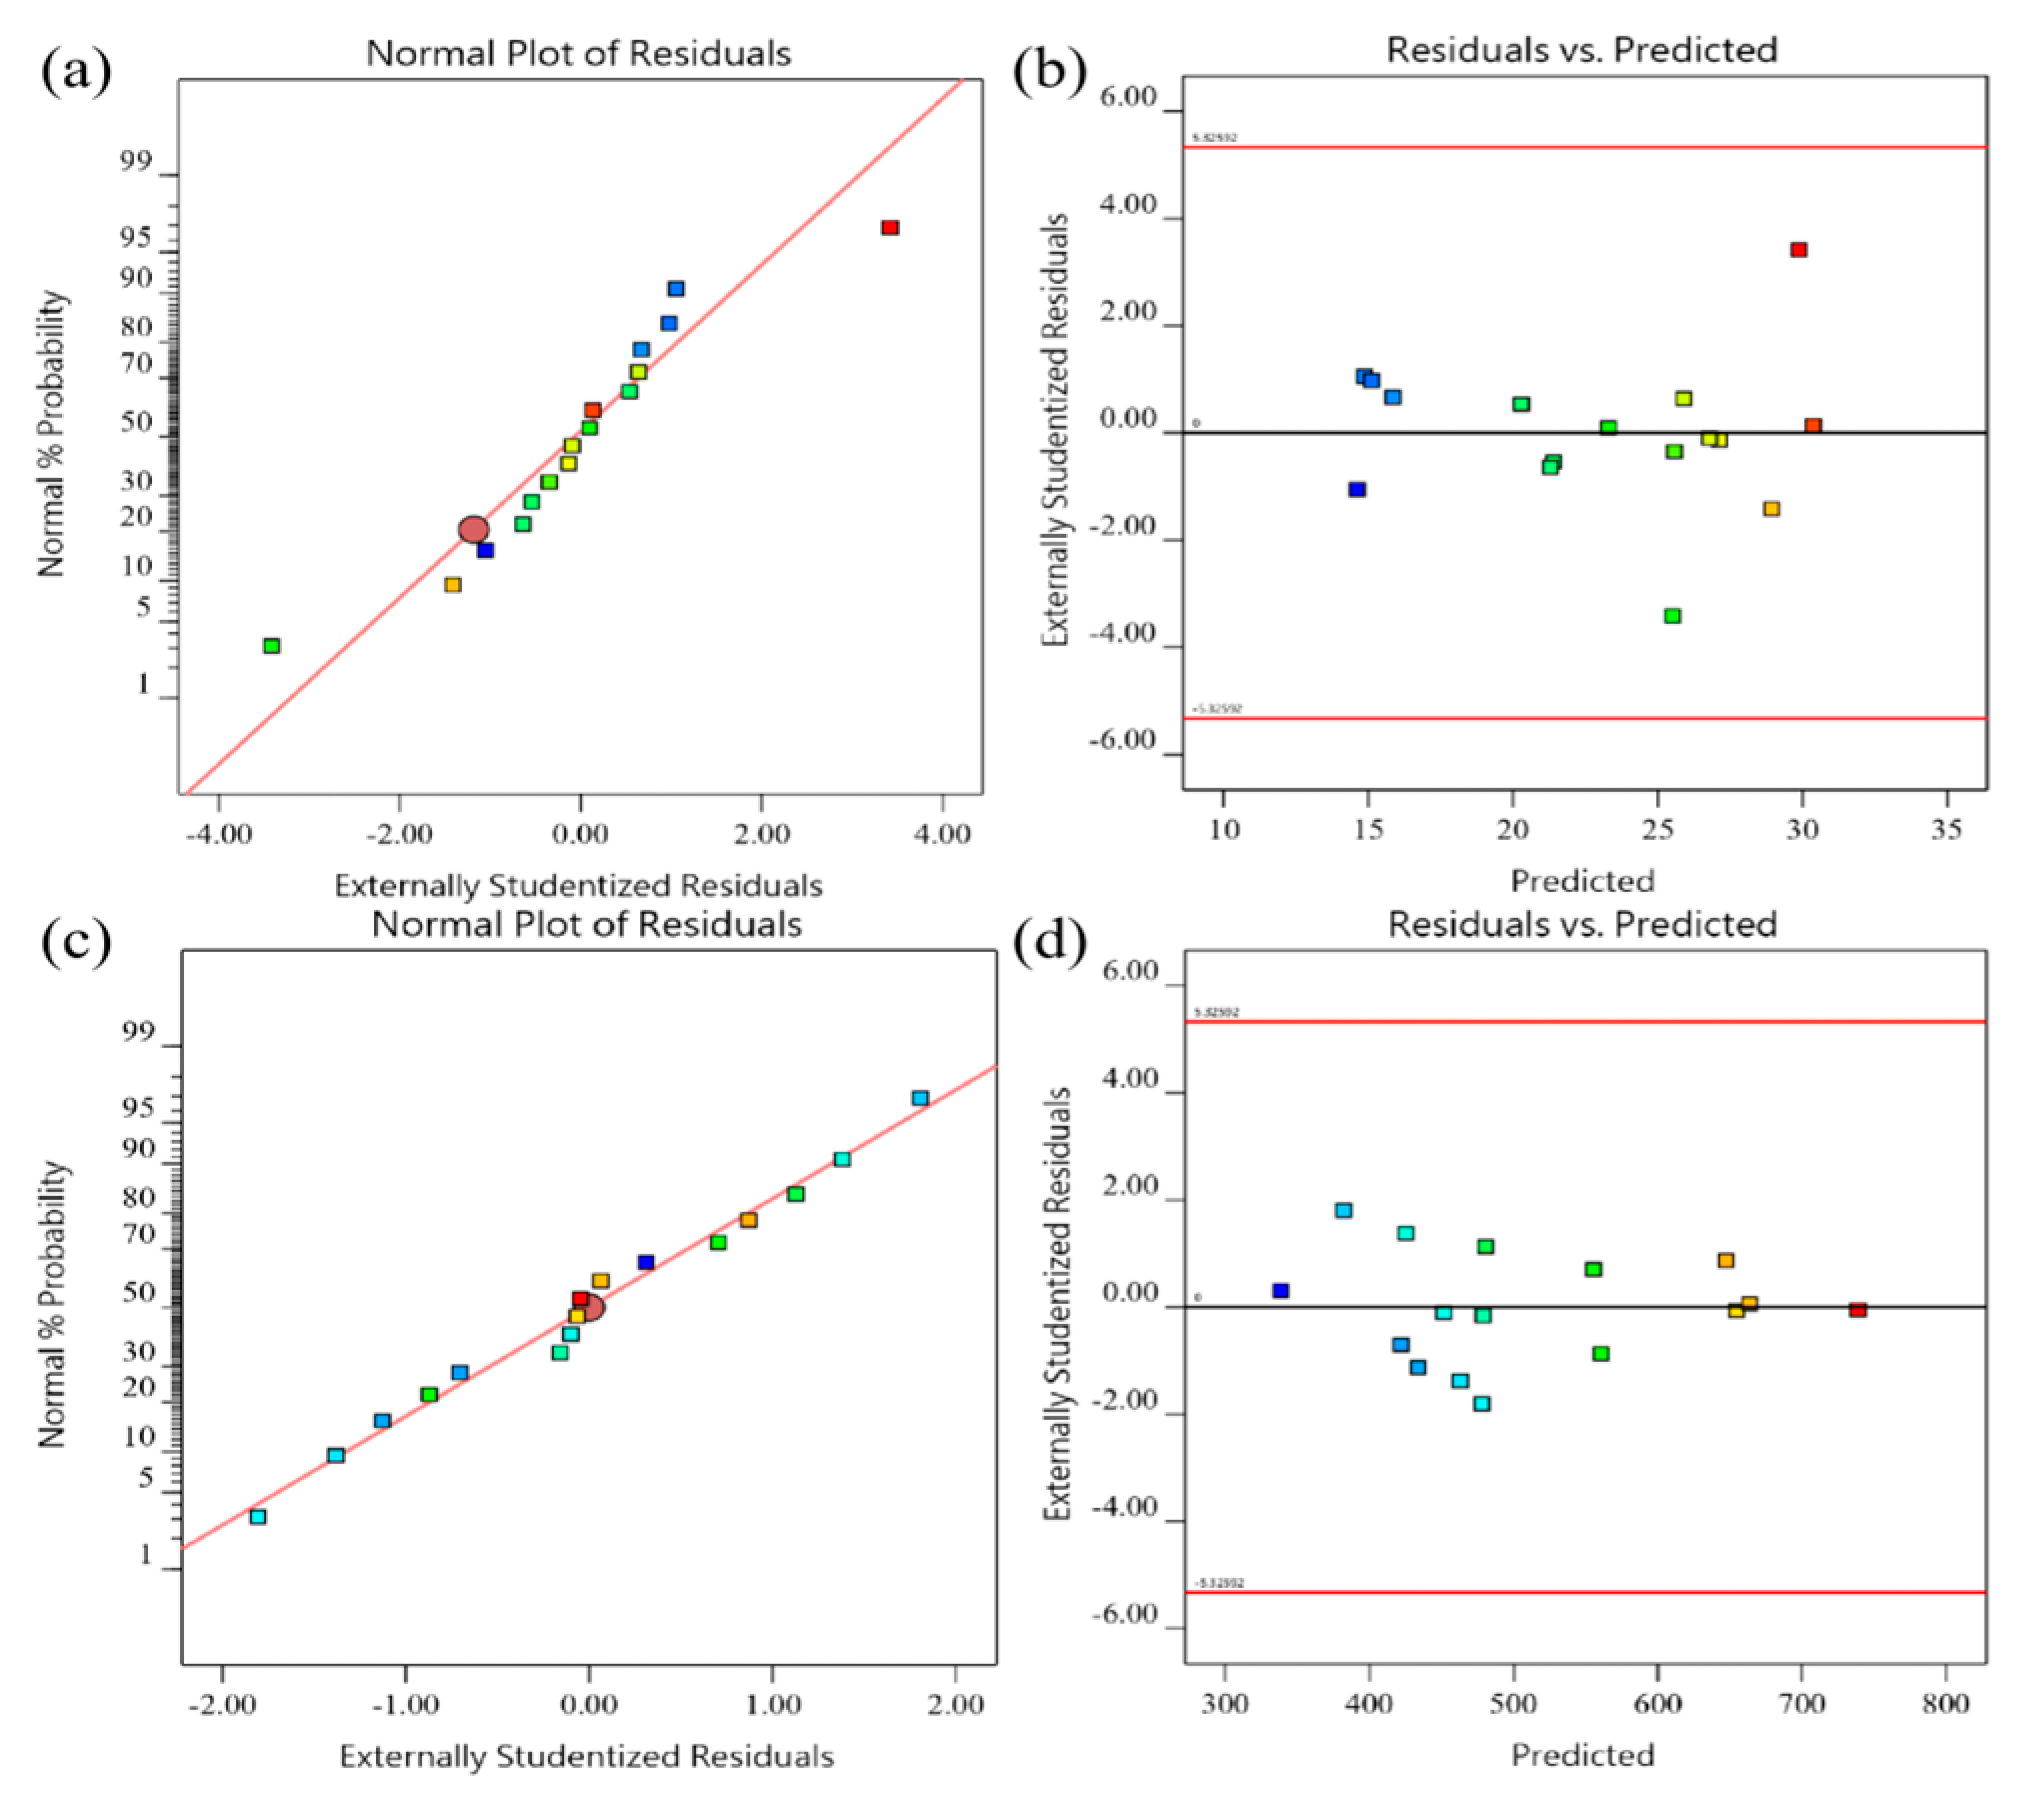
Figure 12 shows the results of the diagnostic analysis function using the software.
Figure 12a,c displays the residuals’ normal probability plots; the closer the plotted points align with the straight line, the more favorable the result. It is evident that most of the scattered points in the graph are almost on the straight line, and overall, they are highly attached to both sides of the line, indicating that the regression model has small residuals and good precision overall.
Figure 12b,d shows the relationship between predicted values and residuals; the more scattered and disordered the points are, the better. Clearly, the scattered points of the predicted values in the graph are disorderedly distributed and are also relatively scattered.
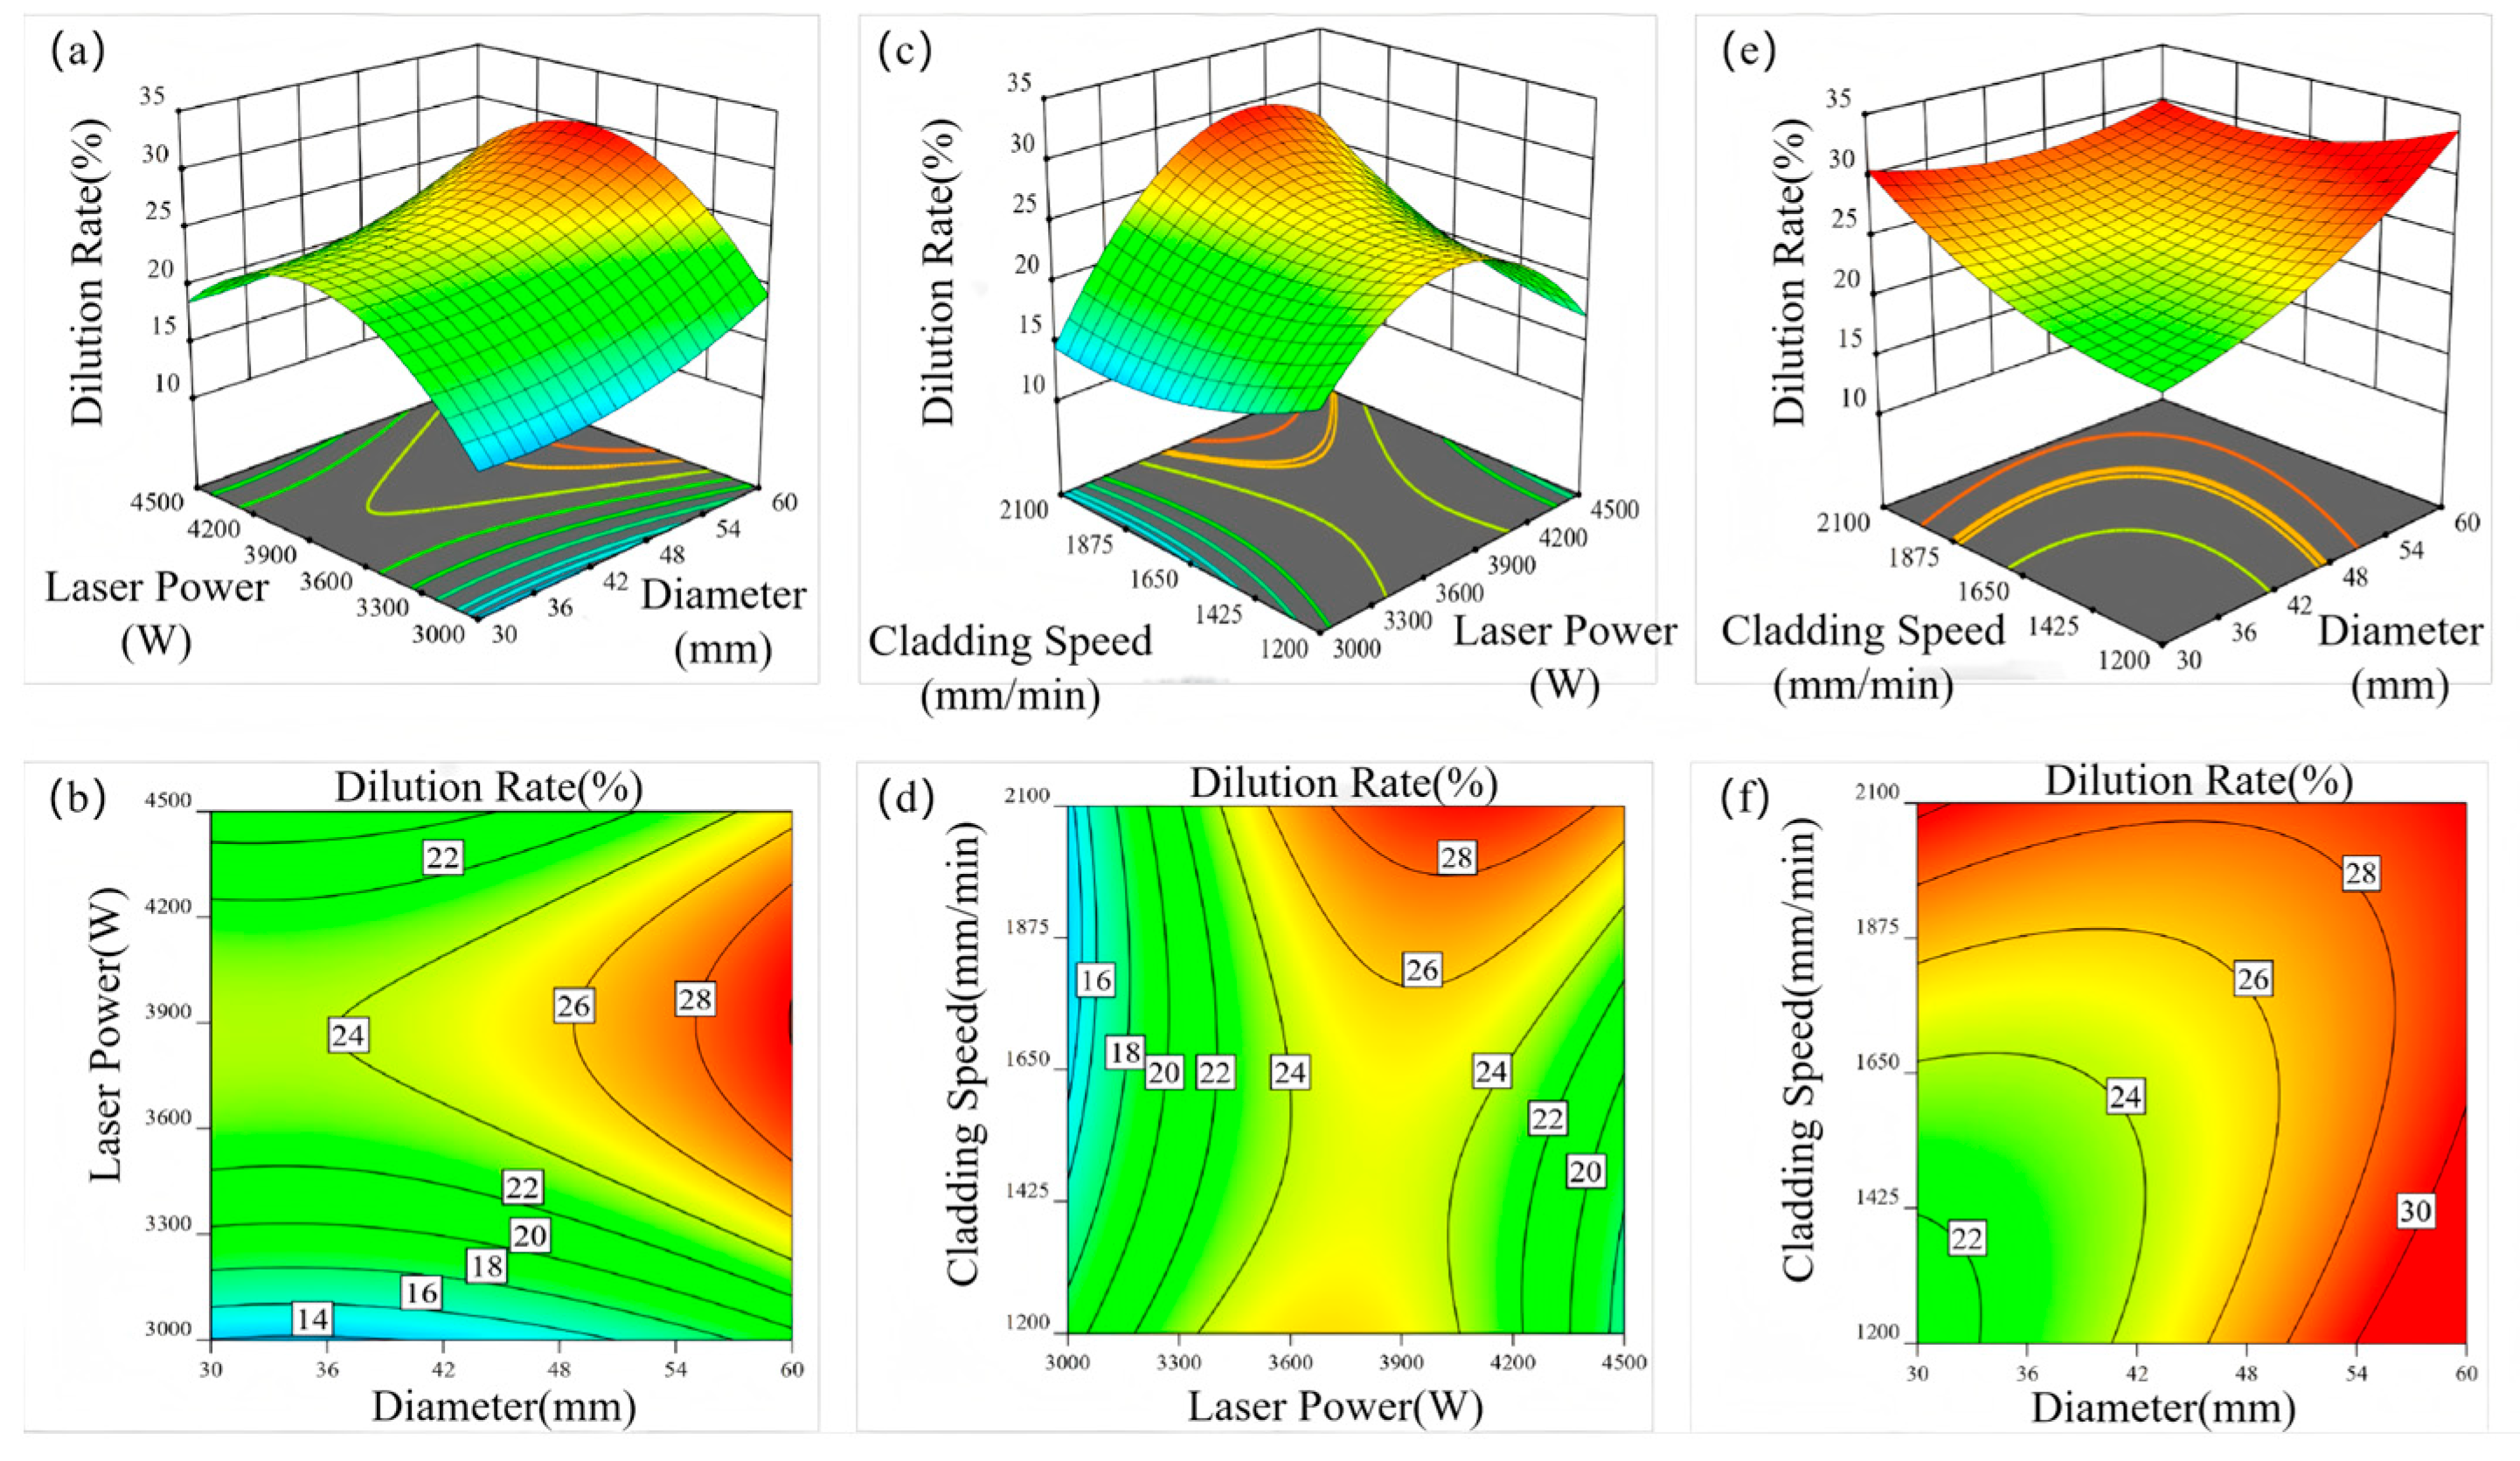
Figure 13 shows the interactions among the three factors that affect the dilution rate: diameter, laser power, and cladding speed.
Figure 13a,b shows that the diameter and laser power have opposite trends in their effects on dilution. Under this interaction, the dilution rate always increases first and then decreases with increasing laser power. However, the monotonicity of the dilution rate under the influence of diameter is not always consistent and depends on the specific value of laser power. When the laser power is within the range of 3000–4200 W, the dilution rate is essentially monotonically increasing with increasing diameter, and the curvature of the curve gradually increases with increasing power within this power range. However, when the laser power exceeds 4200 W, the dilution rate begins to decrease monotonically with increasing diameter. According to the contour map, the dilution rate decreases from above 24% to below 22% within this power range.
The interaction between diameter and cladding speed is summarized in
Figure 13c,d. The surface features are distinct. The dilution rate is lowest when both diameter and cladding speed are at their minimum levels, at which point it is below 22%. From the contour map, it can be seen that starting from the origin of a diameter of 30 mm and a cladding speed of 1200 mm/min, the dilution rate increases gradually in all directions. The dilution rate rises most quickly along the diameter axis and can reach the highest value. When the diameter reaches 60 mm, the dilution rate can exceed 30%. Therefore, it can be concluded that when both diameter and cladding speed are at relatively low levels, it is not conducive to dilution. Thus, in future experiments, to achieve a higher dilution rate, it is advisable to avoid values for both factors that are at low levels or near-low levels.
The interaction surface between laser power and cladding speed has a similar shape to that in
Figure 13a, so their interaction effect on the dilution rate is also similar to the first interaction, and the relationship between laser power and dilution rate remains unchanged. Therefore, the trend and pattern of how the dilution rate is affected by cladding speed are the same as those affected by diameter and thus will not be discussed again here.
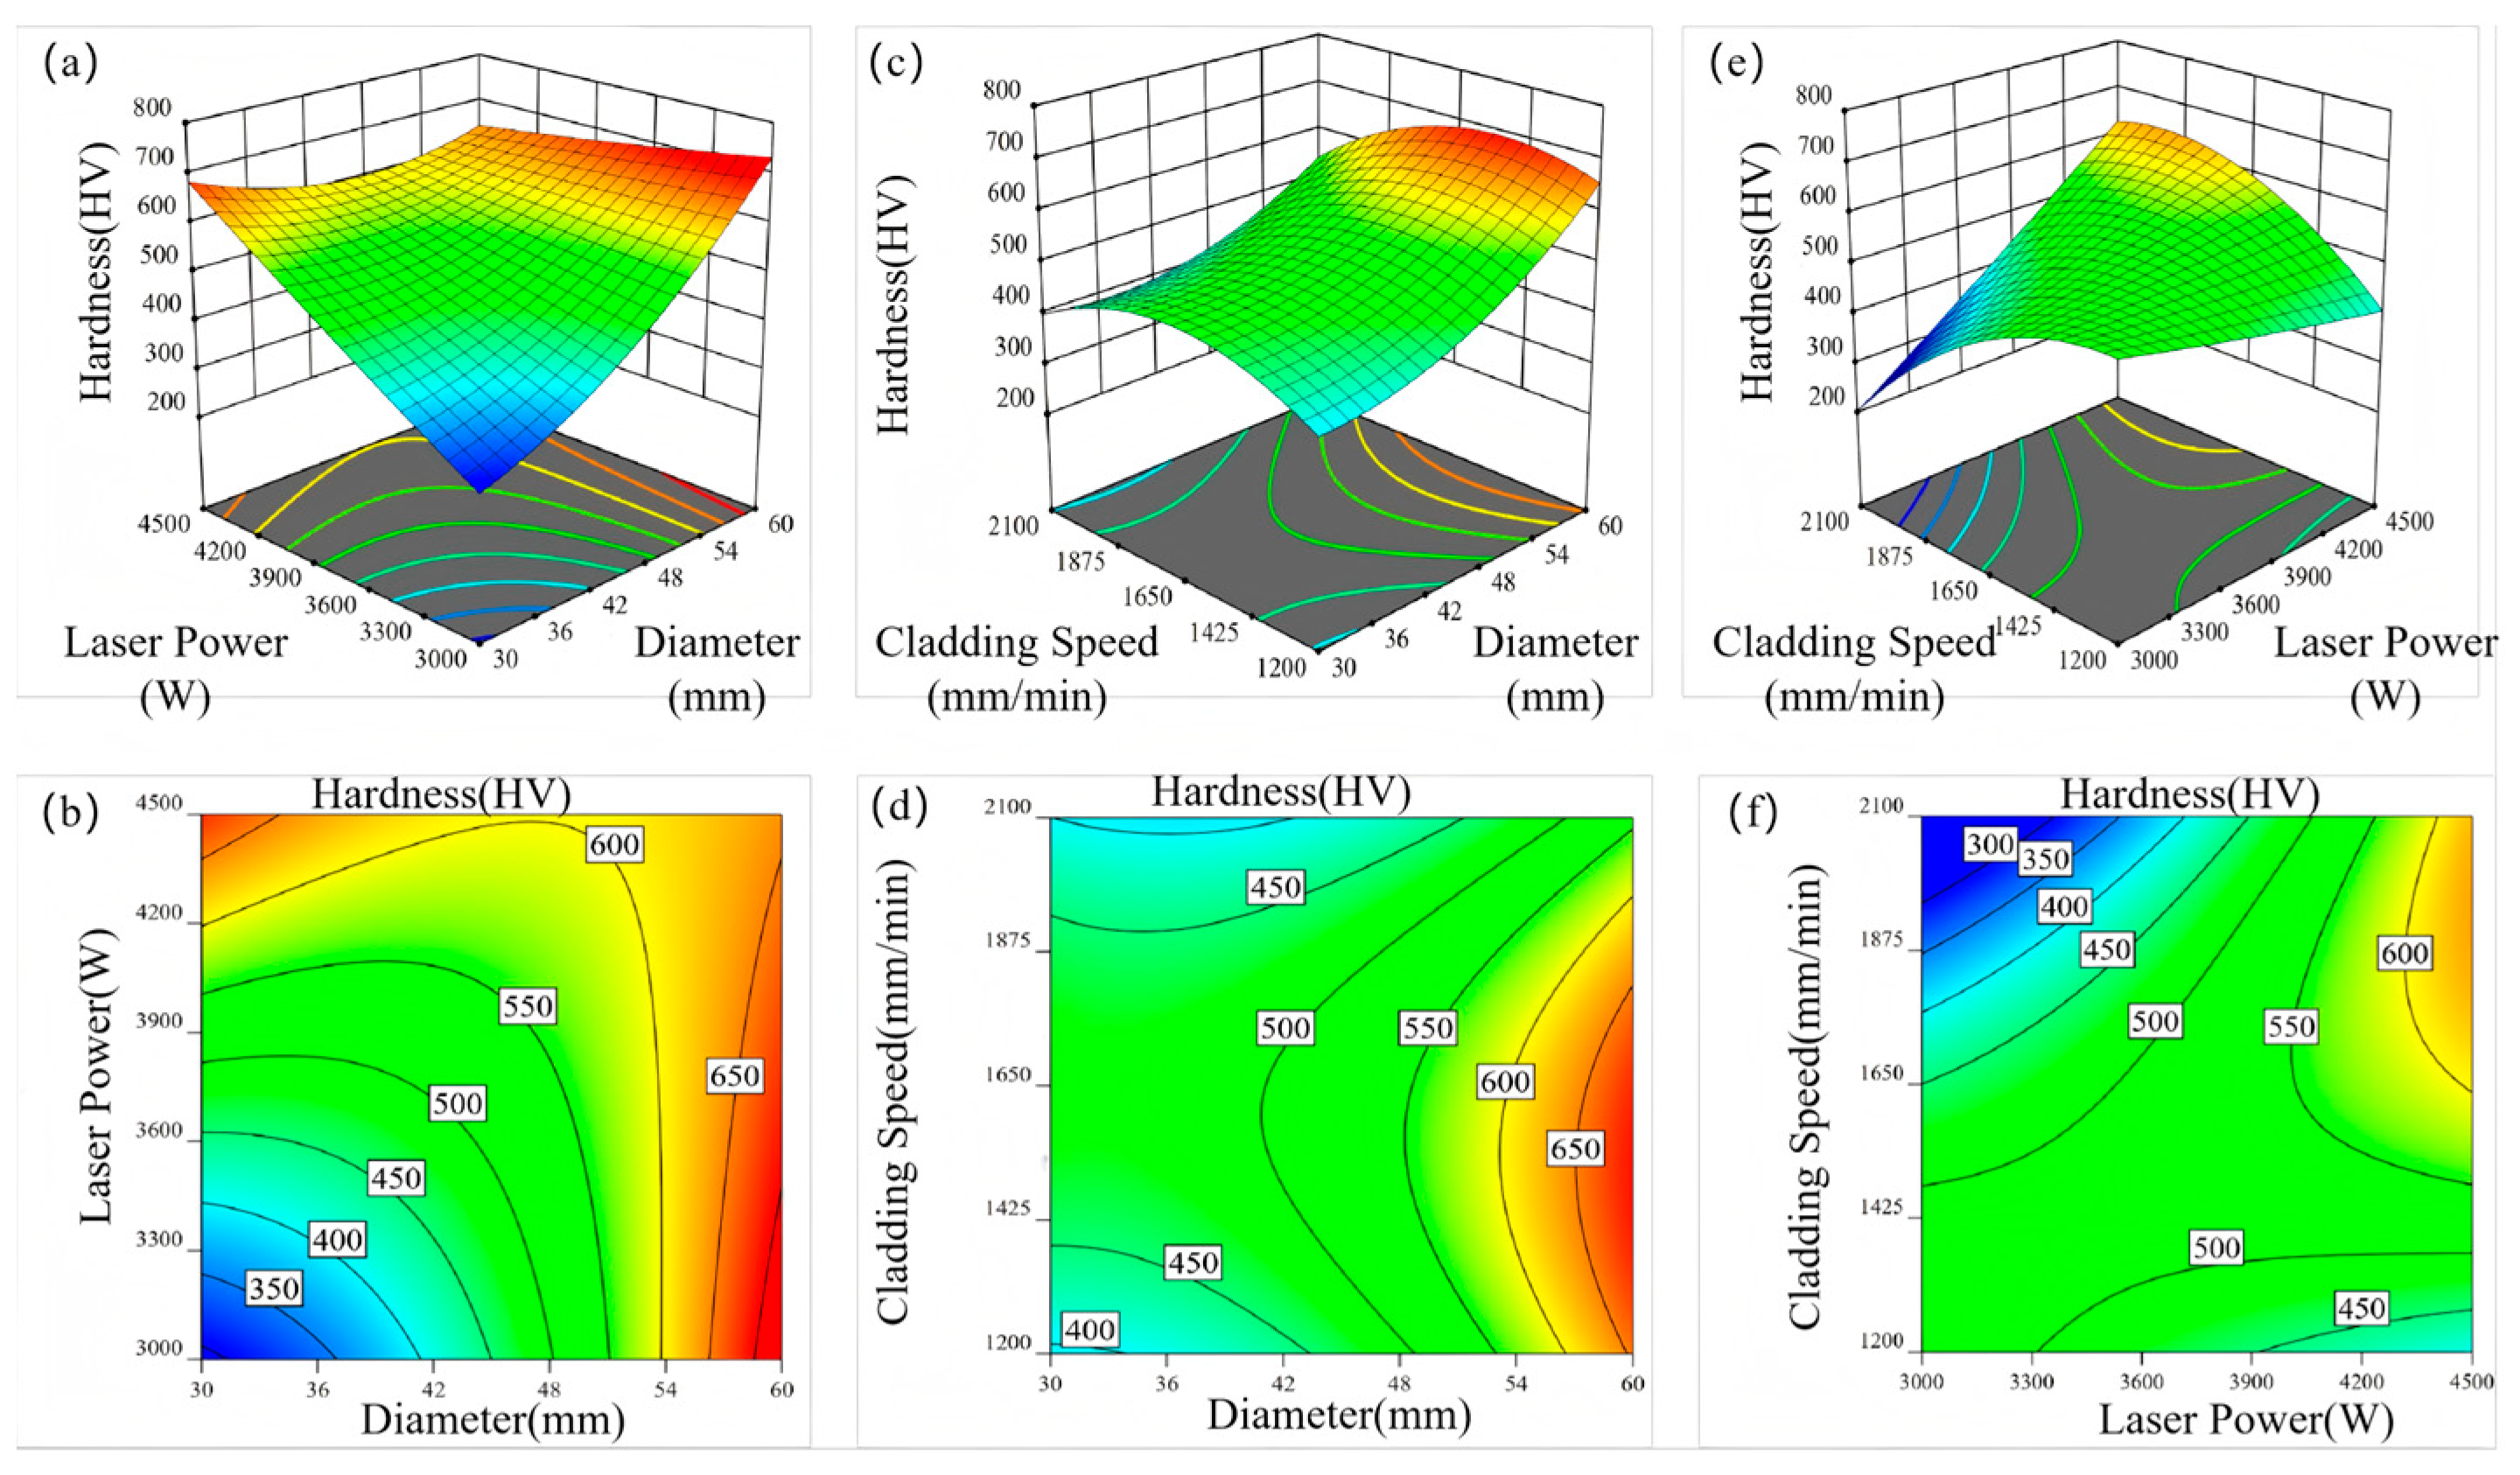
Figure 14 indicates the interaction surface with hardness as the research target. It can be clearly seen from
Figure 14a that the highest and lowest points of the surface are distinct. The hardness is lowest when both diameter and laser power are at their minimum levels, at which point it is less than 350 HV. However, the hardness can exceed 700 HV when the diameter reaches 60 mm and the laser power is not higher than 3600 W. A hardness range of 500–600 HV is considered ideal. According to the contour plot (b), an ideal hardness can be achieved when the diameter is between 48–54 mm across the entire range of laser power, or when the diameter is less than 48 mm and the laser power is between 3800 W and 4200 W. In terms of significance, the dilution rate increases monotonically with increasing diameter and laser power. However, there is a clear difference in the range of dilution rate changes within the entire range of the two factors. The range of hardness values within the levels of diameter and laser power is (300–650) and (300–750), respectively. Therefore, it can be concluded that diameter has a greater impact on hardness.
The interaction between diameter and cladding speed on hardness is summarized in
Figure 14c,d. The hardness values are low when the cladding speed is either very high or very low, below 400 HV. However, when the cladding speed is between 1425–1875 mm/min, a hardness value of 450–650 HV can always be obtained across the entire range of diameters, indicating that this cladding speed range is conducive to achieving better hardness. The hardness begins to exceed 600 HV when the diameter is greater than 57 mm. According to the contour plot, the diameter should be controlled between 42–57 mm to obtain an ideal hardness value.
The interaction surface (e) between laser power and cladding speed shows significantly lower hardness values compared to other interaction surfaces. The hardness can even drop below 300 HV when the laser power is 3000 W and the cladding speed is 2100 mm/min. Moreover, the hardness remains low within a certain range of this level combination. Therefore, in future experiments, the combination of the minimum level of laser power and the maximum level of cladding speed should be avoided to save experimental resources and human and time costs. Although the contour plot shows no clear pattern in the arrangement of contour lines, this interaction term is highly significant in the analysis of variance, and the model is significant with a considerable prediction accuracy.
3.7. Verification of Dilution Rate and Hardness Control Equations
To verify the prediction accuracy and extrapolation capability of the response surface models (Equations (12) and (13)), this study designed verification experiments based on extreme process parameters (diameter 55 mm, laser power 4800 W, cladding speed 1100 mm/min,
Figure 15), which exceeded the boundary conditions of original experimental range (diameter 30–60 mm, power 3000–4500 W, speed 1200–2100 mm/min). The sample preparation used the same equipment, ensuring that the fluctuation rate of process parameters was below ±2% (power standard deviation ±72 W, speed standard deviation ±18 mm/min).
The geometric features of the cladding layer cross-section image (
Figure 16) were extracted using Photoshop software. The measured heights were h
1 = 297 ± 5 μm for the melting zone and h
2 = 585 ± 7 μm for the cladding layer. The calculated dilution rate was 33.6% ± 0.8% (Equation (2)). Vickers hardness testing (ISO 6507-1:2018) showed that the average hardness of the deposition layer was 672.5 ± 18.3 HV (C.V.% = 2.72), indicating good uniformity in the distribution of coating composition. Substituting the verification parameters into the control equations, the model predicted a dilution rate of 33.9% and hardness of 682 HV. The relative errors compared to the measured values were 0.89% and 1.41%, respectively, verifying the high reliability of the model under extrapolated parameter conditions.
The error analysis indicates that the prediction deviation mainly originates from the thermal diffusion time constant of the large-diameter substrate (55 mm), which is 23% higher than the maximum value in the original experiment (
, where
is material’s density,
CP is specific heat capacity,
D is diameter, and
k is thermal conductivity). The thermal accumulation effect causes the actual penetration depth of the molten zone to be 2.1% greater than the value predicted by the steady-state model. By reproducing the experimental conditions using Abaqus, as summarized in
Figure 16, the predicted dilution rate is 34.2% ± 1.1% (
t-test
p = 0.213), which forms a triangular validation with the geometric method and the response surface model, with a maximum discrepancy of 2.4% (F-test
p = 0.157). The response surface model predicts a dilution rate error of only 0.89% (measured 33.6% vs. predicted 33.9%), confirming that the coupling effect of thermal diffusion retardation and molten pool expansion still dominates the dilution rate surge mechanism under super-parameter conditions.
This verification experiment reveals that when the substrate diameter exceeds 50 mm, it is necessary to compensate for the thermal retardation effect through power-diameter coupling control to maintain the dilution rate below 25%. Model inversion indicates that within the range of a diameter of 55 mm and an energy density of 2.0–2.2 J/mm
2, the predicted hardness values (655–690 HV) have a deviation of less than 3% from the measured values, which is significantly better than the optimization efficiency of traditional trial-and-error methods (error > 10%). The study confirms that the response surface model still has engineering guidance value in the super-parameter range, and its prediction error boundary (<5%) meets the quality control requirements of ISO 21920-2:2021 [
37] for laser cladding processes, providing a theoretical basis for intelligent parameter decision-making under complex conditions.


 ,
, 


