Review

Pitfalls and Challenges in Specific Absorption Rate Evaluation for Functionalized and Coated Magnetic Nanoparticles Used in Magnetic Fluid Hyperthermia

National Institute of Materials Physics, 077125 Magurele, Ilfov, Romania
Coatings 2025, 15(3), 345; https://doi.org/10.3390/coatings15030345
Submission received: 27 January 2025 / Revised: 11 March 2025 / Accepted: 13 March 2025 / Published: 17 March 2025
(This article belongs to the Special Issue Advances of Nanoparticles and Thin Films)

Abstract

:
In recent decades, magnetic hyperthermia (MH) has gained considerable scientific interest in cancer treatment due to its ability to heat tumor tissues deeply localized inside the body. Functionalizing magnetic nanoparticles (MNPs) with vector molecules via specific organic molecules that coat the particle surface has enabled targeting particular tissues, thereby increasing the specificity of MH. MH relies on applying radiofrequency (RF) magnetic fields to a magnetic nanoparticle distribution injected in a tumor tissue. The RF field energy is converted into thermal energy through specific relaxation mechanisms and magnetic hysteresis-driven processes. This increases the tumor tissue temperature over the physiological threshold, triggering a series of cellular apoptosis processes. Additionally, the mechanical effects of low-frequency AC fields on anisotropic MNPs have been shown to be highly effective in disrupting the functional cellular components. From the macroscopic perspective, a crucial parameter measuring the efficiency of magnetic nanoparticle systems in MH is the specific absorption rate (SAR). This parameter is experimentally evaluated by different calorimetric and magnetic techniques and methodologies, which have specific drawbacks and may induce significant errors. From a microscopic perspective, MH relies on localized thermal and kinetic effects in the nanoparticle proximity environment. Studying MH at the cellular level has become a focused research topic in the last decade. In the context of these two perspectives, inevitable questions arise: could the thermal and kinetic effects exhibited at the cellular scale be linked by the macroscopic SAR parameter, or should we find new formulas for quantifying them? The present work offers a general perspective of MH, highlighting the experimental pitfalls encountered in SAR evaluation and motivating the necessity of standardizing the devices and protocols involved. It also discusses the challenges that arise in MH performance evaluation at the cellular level.

1. Magnetic Hyperthermia as a Hope in Cancer Therapy

1.1. Introduction

Magnetic hyperthermia (MH) has emerged as a new approach to cancer therapy, raising hopes of finding an effective solution to this disease, which has spread rapidly throughout the world in the last century. On a microscopic level, cancer is induced by changes at the DNA level [1,2]. As a result, the regulatory processes that control cell growth and proliferation in different tissues are altered. DNA is a very complex and dynamic information system that maintains the proper functioning of living beings in the finest detail. It has self-error cleaning capabilities through specific repair mechanisms [3]. Damage to DNA information sequences caused by external factors can overcome these informational repair mechanisms, and a wave of errors can propagate through the system. This contributes to the birth of malignant cells in specific tissues [2,4]. One of the immune system’s roles is to recognize and neutralize these abnormal cells, but its ability can also be overwhelmed by the amplitude of the phenomenon’s occurrence. For this reason, cancer treatment is focused on two aspects: the genetic mechanisms that trigger the repair of DNA damage [5,6] and the destruction of cancer cells by cytostatic drugs or external factors such as heat. It is known that cancer cells are less resistant than healthy cells to a temperature increase above the physiological threshold [7]. Heat can be delivered to tumor tissue in various therapeutic approaches: ultrasonic ablation [8,9], laser ablation [10,11], or magnetic hyperthermia [12,13,14,15,16]. For the successful killing of all cancer cells in a tumor, homogeneous heat distribution and the optimal timing of the heating steps are essential [17]. If some parts of the diseased tissue remain alive, the process of cell proliferation will continue, and the tumor will grow again.

1.2. MH Application

MH is based on injecting a precise, dosed volume of physiological liquid containing well-dispersed MNPs. This may be performed directly into the diseased tissue or in the bloodstream if the nanoparticles are vectorized with specific molecules for tumor targeting. Concomitantly, an alternative magnetic field in the radiofrequency range is applied, and through intrinsic specific relaxation mechanisms or hysteresis loss, nanoparticles will dissipate heat in the surrounding biological environment. MH can be applied to various types of deep-seated tumors, thus gaining significant scientific interest. Magnetic hyperthermia can also be an adjuvant therapy along with other cancer treatment approaches, such as chemotherapy and radiotherapy [18,19]. Furthermore, MNPs may be used as nano-delivery platforms for specific drug molecules (cytostatic), allowing for the integration of the cytotoxic effects with those of hyperthermia [20,21,22]. Drug molecules used in cancer therapy cannot be directly chemically attached to the nanoparticle, and an organic layer with high affinity for specific ligands and drug molecules should cover the nanoparticle surface [23].
A key requirement for materials used in cancer treatment is biocompatibility. All final material products (nanoparticles, coating layer, and functional molecules) must be compatible with the human body. A wide class of biocompatible organic molecules (chitosan, dextran, different lipids and fatty acids, polyacrylic acids, polydopamine, starch, etc.) has been developed [24,25] providing chemical support for drug or marker molecules. In addition to the biocompatibility condition, magnetic hyperthermia must be applied with some limitations given by the negative effects of alternating magnetic fields in the human body. Radiofrequency magnetic fields induce electric currents in biological tissues, which may increase the local temperature. Brezovich, in 1998, established a criterion for the permissible limits of the direct application of AC magnetic fields to the human body: the product between frequency and intensity of the applied field ( f · H ) should not exceed the value of 4.85 × 10 8   A m 1 s 1 [26]. Furthermore, more permissive limits have been elaborated: f · H = 5 × 10 9 [27] and f · H = 9 × 10 9   A m 1 s 1 [28]. A recent work [29] recommended changing the Brezovich criterion with the S A R m a x   [ W g 1 ] parameter, as the maximum power absorbed per unit mass of a specific tissue. Theoretical justification is given by the calculation of the eddy-current-induced power in a muscle tissue in cylindrically symmetric and homogenous magnetic field approximation: P v r = 1 2 σ π 2 μ 0 2 H 0 2 f 2 r 2 , where σ —electrical conductivity of the tissue; μ 0 —vacuum permeability; and r —cylinder radius. The calculus relied on the magnetic field parameters used in clinical experiments described in [29], where tolerable power values for different body parts where higher than those predicted by the Brezovich criterion. Accordingly, the P v r and S A R m a x = P v r / ρ m u s c l e ( ρ m u s c l e —muscle density) calculated values for torso, neck, and thigh were not as divergent as the product f · H 0 , which was three to five times higher for the thigh than for the torso. In this calculation, the radius of the torso is considered 14 cm and that of neck and thigh 7 cm.

1.3. Cellular MH

At the cellular level, MH triggers apoptotic effects by localized thermal transfer mechanisms between MNPs and cell components (membrane, extracellular matrix, cytoskeleton, cytoplasm, nucleus, etc.). It is known that some parts of the cell are more sensitive to heat than others (nucleus and mitochondria) [30]. Hence, MH effects may be very peculiar at this microscopic level. Heat transfer from a particle to the nucleus may induce cell death faster than if all cellular volume is heated over the physiological limit. Cellular MH is strongly influenced by MNP localization inside the cell or in the extracellular matrix.

1.3.1. Nanoparticle Uptake and Localization

Mammalian cells possess complex uptake mechanisms adequate for different particle sizes and morphology [31,32]. Relatively small particles (< 150   n m ) are internalized through a specific mechanism of clathrin-mediated endocytosis, while those 250   n m to 3   μ m in size are internalized through micropinocytosis and phagocytosis [33]. Different particle shapes make distinct angles between the cellular membrane and particles at cell adhesion sites, influencing their internalization [33]. It seems that particles with shape anisotropy are more easily internalized by cells than spherical ones [34].
Magnetic hyperthermia experiments performed in vitro on DX3 human melanoma cells incubated with citric acid-coated iron oxide nanoparticles and exposed to a variable magnetic field of up to 16.1   k A / m in strength at 950   k H z for 2   h , showed high internal uptake of nanoparticles, as demonstrated by transmission electron microscopy (TEM) measurements [35]. Another work [36] studied magnetic hyperthermia in vitro in a glial microtumor phantom incubated with polyacrylic acid-coated and lauric acid-coated F e 3 O 4 nanoparticles. TEM studies showed the partial internalization of the nanoparticles into vesicles distributed in the cytoplasm and the formation of MNP clusters attached to the cell membrane. The effects of magnetic hyperthermia treatment, performed at a frequency of 560   k H z and a field strength of 24   k A m 1 , were compared with those induced in cells by conventional heating in a water bath. Both hyperthermia and the water bath-based classical method induced the apoptosis process as measured by viability tests, but in the case of magnetic hyperthermia, the local damage at the cellular level was more pronounced than in the classical case, possibly due to the mechanical vibration of the nanoparticles under AC magnetic field excitation.

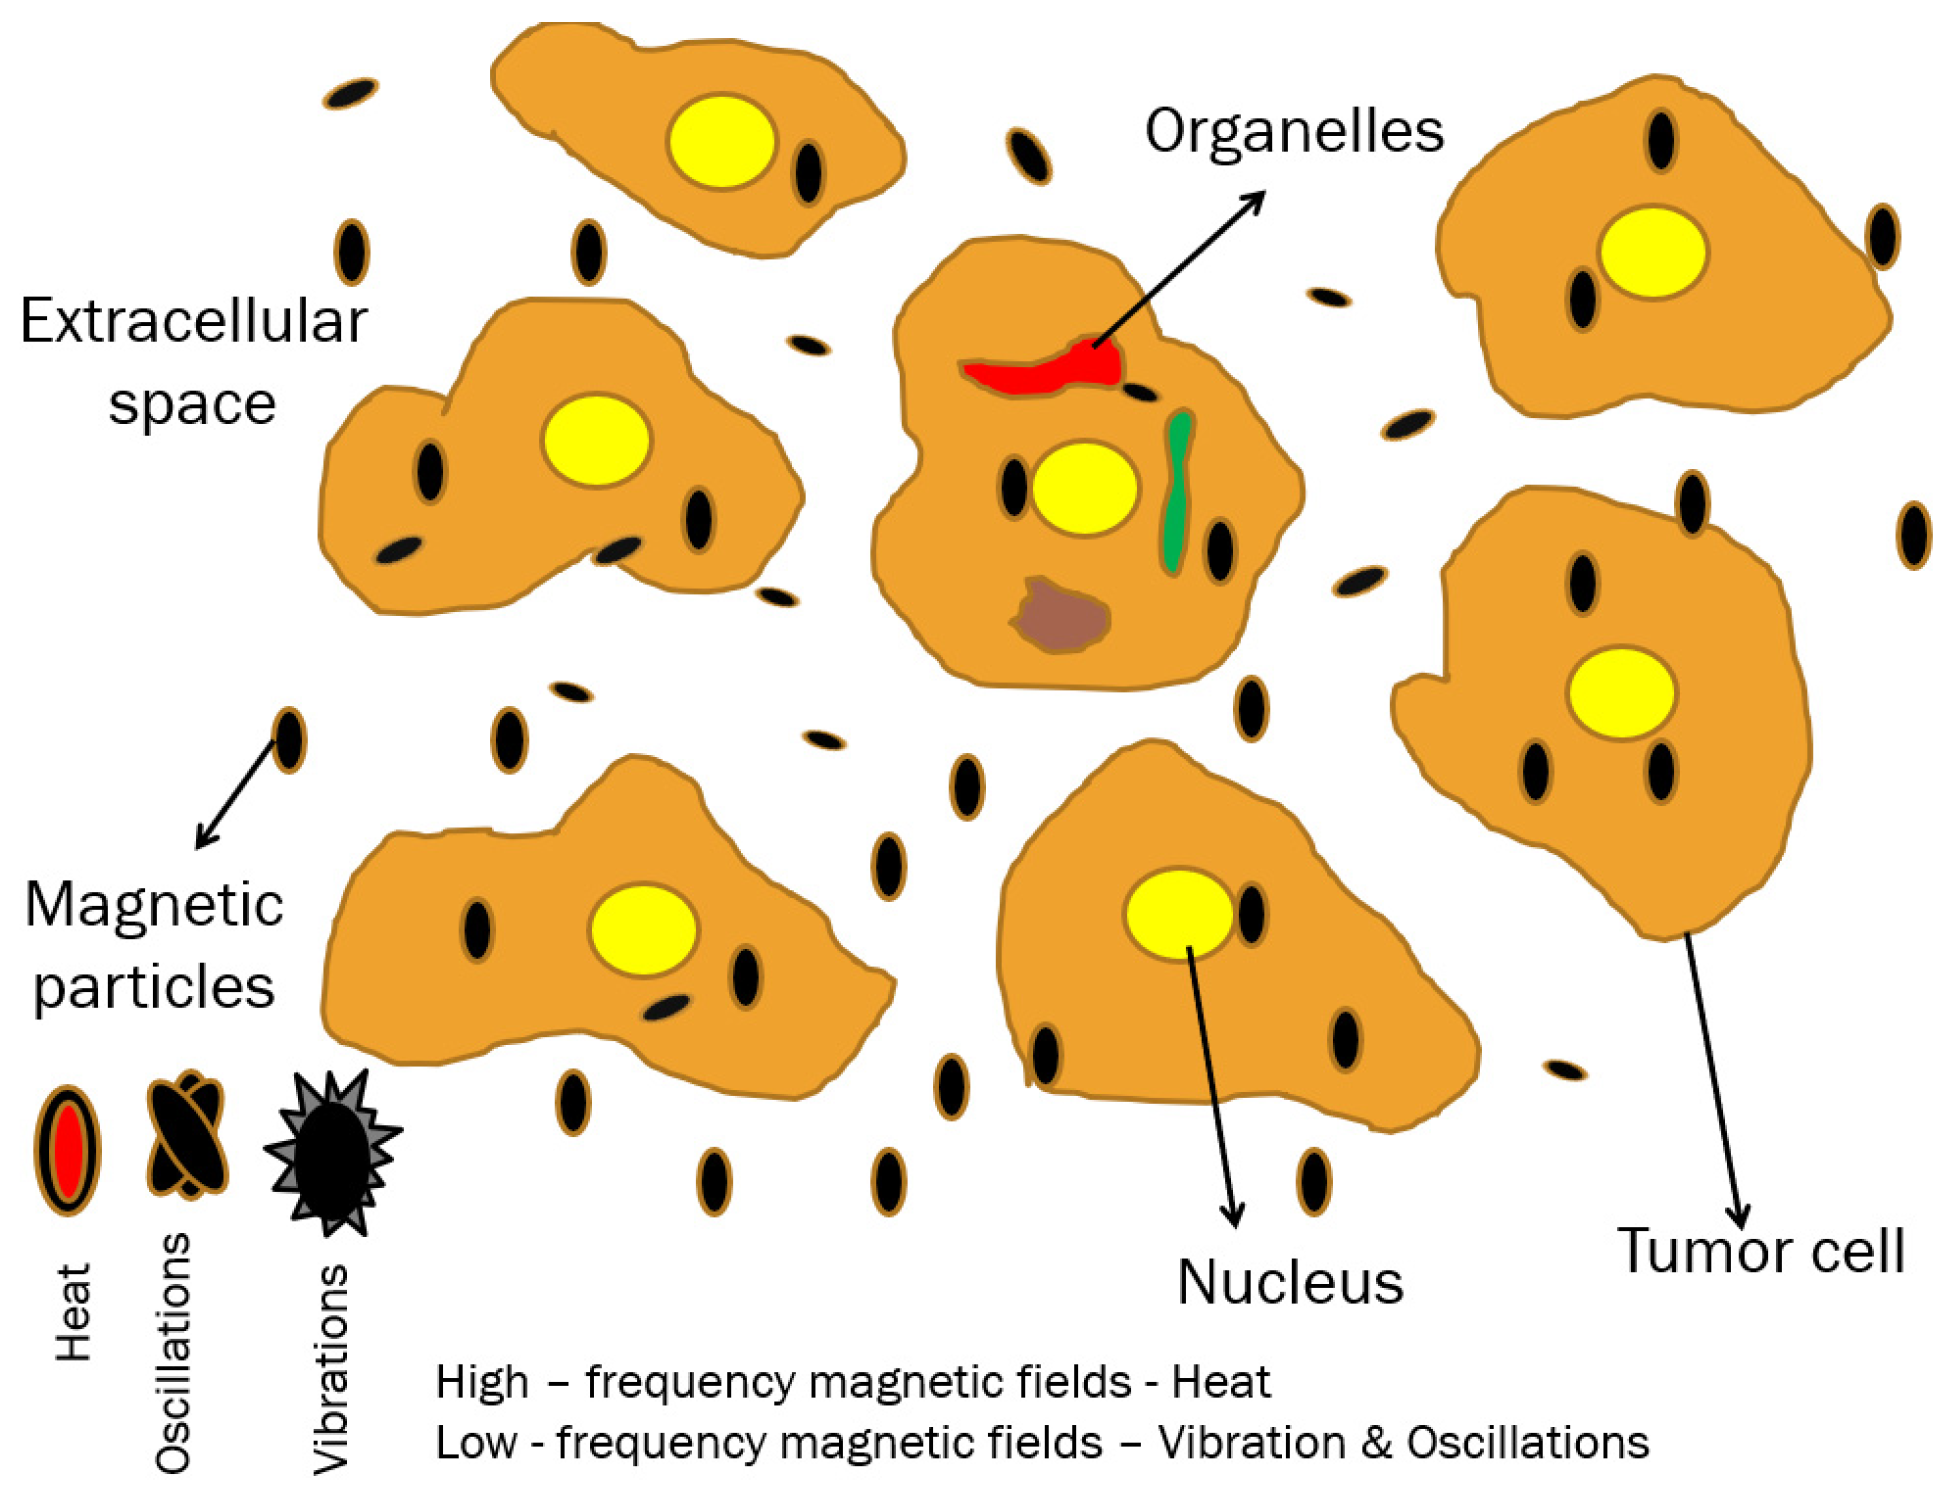
1.3.2. Extracellular/Intracellular Thermal and Mechanical MH Effects

Nanoparticles can be driven to specific locations within the cell, but they can also remain trapped in the extracellular matrix [37,38]. This led to the idea of investigating the local efficiency of MH in the intra- or extracellular space (Figure 1).
Comparative intracellular and extracellular MH experiments were performed on SK-Hep1 hepatocellular carcinoma cells incubated with polystyrene sulfonic acid-coated MNPs immediately after incubation and after 24   h . The MH results showed that nanoparticle localization in the extracellular matrix was more efficient than internalization in the cytoplasm [39]. In addition, other in vitro experiments have shown that the MH process is more effective at the extracellular level than at the intracellular level [40]. In contrast, in vivo experiments on tumors induced in mice showed that MH was more effective in the intracellular space than in the extracellular matrix, even when the temperature reached in the intracellular space was lower than outside the cell [41]. This was explained by the high temperature reached in the vicinity of the nanoparticles (several tens of degrees), which has a strong impact on the integrity of the organelle membranes by inducing local damage. Ratiometric luminescence thermometers based on Sm3+/Eu3+ were developed to detect local temperature increases on the surface of nanoheaters or in specific parts of the cell. Significant temperature differences were found between the nanoparticles and the cellular environment in their immediate vicinity. This suggests that some functional parts of the cell are more sensitive than others, requiring small amounts of heat to trigger the chain of apoptotic processes [30]. Other strategies have used MNPs as immobilizer nanoheaters attached to the cell membrane to induce physical damage (pores) capable of allowing for the passage of drug molecules into the cytoplasmic space [42].
Specific assembly behavior was observed in a cellular MH experiment [43] where nanoparticles were aligned in chains. Furthermore, mechanical effects induced by vibration or oscillation under an AC magnetic field were highlighted by microscopic examination of nuclear debris after MH. Similar works [44,45,46] showed that low-frequency AC and dynamic magnetic fields induce mechanical forces mediated by MNPs of specific shapes (disks of 60 nm in thickness and 1 μm in diameter) inside the cytoplasm, which act on the cell membrane, nuclei, or various organelles, leading to cell disruption. The vibration and oscillation effects of nanoparticles are usually exploited in MH under low-frequency fields, where highly anisotropic (rod-shaped) particles of appreciable size ( 200   n m in length) have been designed for operation in 35   k H z magnetic fields [47,48]. Nanoplates of 1   μ m in diameter have also attracted attention for use in very low and weak fields ( 20   H z and 30   m T ), showing lethal effects on cancer cells without significant heat release [49]. Dieny et al. [50] explained why superparamagnetic nanoparticles (SPM-NPs) cannot be used in this approach. SPM-NPs develop, under low AC fields, mechanical forces of the order of femtonewtons (fN), but those involved in biological processes vary between piconewtons (pN) and hundreds of piconewtons (pN). In in vitro experiments, U87 glioblastoma cells (brain cancer cells) were incubated with gold-coated N i 80 F e 20 microdisks of 1.3   µ m in diameter and 60   n m in thickness. After the U87 cells absorbed the nanodisks, a magnetic field of 400   m T with frequency ranges between 12 and 20   H z was applied for 30 45   m i n . About 80 % of the U87 cells were destroyed, and those who survived became nearly spherical, indicating that their cytoskeleton was damaged. Based on the same microdisks and cell type, in vivo experiments were performed without success, with the main cause being low diffusivity of the MNPs into the tumor. As was noted in [50], other in vivo experiments (on mice) using similar discoidal particles and types of cancer cells proved positive results.

1.4. MNP Synthesis

Few chemical methods allowing for the preparation of high-performance MNPs for MH exist. One is the thermal decomposition method, a particularly effective approach to synthesizing MNPs with high crystallinity, a narrow size distribution, and regular shapes. This method involves the thermal decomposition of organometallic precursors in organic solvents in an inert atmosphere [51]. It was proved that adding molecular oxygen enhances the magnetic properties of nanoparticles and improves the method’s reproducibility [51]. The influence of synthesis parameters on nanoparticle size can be found in [52]. There, it has been demonstrated that the heating rate plays a pivotal role in the synthesis of monodisperse spherical iron oxide nanoparticles. A lower heating rate was found to promote polydispersity and size increase, while higher rates resulted in a broad nanoparticle distribution. The annealing time, dependent on the temperature plateau, was found to be crucial to obtaining a monodisperse particle distribution. Co-doped Fe30O4/γ-Fe2O3 core-shell nanoparticles with high SAR values (up to ~ 9300   W g 1 for 14.6   n m particle size) were synthesized by thermal decomposition, proving the impact of inert flow gas on nanoparticle size and morphology [53]. However, the primary disadvantage of the thermal decomposition method is related to the milligram scale of nanoparticle production. In contrast, solvothermal synthesis represents a compelling alternative.
The solvothermal method involves heating a metallic salt solution in an appropriate solvent within a stainless-steel autoclave, along with nucleating agents and surfactants. Gavilan et al. [54] developed a scalable protocol for the preparation of high-crystallinity and monodisperse MNPs of various shapes (cubic, faceted, and spherical) at the gram scale by the optimization of the solvothermal method. The protocol utilizes alcohol as the solvent and employs shape-directing agents. The SAR values obtained, in their work, for 19   n m cubic MNPs exceeded 500   W g 1 , up to 10 -fold higher than that for similar-size MNPs synthesized by coprecipitation. In the alternative, if water is used as the solvent, the method is designated as hydrothermal.
Another highly used route is the microemulsion method, which relies on the coexistence of two immiscible liquid phases, water and oil. In this system, oil micelles form in water and act as chemical reactors. When a second emulsion or base is added, the precipitate forms, causing the micelles to collide, break apart, and consolidate, facilitating the growth of nanocrystals inside them. This method allows for the production of MNPs in the size range from 1 to 100   n m . By changing the oil phase, the reaction conditions and the type and amount of surfactant, different forms of MNPs can be obtained. An eco-friendly, oil-in-water microemulsion-based method was utilized to synthesize Z n 0.4 F e 2.6 O 4 @ S i O 2 biocompatible clusters, which showed high SAR values (up to 2600   W g 1 ) in vitro magnetic hyperthermia experiments [55].

1.5. Magnetic Nanoparticle and Necrotic Tissue Clearance

Eliminating MNPs from the body is a complex process that depends on the particle size. The elimination of particles larger than 200   n m is primarily performed through the reticuloendothelial system (RES), with the liver, spleen, and lungs being the primary organs involved [56]. Particles smaller than 10   n m are eliminated through renal clearance [57]. In the range of 10 40   n m , particles are transported by the blood circulation, cross the capillary walls, and are phagocytized by macrophages [58]. For sizes over 50   n m , particles may evade the reticuloendothelial system, resulting in a prolonged circulation period [58]. An in vivo study [59] involving the injection of citrate-coated manganese ferrite into mice proved that the presence of nanoparticles in organs over time lasted 60 days in the liver, 30 days in the spleen, and about 12   h in the heart, lungs, kidneys, and blood. With regard to the elimination of necrotic cells resulting in MH, the predominant mechanism is phagocytosis [60], responsible for engulfing particles measuring over 0.5   µ m (necrotic debris).

2. Physical Mechanisms Involved in Magnetic Hyperthermia
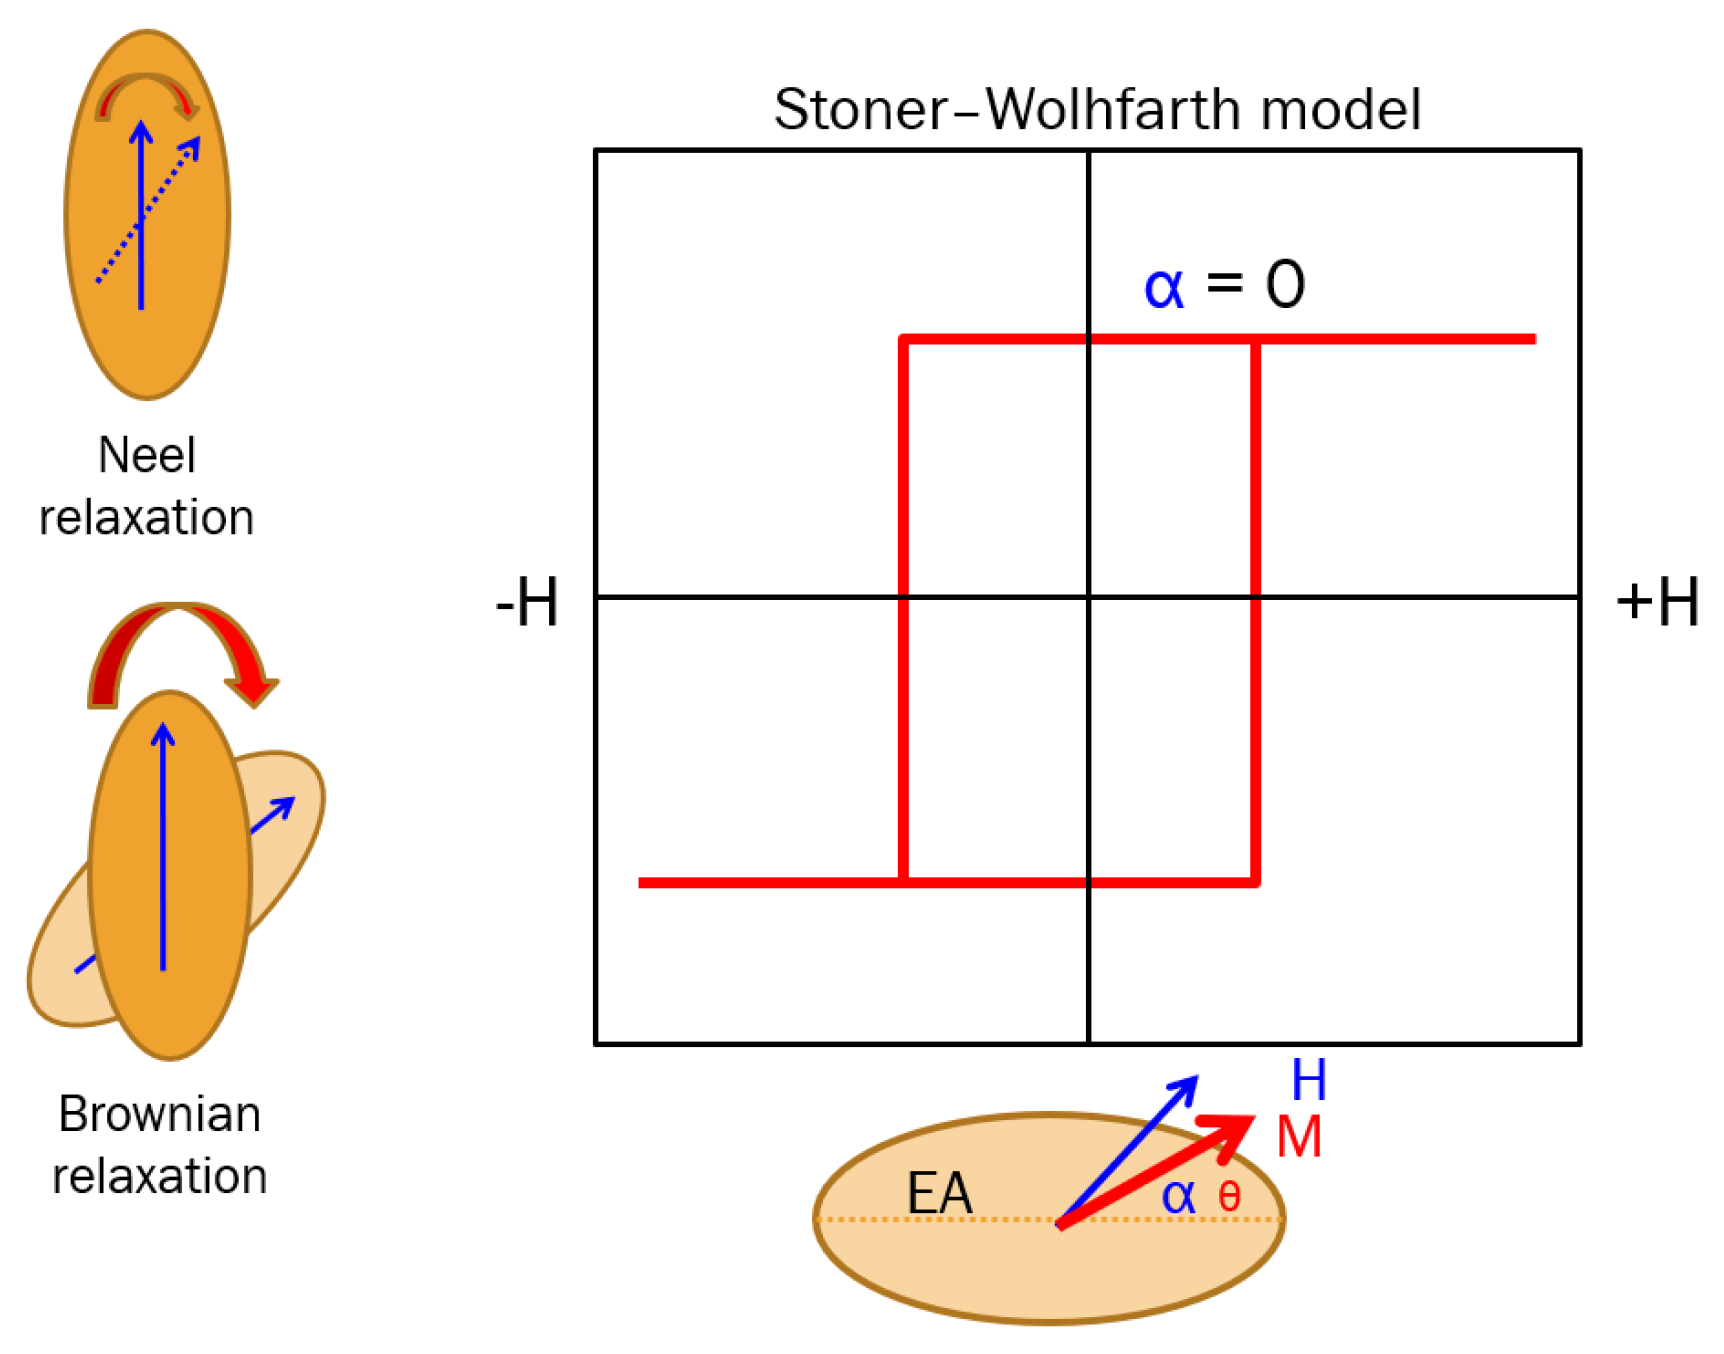
The principle behind magnetic hyperthermia is the generation of heat in nanoparticle systems, typically dispersed in fluid phases, under the influence of alternating magnetic excitation. This process depends on the magnetic mechanisms involved (hysteresis loss and superparamagnetic relaxation: Neel and Brownian relaxation) and the possible Joule effect in metallic nanoparticles due to the electrical currents induced by magnetic field oscillation.
Two categories of magnetic nanoparticles are distinguished: single-domain and multidomain nanoparticles. Bulk magnetic materials are divided into magnetic domains where magnetic spins are all oriented in a specific direction. The magnetic domains are separated by walls in which the spins gradually orient from one direction to another, corresponding to the two adjacent domains. At a specific size, a particle may experience a single magnetic domain where spins are all aligned in a particular direction, named the magnetic easy axis, defined by the magnetic anisotropy energy. Over a specific temperature (blocking temperature— T B ), spins may fluctuate coherently between the two directions of the easy axis—a phenomenon known as superparamagnetic behavior [61,62,63]. For magnetic single-domain nanoparticles subjected to AC fields, the mechanisms responsible for heat generation are hysteresis loss, described by the Stoner–Wohlfarth model, when the particles are in the magnetic frozen regime ( T < T B ), and superparamagnetic relaxation, described by the Rosensweig model ( T > T B ).
The Stoner–Wohlfarth model is a theoretical framework that elucidates the phenomenon of magnetization in single-domain nanoparticles. In this model, magnetic moments spontaneously align with preferential directions, characterized by effective anisotropy energy. The magnetic anisotropy energy can be defined as the energy required to rotate the magnetic moments from the easy axis (EA) direction to a direction that at 90° with respect to the EA, also named the hard magnetization direction.
The hysteresis loss mechanism in magnetic single-domain nanoparticles in the AC magnetic regime (Figure 2) occurs when the anisotropy energy, K V ( K —anisotropy constant; V —particle’s volume), is greater than the thermal energy, k B T ( k B —Boltzmann constant; T—temperature). This happens when the particles are in the frozen magnetic state with all spins aligned with the easy axis and do not rotate as a whole rigid body. This is the case of high-viscosity fluids or when the particle’s rotation is blocked by strong magnetic or physical interactions (e.g., dipolar interactions or organic molecules chain matrices). In the particular case of applied magnetic field aligned with the EA ( α = 0 ), the hysteresis loop is perfectly a square, and the coercive field is identical to the anisotropy field: H c = 2 K e f f / μ 0 M s (Figure 2).
In the case of multidomain nanoparticles, the mechanism of heat generation is given by the hysteresis loss, but in contrast with single-domain particles, the coercivity is lower; hence, heat production is not as efficient. Nevertheless, experimental research studies on multidomain nanoparticle performance in MH [64] have been reported.
The power dissipation in non-interacting SPM-NPs dispersed in a liquid phase and magnetically excited by RF magnetic fields is described by the Rosensweig model [65]:
P = μ 0 χ 0 π f H 0 2 · ω τ 1 + ω τ 2
where, μ 0 = 1.25 × 10 6   N A 2 —vacuum magnetic permeability; H 0 —field amplitude, χ 0 —equilibrium susceptibility; f and H 0 —magnetic field frequency and strength; and τ —the effective relaxation time integrating contributions from Neel and Brownian relaxation processes (Figure 2):
  • Neel relaxation when T > T B and magnetic moments fluctuate statistically and coherently around the nanoparticle’s easy axis between the two energy minima. Neel relaxation is defined by relaxation time: τ = τ 0 e x p ( K V / k B T ) , where τ 0 is a time constant, with τ 0 = 10 10   s . Neel relaxation phenomena take place in both dry and fluid-suspended SPM-NPs.
  • Brownian relation when the magnetic moments are strongly bound to the nanoparticle (the case of high values of K V ) and cannot be driven by the AC field. In this case, the particle rotates as a whole against the fluid viscosity resistance, being characterized by a relaxation time defined as τ B = 3 η V H / k B T , related to the fluid viscosity ( η ) and particle’s hydrodynamic volume.
Hence, an effective relaxation time can be defined as τ = τ B · τ N / ( τ B + τ N ) .
An additional mechanism that theoretically may contribute to heat generation in MH is given by the magnetic field oscillations within metallic nanoparticles that induce electrical currents. Therefore, the electrical resistive loss may increase the particle temperature. This phenomenon depends on the magnetic and electrical properties of the material and the applied magnetic field parameters. The maximum power dissipation of eddy currents in fine metallic particles happens when the particle size is of the order of skin depth inside the particle [66]. Skin depth is defined by the depth in the material where the field is attenuated by 1/e and is expressed by the relation [67] δ = 1 / π f μ σ , where f —the field frequency; μ —magnetic permeability; and σ —electrical conductivity. For instance, the skin depth at MH frequencies in magnetic materials (low electrical conductivity) are of the order of microns, which is far from the usual particle size used in MH [68]. This is why this heat mechanism is not considered in magnetic hyperthermia.

3. SAR Evaluation Methods in Magnetic Hyperthermia

3.1. Specific Absorption Rate (SAR) Bioheat Equation

Almost all the attention in the MH research field used to be focused on single-domain MNPs, mainly due to the heat efficiency of superparamagnetic relaxation phenomena. Even if MH may have highly specific localized effects, as experiments have proved, its standard approach works in the approximation of homogeneous heat distribution in the tumor tissue. In this way, a physical quantity, called specific absorption rate (SAR), was introduced to quantify the amount of power released by MH mechanisms in the tissue mass unit:
S A R = P a b s / m = [ W · g 1 ]
The SAR must have enough high values to compensate for the heat loss driven by the physiological thermoregulation processes, which try to reestablish the temperature at normal limits. MH may be numerically modeled in vivo by the so-called bioheat transfer equation (BHTE) [69]:
· k T + q p + q m W c b T T a = ρ c p T / t
where T ( ° C ) and T a ( ° C ) —the local temperature recorded inside the diseased tissue and the arterial temperature, respectively; c b ( J / k g / ° C ) and c p ( J / k g / ° C ) —specific heat of the blood and of the tumor, respectively; k ( w / m / ° C ) —thermal conductivity of the tumor tissue; and W ( k g / m 3 / s ) —the blood flow rate. The terms q p ( w / m 3 ) and q m ( w / m 3 ) quantify the power generated by the MH process and by the metabolism processes, respectively. MH can be optimized in relation with the q p parameter for biological accepted limits. The term q p is directly related to the SAR parameter by the relation
S A R = P a b s / m = c × T / t = q p / ρ
where ρ —the tumor tissue’s density; c —the specific heat of its density; and T / t —the temperature increase rate. Another formulation of the SAR can be related to the mass of magnetic material spread into the tumor volume and is known under the name of specific loss power (SLP) [70]:
S L P = P a b s / m N P = c · m / m N P × T / t
where m is the tissue mass and m N P is the mass of the MNPs contained by the investigated tissue.
The SAR factor can be evaluated in in vivo experiments (by monitoring the temperature increments by specific methods such as ultrasound echo measurement [71] or thermosensitive light emission effect [72]), in in vitro experiments, and directly in ferrofluid samples, where the temperature may be recorded with a simple optical fiber thermometer. Most SAR evaluation measurements are performed by calorimetry techniques in ferrofluid samples containing “fresh” synthesized nanoheater systems dispersed in liquids (water, physiological serum, or different oily phases). They are subjected to oscillating magnetic fields (usually in the radiofrequency range (RF) 50 1000   k H z ). As a standard method, the temperature increase in ferrofluid samples is measured with optical fiber thermometers (metallic sensors are not allowed in RF fields), but IR imaging is also used [73]. The ferrofluid samples are placed inside circular coils connected to RF generators, which may be commercial (most of them) or home-made. Depending on the coil geometry and setting of the inductor capacitors, the working frequency can be adjusted. The SAR evaluation methods relied on calorimetric measurements involving recording time–temperature heating curves during a temperature range that includes the physiological point. Considering that the heat dissipated in the MH process is strongly dependent on the field parameters ( f , H 0 ), a more specific loss power term, called intrinsic loss power (ILP), can be expressed independently of these parameters [74] as
I L P = S L P / f · H 2 [ H m 2 / k g ]
This is very useful in the evaluation of heat performance in the case of SMNPs where dissipated power depends on the square of field intensity according to the Rosensweig model. In the case of ferrofluids, SLP may be expressed as [75]
S L P = ( ρ F F / η × ρ N P ) × S A R
where η represents the ferrofluid volume fraction, and ρ F F and ρ N P are ferrofluid and nanoparticles densities.
Along with calorimetric methods, magnetic methods may also provide information about the heat efficiency of nanoparticles in MH application. The SAR may be seen as the product between the frequency of the applied magnetic field and the energy released in dispersion media during a field oscillation cycle. This energy can be evaluated through dynamical hysteresis measurements integrating the area of the magnetization loop over a complete field oscillation. Hence, the SAR may be written as [76]
S A R = f · A = f · H 0 + H 0 μ 0 M H d H
Another SAR evaluation magnetic method uses susceptibility measurements [77]. The volume of experimental SAR evaluation data has increased tremendously in the last decades, and a huge scientific effort has been made to evaluate the nanoparticle performance in MH. In the following, calorimetric and magnetic techniques and methodologies for evaluating the SAR parameter in magnetic fluid samples will be mentioned with a few concrete examples, highlighting their main advantages and disadvantages.

3.2. Calorimetric Methods in SAR Evaluation

3.2.1. General Aspects

As mentioned above, RF induction devices are commercially available, usually equipped with coils of different geometry parameters (diameter, length, and pitch). Depending on the coil geometry and capacitor configuration, these RF devices allow one to work with multiple frequencies and sample volumes and shapes. These coils are cooled with water or other special cooling liquids. Typical SAR measurements involve small volumes of ferrofluid enclosed in vials of a maximum of a few milliliters placed in the inner space of the RF coil. The oscillating magnetic field generated by the coil activates relaxation or hysteresis mechanisms in nanoparticles, leading to a temperature increase in the sample volume that is time-measured with an optical fiber thermometer. The shape of the heating curve acquired during an MH experiment is dictated by the competition between heating rates and loss rates (induced by thermal conduction, natural convection, and radiative processes).
Most of the experimental MH setups do not provide adiabatic conditions during the measurements, and this may induce imprecisions in SAR evaluation. Adiabatic environments around the ferrofluid samples are not trivial to build, particularly when the sample volume is very small ( 0.5 2   m L ). Even sample holder walls may store consistent amounts of heat generated during the MH experiment under non-adiabatic conditions. Another important issue in MH experiments is related to large temperature gradients, especially generated when the induction coils are cooled by water at low temperatures. In [78], numerical simulations performed with commercial software Comsol Multiphysics 5.2 demonstrated the influence of cooling water temperature and water flow on the temperature environment inside the coil. If cooling water is used under 15   ° C (usually from a standard tap), the water vapors from the surrounding air may reach the condensation temperature point (dew point) around the coil, and water drops on the coil surface may appear. In this case, the surrounding thermal transfer conditions are drastically changed. This can happen particularly in summer, when air humidity is high. For example, if the air temperature is 25   ° C and indoor humidity is about 45%, the dew point will be 13.8   ° C [79]. Technical solutions for improving the environmental thermodynamic parameters require enclosing the MH experimental setup in specially sealed walls where the inside air may be removed or dried before the experiments. However, even with these special experimental arrangements, in the case of using cooled water at low temperatures, high thermal gradients remain a major issue in evaluating the SAR, especially in the case of slow MH heat rates. Cooling the RF coils with water chillers at a precise temperature may solve the issue, but additional costs are involved. However, the cooling water temperature should be optimal, depending on the values of RF currents through the coil. Therefore, to avoid the heat thermal gradients around the sample, the cooling process should not allow the temperature to increase inside the coil metal. Numerical simulations found the optimal temperature for water cooling at 20   ° C for the solenoid coil and the field parameters involved [80]. The used optical fiber thermometers acquire data from a single point (most likely from the middle of the sample’s volume), even if the temperature at the sample extremities could be a few degrees lower. On the other hand, the coil geometry may induce inhomogeneities in the field distribution inside the sample, which, in turn, may induce heat nonuniformities. In this respect, RF coils with diameters fitting the sample’s geometry, optimal length, and small pitches between turns should be used to ensure relatively uniform field distributions within the sample. Numerical simulations regarding the influence of coil geometry on heating efficiency in MH in vivo experiments were reported in [81]. In the work, various types of coils (helical, Helmholtz, and pancake coils) and field parameters were simulated, showing variation in field homogeneity inside the simulated model. A solution for this issue may involve using a single RF coil for different ferrofluid samples placed in the same type of vials, which should be identically positioned related to the coil geometry. The optical fiber sensor should also be placed carefully in the same position inside the ferrofluid volume for all samples. Some of these technical considerations were investigated by Makridis et al. in an experimental protocol [82]. They performed a comprehensive investigation of the influence of various experimental factors (MNP type, ferrofluid concentration, magnetic field inhomogeneities, coil geometry, etc.) and evaluation methods on SAR values. In this work, 20   n m   F e 3 O 4 nanoparticles (SPM-NPs) and 40   n m   F e 3 O 4 nanoparticles (FM-NPs) were subjected to MH experiments using three different commercial RF devices in a 10 min heating and 10 min cooling protocol. For FM-MNPs, the influence of the sample volume on SLP was investigated by keeping the same concentration ( 1   m g   m L 1 ) but changing the volume from 0.5   m L   t o   2   m L . For 1 mL, SLP increased with the sample volume, and over this value, SLP stabilized at 400   W g 1 . Magnetic field homogeneity effect on SLP was investigated in the case of SPM-NPs using four coils of different geometries (No. of turns/diameter: 9 turns/ 50 mm; 9 turns/ 60 mm; 17 turns/ 50 mm; 17 turns/ 60 mm) for the same field parameters ( 10.4   k A 1 and 300   k H z ). SLP values ranged from 35   W g 1 to 41   W g 1 , indicating relative homogeneity in the coil central region ( 1   c m 2 ). The optical fiber position in the ferrofluid sample also influences the SLP values, as it was proved in the above work. Accordingly, the recorded temperature varied from the highest value recorded in the middle of the sample to the bottom of the sample by 5 % , to the sample surface by 7 % , to the left side of the sample by 5 % and to the right side of the sample by 2 % . The effects of the size and shape of the sample vessel on SLP were also investigated in four cases: three vessels made of glass (with the same specific capacity of 800   J   k g 1   K 1 and one vessel made from plastic with specific heat capacity of 1900   J   k g 1   K 1 ). All vessels had different shapes. The field parameters were 765   k H z and 20   k A m 1 . Each vessel had the sample ( 1   m L at 1   m g   m L 1 ) partially or fully contained in the coil inner space. The glass vessels had their sample’s volume of 63 % , 100 % , and 100 % contained inside the coil, and the plastic vessel had only 21 % the sample volume inside the coil. This was reflected in the low SLP value of around 40   W g 1 obtained for the sample contained by the plastic vessel compared with the glass vessels, where the SLP was found to be between 350 and around 500   W g 1 . In the case of those two ferrofluid samples contained by glass vessels fully inside the coil, the SLP values varied between 350 and 400   W g 1 . The maximum SLP of 500   W g 1 was recorded for the ferrofluid samples contained in a proportion of 63 % inside the coil. In this case, the vessel shape could be the cause.
These peculiar aspects commented here are not discussed in the MH literature enough, but they are experimental pitfalls, influencing the reported SAR results. Therefore, SAR evaluation by calorimetric techniques represents a challenge in these technical circumstances. Special experimental setups and innovative methodologies capable of mitigating their effects are required to allow comparable SAR results to be reported. Below are described different experimental approaches implemented in SAR evaluation to avoid or to compensate for heat loss.

3.2.2. Initial Slope (IS) Method (Sketched in Figure 3a)

The most used technique for trying to avoid the effects of heat loss is to record the temperature increase just for a small period of time at the beginning of the MH process with the assumption that the sample “does not have enough time” to lose heat in the surrounding environment. This technique analyzes only the initial part of the heating curve, which is properly fitted with the linear approach to extract the maximum heating slope. Hence, Equation (4) becomes
S A R = c × T / t t 0 = c × p i n i t i a l
The crucial condition involved here is related to the thermodynamic equilibrium between the sample and the external environment during the MH measurement. Multicore flower-like iron oxide MNPs of 23   n m and 56   n m coated with oleic acid subjected to 23.8   k A m 1 and 202   k H z MH experiments showed SAR values of 305 and 1540   W g 1 , respectively [83].
Figure 3. Sketches of the heating slope methods: (a) initial slope (IS) method; (b) Box–Lucas (BL) method; (c) temperature increase slope (TIS) method; (d) thermographic (TE) method.
Coatings 15 00345 g003

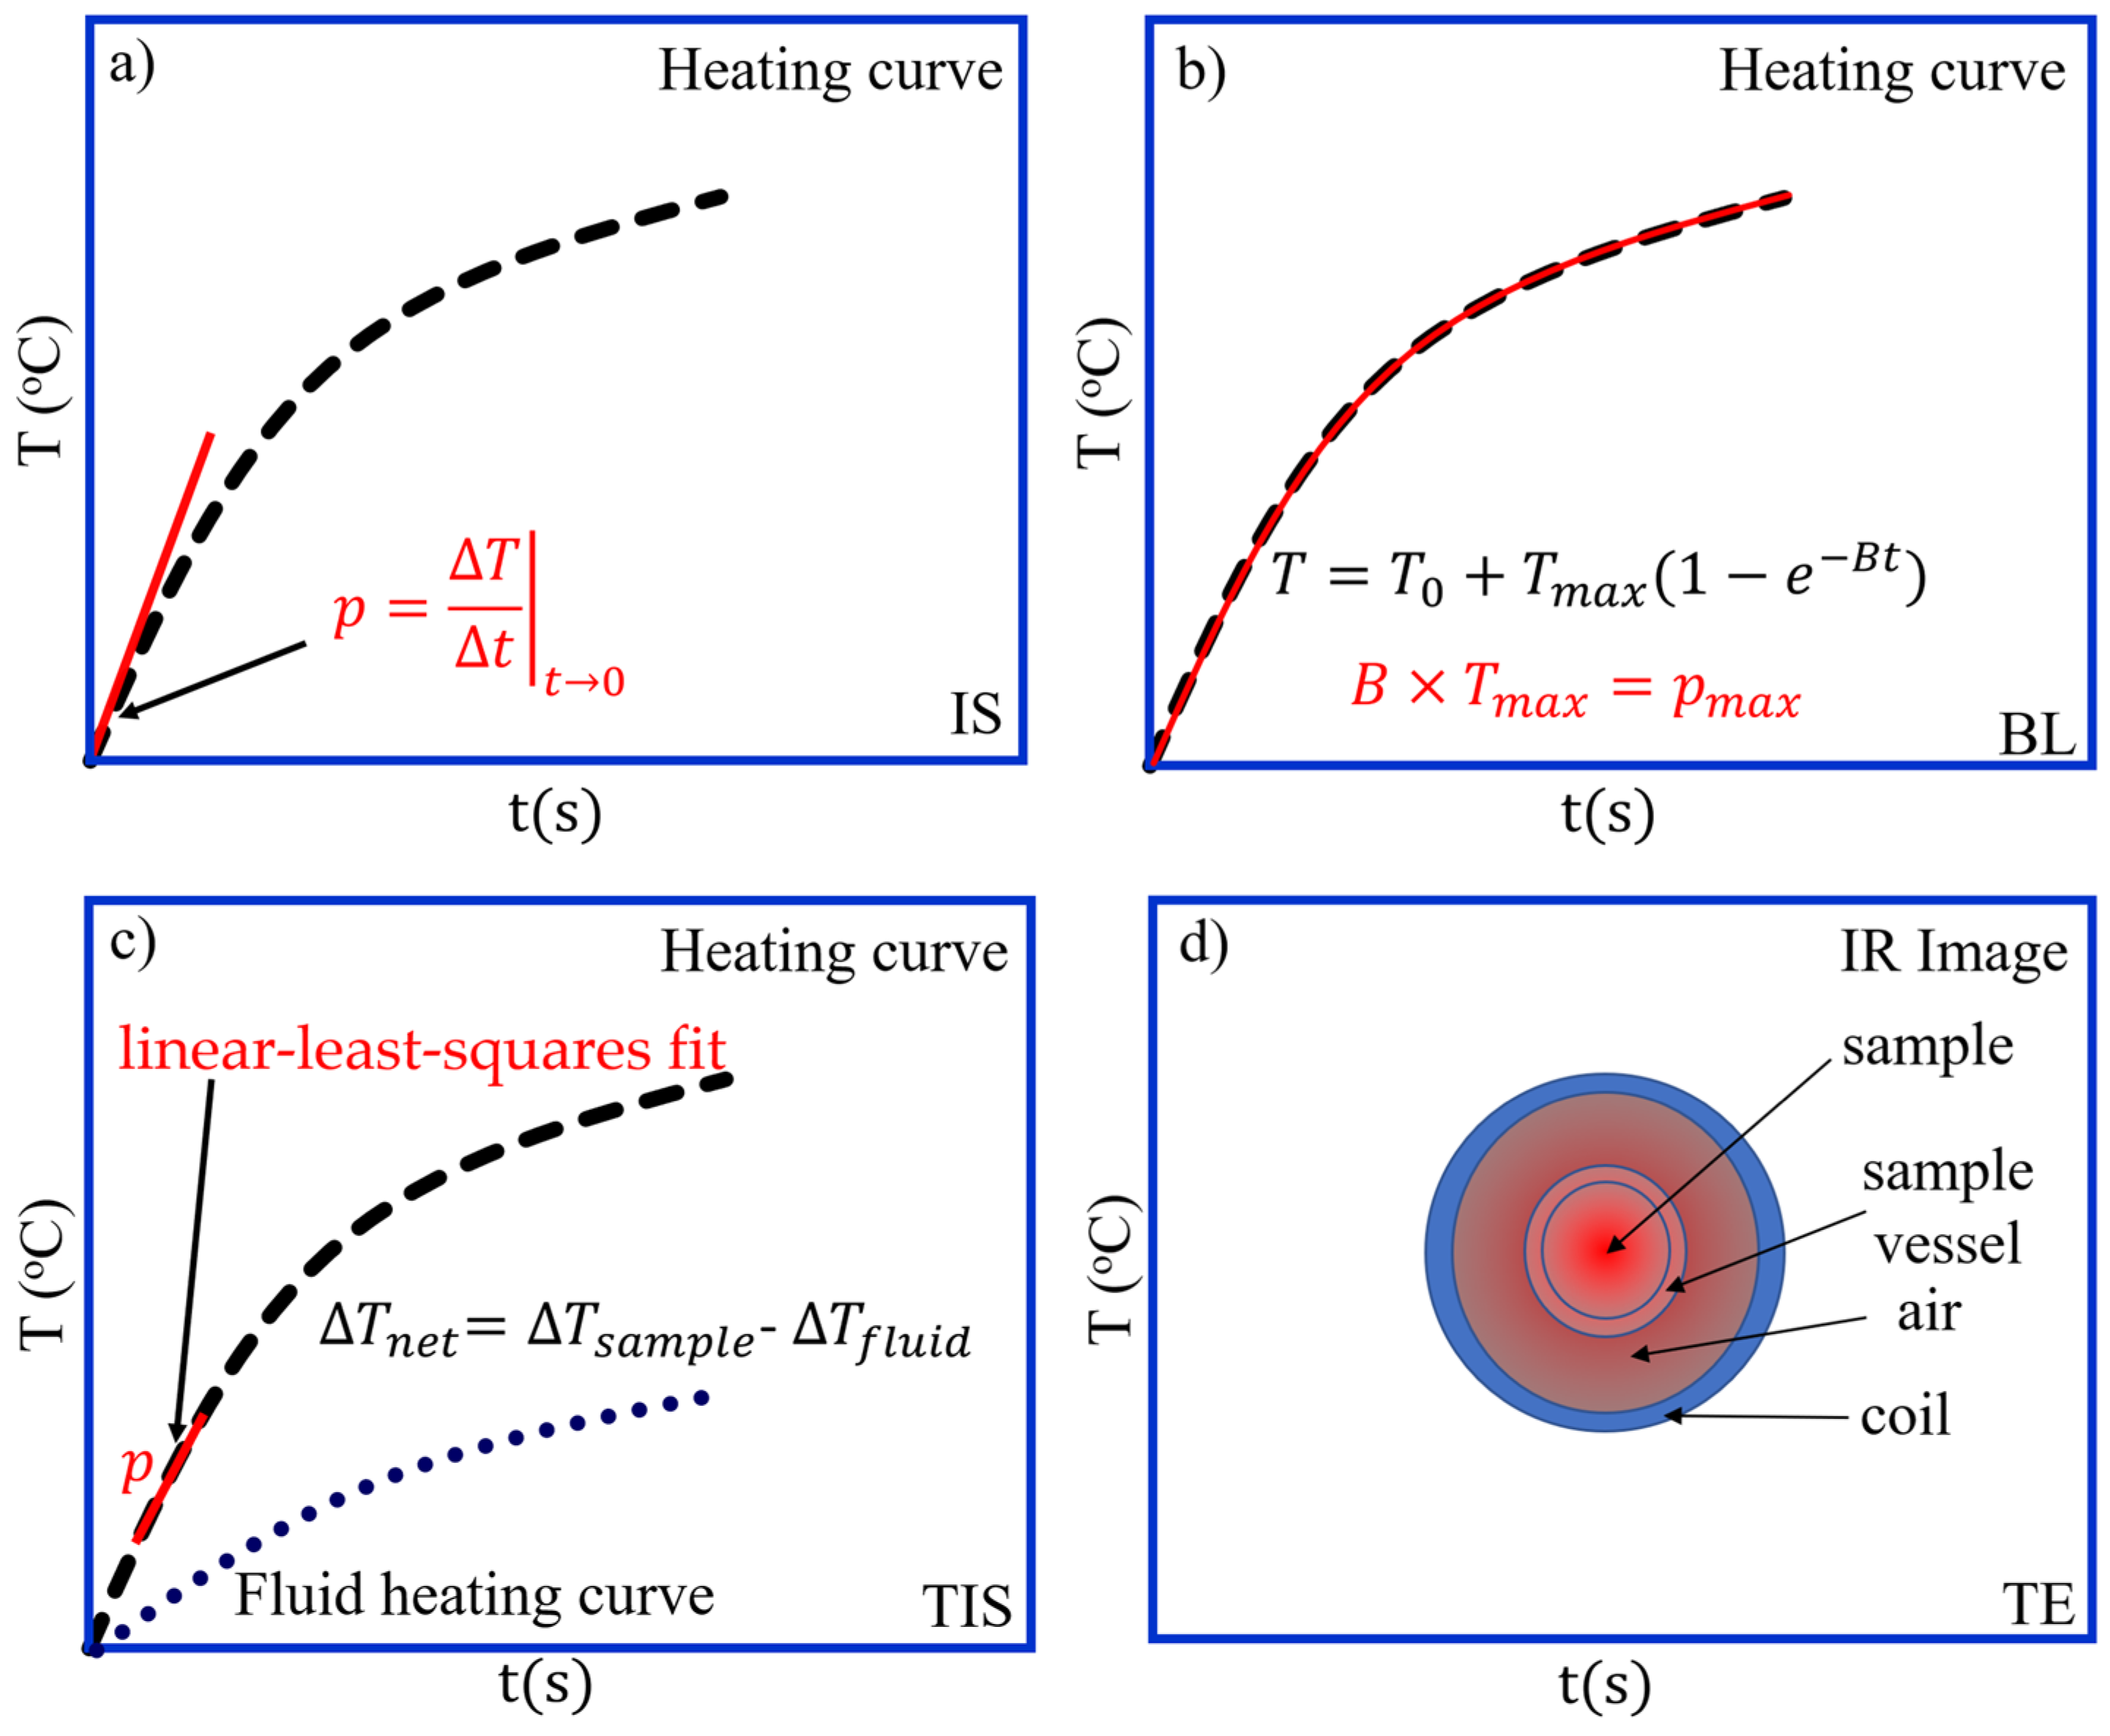
3.2.3. Box–Lucas (BL) Method (Sketched in Figure 3b)

Another very popular method used for heat slope evaluation ( T / t ) is based on the fitting of the heating curve by the Box–Lucas model: T = T 0 + T m a x ( 1 e B t ) , where T 0 —the equilibrium temperature; T m a x —the maximum heating temperature; t —the heating time; and B —a fitting constant. The product ( T m a x × B ) gives the maximum heating slope. Tithito et al. [84] reported SAR values of 9.44   W g 1 calculated with the BL method for the field parameters of 6.03   k A m 1 and 130   k H z and (Mn, Zn) F e 2 O 4 SPM-NPs integrated in an apatite-based composite material. In [85], calorimetric MH experiments on monodisperse, 15   n m sized oleic acid-coated C o F e 2 O 4 cubic nanoparticles were performed by using a commercial device (DM100—nBnanoscale Biomagnetics, Quantum design Europe, Les Ulis, France) and the BL protocol. The heating curves were recorded for a strength field of 15.89   k A m 1 and different frequencies ( 252   k H z , 323   k H z , and 397   k H z ). Using the BL and IS methods SAR calculated values showed considerable difference between these two methods. For instance, at 323   k H z , SARBL was 104.18   W g 1 , and SARIS was 65.86   W g 1 .

3.2.4. Temperature Increase Slope (TIS) Method (Sketched in Figure 3c)

Another heating slope method was developed in [86]. In the work, the authors demonstrated consistent errors in SLP measurements even though the field parameters and sample’s volume and shape were identical for each experiment. Coupled effects between the magnetic field inhomogeneities generated by the coil geometry and particle distributions in the sample volume were identified as main sources of errors. Therefore, they implemented a method that evaluates SLP from the maximum slope of the MH heating curve in few steps: (a) subtract the initial sample temperature; (b) subtract the temperature of the blank sample (fluid without nanoparticles) recorded under identical MH conditions; (c) make a linear–least-squares fit of an arbitrary chosen range from the temperature increase curve; (d) validate the quasi-adiabatic conditions met by the chosen time–temperature range through the inspection of the first derivative of the net temperature increase: [ T n e t t n + 1 T n e t t n ] / t n + 1 t n , where t n + 1 t n = 0.4   s —the time step resolution. Along with the mean value of the rate of temperature rise, these values should not exceed 5 % of the net temperature increase slope. The method was validated by MH experiments performed on different dextran- and citrate-coated magnetic water-based colloidal systems in a range of RF frequencies ( 150 375   k H z ) and field intensities ( 4 44   k A m 1 ). The average SLP reported values ranged between 108 and 3 83   W g 1 .

3.2.5. Thermographic Evaluation (TE) Method (Sketched in Figure 3d)

The thermographic approach of MH was investigated in experiments were glucose-coated iron oxide 25   n m nanoparticles dispersed into different polyacrylamide gels, for emulating intracellular viscosity, were subjected to RF magnetic fields of 32   k A m 1 and 350   k H z [73]. The temperature behavior (heating and cooling curves) of the samples was monitored through a commercial thermographic camera before, during, and after the MH experiment. A sample of discoidal shape of 13   m m in diameter was inserted inside a holder adjusted in the inner space of an RF coil. The method evidenced a difference in the maximum temperature increase between the center and periphery of the sample of around 5   ° C . The radial temperature distribution offers information about lateral thermal gradients.

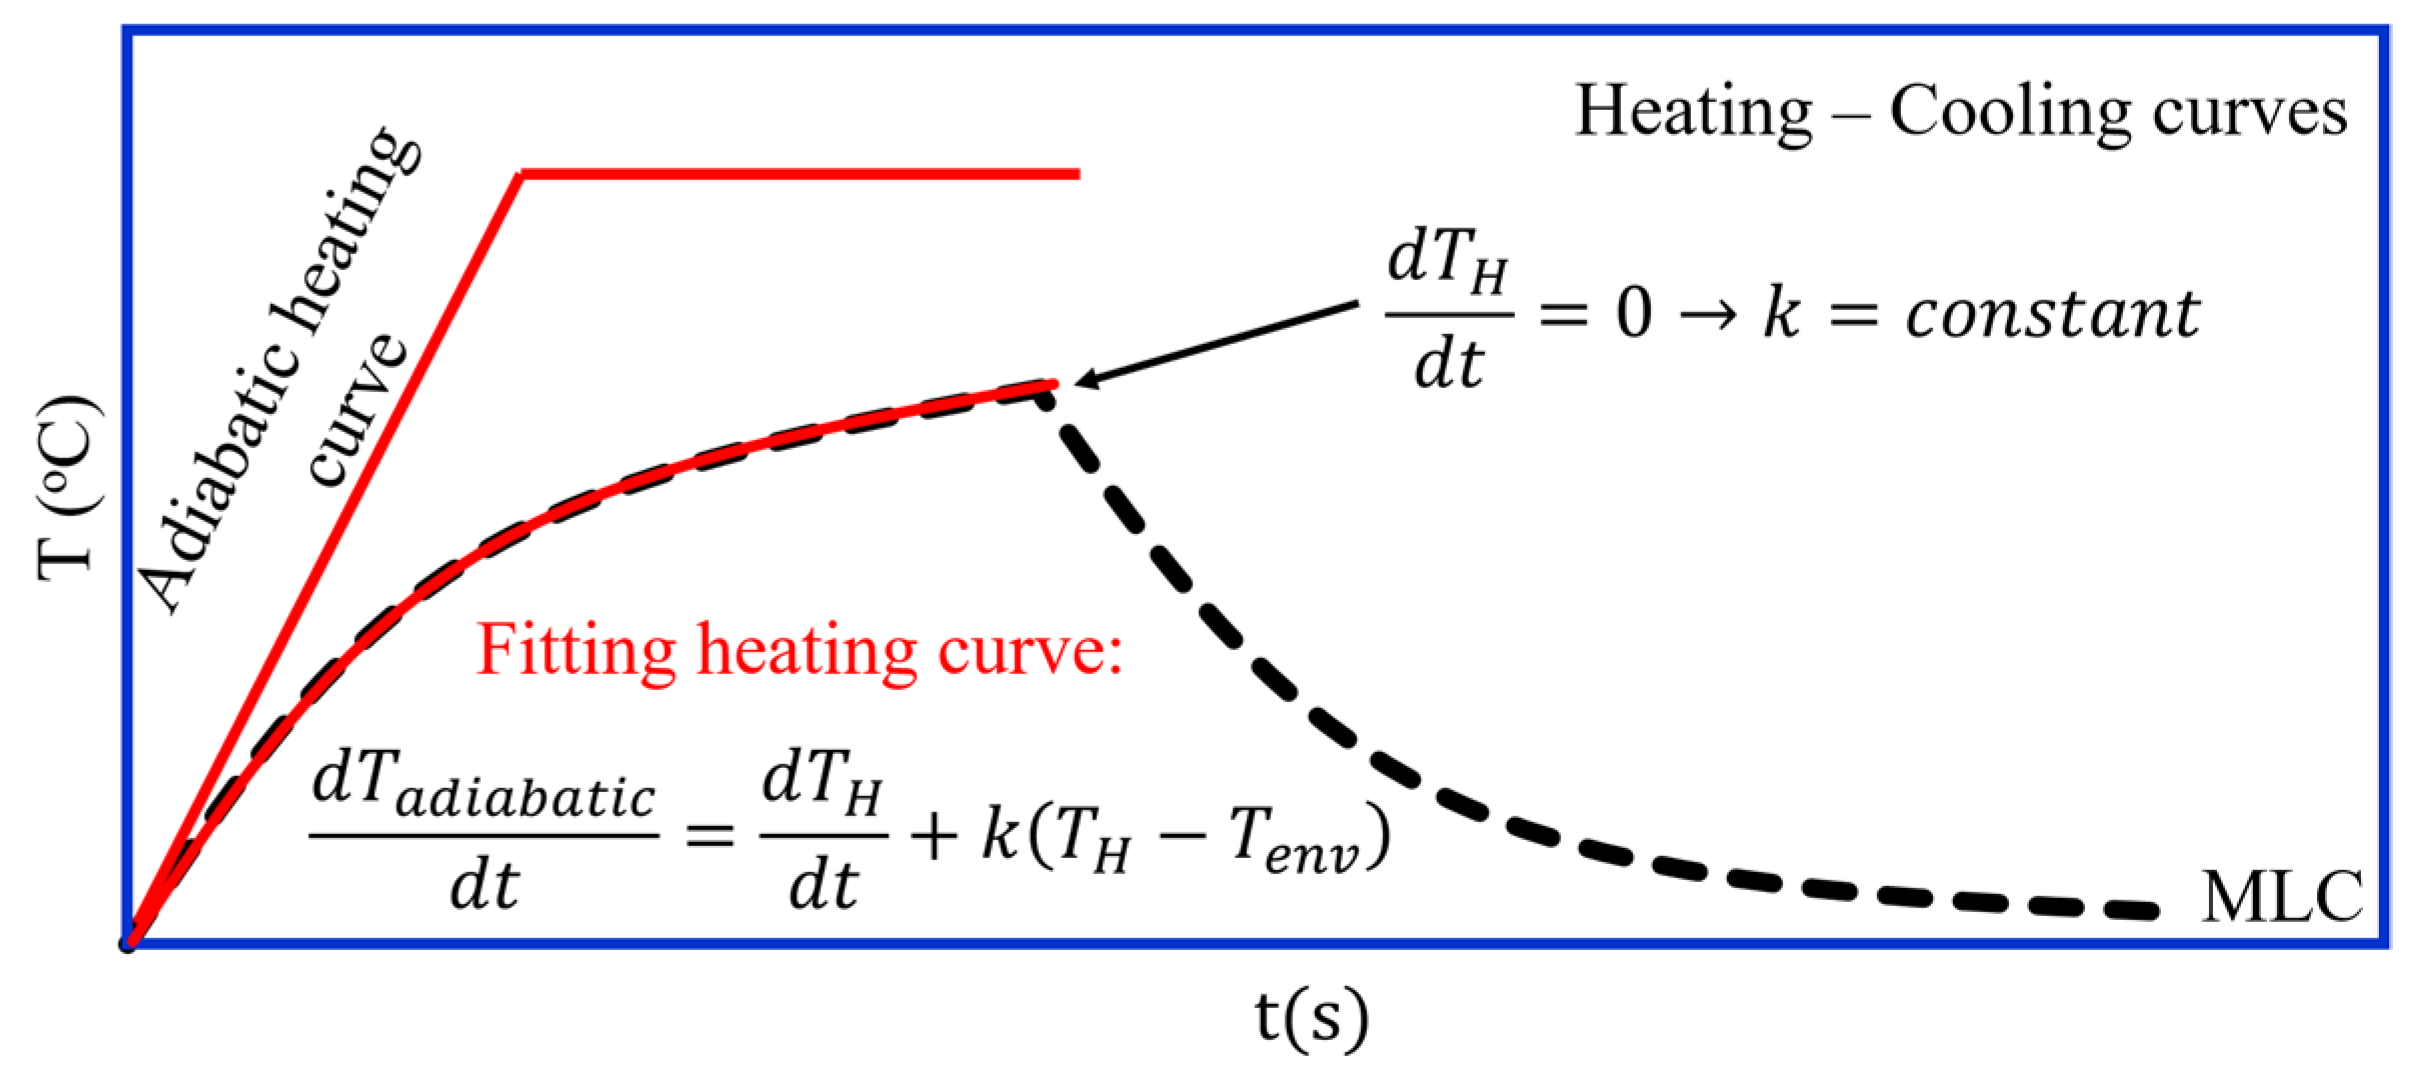
3.2.6. Adiabatic Heating Curve Methods (Sketched in Figure 4a,b)

Iacob et al. [69,75] proposed two simple methodologies involving the recording of time–temperature behavior in both the MH heating regime and the cooling regime, where the sample is subjected to natural convection after the RF magnetic field is turned off. This can be performed continuously, where the temperature is recorded in the entire ranges of the heating and cooling processes (heating and cooling curves—HCCs), or in steps, where the temperature is recorded in successive short intervals in both heating and cooling regimes in correspondence to the intervals of the application of the magnetic fields (heating and cooling steps—HCSs).
Figure 4. (a) Sketch of heating cooling step method and (b) sketch of heating cooling curve method.
Coatings 15 00345 g004
In the case of the HCS method (Figure 4a), the experimental points are fitted with linear functions in order to extract the heating and cooling velocities ( v H ( T ) and v C T ) in correspondence to the temperature points [75]. The continuous dependence of v H ( T ) and v C T is further obtained by the proper fitting of the experimental points. The next step is to numerically compute the adiabatic heating velocity as v A ( T n ) = v H ( T n ) + | v C ( T n ) | at all temperature points equally separated in arbitrary mode ( T n + 1 T n = T = c o n s t a n t ) in the experimental range ( T 0 , T 1 , , T n ). The Δ T / v A T n = Δ t n , n + 1 ratio gives the time required for the temperature to increase between two consecutive points. The summation of all these time intervals n = 0 n t n , n + 1 provides the time during which the temperature increases from T 0 to T n . The generation of the adiabatic heating curve T n ( t n ) is, therefore, possible by the inverse representation of the t n ( T n ) values. Based on the experimental v A T n values, the volume fraction dependence of the input power ( q P ) from the bioheat equation was calculated in the MH temperature range. Accordingly, q P ranged between 0.05 and 0.5   W c m 3 .
In the case of the HCC method (Figure 4b), a more versatile way for calculating the adiabatic heating behavior based on experimental data was developed [69]. The heating and cooling temperature profiles are acquired continuously in the MH process and during natural convection after the magnetic RF field is turned off. The cooling temperature curve that contains information about heat loss due to thermal gradients around the ferrofluid sample can always be fitted by an exponential function: T C t = a C e t / b C + c C , with a C , b C , and c C the fitting parameters. The heating curve may be fitted in the general case by polynomial functions, i.e., T H t = a m t m + a m 1 t m 1 + a 0 , with a m the coefficients, but for low heating rates, it can be fitted by exponential functions: T H t = a H e t / b H + c H , with a H ,   b H , and c H the fitting parameters (bH < 0). In the case of low heating rates (under 0.1 °C/s), the derivative of the exponential heating and cooling profiles gives the temporal heating and cooling rates ( v H t and v C t ). Next, by using a simple mathematical trick of eliminating the time variable that is either numerical or analytical between v H t and T H t , and v C t and T C t , the correspondence between heating and cooling rates (( v H T and v C T , respectively) and temperature is thus obtained: v H T = ( c H T ) / b H and v C T = ( c C T ) / b C . By following the same procedure as in the temperature step approach, the experimental adiabatic heating curve T H * t is constructed. In the case of high heating rates, where the heating curves are fitted by polynomial functions, the correspondence t n ( T n ) can be simply found by solving the equation a 4 t n 4 + a 3 t n 3 + a 0 = T n , where ( a 0 , , a 4 ) are polynomial coefficients. The heating velocity v H t n is obtained by numerically evaluating the derivative of the polynomial function at each t n . But t n corresponds to T n , and the v H T n dependence is found. Next, the adiabatic heating rate v A T n and T H * t are easily computed. In this case, the less linear profile of the adiabatic heating curve is evidenced. If the Rosensweig model (Equation (1)) is computed with the physical parameters of the real nanoparticle system as input values, the dissipated power P n can be calculated at each consecutive point T n of the experimental temperature range. Therefore, the heat dissipated becomes Q = P n · t n , n + 1 = m · c · T n , n + 1 , and t n T n , the time needed for the temperature to increase from T 0 to T n , is obtained by summation: t n T n = 0 n ( t n , t n + 1 ) . In this way, a theoretical heating curve can be generated by the inverse representation of t n ( T n ) . These two methodologies, relied on the continuous and step MH approaches, are strongly validated by the overlapping of both heating profiles: the experimental adiabatic and the theoretical one in the case of SPM nanoparticle systems. Nevertheless, poorer overlapping is observed in the case of high heating rates (the samples with high nanoparticle concentration), possibly induced by changes in SPM nanoparticles’ behavior resulting from magnetic dipolar interactions or due to thermal inertia that induces deviation from linear heat transfer behavior. Both experimental approaches used oleic acid-coated F e 3 O 4 SP-MNPs dispersed in a polar fluid (transformer oil [87]) in low- and high-volume fractions ( 0.004 and 0.15 ). The sample vials were positioned in a PVC tube with vacuum walls centered in a commercial 235   k H z RF coil setup. The main advantage of these methods is given by the simple construction of the experimental setup. The mathematical approaches are also not complicated.

3.2.7. Modified Law of Cooling (MLC) Method (Sketched in Figure 5)

A similar method that accounts for heat loss is described in [88]. Accordingly, from the theoretical perspective, the method is based on the modified law of cooling:
d Q / d t = m C p d T / d t + U A ( T T e n v )
where Q —the thermal energy; m —the ferrofluid mass; C p —the specific heat of the ferrofluid; U —the heat transfer coefficient; A —the effective surface area of the sample; T —the measured temperature; and T e n v —the environment temperature. The first term on the right side of Equation (10) represents the experimental heat recorded during MH, and the second term is the heat lost to the environment. Divided by m C p , Equation (10) may be written as
d T / d t = d T / d t + k T T e n v
where T —the adiabatic temperature (if the heat loss did not exist); k = U A / m C p —a time constant. The k value is determined by the condition d T / d t = 0 , the case when the RF field is turned off. By fitting the experimental heating curve with Equation (11), the adiabatic heating curve is subtracted. For more accurate SAR results, the reference heating curve from the blank ferrofluid sample was subtracted. By using the MLC model, Chalkidou et al. reported SAR values up to 400   W g 1 in MH in vitro experiments.
Figure 5. Sketch of MLC method.
Coatings 15 00345 g005

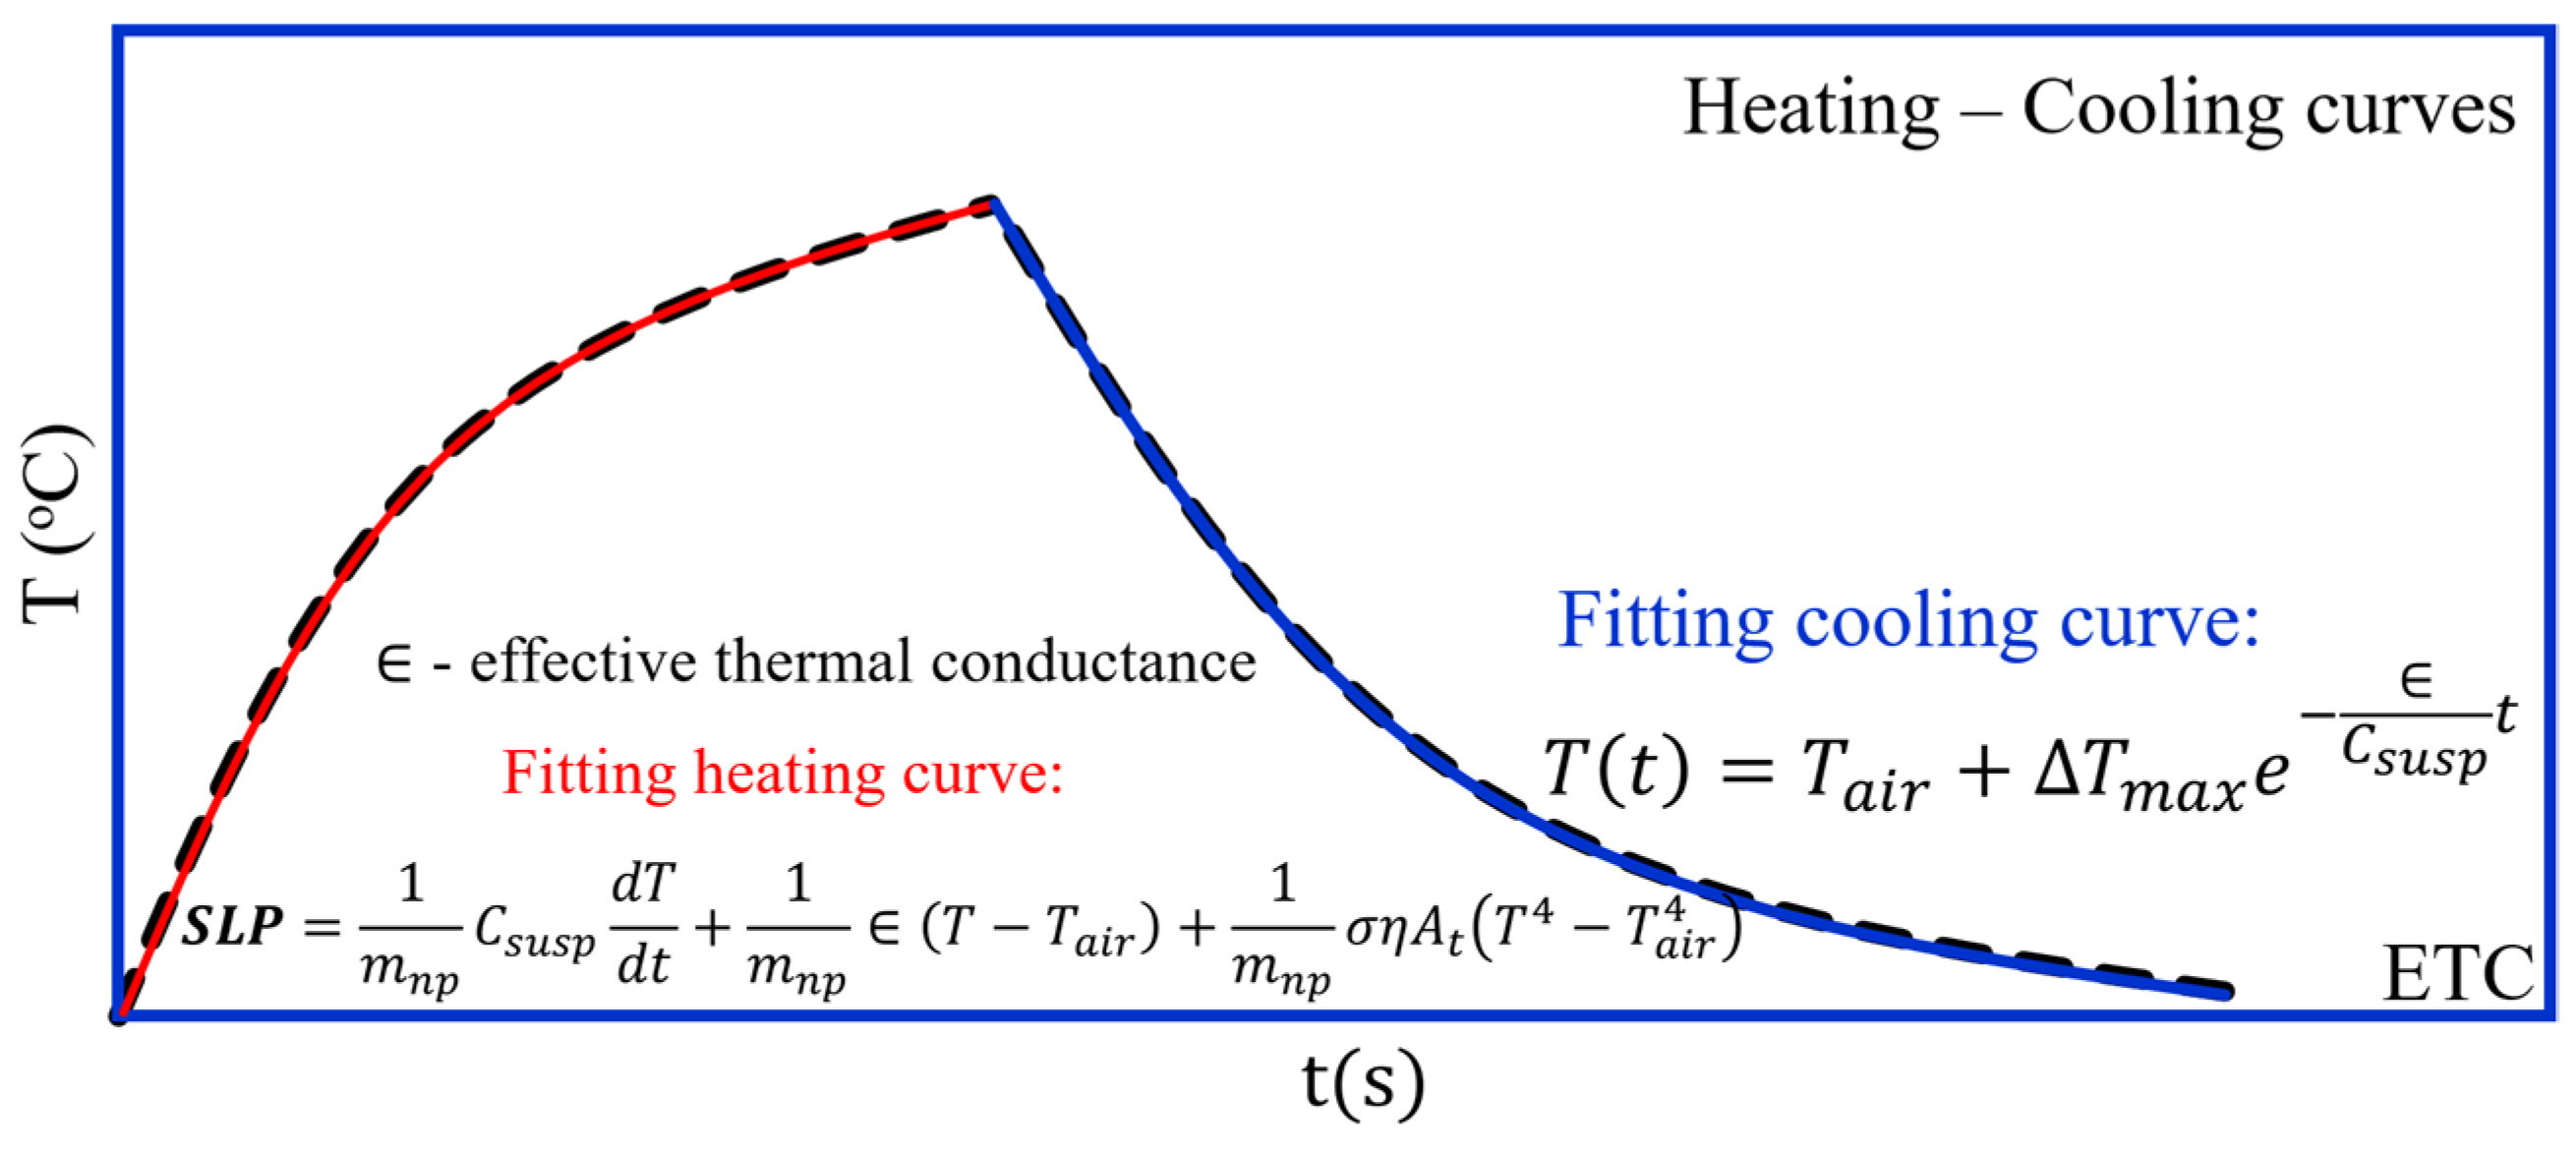
3.2.8. Effective Thermal Conductance (ETC) Method (Sketched in Figure 6)

A general equation relies on a developed thermodynamic approach for determining the SLP factor containing terms corresponding to different thermodynamic regimes: adiabatic approximation, and non-adiabatic and non-radiating conditions; the isothermal case may be found in [89]
S L P = 1 m n p C s u s p d T d t + 1 m n p T T a i r + 1 m n p σ η A t T 4 T a i r 4
where m n p —the nanoparticle mass; C s u s p —the heat capacity of the nanoparticle suspension; —the effective thermal conductance of the sample’s surrounding environment; σ —the Stefan–Boltzmann constant; η —the emissivity; and A t —the total sample surface. HM experiments performed on Fe3O4 and MgFe2O4 nanoparticles of different sizes dispersed in water under non-adiabatic and radiating conditions validated the equation with high accuracy. Curves for heating under the RF field conditions of 70.5   k H z and 70   O e and cooling curves were recorded, and by their proper fitting, the parameter and finally the SLP were obtained. The heating curves were fitted by Equation (12), and the cooling curves were fitted by the equation
T t = T a i r + T m a x e C s u s p t
which is written for the cooling process when the magnetic field is turned off. In this case, S L P = 0 , and T m a x = T m a x T a i r is the temperature difference between the sample and the environment at the moment when the field is suppressed. In respect of the size, the reported SLP values were greater for F e 3 O 4 nanoparticles (e.g., 0.86   W g 1 for 13.4   n m particle size) than for M g F e 2 O 4 nanoparticles ( 1.6   W g 1 for 12.7   n m particle size).
Figure 6. Sketch of ETC method.
Coatings 15 00345 g006

3.2.9. Evaluation of Nanoheater Temperature (ENT) Method (Sketched in Figure 7)

Another SAR evaluation method under non-adiabatic conditions that computes heat loss based on recording both heating and cooling curves was developed in [90]. In the study, the MH setup is completed with a water shell surrounding the magnetic fluid sample based on F e 3 O 4 nanoparticles in order to protect the sample against possible short temperature variations from the environment. The entire holder is placed in a home-made RF device working at 100   k H z . The SAR is evaluated through a developed methodology relying on solving a set of coupled differential equations describing the heat exchange between MH setup components:
P c s m s τ s T s t T w t = c s m s d T s t d t
c s m s τ s T s t T w t ( τ w 1 + τ w 2 ) c w m w τ w 1 τ w 2 T w t T a = c w m w d T w t d t
where P—the power term; c s and m s —specific heat and mass of the heat source (nanoparticles); c w and m w —specific heat and mass of water; τ s —the time constant of the heat exchange between the nanoparticles and water; T s —the nanoparticles’ temperature; T w —the temperature of water; τ w 1 and τ w 2 —the time constants of exponential functions that fit the cooling curve of the magnetic fluid sample under natural convection conditions; and T a = 23.5   ° C —the equilibrium temperature of the environment. The methodology exploits the thermal equilibrium condition attained during the MH process when the heat released by the nanoparticles is completely lost in the environment. In this situation, the system of equations is reduced to
P = ( τ w 1 + τ w 2 ) c w m w τ w 1 τ w 2 [ T M T a ]
where T M —maximum temperature reached in the heating process when the sample enters the thermal equilibrium. It brings some complexity regarding the experimental setup and mathematical methodology, also involving a calibration procedure, but has, as a main advantage, the possibility of estimating the temperature of the magnetic nanoheaters dispersed in the fluid sample. Based on this model and by using two F e 3 O 4 nanoparticle samples, one of 50 100   n m particle size and other of 10 20   n m particle size, the calculated SAR has an approximatively linear dependence in respect of the field amplitude for both samples, reaching higher values for the larger particles (about 170   W g 1 for 90   m T ).
Figure 7. Sketch of ENT method.
Coatings 15 00345 g007

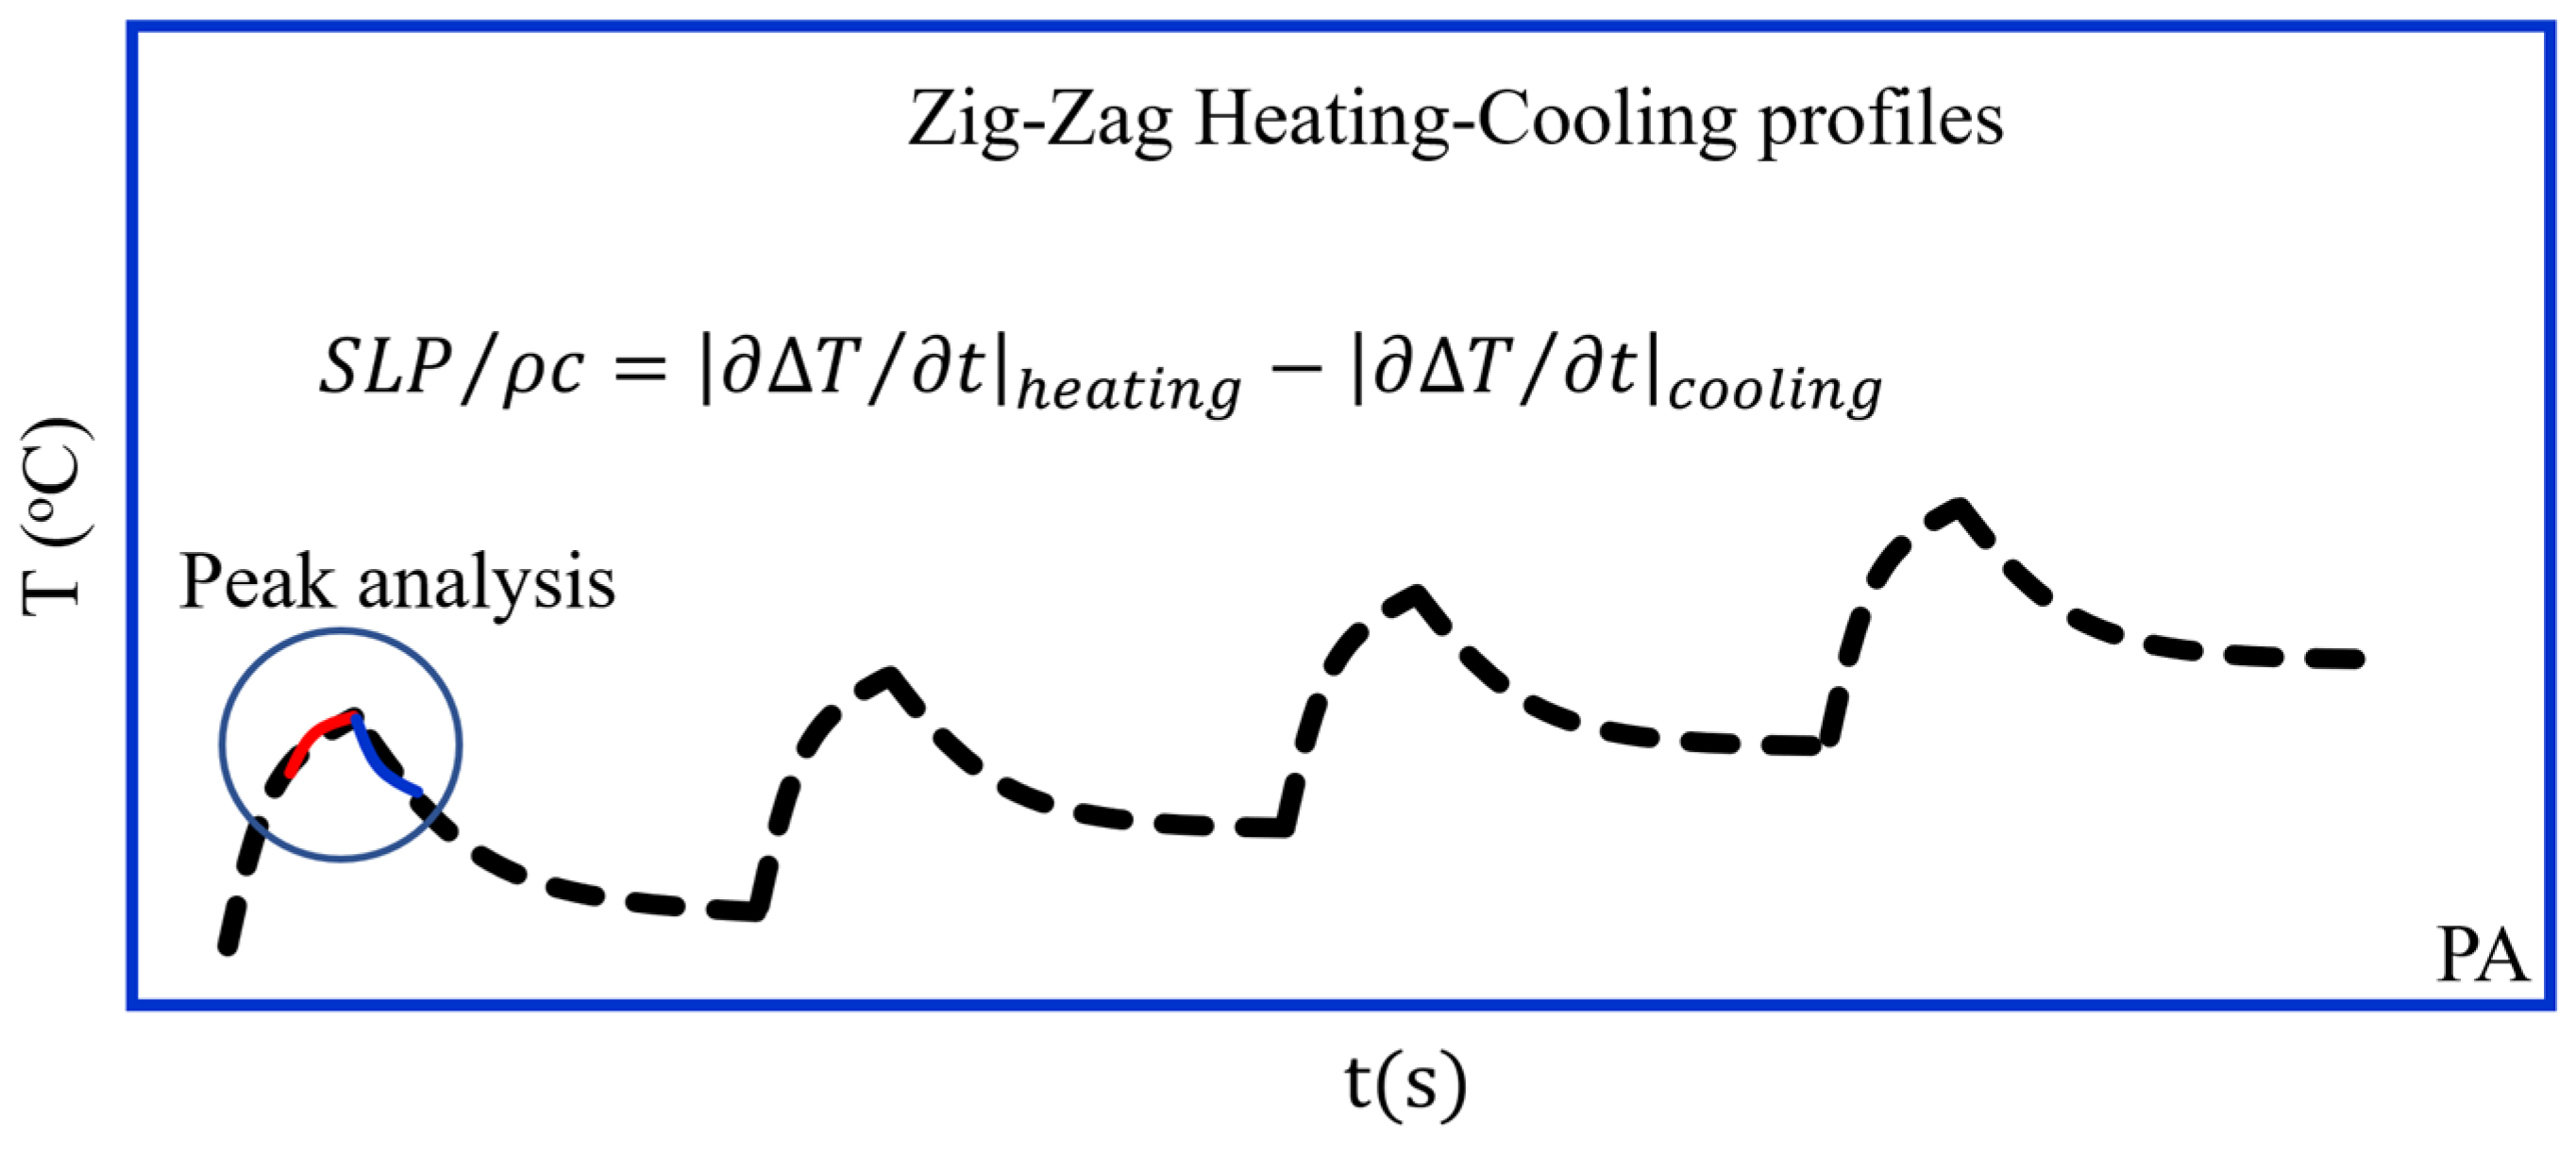
3.2.10. Peak Analysis (PA) Method (Sketched in Figure 8)

Based on a heat diffusion equation, the SLP was calculated by a new method called the Peak Analysis Method (PAM) using a 1D temperature diffusion model and a zig-zag protocol of intermittent heating and cooling steps [91] (similar to [75]). Accordingly, the temperature variation in the 1D of the MH system can be written as T / t = 2 T / x 2 + S , where = k / ρ c —the thermal diffusivity ( k —the thermal conductivity; ρ —the sample density; and c —the heat capacity); S = S L P / ρ c —the heating source; and T = T T e n v . The method calculates SLP at the point (peak) of the transition between the heating and cooling curves. Around this peak, the effects of loss are minimized, and the temperature profile is practically unchanged. Therefore, the source heat may be written as S = T / t h e a t i n g T / t c o o l i n g . The experimental validation of this approach was performed by using three devices with the same field parameters (~ 165   k H z and 35   m T ) with which a 1 mg/mL magnetite nanoparticle suspension was heated. The temperature was acquired with an optical fiber thermometer. The SLP values were compared with those obtained from a single heating–cooling cycle experiment recorded on the same devices. The SLP values (around 300   W g 1 ) were consistent for all three devices in the zig-zag protocol, drastically reducing the errors between the devices and the measuring time of the SLP evaluation.
Figure 8. Sketch of PA method.
Coatings 15 00345 g008

3.2.11. Pulse Heating (PH) Method (Sketched in Figure 9)

In [92], an alternative method for SAR evaluation in MH experiments claims high precision due to non-transient measurements. The experimental setup is complicated, providing the almost adiabatic conditions accomplished by maintaining a controlled thermal equilibrium between the environment and the fluid sample. The method is based on applying consecutive AC magnetic pulses that generate heating ramps in a ferrofluid sample. It is assumed that the entire the heat generated during a heating pulse remains in the sample, allowing for the measurement of the adiabatic temperature increment ( T ) . The method has, along with precision, the advantages of measuring low SAR values. This was experimentally proved by heating, under 108   k H z and 1.1   k A m 1 field conditions, a ferrofluid sample of F e 3 O 4 nanoparticles o f   50   n m in hydrodynamic diameter and 100   m g   m L 1 concentration. Each heating pulse was delivered in 600   s and generated a temperature slope of 2 × 10 4   ° C / s , corresponding to a low SAR value of 0.217   W g 1 .
Figure 9. Sketch of PH method.
Coatings 15 00345 g009

3.2.12. Discussion

The heat slope (IS, BL, and TIS) methods do not imply a complex experimental setup and do not account for heat loss, which is very important in MH experiments that involve very low heating rates. IS and BL are quite simple-to-compute methods, but the TIS method requires some computational effort. However, all these methods work very well in the case of significant heating rates. Both the BL and TIS methods offer higher accuracy compared with the IS method, but the BL method may be preferable due to simplicity. Good thermal insulation of the sample is recommended for all these methods.
The HCS and HCC methods do not involve complicated experimental conditions and computation. They allow for the reconstruction of the adiabatic heating curve and work very well for low heating rates (under 0.1   ° C /s). At high heating rates, the methodology cannot accurately predict the entire MH adiabatic heating behavior. However, the HCC method is easier to implement. The MLC method is a similar method that allows for the reconstruction of the experimental adiabatic MH profile and is not hard to implement experimentally. The method proved to have high accuracy. The ETC method has been experimentally proved to have high accuracy in SLP evaluation, but its disadvantage is the inability to reconstruct the experimental adiabatic curve. However, this aspect may be useful only when nonlinear heating behaviors exist. The ENT methodology developed can calculate the temperature of nanoparticles dispersed in ferrofluid. The complexity of the experimental setup and evaluation methodology gives the method a disadvantage. Based on applying consecutive AC magnetic pulses, the PH method claims high precision even in the case of low SAR values (as experimentally proved). The disadvantage of the PH method is given by the difficulty of its experimental implementation. The PA method, along with the zig-zag protocol, demonstrated high accuracy in SLP evaluation, compared with other methods, but not easy experimental implementation. The TE method is a simple and interesting method with the advantage of the recording radial thermal gradients. For high-accuracy results, the method requires quasi-adiabatic protection of the sample and a high-resolution camera. However, there is a problem with the implementation of thermal protection at the sample side towards the IR camera. A low-thickness sample would have the advantage of eliminating the volume thermal gradients.
Regarding the calorimetric evaluation methods, there is an important issue related to the accuracy of the reported SAR results. Different evaluation methods involving different experimental setups and mathematical approaches provide SAR values that are more or less accurate. The errors induced by the method principles cumulate with errors induced by the thermal transfer between setup components and the magnetic fluid properties [82,91,93]. A possible solution may be the standardization of these calorimetric methods, but this cannot be successful without the standardization of the physical equipment involved in MH experiments. In the case of well-established experimental techniques, such as X-ray diffraction, electron microscopy, and magnetometry, standardized commercial devices are utilized. The question, therefore, arises as to why standardized devices for SAR measurements are not employed in the context of magnetic hyperthermia. While there are indeed such devices on the market, they are limited in terms of the range of models and available options. It is very important that for the same field parameters set in every MH experiment performed around the globe, the RF coil has the same geometry and surrounding environment. This can be accomplished only with standardized MH equipment. This equipment should come with integrated working protocols (regarding sample concentration, ferrofluid stability, and type of coating), calculation methodologies (proper methods for specific heating rates), and possible calibration samples.

3.3. Magnetic Methods in SAR Evaluation

Dynamic magnetic hysteresis measurements performed in the MH frequency regime bring high accuracy in SAR evaluation [76,94,95,96,97,98,99], but commercial devices that deliver proper field intensities are not available. Instead, diverse locally implemented solutions have been built with good results [94,95,98]. Comparative analyses with calorimetric methods have been performed, indicating good agreement [94,95]. The advantages of this technique are mainly given by the speed and accuracy of measurements. Drawbacks are given by the impossibility of measuring hysteresis loops in the case of SMNPs. For that, AC susceptometers working at MH frequencies have been built in different laboratories because, commercially, they are not available [77,100,101]. Most commercial devices (e.g., PPMS by Quantum Design) for magnetic measurements allow for χ measurements as a function of temperature and field parameters ( f 10   k H z and H 0 1.2 ), which are not useful in the range of MH. Each magnetometer technique has advantages and disadvantages regarding the type of nanoparticles that can be investigated. These techniques also are not standardized, allowing for errors between different experimental setups that may arise from the quality of electronic components, calibration procedures, and working protocols. Hence, building standardized AC magnetometers/susceptometers for MH application on a large scale is clearly a necessity.

4. Effects of Coating Layer on SAR

The hydrodynamic volume of a particle is strongly influenced by the thickness of the organic coating layer, thereby reducing the magnetic dipolar interactions and avoiding particle agglomeration. This is very important in preserving the superparamagnetic behavior in fine MNP assemblies. On the other hand, the organic layer may suppress Brownian relaxation. The organic layer may also chemically interact with the magnetic atoms on the particle surface, creating a disordered magnetic shell and affecting saturation magnetization. In these circumstances, the organic coating layer exerts a significant influence on MNP heat efficiency. Spherical magnetite nanoparticles with a mean diameter of 13   n m coated with different surfactants (citric acid (CA), dextran (DEX), and (3-aminopropyl) trimethoxysilane (APTES)) were subjected to MH calorimetric experiments with the RF field parameters of 15.9   k A m 1 and 250   k H z [102]. Furthermore, the SAR was evaluated in naked F e 3 O 4 nanoparticles. The hydrodynamic diameter was found to be 20.8   n m for the naked F e 3 O 4 nanoparticles, 46.9   n m for F e 3 O 4 @ C A , and 76.6   n m for F e 3 O 4 @ A P T E S . The F e 3 O 4 @ C A and F e 3 O 4 @ A P T E S samples exhibited relatively appropriate SAR values of 65.8   W g 1 and 67.2   W g 1 , respectively, compared with the uncoated F e 3 O 4 nanoparticles ( 63.4   W g 1 ). The F e 3 O 4 @ D E X sample demonstrated a lower SAR value ( 55.6   W g 1 ). The F e 3 O 4 @ C A and F e 3 O 4 @ A P T E S nanoparticles demonstrated higher SAR values in comparison to the uncoated ones due to better dispersion stability. The F e 3 O 4 @DEX nanoparticles exhibited the highest hydrodynamic diameter and the thickest organic layer, which exerted a significant influence on Brownian loss and the SAR value, respectively. Furthermore, the high thickness of the DEX layer induces magnetic disorder at the particle surface, decreasing the saturation magnetization and, correspondingly, the SAR [102].
MH experiments conducted with varying field parameters in coated and uncoated iron oxide SPM-NPs demonstrated, by the Box–Lucas method, a decrease in SAR values in the case of the coated particles [103]. In the study, the dextran-coated F e 3 O 4 nanoparticles with a hydrodynamic diameter of 352   n m exhibited significantly lower SAR values ( 247   W g 1 ) compared with the naked F e 3 O 4 nanoparticles with a hydrodynamic diameter of 52   n m ( 997   W g 1 ) . This reduction in the SAR is attributed to a decrease in Brownian motion. The MH heat efficiency of F e 3 O 4 nanoparticles coated with sodium citrate and carboxymethyl cellulose (CMC) was investigated through dynamic hysteresis measurements performed at 69   k H z for 13.3 and 24.8   k A m 1 and calorimetric measurements performed at 100   k H z and 48   k A m 1 [104]. The dispersion of the citrate– F e 3 O 4 nanoparticles in solution and their smallest hydrodynamic mean diameter were found to be directly related to the highest SLP values ( 99.8   W g 1 ) obtained from calorimetric measurements. In contrast, the naked F e 3 O 4 nanoparticles with a hydrodynamic diameter of 135   n m demonstrated complete sedimentation and a SAR value of 60.4   W g 1 . Furthermore, the CMC-coated F e 3 O 4 nanoparticles with a hydrodynamic diameter of 152   n m exhibited a SAR value of 50.8   W g 1 . The dynamic hysteresis measurements shown the largest loop area for citrate– F e 3 O 4 and the smallest for uncoated F e 3 O 4 nanoparticles. The magnetic measurements do not account the Brownian relaxation contribution.
Another important factor that influences MH performance is related to the heat transfer capacity of the coating layer. Various coating molecules and their geometrical configurations around the nanoparticle define the heat transfer behavior between the magnetic core and the environment. In [105], a study on the influence of the thermal diffusivity of different coating molecules on the SAR is performed. Magnetite nanoparticles of around 10   n m in size coated with palmitic (PA) and stearic (SA) acids were subjected to MH experiments under similar RF field conditions. The SAR values obtained for SA were 36.1 % , higher than in the case of PA. Numerical simulations generated similar SAR values for setting the thermal diffusivity of SA at a 1.7 value, higher than for PA. Based on numerical simulations, another work [106] showed that both polymer layer thickness and its density influence MH performance. It was demonstrated that for a given coating thickness, the SLP has a polynomial dependence with respect to the surface layer density. The SLP slightly decreased with the increase in layer thickness, reached a minimum value and increased again with the increase in thickness. This behavior was explained by the competition between the steric forces (repulsion) and magnetic dipolar forces (attraction). This allows one to tune MH by controlling the thickness of the polymer coating.
Lazaro et al. [93] reported MH experiments using naked and different-polymer-coated magnetite/maghemite nanorods of 40   n m . The calculated SAR values for the same frequency of 144   k H z and different field amplitudes showed higher values for the naked particles than for the coated ones. The SAR values differences between the naked and coated particles increased with the field amplitude (at 23   k A m 1 , the SAR for the naked particles was around 150   W g 1 , and that for the coated particles was two times smaller). Keeping the field amplitude at the same value of 17   k A m 1 , at different frequencies, the SAR values were relatively unchanged for the coated nanorods (about 15   W g 1 ), but the naked nanorods’ SAR showed significant higher values, which dramatically changed with frequency and reached 80   W g 1 .

5. SAR at Cellular Level

Nanoparticle clustering in tumor cells has been experimentally observed, particularly when the particles are functionalized for targeting specific cellular components [36]. Therefore, optimizing the injected magnetic fluid doses, particle volume fraction, and their shape and size emerges as a pivotal task to preserve the heat dispersion efficiency of the nanoparticles utilized in MH. Conversely, a specific geometrical configuration of a nanoparticle cluster might prove advantageous in facilitating optimal heat transfer to the targeted cellular component to hinder its functionality. As previously mentioned, the cellular effects of magnetic hyperthermia are predominantly influenced by the heat transfer in the proximity of the nanoparticle. A cluster of nanoparticles measuring a few nanometers is comparable in dimensions to subcellular components. From this perspective, the size and shape of the cluster may be optimized with respect to the size of the cellular component to ensure efficient heat transfer. Additionally, large particles (hundreds of nm) that can be internalized by cells and come into physical contact with the thermosensitive part of the cell are of particular interest in cellular hyperthermia [16,107]. These particles dissipate thermal energy through hysteresis loss, exhibiting, in general, a lower SLP factor compared with SPM-NPs. However, the total thermal energy transferred to a vital component of the cell may exceed the minimum necessary for it to lose its functionality. Another type of nanostructure that is of interest in the context of cellular hyperthermia is the nanoflower [83,108,109], which possess particular shapes and complex geometries, allowing it to attach to cellular components in specific ways that lead to amplifying the heat transfer. In this regard, the significance of the SAR/SLP/ILP diminishes when assessing the consequences of hyperthermia at the subcellular level. Cellular MH is a new and more focused research direction in cancer hyperthermia that requires advanced knowledge in the biology and biochemistry fields regarding the physical and chemical interactions between magnetic nanostructures and cellular components.

6. Conclusions and Remarks

Magnetic hyperthermia constitutes an alternative therapeutic approach for the treatment of cancer. Its principal mechanism of action involves the generation of heat in a tumor tissue (by embedding a system of MNPs) subsequent to the application of a radiofrequency field. The MNPs release heat by specific magnetic relaxation processes, Neel and Brownian relaxation [65], or hysteresis losses [76,94,95,96,97,98,99]. It is well established that cancer cells exhibit heightened sensitivity to temperature increases that surpass physiological thresholds, leading to a process known as apoptosis.
In the classical MH approach, the implementation at the clinical level necessitates prior knowledge of the magnetic material distribution within the tumor tissue and the magnetic field parameters that can be utilized under safe patient conditions. This can be achieved through the theoretical and experimental modeling of magnetic hyperthermia. From a theoretical standpoint, the modeling of magnetic hyperthermia can be achieved through the utilization of the BHTE equation [75], contingent upon the availability of data pertaining to the power dissipated in the tissue ( q P ) by the mechanisms of magnetic hyperthermia and the bio-thermodynamic parameters of the tissue in normal physiological metabolism. To determine the q P term, it is necessary to employ laboratory experimental methods involving calorimetric and magnetic measurements.
Calorimetric measurements face limitations in directly evaluating the q P term due to their inability to maintain adiabatic conditions, which are required to avoid heat loss. In a real, non-adiabatic system, the most straightforward and accessible method to circumvent the impact of heat dissipation is to consider the initial heating slope (IS) solely [83] of the temperature curve recorded during magnetic hyperthermia. For higher SAR evaluation accuracy, similar methods (BL and TIS) relying on finding the maximum heating slope have been developed [84,85,86] Despite their versatility, the IS, BL, and TIS methods have drawbacks, particularly for slow magnetic hyperthermia processes, where the ferrofluid samples may lose considerable heat with respect to that produced. Another strategy is not to avoid the heat loss but to record it to reconstruct the experimental adiabatic heating curve. For this purpose, various simple or advanced heat loss calorimetric methods providing high accuracy results [69,75,88,89,90,91,92] have been developed based on the consideration of the heat loss induced by the thermal conduction between the experimental setup components, natural convective cooling, and radiative loss. If the heat slope methods give good results in the case of significant heating rates, the heat loss compensation methods could be complementarily used in the case of low heating rates (< 0.1   ° C ).
Magnetic methods (dynamic hysteresis and susceptibility measurements) are versatile and provide accurate and rapid information on the MNP response in alternating magnetic fields [76,94,95,96,97,98,99]. The principal disadvantage of these techniques is that magnetometer devices operating in the range of magnetic hyperthermia field parameters are not commercially available, only locally constructed in the laboratory, but provide remarkable results.
Unfortunately, MH experiments have proved important variations in SAR results collected with different evaluation methods and devices [82,91,93]. Therefore, it is hard to believe that all these evaluation methods and methodologies are able to allow for a comparison with high-accuracy SAR values obtained from different laboratories around the world without involving standardized measurement equipment and protocols. The standardization of the equipment and working protocols represent the unique way to avoid the pitfalls given by a wide class of experimental factors, i.e., various geometries used in coil building, their cooling systems, ambient thermal conditions, the volume and shape of the sample’s holder and its material composition, ferrofluid volume fraction and suspension stability, etc., in the case of the calorimetric approach and different electronic parts, constructive design, and calibration protocols in the case of the magnetic approach.
At the cellular level, heat dissipation during hyperthermia exerts a specific influence on the growth and multiplication capacity of tumor cells. While the underlying mechanisms remain to be fully elucidated, ongoing research endeavors seek to identify the heat-sensitive cellular components that could expedite the process of apoptosis following magnetic hyperthermia treatment. In this regard, a novel trend in the study of magnetic hyperthermia entails targeting specific subcellular structures within the cytoplasmic environment or extracellular matrix [30,31,32,33,34,35,36,37,38,39,40,41]. This approach aims to localize the effect of magnetic hyperthermia and optimize the utilization of MNPs and applied fields. This objective can be achieved by binding molecular vectors with chemical affinity for specific cell receptors to the nanoparticle surface. In addition to the effects of cellular magnetic hyperthermia, scientific interest has shifted to the study of the kinetic effect [45,46,47,49,50] of nanoparticles on subcellular components by applying low-frequency magnetic fields to nanostructures with high magnetic anisotropy (nanodisks, nanorods, nanoflowers, etc.). The oscillations and vibrations of these particles have the potential to induce local cellular damage, thereby triggering apoptosis processes.
Considering the classical aspects of magnetic hyperthermia, but also the new trend to focus the effect of MNPs on cell growth and proliferation mechanisms at the cellular level, questions inevitably arise: What is the relationship between the SAR/SLP/ILP and the local effect of magnetic hyperthermia on the cellular infrastructure? Does it still make sense to consider the power dissipated by MNPs in tissue a continuous macroscopic variable? Or should we focus our scientific interest on local thermal and mechanical effects at the subcellular level, looking for the optimal way to release the heat and kinetic energy of a single nanoparticle or a cluster of nanoparticles? In this case, we would need to find ways of expressing SLP/ILP for a single particle, incorporating the kinetic term. However, it is difficult to establish a link between the power (caloric or kinetic) dissipated by a single particle and its effect on cellular metabolic mechanisms. In this way, the new approach to magnetic hyperthermia becomes highly specialized, adding destructive mechanical effects to the thermal ones. Depending on the targeted cell part, combining these effects could be the safest way to approach magnetic hyperthermia. The temperature achieved in the proximity of the nanoparticle surface has become the new variable of interest in cellular hyperthermia and innovative ways of measuring it must be found. Most of the research in the MH field is performed by chemists and physicists, but a strong involvement of biologists and biochemists is crucial to understanding the fundamental cellular mechanisms of interactions between magnetic particles and cells. Therefore, designing optimal MH approaches of high precision and efficiency without side effects is necessary. It is like in a modern war: instead of using a lot of low-precision projectiles, you can use a few with high targeting precision. High local heat waves and kinetic disrupting effects targeting the most thermally and structurally sensitive parts of the cell will probably be the magic bullet in MH. However, until there is a long and challenging process, material and design optimization steps in nanoparticle production should be carried out continuously. On the other hand, a systematic and complex review of all clinical and preclinical experimental results, including the vast number of in vitro and in vivo experimental results, is needed to provide focused research directions. This may be possible with the new AI algorithms. Therefore, a unified perspective on the SAR at the macroscopic and cellular levels is more than welcome.

Funding

This research study was funded by the Romanian Ministry of Research, Innovation and Digitalization, Core Program of the National Institute of Materials Physics under Project PN23080101.

Institutional Review Board Statement

Not applicable.

Informed Consent Statement

Not applicable.

Data Availability Statement

Data are contained within the article.

Conflicts of Interest

The author declares no conflicts of interest.

References

  1. Moon, J.; Kitty, I.; Renata, K.; Qin, S.; Zhao, F.; Kim, W. DNA Damage and Its Role in Cancer Therapeutics. Int. J. Mol. Sci. 2023, 24, 4741. [Google Scholar] [CrossRef] [PubMed]
  2. Kay, J.; Thadhani, E.; Samson, L.; Engelward, B. Inflammation-Induced DNA Damage, Mutations and Cancer. DNA Repair 2019, 83, 102673. [Google Scholar] [CrossRef] [PubMed]
  3. Chatterjee, N.; Walker, G.C. Mechanisms of DNA Damage, Repair, and Mutagenesis. Environ. Mol. Mutagen. 2017, 58, 235–263. [Google Scholar] [CrossRef] [PubMed]
  4. Greten, F.R.; Grivennikov, S.I. Inflammation and Cancer: Triggers, Mechanisms and Consequences. Immunity 2019, 51, 27–41. [Google Scholar] [CrossRef]
  5. Huang, R.; Zhou, P.-K. DNA Damage Repair: Historical Perspectives, Mechanistic Pathways, and Clinical Translation for Targeted Cancer Therapy. Signal Transduct. Target. Ther. 2021, 6, 254. [Google Scholar] [CrossRef]
  6. Li, L.; Guan, Y.; Chen, X.; Yang, J.; Cheng, Y. DNA Repair Pathways in Cancer Therapy and Resistance. Front. Pharmacol. 2021, 11, 629266. [Google Scholar] [CrossRef]
  7. Imashiro, C.; Takeshita, H.; Morikura, T.; Miyata, S.; Takemura, K.; Komotori, J. Development of Accurate Temperature Regulation Culture System with Metallic Culture Vessel Demonstrates Different Thermal Cytotoxicity in Cancer and Normal Cells. Sci. Rep. 2021, 11, 21466. [Google Scholar] [CrossRef]
  8. De Maio, A.; Alfieri, G.; Mattone, M.; Ghanouni, P.; Napoli, A. High-Intensity Focused Ultrasound Surgery for Tumor Ablation: A Review of Current Applications. Radiol. Imaging Cancer 2023, 6, e230074. [Google Scholar] [CrossRef]
  9. Ji, Y.; Zhu, J.; Zhu, L.; Zhu, Y.; Zhao, H. High-Intensity Focused Ultrasound Ablation for Unresectable Primary and Metastatic Liver Cancer: Real-World Research in a Chinese Tertiary Center with 275 Cases. Front. Oncol. 2020, 10, 519164. [Google Scholar] [CrossRef]
  10. Schena, E.; Saccomandi, P.; Fong, Y. Laser Ablation for Cancer: Past, Present and Future. J. Funct. Biomater. 2017, 8, 19. [Google Scholar] [CrossRef]
  11. Fan, Y.; Xu, L.; Liu, S.; Li, J.; Xia, J.; Qin, X.; Li, Y.; Gao, T.; Tang, X. The State-of-the-Art and Perspectives of Laser Ablation for Tumor Treatment. Cyborg Bionic Syst. 2024, 5, 0062. [Google Scholar] [CrossRef] [PubMed]
  12. Adibzadeh, F.; Sumser, K.; Curto, S.; Yeo, D.T.B.; Shishegar, A.A.; Paulides, M.M. Systematic review of pre-clinical and clinical devices for magnetic resonance-guided radiofrequency hyperthermia. Int. J. Hyperth. 2020, 37, 15–27. [Google Scholar] [CrossRef] [PubMed]
  13. Chang, D.; Lim, M.; Goos, J.A.C.M.; Qiao, R.; Ng, Y.Y.; Mansfeld, F.M.; Jackson, M.; Davis, T.P.; Kavallaris, M. Biologically Targeted Magnetic Hyperthermia: Potential and Limitations. Front. Pharmacol. 2018, 9, 831. [Google Scholar] [CrossRef]
  14. Dutz, S.; Hergt, R. Magnetic Particle Hyperthermia—A Promising Tumour Therapy? Nanotechnology 2014, 25, 452001. [Google Scholar] [CrossRef]
  15. Feddersen, T.V.; Hernandez-Tamames, J.A.; Franckena, M.; van Rhoon, G.C.; Paulides, M.M. Clinical Performance and Future Potential of Magnetic Resonance Thermometry in Hyperthermia. Cancers 2021, 13, 31. [Google Scholar] [CrossRef]
  16. Gavilán, H.; Kumar Avugadda, S.; Fernández-Cabada, T.; Soni, N.; Cassani, M.; Mai, B.T.; Chantrell, R.; Pellegrino, T. Magnetic Nanoparticles and Clusters for Magnetic Hyperthermia: Optimizing Their Heat Performance and Developing Combinatorial Therapies to Tackle Cancer. Chem. Soc. Rev. 2021, 50, 11614–11667. [Google Scholar] [CrossRef]
  17. Kok, H.P.; Cressman, E.N.K.; Ceelen, W.; Brace, C.L.; Ivkov, R.; Grüll, H.; ter Haar, G.; Wust, P.; Crezee, J. Heating Technology for Malignant Tumors: A Review. Int. J. Hyperth. 2020, 37, 711–741. [Google Scholar] [CrossRef]
  18. Ribeiro, T.P.; Moreira, J.A.; Monteiro, F.J.; Laranjeira, M.S. Nanomaterials in Cancer: Reviewing the Combination of Hyperthermia and Triggered Chemotherapy. J. Control. Release 2022, 347, 89–103. [Google Scholar] [CrossRef]
  19. Shirvalilou, S.; Khoei, S.; Esfahani, A.J.; Kamali, M.; Shirvaliloo, M.; Sheervalilou, R.; Mirzaghavami, P. Magnetic Hyperthermia as an Adjuvant Cancer Therapy in Combination with Radiotherapy versus Radiotherapy Alone for Recurrent/Progressive Glioblastoma: A Systematic Review. J. Neurooncol. 2021, 152, 419–428. [Google Scholar] [CrossRef]
  20. Price, P.M.; Mahmoud, W.E.; Al-Ghamdi, A.A.; Bronstein, L.M. Magnetic Drug Delivery: Where the Field Is Going. Front. Chem. 2018, 6, 619. [Google Scholar] [CrossRef]
  21. Pusta, A.; Tertis, M.; Crăciunescu, I.; Turcu, R.; Mirel, S.; Cristea, C. Recent Advances in the Development of Drug Delivery Applications of Magnetic Nanomaterials. Pharmaceutics 2023, 15, 1872. [Google Scholar] [CrossRef] [PubMed]
  22. Toderascu, L.I.; Sima, L.E.; Orobeti, S.; Florian, P.E.; Icriverzi, M.; Maraloiu, V.-A.; Comanescu, C.; Iacob, N.; Kuncser, V.; Antohe, I.; et al. Synthesis and anti-melanoma activity of L-cysteine-coated iron oxide nanoparticles loaded with doxorubicin. Nanomaterials 2023, 13, 621. [Google Scholar] [CrossRef] [PubMed]
  23. Reddy, L.H.; Arias, J.L.; Nicolas, J.; Couvreur, P. Magnetic Nanoparticles: Design and Characterization, Toxicity and Biocompatibility, Pharmaceutical and Biomedical Applications. Chem. Rev. 2012, 112, 5818–5878. [Google Scholar] [CrossRef] [PubMed]
  24. Kush, P.; Kumar, P.; Singh, R.; Kaushik, A. Aspects of High-Performance and Bio-Acceptable Magnetic Nanoparticles for Biomedical Applications. Asian J. Pharm. Sci. 2021, 16, 704–737. [Google Scholar] [CrossRef]
  25. Bychkova, A.V.; Sorokina, O.N.; Rosenfeld, M.A.; Kovarski, A. Multifunctional biocompatible coatings on magnetic nanoparticles. Russ. Chem. Rev. 2012, 81, 1070–1083. [Google Scholar] [CrossRef]
  26. Atkinson, W.J.; Brezovich, I.A.; Chakraborty, D.P. Usable frequencies in hyperthermia with thermal seeds. IEEE Trans. Biomed. Eng. 1984, 31, 70. [Google Scholar] [CrossRef]
  27. Dutz, S.; Hergt, R. Magnetic Nanoparticle Heating and Heat Transfer on a Microscale: Basic Principles, Realities, and Physical Limitations of Hyperthermia for Tumour Therapy. Int. J. Hyperth. 2013, 29, 790–800. [Google Scholar] [CrossRef]
  28. de la Parte, B.H.; Rodrigo, I.; Gutiérrez-Basoa, J.; Correcher, S.I.; Mar Medina, C.; Echevarría-Uraga, J.J.; Garcia, J.A.; Plazaola, F.; García-Alonso, I. Proposal of New Safety Limits for In Vivo Experiments of Magnetic Hyperthermia Antitumor Therapy. Cancers 2022, 14, 3084. [Google Scholar] [CrossRef]
  29. Kwok, M.K.Y.; Maley, C.C.J.; Dworkin, A.; Hattersley, S.; Southern, P.; Pankhurst, Q.A. Nonspecific Eddy Current Heating in Magnetic Field Hyperthermia. Appl. Phys. Lett. 2023, 122, 240502. [Google Scholar] [CrossRef]
  30. Gu, Y.; Piñol, R.; Moreno-Loshuertos, R.; Brites, C.D.S.; Zeler, J.; Martínez, A.; Maurin-Pasturel, G.; Fernández-Silva, P.; Marco-Brualla, J.; Téllez, P.; et al. Local Temperature Increments and Induced Cell Death in Intracellular Magnetic Hyperthermia. ACS Nano 2023, 17, 6822–6832. [Google Scholar] [CrossRef]
  31. Li, J.; Tran, N.; Webster, T.J. Towards a Better Understanding of the Effects of the Magnetic Nanoparticles Size and Magnetic Field on Cellular Endocytosis. J. Phys. D Appl. Phys. 2020, 53, 175401. [Google Scholar] [CrossRef]
  32. Sabourian, P.; Yazdani, G.; Ashraf, S.S.; Frounchi, M.; Mashayekhan, S.; Kiani, S.; Kakkar, A. Effect of Physico-Chemical Properties of Nanoparticles on Their Intracellular Uptake. Int. J. Mol. Sci. 2020, 21, 8019. [Google Scholar] [CrossRef] [PubMed]
  33. Peng, Y.; Yang, Z.; Sun, H.; Li, J.; Lan, X.; Liu, S. Understanding Cellular Uptake, Localization, and Retention for Enhanced Disease Diagnosis and Therapy. Aging Dis. 2025, 16, 168–208. [Google Scholar] [CrossRef] [PubMed]
  34. Potrč, T.; Kralj, S.; Nemec, S.; Kocbek, P.; Erdani Kreft, M. The Shape Anisotropy of Magnetic Nanoparticles: An Approach to Cell-Type Selective and Enhanced Internalization. Nanoscale 2023, 15, 8611–8618. [Google Scholar] [CrossRef]
  35. Blanco-Andujar, C.; Ortega, D.; Southern, P.; Nesbitt, S.A.; Thanh, N.T.K.; Pankhurst, Q.A. Real-Time Tracking of Delayed-Onset Cellular Apoptosis Induced by Intracellular Magnetic Hyperthermia. Nanomedicine 2016, 11, 121–136. [Google Scholar] [CrossRef]
  36. Calatayud, M.P.; Soler, E.; Torres, T.E.; Campos-Gonzalez, E.; Junquera, C.; Ibarra, M.R.; Goya, G.F. Cell damage produced by magnetic fluid hyperthermia on microglial BV2 cells. Sci. Rep. 2017, 7, 8627. [Google Scholar] [CrossRef]
  37. Beola, L.; Asín, L.; Fratila, R.M.; Herrero, V.; de la Fuente, J.M.; Grazu, V.; Gutiérrez, L. Dual Role of Magnetic Nanoparticles as Intracellular Hotspots and Extracellular Matrix Disruptors Triggered by Magnetic Hyperthermia in 3D Cell Culture Models. ACS Appl. Mater. Interfaces 2018, 10, 44301–44313. [Google Scholar] [CrossRef]
  38. Hogan, K.J.; Perez, M.R.; Mikos, A.G. Extracellular Matrix Component-Derived Nanoparticles for Drug Delivery and Tissue Engineering. J. Control. Release 2023, 360, 888–912. [Google Scholar] [CrossRef]
  39. Chen, B.-W.; Chiu, G.-W.; He, Y.-C.; Huang, C.-Y.; Huang, H.-T.; Sung, S.-Y.; Hsieh, C.-L.; Chang, W.-C.; Hsu, M.-S.; Wei, Z.-H.; et al. Extracellular and Intracellular Intermittent Magnetic-Fluid Hyperthermia Treatment of SK-Hep1 Hepatocellular Carcinoma Cells Based on Magnetic Nanoparticles Coated with Polystyrene Sulfonic Acid. PLoS ONE 2021, 16, e0245286. [Google Scholar] [CrossRef]
  40. Hannon, G.; Bogdanska, A.; Volkov, Y.; Prina-Mello, A. Comparing the Effects of Intracellular and Extracellular Magnetic Hyperthermia on the Viability of BxPC-3 Cells. Nanomaterials 2020, 10, 593. [Google Scholar] [CrossRef]
  41. Kobayashi, S.; Ohki, A.; Tanoue, M.; Inaoka, Y.; Murase, K. Comparative Study of Extracellular and Intracellular Magnetic Hyperthermia Treatments Using Magnetic Particle Imaging. Open J. Appl. Sci. 2017, 7, 647–660. [Google Scholar] [CrossRef]
  42. Idiago-López, J.; Ferreira, D.; Asín, L.; Moros, M.; Armenia, I.; Grazú, V.; Fernandes, A.R.; Baptista, P.V.; Fratila, R.M. Membrane-Localized Magnetic Hyperthermia Promotes Intracellular Delivery of Cell-Impermeant Probes. Nanoscale 2024, 16, 15176–15195. [Google Scholar] [CrossRef] [PubMed]
  43. Fernández-Afonso, Y.; Ruta, S.; Páez-Rodríguez, A.; van Zanten, T.S.; Gleadhall, S.; Fratila, R.M.; Moros, M.; Morales, M.P.; Satoh, A.; Chantrell, R.W.; et al. Reversible Alignment of Nanoparticles and Intracellular Vesicles During Magnetic Hyperthermia Experiments. Adv. Funct. Mater. 2024, 34, 2405334. [Google Scholar] [CrossRef]
  44. Kim, D.-H.; Rozhkova, E.A.; Ulasov, I.V.; Bader, S.D.; Rajh, T.; Lesniak, M.S.; Novosad, V. Biofunctionalized Magnetic-Vortex Microdiscs for Targeted Cancer-Cell Destruction. Nat. Mater. 2009, 9, 165–171. [Google Scholar] [CrossRef]
  45. Zhang, E.; Kircher, M.F.; Koch, M.; Eliasson, L.; Goldberg, S.N.; Renström, E. Dynamic Magnetic Fields Remote-Control Apoptosis via Nanoparticle Rotation. ACS Nano 2014, 8, 3192–3201. [Google Scholar] [CrossRef]
  46. Naud, C.; Thébault, C.; Carrière, M.; Hou, Y.; Morel, R.; Berger, F.; Diény, B.; Joisten, H. Cancer treatment by magneto-mechanical effect of particles, a review. Nanoscale Adv. 2020, 2, 3632–3655. [Google Scholar] [CrossRef]
  47. Cheng, D.; Li, X.; Zhang, G.; Shi, H. Morphological Effect of Oscillating Magnetic Nanoparticles in Killing Tumor Cells. Nanoscale Res. Lett. 2014, 9, 195. [Google Scholar] [CrossRef]
  48. Nishita, M.; Park, S.-Y.; Nishio, T.; Kamizaki, K.; Wang, Z.; Tamada, K.; Takumi, T.; Hashimoto, R.; Otani, H.; Pazour, G.J.; et al. Ror2 Signaling Regulates Golgi Structure and Transport Through IFT20 for Tumor Invasiveness. Sci. Rep. 2017, 7, 1. [Google Scholar] [CrossRef]
  49. Leulmi, S.; Chauchet, X.; Morcrette, M.; Ortiz, G.; Joisten, H.; Sabon, P.; Livache, T.; Hou, Y.; Carrière, M.; Lequien, S.; et al. Triggering the Apoptosis of Targeted Human Renal Cancer Cells by the Vibration of Anisotropic Magnetic Particles Attached to the Cell Membrane. Nanoscale 2015, 7, 15904–15913. [Google Scholar] [CrossRef]
  50. Dieny, B.; Morel, R.; Joisten, H.; Naud, C.; Nicolas, A.; Visonà, A.; Obeïd, P.; Belin, S.; Berger, F. Magnetism for mechanobiology and related biomedical applications. Phys. Rev. Appl. 2025, 23, 010501. [Google Scholar] [CrossRef]
  51. Unni, M.; Uhl, A.M.; Savliwala, S.; Savitzky, B.H.; Dhavalikar, R.; Garraud, N.; Arnold, D.P.; Kourkoutis, L.F.; Andrew, J.S.; Rinaldi, C. Thermal Decomposition Synthesis of Iron Oxide Nanoparticles with Diminished Magnetic Dead Layer by Controlled Addition of Oxygen. ACS Nano 2017, 11, 2284–2303. [Google Scholar] [CrossRef] [PubMed]
  52. Fokina, V.; Wilke, M.; Dulle, M.; Ehlert, S.; Förster, S. Size Control of Iron Oxide Nanoparticles Synthesized by Thermal Decomposition Methods. J. Phys. Chem. C 2022, 126, 21356–21367. [Google Scholar] [CrossRef]
  53. Demessie, A.A.; Park, Y.; Singh, P.; Moses, A.S.; Korzun, T.; Sabei, F.Y.; Albarqi, H.A.; Campos, L.; Wyatt, C.R.; Farsad, K.; et al. An Advanced Thermal Decomposition Method to Produce Magnetic Nanoparticles with Ultrahigh Heating Efficiency for Systemic Magnetic Hyperthermia. Small Methods 2022, 6, 2200916. [Google Scholar] [CrossRef] [PubMed]
  54. Gavilan, H.; Rizzo, G.M.R.; Silvestri, N.; Mai, B.T.; Pellegrino, T. Scale-up approach for the preparation of magnetic ferrite nanocubes and other shapes with benchmark performance for magnetic hyperthermia applications. Nat. Protoc. 2023, 18, 783–809. [Google Scholar] [CrossRef]
  55. Nițică, S.; Fizeșan, I.; Dudric, R.; Barbu-Tudoran, L.; Pop, A.; Loghin, F.; Vedeanu, N.; Lucaciu, C.M.; Iacovita, C. A Fast, Reliable Oil-In-Water Microemulsion Procedure for Silica Coating of Ferromagnetic Zn Ferrite Nanoparticles Capable of Inducing Cancer Cell Death In Vitro. Biomedicines 2022, 10, 1647. [Google Scholar] [CrossRef]
  56. Bruschi, M.L.; Toledo, L.A.S. Pharmaceutical Applications of Iron-Oxide Magnetic Nanoparticles. Magnetochemistry 2019, 5, 50. [Google Scholar] [CrossRef]
  57. Arias, L.S.; Pessan, J.P.; Vieira, A.P.M.; Lima, T.M.T.; Delbem, A.C.B.; Monteiro, D.R. Iron Oxide Nanoparticles for Biomedical Applications: A Perspective on Synthesis, Drugs, Antimicrobial Activity, and Toxicity. Antibiotics 2018, 7, 46. [Google Scholar] [CrossRef]
  58. Li, B.; Chen, X.; Qiu, W.; Zhao, R.; Duan, J.; Zhang, S.; Pan, Z.; Zhao, S.; Guo, Q.; Qi, Y.; et al. Synchronous Disintegration of Ferroptosis Defense Axis via Engineered Exosome-Conjugated Magnetic Nanoparticles for Glioblastoma Therapy. Adv. Sci. 2022, 9, 2105451. [Google Scholar] [CrossRef]
  59. Soares, G.A.; Faria, J.V.C.; Pinto, L.A.; Prospero, A.G.; Pereira, G.M.; Stoppa, E.G.; Buranello, L.P.; Bakuzis, A.F.; Baffa, O.; Miranda, J.R.A. Long-Term Clearance and Biodistribution of Magnetic Nanoparticles Assessed by AC Biosusceptometry. Materials 2022, 15, 2121. [Google Scholar] [CrossRef]
  60. Vandendriessche, S.; Mattos, M.S.; Bialek, E.L.; Schuermans, S.; Proost, P.; Marques, P.E. Complement Activation Drives the Phagocytosis of Necrotic Cell Debris and Resolution of Liver Injury. Front. Immunol. 2024, 15, 1512470. [Google Scholar] [CrossRef]
  61. Coey, J.M.D. Magnetism and Magnetic Materials; Cambridge University Press: Cambridge, UK, 2010; ISBN 978-0-521-81614-4. [Google Scholar]
  62. Kuncser, V.; Palade, P.; Kuncser, A.; Greculeasa, S.; Schinteie, G. Engineering Magnetic Properties of Nanostructures via Size Effects and Interphase Interactions. In Size Effects in Nanostructures; Kuncser, V., Miu, L., Eds.; Springer Series in Materials Science; Springer: Berlin/Heidelberg, Germany, 2014; pp. 169–237. [Google Scholar] [CrossRef]
  63. Bedanta, S.; Kleemann, W. Supermagnetism. J. Phys. D Appl. Phys. 2009, 42, 013001. [Google Scholar] [CrossRef]
  64. Rajan, A.; Sahu, N.K. Review on Magnetic Nanoparticle-Mediated Hyperthermia for Cancer Therapy. J. Nanopart. Res. 2020, 22, 319. [Google Scholar] [CrossRef]
  65. Rosensweig, R.E. Heating Magnetic Fluid with Alternating Magnetic Field. J. Magn. Magn. Mater. 2002, 252, 370–374. [Google Scholar] [CrossRef]
  66. Rognin, E.; Brun, P.; Sauvage, E.; Lacombe, J. Computation of Eddy Currents in Highly Conductive Particles Dispersed in a Moderately Conductive Matrix. Int. J. Appl. Electromagn. Mech. 2017, 53, 2241. [Google Scholar] [CrossRef]
  67. Wheeler, H.A. Formulas for the Skin Effect. Proc. IRE 1942, 30, 412–426. [Google Scholar] [CrossRef]
  68. Available online: https://www.rfcafe.com/references/electrical/cond-high-freq.htm (accessed on 14 January 2025).
  69. Iacob, N.; Schinteie, G.; Palade, P.; Kuncser, V. Approach for an Improved Experimental Evaluation of the Specific Absorption Rate in Magnetic Fluid Hyperthermia. J. Nanopart. Res. 2015, 17, 190. [Google Scholar] [CrossRef]
  70. Coïsson, M.; Barrera, G.; Appino, C.; Celegato, F.; Martino, L.; Safronov, A.P.; Kurlyandskaya, G.V.; Tiberto, P. Specific Loss Power Measurements by Calorimetric and Thermal Methods on γ-Fe2O3 Nanoparticles for Magnetic Hyperthermia. J. Magn. Magn. Mater. 2019, 473, 403–409. [Google Scholar] [CrossRef]
  71. Takeuchi, M.; Sakai, T.; Andocs, G.; Takao, K.; Nagaoka, R.; Hasegawa, H. Temperature Elevation in Tissue Detected In Vivo Based on Statistical Analysis of Ultrasonic Scattered Echoes. Sci. Rep. 2020, 10, 9030. [Google Scholar] [CrossRef]
  72. Sun, Y.; Kong, M.; Ke, J.; Yuan, W.; Wen, C.; Gu, Y.; Luo, S.; Feng, W. Nanothermometer for In Vivo Temperature Detection with High Spatial Resolution Based on Core–Shell Rare Earth Nanoparticles. ACS Appl. Nano Mater. 2023, 6, 23173–23183. [Google Scholar] [CrossRef]
  73. Valdés, D.P.; Torres, T.E.; Maldonado, A.C.M.; Urretavizcaya, G.; Nadal, M.S.; Mansilla, M.V.; Zysler, R.D.; Goya, G.F.; Biasi, E.D.; Lima, E., Jr. Thermographical Method to Assess the Performance of Magnetic Nanoparticles in Hyperthermia Experiments Through Spatiotemporal Temperature Profiles. Phys. Rev. Appl. 2023, 19, 014042. [Google Scholar] [CrossRef]
  74. Kallumadil, M.; Tada, M.; Nakagawa, T.; Abe, M.; Southern, P.; Pankhurst, Q.A. Suitability of Commercial Colloids for Magnetic Hyperthermia. J. Magn. Magn. Mater. 2009, 321, 1509–1513. [Google Scholar] [CrossRef]
  75. Iacob, N.; Schinteie, G.; Palade, P.; Ticos, C.M.; Kuncser, V. Stepped Heating Procedure for Experimental SAR Evaluation of Ferrofluids. Eur. Phys. J. E 2015, 38, 57. [Google Scholar] [CrossRef] [PubMed]
  76. Carrey, J.; Mehdaoui, B.; Respaud, M. Simple Models for Dynamic Hysteresis Loop Calculations of Magnetic Single-Domain Nanoparticles: Application to Magnetic Hyperthermia Optimization. J. Appl. Phys. 2011, 109, 083921. [Google Scholar] [CrossRef]
  77. Beković, M.; Trlep, M.; Jesenik, M.; Gorican, V.; Hamler, A. An Experimental Study of Magnetic-Field and Temperature Dependence on Magnetic Fluid’s Heating Power. J. Magn. Magn. Mater. 2013, 331, 264–268. [Google Scholar] [CrossRef]
  78. Gas, P.; Kurgan, E. Cooling Effects Inside Water-Cooled Inductors for Magnetic Fluid Hyperthermia. IEEE Trans. Magn. 2017, 53, 1528–1534. [Google Scholar] [CrossRef]
  79. Available online: https://www.calculator.net/dew-point-calculator.html (accessed on 15 January 2025).
  80. Li, J.; Ye, Y.; Lin, Z.; Wang, Z.; Chen, Y.; Li, G.; Ouyang, Z.; Li, J. Application of a New Self-Regulating Temperature Magnetic Material Fe83Zr10B7 in Magnetic Induction Hyperthermia. Int. J. Hyperth. 2023, 40, 2211269. [Google Scholar] [CrossRef]
  81. Vicentini, M.; Ferrero, R.; Manzin, A. Influence of Coil Geometry, Supply Conditions and Nanoparticle Heating Properties on Magnetic Hyperthermia in Mouse Models. Int. J. Therm. Sci. 2024, 203, 109151. [Google Scholar] [CrossRef]
  82. Makridis, A.; Curto, S.; van Rhoon, G.C.; Samaras, T.; Angelakeris, M. A Standardisation Protocol for Accurate Evaluation of Specific Loss Power in Magnetic Hyperthermia. J. Phys. D Appl. Phys. 2019, 52, 255001. [Google Scholar] [CrossRef]
  83. García-Soriano, D.; Milán-Rois, P.; Lafuente-Gómez, N.; Rodríguez-Díaz, C.; Navío, C.; Somoza, Á.; Salas, G. Multicore Iron Oxide Nanoparticles for Magnetic Hyperthermia and Combination Therapy Against Cancer Cells. J. Colloid Interface Sci. 2024, 670, 73–85. [Google Scholar] [CrossRef]
  84. Tithito, T.; Sillapaprayoon, S.; Chantho, V.; Pimtong, W.; Thongbunchoo, J.; Charoenphandhu, N.; Krishnamra, N.; Yong, N.; Lert-itthiporn, A.; Maneeprakorn, W.; et al. Evaluation of Magnetic Hyperthermia, Drug Delivery and Biocompatibility of Trace Element Co-Doped Hydroxyapatite Combined with Mn–Zn Ferrite for Bone Tissue Applications. RSC Adv. 2024, 14, 29242–29253. [Google Scholar] [CrossRef]
  85. Zeleňáková, A.; Nagy, Ľ.; Hrubovčák, P.; Barutiak, M.; Lisnichuk, M.; Huntošová, V.; Mrakovič, A.; Gerina, M.; Zákutná, D. Cobalt-Ferrite Nano-Cubes for Magnetic Hyperthermia Applications. J. Alloys Compd. 2024, 989, 174415. [Google Scholar] [CrossRef]
  86. Soetaert, F.; Kandala, S.K.; Bakuzis, A.; Ivkov, R. Experimental Estimation and Analysis of Variance of the Measured Loss Power of Magnetic Nanoparticles. Sci. Rep. 2017, 7, 6661. [Google Scholar] [CrossRef]
  87. Schinteie, G.; Palade, P.; Vekas, L.; Iacob, N.; Bartha, C.; Kuncser, V. Volume Fraction Dependent Magnetic Behaviour of Ferrofluids for Rotating Seal Applications. J. Phys. D Appl. Phys. 2013, 46, 395501. [Google Scholar] [CrossRef]
  88. Chalkidou, A.; Simeonidis, K.; Angelakeris, M.; Samaras, T.; Martinez-Boubeta, C.; Balcells, L.; Papazisis, K.; Dendrinou-Samara, C.; Kalogirou, O. In vitro application of Fe/MgO nanoparticles as magnetically mediated hyperthermia agents for cancer treatment. J. Magn. Magn. Mater. 2011, 323, 775–780. [Google Scholar] [CrossRef]
  89. Iglesias, C.A.M.; Araújo, J.C.R.; Xavier, J.; Anders, R.L.; de Araújo, J.M.; da Silva, R.B.; Soares, J.M.; Brito, E.L.; Streck, L.; Fonseca, J.L.C.; et al. Magnetic Nanoparticles Hyperthermia in a Non-Adiabatic and Radiating Process. Sci. Rep. 2021, 11, 11867. [Google Scholar] [CrossRef]
  90. Coïsson, M.; Barrera, G.; Celegato, F.; Martino, L.; Vinai, F.; Martino, P.; Ferraro, G.; Tiberto, P. Specific Absorption Rate Determination of Magnetic Nanoparticles Through Hyperthermia Measurements in Non-Adiabatic Conditions. J. Magn. Magn. Mater. 2016, 415, 2–7. [Google Scholar] [CrossRef]
  91. Ruta, S.; Fernández-Afonso, Y.; Rannala, S.E.; Morales, M.P.; Veintemillas-Verdaguer, S.; Jones, C.; Gutiérrez, L.; Chantrell, R.W.; Serantes, D. Beyond Newton’s Law of Cooling in Evaluating Magnetic Hyperthermia Performance: A Device-Independent Procedure. Nanoscale Adv. 2024, 6, 4207. [Google Scholar] [CrossRef]
  92. Natividad, E.; Castro, M.; Mediano, A. Accurate Measurement of the Specific Absorption Rate Using a Suitable Adiabatic Magnetothermal Setup. Appl. Phys. Lett. 2008, 92, 093116. [Google Scholar] [CrossRef]
  93. Lázaro, M.; Sola-Leyva, A.; Jimenez-Carretero, M.; Carrasco Jiménez, M.P.; Delgado, Á.V.; Iglesias, G.R. The Role of Biocompatible Coatings of Magnetic Nanorods on Their Thermal Response in Hyperthermia: Consequences on Tumor Cell Survival. J. Drug Deliv. Sci. Technol. 2024, 95, 105622. [Google Scholar] [CrossRef]
  94. Guibert, C.; Fresnais, J.; Peyre, V.; Dupuis, V. Magnetic Fluid Hyperthermia Probed by Both Calorimetric and Dynamic Hysteresis Measurements. J. Magn. Magn. Mater. 2017, 421, 384–392. [Google Scholar] [CrossRef]
  95. Coïsson, M.; Barrera, G.; Celegato, F.; Martino, L.; Kane, S.N.; Raghuvanshi, S.; Vinai, F.; Tiberto, P. Hysteresis Losses and Specific Absorption Rate Measurements in Magnetic Nanoparticles for Hyperthermia Applications. Biochim. Biophys. Acta 2017, 1861, 1545–1558. [Google Scholar] [CrossRef] [PubMed]
  96. Garaio, E.; Collantes, J.M.; Garcia, J.A.; Plazaola, F.; Mornet, S.; Couillaud, F.; Sandre, O. A Wide-Frequency Range AC Magnetometer to Measure the Specific Absorption Rate in Nanoparticles for Magnetic Hyperthermia. J. Magn. Magn. Mater. 2014, 368, 432–437. [Google Scholar] [CrossRef]
  97. Rodrigo, I.; Castellanos-Rubio, I.; Garaio, E.; Arriortua, O.K.; Insausti, M.; Orue, I.; Garcia, J.A.; Plazaola, F. Exploring the Potential of Dynamic Hysteresis Loops via High Field, High Frequency, and Temperature-Adjustable AC Magnetometer for Magnetic Hyperthermia Characterization. Int. J. Hyperth. 2020, 37, 976–991. [Google Scholar] [CrossRef]
  98. Sámano, A.H.; Rosales, S.; Mazon, E.E.; Casillas, N.; Topete, A.; Paz, J.A.; Quintero, L.H.; Estrada, J.C.; Cano, M.E. A Dynamic Hysteresis Meter for Studying Ferrofluids Designed for Magnetic Hyperthermia. Meas. Sci. Technol. 2020, 31, 055902. [Google Scholar] [CrossRef]
  99. Zapata, J.C.; Restrepo, J. Dynamic Hysteretic Properties and Specific Loss Power of Magnetic Nanoparticles in a Viscous Medium at Different Thermal Baths. AIP Adv. 2023, 13, 105110. [Google Scholar] [CrossRef]
  100. Glöck, G.; Hergt, R.; Zeisberger, M.; Dutz, S.; Nagel, S.; Weitschies, W. The Effect of Field Parameters, Nanoparticle Properties, and Immobilization on the Specific Heating Power in Magnetic Particle Hyperthermia. J. Phys. Condens. Matter 2006, 18, S2935–S2949. [Google Scholar] [CrossRef]
  101. Nakamura, K.; Ueda, K.; Tomitaka, A.; Yamada, T.; Takemura, Y. Self-Heating Temperature and AC Hysteresis of Magnetic Iron Oxide Nanoparticles and Their Dependence on Secondary Particle Size. IEEE Trans. Magn. 2013, 49, 240–243. [Google Scholar] [CrossRef]
  102. Ognjanović, M.; Stanković, D.M.; Jaćimović, Ž.K.; Kosović-Perutović, M.; Dojčinović, B.; Antić, B. The Effect of Surface-Modifier of Magnetite Nanoparticles on Electrochemical Detection of Dopamine and Heating Efficiency in Magnetic Hyperthermia. J. Alloys Compd. 2021, 884, 161075. [Google Scholar] [CrossRef]
  103. Ferreira-Filho, V.C.; Morais, B.; Vieira, B.J.C.; Waerenborgh, J.C.; Carmezim, M.J.; Tóth, C.N.; Même, S.; Lacerda, S.; Jaque, D.; Sousa, C.T.; et al. Influence of SPION Surface Coating on Magnetic Properties and Theranostic Profile. Molecules 2024, 29, 1824. [Google Scholar] [CrossRef]
  104. Vassallo, M.; Martella, D.; Barrera, G.; Celegato, F.; Coïsson, M.; Ferrero, R.; Olivetti, E.S.; Troia, A.; Sözeri, H.; Parmeggiani, C.; et al. Improvement of Hyperthermia Properties of Iron Oxide Nanoparticles by Surface Coating. ACS Omega 2023, 8, 2143–2154. [Google Scholar] [CrossRef]
  105. Khan, F.; Lahiri, B.B.; Srujana, M.; Vidya, R.; Philip, J. Induction Heating of Magnetic Nanoparticles: Role of Thermo-Physical Properties of the Coating Moieties. Colloids Surf. A Physicochem. Eng. Asp. 2024, 692, 133982. [Google Scholar] [CrossRef]
  106. Osaci, M.; Cacciola, M. About the Influence of the Colloidal Magnetic Nanoparticles Coating on the Specific Loss Power in Magnetic Hyperthermia. J. Magn. Magn. Mater. 2021, 519, 167451. [Google Scholar] [CrossRef]
  107. Rennick, J.J.; Johnston, A.P.R.; Parton, R.G. Key Principles and Methods for Studying the Endocytosis of Biological and Nanoparticle Therapeutics. Nat. Nanotechnol. 2021, 16, 266–276. [Google Scholar] [CrossRef] [PubMed]
  108. Patel, H.; Upadhyay, R.V.; Parekh, K.; Reis, D.; Oliveira, C.L.P.; Neto, A.M.F. Optimized Mn0.5Zn0.5Fe2O4 Nanoflowers Based Magnetic Fluids for Potential Biomedical Applications. J. Magn. Magn. Mater. 2024, 590, 171656. [Google Scholar] [CrossRef]
  109. Bejko, M.; Al Yaman, Y.; Keyes, A.; Bagur, A.; Rosa, P.; Gayot, M.; Weill, F.; Mornet, S.; Sandre, O. Structure-Function Relationship of Iron Oxide Nanoflowers: Optimal Sizes for Magnetic Hyperthermia Depending on Alternating Magnetic Field Conditions. ChemPhysChem 2024, 25, e202400023. [Google Scholar] [CrossRef]
Figure 1. Localization of magnetic nanoparticles in both intra- and extracellular space. Under high- and low-frequency magnetic fields, particles generate heat, mechanical vibrations, and oscillations.
Coatings 15 00345 g001
Figure 2. Neel and Brownian relaxation mechanisms in SPM-NPs. Hysteresis loop in Stoner–Wohlfarth model for applying magnetic field parallel with EA ( α = 0 ).
Coatings 15 00345 g002
Disclaimer/Publisher’s Note: The statements, opinions and data contained in all publications are solely those of the individual author(s) and contributor(s) and not of MDPI and/or the editor(s). MDPI and/or the editor(s) disclaim responsibility for any injury to people or property resulting from any ideas, methods, instructions or products referred to in the content.

