Article

Preparation and Photocatalytic Performance of Silver-Loaded Micro-Arc Oxidation TiO2 Coating

1
School of Vanadium and Titanium, Panzhihua University, Panzhihua 617000, China
2
Panzhihua University Library, Panzhihua University, Panzhihua 617000, China
3
Key Laboratory of Green Chemistry, Sichuan Institutes of Higher Education, Zigong 643000, China
*
Author to whom correspondence should be addressed.
Coatings 2025, 15(3), 272; https://doi.org/10.3390/coatings15030272
Submission received: 31 December 2024 / Revised: 20 February 2025 / Accepted: 24 February 2025 / Published: 25 February 2025
(This article belongs to the Special Issue Coatings as Key Materials in Catalytic Applications)

Abstract

:
Using a Ti6Al4V (TC4) titanium alloy plate as a substrate, micro-arc oxidation technology was applied at an oxidation time of 3.5 min and a voltage of 480 V, 495 V, and 510 V. A TiO2–containing ceramic layer was prepared on the surface of the TC4 alloy, and the TiO2–containing coating was doped with silver ions. The surface microstructure, phase structure, and photocatalytic performance of ceramic coatings before and after doping with silver ions were analyzed using instruments such as X-ray diffraction (XRD), energy dispersive spectroscopy (EDS), and scanning electron microscopy (SEM). The results showed that as the oxidation voltage increased, the number of large pores first decreased and then increased. At a voltage of 495 V, the total area of various pores reached 45–50 μm2. After the voltage rose to 510 V, the maximum pore area decreased. TiO2 exists in the surface pores of the morphology in the form of rutile, and the loading of silver ions further enhances its photocatalytic performance. The degradation rate of methyl orange by undoped silver ion samples can reach 15.5%, and the degradation rate of methyl orange can reach about 31% when 4 g/L Ag2O is added to the electrolyte. Increasing the concentration of doped silver ions can enhance the degradation rate of methyl orange.

1. Introduction

Photocatalytic technology is a technique that converts light energy into usable energy, and sunlight is also infinite. Most photocatalysts developed using photocatalytic technology are semiconductor materials, which have the advantages of a high efficiency in degrading organic matter in wastewater, simple manufacturing process, and low cost [1]. After Fujishima and Honda discovered the phenomenon of TiO2 decomposing water under light radiation [2], many scientists began to study in this direction. In 1976, Garey et al. achieved the degradation of polychlorinated biphenyls in water using titanium dioxide [3]. Research on semiconductors in photocatalysis has gradually become a focus. Due to the high efficiency and stability of semiconductor photocatalytic conversion, scientists have begun to search for materials that can be used as photocatalysts among numerous raw materials. Among them, TiO2 itself has become a popular material for photocatalyst research due to its excellent chemical stability, low production cost, and no toxicity [4]. Regarding research on TiO2, previously developed powdered TiO2 is mainly in powder form on photocatalysts. After use, it was found that the powder is difficult to recycle and can cause environmental pollution. Therefore, a reusable solid photocatalyst is sought to meet the current high requirements. Micro-arc oxidation technology can generate thin films on the surfaces of titanium alloys, magnesium alloys, and aluminum alloys, and the thin films generated from titanium alloys contain TiO2, which has photocatalytic activity [5]. TC4, as a titanium alloy, has excellent mechanical properties and can generate TiO2 coatings in situ on its surface through micro-arc oxidation and other methods. The coating is firmly bonded to the substrate and is not easily peeled off. The energy band of semiconductor materials consists of three parts: valence band, conduction band, and bandgap [6]. Photocatalytic reactions can convert solar radiation into chemical energy and have redox properties. When TiO2 receives light energy greater than its bandgap energy, electrons e- in the valence band absorb light energy and transition to the conduction band, forming electron vacancies h+ in the original valence band, known as holes. After a series of reactions, reactive oxygen species are generated on the surface of TiO2 [7], which can decompose metal ions and pollutants in wastewater into organic compounds. However, TiO2 photocatalysis also has drawbacks. Firstly, the bandgap width of TiO2 is narrow. Secondly, its photocatalytic performance is greatly influenced by the TiO2 crystal type. Studies have found that the refractive index of anatase crystals is higher than that of rutile crystals, and the photocatalytic efficiency is higher than that of rutile crystals. However, the stability of rutile crystals is higher than that of anatase crystals, and the anatase type will irreversibly transform into the rutile type at high temperatures [8]. To further improve photocatalytic performance, there are two main approaches: one is to broaden the bandgap of TiO2 by ion doping [9,10,11,12], and the other is to achieve stable formation of rutile TiO2 through special means [13,14,15]. Although metal/TiO2 photocatalysts have made great progress in photocatalytic reactions, there are still some shortcomings. For example, the preparation of metal/TiO2 composite photocatalysts generally involves introducing metal components through physical or chemical means, and then immobilizing them in the form of clusters or nanoparticles on the surface of TiO2. However, due to the lack of effective regulation of the surface interface structure between the metal and semiconductor during catalyst preparation, poor interface contact between the metal and semiconductor often occurs, seriously hindering the transfer of interface charges and weakening the promoting effect of metal components on photocatalytic reactions, thereby affecting the activity and stability of the catalyst [16,17].
There are various methods for TiO2 modification, including metal doping, non-metal doping, dye photosensitization, semiconductor composites, and organic metal framework encapsulation [18]. These methods have a certain effect on improving the photocatalytic performance of TiO2, but there are also some problems, such as poor thermal stability of TiO2 photocatalysts prepared by the metal doping method, and excessive metal ions may become new electron hole pair recombination centers; the modification effect will be poor if the amount of metal ions is too low. [19]. The use of non-metallic doping to prepare photocatalysts makes it difficult for single component non-metallic doping to simultaneously expand the photoresponse range of TiO2 materials and improve quantum efficiency. Moreover, TiO2 doped with non-metallic elements has a weak oxidation ability, making it difficult to directly mineralize the material [20]. The sensitizers introduced by dye sensitization are mostly organic substances, which may cause secondary pollution during application. In addition, when using TiO2 for photosensitization, TiO2 is prone to cause photolysis of dyes [21]. The preparation of organic metal frameworks for photocatalysts requires strict laboratory environments, which limits their practical applications; moreover, its stability is poor in actual extreme environments [22]. Compared with the preparation, doping, and composite methods of other TiO2 materials, the TiO2 oxide film grown directly “In Situ” on the surface of the Ti alloy substrate by micro-arc oxidation (MAO) is firmly loaded, has good vibration resistance, can increase the specific surface area of the coating, and can be used for ultrasonic catalysis and photoacoustic combined catalysis of supported catalysts. It has strong processability and a great development space in the field of photocatalytic reactor design. The preparation of TiO2 film by the MAO process can be directly designed for morphology, and is easy to modify by doping, composite, etc., making it an excellent photocatalytic material. In addition, the migration of photogenerated carriers after the deposition of precious metals will redistribute charges on the “precious metal-TiO2”, with negative charges distributed on the surface of the precious metal and positive charges distributed on the surface of TiO2. The intermediate bandgap will create a Schottky energy barrier, forming a trap for capturing electrons and preventing the recombination of electron hole pairs. Precious metals typically deposit on the surface of TiO2, thereby modifying semiconductors, altering charge distribution, and affecting photocatalytic performance. Shi Hongyu et al. further enhanced the photocatalytic performance of titanium dioxide particles by doping with Ag [23].
This study used TC4 as the substrate and Ag2O as the silver ion additive to prepare a Ag–TiO2 composite coating on the surface of the substrate using micro-arc oxidation technology. The effect of the coating on the photocatalytic degradation of methyl orange was explored, providing new ideas for the preparation of solid photocatalysts.

2. Materials and Methods

2.1. TC4 Titanium Alloy Pretreatment

The TC4 titanium alloy plate was pretreated into rectangular sheets with a size of 40 mm × 10 mm. The titanium alloy sheet was polished step by step with 600 grit, 800 grit, and 1000 grit sandpaper, and then cleaned before use.

2.2. Configuration of Electrolyte

The electrolyte is a composite system composed of sodium phosphate, sodium silicate, and sodium meta-aluminate. The formula consists of 5.5 g/L sodium silicate, 5 g/L sodium phosphate, and 0.5 g/L sodium meta-aluminate, with the addition of 4 mL/L glycerol as the base electrolyte. Then, 2 g/L, 3 g/L, and 4 g/L of Ag2O were added to this basic electrolyte to prepare the silver-loaded micro-arc oxidation electrolyte.

2.3. Micro-Arc Oxidation Treatment

Using a TC4 titanium alloy sheet as an anode and a graphite sheet as a cathode, an AIYS750-15A pulse power (Tianjin Mingruichuang Electronic Technology Co., Ltd., Tianjin, China) supply was used for micro-arc oxidation of TC4 titanium alloy. The fixed current was 1 A; the duty cycle was 30%; the frequency was 500 Hz; the oxidation time was 3.5 min; and the oxidation voltages were 480 V, 495 V, and 510 V. A mixture of ice and water was used to cool the electrolyte during micro-arc oxidation. After oxidation, the surface was rinsed with deionized water to remove salt components from the electrolyte, and blow-dried for later use.

2.4. Photocatalytic Experiment

The experiment of photocatalytic degradation of methyl orange was conducted in a quartz test tube (70 mL). The light source used was a 300 W high-pressure mercury lamp (Shanghai Yaming Lighting Factory, Shanghai, China) with a maximum emission wavelength of 365 nm. The visible light excitation light source filtered out ultraviolet light below 380 nm through a color filter to obtain the mercury lamp. The mercury lamp was cooled by chilled water in a quartz jacket. The experiment used methyl orange as the degradation object and prepared a 10 mg/mL methyl orange solution. To prepare a 1 g/mL solution of methyl orange, weigh 0.5 g of methyl orange into a beaker; add 500 mL of deionized water to dissolve thoroughly; and transfer to a 500 mL volumetric flask for later use. To calculate the photocatalytic degradation rate of methyl orange, take 5 mL of 1 g/mL methyl orange solution in a beaker; dissolve it in 500 mL deionized water; and transfer it to a 500 mL volumetric flask. Take the 10 mg/mL methyl orange solution and measure its absorbance, denoted as A0. Take 3 culture dishes and pour 30 mL of 10 mg/mL methyl orange solution into each dish. Immerse the sample in the solution and place it in a visual colorimetric box. The distance between the lamp tube and the sample is 6–8 cm. Every half hour, use a dropper to draw a certain amount of methyl orange solution into the quartz colorimetric dish. Use a 722S visible light spectrophotometer to measure the absorbance, which is recorded as Aχ. Measure the absorbance of methyl orange solution samples taken at each time point three times and take the average value. Calculate the degradation degree of methyl orange based on the relationship between absorbance and concentration.

2.5. Material Characterization

2.5.1. Microscopic Morphology Observation and Analysis

The surface morphology of the micro-arc oxidation ceramic film layer was characterized using a TESCAN VEGAII scanning electron microscope (TESCAN Group a.s. Brno, Czech Republic), which was fully PC-controlled and equipped with a tungsten heating filament.

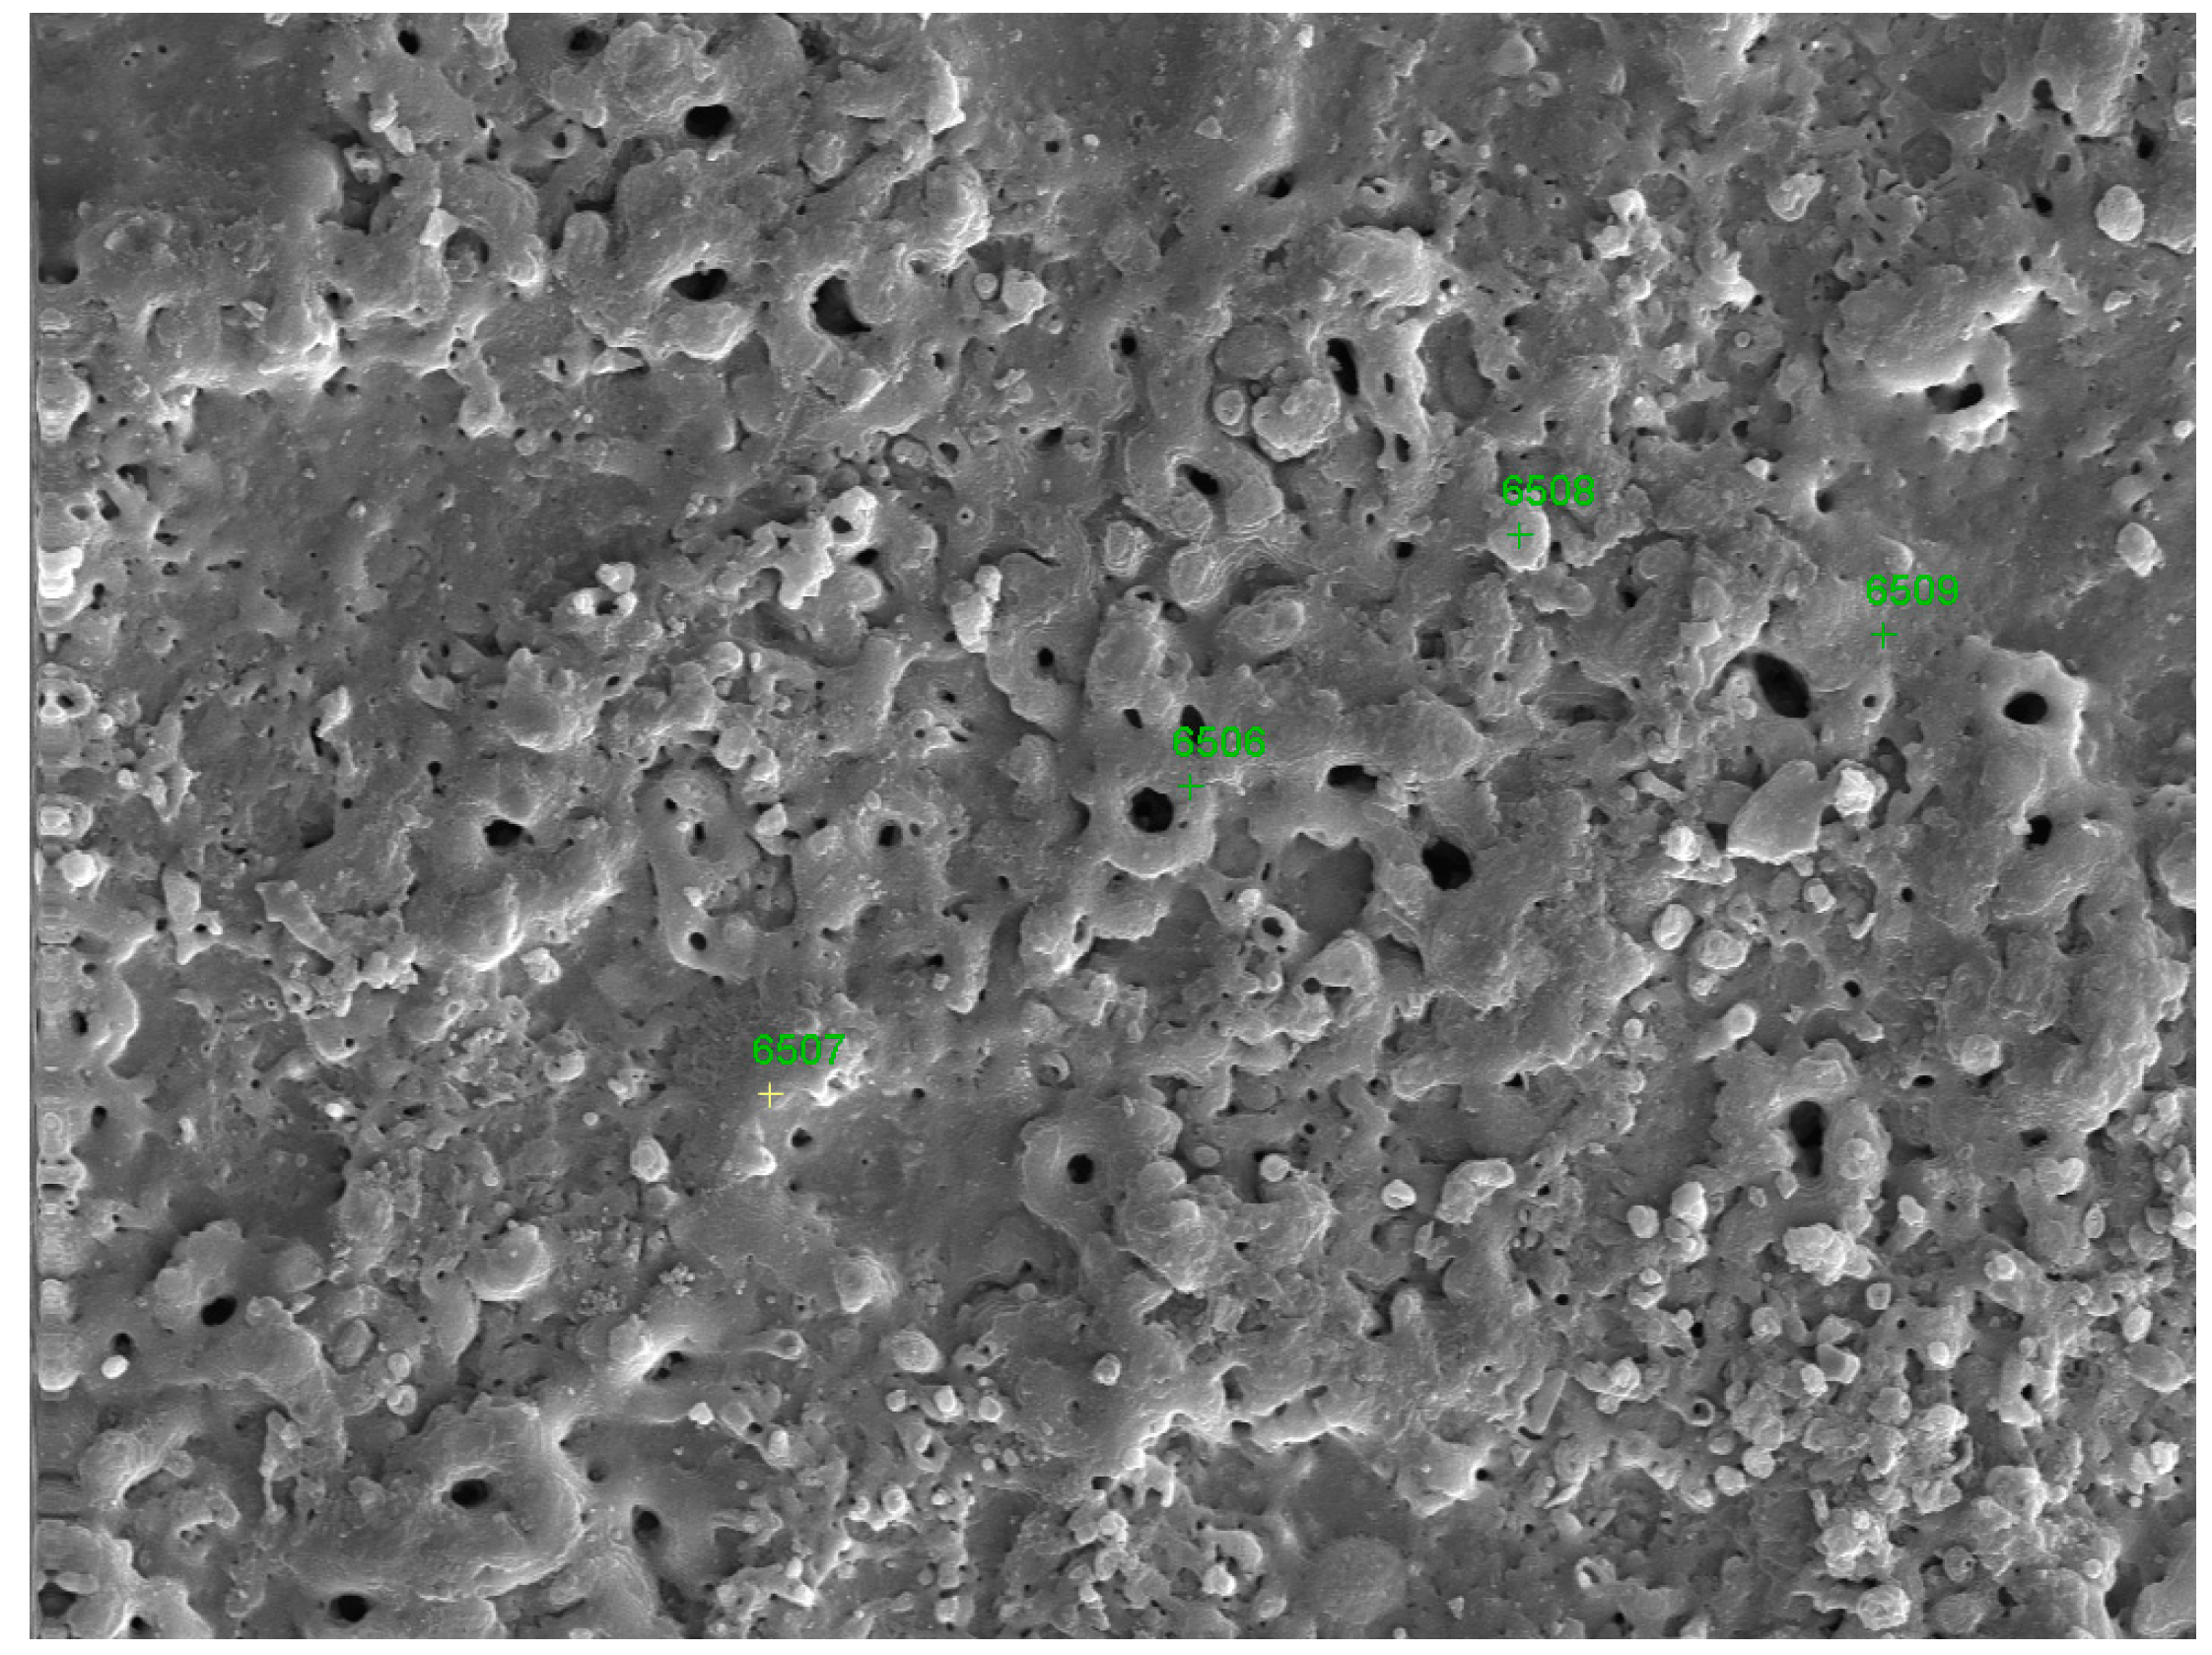
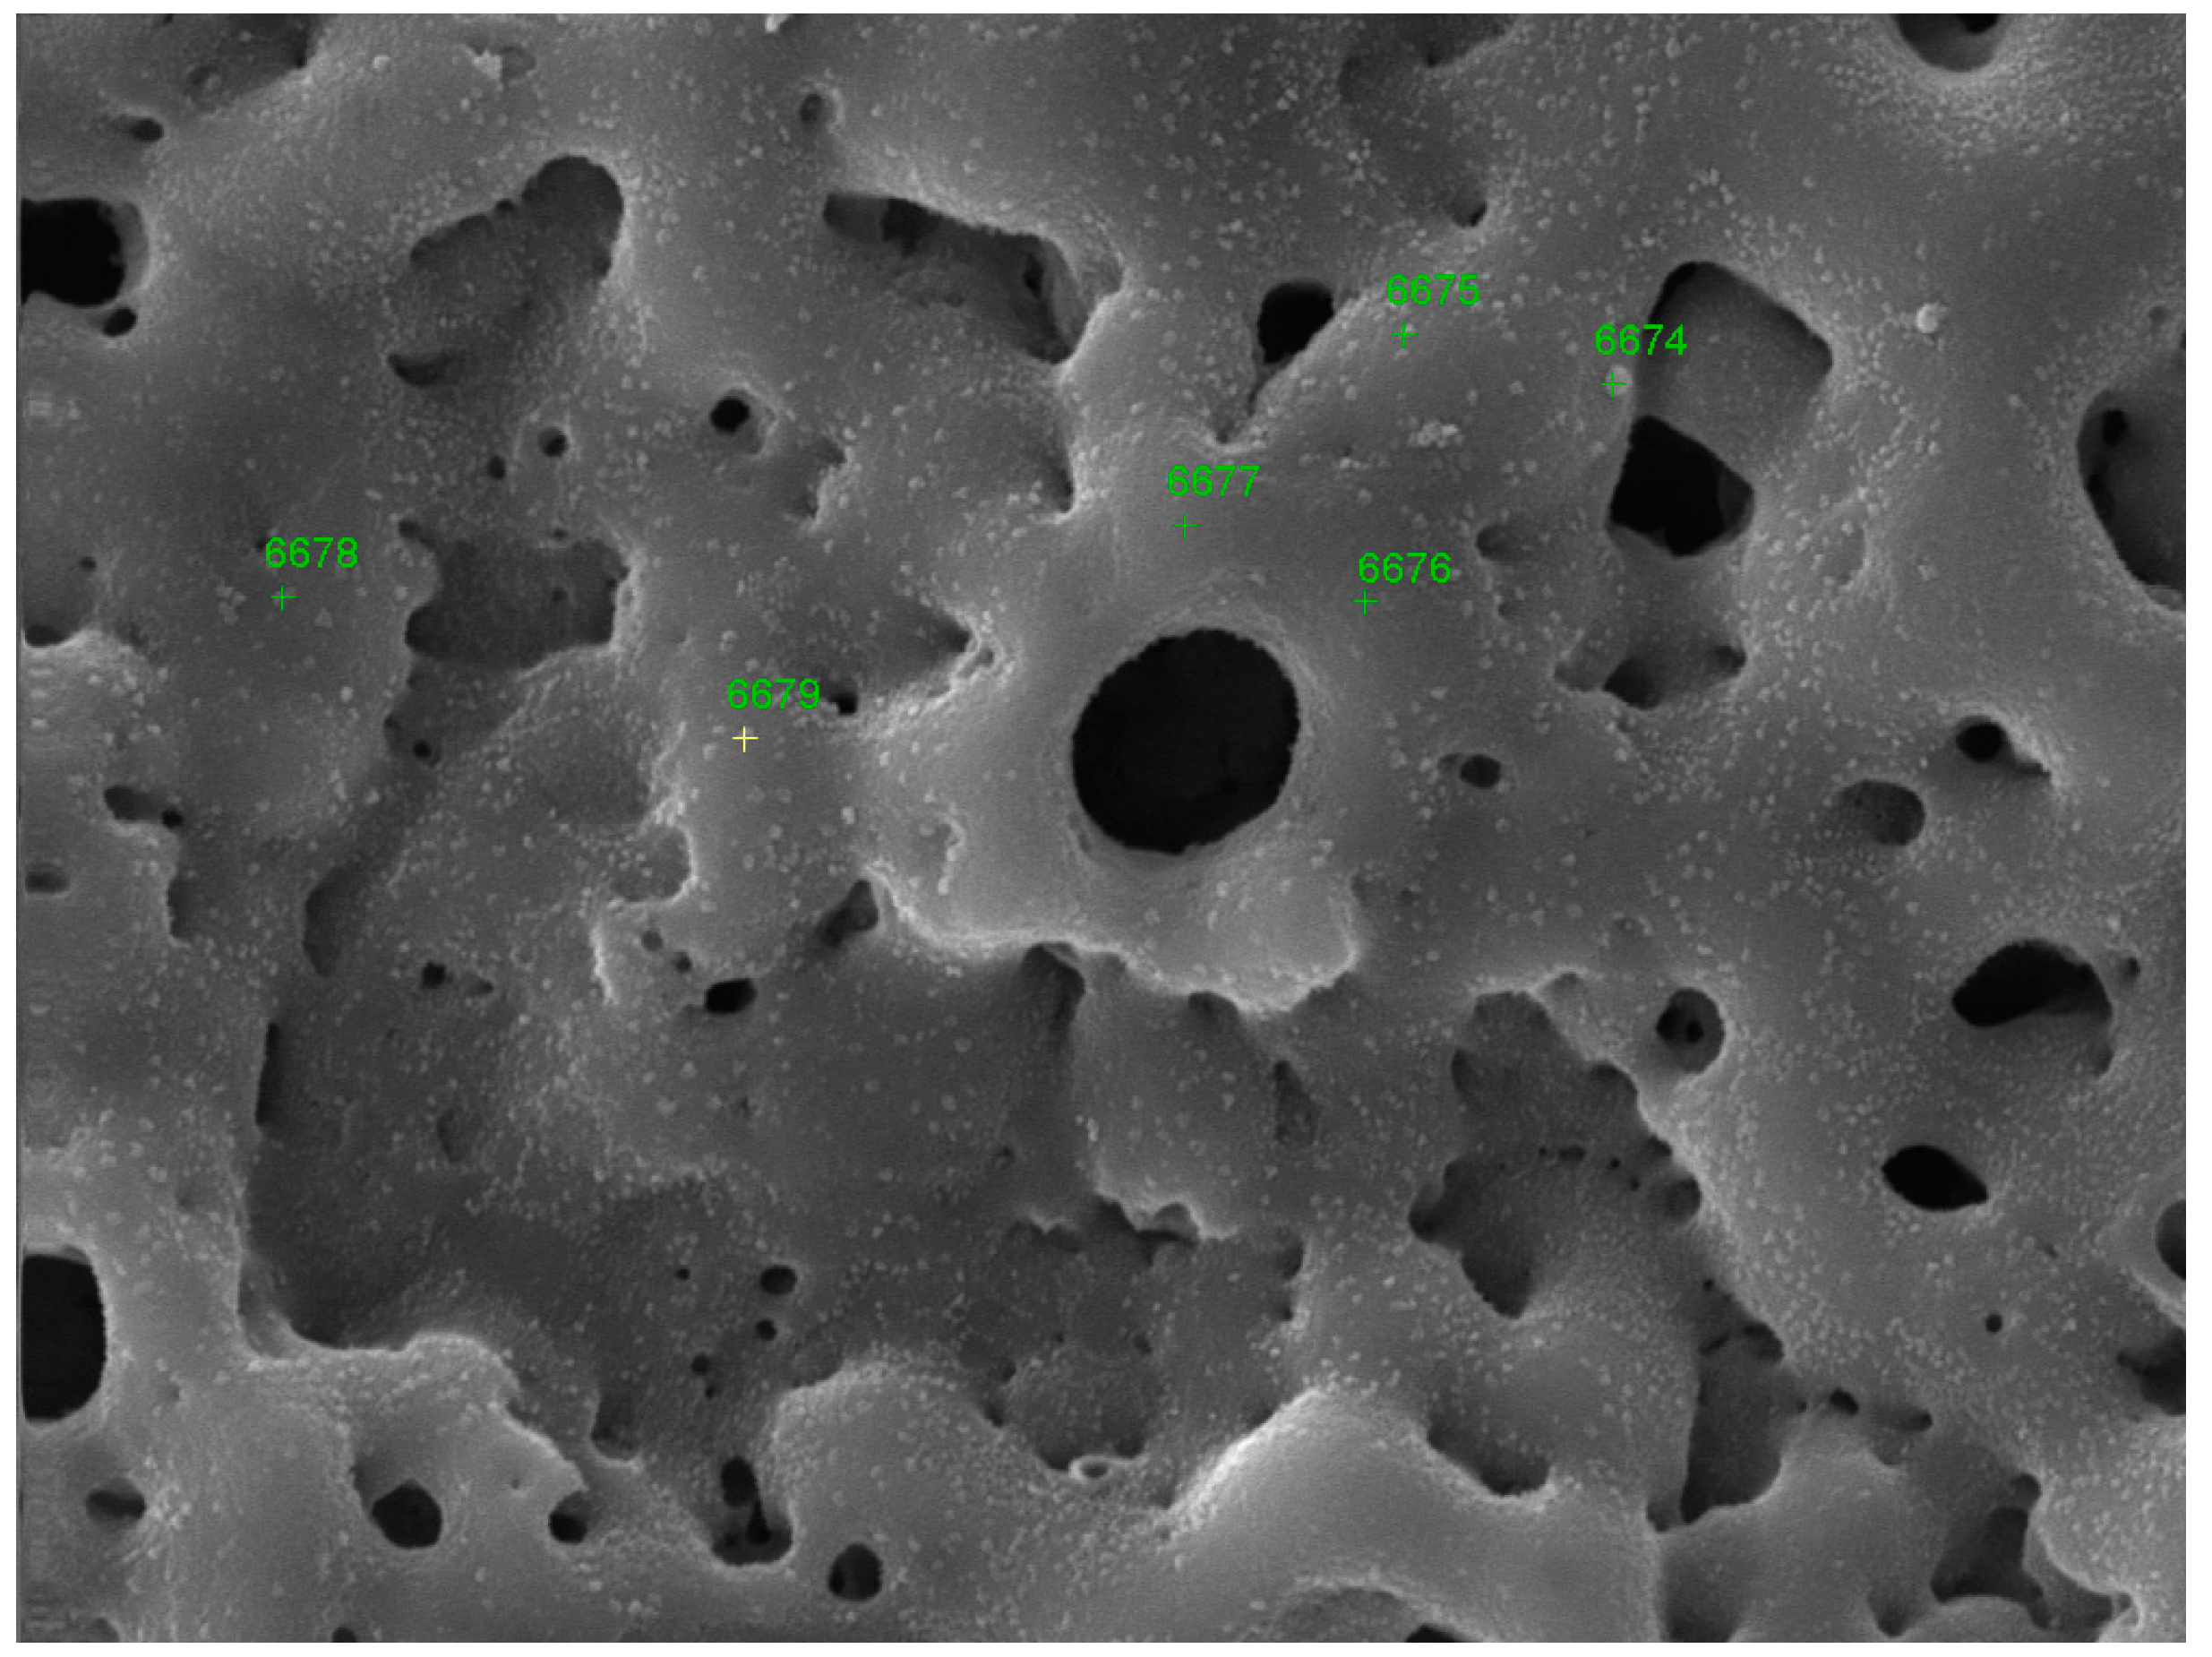
2.5.2. Energy Dispersive Spectroscopy (EDS) Analysis

Using EDS energy spectrum analysis, points on the microscopic surface were selected to analyze the elemental composition, and the main roles played by the elements in combination with performance analysis were discussed.

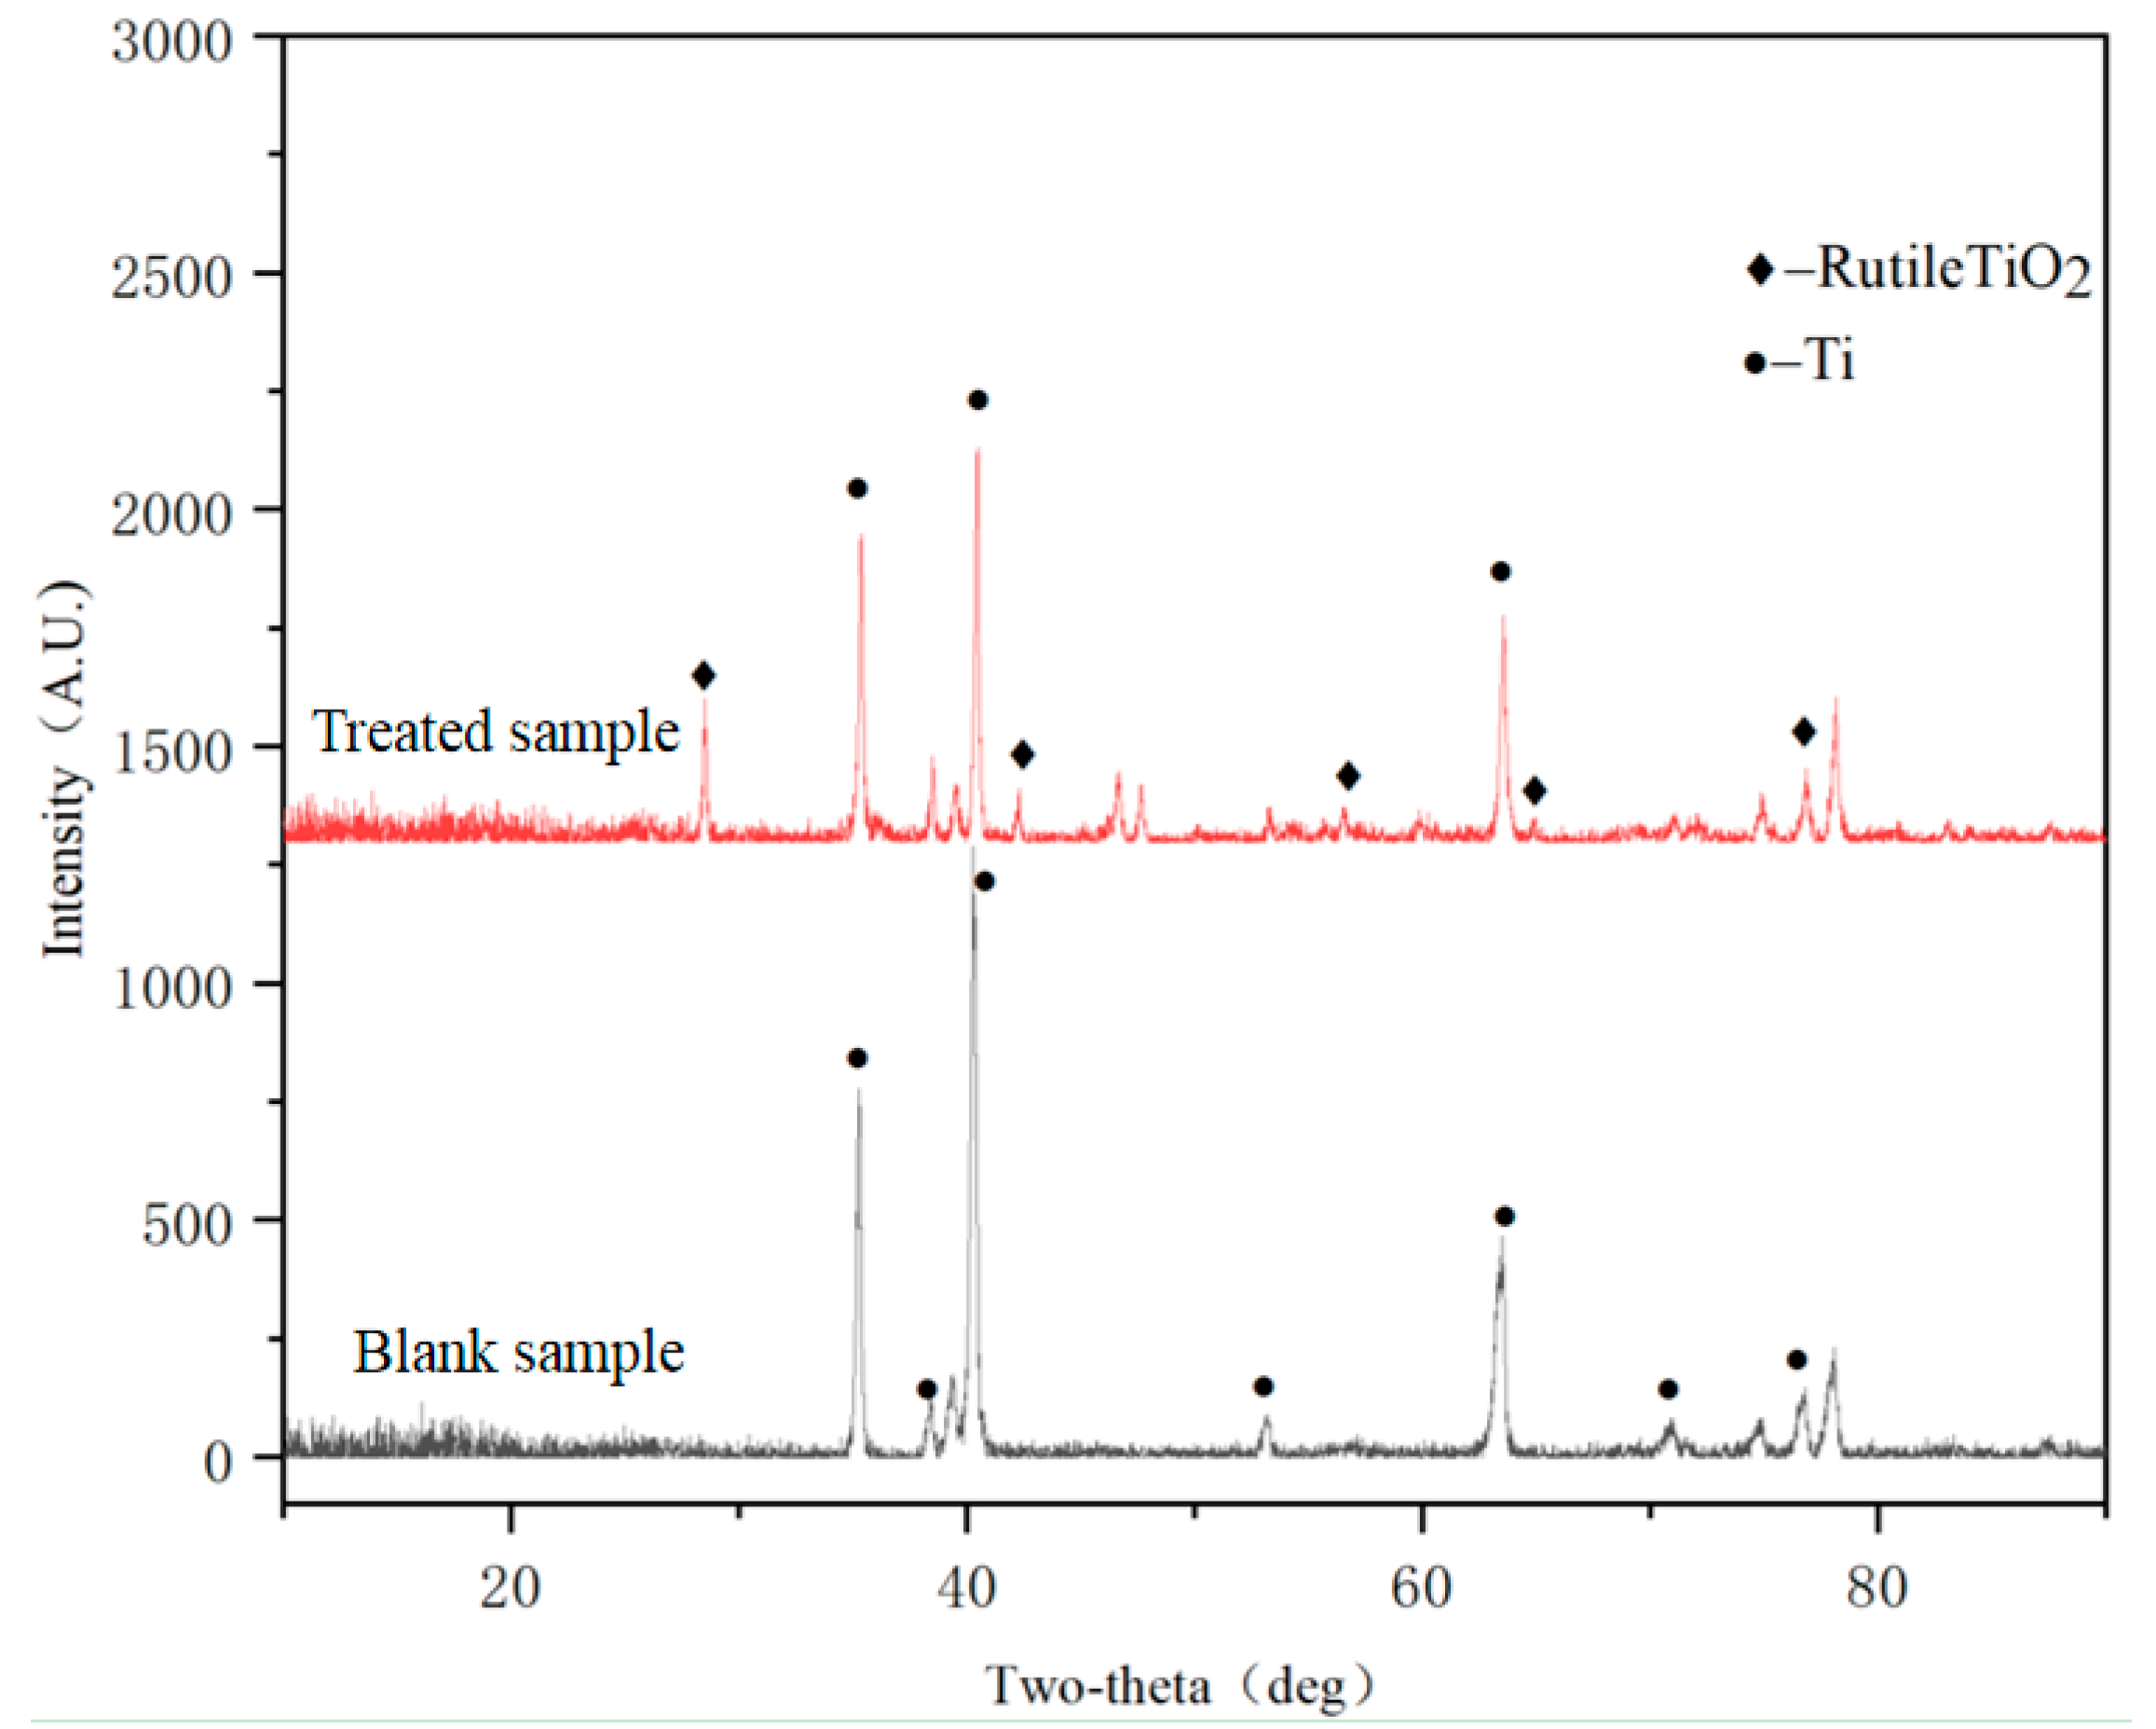
2.5.3. XRD Phase Analysis

A DX-2700d X-ray diffractometer (Dandong Haoyuan Instrument Co., Ltd., Dandong, China) was used to detect the phase of the film layer. The measurement parameters were as follows: tube current 30 mA and voltage 40 kV, and a Cu Kα radiation in the regular range 10°~90° and a scanning speed of 8°/min. And the phase was analyzed using Powder Diffraction File (PDF4-2009, International Center for diffraction Data).

2.5.4. Distribution Pattern of Pore Area Analysis

Image J 1.8.0 was used to analyzed the pore positions from the morphology map.

2.5.5. Comparison of Photocatalytic Performance

The experiment used the degradation rate of methyl orange under photocatalysis as a control to analyze the strength of the photocatalytic performance of the sample. The degradation rate of methyl orange can be calculated using Formula (1), and was analyzed and discussed using Origin plot.
A = A 0 A χ A 0 × 100 %
In the formula, A represents the degradation rate of methyl orange; A0 represents the absorbance of methyl orange before photocatalysis; and Aχ represents the absorbance of methyl orange after a certain period of photocatalysis.

3. Results and Discussion

3.1. XRD Phase Analysis Results

Figure 1 shows the X-ray diffraction patterns of the samples before and after micro-arc oxidation.
The sample has already formed a coating during the micro-arc oxidation process. In the untreated TC4 diffraction peak spectrum, the diffraction peak at 40.23° is the diffraction peak of the titanium substrate. After micro-arc oxidation treatment, the coating is mainly composed of rutile TiO2. The micro-arc oxidation process will undergo the following reaction [24]:
Ti + 2 H 2 O TiO 2 + 4 H + + 4 e
The reason why the spectrum did not detect rutile is because anatase TiO2 is more easily formed at low temperatures, but rutile TiO2 has stronger thermal stability than anatase TiO2. At a voltage of 510 V, an electric spark is generated on the surface of the sample, causing the surrounding temperature to rise sharply to a temperature that can melt the TC4 matrix, and causing the electrolyte to vaporize. The formed anatase TiO2 gradually transforms into rutile TiO2 as the oxidation time increases and the temperature rises [25].

3.2. EDS Analysis

3.2.1. Composition of Undoped Silver Ion Coating Elements

Figure 2 shows the energy spectrum of the undoped silver ion coating.
After conducting element analysis on the selected points, a table was drawn as shown in Table 1. Under the condition of not doping with silver ions, the basic elements on the surface are O, Al, Si, and Ti. This indicates that O, Al, Si, and Ti are more likely to bond with TiO2 coatings during the micro-arc oxidation process, while Na has a lower bonding force with TiO2 coatings, and all elements exist in the form of oxides in the coating.

3.2.2. Doping Silver Ions on the Composition of Coating Elements

A point selection analysis on the sample was performed with a voltage of 510 V and an oxidation time of 3.5 min in an electrolyte containing 2 g/L Ag2O as shown in Figure 3.
The mass of surface elements doped with silver ions is shown in Table 2. It can be seen that Ag2O, as a silver ion additive, was successfully doped and integrated into the TiO2 coating during the micro-arc oxidation process. This EDS analysis showed an increase in the P element compared to undoped silver ion analysis. The reason is that the addition of Ag2O increases the conductivity of the electrolyte and also enhances adhesion between the P element and the coating. From Figure 3, it can be seen that silver ions mainly appear in the surface particles, and their forms of existence are adsorption on the coating or doping of silver ions into the TiO2 coating, resulting in particle formation in the surface tissue.

3.3. Microstructure and Performance Analysis

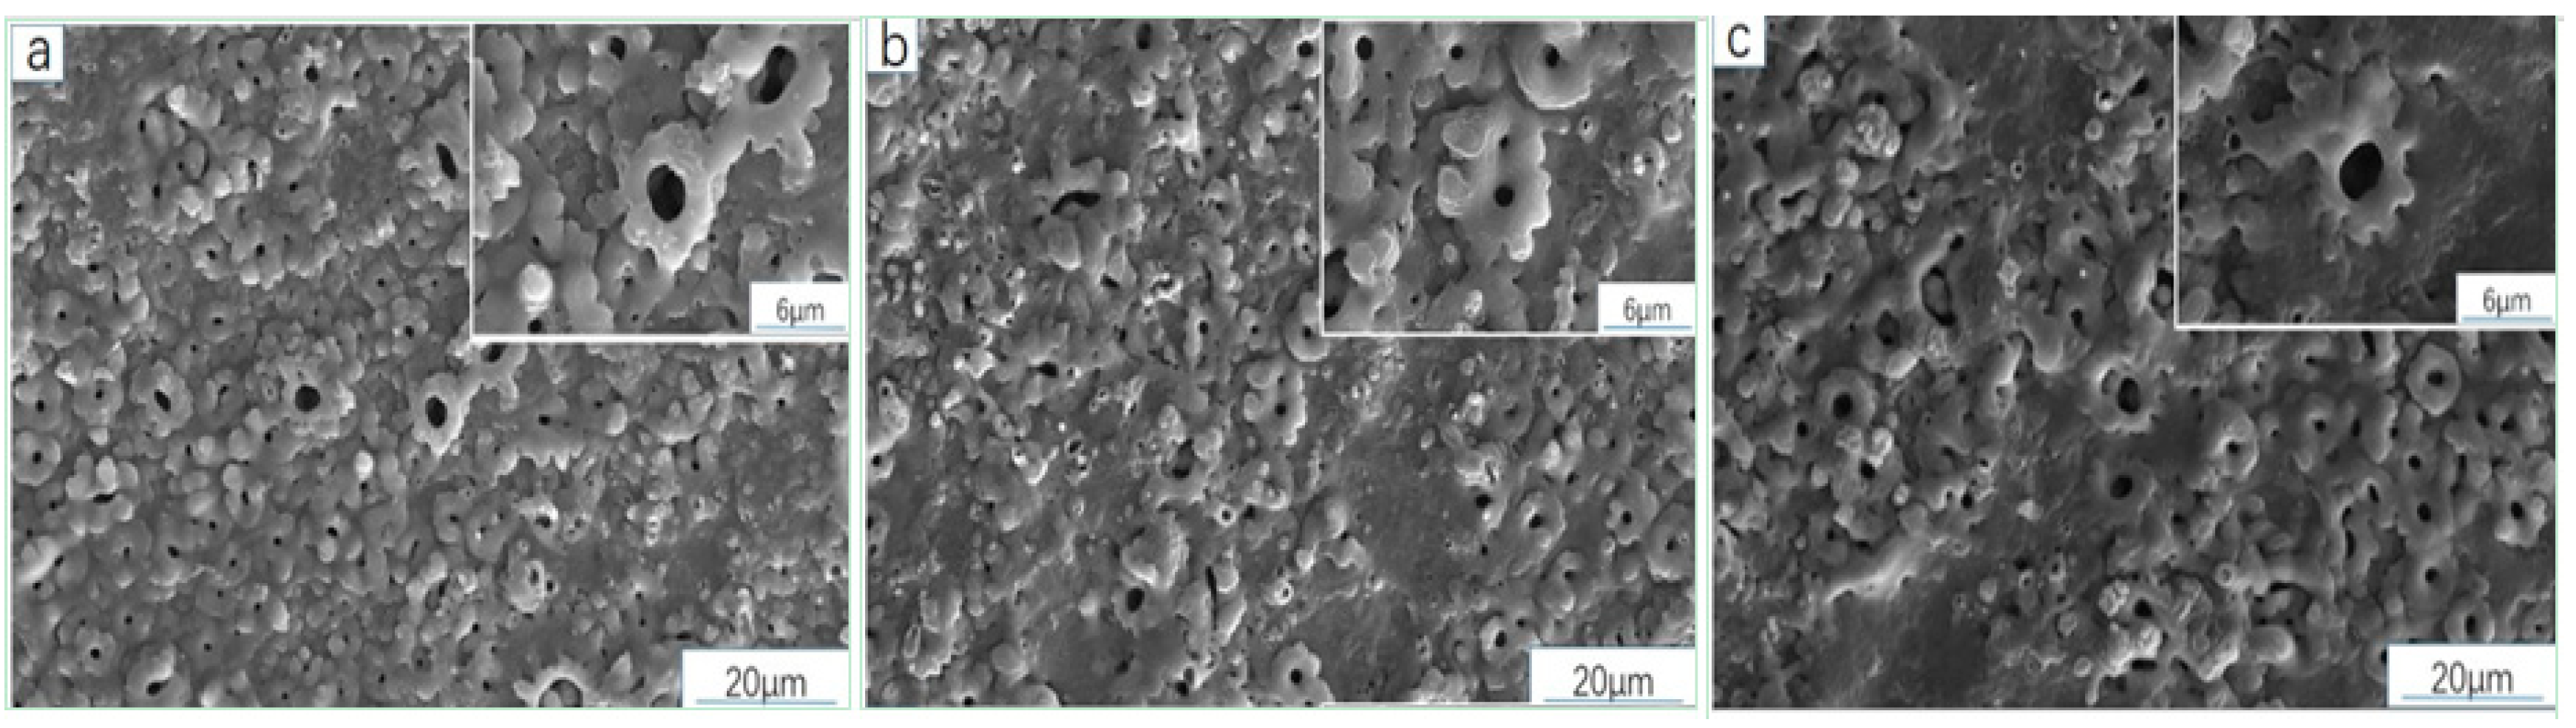
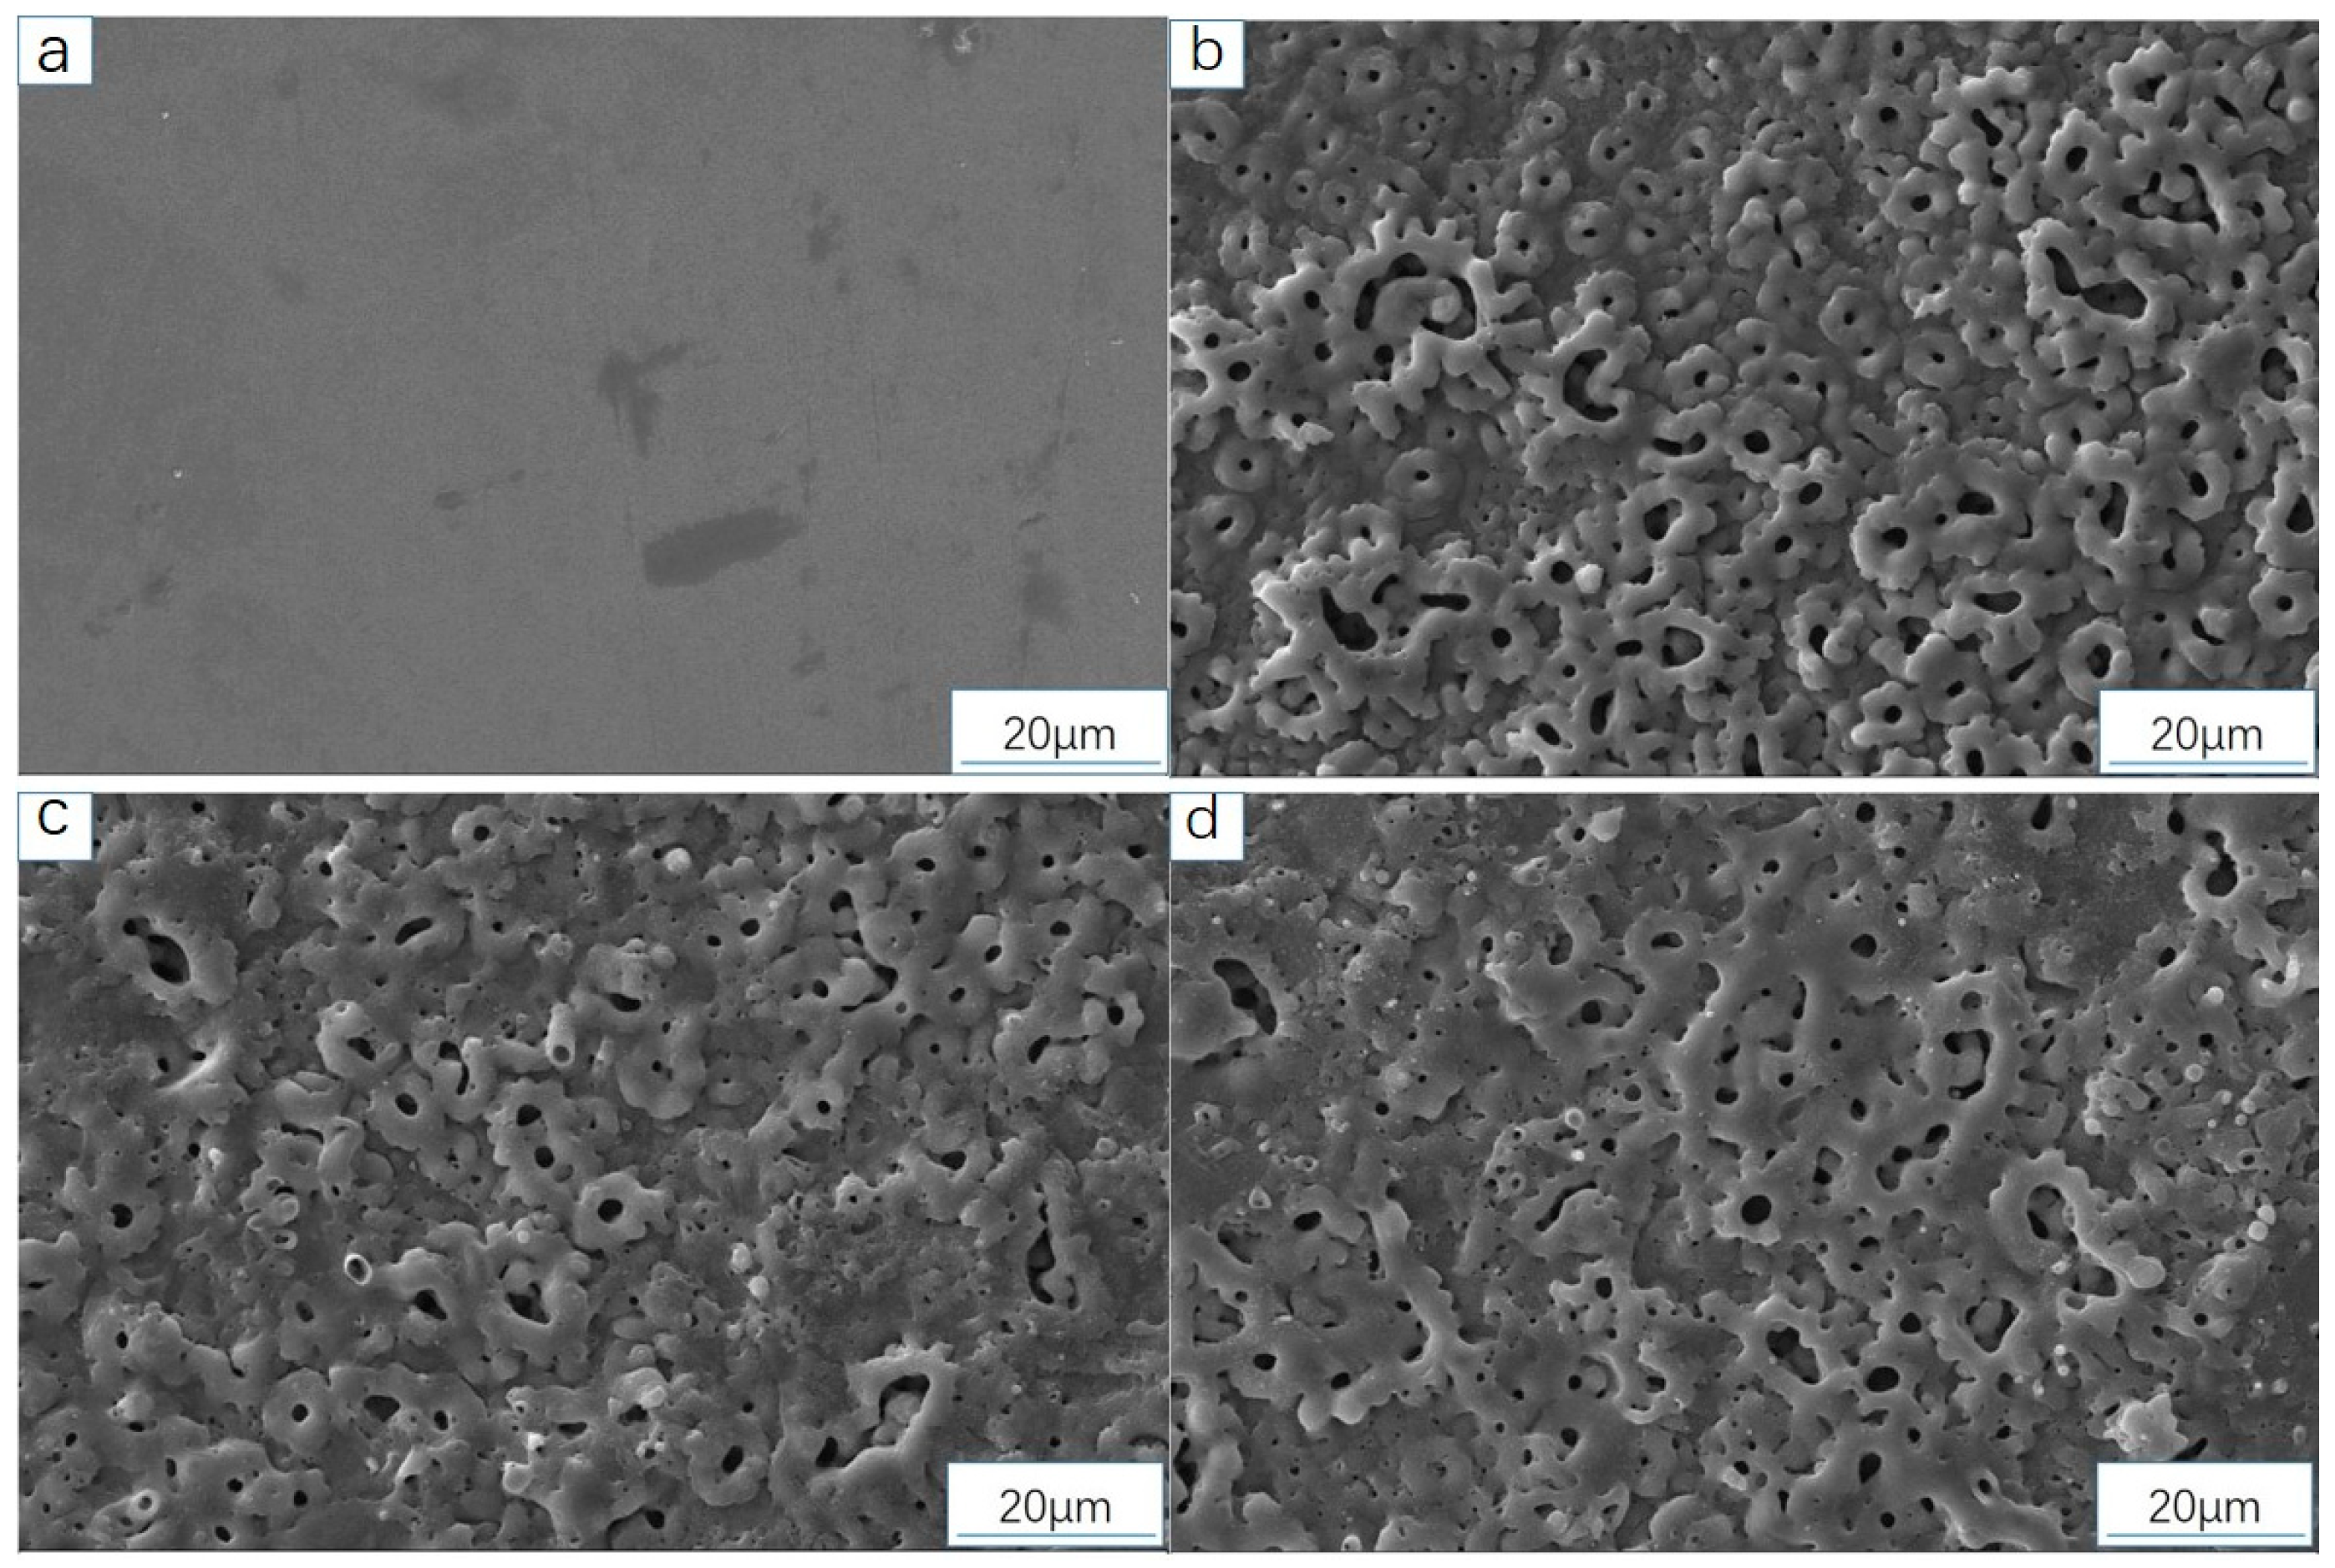
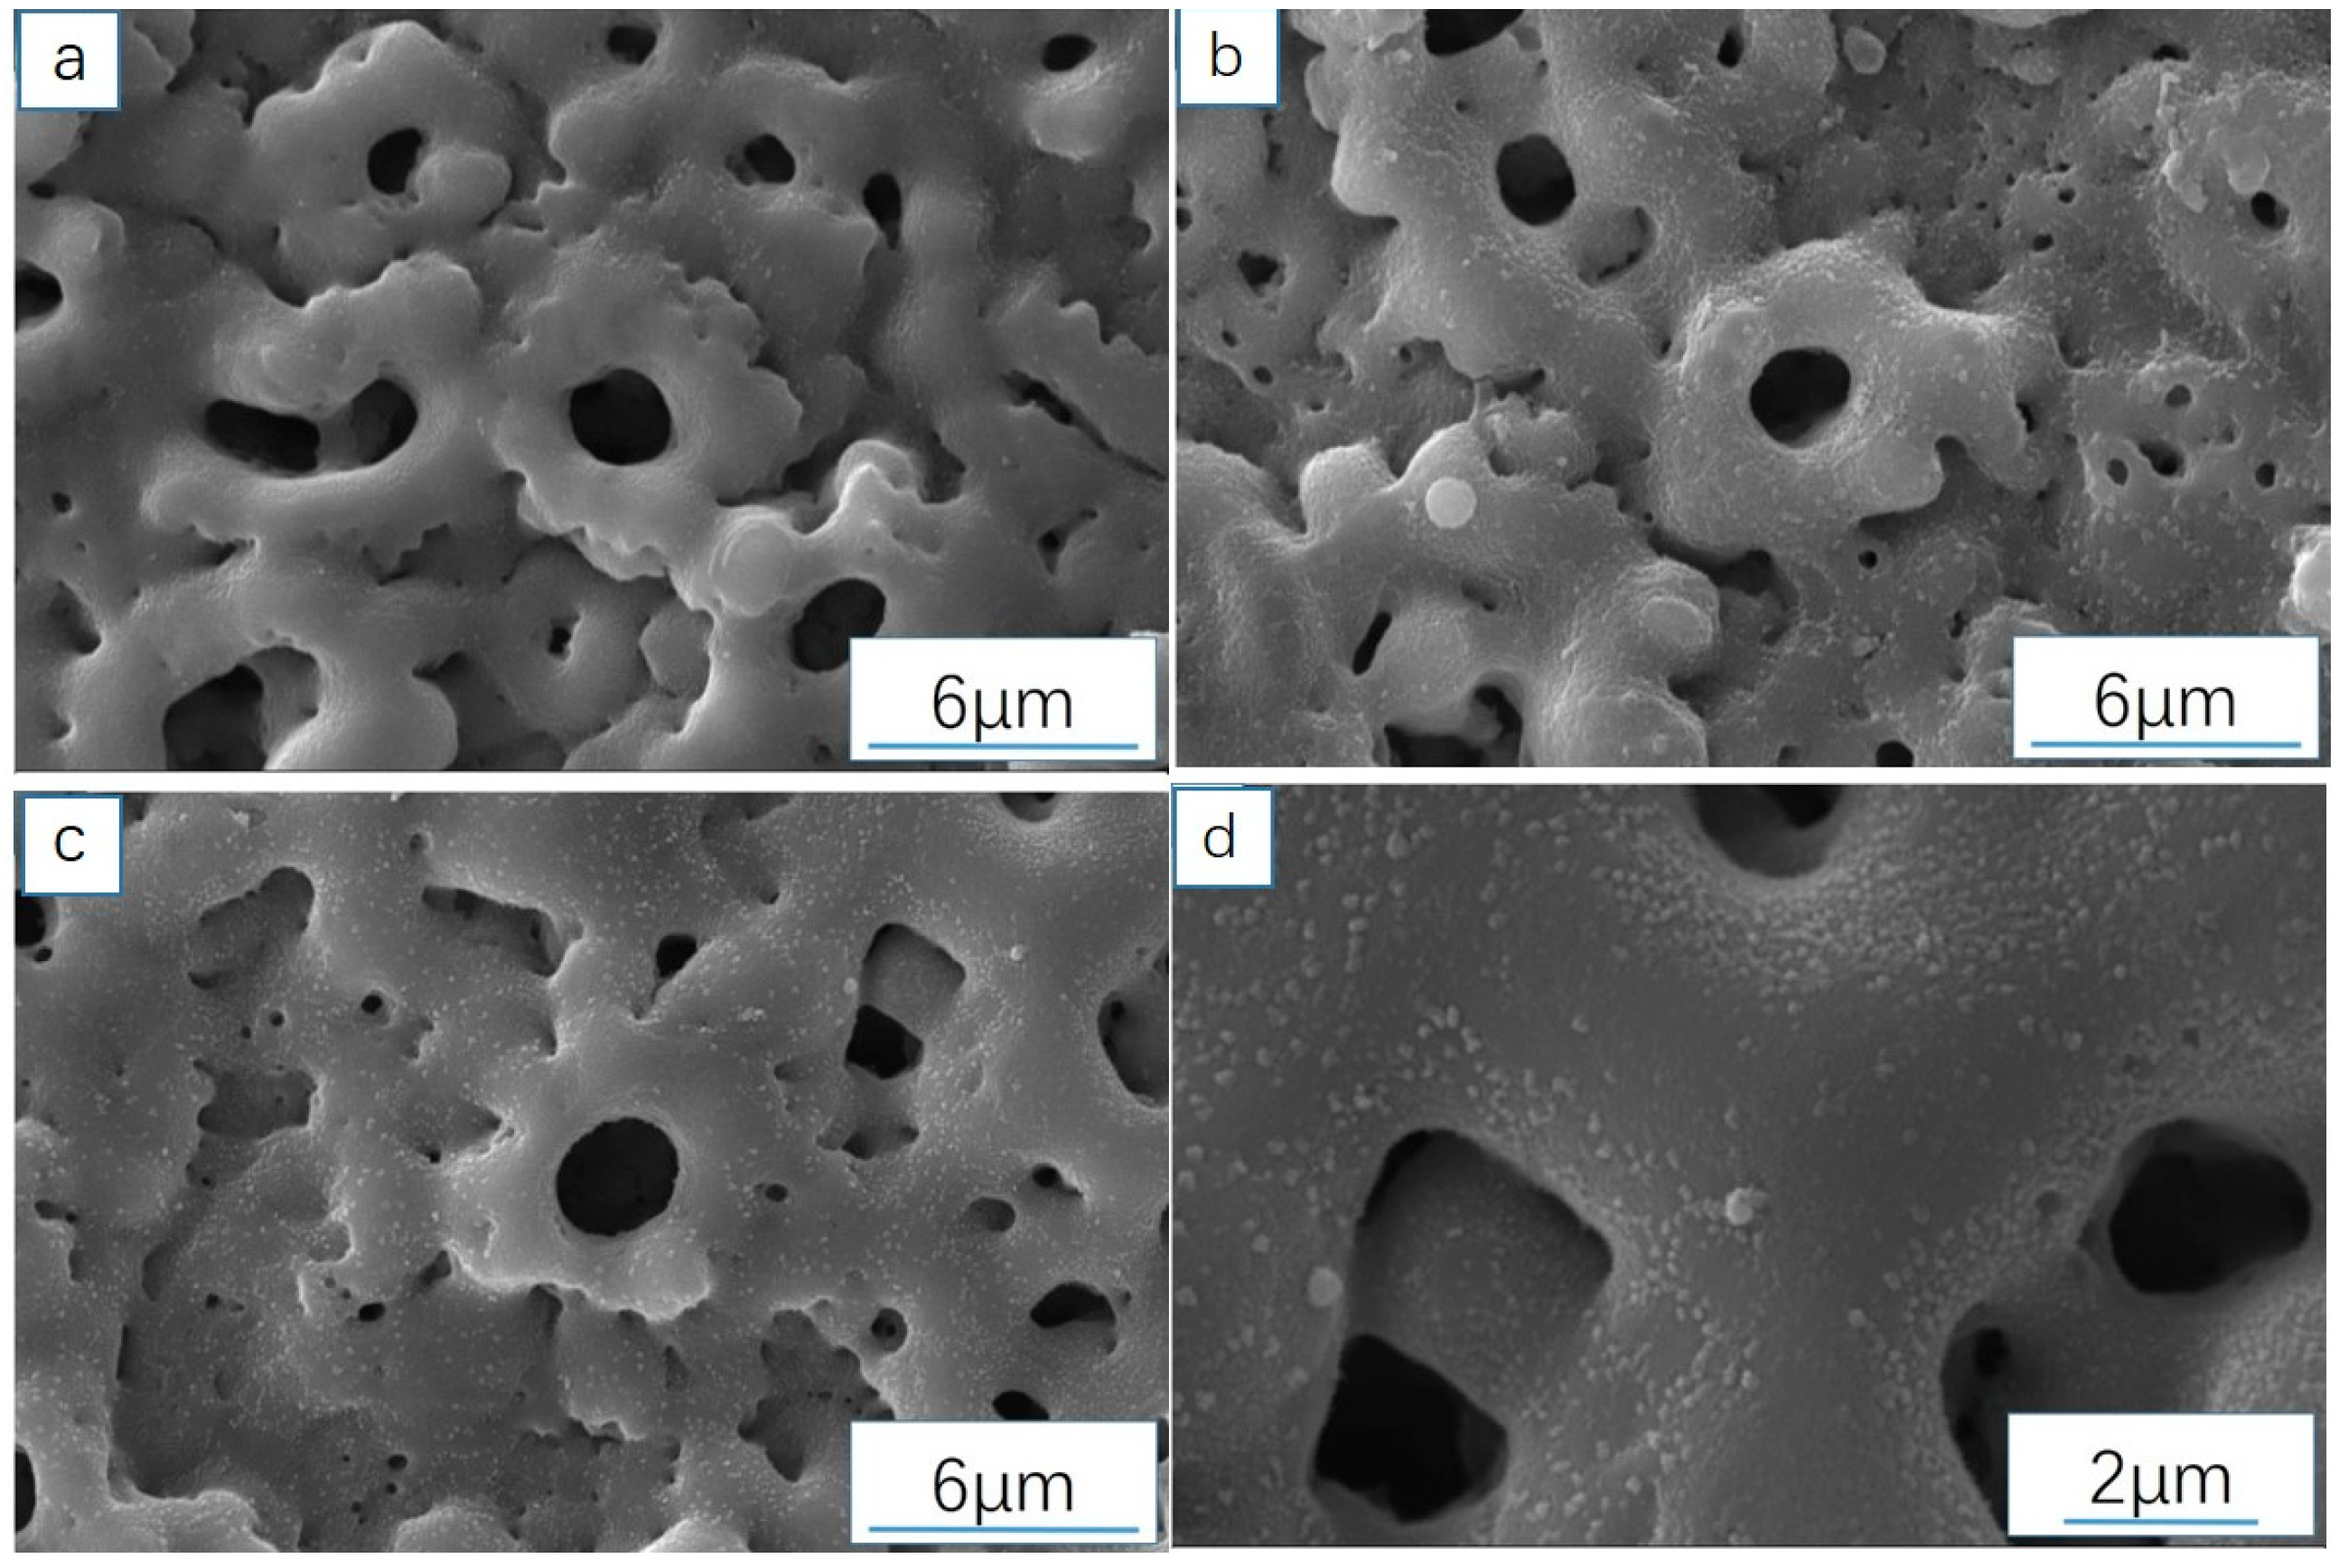
3.3.1. Analysis of Sample Surface Morphology (SEM)

(1) Influence of voltage on the surface morphology of film layers.
Figure 4 shows the surface morphology of the samples prepared under different oxidation voltages. At different voltages, it was observed that the degree of tissue unevenness gradually became more severe as the voltage increased. The increase in voltage made the reaction of the discharge channel more intense, and the reaction time could not bring the resistance of each part of the tissue to a certain level, resulting in uneven tissue in different parts, like continuous mountain peaks, with almost no flat parts.

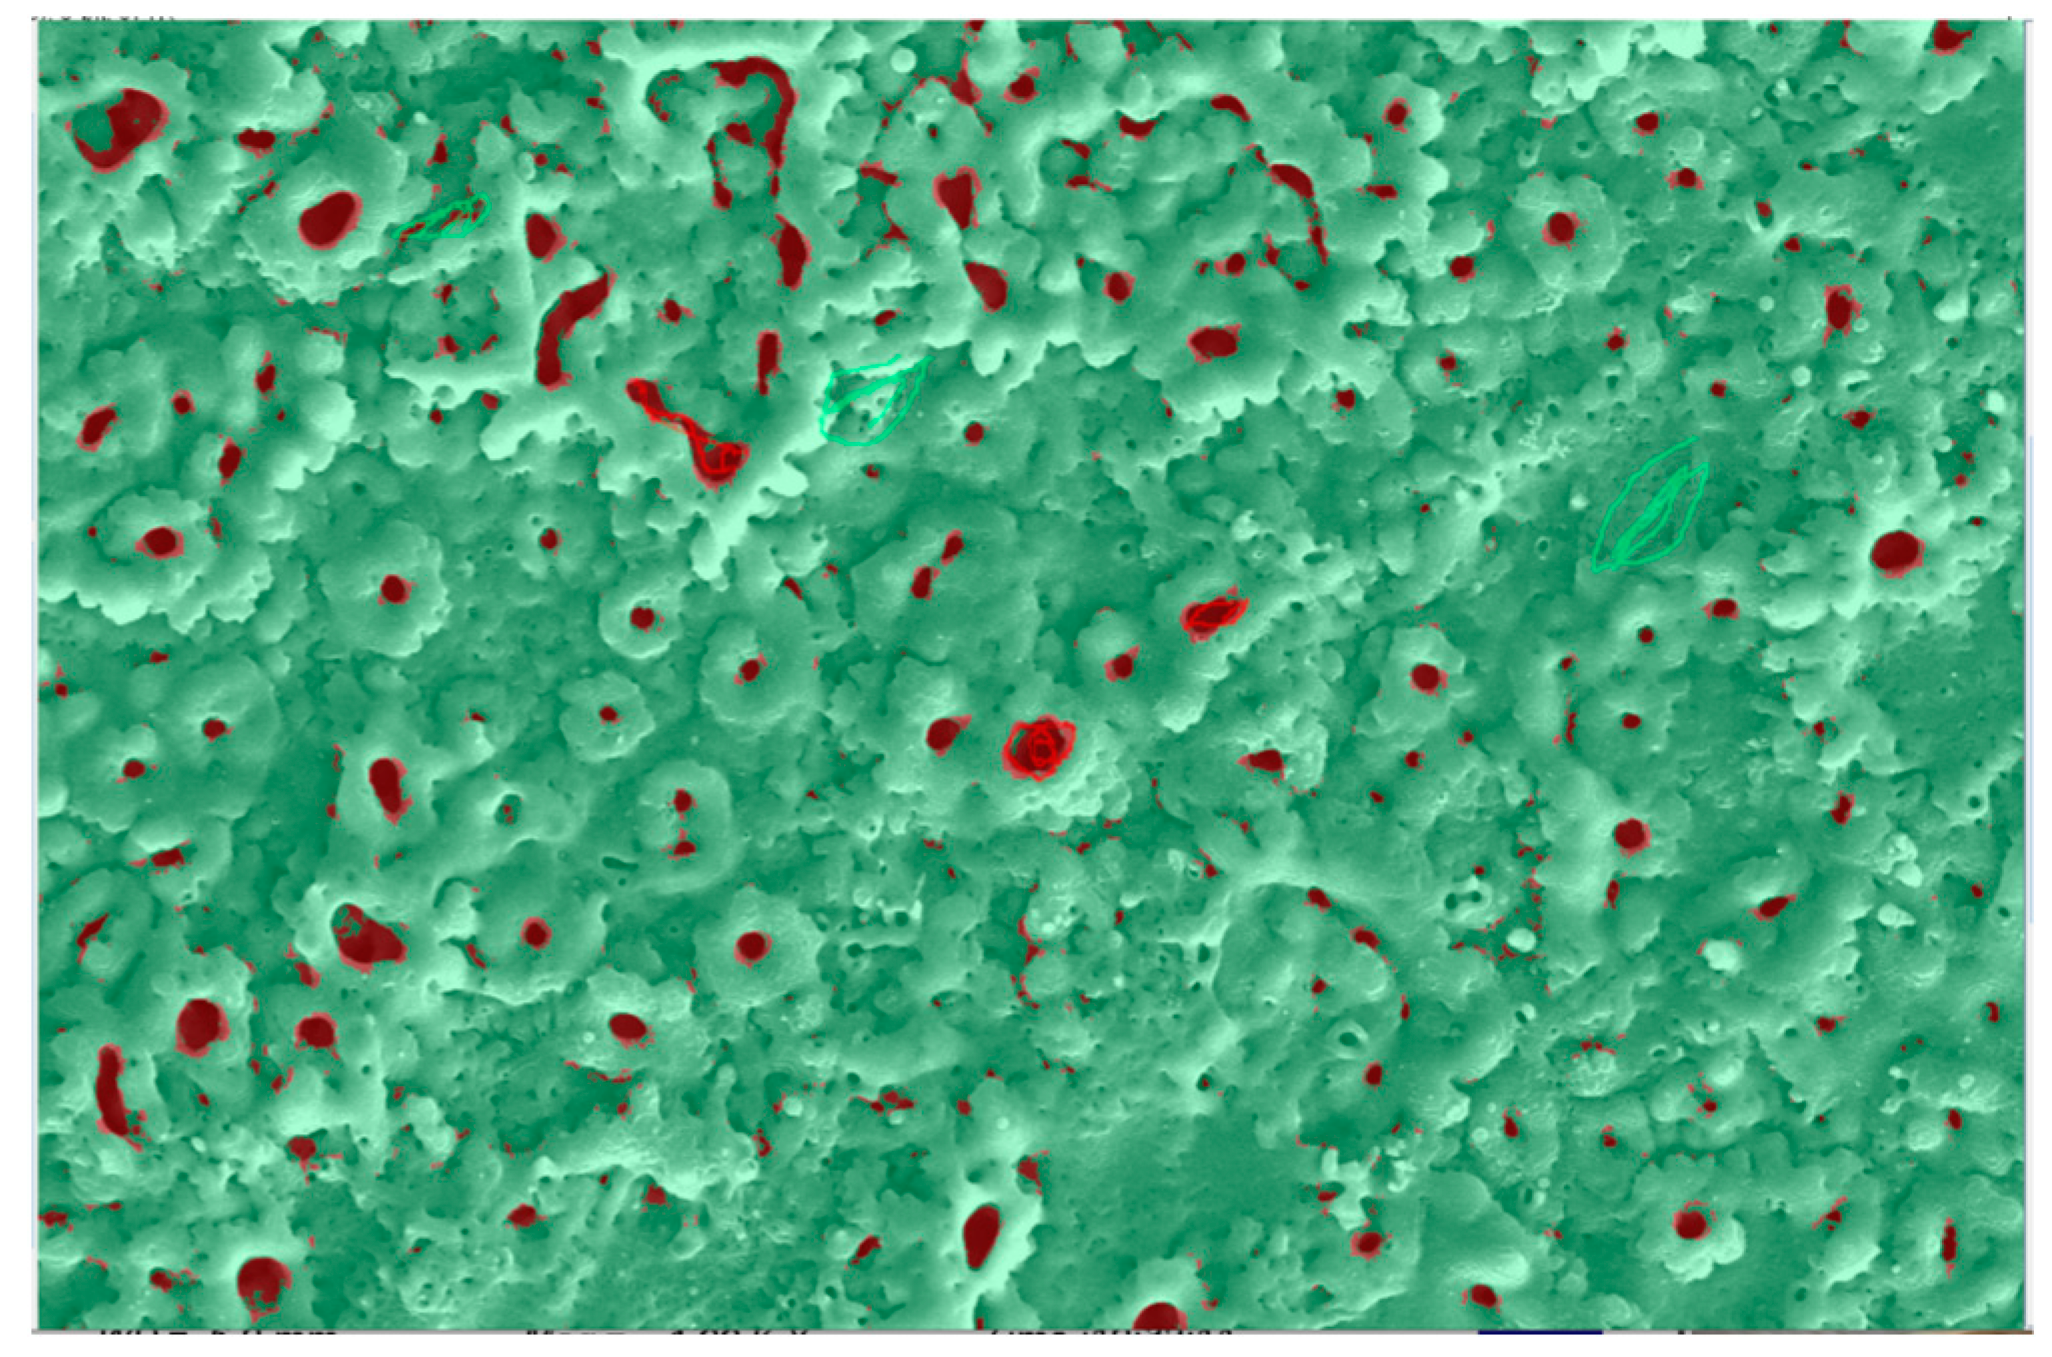
3.3.2. Distribution Pattern of Pore Area

Figure 5 shows the distribution of the surface pore area of samples subjected to micro-arc oxidation at different voltages. As shown in the figure, with an increase in oxidation voltage, the number of large pores first decreases and then increases. This phenomenon is caused by the gradual increase in voltage, and the rate of breakdown to form pores is greater than the rate of material cooling to fill pores. The number of pores also increases with the increase in voltage. At a voltage of 495 V, the total area of various types of holes is as high as 45–50 μm2. After the voltage rises to 510 V, the maximum hole area decreases, indicating that the rate of hole formation by breakdown and the rate of hole filling by material cooling also increase when the voltage rises. However, the rate of hole formation by breakdown remains higher than the rate of hole filling by material cooling.

3.3.3. Photocatalytic Performance

To better analyze and discuss the strength of the photocatalytic performance of the sample, the absorbance of methyl orange degradation within 3 h was measured. The degradation rate of methyl orange was calculated using a formula to compare and discuss the mechanism of photocatalytic degradation of methyl orange. Figure 6 shows the trend of the photocatalytic degradation rate of methyl orange for different samples within 3 h. With an increase in micro-arc oxidation voltage, the photocatalytic activity of the prepared film layer is enhanced. As the photocatalytic time progresses, the degradation rate of methyl orange in the same sample increases. When the time is 3 h, the highest efficiency of photocatalytic degradation of methyl orange can reach about 15.5%, and the effect is significant. This result may be related to the membrane structure on the surface of the sample.
The mechanism of photocatalytic degradation of methyl orange based on the pore area in the morphology was discussed. The pore positions from the morphology map were analyzed by Image J software. And the results are shown in Figure 7. The red represents the pore area and the green represents the non-pore area. Origin software (Origin 8.0) was used to draw a table. Table 3 shows the calculated pore area statistics. The oxidation time is 3.5 min, and the total area under different voltages is the smallest, indicating that the formation of pores is not conducive to the progress of photocatalysis. The increase in pores reduces the contact area between the surface of the sample and the methyl orange solution. TiO2 generates reactive oxygen species ( O 2 2 and •OH) upon light stimulation, which migrate to the surface of the sample instead of inside the pores. Therefore, an excessive pore area will reduce the performance of TiO2 coating in producing reactive oxygen species and the area in contact with light.

3.4. Influence of Doping Silver Ions on Microstructure and Properties

TiO2 coating materials containing silver ions were prepared by adding 2 g/L, 3 g/L, and 4 g/L Ag2O to the configured electrolyte, fixing the oxidation time for 3.5 min, and applying voltages of 480 V, 495 V, and 510 V, respectively.

3.4.1. Analysis of Surface Microstructure and Morphology of the Sample

Figure 8 shows the surface morphology of samples prepared at different voltages in a Ag2O electrolyte containing 2 g/L. Compared with the morphology formed under different voltages, the surface tissue under 510 V voltage is smoother, with the smallest degree of concavity and convexity, but there are still many pores. Compared with the surface morphology of undoped Ag ions, there are more cohesive pores formed by the presence of small pores in the surface macropores; the most obvious of which is shown in Figure 8b at 480 V, and the smallest degree of fluctuation in the surrounding area is also shown in Figure 8b at 480 V. The reason for this phenomenon is that during the micro-arc oxidation process, continuous discharge occurs under voltage, and breakdown phenomena continue to occur, forming multiple discharge channels. The temperature of the discharge channels increases, causing the surrounding material to become molten. The molten material and electrolyte undergo a cooling reaction and solidify in the surface layer. Due to low voltage, some film layers have high resistance and cannot continue to generate electricity, causing the cooled material to push into new holes and form cohesive pores at the original hole position. Additionally, some surface layers experience film accumulation, while others remain unresponsive, resulting in varying degrees of unevenness. Under high voltage, there are no cohesive pores and the degree of fluctuation is low because the continuous breakdown of film resistance by high voltage is insufficient. In addition, after adding Ag2O to the electrolyte, the material doped with Ag ions after cooling can quickly fill the pore positions. Therefore, as the voltage increases, the number of large pore positions in the morphology gradually decreases; the degree of fluctuation decreases; and the number of cohesive pore positions also decreases.
Figure 9 shows the morphology at 4000 times magnification. It can be seen that compared with undoped silver ion morphology, the surface tissue after doping with silver ions has more small granular tissue. Figure 9a shows a small amount of granular tissue, while Figure 9c shows the highest and most obvious amount of granular tissue, distributed in every position. Figure 9d shows that under a magnification of 10,000 times, the granular structure can be more intuitively observed. Combined with energy dispersive spectroscopy (EDS) analysis, it indicates that silver ions have been successfully doped into the TiO2 coating and exist in a granular form on the surface. The surface tissue in Figure 9a shows the most obvious undulations, with many pores. Due to the addition of Ag2O, under the condition of increased voltage, the undulations in Figure 9b have been improved, but the effect is not significant, and the number of pores has decreased. The undulations in Figure 9c have been significantly improved, and the number of pores has decreased significantly compared to Figure 9a, indicating that the filling rate of pores by Ag2O increases after the voltage is increased, and the improvement in surface tissue is successful.

3.4.2. Distribution of Pore Area After Doping with Silver

Figure 10a shows that the maximum pore area is around 30 μm2 at 480 V. Figure 10b shows that the pore area is around 24 μm2 at 495 V, and Figure 10c shows that the pore area returns to around 30 μm2 at 510 V. The distribution of pore area decreases from large to small, and the number of pores decreases with an increase in voltage. The addition of Ag2O increases the solute in the electrolyte, and the micro-arc oxidation reaction reacts violently with the increase in voltage. The solute in the electrolyte will solidify on the surface of the sample together with the molten material during the micro-arc oxidation process, and the pores will be filled. Only large holes are not filled with sufficient cooling material, resulting in irregular holes. Medium-sized holes are filled, while small holes cannot be filled with cooling material and remain.
Table 4 shows the statistical table of pore area (μm2) after doping with 2 g/L Ag2O at different voltages. According to the table, when the oxidation voltage is 495V, the total area of the pores is the smallest.

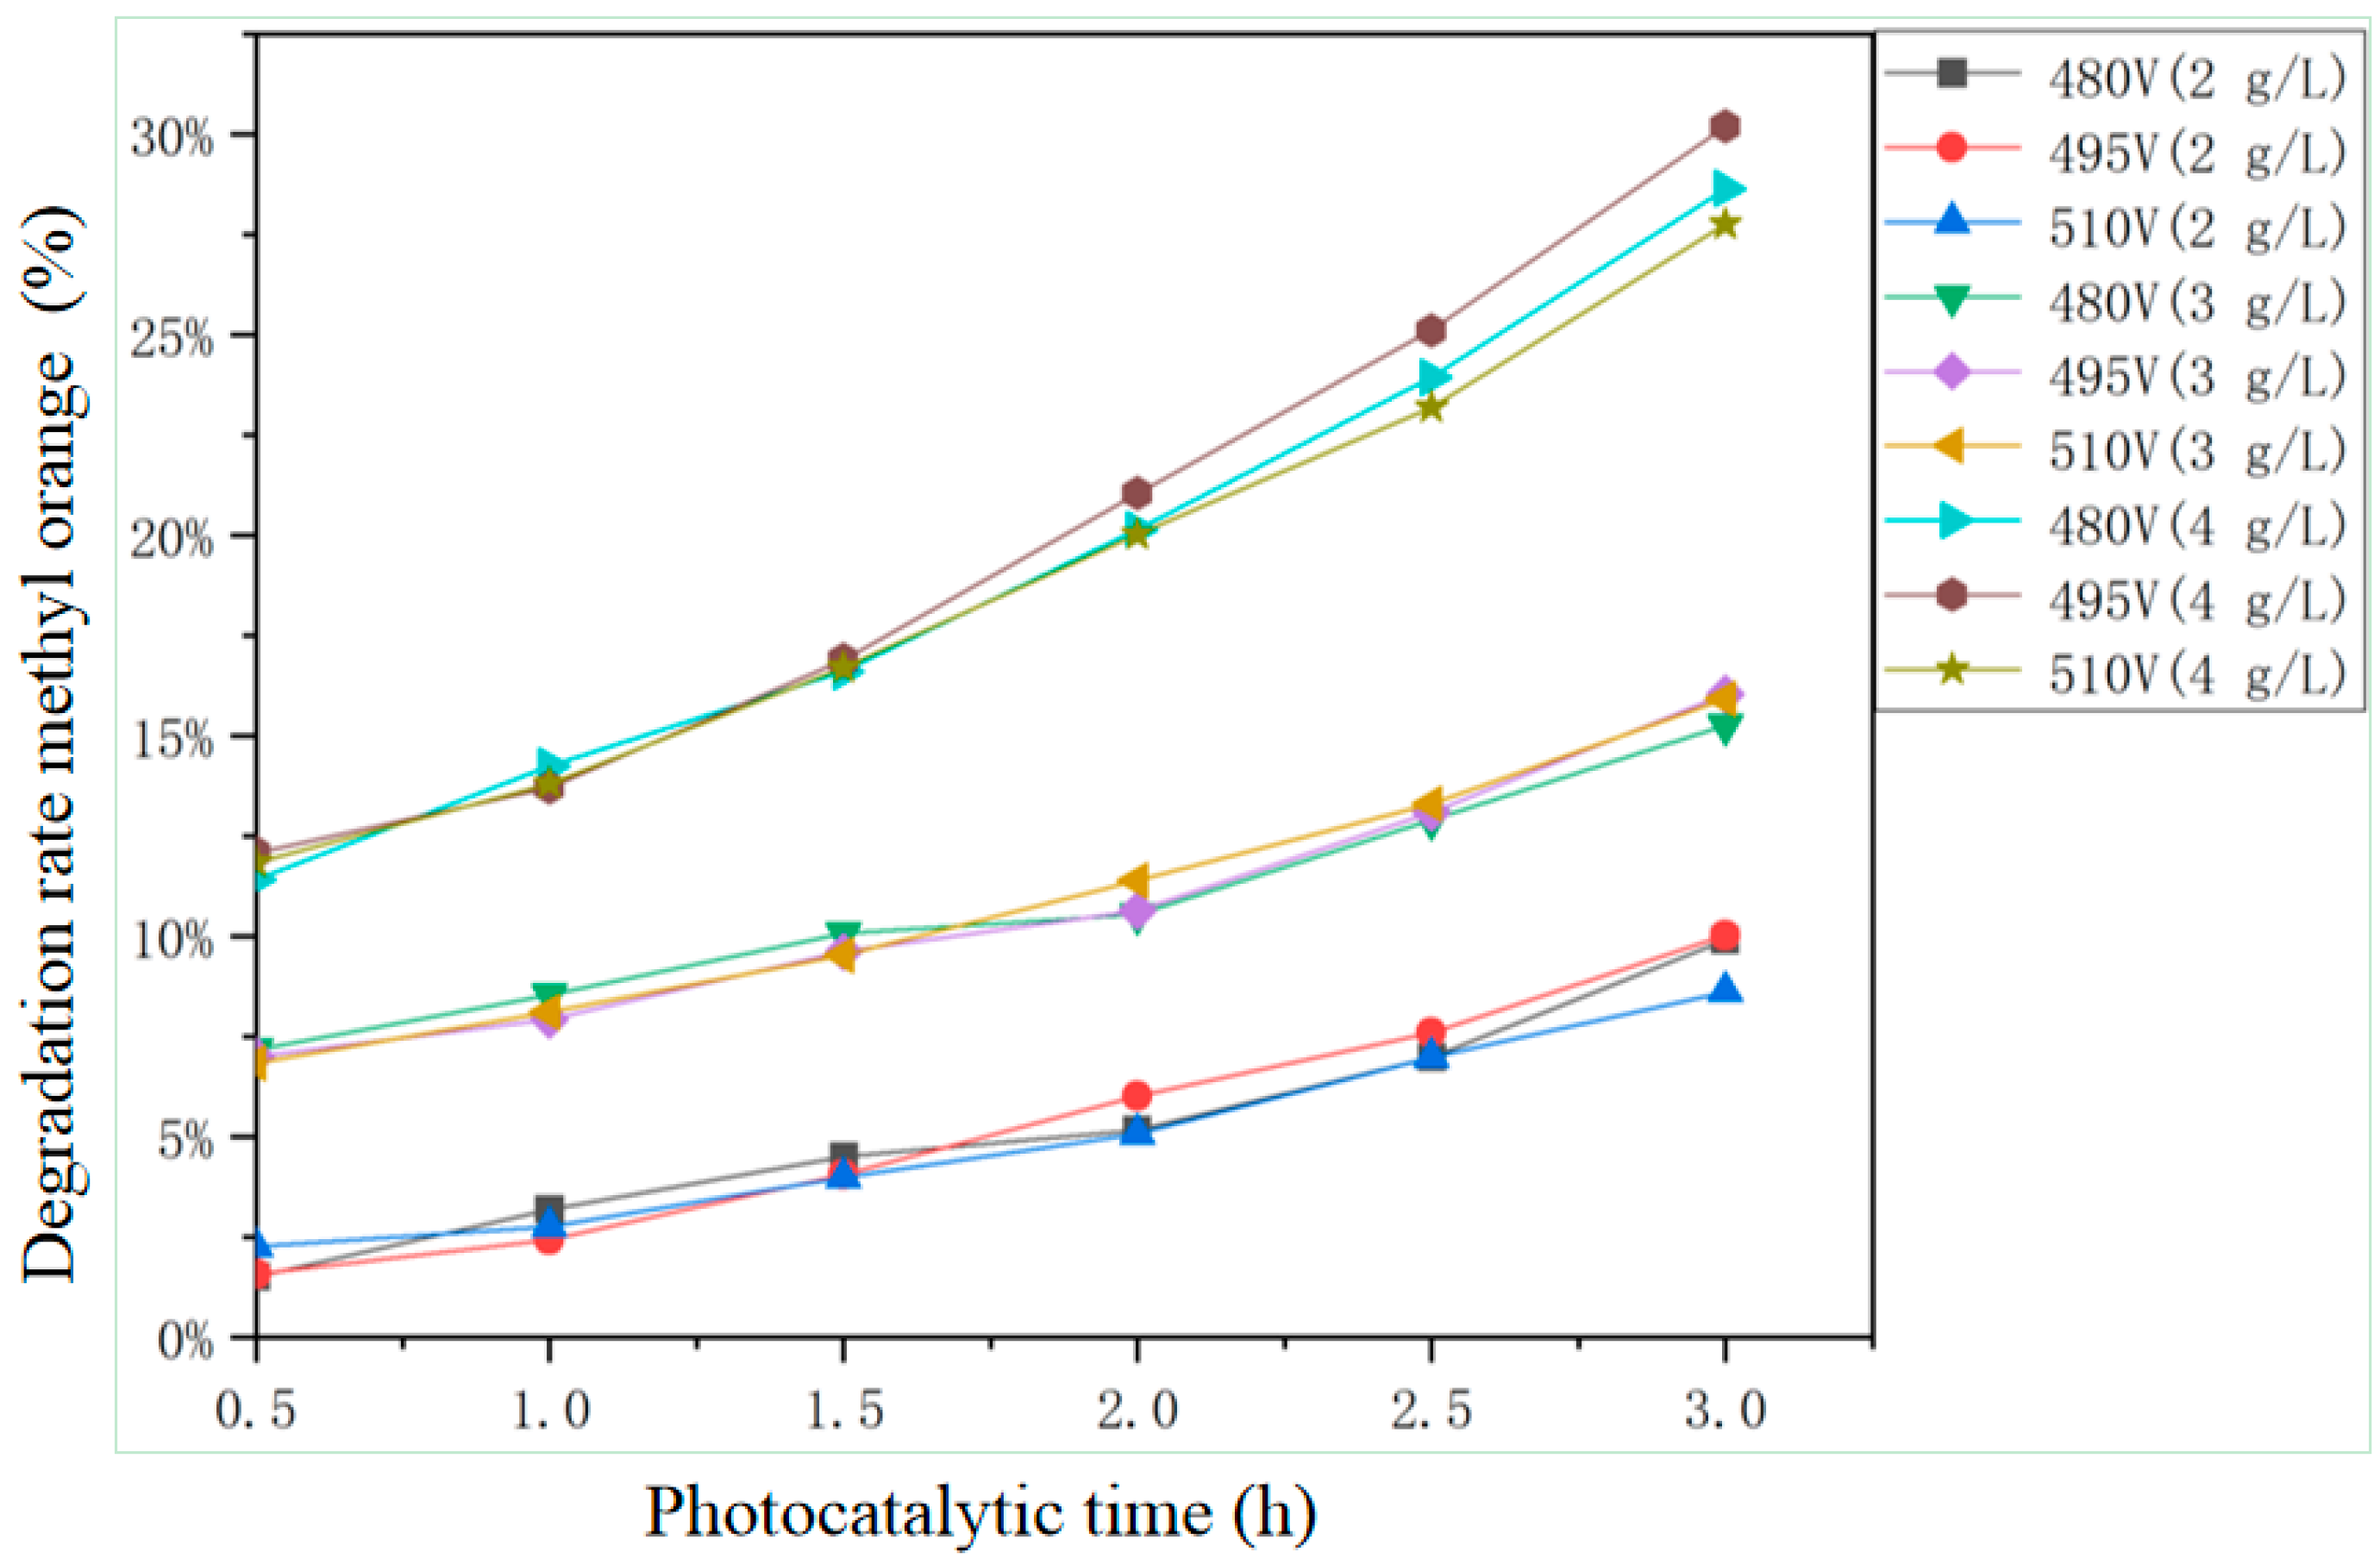
3.4.3. Influence of Doping Silver Ion Concentration on Photocatalytic Performance

Figure 11 shows the degradation rate of methyl orange by samples with different doping silver ion concentrations under different voltages. Overall, for the same sample, as the concentration of doped silver ions increases, the photocatalytic effect is enhanced. When the sample obtained by micro-arc oxidation in an electrolyte containing 4 g/L Ag2O is added, the degradation efficiency of methyl orange reaches about 31%. Compared with the blank group without doping with silver ions, the degradation rate of methyl orange was significantly improved after doping with silver ions, most notably in the sample containing 4 g/L.
Comparing the statistical table of pore area after doping with 2 g/L Ag2O in Table 4, the total pore area of the 495 V sample is the smallest, and the degradation rate of methyl orange is also the lowest in the experimental group containing 2 g/L, indicating that the surface pore area of the sample affects the photocatalytic efficiency of the sample.
In this study, the mechanism of analysis of methyl orange degradation is as follows: Methyl orange adsorbed on TiO2 under light irradiation absorbs visible light and is excited to inject electrons into the conduction band of TiO2. Due to the Schottky energy barrier, excited state electrons accumulate toward silver particles through the conduction band of TiO2 and react with adsorbed oxygen molecules on the surface of Ag to generate reactive oxygen species such as O2·, HO2·, H2O2, and OH·. These reactive oxygen species then attack the methyl orange molecules in the solution and degrade them. Silver plays a role in enriching and transporting electrons on the surface of TiO2. Due to the effect of silver atomic clusters, the reaction between the originally slow conduction band electrons of TiO2 and oxygen molecules has become a rapid process. The process of electron transfer from the conduction band of titanium dioxide to silver atomic clusters and then the reaction with oxygen molecules is very fast, which can suppress the recombination of electrons and methyl orange cations and significantly accelerate the oxidation degradation rate of methyl orange.
TiO2–coated photocatalysts loaded with silver have high stability, photocorrosion resistance, and non-toxicity. They do not produce secondary pollution during the treatment process and can be recycled and reused. From the perspective of material cycling, organic pollutants can be completely degraded into inorganic substances. Therefore, the application of TiO2–coated photocatalysts is a clean treatment technology.

4. Conclusions

A coating mainly composed of rutile TiO2 was formed on the surface of TC4 by micro-arc oxidation treatment. Voltage has the greatest impact on the film layer, and an increase in voltage will continuously break down the film layer, forming volcanic pores and continuous structures. The total area of pores formed with an oxidation time of 3.5 min is the smallest, and after doping with Ag2O, the total area of pores increases. Before doping with Ag2O, the highest photocatalytic degradation rate of methyl orange was only 15.5%. Increasing the concentration of doped silver ions improves the degradation rate of methyl orange. After doping with Ag2O, the highest photocatalytic degradation rate of methyl orange could reach about 31%, indicating that silver loading on TiO2 coatings can improve their photocatalytic performance.

Author Contributions

Experiments, X.F.; writing, X.F. and Y.X.; editing and translation, W.F. and Y.L. All authors have read and agreed to the published version of the manuscript.

Funding

This research was funded by the Opening Project of Key Laboratory of Green Chemistry of Sichuan Institutes of Higher Education No: LYJ2302.

Institutional Review Board Statement

Not applicable.

Informed Consent Statement

Not applicable.

Data Availability Statement

Data are contained within the article.

Conflicts of Interest

The authors declare no conflicts of interest.

References

  1. Xue, S.S. Research Progress in titanium dioxide doped modification and photocatalytic degradation of pollutants. Mod. Chem. Res. 2023, 16, 19–21. [Google Scholar]
  2. Fujishima, A.; Honda, K. Electrochemical photolysis of water at a semiconductor electrode. Nature 1972, 238, 37–38. [Google Scholar] [CrossRef] [PubMed]
  3. Carey, J.H.; Lawrence, J.; Tosine, H.M. Photodechlorination of PCB’s in the presence of titanium dioxide in aqueous suspensions. Bull. Environ. Contam. Toxicol. 1976, 16, 697–701. [Google Scholar] [CrossRef]
  4. Arun, J.; Nachiappan, S.; Rangarajan, G. Synthesis and application of titanium dioxide photocatalysis for energy, decontamination and viral disinfection: A review. Environ. Chem. Lett. 2023, 21, 339–362. [Google Scholar] [CrossRef] [PubMed]
  5. Li, P.L. Preparation and Properties of MAO Coating on Titanium Fiber Surface. Master’s Thesis, Chang’an University, Xi’an, China, 2023. [Google Scholar]
  6. Zhang, B.W. Preparation of Modified TiO2-Based Photocatalyst and Its Photocatalytic Degradation of Organic Pollutants. Master’s Thesis, Guangxi University, Nanning, China, 2023. [Google Scholar]
  7. Wan, R.S. Photocatalytic Degradation of Formaldehyde and Deactivation-Regeneration of Supported TiO2. Master’s Thesis, Nanchang University, Nanchang, China, 2023. [Google Scholar]
  8. Li, Y.Z. Preparation and Photocatalytic Performance of Tungsten Doped TiO2 Nanotubes on the Surface of Titanium Mesh. Master’s Thesis, Liaoning Normal University, Dalian, China, 2023. [Google Scholar]
  9. Hung, R.Y.; Luo, X.Y.; Zhao, D.F. Preparation and photocatalytic properties of Ag doped TiO2. Nonferr. Met. Met. Sci. Eng. 2016, 7, 67–72. [Google Scholar]
  10. Yu, L.Z.; Li, J.W.; Lin, Y.H. Research progress on the photocatalytic property of modifiednano-TiO2 doped with transition metal ions. Energy Chem. Ind. 2019, 40, 11–17. [Google Scholar]
  11. Li, B.; Wang, X.M.; Wei, H.M. Effect of B-F gradient doping on photocatalytic properties of TiO2 thin films. J. Qinghai Univ. 2018, 36, 93–98. [Google Scholar]
  12. Lee, J.H.; Lee, Y.K.; Kim, Y.J. Surface characteristics and photocatalytic propertiy of B doped TiO2 layer synthesized by plasma electrolytic oxidation process. Korean J. Mater. Res. 2021, 31, 552–561. [Google Scholar] [CrossRef]
  13. Gao, X.; Feng, Q.; Fu, Y. Mechanism of microscopic adsorption of organic molecules with different functional groups on the surface of anatase phase TiO2(101). J. At. Mol. Phys. 2023, 40, 31–38. [Google Scholar]
  14. Yu, H.; Yao, Z.; Yu, Z.; Tian, F.Z.; Su, Y.X.; Wang, Y.B.; Yu, J. Application of black titanium dioxide and its composite materials in photocatalytic degradation of water pollutants. Fine Chem. 2025, 1, 1–18. [Google Scholar]
  15. Diana, R.; Geometry, A.; Muhamad, D. Study on triphase of polymorphs TiO2 (Anatase/rutile/brookite) for boosting photocatalytic activity of metformin degradation. Chemosphere 2024, 351, 141206. [Google Scholar]
  16. Wang, H.; Wang, L.; Lin, D. Titanosilicate zeolite supported Pt nanoparticles with electronic metal-supportinteractions for efficient methanol steam reforming. Catal. Today 2021, 382, 42–47. [Google Scholar] [CrossRef]
  17. Wu, X.K.; Wang, Z.C.; Zhang, D. Solvent-free microwave synthesis of ultra-small Ru-Mo2C@CNT with strong metal-support interaction for industrial hydrogen evolution. Nat. Commun. 2021, 12, 4018–4027. [Google Scholar] [CrossRef]
  18. Wang, B.; Sa, G.L.; Xu, A.J. Progress of photocatalytic degradation of organic pollutants over TiO2. Ind. Catal. 2020, 28, 20–24. [Google Scholar]
  19. Guo, J.R.; Han, F.; Li, C.R.; Deng, H.Z.; Li, J. Study on the photocatalytic degradation of organic dye by Cu-doped TiO2. Appl. Chem. Ind. 2016, 45, 653–656. [Google Scholar]
  20. Zhou, J.W.; Wei, Z.B.; Sun, M.; Hao, Y.Y.; Huang, J.; Zhang, Y.; Liu, R.X. Enhancement of Photocatalytic Activity via Boron-doped Titanium Dioxide. J. Xinxiang Univ. 2019, 36, 11–16. [Google Scholar]
  21. Wen, Y.X.; Bao, L.H.; Ling, J.W. Photocatalytic activity of dye-sensitized titanium dioxide/graphene composite. Dye Finish 2021, 47, 7–12. [Google Scholar]
  22. Zhang, Q.Y.; Wu, L.M.; Tian, Y.Y.; Yu, R.F.; Zhang, Y.T. Preparation and photocatalytic properties of MOF-derived TiO2/heteropolyacids pomposites. Technol. Water Treat. 2022, 48, 71–75. [Google Scholar]
  23. Shi, H.Y.; Li, G.Z.; Li, J.M.; Zhang, S.L.; Luo, L.J.; Wang, H.B.; Yang, M. Study on photocatalytic degradation of methylene blue by silver doped titanium dioxide. J. Yunnan Minzu Univ. (Nat. Sci. Ed.) 2024, 33, 314–319. [Google Scholar]
  24. Xu, Y.K.; Luo, Y.Q.; Jiang, J.L. Influence of electrolyte Ca/P ratio on microstructure and properties of micro-arc oxidation titanium alloy coatings. Rare Metal. Mat. Eng. 2023, 52, 675–684. [Google Scholar]
  25. Li, L.X.; Zhang, R.Z.; Liu, Z.P. Catalytic properties of different crystalline TiO2 for ozoneoxidation. New Chem. Mat. 2024, 52, 184–189. [Google Scholar]
Figure 1. XRD patterns of samples before and after micro-arc oxidation.
Coatings 15 00272 g001
Figure 2. Point selection of undoped silver ion energy spectrum.
Coatings 15 00272 g002
Figure 3. Energy spectrum after doping with silver ions.
Coatings 15 00272 g003
Figure 4. Surface morphology after oxidation at different voltages of (a) 480 V, (b) 495 V, and (c) 510 V.
Coatings 15 00272 g004
Figure 5. Statistics of hole area at (a) 480 V, (b) 495 V, and (c) 510 V.
Coatings 15 00272 g005
Figure 6. The effect of coatings prepared at different voltages on the degradation rate of methyl orange.
Coatings 15 00272 g006
Figure 7. Image J software analysis of hole location (red area for holes, green area for non-holes).
Coatings 15 00272 g007
Figure 8. SEM images of the sample surface under different micro-arc oxidation voltages, 1000×: (a) 0 V, (b) 480 V, (c) 495 V, and (d) 510 V.
Coatings 15 00272 g008
Figure 9. (ac) show morphology images at 480 V, 495 V, and 510 V, respectively, at 4000× and (d) 10,000× times the morphology of 510 V.
Coatings 15 00272 g009
Figure 10. Distribution of pore area after doping with silver ions at (a) 480 V, (b) 495 V, and (c) 510 V.
Coatings 15 00272 g010
Figure 11. Degradation rate of methyl orange doped with Ag2O.
Coatings 15 00272 g011
Table 1. Mass fraction of undoped silver ion surface elements (%).
PointOAlSiTiNa
650636.818.0012.0942.220.88
650849.546.1813.8826.844.06
650733.6710.228.9947.120
650943.559.548.4438.470
Table 2. Mass fraction of surface elements doped with silver ions (%).
PointOAlSiTiPAg
667435.295.688.4531.05019.52
667540.667.0311.5240.7900
667647.745.058.1334.654.440
667745.154.687.8837.245.050
Table 3. Statistics of hole area (μm2).
VoltageTotal Number of Holes (N)Mean Value
480 V2231.316
495 V1860.884
510 V2240.939
Table 4. Statistical table of pore area (μm2) after doping with 2 g/L Ag2O.
VoltageTotal Number of Holes (N)Mean Value
480 V3501.380
495 V3201.421
510 V2701.793
Disclaimer/Publisher’s Note: The statements, opinions and data contained in all publications are solely those of the individual author(s) and contributor(s) and not of MDPI and/or the editor(s). MDPI and/or the editor(s) disclaim responsibility for any injury to people or property resulting from any ideas, methods, instructions or products referred to in the content.

