3.1. Orthogonal Experiment Polar Analysis
The orthogonal experimental design requires identifying the correspondence between factors and their levels [
25], and determining the most influential factor on the results through variance analysis, along with its corresponding optimal level [
26,
27,
28].
Using the orthogonal experimental design method, we concluded that nine simulation experiments are required to comprehensively evaluate the effects of welding parameters on the temperature field distribution and molten pool morphology. This experimental design allows for a systematic analysis of each parameter—such as heat source spacing, welding speed, laser power, and arc power—enabling an independent assessment of their influence on welding quality.
The peak value of the temperature field can be converted into the corresponding stress by the formula to carry out orthogonal experimental analysis [
29], and the peak temperature can also be used directly as a criterion. The tensile properties of the metal can be approximated by a quadratic function that is symmetrical around the optimal temperature range [
30]. Therefore, in the orthogonal experimental range analysis, segmented temperature values were used as evaluation criteria, with temperatures divided into the following two segments: below 900 K and above 1000 K.
T is the converted temperature value and is the actual temperature value.
Table 5 shows each set of experiments and their corresponding results, as follows:
Table 6 shows the data of the orthogonal experiments, which result from analyzing the results of the orthogonal experiments in terms of polarity analysis.
In laser-arc hybrid welding, heat source spacing has the greatest impact on temperature because it directly affects the interaction between the laser and the arc. Laser power ranks second, as the energy from the laser is more concentrated compared to the arc, making its effect on peak temperature more pronounced. Welding speed has a moderate effect, while arc power has the least influence on peak temperature.
The optimal process parameters for achieving the best tensile performance of the weld are presented in
Table 7. Using these parameters ensures that the peak temperature remains within the range of 900 K to 1000 K, thereby enhancing weld quality and tensile properties.
Through the aforementioned simulation experiments, we obtained temperature distribution maps and molten pool morphology diagrams for the weld area. A temperature probe was placed at the center of the weld, 10 mm from the welding start point, to observe the relationship between peak temperature and holding time. By comparing the simulation results, we identified the parameter set that achieved a peak temperature within the range of 900 K to 1000 K with the shortest holding time. This parameter set was selected as the optimal experimental condition for the welding test.
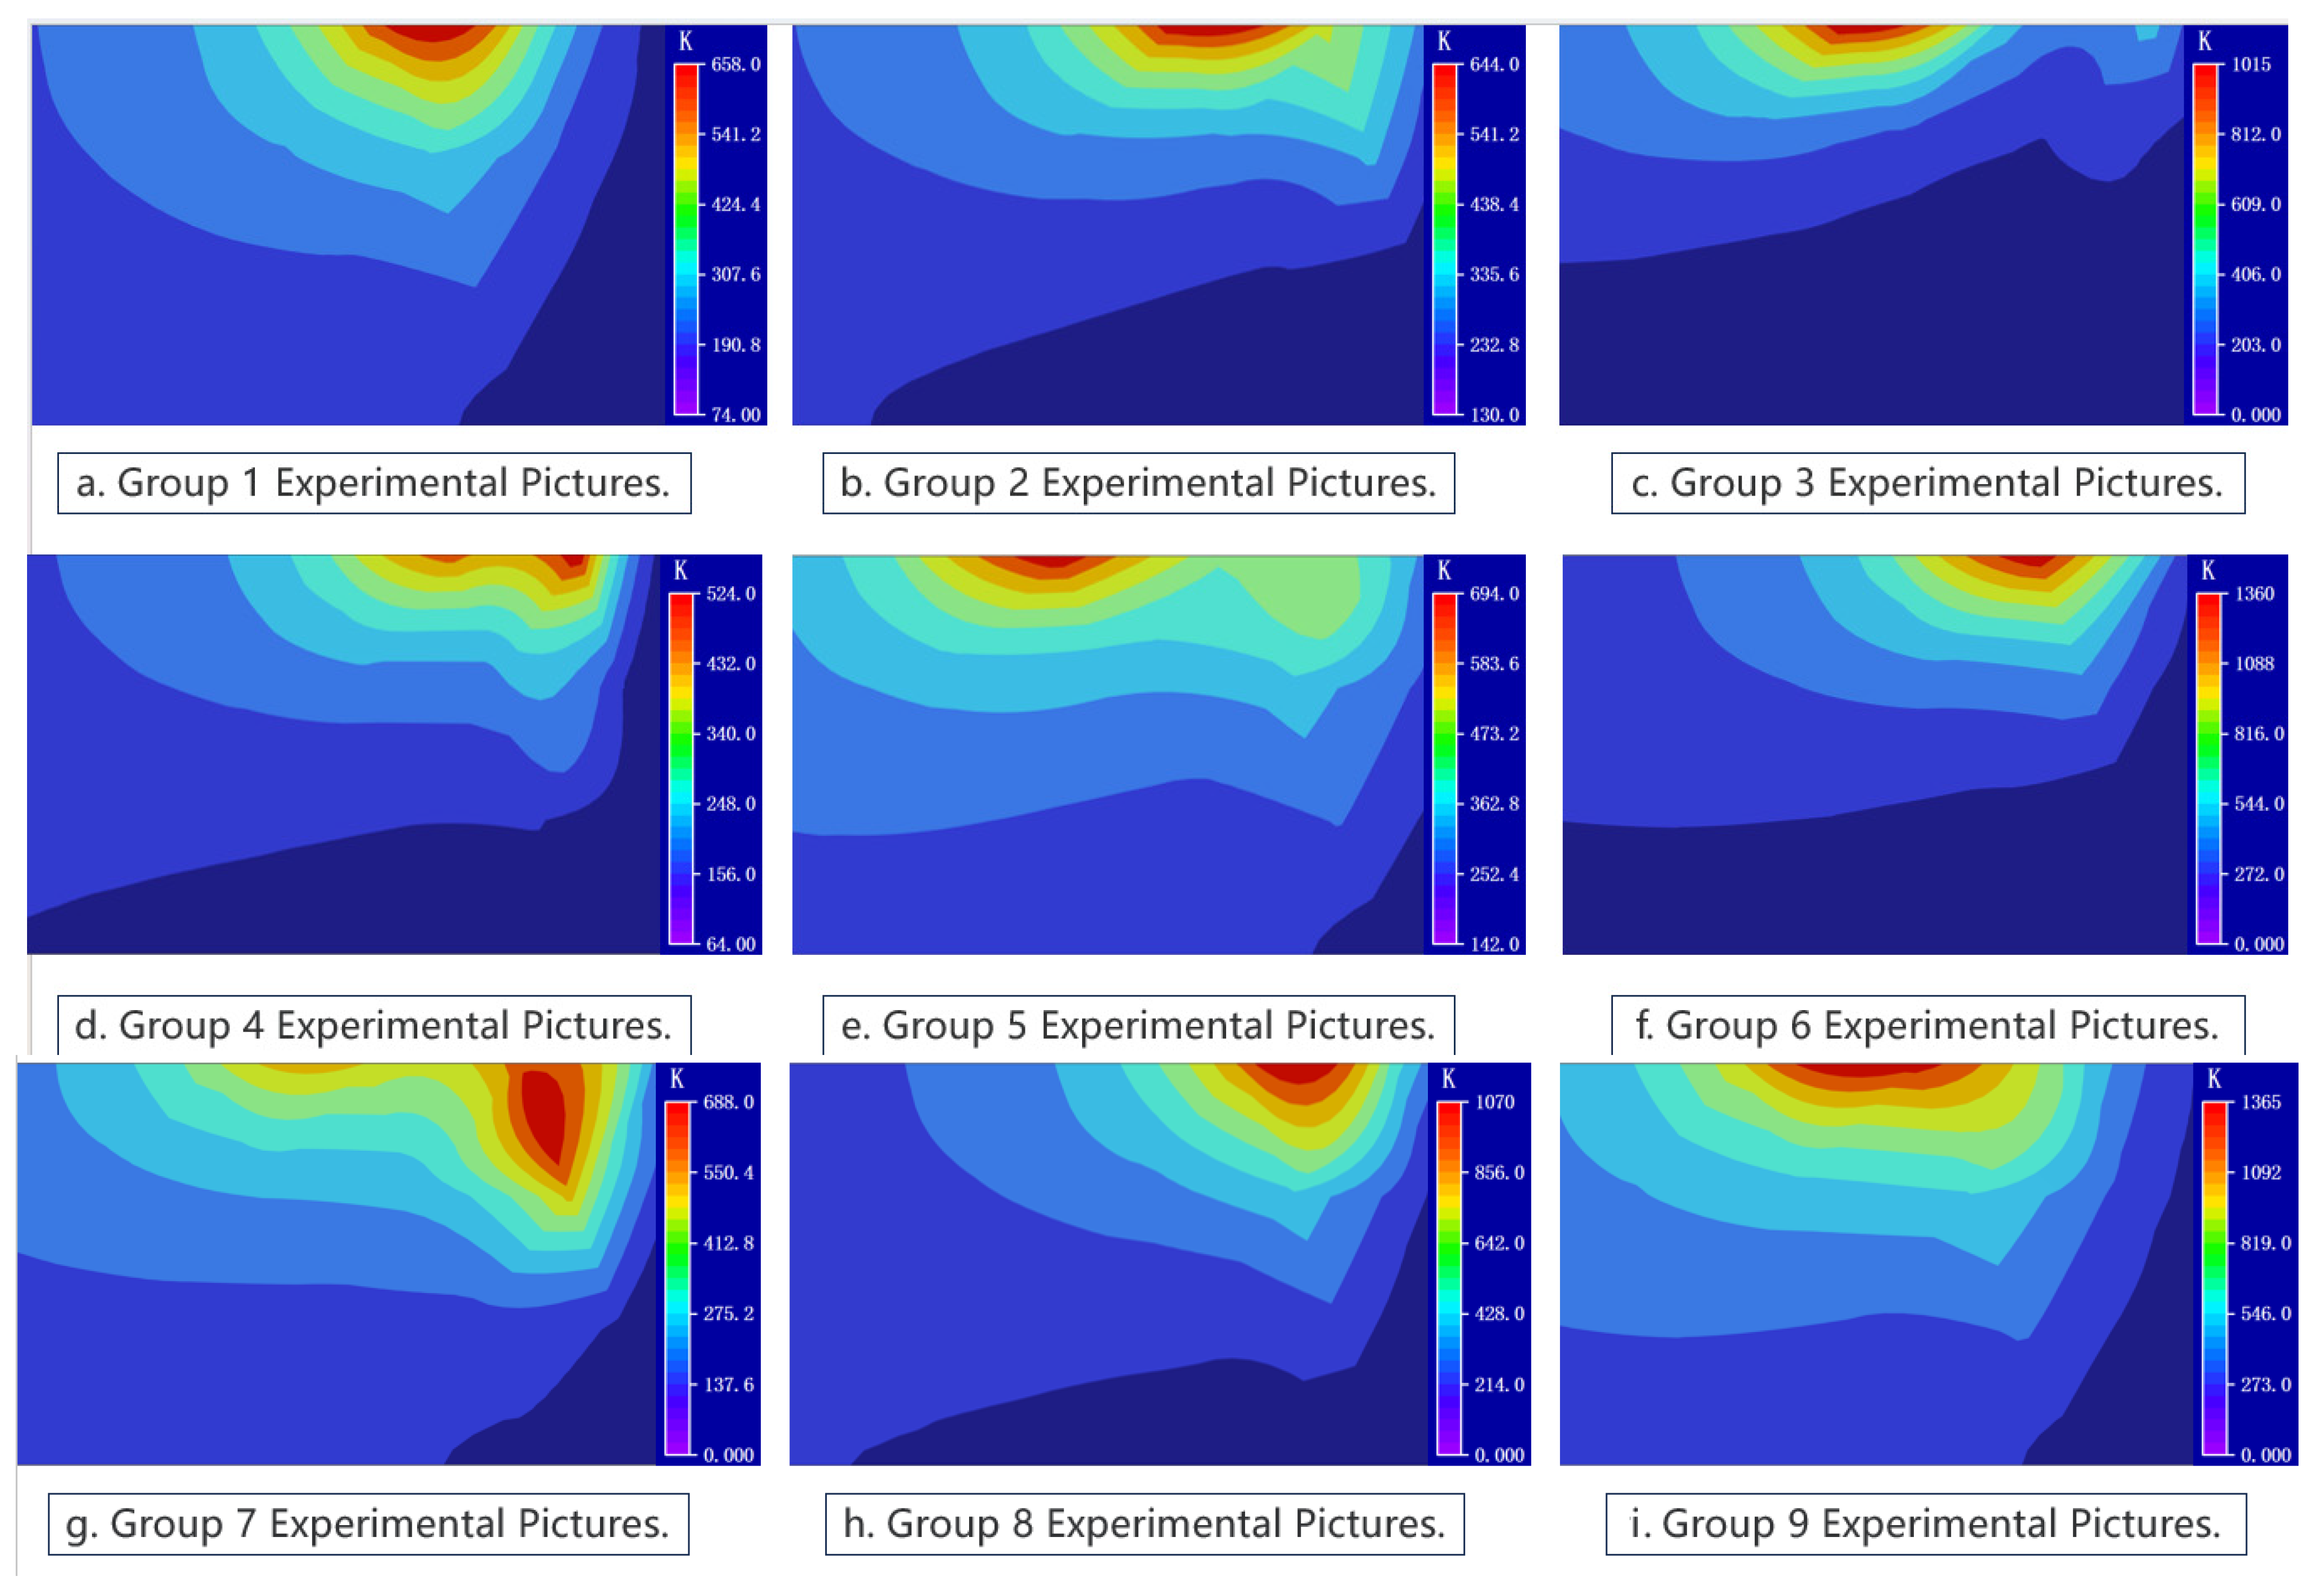
Figure 9 shows the peak temperatures during the simulation of the orthogonal experimental parameters.
Figure 9a–i corresponds to experimental groups 1 to 9, respectively. From the simulated temperature field diagrams, the peak temperature of the weld and the corresponding molten pool morphology can be clearly observed.
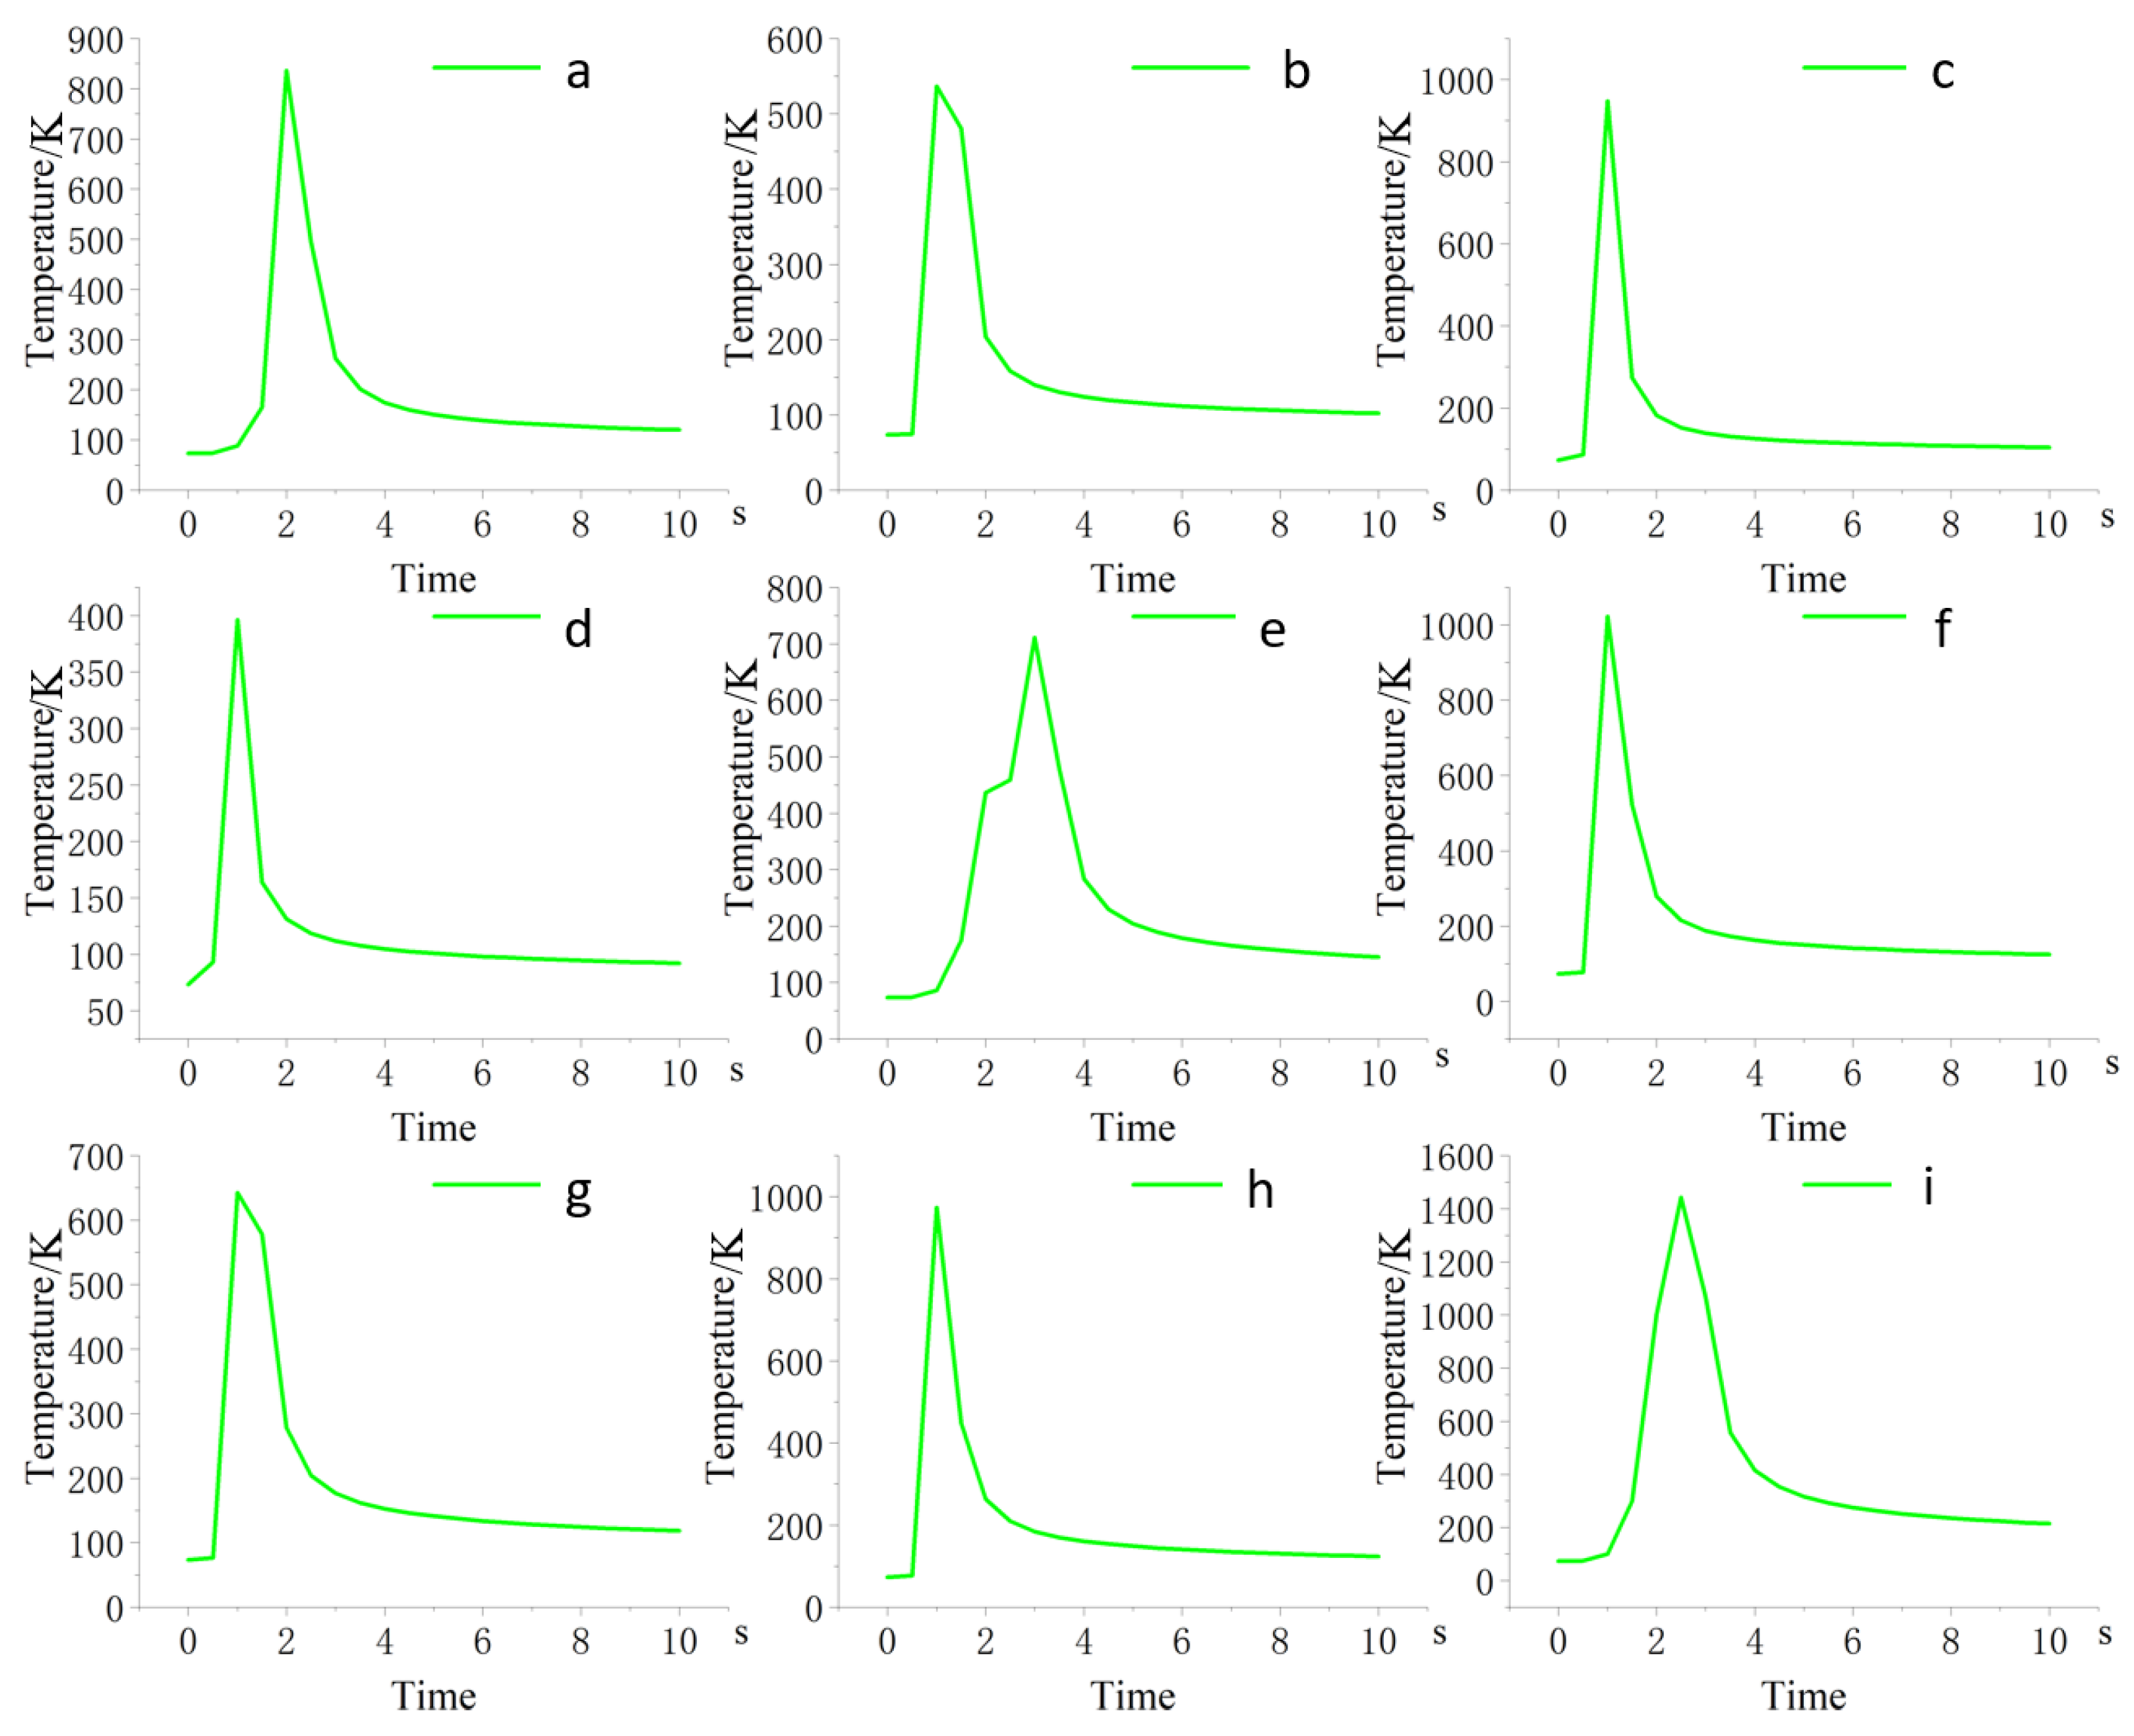
Figure 10 shows the temperature variation over time at the weld center, 10 mm from the welding start point. By comparing the point temperature graphs from Experiments 1 to 9, the following conclusions can be drawn:
Under the condition that the peak temperature falls within the range of 900–1000 K, a higher welding speed results in a shorter holding time. This is beneficial for grain refinement. From the nine graphs (a–i), it is evident that the temperature profile in graph E has the largest area, indicating a relatively long holding time. In contrast, the temperature profiles in graphs C and F have smaller areas, reflecting shorter holding times.
The comparison of experimental groups clearly shows that holding time is most significantly influenced by welding speed. The shorter the heat source dwell time, the shorter the holding time.
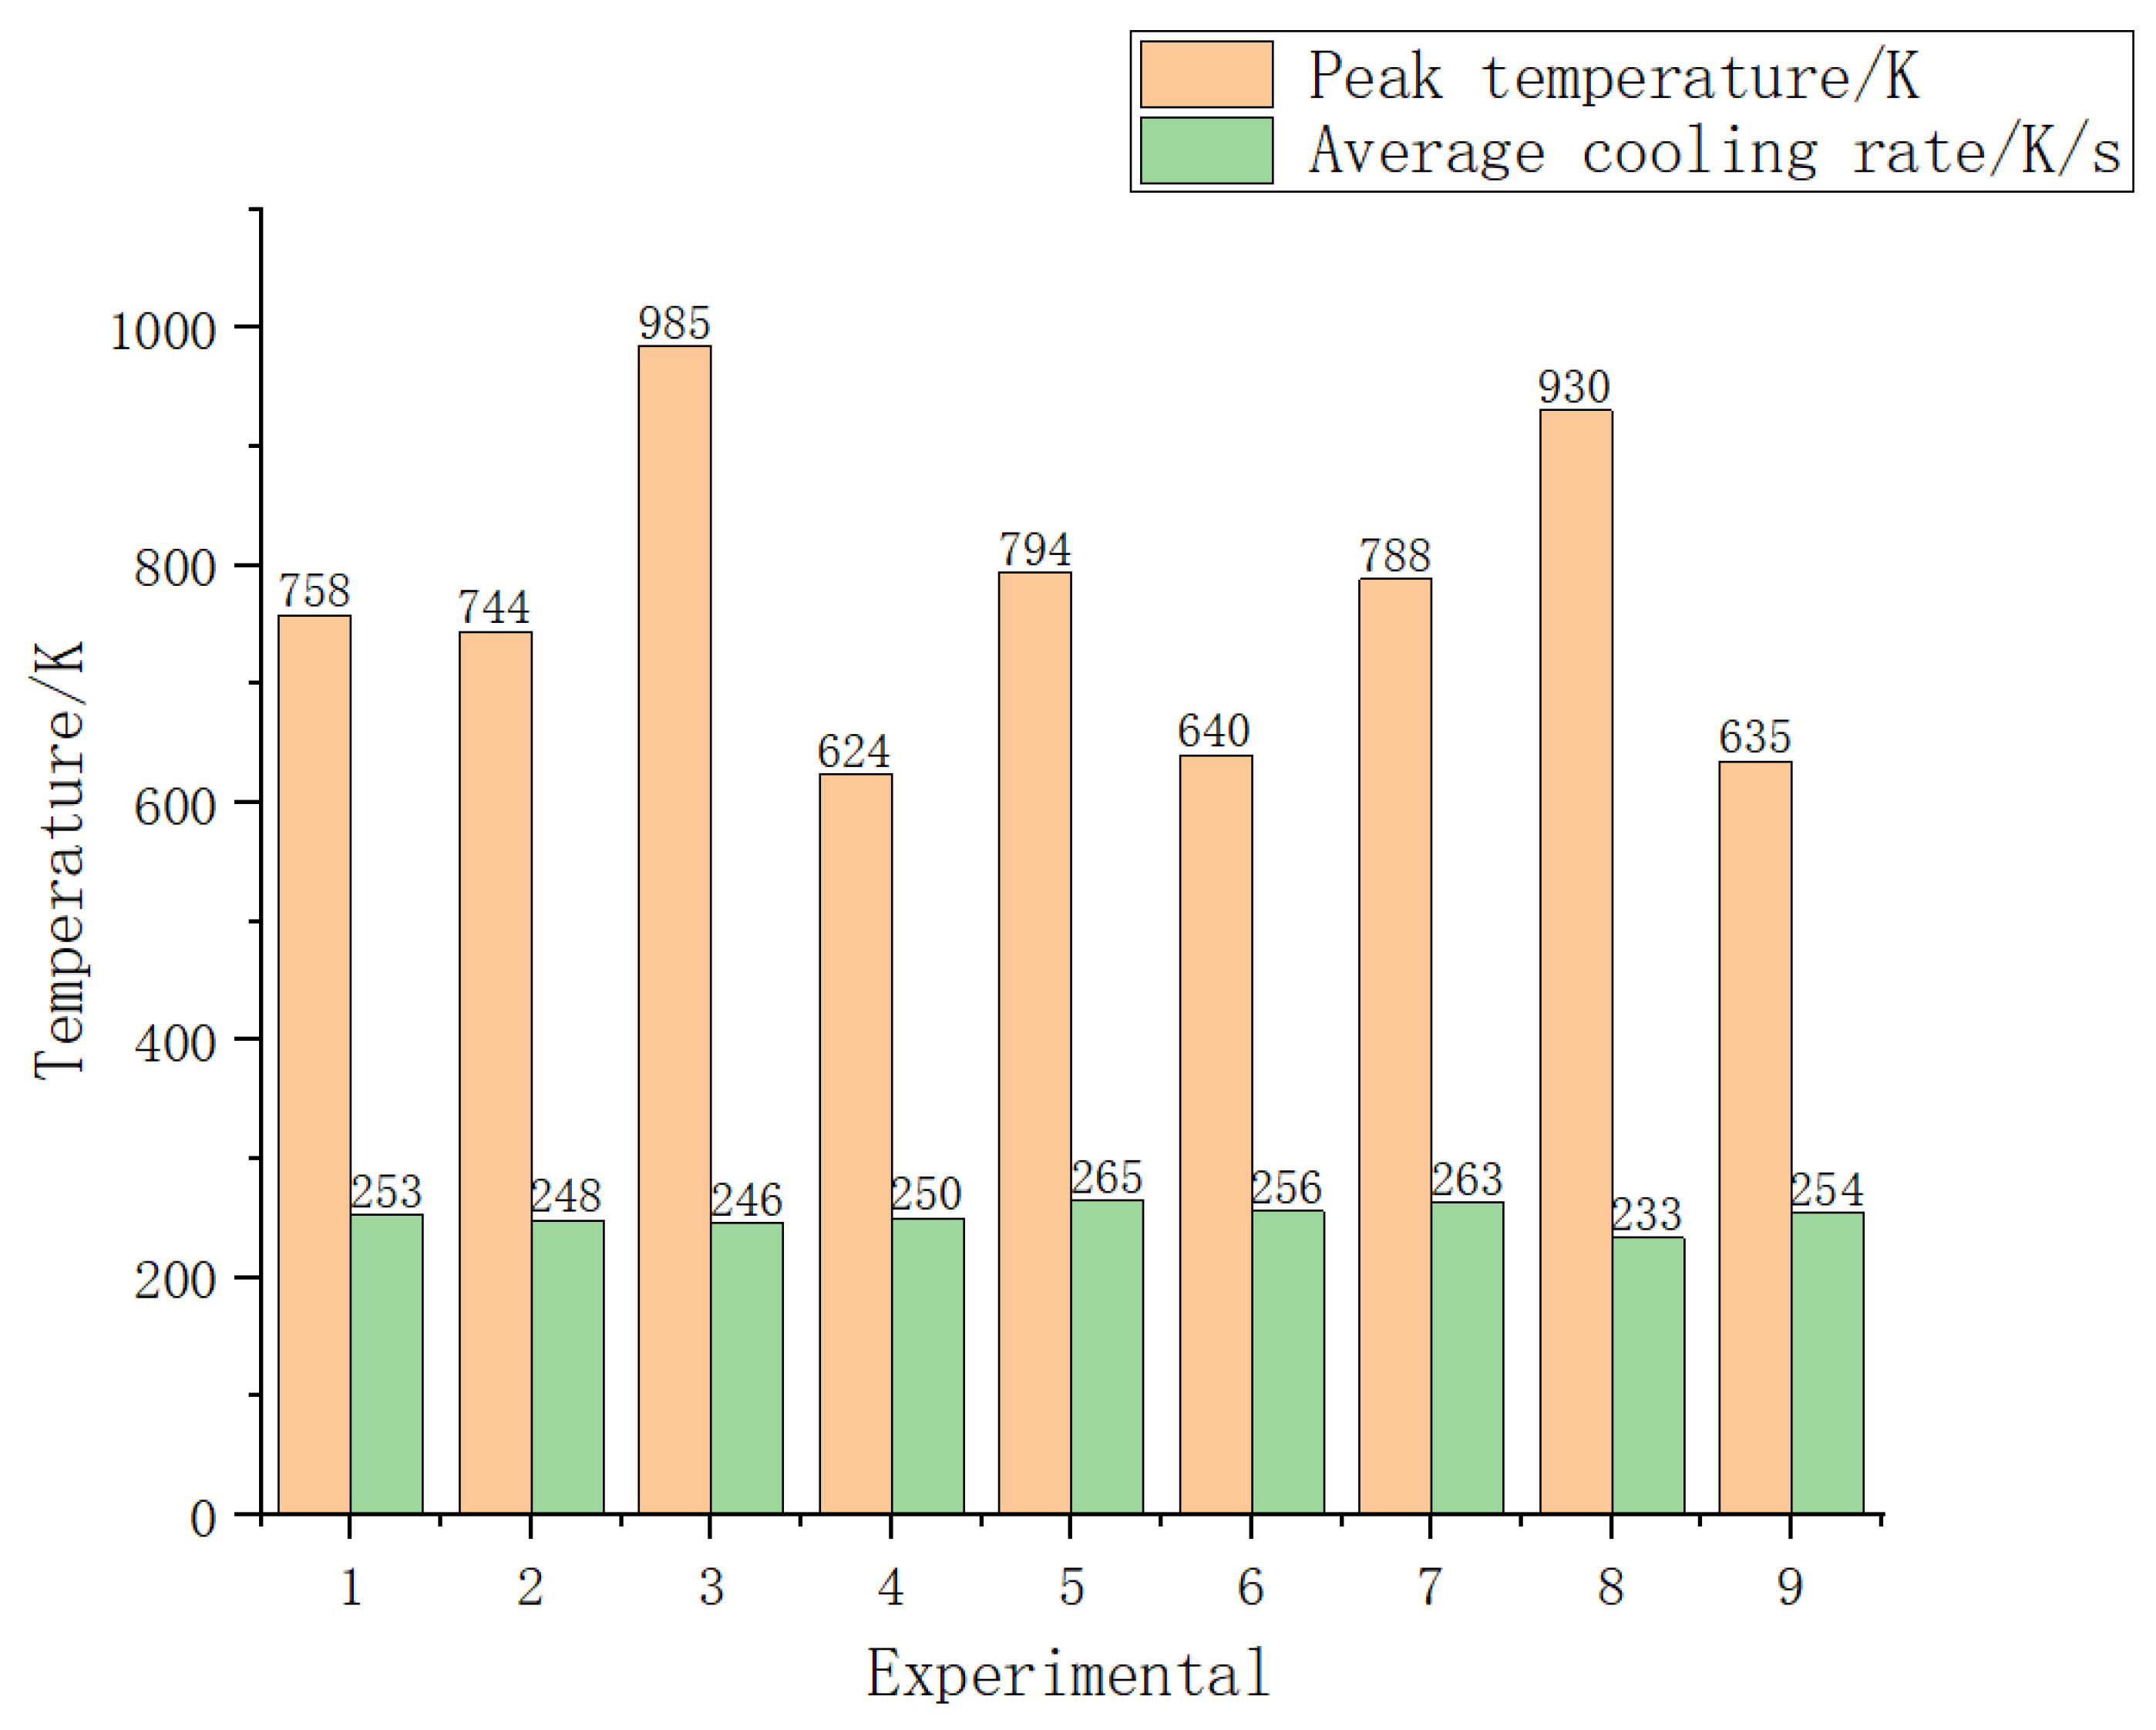
Figure 11 demonstrates the relationship between peak temperature and cooling rate under natural cooling conditions in the simulation. As shown, the magnitude of the peak temperature exhibits a negligible influence on the natural cooling rate of Q355 steel. Specifically, the average cooling rate from peak temperature to 700 K remained approximately 250 K/s under natural cooling conditions without additional insulation. This consistency suggests that process parameters (e.g., laser power, arc current) have a limited impact on cooling rates during laser-arc hybrid welding. Instead, the cooling behavior is determined primarily by the intrinsic thermal properties of the base metal. Furthermore, such cooling rate stability implies that there is no significant correlation with the mechanical performance of the weldments.
3.2. Welding Test Results
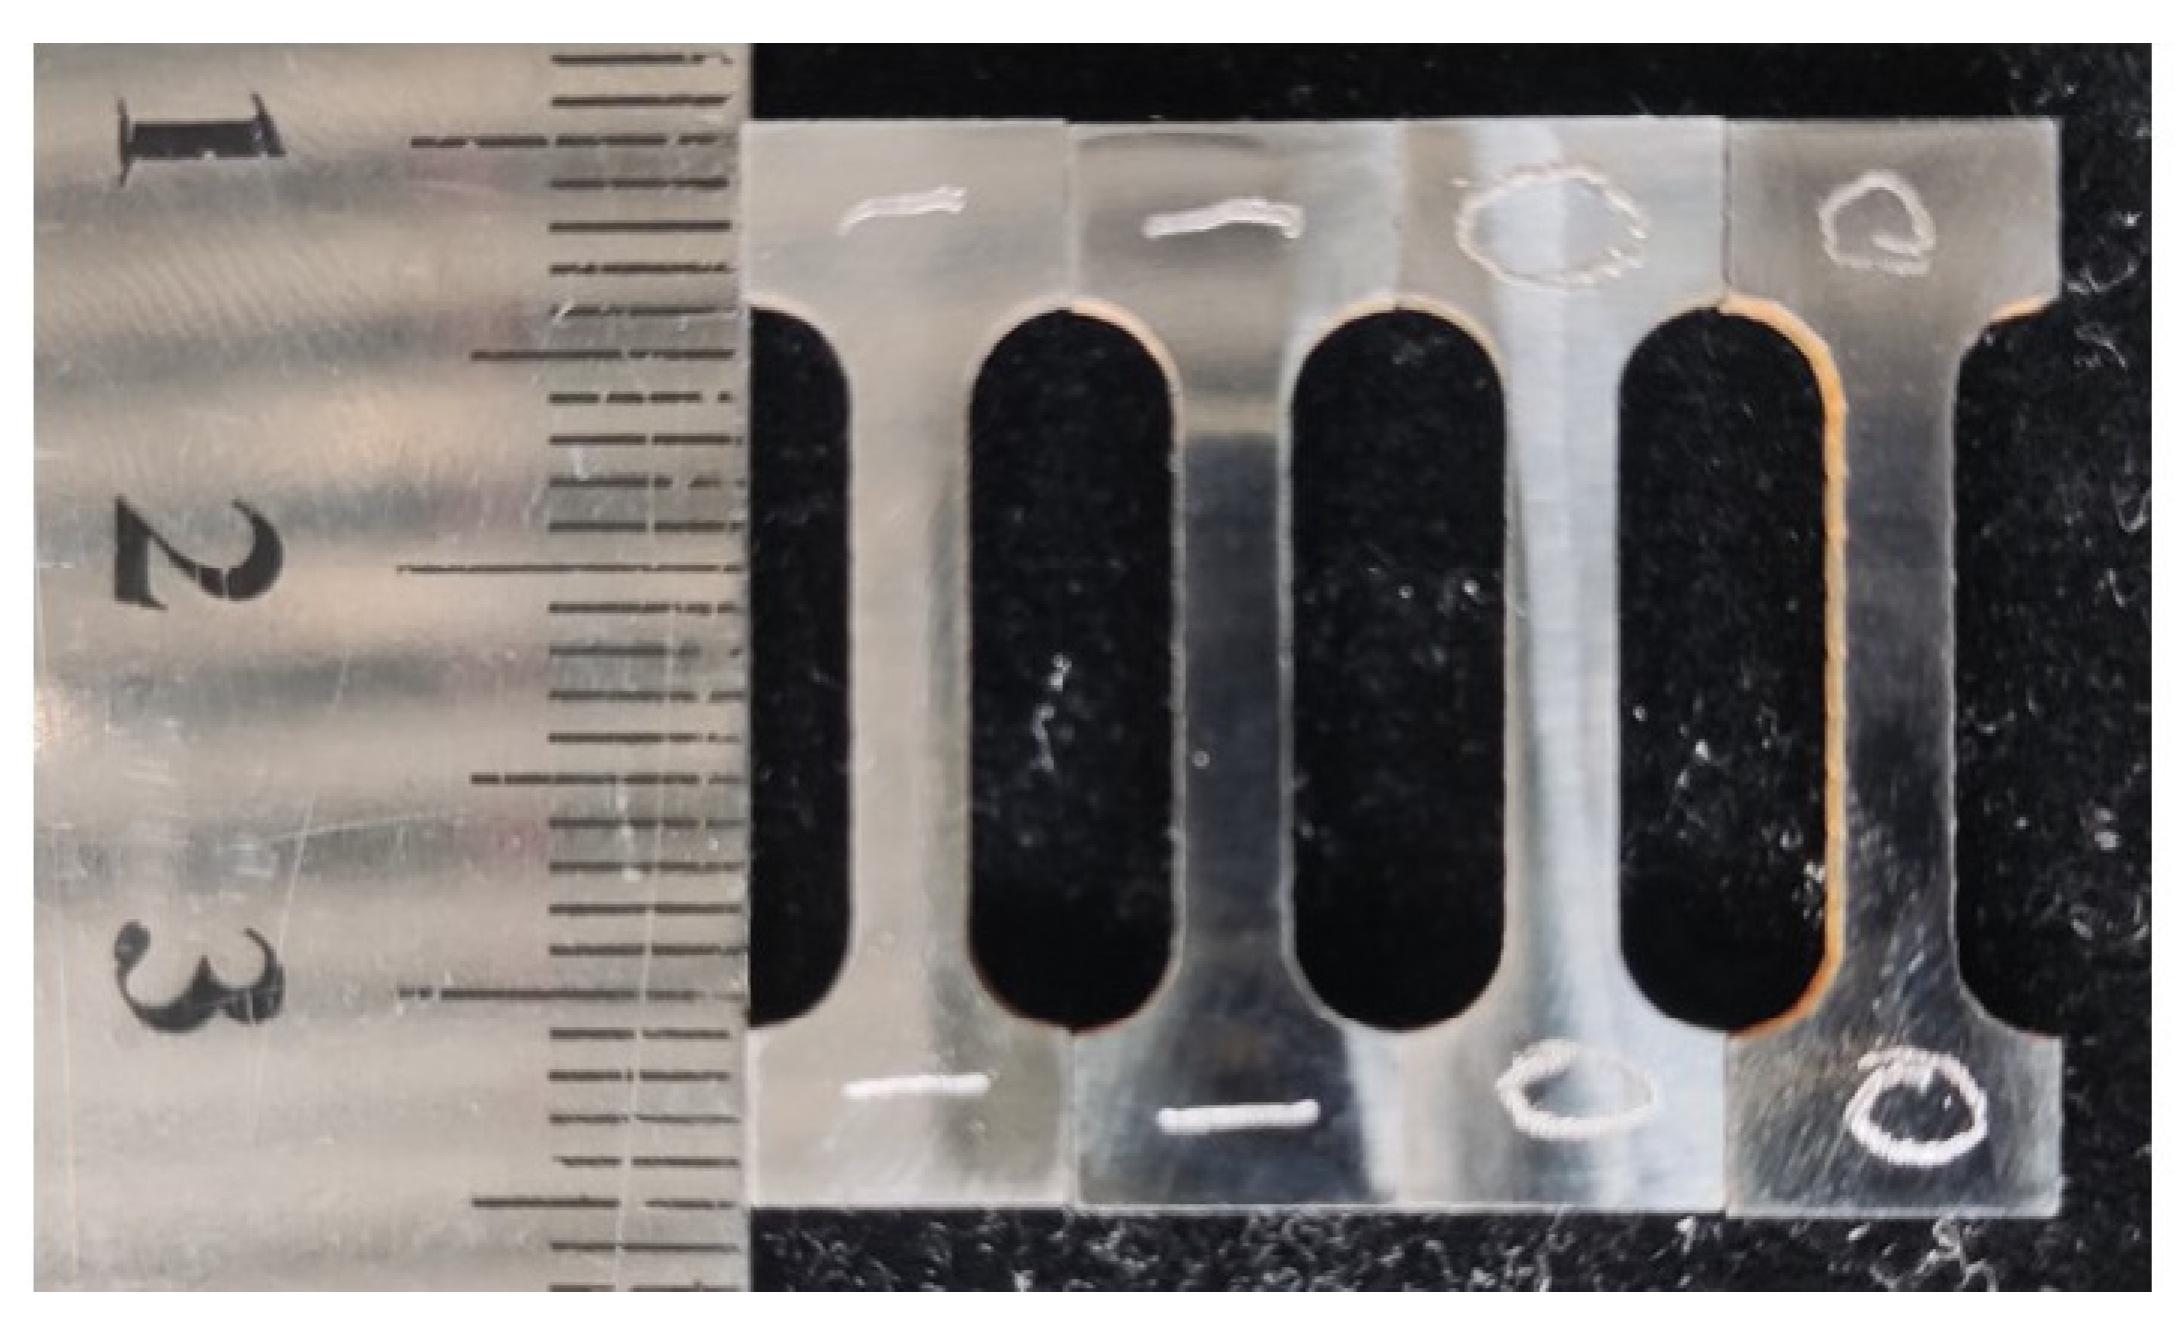
Within the optimal temperature range, the simulation of the surface numerical model is reliable. The weld seam is uniform, with a smooth and even surface, and distinct weld ripples. This indicates a stable welding heat source and the absence of significant welding defects, such as undercut, lack of fusion, or porosity.
The heat-affected zone (HAZ) is minimal. The laser-arc hybrid welding technique combines the high-energy density of the laser with the stable heat input of the arc, resulting in a narrow HAZ. This reduces changes to the base material’s properties and minimizes distortion.
The weld exhibits significant penetration. From the weld coloration and heat input distribution, the deep penetration is evident, which is attributed to the synergistic effect of the laser and the arc, which concentrates the heat transfer deep into the molten pool.
The improvement in weld quality can be primarily credited to the laser-arc synergy, which enhances penetration depth, reduces defect rates, and optimizes HAZ distribution.
Figure 12 shows the welding experiment results.
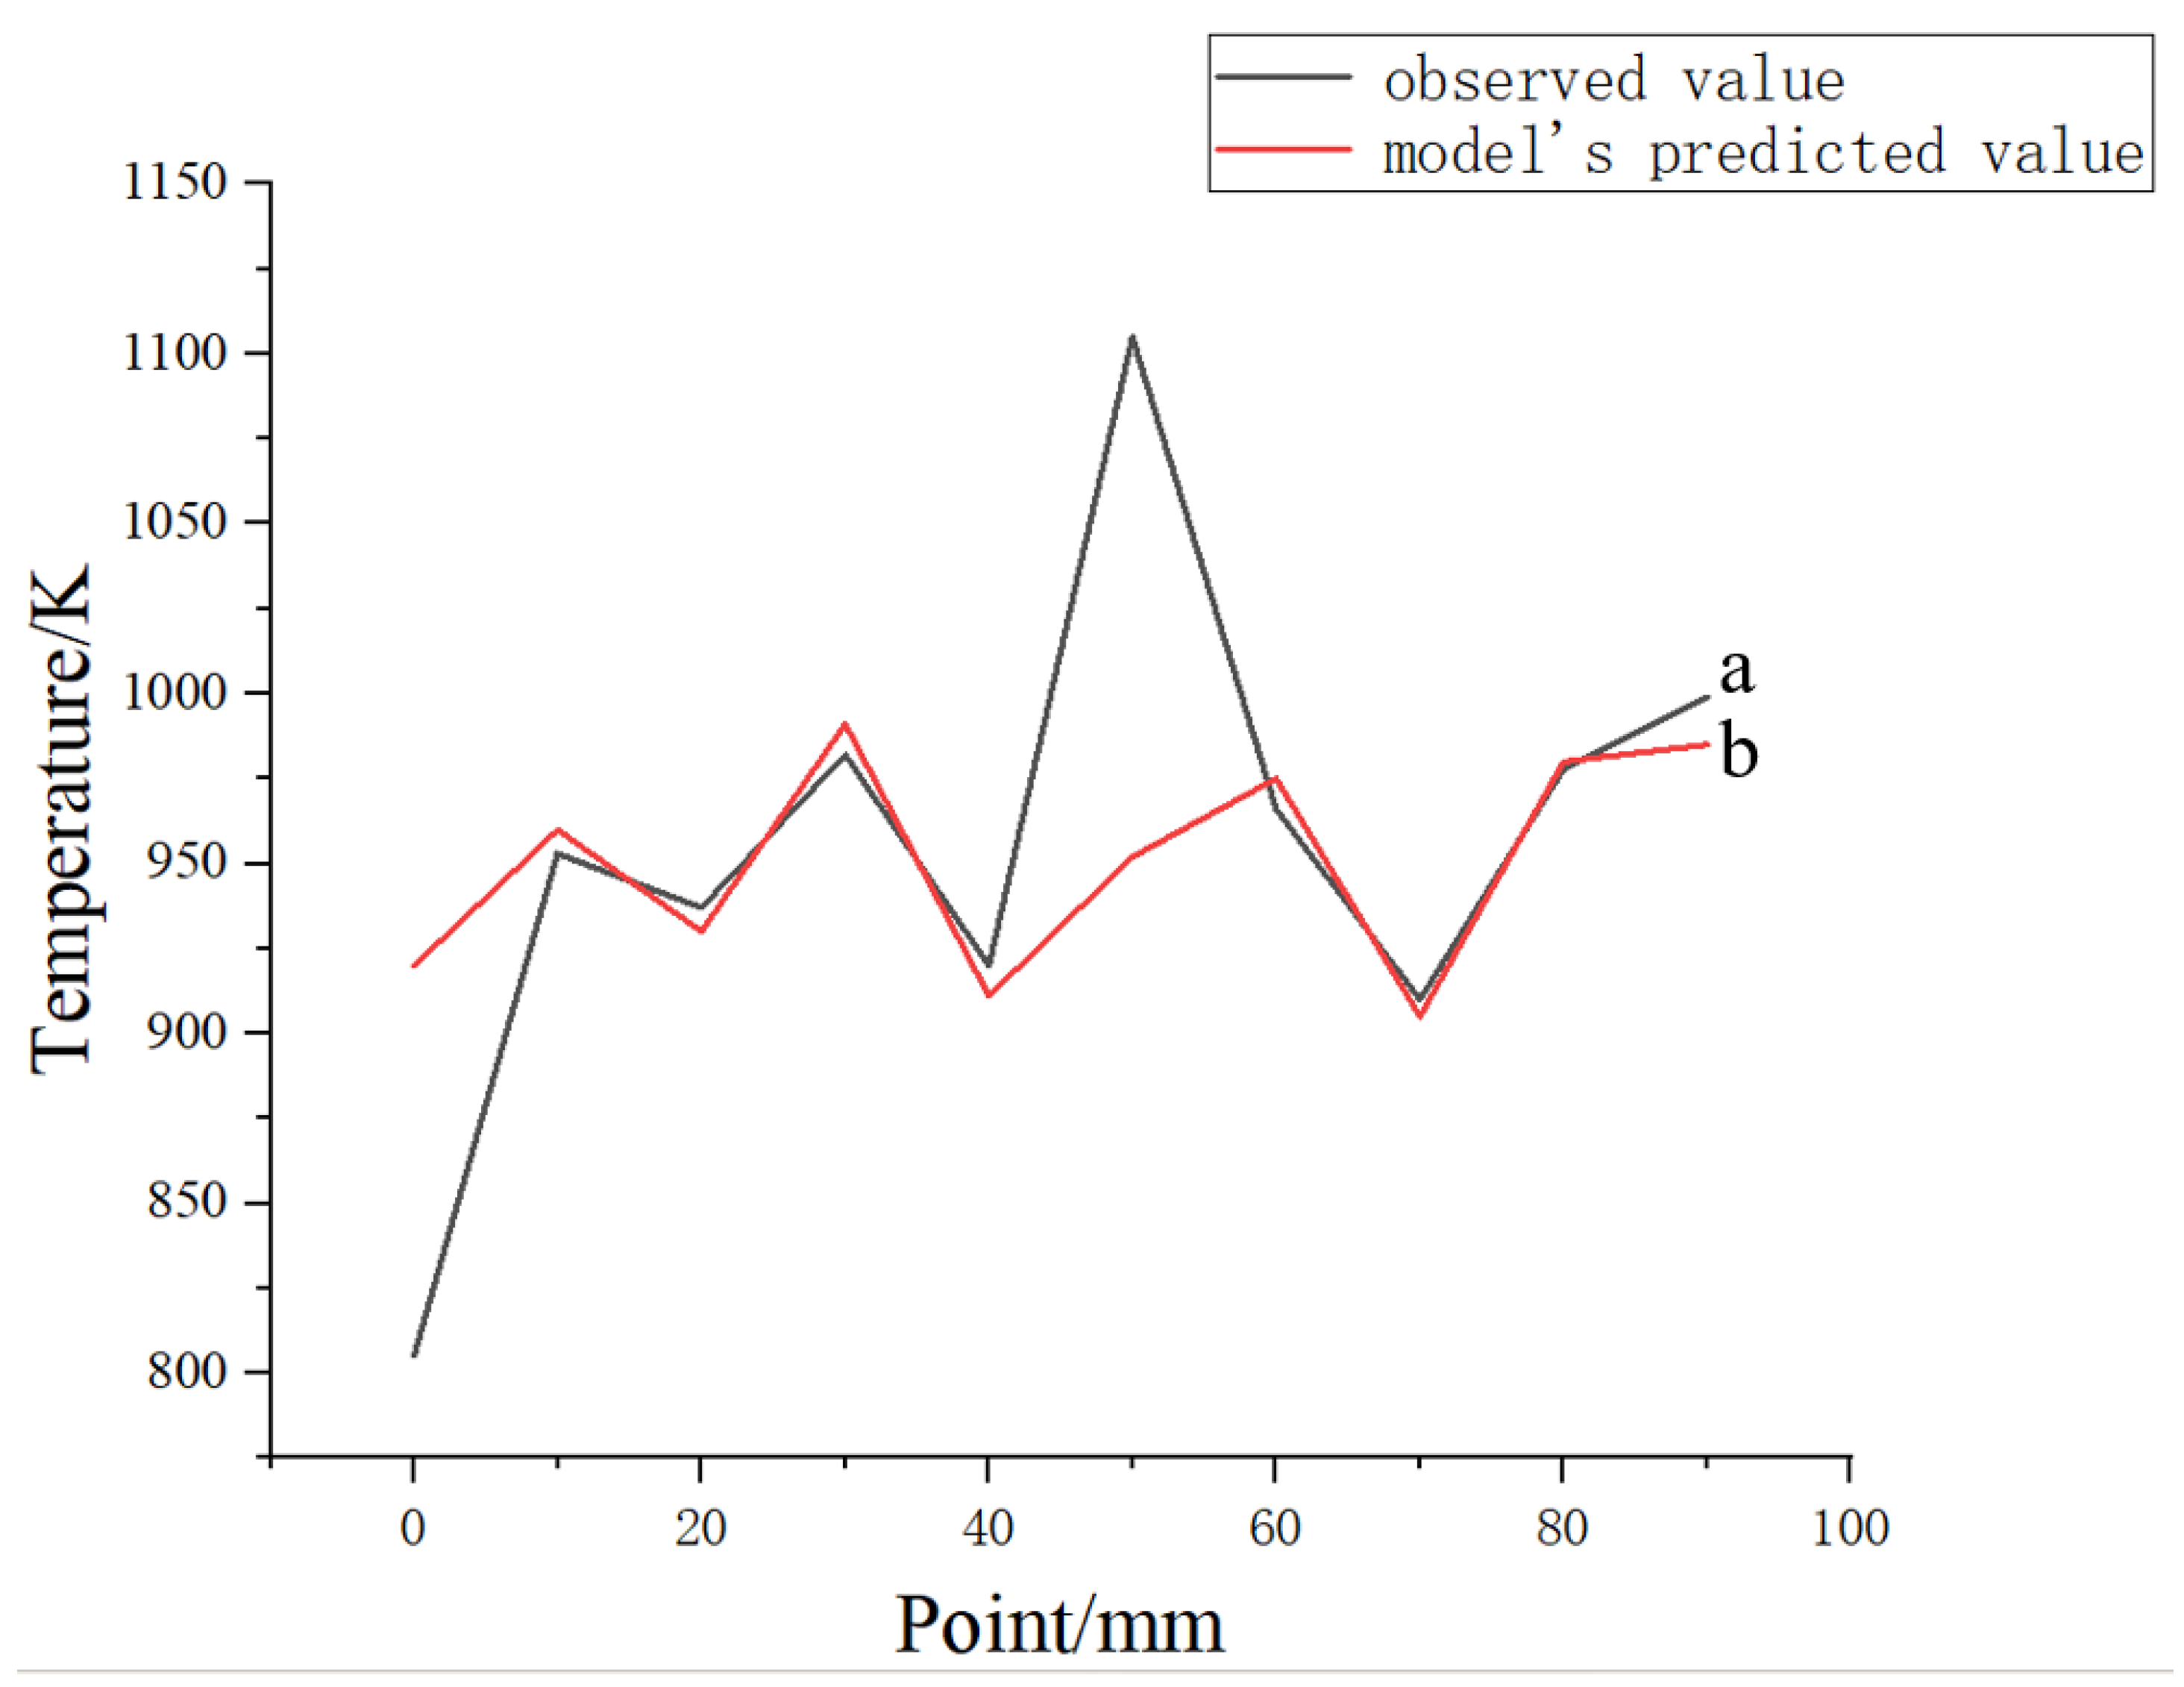
During the numerical simulation, ten-point temperature probes were inserted at 10 mm intervals along the weld seam to record the peak temperatures at the corresponding points throughout the welding process. These simulated peak temperatures were then compared to experimental measurements obtained from infrared thermometers positioned at identical probe locations during physical welding trials. The discrepancies between the simulated and experimental results were systematically evaluated through residual analysis to validate the model’s accuracy against actual welding processes. The formula for calculating residuals is as follows:
where
is the residual value,
is the observed value,
is the model’s predicted value, and
is the relative error.
Figure 13 presents the temperature curves, comparing the observed and simulated values. Curve ‘a’ represents the observed values, while curve ‘b’ represents the model’s predicted values. By comparing these curves, we observe that, except for a few points, the temperature trends of the observed and predicted values align well, indicating a good agreement between the simulation and experimental results.
Table 8 presents a comparison of error and residual analyses between the actual welding process and the simulation model’s peak temperature differences. By selecting ten points along the weld seam at 10 mm intervals, starting from the center, we observe that, except for the initial point and the sixth point, the predicted and observed values for all other points align within approximately 1%. Overall, the average error is only 5%, indicating that the numerical simulation model is reliable.
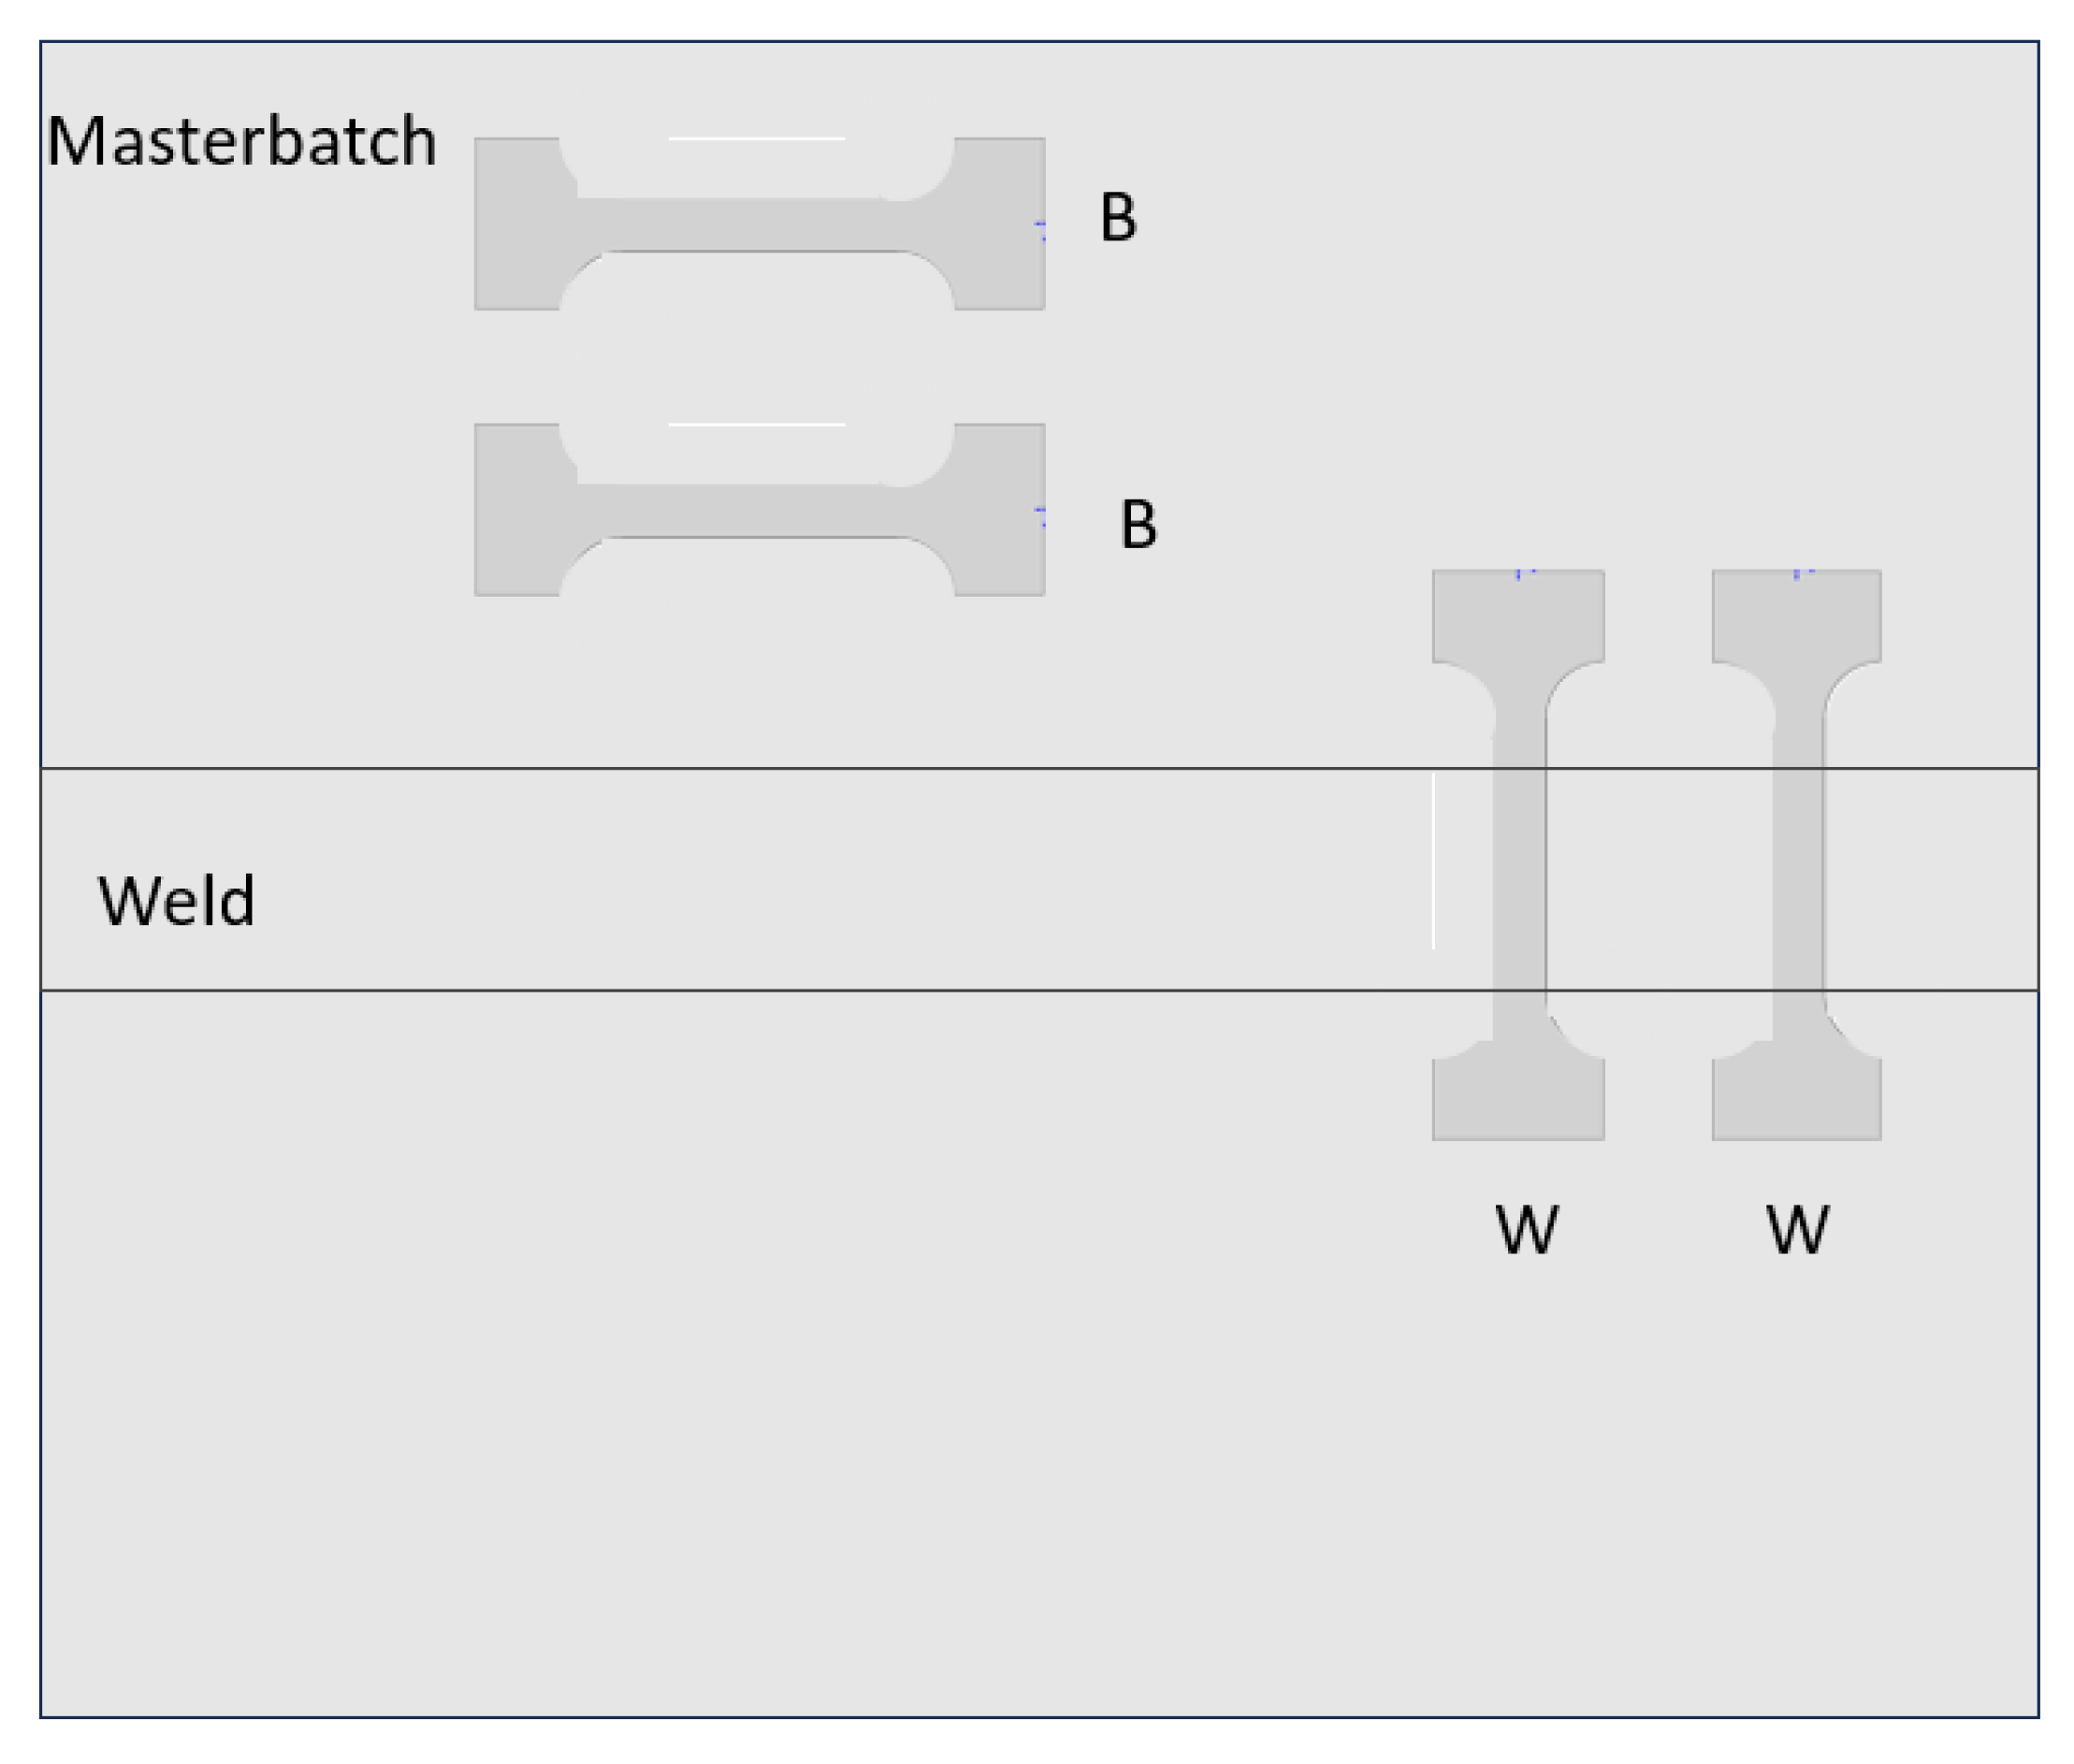
The HV-1000 Vickers hardness tester was used to measure the hardness at the center of the weld, in the heat-affected zone (HAZ), 6 mm away from the weld center, and in the base material zone, 25 mm away from the weld.
Figure 14 illustrates the process of selecting the locations for microhardness test points.
The hardness was tested at five points along the weld, with a spacing of 0.5 mm between adjacent points. A load of 1000 N was applied for 10 s.
Table 9 shows the hardness measurement results for the weld zone, heat-affected zone, and base material zone. By comparing the hardness values from different regions, it was found that the average hardness in the heat-affected zone was the highest, at 203.8 HV, followed by the weld zone, at 189.2 HV, and the lowest was in the base material zone, at 169.8 HV. The reason for this result is that the base material has finer grains, resulting in lower hardness, while the grain growth during welding increases the hardness in the heat-affected zone and the weld zone, making them harder than the base material.
3.3. Tensile Test Results
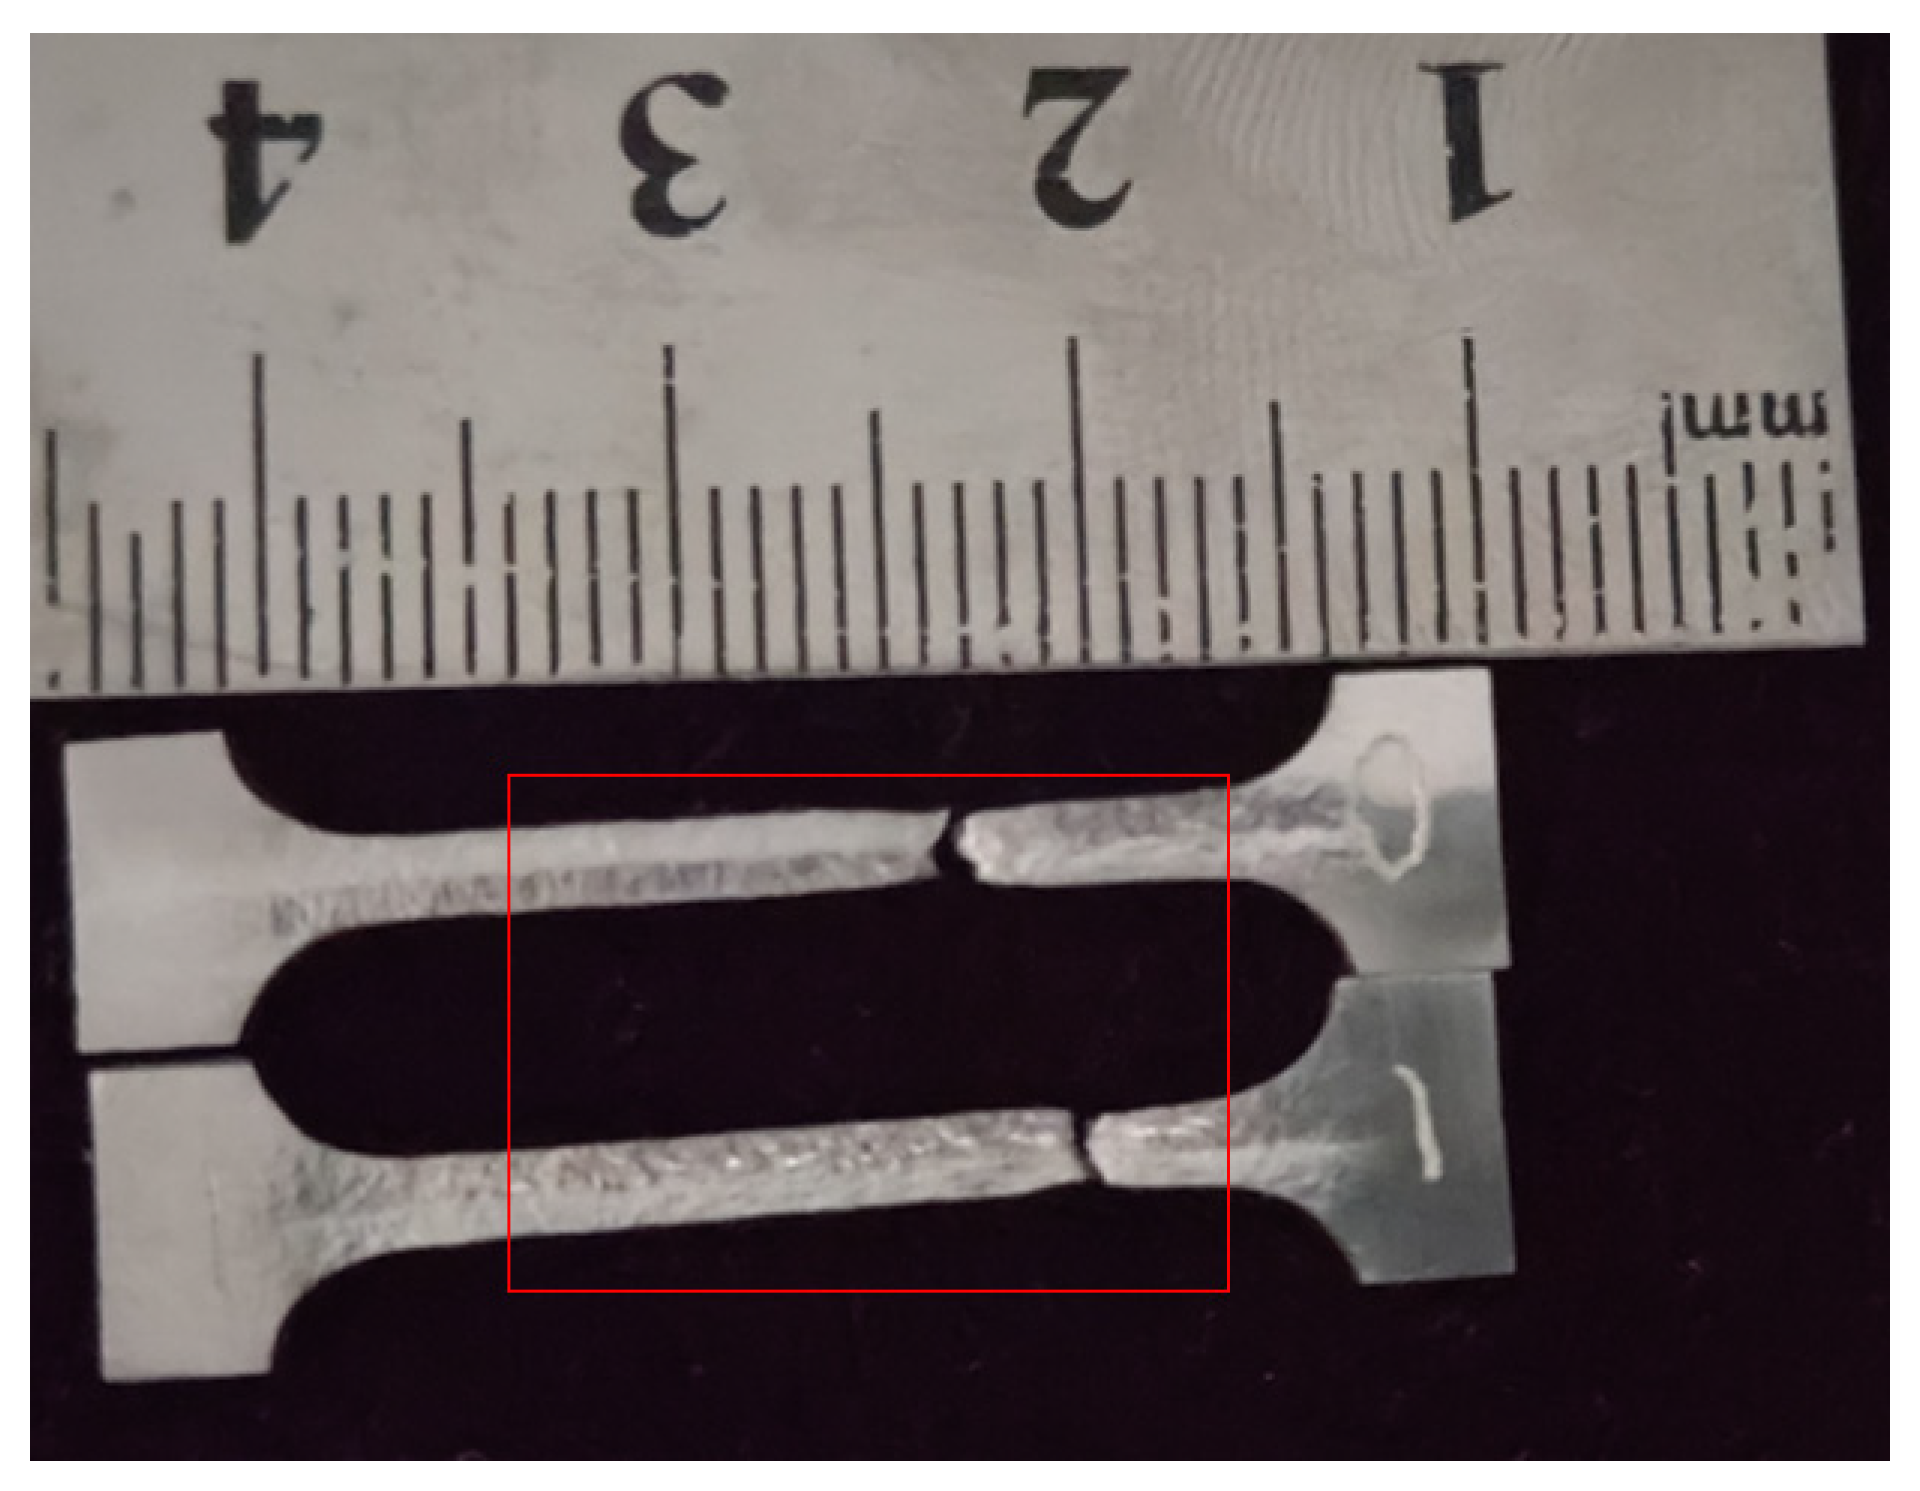
The tensile test results for specimens from the base material and weld zone under a loading rate of 0.5 mm/min are shown in
Figure 15. From the post-tensile comparison, it is evident that both the weld and base material specimens fractured in the same location, concentrated in the base material zone, with noticeable elongation compared to their original state. The fracture occurred in the base material rather than in the weld or heat-affected zone, indicating that the weld exhibits excellent tensile performance.
The strain range of the weld (a) is consistent with that of the base material and (b) exhibits a more prolonged plastic deformation phase under high-stress conditions. Notably, at a strain of 55%, the weld curve shows a brief stress spike (indicated by the arrow in
Figure 16), which may result from the pinning effect of solute atoms on dislocations during dynamic strain aging. This reflects the dynamic interaction between dislocation movement and microstructure in the fine-grained weld. This indicates that the weld possesses ductility comparable to, or even exceeding, that of the base material. The weld zone elongation reaches 77%, a 4% improvement over the base material’s at 73%, fully demonstrating the weld’s excellent plasticity. This performance indicates that the welding process effectively suppresses grain coarsening or defect formation in the weld zone, ensuring that the weld’s plasticity and toughness indicators align well with those of the base material, in accordance with the technical requirements of the Chinese national standard, “Steel Structure Welding Code” (GB 50661-2011). The fracture locations and stress levels of both are highly consistent, and the weld does not exhibit brittle fracture characteristics, indicating that its plasticity and fracture resistance have reached or surpassed the base material’s level.
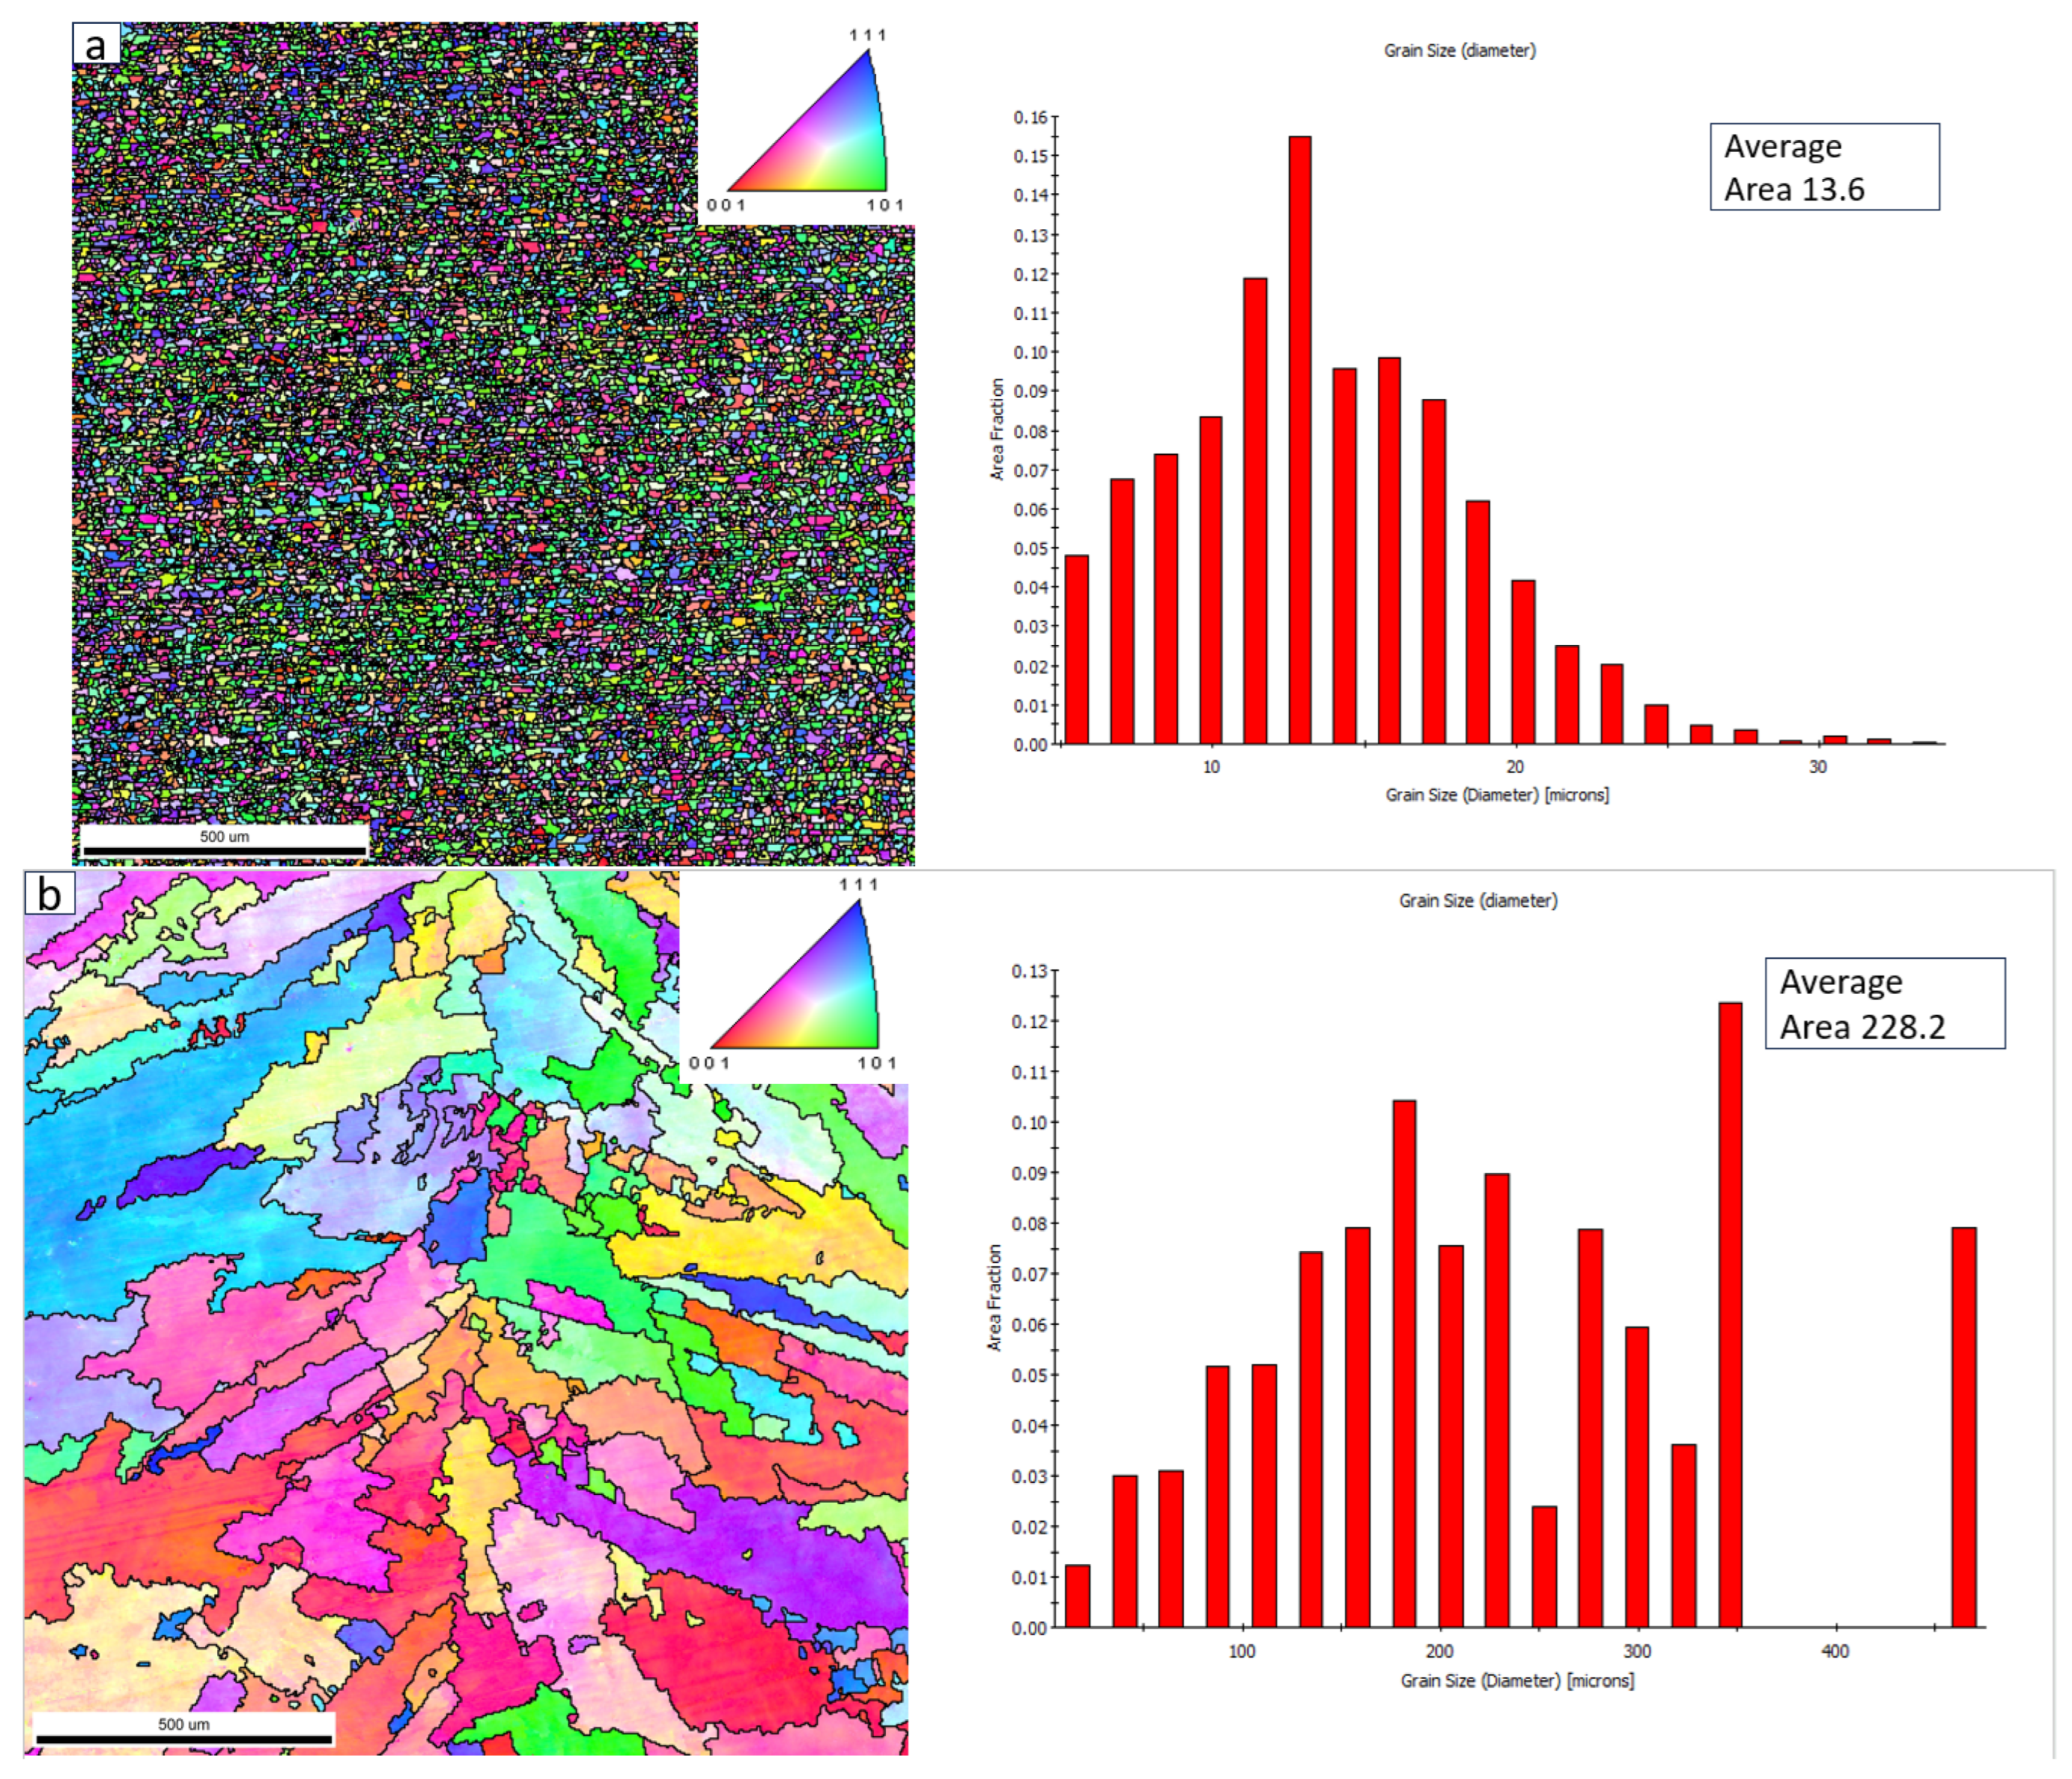
Figure 17 shows the EBSD microstructure maps of the base material and the weld. Subfigure (a) represents the microstructure of the base material, and subfigure (b) represents the microstructure of the weld. By comparison, we observe that the grain structure of the base material is tightly arranged, while the grains in the weld grow in a dendritic pattern from the center and are also closely packed. Both grain arrangements contribute to excellent mechanical properties. The average grain size of the base material is only 13 μm, and such a fine grain structure leads to lower tensile properties and hardness compared to the weld. In contrast, the average grain size of the weld has grown to 228 μm due to the welding process, resulting in improved mechanical properties, as well as particularly better tensile strength and overall performance. Both the weld and the base material are primarily composed of alpha (α) and gamma (γ) phases.
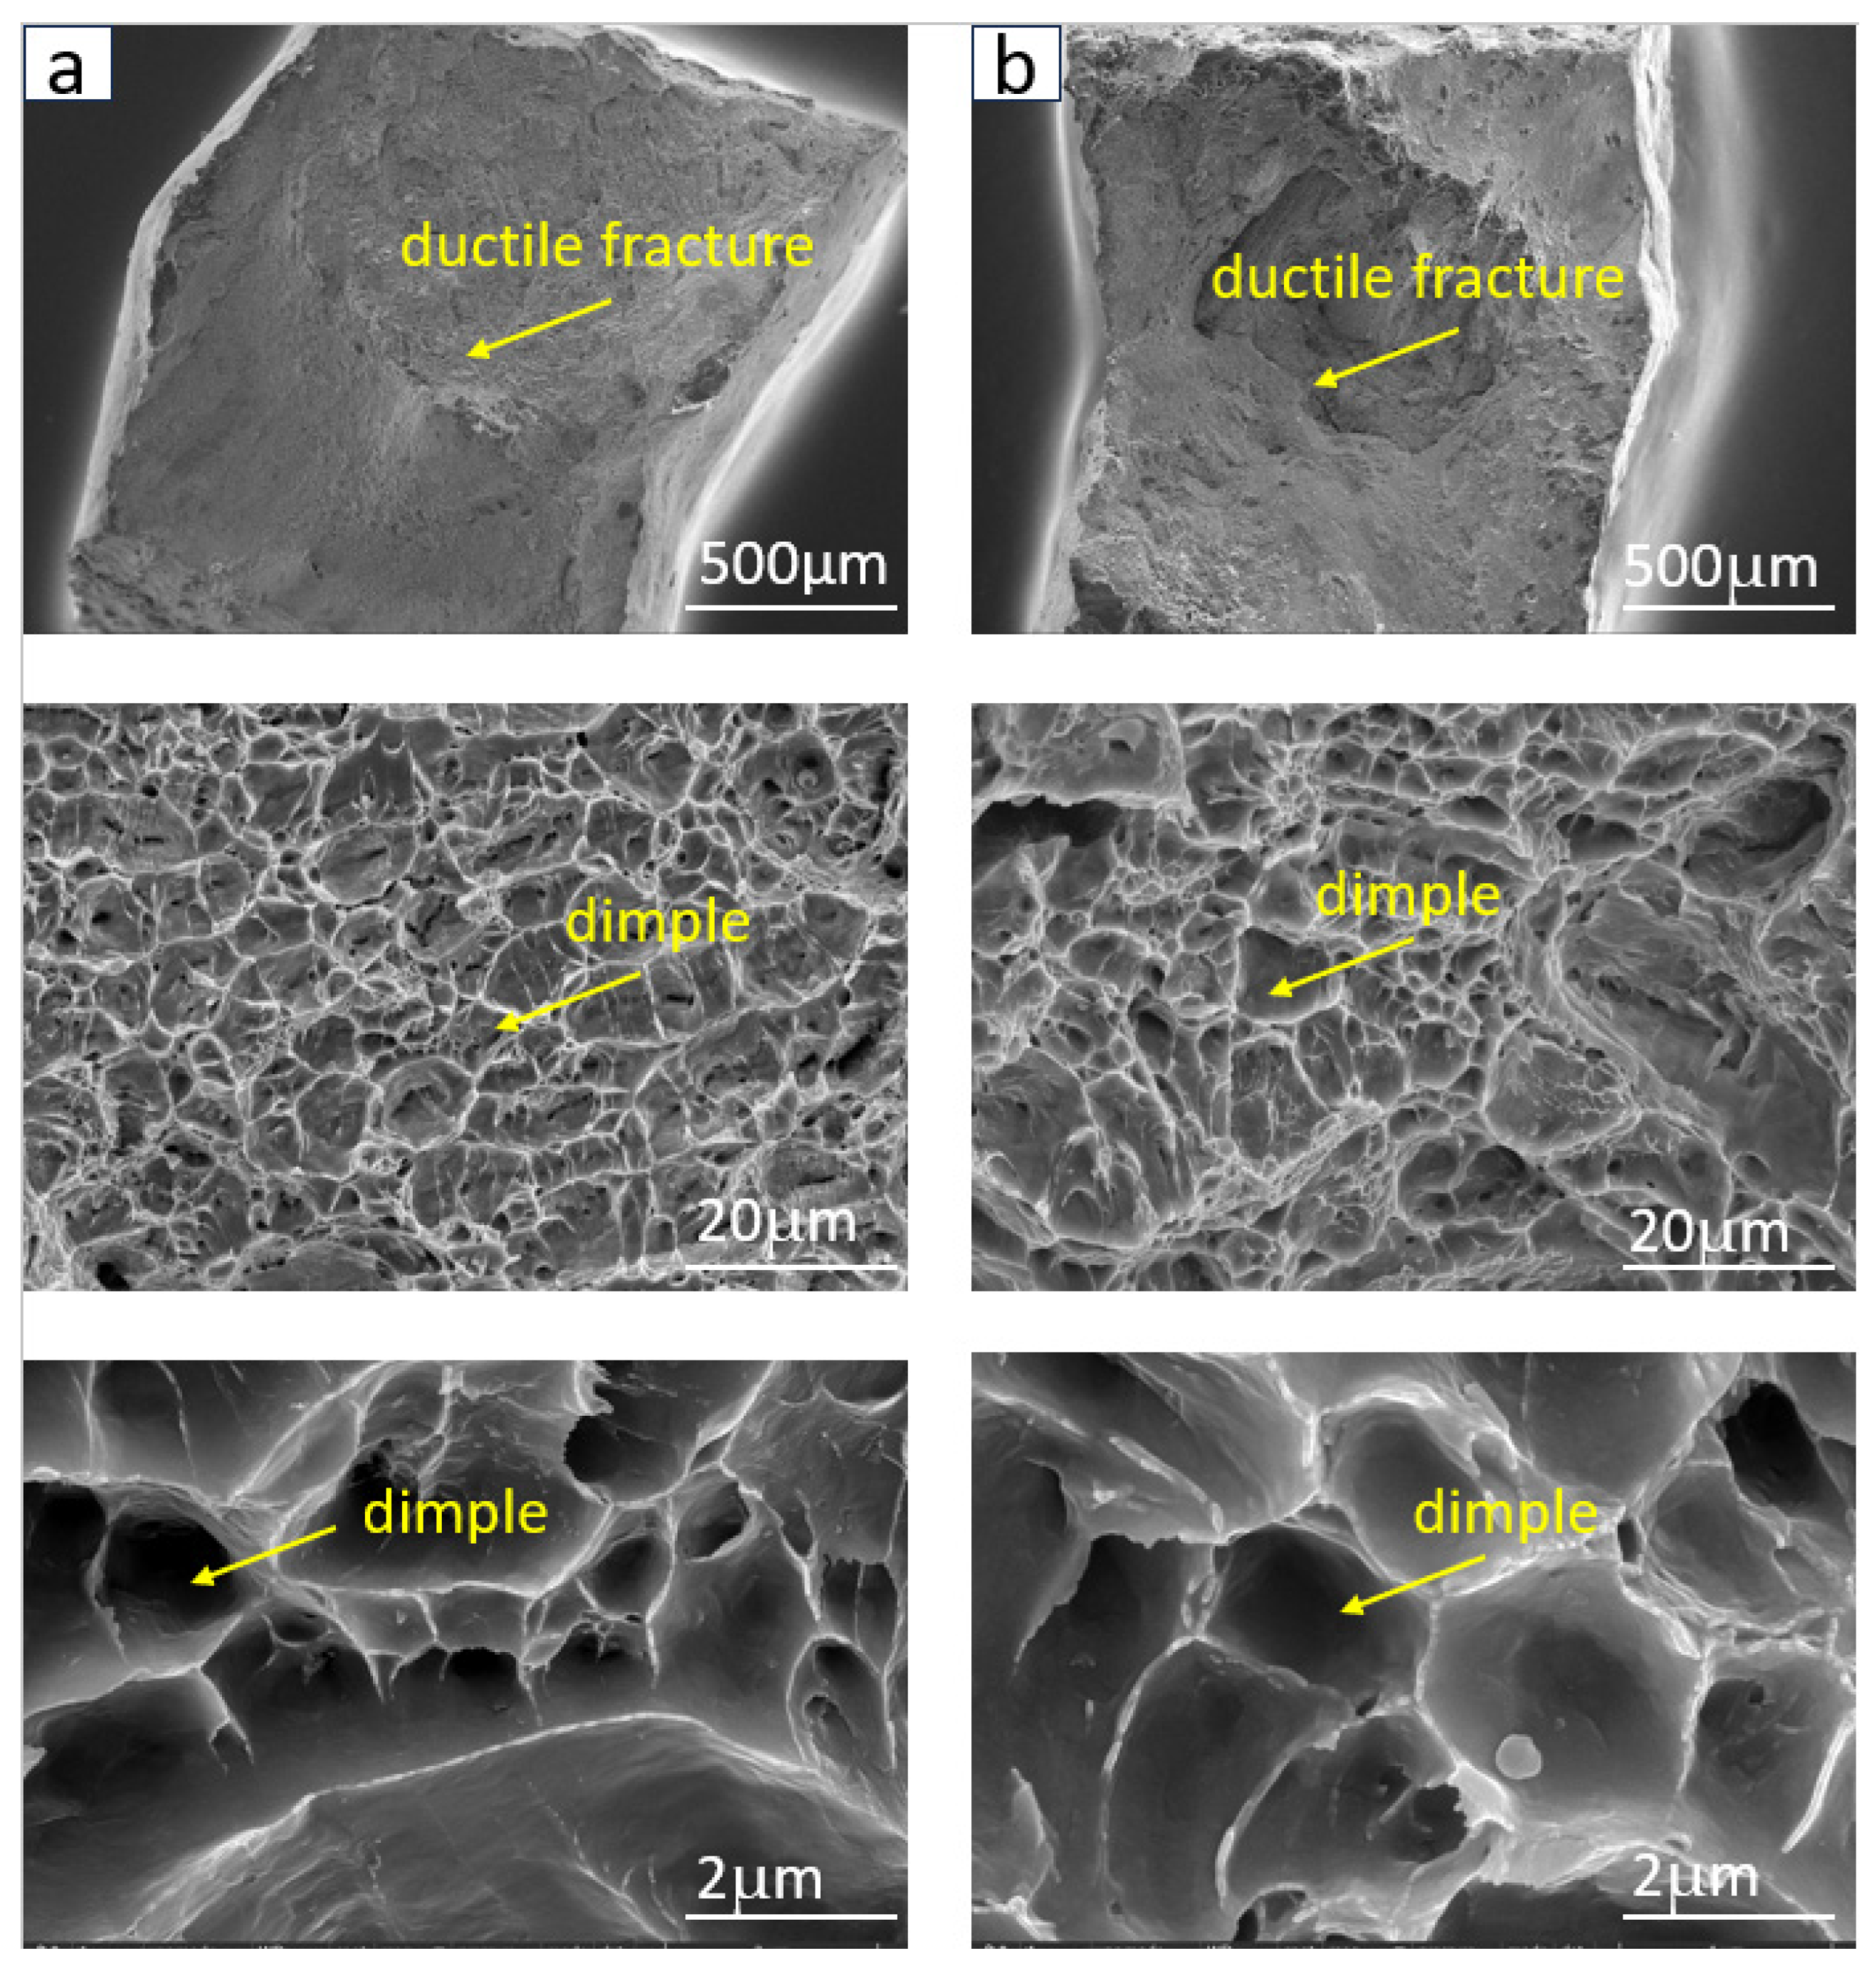
The following are the SEM tensile fracture images of the weld and base metal, at a tensile rate of 0.5 mm/min. The images below show the SEM morphology of the base metal and weld fracture surfaces [
31]. As shown in
Figure 18, the cross-sectional morphology comparison reveals that the base metal fracture (a) exhibits a relatively uniform and dense distribution of dimples, indicating good toughness and plasticity, with the ductile fracture being dominant. The weld fracture (b) also shows clear dimple features, with the depth and diameter of the dimples being comparable to those of the base metal. In some areas, the dimples are even deeper, suggesting that the weld metal underwent significant plastic deformation during loading. The fracture process was accompanied by the accumulation of numerous microvoids and an increase in toughness. Dimples are features of microvoid accumulation formed during plastic deformation in tensile fracture, and the quantity, depth, and distribution of dimples directly reflect the material’s overall toughness and tensile properties. An analysis of the dimple features reveals that the weld fracture (b) exhibits well-formed and evenly distributed dimples, indicating that the weld metal has good plasticity and fracture resistance. Both the base metal and weld fractures are dominated by ductile fracture, with no brittle fracture features observed. The deep and evenly distributed dimple structure in the weld (b) suggests that the weld metal can effectively absorb energy and delay fracturing, demonstrating tensile properties similar to those of the base metal.


