1. Introduction
The management of antibiotic wastewater is challenging due to its large-scale discharge, which can be quantified in millions of liters per day globally, and its notable resistance to degradation, with some antibiotics exhibiting half-lives extending over several months under environmental conditions [
1,
2,
3,
4,
5]. Conventional treatment methods such as adsorption, coagulation, membrane filtration, and advanced oxidation processes have distinct limitations [
6,
7,
8,
9,
10,
11,
12,
13]. For example, adsorbents may require frequent regeneration, coagulation can lead to secondary pollutants, membrane systems suffer from fouling issues, and advanced oxidation processes can be energy intensive [
14,
15,
16,
17].
Zinc oxide (ZnO) is a non-toxic n-type semiconductor metal oxide photocatalyst known for its stable physicochemical properties, cost-effectiveness, excellent photoelectric characteristics, high photosensitivity, and efficient electron utilization. It shows notable efficacy in treating organic pollutants in wastewater. However, its photocatalytic efficiency is hindered by the recombination of photogenerated electron–hole pairs occurring within nanoseconds and its wide bandgap, which limits absorption to the ultraviolet range of the light spectrum. To improve photocatalytic activity, integrating the semiconductor with non-precious metals like silver can decrease the electron–hole recombination rate. Under light irradiation, electrons are captured by silver, which leaves behind holes that facilitate the production of hydroxyl radicals [
18,
19]. Furthermore, silver’s surface induces surface plasmon resonance (SPR) effects, thereby broadening the range of visible light absorption [
20]. Studies by Aaliya Ashpak Shaikh et al. [
21] demonstrated that silver doping in zinc oxide narrows its bandgap from 3.2 eV to 3.08 eV, enhancing its visible light absorption.
Nonetheless, in the Ag/ZnO system, the electron–hole recombination rate, quantified in terms of picoseconds, is still a limiting factor. Chlorobismuthate, a representative halogen in bismuth oxyhalides (BiOX), is distinguished by its unique layered structure. This structure fosters a more rapid electron–hole separation and generates a greater number of oxygen vacancies in the absence of UV light, thus amplifying photocatalytic activity. Xue et al. [
22] created spherical Bi
2MoO
6/BiOCl (OVs-bmo/BOC) z-type oxygen vacancy (OVs) photocatalysts using a hydrothermal calcination approach. In visible light, the OVs-BMO/BOC composite material attained a CIP removal efficiency of 97.40%. Additionally, BiOCl and ZnO, compatible semiconductors, can form a heterojunction, resulting in an improved catalytic reaction interface and synergistic effects, which leads to an increase in active sites and, consequently, catalytic activity. Yang et al. [
23] developed ZnO/BiOCl heterostructure photocatalysts with semi-coherent interfaces via a one-pot hydrothermal method. Owing to their durable nature and the rapid, quantifiable separation and migration of charge carriers in the scale of microseconds, these catalysts are particularly noted for removing pollutants such as Rhodamine B (RhB), tetracycline (TC), and ciprofloxacin (CIP). Consequently, this study synthesized a novel photocatalyst, Ag/ZnO/BiOCl. Targeting ciprofloxacin solution (CIP) as the pollutant, the photocatalytic activity of Ag/ZnO/BiOCl composite nanomaterials was investigated, showing enhanced ability to utilize the solar spectrum, thus improving the photocatalytic degradation rate, particularly for challenging pollutants like antibiotics.
2. Experiment
2.1. Experimental Reagents
The experimental reagents were obtained from the following manufacturers: sodium hydroxide (NaOH, AR) from Tianjin Continental Chemical Reagent Factory; anhydrous ethanol (C2H5OH, AR) from Tianjin Tianli Chemical Reagent Co., Ltd., Tianjin, China; zinc nitrate (Zn(NO3)2·6H2O, AR) from Sinopharm Chemical Reagent Co., Ltd., Beijing, China; silver nitrate (AgNO3, AR) from Tianjin Beilian Fine Chemicals Development Co., Ltd., Tianjin, China; sodium dodecylbenzenesulfonate (C18H29NaO3S, AR) from Tianjin Yongsheng Fine Chemical Co., Ltd., Tianjin, China; ciprofloxacin (C17H18FN3O3, AR) from Shanghai Aladdin Reagent Co., Ltd., Shanghai, China; acetone (C3H6O, AR) from Shanghai Macklin Biochemical Co., Ltd., Shanghai, China; bismuth nitrate (Bi(NO3)3·5H2O, AR) from Tianjin Damao Chemical Reagent; potassium chloride (KCl, AR) from Tianjin Bodi Chemical Co., Ltd., Tianjin, China; ethylene glycol (C2H6O2, AR) from Tianjin Fuyu Fine Chemical Co., Ltd., Tianjin, China; p-benzoquinone (C6H4O2, AR) from Shanghai Macklin Biochemical Co., Ltd.; isopropanol ((CH3)2CHOH, AR) from Tianjin Fuyu Fine Chemical Co., Ltd., Tianjin, China; disodium ethylenediaminetetraacetate (C10H14N2Na2O8, AR) from Tianjin Benchmark Chemical Reagent Co., Ltd., Tianjin, China; hydrochloric acid (HCl, AR) from Liaoning Quanrui Reagent Co., Ltd., Liaoning, China.
2.2. Sample Preparation
Preparation of ZnO nanofilm: Zn(NO3)2·6H2O weighing 2.9749 g and a predetermined amount of sodium dodecylbenzenesulfonate (SDBS) were dissolved in a mixture of 16 mL distilled water and 12 mL acetone, forming solution A. In a separate container, 0.4 g of NaOH was dissolved in 16 mL distilled water to create solution B. Both solutions A and B were stirred separately for 30 min until completely dissolved. Solution B was then gradually added to solution A, forming a white precipitate. This mixture was stirred for an additional 30 min and then transferred to a polytetrafluoroethylene autoclave for hydrothermal reaction at a predetermined temperature in an air blast drying oven. The resulting product was cooled, centrifuged, and washed several times with deionized water and anhydrous ethanol. After drying in an oven, it was calcined at 550 °C in a muffle furnace for 2 h. After calcination, we ground the resulting ZnO product into a fine powder using a high-precision ball mill. This grinding process was crucial to achieve uniform particle size, which is essential for the consistency of the thin films. We then carefully sieved the powder to remove any larger particles, ensuring the use of only fine powder for film formation.
For the pressing process, we placed the fine ZnO powder into a steel die of a predetermined diameter. We employed a hydraulic press to apply a specific pressure uniformly across the powder, forming a compact and homogeneous disk. This pressure was maintained for a set duration, ensuring proper binding of the particles without causing structural damage. After pressing, we carefully removed the thin films from the die and subjected them to a final heat treatment. This treatment enhanced their mechanical stability and surface properties, rendering them suitable for photocatalytic applications.
Preparation of Ag/ZnO: An additional 0.3 g of AgNO3 was added to solution A, and the subsequent steps were identical to those used in the preparation of ZnO nanofilm.
Preparation of BiOCl: Bi(NO3)3·5H2O weighing 0.485 g was dissolved in 20 mL ethylene glycol, stirred for 30 min, and then ultrasonicated for 10 min, creating solution A. Separately, 0.074 g of KCl was dissolved in 20 mL deionized water, forming solution B. Solution B was gradually added to solution A, stirred vigorously for 3 h, then filtered. The precipitate was washed thrice with ethanol and deionized water and dried at 60 °C.
Preparation of Ag/ZnO/BiOCl: Disperse Ag/ZnO weighing 0.4396 g was dispersed in 20 mL deionized water to make solution C. A specific amount of BiOCl was added to 20 mL deionized water, forming solution D. Solution C was gradually added to solution D, stirred for 1 h, and then transferred to a polytetrafluoroethylene autoclave for reaction at 100 °C for 3 h. After cooling, the mixture was filtered, washed with anhydrous ethanol and deionized water thrice, and dried at 60 °C in an air blast drying oven. The dried product was ground into powder and made into a film according to the above method to make Ag/ZnO/BiOCl catalyst.
2.3. Sample Characterization
For a comprehensive understanding of the samples, we employed various analytical techniques. X-ray diffraction (XRD, Bruker D8-ADVANCE, Bruker Corporation, Billerica, MA, USA) was utilized to examine the crystalline structure and phase purity, the test conditions were set as follows: a tube voltage of 40 kV and a tube current of 30 mA. Utilizing a Cu-Kα radiation source, X-rays were emitted to interact with the sample, resulting in diffraction and scattering effects. The scanning angle range was set from 20° to 80°, with a scanning speed of 8° per minute. Fourier-transform infrared spectroscopy (FTIR, Bruker VERTEX-80, Bruker Corporation, Billerica, MA, USA) provided insights into the functional groups and chemical bonding, with spectra recorded in the range of 4000–400 cm−1. The surface morphology and microstructure of the samples were meticulously studied using scanning electron microscopy (SEM, Zeiss-Supra55, Carl Zeiss AG, Oberkochen, Germany), with images captured at various magnifications to reveal the detailed surface features. X-ray photoelectron spectroscopy (XPS, ESCALAB 250, Thermo Fisher Scientific, Waltham, MA, USA) was utilized for elemental analysis and to understand the chemical and electronic state of the elements, with high-resolution scans performed for key peaks. UV–visible spectrophotometry (UV-vis DRS, UV-2550, Shimadzu Corporation, Kyoto, Japan) assisted in determining the optical absorption properties and bandgap energy of the samples. Photoluminescence (PL, F-7000, Hitachi High-Technologies Corporation, Tokyo, Japan) measurements were conducted to assess the recombination efficiency of electron–hole pairs.
2.4. Photocatalytic Degradation Performance Analysis
Add 50 mL of 10 mg/L ciprofloxacin solution to a quartz test tube, followed by 5 mg of Ag/ZnO/BiOCl photocatalyst (1 g/L). Place the test tube with a rotor in the rotation slot of a photochemical reactor (Phchemlll, manufactured by Beijing Niubit Technology Co., Ltd., Beijing, China), stir in the dark for about 30 min to reach adsorption–desorption equilibrium, and measure its absorbance. After the dark reaction, turn on the tap, connect the condenser, adjust the water level to about 2/3 of the tube, insert the lamp source into the condenser and turn on a 250 W xenon lamp, start the rotator at approximately 500 rpm, cover the front panel, and begin the photochemical reaction. Take samples every 30 min and conduct three parallel experiments to minimize errors. Collect samples using a syringe, filter through a 0.22 μm filter to remove the catalyst, and measure absorbance with a UV spectrophotometer.
3. Results and Discussion
3.1. Phase and Structure Analysis of Samples
3.1.1. X-ray Diffraction Analysis
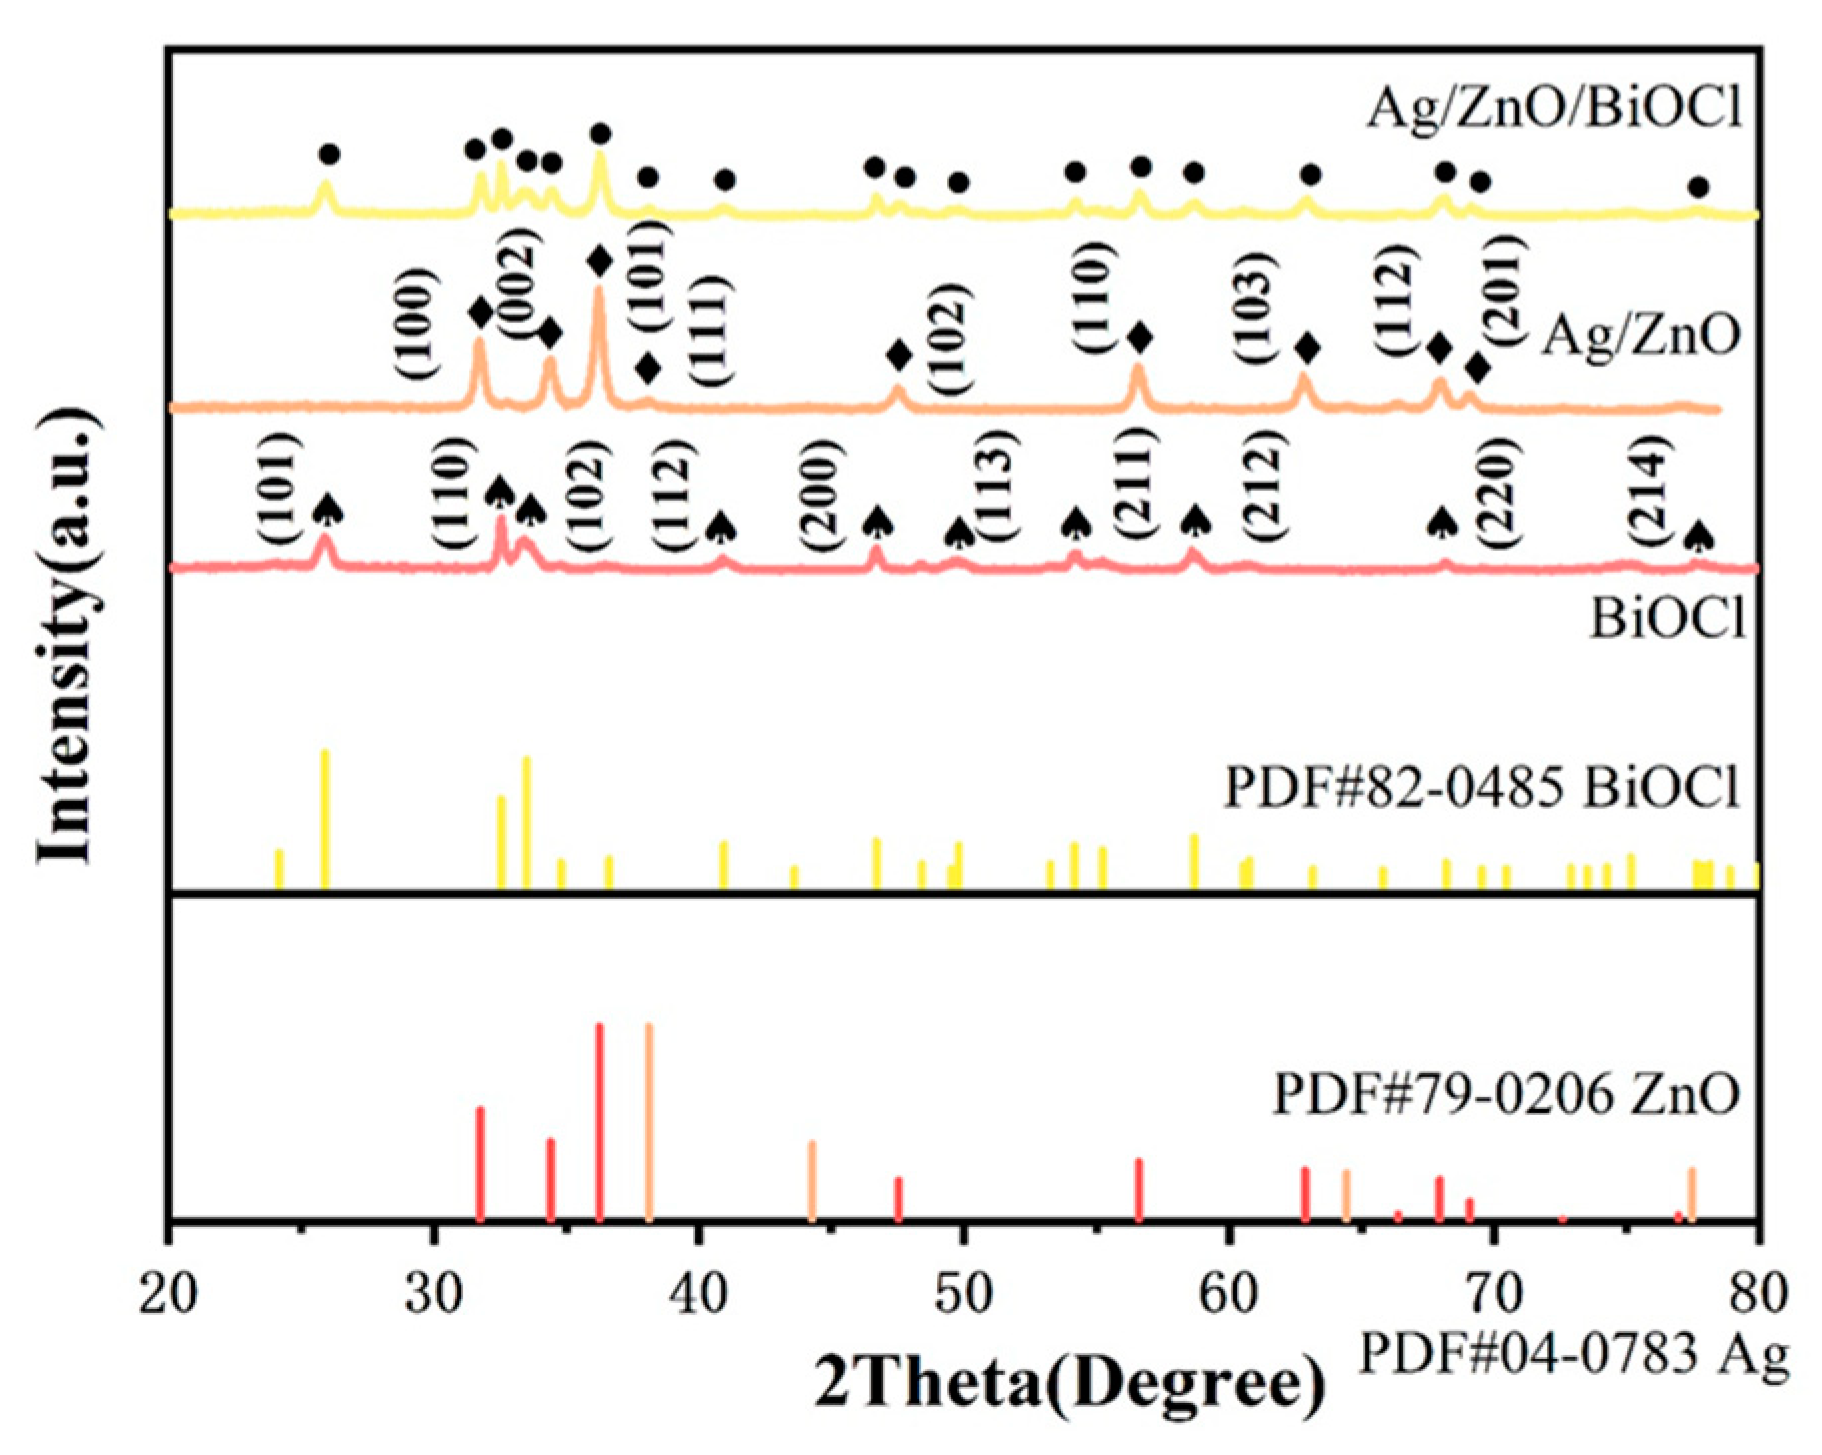
The X-ray diffraction (XRD) patterns of Ag/ZnO/BiOCl, Ag/ZnO, and BiOCl samples are displayed in
Figure 1. For the BiOCl sample, the high-intensity peak and other weaker peaks correspond to the tetragonal phase of BiOCl, in agreement with the standard card PDF#82-0485 (highlighted in yellow) [
24,
25]. These sharp and well-defined diffraction peaks signify a well-crystallized material. In the Ag/ZnO/BiOCl composite sample, the diffraction peaks at 2θ values of 31.7°, 34.4°, 36.2°, 47.5°, 56.5°, 62.8°, 67.9°, and 69.0° can be indexed to the (100), (002), (101), (102), (110), (103), (112), and (201) planes of ZnO (shown in red), indicative of a hexagonal wurtzite structure, according to standard card PDF#79-0206 [
26]. Furthermore, peaks at 2θ values of 38.1°, 44.3°, 64.4°, and 77.5° correspond to the (111), (200), (220), and (311) planes of metallic silver, as per standard card PDF#04-0783 (depicted in black). The Ag/ZnO/BiOCl sample also shows strong diffraction peaks that are characteristic of Bi-OCl, affirming the successful formation of the Ag/ZnO and BiOCl composite. The presence of distinct diffraction peaks for each component within the composite suggests that the samples possess high crystallinity and purity. This crystalline purity is advantageous for the enhanced transfer rate of photogenerated carriers, which is pivotal in accelerating the photocatalytic reactions.
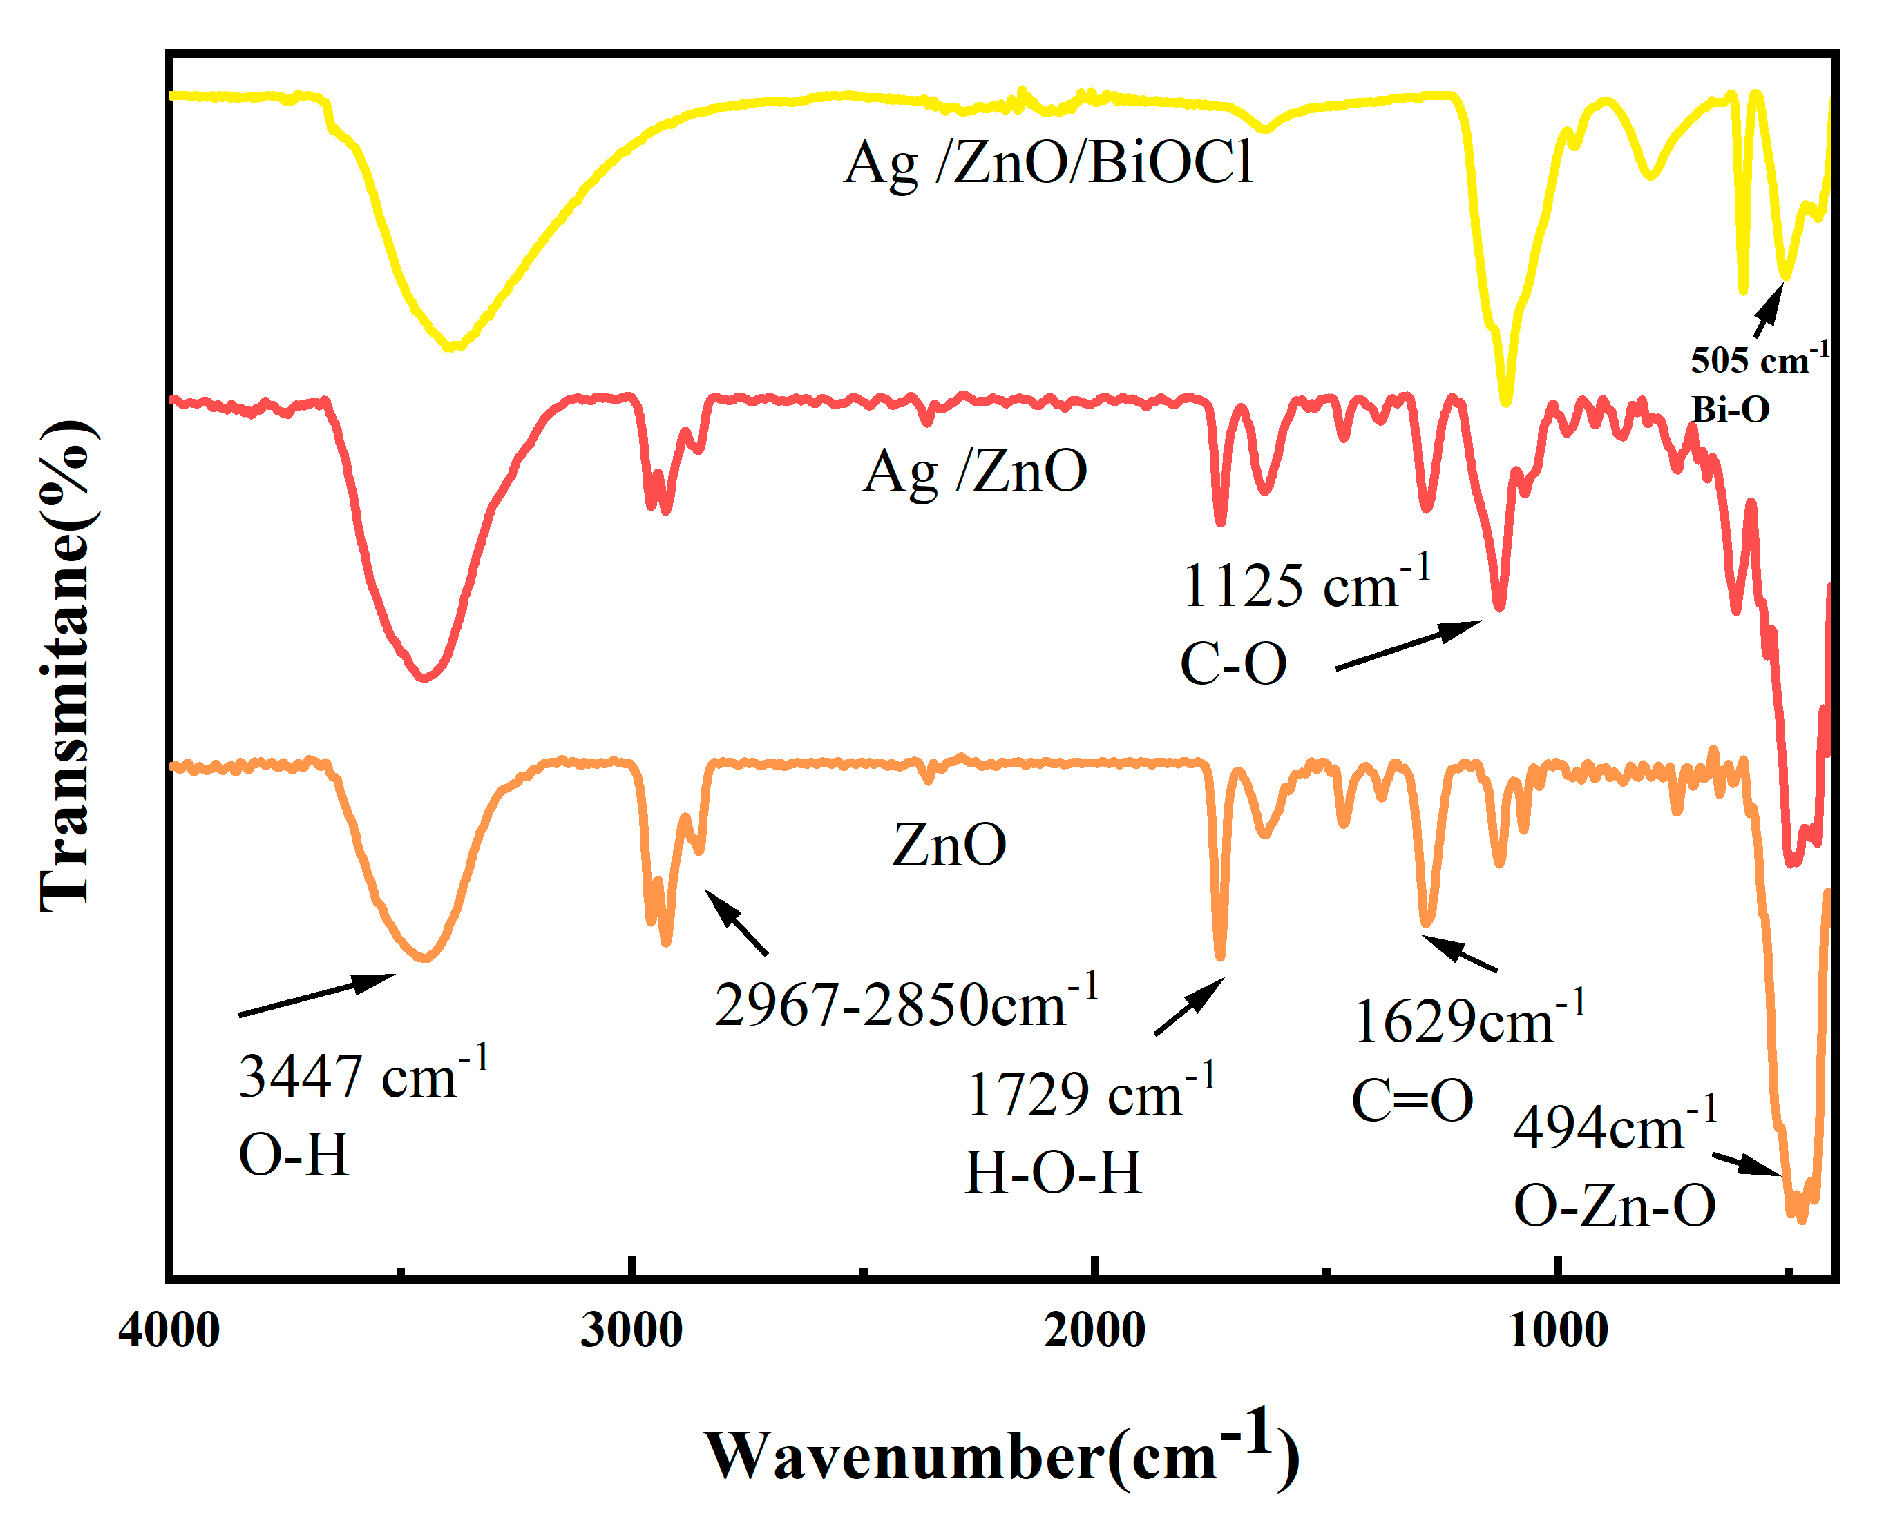
3.1.2. Fourier-Transform Infrared Spectroscopy Analysis
The Fourier-transform infrared (FTIR) spectra of ZnO, Ag/ZnO, and Ag/ZnO/BiOCl samples are presented in
Figure 2. In the spectra, the vibrational peak at 494 cm
−1 is attributed to the O-Zn-O bond, while the peak at 614 cm
−1 corresponds to the Zn-O bond. The peak at 1729 cm
−1 is associated with the H-O-H bond, and the peak at 3447 cm
−1 is indicative of the O-H bond in water. The vibrational peak at 1125 cm
−1 corresponds to the C-O bond, and the peak at 1629 cm
−1 is related to the C=O bond. The peak at 505 cm
−1 can be assigned to the Bi-O bond. The vibrational peaks between 2967–2850 cm
−1 are attributed to potassium bromide used in the testing process. Notably, compared to ZnO and Ag/ZnO, the Ag/ZnO/BiOCl sample shows a significant enhancement in the vibrational peak at 3447 cm
−1, suggesting an increased adsorption of oxygen on the material’s surface, which implies higher catalytic activity [
27].
3.2. Morphological Analysis of Samples
The scanning electron microscopy (SEM) images of ZnO, Ag/ZnO, and Ag/ZnO/BiOCl, along with the energy-dispersive X-ray spectroscopy (EDS) spectrum of Ag/ZnO/BiOCl, are presented in
Figure 3.
Figure 3a depicts ZnO microrods with uniform hexagonal facets, smooth surfaces, and sharp terminations, demonstrating their well-defined crystalline structure. The micrometer-scale dimensions are characteristic of ZnO synthesized under controlled conditions.
Figure 3b showcases Ag-modified ZnO microrods, where the presence of Ag nanoparticles on the ZnO surface is evident. These nanoparticles are well-dispersed and likely induce heterojunctions, which are beneficial for photocatalytic processes due to their potential to facilitate charge separation. Further morphological evolution is observed in
Figure 3c, where BiOCl nanoplates are integrated onto the Ag/ZnO framework. The resultant Ag/ZnO/BiOCl composite exhibits a hierarchical ‘flower-like’ structure, suggesting a synergistic assembly that provides an expanded surface area and additional active sites. The SEM imagery collectively illustrates the progressive build-up of a complex, multi-component system. This system is anticipated to demonstrate superior photocatalytic activity arising from the enhanced charge carrier separation and augmented reactive interface provided by the stepwise modification of ZnO with Ag and subsequent BiOCl addition. As shown in
Figure 3d, prominent peaks corresponding to Zn, O, Ag, Bi, and Cl are observed, signifying their presence in the Ag/ZnO/BiOCl composite material. Additionally, there are discernible, but less intense, peaks which can be attributed to C, likely from atmospheric contamination, as well as Au and Cu, which may originate from the sample preparation process and the sample holder materials. The apparent ratio of Zn to O, which suggests a value of less than 1, might indicate a higher adsorption of oxygen on the surface of the composite, potentially forming more active sites. This can enhance photocatalytic activity by facilitating the generation of reactive species under illumination.
3.3. Valence State Analysis of Samples
The XPS full spectra for ZnO, Ag/ZnO, and Ag/ZnO/BiOCl (
Figure 4a) show elements C, Zn, and O across all samples, with Ag Bi, and Cl evident in respective composites. Carbon’s presence likely results from air exposure. Our analysis demonstrates the relative purity of the synthesized samples.
In the Zn 2p XPS spectra (
Figure 4d), we observed spin-orbit coupling-induced splitting for Zn 2p
3/2 and Zn 2p
1/2, with peak values for ZnO at 1044.83 eV and 1021.81 eV, and slight variations in Ag/ZnO and Ag/ZnO/BiOCl. Notably, the splitting in pure ZnO aligns with reported values from the literature, while the addition of Ag and BiOCl shows a measurable impact on these peak positions, reflecting alterations in the electronic environment of Zn [
28,
29].
Furthermore, the FWHM of the Zn 2p
3/2 peak in ZnO was observed to be narrower, indicating a more homogeneous chemical environment for Zn in the pure form. The introduction of Ag and BiOCl into the composite leads to a broadening of this peak, suggesting increased heterogeneity in the electronic structure around Zn sites [
30]. This broadening aligns with the role of Ag and BiOCl in modifying the electronic properties of ZnO, impacting the photocatalytic activity of the composite material.
The Ag 3d XPS spectra of the Ag/ZnO/BiOCl composite reveal peak broadening and a noticeable shoulder, suggesting the coexistence of metallic silver and a more oxidized silver species. A shift in binding energy and peak shape alteration, as compared to the Ag/ZnO spectrum, corroborates this. The oxidized silver species are implicated in modifying the charge carrier dynamics, which may influence the photocatalytic activity.
In the O 1s XPS spectra, we observe peaks at specific binding energies corresponding to different oxygen species. The peaks at 530.18 eV and 530.05 eV for Ag/ZnO, as well as 531.18 eV for Ag/ZnO/BiOCl, are indicative of lattice oxygen, which is known to be integral to the generation of oxygen vacancies and hydroxyl radicals, both key in photocatalysis. Additionally, the peaks at 530.10 eV across the composites are attributed to adsorbed oxygen species, which could play a role in trapping free electrons to facilitate the formation of superoxide anions, a vital step in photocatalytic degradation processes. Moreover, the peak at 532.16 eV is associated with hydroxyl oxygen, which can enhance photocatalytic reactions by promoting the formation of reactive radicals [
31].
Other
Figure 4b,c showcase spectra for Bi 4f and Cl 2p, with peaks indicative of their respective valence states and interactions within the composite. The observed shifts and changes in peak shapes across these spectra further corroborate the successful integration of Ag and BiOCl with ZnO and the resultant alterations in the material’s electronic properties.
3.4. Optical Property Analysis
3.4.1. UV–Visible Diffuse Reflectance Spectroscopy Analysis
The UV-vis diffuse reflectance spectroscopy (DRS) spectra and optical band gap diagrams of the samples are presented in
Figure 5. Pure ZnO exhibits its intrinsic absorption threshold around 372 nm, which is the typical absorption threshold of ZnO, and its absorption edge is mainly limited to the UV region. In contrast, Ag/ZnO and Ag/ZnO/BiOCl composites exhibit a clear red shift in the absorption edge beyond 400 nm, effectively extending their light harvesting capabilities into the visible range. This transition is particularly pronounced in Ag/ZnO composites, which exhibit a distinct absorption peak at 462 nm, a feature attributed to the surface plasmon resonance (SPR) of Ag nanoparticles embedded within the matrix. This SPR-induced absorption significantly enhances the visible light response of the material. On the other hand, the absorption intensity of the Ag/ZnO/BiOCl composite material increases significantly in the visible light region. This enhancement indicates improved utilization of the UV part of the spectrum, which may contribute to more efficient photocatalytic performance since it is possible to generate more photon-induced charge carriers. The observed high absorption in the 200–400 nm range across these materials indicates electronic transitions corresponding to their band-gap energies. The variations in absorption intensities among these composites can be attributed to the altered electronic structures caused by the incorporation of Ag and BiOCl, which modify the electronic environment and light absorption characteristics of ZnO.
The band gap widths of ZnO, Ag/ZnO, and Ag/ZnO/BiOCl are 3.18 eV, 3.09 eV, and 3.11 eV, respectively. This indicates that the incorporation of Ag notably reduces the band gap width of the material, while the addition of BiOCl has a minimal impact on the band gap width. This can be attributed to the surface plasmon resonance (SPR) effect of Ag nanoparticles. The SPR effect refers to the collective oscillation of conduction band electrons in the Ag nanoparticles, stimulated by incident light. This phenomenon enhances the absorption of visible light and can extend the light absorption range of ZnO from the ultraviolet to the visible light region. Consequently, the incorporation of Ag creates new electronic states in the band structure of ZnO, leading to a narrowing of the band gap. The narrowed band gap allows for the excitation of electrons with lower energy (visible light), thus improving the efficiency of electron transitions and photocatalytic activity under visible light irradiation. The reduction in band gap width implies that under the same conditions, Ag/ZnO/BiOCl requires less energy for electron transitions compared to ZnO, facilitating quicker excitation and generation of active species, thereby enhancing photocatalytic activity.
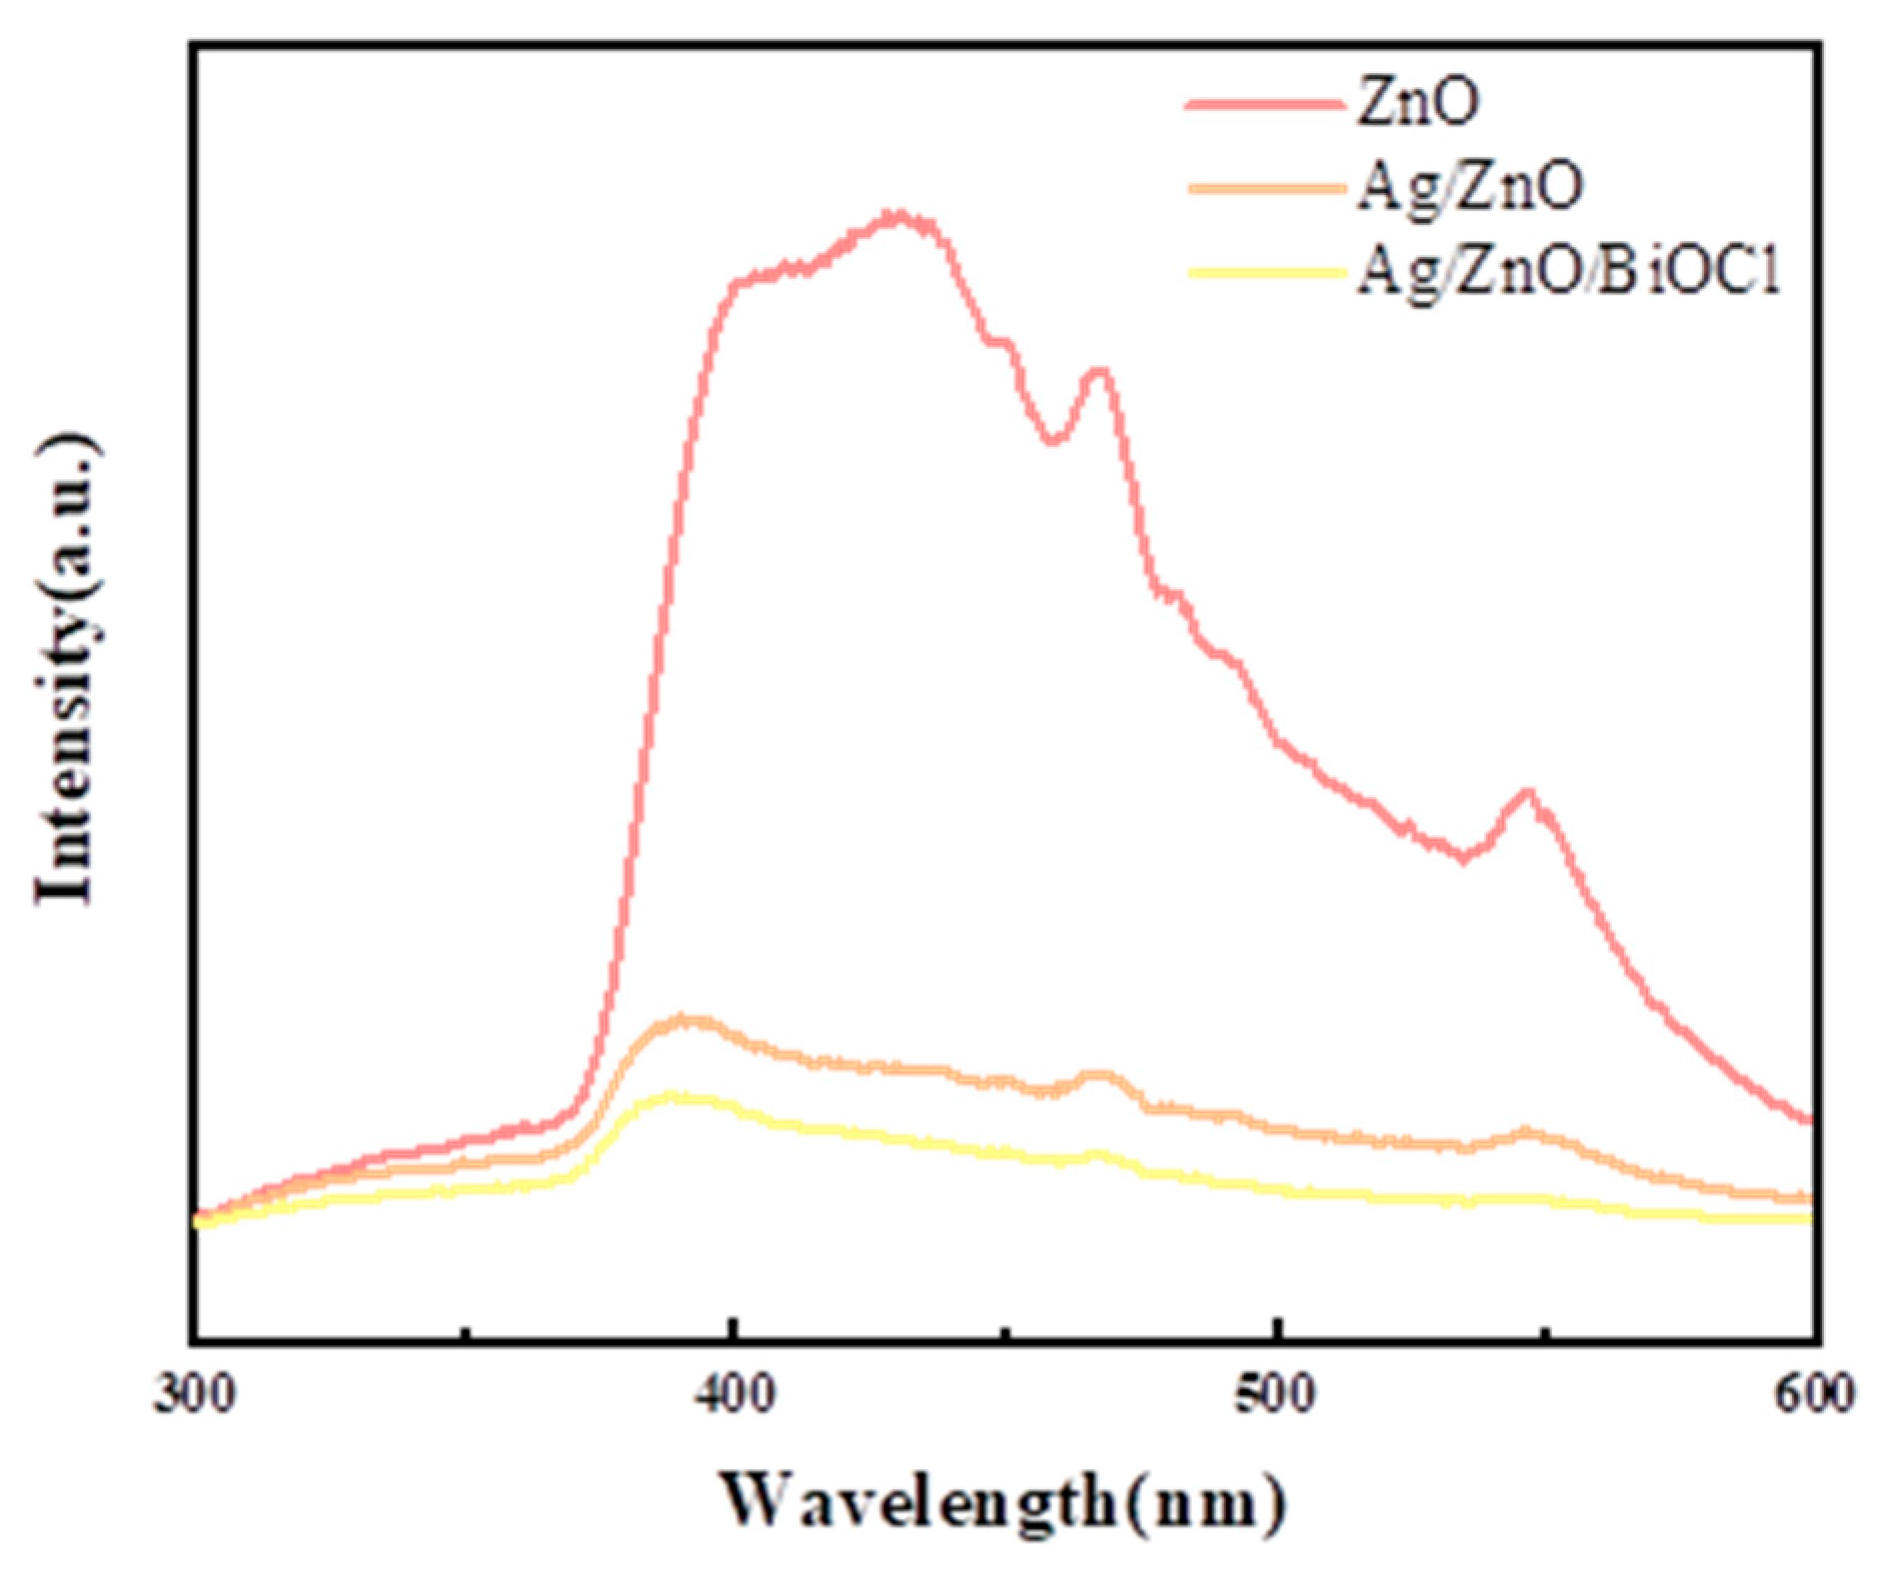
3.4.2. Photoluminescence Spectroscopy Analysis
The photoluminescence (PL) spectra of ZnO, Ag/ZnO, and Ag/ZnO/BiOCl samples are depicted in
Figure 6. Pure ZnO exhibits a strong ultraviolet (UV) emission peak at approximately 400 nm, which is commonly associated with the near-band-edge emission due to the recombination of free excitons. Additionally, the visible emission peaks at around 431 nm, 467 nm, and 546 nm correspond to defect-related emissions, often attributed to oxygen vacancies and zinc interstitials in the ZnO lattice.
The introduction of Ag into the ZnO matrix (Ag/ZnO) results in a notable shift of the UV emission peak to 389 nm and a modification of the visible emission peaks, now observed at 470 nm and 546 nm. This shift suggests that Ag incorporation influences the electronic structure of ZnO, possibly through the introduction of new electronic states or interactions with ZnO defects that affect the recombination processes.
With the further addition of BiOCl to form Ag/ZnO/BiOCl composites, a continued decrease in intensity of all emission peaks is observed. The suppression of PL intensity can be indicative of reduced recombination rates of electron–hole pairs, as photogenerated electrons may be transferred more effectively to the conduction band of BiOCl or trapped by Ag, leaving the holes in the valence band of ZnO. This reduction in PL intensity correlates with an enhancement in photocatalytic activity, suggesting that the addition of BiOCl to the Ag/ZnO system facilitates charge separation and extends the lifetime of charge carriers, thereby improving the photocatalytic performance.
3.5. Photocatalytic Performance Testing
In evaluating the photocatalytic degradation of ciprofloxacin, commercial TiO2 (P25) was used as a benchmark. Our investigation focused on the performance of ZnO, Ag/ZnO, and Ag/ZnO/BiOCl under a 250 W xenon lamp simulating sunlight, as detailed in
Figure 7. In the control scenario without a catalyst, the ciprofloxacin concentration remained largely unchanged under light exposure. With the addition of Ag/ZnO/BiOCl in the absence of light, a notable decrease in ciprofloxacin concentration was observed within the initial 30 min, attributed to adsorption. This concentration stabilized post-adsorption–desorption equilibrium.
Upon illumination, the conversion efficiency of ciprofloxacin increased significantly within the first 90 min for all samples, subsequently plateauing. The study revealed that the synthesized photocatalysts, particularly Ag/ZnO/BiOCl, significantly enhanced the conversion efficiency of ciprofloxacin, surpassing the performance of P25. Specifically, Ag/ZnO/BiOCl achieved a conversion efficiency of 93.24% in decomposing the ciprofloxacin solution.
3.6. Optimization of Degradation Conditions for Ciprofloxacin by Ag/ZnO/BiOCl
3.6.1. Influence of Initial pH on Ciprofloxacin Degradation
The effect of initial pH on the degradation of ciprofloxacin was studied under the conditions of a ciprofloxacin concentration of 10 mg/L, an Ag/ZnO/BiOCl dosage of 1 g/L, and a light exposure of 150 min. Five different initial pH values were adjusted using hydrochloric acid and sodium hydroxide, specifically pH 3, 5, 7, 9, and 11. The relationship between conversion efficiency and the initial pH of the solution is shown in
Figure 8.
As depicted in
Figure 8, the conversion efficiency of ciprofloxacin initially increases and then decreases with the rising pH. At pH 3 and 5, the conversion efficiencies are relatively low, at 84.72% and 89.38%, respectively. This may be due to an excess of H
+ in acidic conditions, which can interfere with the generation of hydroxyl radicals from OH
- and h
+, thus affecting the reaction process. At pH 9, the conversion efficiency reaches its peak at 95.34%, likely because the alkaline environment facilitates the formation of strong oxidizing hydroxyl radicals from abundant OH
− and h
+, accelerating the reaction. However, at pH 11, the conversion efficiency decreases to 91.88%, possibly because an excess of OH
− can react with part of the BiOCl to form BiO
3Cl
4, thereby reducing the photocatalytic activity. The small variation in the conversion efficiency of ciprofloxacin at pH values of 5, 7, and 11 can be attributed to the photocatalyst’s stability and reactivity across different pH levels. At these pH levels, the photocatalytic activity of the composite material, Ag/ZnO/BiOCl, remains relatively consistent, indicating its robust performance in varying acidic and alkaline environments. This implies that the photocatalyst can maintain its efficiency in both slightly acidic and slightly alkaline conditions, without significant changes in its ability to generate reactive species necessary for the degradation process. This characteristic is crucial for practical applications where pH conditions might vary.
As seen in
Table 1, the relationship between the −ln(C/C0) and time (t) for different initial pH values of the solution is linear and conforms to the pseudo-first-order kinetic equation, with the maximum rate constant K being 0.0198 min
−1. In conclusion, the optimal initial pH for the highest conversion efficiency of ciprofloxacin solution is determined to be pH 9.
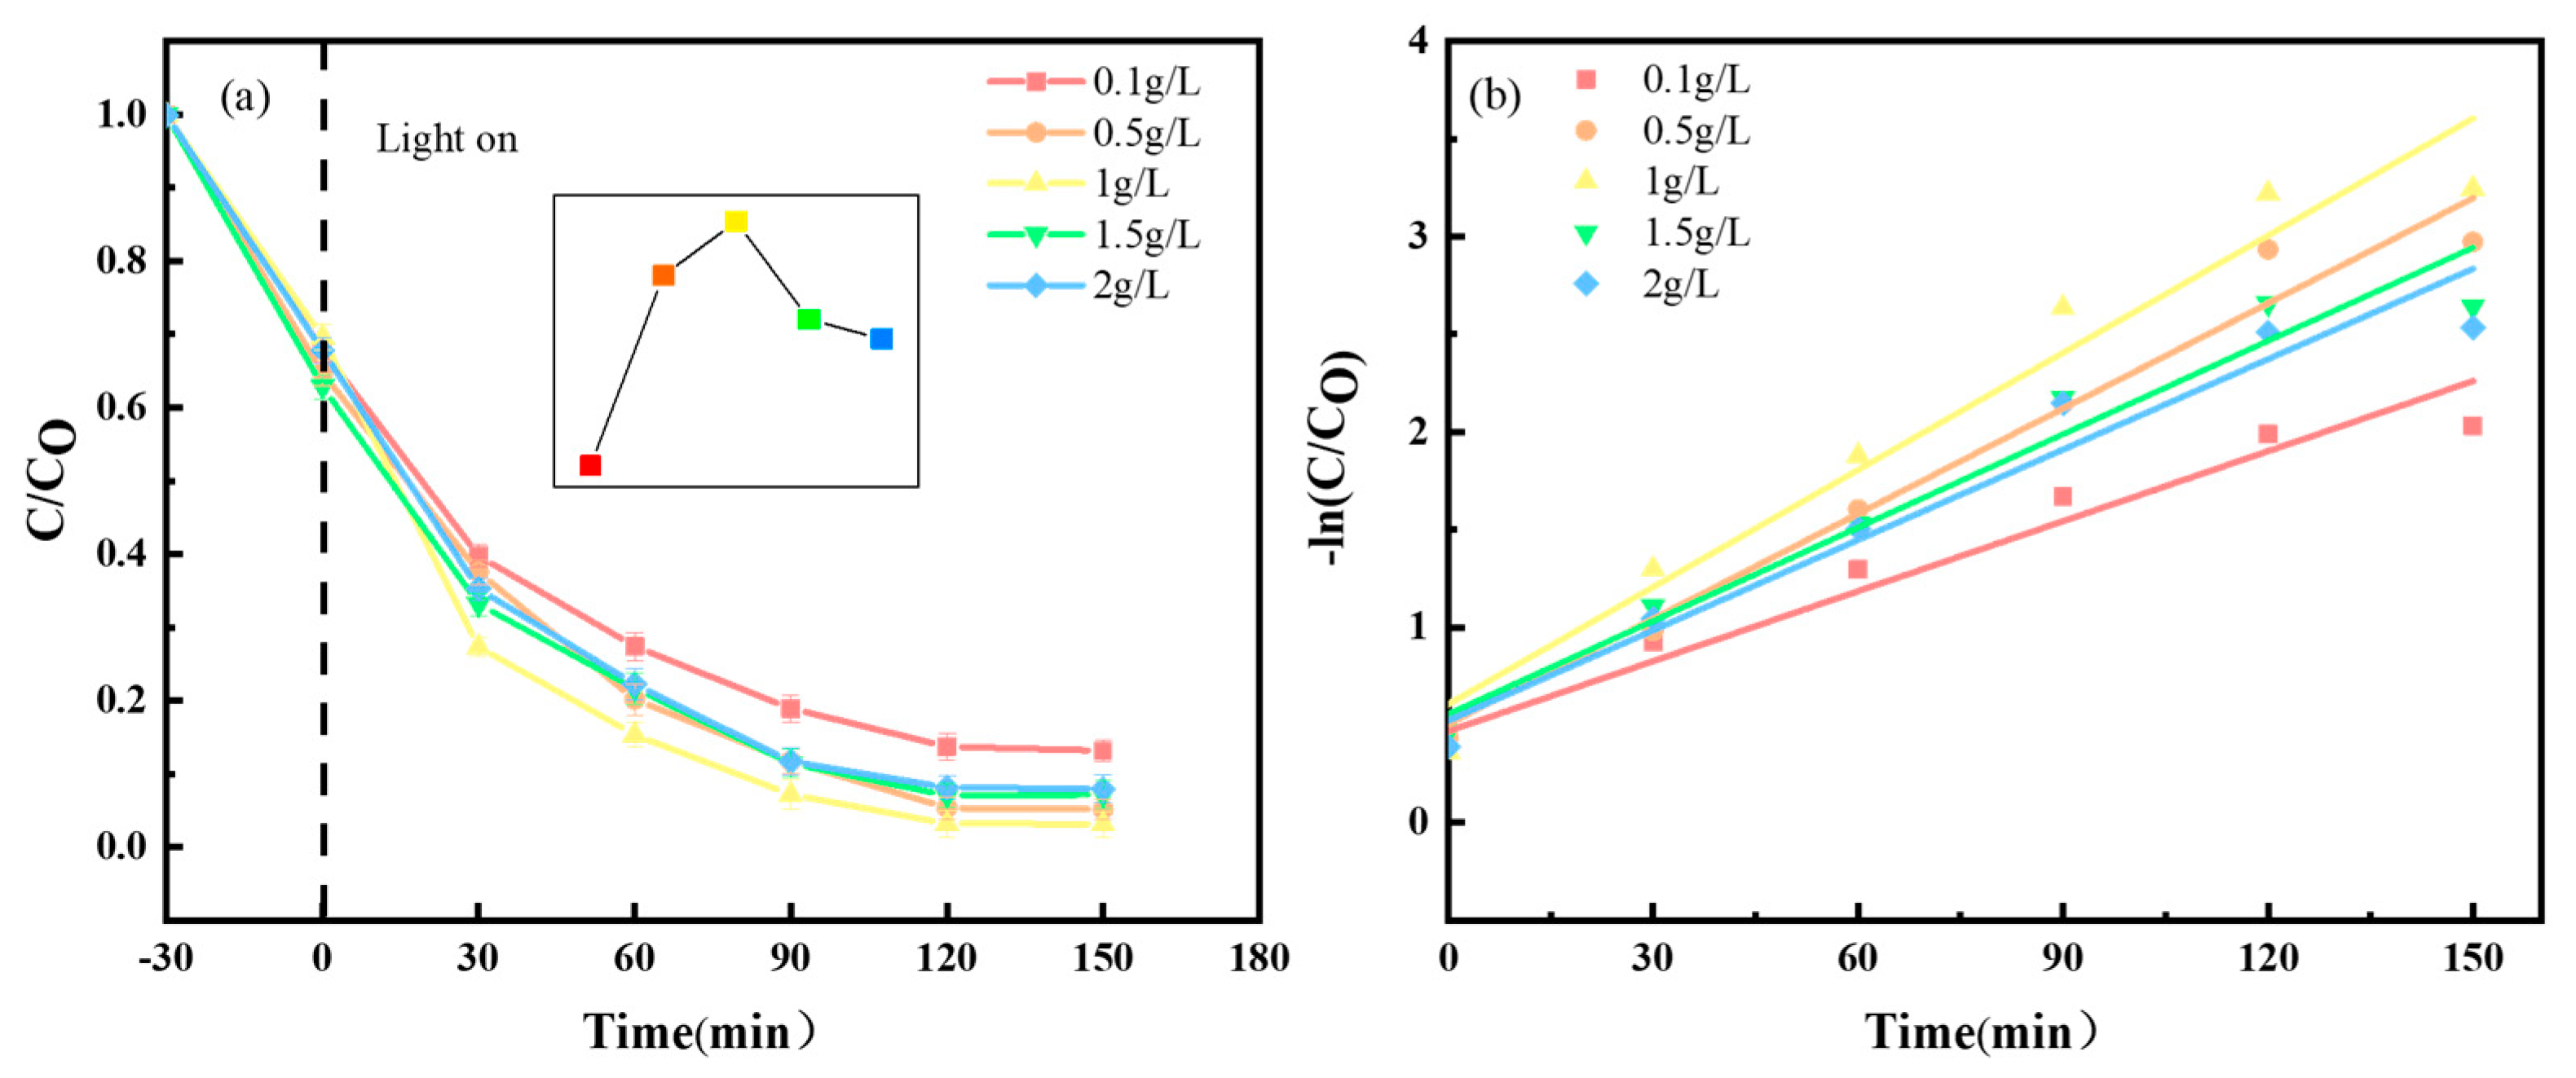
3.6.2. Impact of Catalyst Dosage on Ciprofloxacin Degradation
The effect of varying dosages of Ag/ZnO/BiOCl on the degradation of ciprofloxacin was investigated under the conditions of a ciprofloxacin concentration of 10 mg/L, an initial pH of 9, and light exposure for 150 min. The Ag/ZnO/BiOCl dosages tested were 0.1 g/L, 0.5 g/L, 1 g/L, 1.5 g/L, and 2 g/L. The relationship between conversion efficiency and Ag/ZnO/BiOCl dosage is shown in
Figure 9.
As observed in
Figure 9, the conversion efficiency of ciprofloxacin initially increases and then decreases with the increasing dosage of Ag/ZnO/BiOCl. The conversion efficiency gradually increases at dosages of 0.1 g/L, 0.5 g/L, and 1 g/L, reaching a maximum of 96.92% at a dosage of 1 g/L. This increase can be attributed to the greater availability of Ag/ZnO/BiOCl in the reaction system at higher dosages, providing more contact area and active sites for the reaction with ciprofloxacin. However, when the dosage of Ag/ZnO/BiOCl exceeds 1 g/L, at 1.5 g/L and 2 g/L, a decline in conversion efficiency is observed, with the lowest rate at 92.08%. This decrease may be due to excessive catalyst blocking the exposure of the catalyst and ciprofloxacin solution to sufficient light, leading to a reduction in conversion efficiency.
As shown in
Table 2, the relationship between −ln(C/C0) and time (t) for different dosages of Ag/ZnO/BiOCl is linear and conforms to the pseudo-first-order kinetic equation, with the maximum rate constant K being 0.0201 min
−1. In summary, the optimal dosage of Ag/ZnO/BiOCl for the highest conversion efficiency of ciprofloxacin solution is determined to be 1 g/L.
3.6.3. Impact of Initial Concentration on Ciprofloxacin Degradation
The effect of different initial concentrations of ciprofloxacin on its degradation was studied under the conditions of an Ag/ZnO/BiOCl dosage of 1 g/L, an initial pH of 9, and light exposure for 150 min. The ciprofloxacin concentrations tested were 5 mg/L, 10 mg/L, 15 mg/L, 20 mg/L, and 25 mg/L. The relationship between conversion efficiency and the concentration of ciprofloxacin is shown in
Figure 10.
As indicated in
Figure 10, the conversion efficiency of ciprofloxacin decreases from 98.79% to 83.92% as the solution concentration increases from 5 mg/L to 25 mg/L. Both the conversion efficiency and the rate constant (K) diminish with the increase in ciprofloxacin concentration, reaching a maximum at a concentration of 5 mg/L. This trend might be attributed to the fact that the generation of active free radicals in the solution system is constant. Higher concentrations of ciprofloxacin reduce the contact time and surface area between the active free radicals and ciprofloxacin molecules. Additionally, excessive ciprofloxacin can absorb photons, thereby decreasing the interaction opportunities between light and the catalyst. Furthermore, high concentrations of pollutants could potentially block the reactive active sites. These factors lead to a reduced conversion efficiency at higher ciprofloxacin concentrations. As shown in
Table 3, there is a linear relationship between −ln(C/C0) and time (t) for different ciprofloxacin concentrations, and the reaction follows the Langmuir–Hinshelwood pseudo-first-order kinetic equation, with the maximum rate constant (K) being 0.0271 min
−1.
3.7. Cyclic Stability Testing
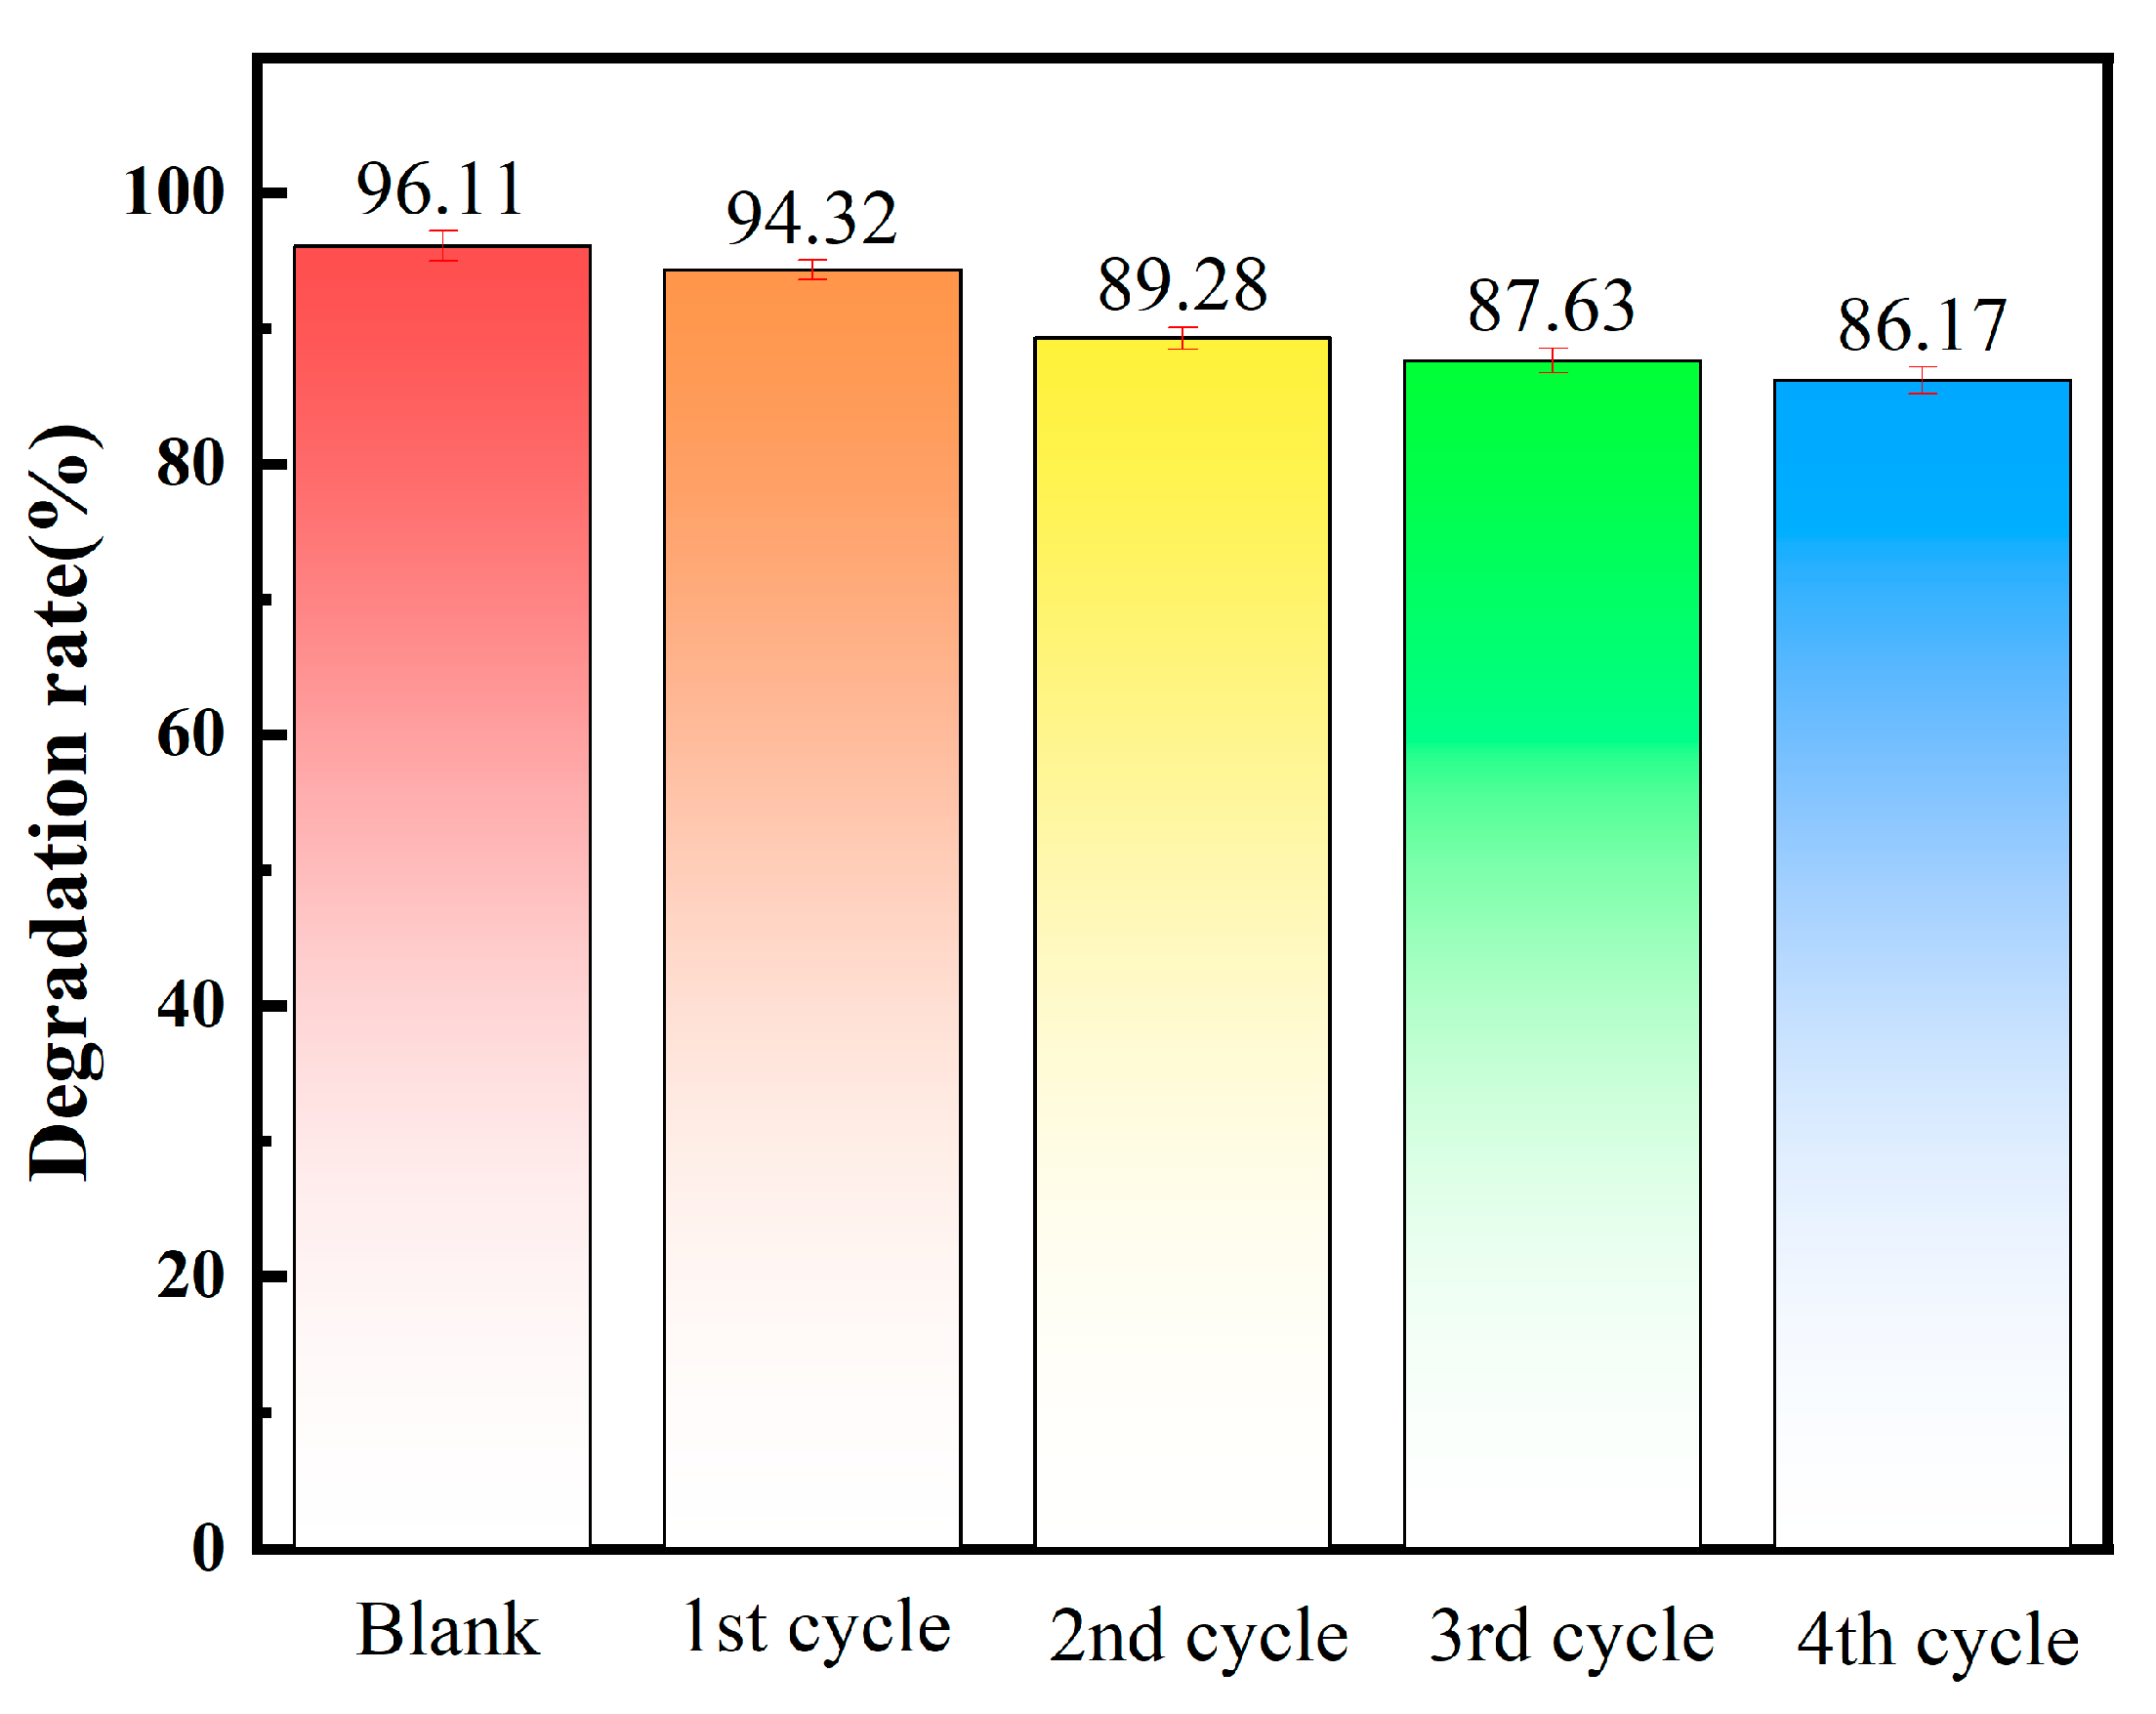
Figure 11 presents a bar chart depicting the relationship between time and conversion efficiency after five repeated uses of the photocatalyst. It is observed that the conversion efficiency remains high at 94.32% during the first cycle of reuse, indicating minimal loss in photocatalytic activity. After five cycles, the Ag/ZnO/BiOCl composite material still achieves a conversion efficiency of 86.17% for the ciprofloxacin solution, maintaining a high level of photocatalytic activity. These results demonstrate that the synthesized Ag/ZnO/BiOCl composite material possesses good stability and can be used multiple times in practical applications.
3.8. Radical Scavenging Experiment
Radical scavenging experiments were conducted using tert-butanol (TBA), disodium ethylenediaminetetraacetate (Na2-EDTA), and p-benzoquinone (BQ) as scavengers for ·O
2−, ·OH, and h
+, respectively, to investigate the active species in the photocatalytic reaction of Ag/ZnO/BiOCl. The experimental results are shown in
Figure 12. After adding TBA, Na
2-EDTA, and BQ to three separate samples of Ag/ZnO/BiOCl, the conversion efficiency of methyl orange solution by Ag/ZnO/BiOCl decreased from 93.24% to 50.7%, 62.22%, and 86.12%, respectively. The experiment indicates that ·OH plays a major role in the degradation of ciprofloxacin, with h
+ also having a significant impact, while the role of ·O
2− is the weakest.
3.9. Photocatalytic Mechanism Analysis
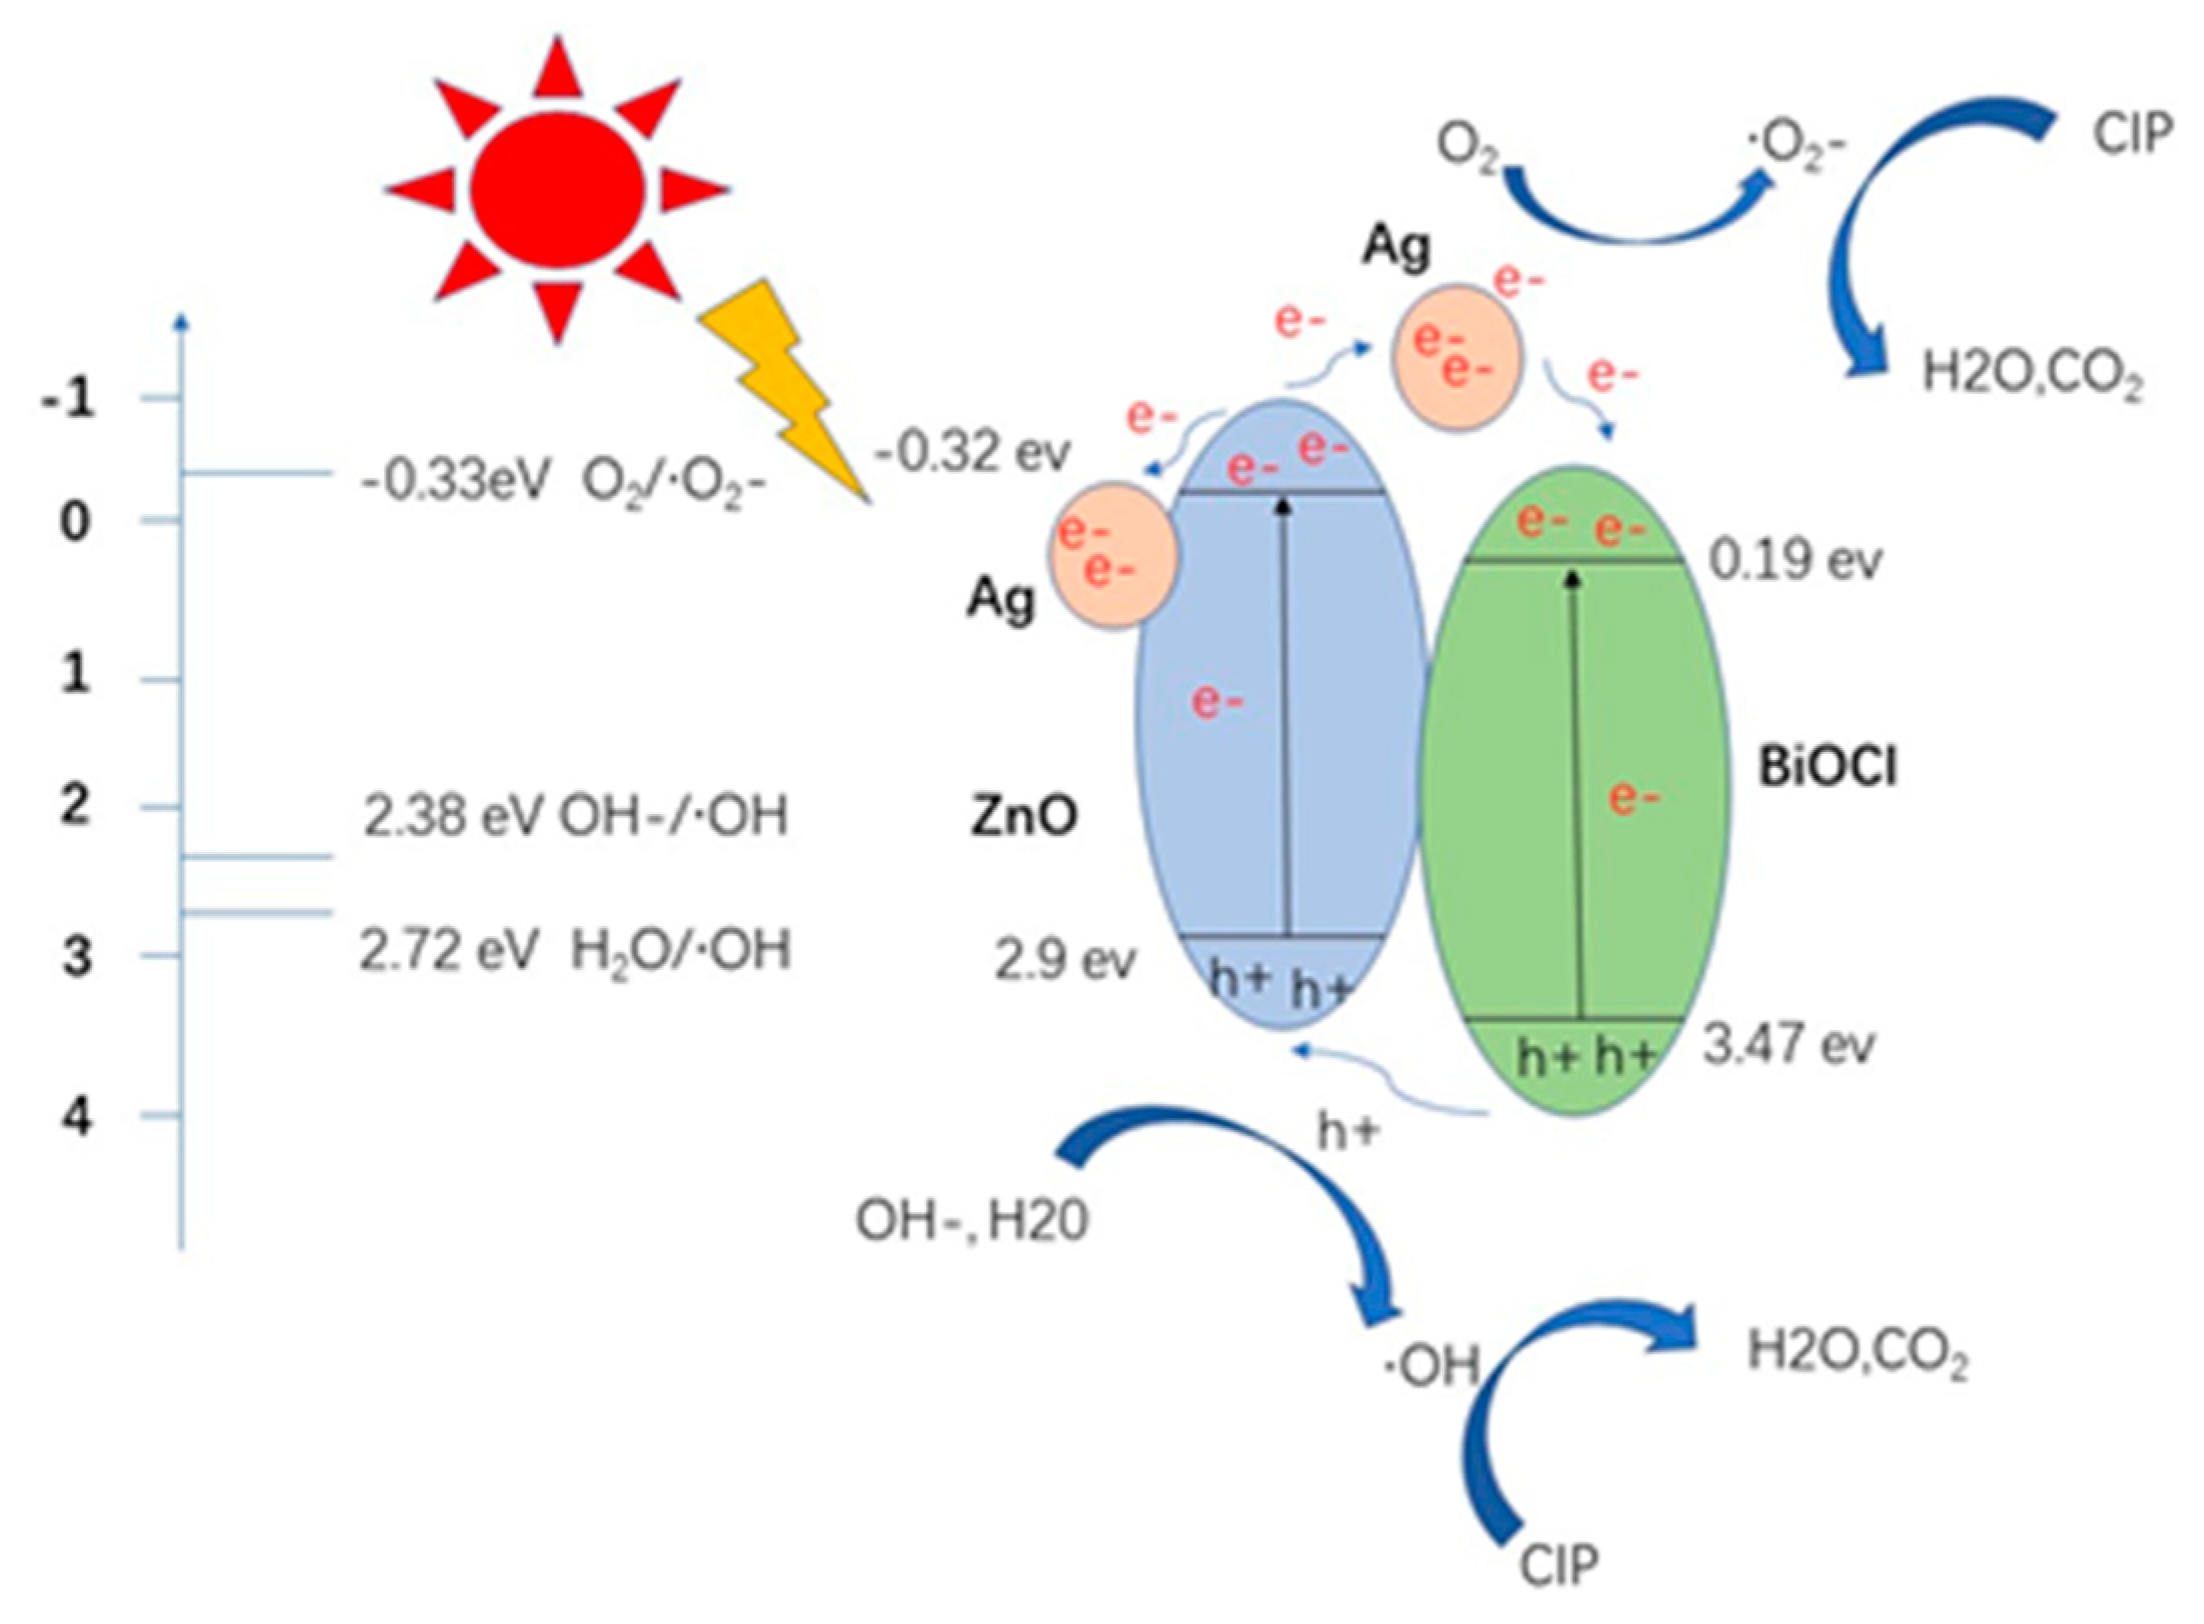
The proposed photocatalytic mechanism for the degradation of ciprofloxacin by Ag/ZnO/BiOCl composite material is illustrated in
Figure 13. To understand the degradation mechanism, the valence and conduction band positions of the semiconductors were calculated using the Butler and Ginley model [
32]. The equations used are as follows:
In these equations, χ represents the absolute electronegativity of the semiconductor; Ee is the free electron energy on the hydrogen scale (4.5 eV); and Eg is the bandgap energy of the semiconductor.
From these calculations, the conduction bands of ZnO and BiOCl are determined to be −0.32 eV and 0.19 eV, respectively, with band gaps of 2.9 eV and 3.47 eV. When the energy of incident light exceeds the bandgap width of ZnO, electrons in the valence band of ZnO transition to the conduction band, leading to electron–hole separation. Due to the lower Fermi level of metal Ag compared to ZnO, some electrons from ZnO transfer to the surface of Ag, which acts as a temporary electron storage, thereby enhancing electron–hole separation efficiency.
Since the conduction band potential of ZnO (−0.32 eV) is lower than that of BiOCl (0.19 eV), some electrons transfer to the surface of BiOCl. These free electrons, along with those on the surface of Ag, are readily captured by O2 to form the active radical ·O2−. Furthermore, the valence band potential of BiOCl (3.47 eV) is higher than that of ZnO (2.9 eV), causing holes on BiOCl to transfer to ZnO and react with OH- and H2O to produce highly oxidizing ·OH radicals. These radicals react with ciprofloxacin to form H2O and CO2. The holes on the valence band of BiOCl and free electrons on Ag and ZnO further inhibit electron–hole pair recombination, enhancing photocatalytic activity.
Since the conduction band potential of ZnO does not reach the oxidation potential of O2/·O2− (−0.33 eV) but the valence band potential reaches the reduction potentials of OH−/·OH (2.38 eV) and H2O/·OH (2.72 eV), the reaction of electrons with O2 to form ·O2− is weak, resulting in fewer ·O2− radicals. Conversely, the generation of ·OH radicals from the reaction of holes with H2O and OH− is more prominent. Therefore, ·OH and holes play a dominant role in the degradation process, which is consistent with the findings of the radical scavenging experiment.


