Article

Research on the Calibration Method of the Bonding Parameters of the EDEM Simulation Model for Asphalt Mixtures

1
School of Environment and Architecture, University of Shanghai for Science and Technology, Shanghai 200093, China
2
Road Engineering Technology Research Institute Co., Ltd., Jiaxing 314000, China
3
China MCC5 Group Corp. Ltd., Chengdu 610063, China
*
Author to whom correspondence should be addressed.
Coatings 2024, 14(12), 1553; https://doi.org/10.3390/coatings14121553
Submission received: 8 November 2024 / Revised: 7 December 2024 / Accepted: 10 December 2024 / Published: 11 December 2024

Abstract

:
To enhance the accuracy and reliability of the discrete element simulation software EDEM 2023 for pavement asphalt mixture simulation, three representative coarse aggregate particles were modeled in 3D using the SolidWorks 2018 software and imported into the EDEM 2023 software for particle filling. The Hertz–Mindlin with bonding contact model was used to construct the EDEM simulation model of asphalt mixtures, and the quadratic regression model of asphalt mixtures’ splitting tensile strength and four bonding parameters, namely, normal stiffness per unit area, shear stiffness per unit area, critical normal stress, and critical shear stress, was found by the response surface methodology. The results show that the relationship between the significance magnitude of the four bonding parameters on the splitting tensile strength of the asphalt mixture simulation model is as follows: critical normal stress > shear stiffness per unit area > normal stiffness per unit area > critical shear stress. The calibration results of the bonding parameters were used for simulation verification, and the relative error between the simulation and actual splitting tensile strength was only −2.48%. The feasibility of this bonding parameter calibration method is demonstrated, and it can lay a foundation for EDEM to simulate the performance of asphalt mixtures on pavements with high-precision simulation.

1. Introduction

Asphalt mixtures are widely used in road construction based on their excellent road performance [1]. The macroscopic mechanical properties of asphalt mixtures are closely related to their mesoscopic behavioral properties [2]. In recent years, the study of meso-scale asphalt mixtures has gradually attracted the attention of numerous scholars. The discrete element method (DEM), based on interparticle contact modeling and Newton’s second law, was initially applied to geotechnical material. It started to be applied to asphalt mixtures after the emergence of the bond contact model and has been widely used for asphalt mixtures research currently [3,4,5]. The discrete element method (DEM) is used in two-dimensional particle flow code (PFC2D), three-dimensional particle flow code (PFC2D), and the EDEM software [6,7,8]. Researchers have used the discrete element method (DEM) to study asphalt mixtures from different perspectives, mainly including the internal mechanical response, the evolution of meso-mechanical behavior during the loading process, and the morphological characteristics of the coarse aggregate skeleton [9,10,11].
The discrete element simulation software EDEM has advantages in high-performance computing, user-friendliness, integration with other computer-aided engineering (CAE) tools, rich visualization and analysis tools, suitability for large-scale complex simulation, and multi-tool integration [12]. Khateeb et al. [7] simulated the meso-mechanical behavior of asphalt mixtures during the compaction process using the viscoelastic contact model in EDEM. They analyzed the internal structure and bubble distribution within the mixtures during this process. Xie et al. [3] conducted discrete element method (DEM) simulations using EDEM, considering the asphalt film and Johnson–Kendall–Roberts (JKR) cohesive forces. Their research focused on investigating the mechanism and evaluation of segregation in asphalt mixtures. Ma et al. [13] utilized the EDEM discrete element simulation software to establish a simulation model for the vibrating screening component, which is a core and critical structure of the detection equipment, based on the functional requirements for detecting the aggregate gradation of Recycled Asphalt Pavement (RAP). They conducted simulations of the entire screening process. Yu et al. [14] used the discrete element method (DEM) simulation software EDEM to generate and compact six types of asphalt mixtures with different aggregate gradations. Based on the complex network theory, they analyzed the influence of the compaction degree of the mixtures on the topological characteristics of Functional Connectivity Networks (FCNs). X. M. Ai et al. [15] summarized that the morphological characteristics of coarse aggregates and spatial distribution of air voids are essential to the simulation results of asphalt mixtures. H. Zhang et al. [16] conducted Brazilian disk-splitting tensile tests on concrete and mortar with three water–cement ratios and four loading rates, respectively. A model that conforms to the macroscopic performance of the concrete dynamic splitting tensile test was established based on the discrete element method (DEM) and Hertz–Mindlin bond model. Virtual splitting tests have become an important means of exploring the micro- and meso-mechanical properties of asphalt mixtures. Sun et al. [17] calibrated the parameters by the Marshall experiment, and the simulation experiment results after parameter adjustment were in good agreement with the experimental results in a laboratory.
The studies above indicate that the use of the discrete element method (DEM) simulation software EDEM for simulating asphalt mixtures in pavements is feasible. The reliability of the simulation results depends on the accuracy of the DEM parameters. However, many studies rely on parameters either already available in the literature or based on empirical values. Parameters solely obtained from the literature cannot accurately simulate actual conditions. Currently, there are few scholars who have conducted relevant research on the relationship between the mesoscopic characteristics and macroscopic mechanical properties of asphalt mixtures using the Hertz–Mindlin with bonding contact model in the discrete element method (DEM) software EDEM. In view of this, this study employs the discrete element method (DEM) simulation software EDEM and selects the Hertz–Mindlin with bonding contact model. The calibration method for the binding parameters of the EDEM simulation model of asphalt mixtures was studied by laboratory and simulation splitting tests. The foundation for EDEM’s high-precision simulation of pavement asphalt mixture properties was laid. EDEM simulation based on the bonding parameters that get calibrated makes the simulation results conform to the real situation. The practical application of EDEM simulation studies is further promoted, thus reducing the economic costs incurred by laboratory tests.

2. Materials and Methods
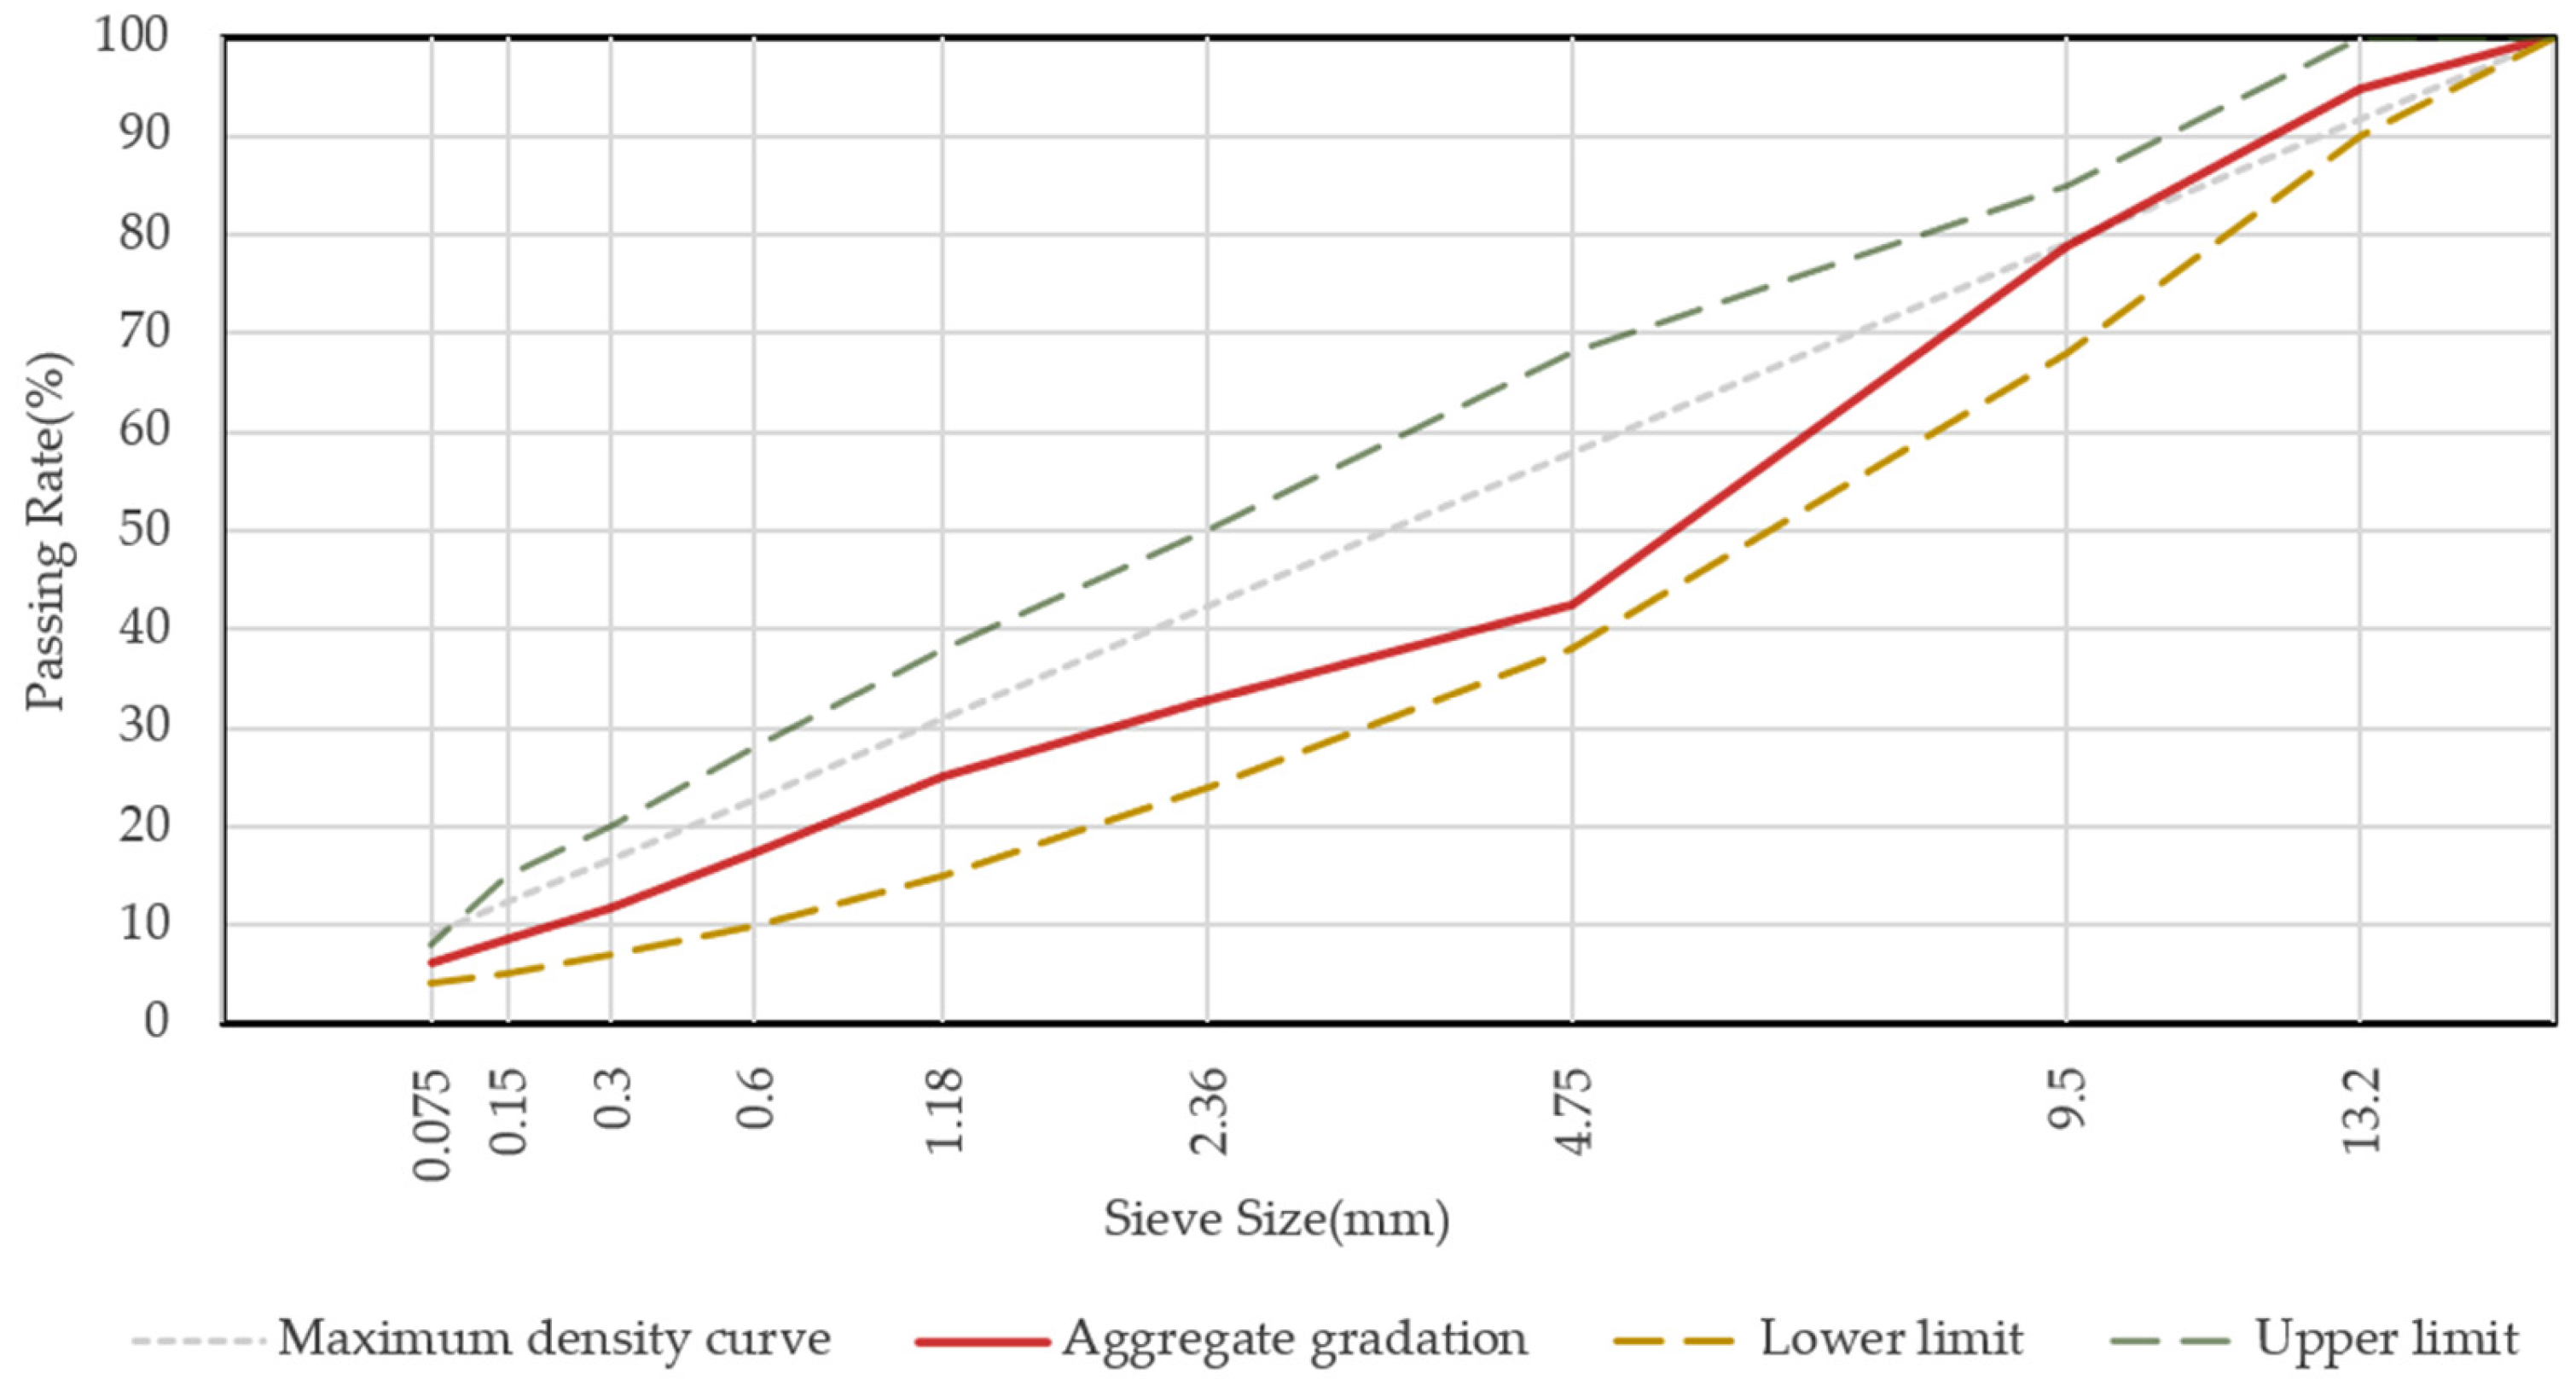
2.1. Raw Materials

In the discrete element model, the bond strength of the asphalt binder is represented in the parameter settings of the bond contact model, so the type of asphalt binder chosen has no effect on the results of the study. Due to its excellent performance in high-temperature stability, low-temperature crack resistance, and fatigue resistance, Styrene–butadiene–styrene (SBS)-modified asphalt mixture is widely used in high-grade pavements [18]. Therefore, SBS-modified asphalt binder supported by a company in Jiaxing, China is selected, and its technical indicators are tested according to the requirements of the “Standard Test Methods of Bitumen and Bituminous Mixtures for Highway Engineering” (JTG E20-2011) [19]. The test results are shown in Table 1.
According to the “Test Methods of Aggregate for Highway Engineering” (JTG 3432-2024) [20], the technical indicators of coarse aggregate, fine aggregate, and mineral powder (Sourced from Jiaxing, China) were tested. The test results are presented in Table 2, Table 3 and Table 4, respectively, and all the technical indicators meet the requirements of the relevant technical standards.

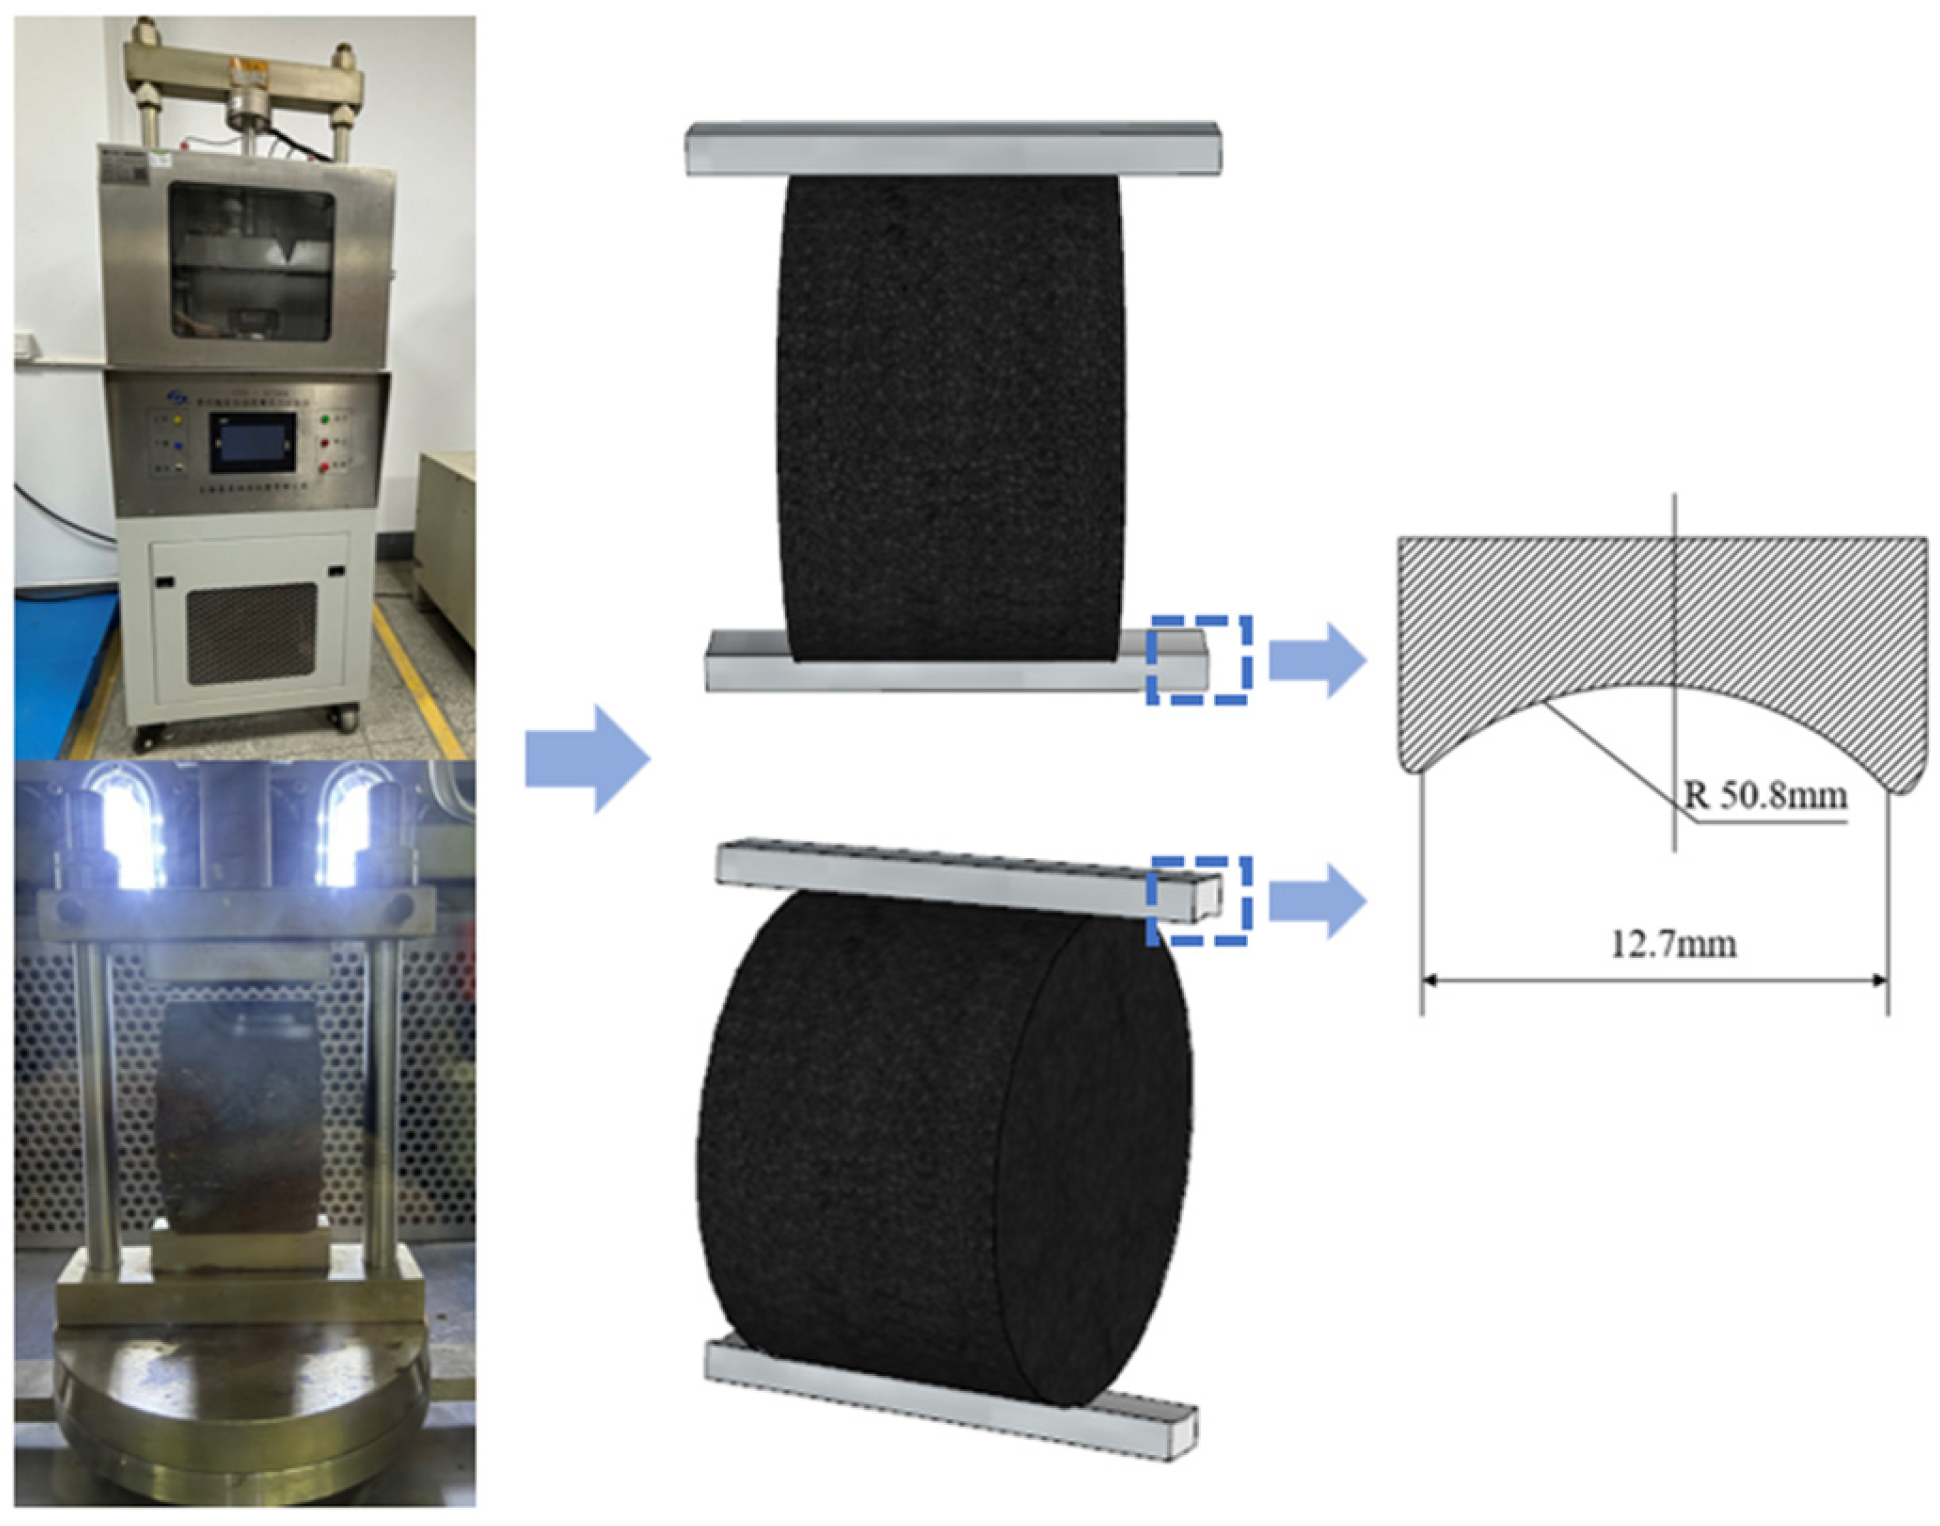
2.2. Measurement of Splitting Tensile Strength of Asphalt Mixtures

The aggregate gradation of the asphalt mixture is selected as AC-13, as shown in Figure 1. The oil–stone ratio is 5%. Marshall specimens with dimensions of φ101.6 mm ± 0.25 mm × 63.5 mm ± 1.3 mm, formed using the standard compaction method (75 hits on each side), were used for the splitting test.
The SYD-0730A multi-functional automatic asphalt pressure tester (Produced by Shanghai Changji Geological Instrument CO., LTD, Shanghai, China) was used to conduct splitting tensile strength tests on the asphalt mixture specimens. The test was conducted at a temperature of 15 °C with a loading rate of 50 mm/min (Figure 2).
According to the “Test Methods of Bitumen and Bituminous Mixtures for Highway Engineering” (JTG E20-2011) [19], the splitting tensile strength is calculated using Equation (1). The splitting tensile strengths of the specimens are shown in Table 5.
R T = 0.006287 P T / h
In Equation (1), R T is the splitting tensile strength, MPa; P T is the maximum load applied to the specimen, N; and h is the height of the specimen, mm.

3. EDEM Simulation Modeling of Asphalt Mixtures

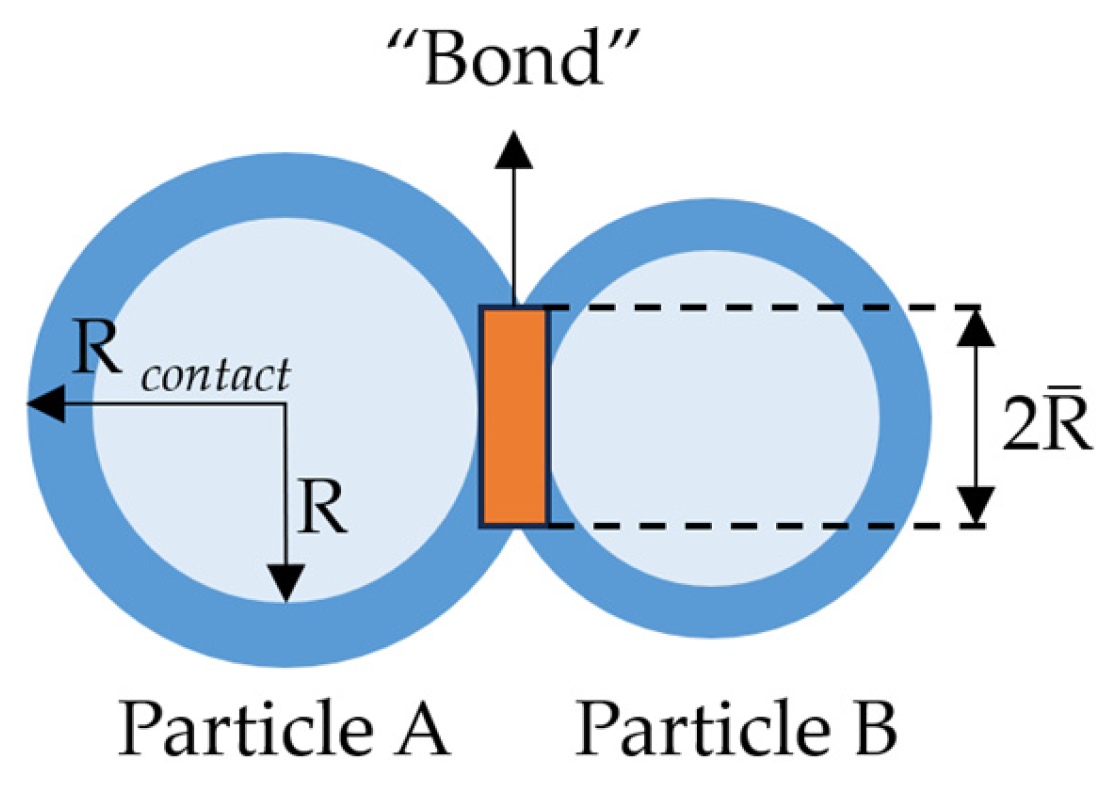
3.1. Selection of Bonded Contact Model

The crux of constructing a simulation model for asphalt mixtures lies in accurately modeling the bonding interactions between particles. The Hertz–Mindlin with bonding contact model, available within the discrete element method (DEM) simulation software EDEM, introduces the concept of a “Bond” based on the Hertz–Mindlin model to simulate the bonding interactions between particles. The bonding model is particularly suitable for simulating the fracture and failure of asphalt concrete and geomaterial structures [21,22].
As depicted in Figure 3, R represents the physical radius of the particles; R c o n t a c t denotes the contact radius of the particles; and R ¯ signifies the bonding radius. A “Bond” can be formed when the distance between particles is less than the sum of their contact radius. This “Bond” acts as a finite-sized adhesive, resisting a certain degree of normal and shear movement within the contact radius of the particles. When the normal and shear stresses exceed a predefined value, the bond breaks and will not regenerate.
The motional state and displacement state of the asphalt mixture particle units are calculated using the Hertz–Mindlin model prior to the bonding time t b o n d . Upon reaching the bonding time t b o n d in the simulation, bonding occurs between the particles, and the contact forces ( F n , t ) and torques ( M n , t ) are subsequently reset to zero. These are then recalculated at each time step using the following equations:
δ F n = v n S n A δ t
δ F t = v t S t A δ t
δ M n = ω n S t J δ t
δ M t = ω t S n J 2 δ t
In which
A = π R ¯ 2
J = 1 2 π R ¯ 4
In the equations, v n and v t represent the normal and shear velocities of the particle, respectively, m/s; S n and S t denote the normal stiffness per unit area and the shear stiffness per unit area, respectively, N/m3; δ t is the time step, s; ω n and ω t are the normal and shear angular velocities of the particle, respectively, rad/s; A is the area of the contact region, m2; and J is the moment of inertia, m4.
When the normal stress and shear stress exceed their respective preset critical values, the “Bond” link will break. The condition for bond rupture can be expressed as follows:
σ m a x < F n A + 2 M t J R ¯
τ m a x < F t A + M n J R ¯
In the equation, σ m a x and τ m a x is the critical normal stress and the critical shear stress, respectively, P a .
To establish a reasonable and reliable EDEM simulation model for asphalt mixtures, it is necessary to calibrate the four key bonding contact parameters of the Hertz–Mindlin with bonding model.

3.2. Simulation Modeling of Asphalt Mixtures

3.2.1. Particle Modeling and Basic Material Parameters

Based on the asphalt mixture mastic theory, this study divides asphalt mixtures into coarse aggregates and asphalt mortar, as shown in Figure 4. The asphalt mortar comprises fine aggregates, fillers, and an asphalt binder.
The skeleton of asphalt mixtures is composed of coarse aggregates, and the particle morphology of these coarse aggregates has a significant impact on the mechanical properties of asphalt mixtures [23,24]. Using a single spherical particle for simulation would deviate significantly from actual conditions, thereby compromising the rationality of the simulation. In this study, three representative typical particles were selected for each grade of coarse aggregates: regular particle, elongated particle, and flat particle [25]. These selected typical particles were three-dimensionally modeled using the SolidWorks software, saved as STL files, and imported into EDEM for particle packing. Upon reviewing the relevant literature [26], it was found that as the number of spheres used to fill the particle increases, the particle model becomes closer to its actual shape, but the change in calculation accuracy is minimal. To ensure both calculation accuracy and efficiency, this study employed a five-sphere model to simulate real coarse aggregate particles. Research has shown that this three-dimensional semi-realistic discrete element method (DEM) model can effectively simulate the macroscopic mechanical properties of granular materials [27]. The packing effects of the three typical particles for coarse aggregates with a particle size range of 13.2–16 mm are shown in Table 6.
In asphalt mixtures, asphalt mortar contributes relatively little to the overall structural support, primarily serving roles in bonding and filling. Additionally, due to the small particle size of asphalt mortar, generating a model based on the aggregate gradation of asphalt mixtures would result in many fine particles, leading to an exponential increase in computation time and a significant reduction in computational efficiency. Therefore, when generating the particle model for asphalt mixtures, asphalt mortar particles are uniformly replaced with spherical particles of a diameter of 2.36 mm [28] in order to facilitate the optimization of the calculation process and achieve a balance between efficiency and accuracy.
The rationality of the material properties of particles and equipment is a vital factor in ensuring the correctness of the simulation results. The material of the equipment is designated as steel. By referring to the relevant literature [23,29], the intrinsic parameters of the materials are listed in Table 7.
The contact parameters between different materials are presented in Table 8.

3.2.2. Simulation Model of the Splitting Test

A cylindrical container with dimensions of φ101.6 mm × 63.5 mm is created in EDEM, serving as the mold for the Marshall specimen. The material of the mold is set to steel. Above the mold, an equally sized virtual container is generated, functioning as a particle factory for generating asphalt mixture particles. The mold and particle factory are illustrated in Figure 5.
The aggregate gradation for the splitting test simulation model, determined based on the asphalt mixture aggregate gradation from the laboratory splitting test, is shown in Table 9.
Based on the aggregate gradation, the particle factory is set to generate asphalt mixture particles. “Max Attempts to Place Particle” is set to 20, which avoids the segregation of the particles and achieves a good distribution of the particles. After all the particles are generated, they undergo compaction processing. Asphalt mixture compaction methods include Marshall impact compaction (MIC), Superpave gyratory compaction (SGC), static compaction (SC), and linear kneading compaction (LKC) [30]. Static compaction (SC) [14] was used in this study. The particle generation and compaction process for the Marshall specimen model is illustrated in Figure 6.
The distribution of particles of various sizes within the compacted Marshall specimen is shown in Figure 7. Both asphalt mortar and coarse particles are distributed uniformly. Asphalt mortar particles make up the largest percentage and are distributed throughout the specimen. It is consistent with Table 9.
“Bond” links are formed after the particles are stabilized through compaction. Then, we conceal the particles while revealing the “Bond” links. Following the requirements of the “Standard Test Methods of Bitumen and Bituminous Mixtures for Highway Engineering” (JTG E20-2011) [19] for the shape of the compression bar, a three-dimensional model of the compression bar is established using the SolidWorks software and imported into EDEM. The model for the splitting test is shown in Figure 8. The loading rate of the compression bar in the simulated test is consistent with that of the laboratory splitting test, which is 50 mm/min.

4. Design of Experiments for Calibration Methods of Bonding Parameters

4.1. Response Surface Methodology (RSM) Design and Simulation Results of the Bonded Contact Parameters

Response surface methodology (RSM) is a statistical optimization method that integrates experimental design and mathematical modeling. It models the functional relationship between one or more factors and the response through the data obtained from the experimental design [31]. The various factors affecting the response in response surface methodology need to be identified, along with the selection of an appropriate experimental design methodology, such as the Central Composite Design (CCD) or Box–Behnken design, to obtain sufficient data for modeling. The rupture of the “Bond” links between particles is related to four bonding parameters in the Hertz–Mindlin with bonding contact model, which include normal stiffness per unit area, shear stiffness per unit area, critical normal stress, and critical shear stress. To prevent being affected by out-of-range parameter values, studies related to the setting of bonding parameters in EDEM models for asphalt mixtures are referenced [32,33,34]. The upper and lower limits of the four bonding parameters are shown in Table 10.
For the convenience of expression, normal stiffness per unit area, shear stiffness per unit area, critical normal stress, and critical shear stress have been, respectively, denoted using the X 1 , X 2 , X 3 , and X 4 . They are identified as the parameters to be calibrated. A response surface methodology experimental design is adopted, with splitting tensile strength R T as the test indicator. Utilizing the Box–Behnken method in the software Design-Expert 13 and referring to the upper and lower limits of the four bonding parameters in Table 10, a response surface methodology is designed. The response surface methodology design and simulation results are presented in Table 11.

4.2. Analysis of Simulation Results

The simulation results in Table 11 show that the maximum and minimum values of splitting tensile strength for the EDEM simulation model of asphalt mixtures are 1.21 MPa and 0.12 MPa, respectively. The range of splitting tensile strength of asphalt mixtures is generally covered. The results of the response surface methodology experiment were fitted and analyzed. The results indicated that when using a quadratic full model equation for fitting, the coefficient of determination R 2 was 0.9918. The variance analysis of the regression model is presented in Table 12.
As shown in Table 12, the p-value of the regression model is less than 0.01, demonstrating that the model’s independent variables have a very significant impact on the dependent variable. The p-value of the loss-of-fit term is greater than 0.05, indicating that the loss of fit is not significant. This suggests that the quadratic regression equation fitted by the model aligns well with the actual situation, allowing for reliable parameter estimation results. Among the effects on splitting tensile strength, X 1 , X 2 , X 3 , X 4 , X 1 X 3 , X 1 X 4 , X 2 X 3 , and X 2 2 are very significant; X 1 X 2 , X 3 X 4 , and X 4 2 are significant; and X 2 X 4 , X 1 2 , and X 3 2 are not significant.
Based on the regression equation, response surfaces for the interaction effects of various factors on the splitting tensile strength R T can be obtained, as shown in Figure 9.
Figure 9 clearly illustrates the influence patterns of the four bonding parameters on the splitting tensile strength. As shown in Figure 9d,f and Figure 9b, when the normal stiffness per unit area ( X 1 ), shear stiffness per unit area ( X 2 ), and critical shear stress ( X 4 ) are fixed, the critical normal stress ( X 3 ) has the most obvious effect on the splitting tensile strength, and the splitting tensile strength increases significantly with the increase in the critical normal stress, and the growth rate increases significantly.
As shown in Figure 9d,e and Figure 9a, when the normal stiffness per unit area ( X 1 ), the critical normal stress ( X 3 ), and the critical shear stress ( X 4 ) are fixed, the splitting tensile strength increases slowly and then tends to flatten out, or even tends to decrease, with the increase in the shear stiffness per unit area ( X 2 ).
As shown in Figure 9b,c and Figure 9a, when the shear stiffness per unit area ( X 2 ), the critical normal stress ( X 3 ), and the critical shear stress ( X 4 ) are fixed, the splitting tensile strength decreases with the increase in the normal stiffness per unit area ( X 1 ), but the rate of decrease is low.
As shown in Figure 9e,f and Figure 9c, when the normal stiffness per unit area ( X 1 ), shear stiffness per unit area ( X 2 ), and critical normal stress ( X 3 ) are fixed, the critical shear stress ( X 4 ) has no significant effect on the splitting tensile strength.
In summary, the significance of the influencing factors among the four bonding parameters is ranked as follows: critical normal stress ( X 3 ) > shear stiffness per unit area ( X 2 ) > normal stiffness per unit area ( X 1 ) > critical shear stress ( X 4 ). This ranking is consistent with the results of the model variance analysis.
Under the premise of ensuring a significant regression model and insignificant loss-of-fit terms, insignificant terms are removed to modify the quadratic regression model. The results show that when fitted using the quadratic full model equation, the coefficient of determination R 2 was 0.9879. The variance analysis of the modified regression model is presented in Table 13. The resulting quadratic regression model is as follows:
R T = 0.1486 + 1.14 E 11 X 1 + 2.64 E 11 X 2 + 8.44 E 11 X 3 + 5.41 E 11 X 4 5.22 E 22 X 1 X 2 2.95 E 21 X 1 X 3 2.59 E 21 X 1 X 4 + 3.04 E 21 X 2 X 3 + 6.11 E 21 X 3 X 4 7.01 E 22 X 2 2 5.68 E 21 X 4 2
As seen in Table 13, the independent variable in the modified regression model has an extremely significant effect on the dependent variable, and at the same time, the regression equation is consistent with the actual situation, and reliable calibration results can be obtained. Compared to previous researchers who set the bonding parameters empirically when performing the EDEM simulations of asphalt mixtures, this regression model can provide researchers with a guide for the settings.
Using the Design-Expert software, the target value of R T , which is the average splitting tensile strength of 0.848 MPa in laboratory asphalt mixture splitting tests, was sought. This is the result of the calibration of the bonding parameters of the EDEM simulation model for asphalt mixtures: the normal stiffness per unit area, shear stiffness per unit area, critical normal stress, and critical shear stress were 1.31 × 10¹⁰  N / m 3 , 8.24 × 10⁹  N / m 3 , 5.78 × 10⁹ Pa, and 5.28 × 10⁹ Pa, respectively.

5. Verification of EDEM Simulation Model for Asphalt Mixtures

To verify the accuracy and reliability of the model for the tensile splitting strength of asphalt mixtures, this study conducts EDEM simulation experiments based on the calibration results of the bonding parameters. The loading rate of the compression bar in the simulation experiments is set to 50 mm/min, consistent with that in the laboratory splitting test. The EDEM analyst module is utilized to export data on the variation in the load of the upper compression bar over time. The variation in the load applied by the upper compression bar and the fracture state of the specimen over time are shown in Figure 10.
From Figure 10, it can be observed that the overall trend of the load variation over time applied by the upper compression bar in both the simulation and laboratory splitting test of the asphalt mixture is similar. The simulated splitting tensile strength, calculated by Equation (1), is 0.827 MPa, with a relative error of only −2.48% compared to the splitting tensile strength obtained from the laboratory test.
The calibration method of the bonding parameters has been proven to be accurate. The relationship between the mesoscopic characteristics and macroscopic mechanical properties of asphalt mixtures was provided. The performance of the asphalt mixture EDEM simulation model can be more accurately simulated after the bonding parameters have been calibrated.

6. Conclusions

The three-dimensional modeling of coarse aggregate particles in asphalt mixture was conducted using SolidWorks and then imported into the EDEM software for particle packing; asphalt mortar particles were uniformly replaced with spherical particles of a diameter of 2.36 mm, thereby establishing an EDEM simulation model for asphalt mixture. The main research conclusions are as follows:
(1)
In the discrete element software EDEM’s Hertz–Mindlin with bonding contact modeling, the significance of the influence of the four bonding parameters on the splitting tensile strength of the asphalt mixture simulation model is as follows: critical normal stress ( X 3 ) > shear stiffness per unit area ( X 2 ) > normal stiffness per unit area ( X 1 ) > critical shear stress ( X 4 ).
(2)
The regression models between the four bonding parameters and splitting tensile strength were established by the response surface methodology (RSM). The splitting tensile strength of asphalt mixtures in the laboratory tests was calibrated as follows: the normal stiffness per unit area, shear stiffness per unit area, critical normal stress, and critical shear stress were 1.31 × 10¹⁰  N / m 3 , 8.24 × 10⁹  N / m 3 , 5.78 × 10⁹ Pa, and 5.28 × 10⁹ Pa, respectively.
(3)
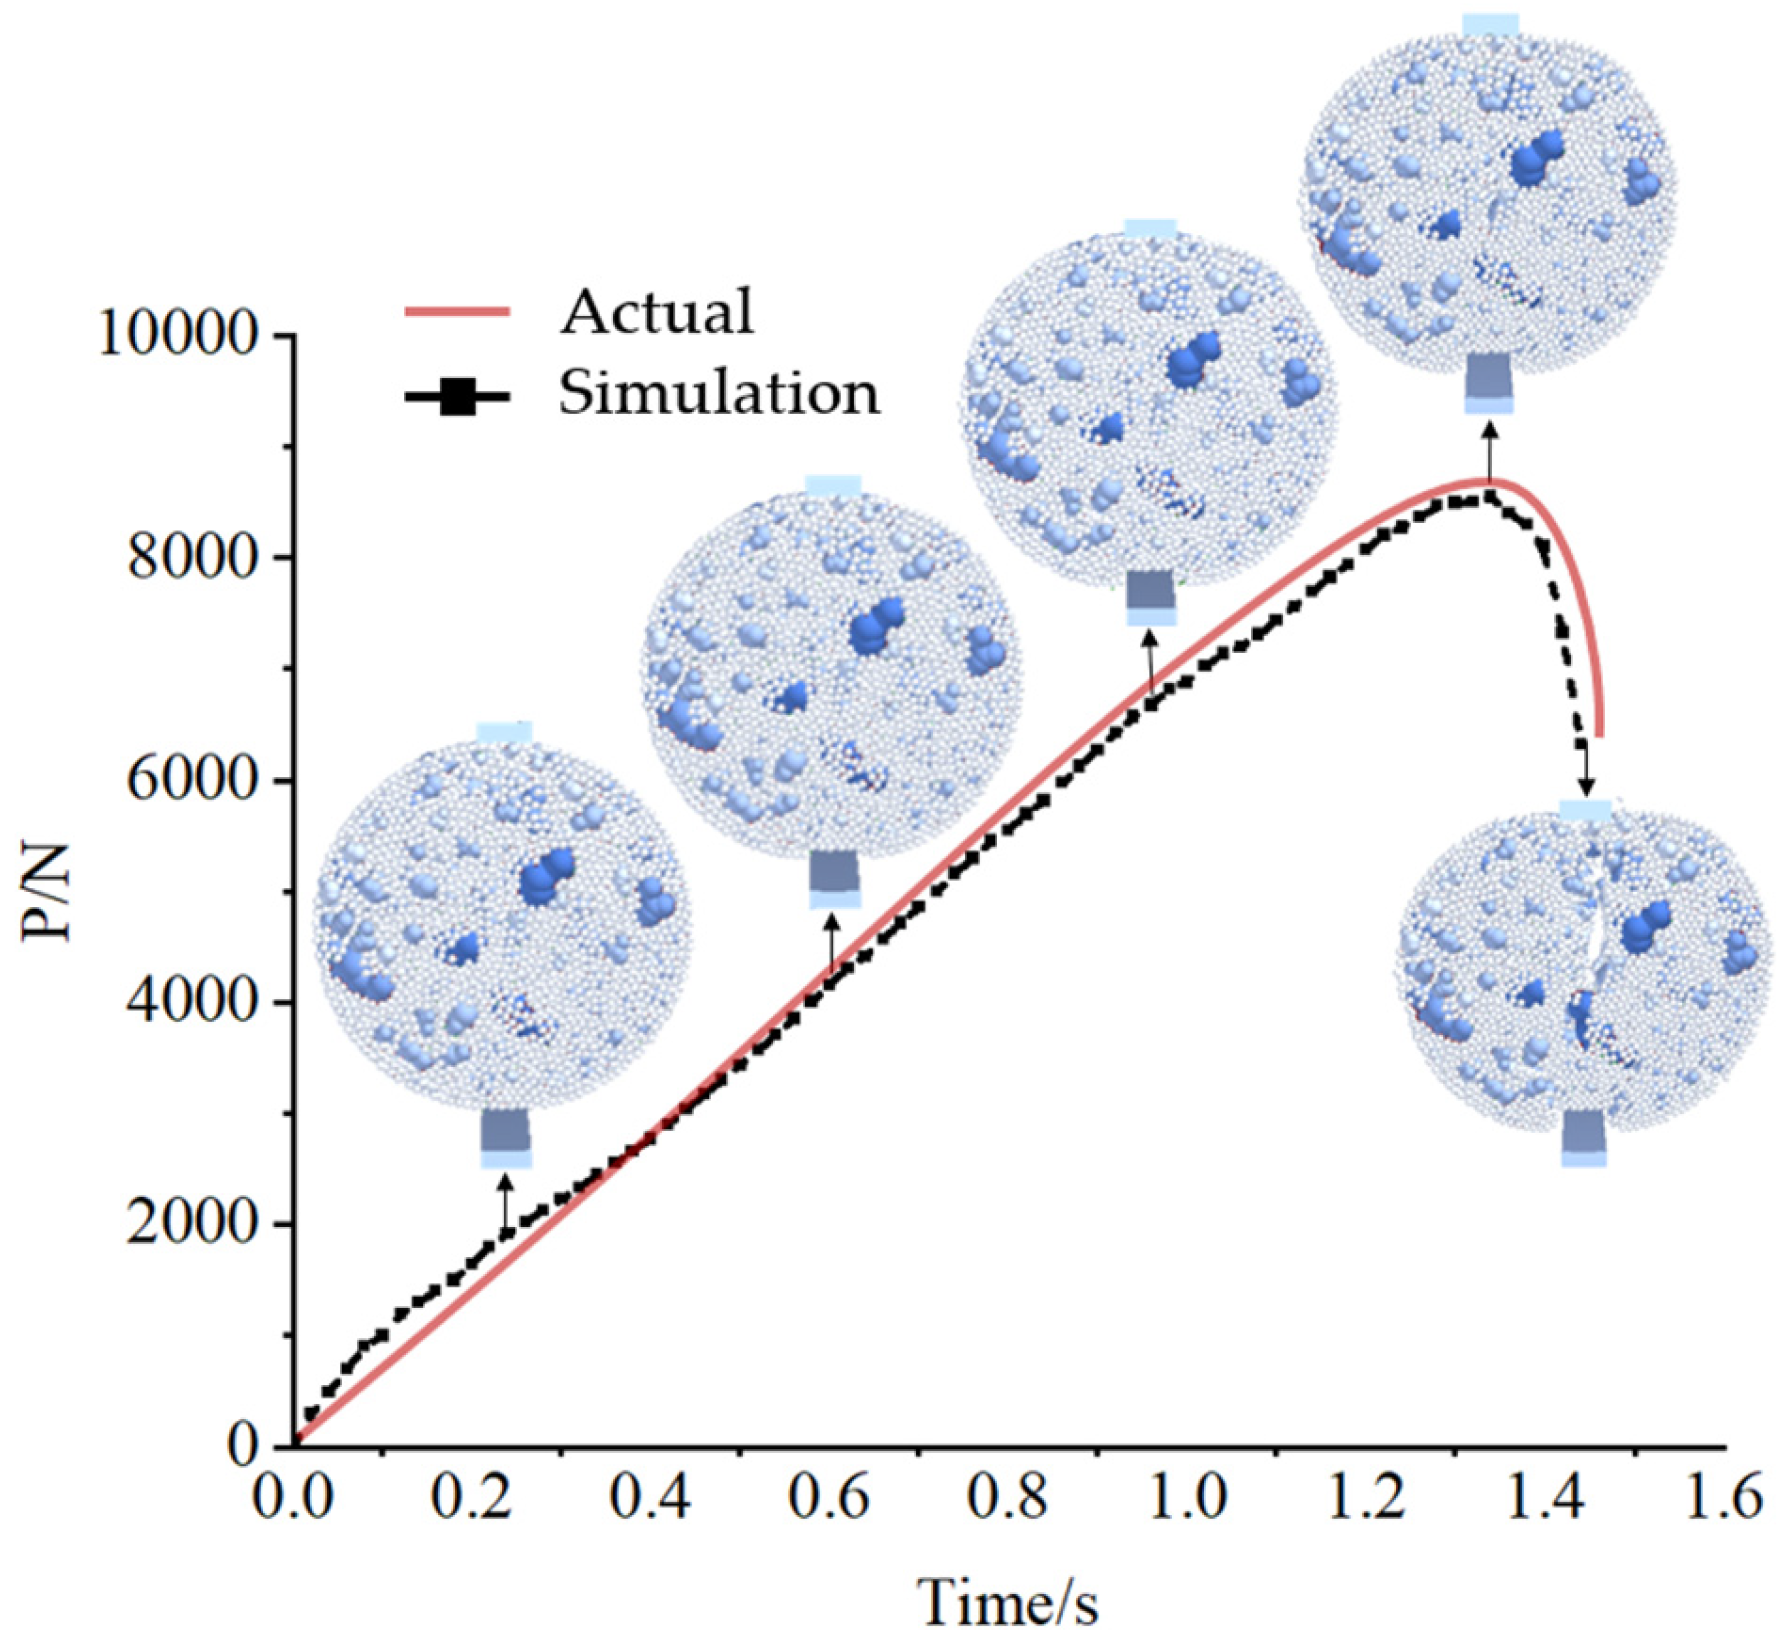
The comparative validation results between the discrete element simulation tests and laboratory tests show that the trends of time–load curve changes between the simulation and actual tests are generally consistent. The feasibility and accuracy of the bond parameter calibration method for the EDEM simulation models of asphalt mixtures are proved. The calibration method can provide a basis for accurate studies of asphalt mixtures.

Author Contributions

Conceptualization, X.L.; methodology, X.L. and Z.Z.; data curation, Z.Z. and L.Z.; writing—original draft preparation, Z.Z. and H.Z.; writing—review and editing, X.L.; visualization, Z.Z.; project administration, F.S.; funding acquisition, X.L. and F.S. All authors have read and agreed to the published version of the manuscript.

Funding

This research received no external funding.

Institutional Review Board Statement

Not applicable.

Informed Consent Statement

Not applicable.

Data Availability Statement

Data is contained within the article.

Conflicts of Interest

Authors Linhao Zhao and Fangzhi Shi were employed by Road Engineering Technology Research Institute Co., Ltd. Author Heng Zhang was employed by China MCC5 Group Corp. Ltd. The remaining authors declare that the research was conducted in the absence of any commercial or financial relationships that could be construed as a potential conflict of interest.

References

  1. Editorial Department of China Journal of Highway and Transport. Review on China’s Pavement Engineering Research: 2024. China J. Highw. Transp. 2024, 37, 1–81. [Google Scholar]
  2. Sun, Y.; Xue, B.; Sun, Y.; Wang, Z.; Pan, J. Mesoscale simulation of cracking behavior of asphalt mixture considering heterogeneity. J. Jilin Univ. Eng. Technol. Ed. 2024, 54, 1708–1718. [Google Scholar]
  3. Xie, Y.; Yuan, M.; Zhao, Y. Analysis of mechanism and evaluation of asphalt mixtures segregation based on DEM simulation. Constr. Build. Mater. 2023, 398, 132500. [Google Scholar] [CrossRef]
  4. Ge, H.; Quezada, J.C.; Houerou, V.L.; Chazallon, C. Multiscale analysis of tire and asphalt pavement interaction via coupling FEM–DEM simulation. Eng. Struct. 2022, 256, 113925. [Google Scholar] [CrossRef]
  5. Wang, H.; Wu, H.; Xiang, J.; Ye, G. Simulation of Creep Damage of Asphalt Mixture Based on Discrete Element Method. J. Mater. Civ. Eng. 2023, 35, 04023185. [Google Scholar] [CrossRef]
  6. Pouranian, M.R.; Shishehbor, M.; Haddock, J.E. Impact of the coarse aggregate shape parameters on compaction characteristics of asphalt mixtures. Powder Technol. Int. J. Sci. Technol. Wet Dry Part. Syst. 2020, 363, 369–386. [Google Scholar] [CrossRef]
  7. Al Khateeb, L.; Anupam, K.; Erkens, S.; Scarpas, T. Micromechanical simulation of porous asphalt mixture compaction using discrete element method (DEM). Constr. Build. Mater. 2021, 301, 124305. [Google Scholar] [CrossRef]
  8. Ning, Y.; Huang, Q.; Shi, C.; Meng, Q. Numerical Simulation Study on Compression Characteristics of Gravelly Soil Mixture Based on Soft Servo Method. Geofluids 2021, 2021, 9946628. [Google Scholar] [CrossRef]
  9. Zhu, X.; Qian, G.; Yu, H.; Yao, D.; Shi, C.; Zhang, C. Evaluation of coarse aggregate movement and contact unbalanced force during asphalt mixture compaction process based on discrete element method. Constr. Build. Mater. 2022, 328, 127004. [Google Scholar] [CrossRef]
  10. Ren, J.; Yin, C. Investigating mechanical characteristics of aggregate structure for road materials. Int. J. Pavement Eng. 2022, 23, 372–386. [Google Scholar] [CrossRef]
  11. Guo, H.; Dai, X.; Zhang, K.; Pan, Y.; Wu, J. Study on the compaction space of coarse aggregates of asphalt mixtures. Constr. Build. Mater. 2022, 359, 129487. [Google Scholar] [CrossRef]
  12. Liang, X.; Hu, Z.; Zheng, L.; Wang, Y. Optimization of the discrete element contact model for tidal flat soil and field shoveling experiment. Trans. Chin. Soc. Agric. Eng. 2024, 40, 107–115. [Google Scholar]
  13. MA, D.; Xu, T.; Gui, X.; Wang, E. Design and simulation analysis of real-time automatic detection system for RAP gradation. J. Harbin Inst. Technol. 2024, 56, 145–152. [Google Scholar]
  14. Yu, W.; Wang, S.; Gong, Z.; Miao, Y. Effect of compaction degree on the topological characteristics of force chain network (FCN) in aggregate blend. Constr. Build. Mater. 2024, 419, 135554. [Google Scholar] [CrossRef]
  15. Ai, X.M.; Yi, J.Y.; Pei, Z.S.; Zhou, W.Y.; Feng, D.C. Advances in Discrete Element Modeling of Asphalt Mixture: A Literature Review. Arch. Comput. Methods Eng. 2024, 31, 4003–4029. [Google Scholar] [CrossRef]
  16. Zhang, H.; Pan, L.Y.; Pan, Q.; Jin, C.J.; Ji, S.S.; Liu, X.Y. Experimental Study on Splitting Tensile Damage Characteristics and Discrete Element Simulation of Concrete Based on Acoustic Emission Technology. J. Mater. Civ. Eng. 2023, 35, 04022385. [Google Scholar] [CrossRef]
  17. Sun, X.Y.; Wang, H.X.; Gu, X.; He, Z.; Xu, L.D.; Shi, M.F. Effects of Needle Flake Particles on Splitting Experiment of Asphalt Mixture: An Experimental and Numerical Investigation. Nanosci. Nanotechnol. Lett. 2020, 12, 1166–1170. [Google Scholar] [CrossRef]
  18. Liang, B.; Zhang, K.; Zhang, H. Adhesion Performance of Aminosilane-Montmorillonite/SBS Modified Asphalt and Modified Aggregate. J. Hunan Univ. Nat. Sci. 2023, 50, 195–205. [Google Scholar]
  19. JTG E20-2011; Standard Test Methods of Bitumen and Bituminous Mixtures for Highway Engineering. Ministry of Transport of the People’s Republic of China: Beijing, China, 2011.
  20. JTG 3432-2024; Aggregate Testing Procedure for Highway Engineering. Ministry of Transport of the People’s Republic of China: Beijing, China, 2024.
  21. Yao, Y.S.; Li, J.; Ni, J.J.; Liang, C.H.; Zhang, A.S. Effects of gravel content and shape on shear behaviour of soil-rock mixture: Experiment and DEM modelling. Comput. Geotech. 2022, 141, 104476. [Google Scholar] [CrossRef]
  22. Wang, S.Q.; Ji, S.Y. A unified level set method for simulating mixed granular flows involving multiple non-spherical DEM models in complex structures. Comput. Methods Appl. Mech. Eng. 2022, 393, 114802. [Google Scholar] [CrossRef]
  23. Wang, H. Bending and Pulling of Asphalt MixturesConsidering Coarse Aggregate Morphology Using Discrete Elements. Master’s Thesis, Harbin Engineering University, Harbin, China, 2022. [Google Scholar]
  24. Wu, G.; Jiang, Y.; Zhang, W.; Chen, H. Influence of Coarse Aggregate Distribution Morphology on the Fatigue Performance of Asphalt Mixtures. J. Chongqing Jiaotong Univ. Nat. Sci. 2023, 42, 80–86. [Google Scholar]
  25. Wang, S.D.; Miao, Y.H.; Wang, L.B. Investigation of the force evolution in aggregate blend compaction process and the effect of elongated and flat particles using DEM. Constr. Build. Mater. 2020, 258, 119674. [Google Scholar] [CrossRef]
  26. Stahl, M.; Konietzky, H. Discrete element simulation of ballast and gravel under special consideration of grain-shape, grain-size and relative density. Granul. Matter 2011, 13, 417–428. [Google Scholar] [CrossRef]
  27. Lu, M.; McDowell, G.R. The importance of modelling ballast particle shape in the discrete element method. Granul. Matter 2007, 9, 69–80. [Google Scholar] [CrossRef]
  28. Deng, Z. Study on Numerical Simulation Method of Asphalt Mixture Based on Three Dimensional Discrete Element Method. Master’s Thesis, South China University of Technology, Guangzhou, China, 2017. [Google Scholar]
  29. Luo, M. Analysis of Planetary Mixing Parameters for Regeneration of Used Asphalt Pavement Materials. Master’s Thesis, University of Jinan, Jinan, China, 2022. [Google Scholar]
  30. Qian, G.; Hu, K.; Li, J.; Bai, X.; Li, N. Compaction process tracking for asphalt mixture using discrete element method. Constr. Build. Mater. 2020, 235, 117478. [Google Scholar] [CrossRef]
  31. Vatanparast, M.; Sarkar, A.; Sahaf, S.A. Optimization of asphalt mixture design using response surface method for stone matrix warm mix asphalt incorporating crumb rubber modified binder. Constr. Build. Mater. 2023, 369, 130401. [Google Scholar] [CrossRef]
  32. Wang, J. Numerical Simulation and Structural Improvement of the Milling Process of Asphalt Pavement Milling Machine. Master’s Thesis, Xiangtan University, Xiangtan, China, 2022. [Google Scholar]
  33. Huang, Y. Study on Agglomeration Rate of Recycled Asphalt Mixture Based on Discrete Element Method. Master’s Thesis, Chongqing Jiaotong University, Chongqing, China, 2023. [Google Scholar]
  34. Guo, Q.; Xu, H.; Wang, J.; Hang, J.; Wang, K.; Hu, P.; Li, H. Gradation Optimization Based on Micro-Analysis of Rutting Behavior of Asphalt Mixture. Coatings 2023, 13, 1965. [Google Scholar] [CrossRef]
Figure 1. Aggregate gradation of asphalt mixture.
Coatings 14 01553 g001
Figure 2. Laboratory splitting test for asphalt mixtures.
Coatings 14 01553 g002
Figure 3. Interaction of the “Bond” between Particle A and Particle B.
Coatings 14 01553 g003
Figure 4. Asphalt mixture mastic theory.
Coatings 14 01553 g004
Figure 5. Marshall specimen mold and particle factory.
Coatings 14 01553 g005
Figure 6. Schematic diagram of Marshall specimen model generation and compaction process.
Coatings 14 01553 g006
Figure 7. Marshall specimen particle size distribution chart by grade.
Coatings 14 01553 g007
Figure 8. The simulation model for the splitting test.
Coatings 14 01553 g008
Figure 9. Response surfaces for the interaction effects of various factors on the splitting tensile strength R T : (a) interaction effects between X 1 and X 2 ; (b) interaction effects between X 1 and X 3 ; (c) interaction effects between X 1 and X 4 ; (d) interaction effects between X 2 and X 3 ; (e) interaction effects between X 2 and X 4 ; (f) interaction effects between X 3 and X 4 .
Coatings 14 01553 g009
Figure 10. The variation in the load applied by the upper compression bar and the fracture state of the specimen over time.
Coatings 14 01553 g010
Table 1. Technical indicators by specifications and test results for SBS-modified asphalt binder.
ItemUnitTest ValueSpecificationTesting Method
Penetration (25 °C, 100 g, 5 s)0.1 mm70.860~80T 0604
Penetration Index (PI)——0.2≥−0.4T 0604
Ring and Ball Softening Point°C78.6≥55T 0606
Residual Ductility at 5 °Ccm42.1≥30T 0605
Viscosity at 135 °CPa·s1.532≤3T 0625
Elastic Recovery at 25 °C%95≥65T 0662
Density at 25 °Cg/cm31.0036MeasuredT 0603
RTFOTMass Change%0.23≤±1.0T 0609
Penetration Ratio%84.8≥60T 0604
Residual Ductility at 5 °Ccm24.2≥20T 0605
Table 2. Technical indicators by specifications and test results for coarse aggregate.
Test ItemUnitStandard
Requirement
Coarse Aggregate Test ResultAssessmentTesting Method
15~25 mm5~15 mm3~5 mm
Apparent Relative Densityg/cm3≥2.602.8672.7182.825QualifiedT 0304
Bulk Relative Densityg/cm3Measured2.8182.6482.732QualifiedT 0304
Water Absorption Rate%≤2.00.620.971.2QualifiedT 0304
Adhesion to AsphaltStage≥55QualifiedT 0616
Crushing Value%≤2816.2QualifiedT 0316
Elongated and Flaky Particle Content%≤188.6QualifiedT 0312
Soft Stone Content%≤32.3QualifiedT 0320
Sturdiness%≤127QualifiedT 0314
Table 3. Technical indicators by specifications and test results for fine aggregate.
Test ItemUnitStandard
Requirement
Test ResultAssessmentTesting Method
Apparent Densityg/cm3Measured2.701QualifiedT 0328
Apparent Relative Density≥2.502.705T 0328
Robustness (>0.3 mm)%≤128.8QualifiedT 0340
Sand Equivalent%≥6063QualifiedT 0334
Table 4. Technical indicators by specifications and test results for mineral powder.
Test ItemUnitStandard RequirementTest ResultAssessmentTesting Method
Apparent Densityg/cm3Measured2.698QualifiedT 0352
Water Content%≤10.33QualifiedT 0103
Drying Method
Particle Size Range<0.6 mm%100100QualifiedT 0351
<0.15 mm%90~10096.6Qualified
<0.075 mm%75~10085.8Qualified
AppearanceFree from Agglomeration and CakingFree from Agglomeration and CakingQualified
Hydrophilic Coefficient<1.00.8QualifiedT 0353
Table 5. The splitting tensile strength of the Marshall specimens.
Specimen Number The   Maximum   Load   Applied   to   the   Specimen   P T / N The   Splitting   Tensile   Strength   R T / M P a
186100.853
287300.868
386900.849
484900.841
582800.829
Mean Value85600.848
Table 6. The packing effects of the three typical particles for coarse aggregates.
Aggregate TypeActual Photo3D Model DiagramPacking Effects
Regular ParticleCoatings 14 01553 i001Coatings 14 01553 i002Coatings 14 01553 i003
Elongated ParticleCoatings 14 01553 i004Coatings 14 01553 i005Coatings 14 01553 i006
Flat ParticleCoatings 14 01553 i007Coatings 14 01553 i008Coatings 14 01553 i009
Table 7. Intrinsic parameters of the materials.
Material TypePoisson’s RatioDensity (kg/m3)Shear Modulus (Pa)
Coarse Aggregate0.3326001 × 108
Asphalt Mortar0.1524001 × 108
Steel0.378507 × 1010
Table 8. The contact parameters between different materials.
Contact TypeCoefficient of RestitutionStatic Friction CoefficientDynamic Friction Coefficient
Coarse Aggregate–Coarse Aggregate0.010.70.1
Coarse Aggregate–Asphalt Mortar0.0050.750.15
Coarse Aggregate–Steel0.010.60.1
Asphalt Mortar–Asphalt Mortar0.0010.70.1
Asphalt Mortar–Steel0.0050.50.05
Table 9. The aggregate gradation for the splitting test simulation model.
Range of Particle Size/mm16~1913.2~169.5~13.24.75~9.52.36~4.75Asphalt Mortar (2.36)
Simulation Ratio/%0.05.015.134.79.036.1
Table 10. The upper and lower limits of the four bonding parameters.
Bonding ParametersUpper Limit of ParametersLower Limit of Parameters
Normal   Stiffness   Per   Unit   Area / ( N · m 3 )3.05 × 1092.31 × 1010
Shear   Stiffness   Per   Unit   Area / ( N · m 3 )3.05 × 1092.31 × 1010
Critical   Normal   Stress / P a 4.25 × 1086.00 × 109
Critical   Shear   Stress / P a 4.25 × 1086.00 × 109
Table 11. The response surface methodology design and simulation results.
NumberParameters R T /MPa
X 1 /(N·m−3) X 2 /(N·m−3) X 3 /Pa X 4 /Pa
13.05 × 1091.31 × 10103.21 × 1094.25 × 1080.53
21.31 × 10102.31 × 10104.25 × 1083.21 × 1090.23
31.31 × 10103.05 × 1093.21 × 1096.00 × 1090.32
43.05 × 1092.31 × 10103.21 × 1093.21 × 1090.79
51.31 × 10102.31 × 10103.21 × 1096.00 × 1090.65
63.05 × 1091.31 × 10104.25 × 1083.21 × 1090.28
71.31 × 10101.31 × 10104.25 × 1086.00 × 1090.18
81.31 × 10103.05 × 1094.25 × 1083.21 × 1090.12
91.31 × 10103.05 × 1093.21 × 1094.25 × 1080.33
102.31 × 10101.31 × 10103.21 × 1096.00 × 1090.39
111.31 × 10101.31 × 10106.00 × 1096.00 × 1091.01
122.31 × 10102.31 × 10103.21 × 1093.21 × 1090.47
131.31 × 10101.31 × 10106.00 × 1094.25 × 1080.82
141.31 × 10101.31 × 10103.21 × 1093.21 × 1090.49
151.31 × 10102.31 × 10106.00 × 1093.21 × 1091.12
161.31 × 10101.31 × 10103.21 × 1093.21 × 1090.64
173.05 × 1091.31 × 10106.00 × 1093.21 × 1091.21
181.31 × 10101.31 × 10103.21 × 1093.21 × 1090.58
192.31 × 10101.31 × 10103.21 × 1094.25 × 1080.42
203.05 × 1091.31 × 10103.21 × 1096.00 × 1090.79
211.31 × 10103.05 × 1096.00 × 1093.21 × 1090.67
222.31 × 10101.31 × 10104.25 × 1083.21 × 1090.19
232.31 × 10101.31 × 10106.00 × 1093.21 × 1090.79
243.05 × 1093.05 × 1093.21 × 1093.21 × 1090.41
251.31 × 10102.31 × 10103.21 × 1094.25 × 1080.56
261.31 × 10101.31 × 10104.25 × 1084.25 × 1080.18
272.31 × 10103.05 × 1093.21 × 1093.21 × 1090.30
Table 12. The variance analysis of the regression model.
SourcesQuadratic SumDegree of FreedomMean SquareF-ValueSignificance Level p
Models2.23140.1591103.72<0.0001Significant
X 1 0.175210.1752114.21<0.0001
X 2 0.232410.2324151.50<0.0001
X31.6411.641070.91<0.0001
X 4 0.020810.020813.580.0031
X 1 X 2 0.011010.01107.190.0200
X 1 X 3 0.027210.027217.750.0012
X 1 X 4 0.021010.021013.710.0030
X 2 X 3 0.028910.028918.840.0010
X 2 X 4 0.002510.00251.630.2259
X 3 X 4 0.009010.00905.880.0320
X 1 2 0.000110.00010.0730.7916
X 2 2 0.026410.026417.240.0013
X 3 2 0.005910.00593.860.0729
X 4 2 0.010410.01046.780.0230
Residual0.0184120.0015
Loss of Fit0.0070100.00070.12300.9920Not Significant
Error0.011420.0057
Total Deviation2.2526
Note: p  <  0.01, the difference was very significant; p  <  0.05, the difference was significant; p  >  0.05, the difference was not significant.
Table 13. The variance analysis of the modified regression model.
SourcesQuadratic SumDegree of FreedomMean SquareF-ValueSignificance Level p
Models2.22110.2017111.69<0.0001Significant
X 1 0.175210.175297.01<0.0001
X 2 0.232410.2324128.69<0.0001
X31.6411.64909.64<0.0001
X 4 0.020810.020811.540.004
X 1 X 2 0.01110.0116.10.026
X 1 X 3 0.027210.027215.070.0015
X 1 X 4 0.02110.02111.640.0039
X 2 X 3 0.028910.0289160.0012
X 3 X 4 0.00910.00950.041
X 2 2 0.040910.040922.620.0003
X 4 2 0.018410.018410.20.006
Residual0.0271150.0018
Loss of Fit0.0157130.00120.21170.9713Not Significant
Pure Error0.011420.0057
Total Deviation2.2526
Disclaimer/Publisher’s Note: The statements, opinions and data contained in all publications are solely those of the individual author(s) and contributor(s) and not of MDPI and/or the editor(s). MDPI and/or the editor(s) disclaim responsibility for any injury to people or property resulting from any ideas, methods, instructions or products referred to in the content.

