Article

Multi-Scale Thermo-Mechanical Model Simulation of Residual Stress in Atmospheric Plasma Spray Process

by
Jose Martínez-García
1,*,
Venancio Martínez-García
2 and
Andreas Killinger
2
1
Department of Thermal and Fluid Engineering, Faculty of Industrial Engineering, Universidad Politécnica de Cartagena, Campus Muralla del Mar, C/Doctor Fleming, s/n, 30202 Cartagena, Spain
2
Institute for Manufacturing Technologies of Ceramic Components and Composites (IMTCCC), University of Stuttgart, Allmandring 7b, D-70569 Stuttgart, Germany
*
Author to whom correspondence should be addressed.
Coatings 2024, 14(12), 1547; https://doi.org/10.3390/coatings14121547
Submission received: 18 November 2024 / Revised: 4 December 2024 / Accepted: 5 December 2024 / Published: 11 December 2024

Abstract

:
This work presents a multi-scale one-way-coupled thermo-mechanical method to determine the residual stress in an Atmospheric Plasma Spray (APS) process. The model uses three submodelling scale levels that range from the entire component (macroscopic) to a splat coating layer (microscopic) dimension. The three-level scale temperature and stress evolutions of an Al2O3 coating material on a flat aluminium substrate were analysed. The quenching stress for different substrate preheating temperatures up to 600 K at the end of the APS coating process was discussed and validated through an experimental in situ curvature method and Stoney’s quenching stress equation.

1. Introduction

Thermal spray coating technology is a widely used technique for producing advanced surfaces adapted to industrial requirements, such as wear resistance, corrosion resistance, abrasion resistance, thermal/electrical conductivity, or thermal/electrical insulation, among others, at low cost [1,2]. Different thermal spraying processes have been developed depending on the energy source used, such as plasma spraying, flame spraying, high-speed oxyfuel spraying, and arc spraying. Atmospheric Plasma Spray (APS) allows for the processing of a wide range of materials, such as metals and their alloys, metal oxides, ceramics, and others, due to the high temperatures reached in the deposition flow up to 15,000 K. It also allows for coating thicknesses in the range of micrometres to several millimetres [3].
Complex dynamic heat and mass-transfer processes occur between the high-energy process gases, the coating material particles, and the substrate, which determine the final properties of the coating [4]. Each thermal spray process is characterised by its temperature range, enthalpy, and velocity, resulting in coatings with unique properties such as adhesion, porosity, inclusions, hardness, and residual stress [5,6].
Residual stress is one of the most critical factors influencing coating properties and behaviour, as it can lead to cracks that reduce coating life when facing adhesion wear. Differences in the material properties of the coating and the substrate, such as the coefficient of thermal expansion and the elastic modulus, generate residual stress at various stages of the coating process [7,8,9]. Residual stresses are classified according to the phase of the process in which they are generated. In the first phase during the deposition process, quenching stress, σq, is generated by the sudden solidification of the deposited splats at the impact with the substrate surface. Quenching stress is always tensile and causes bending or distortion of the substrate layer at mesoscopic scales. The coating material, the substrate temperature, and the stress relaxation mechanisms determine the σq value [9]. During the cooling phase, so-called thermal stress, σt, is due to the unequal shrinkage of the substrate and the coating due to the mismatch in the Coefficient of Thermal Expansion (CTE) between the two materials [10,11]. The stress is usually compressive for ceramic coatings with a lower CTE than that of the substrate. The final residual stress is the sum of the quenching and thermal stress described above.
Several works have presented simulations to study the evolution of temperatures and residual stress during the thermal spray process [12,13,14,15,16]. They all focused on obtaining the residual stresses at the end of the ceramic coating process. None of them studied the deposition phenomena at the splat level in detail. The novelty of the multi-scale thermomechanical approach is that it provides a more complete understanding by incorporating advanced sub-modelling techniques that have not been explored in previous studies. Three scale levels are defined, from the complete component (macroscopic) to a splat coating layer (microscopic). This allows for the study of the interaction between the splat layers and how it affects the temperature and stress distribution within the coating and on the substrate’s surface.
The main objective of this work is to implement a multi-scale thermal–mechanical model that predicts the temperature and stress evolution at different coating and substrate depths during the APS deposition process on a flat substrate. Section 2 introduces the Finite Element Model (FEM) based on the submodelling technique of one-way coupled thermal–mechanical analysis. The temperature and residual stress evolution at the three modelling levels during the APS coating process are analysed in detail in Section 3. The simulated quenching stress at different substrate preheating temperatures up to 600 K is discussed. Section 4 proposes an experimental in situ curvature method to calculate the residual stress from the curvature produced in the substrate. The quenching stress is experimentally measured and determined by the Stoney equation, which validates the simulation results from the model.

2. Numerical Model

This section presents the FEM proposed to obtain the evolution of temperature and stress during the APS coating process. Section 2.1 describes one-way coupled thermo-mechanical analysis based on the submodelling method. This allows for temperature and stress analysis at different scale levels, from the entire component (macroscopic) to the splat coating layer (microscopic). In such modelling, it is necessary to define the operating parameters used in the APS process, such as torch speed and trajectory, as well as the plasma plume profile and the sequence of heat transfer mechanisms followed during the process. These are described in Section 2.2 and Section 2.3, respectively. Finally, Section 2.4 summarises the thermal and mechanical properties of the materials used in the model.

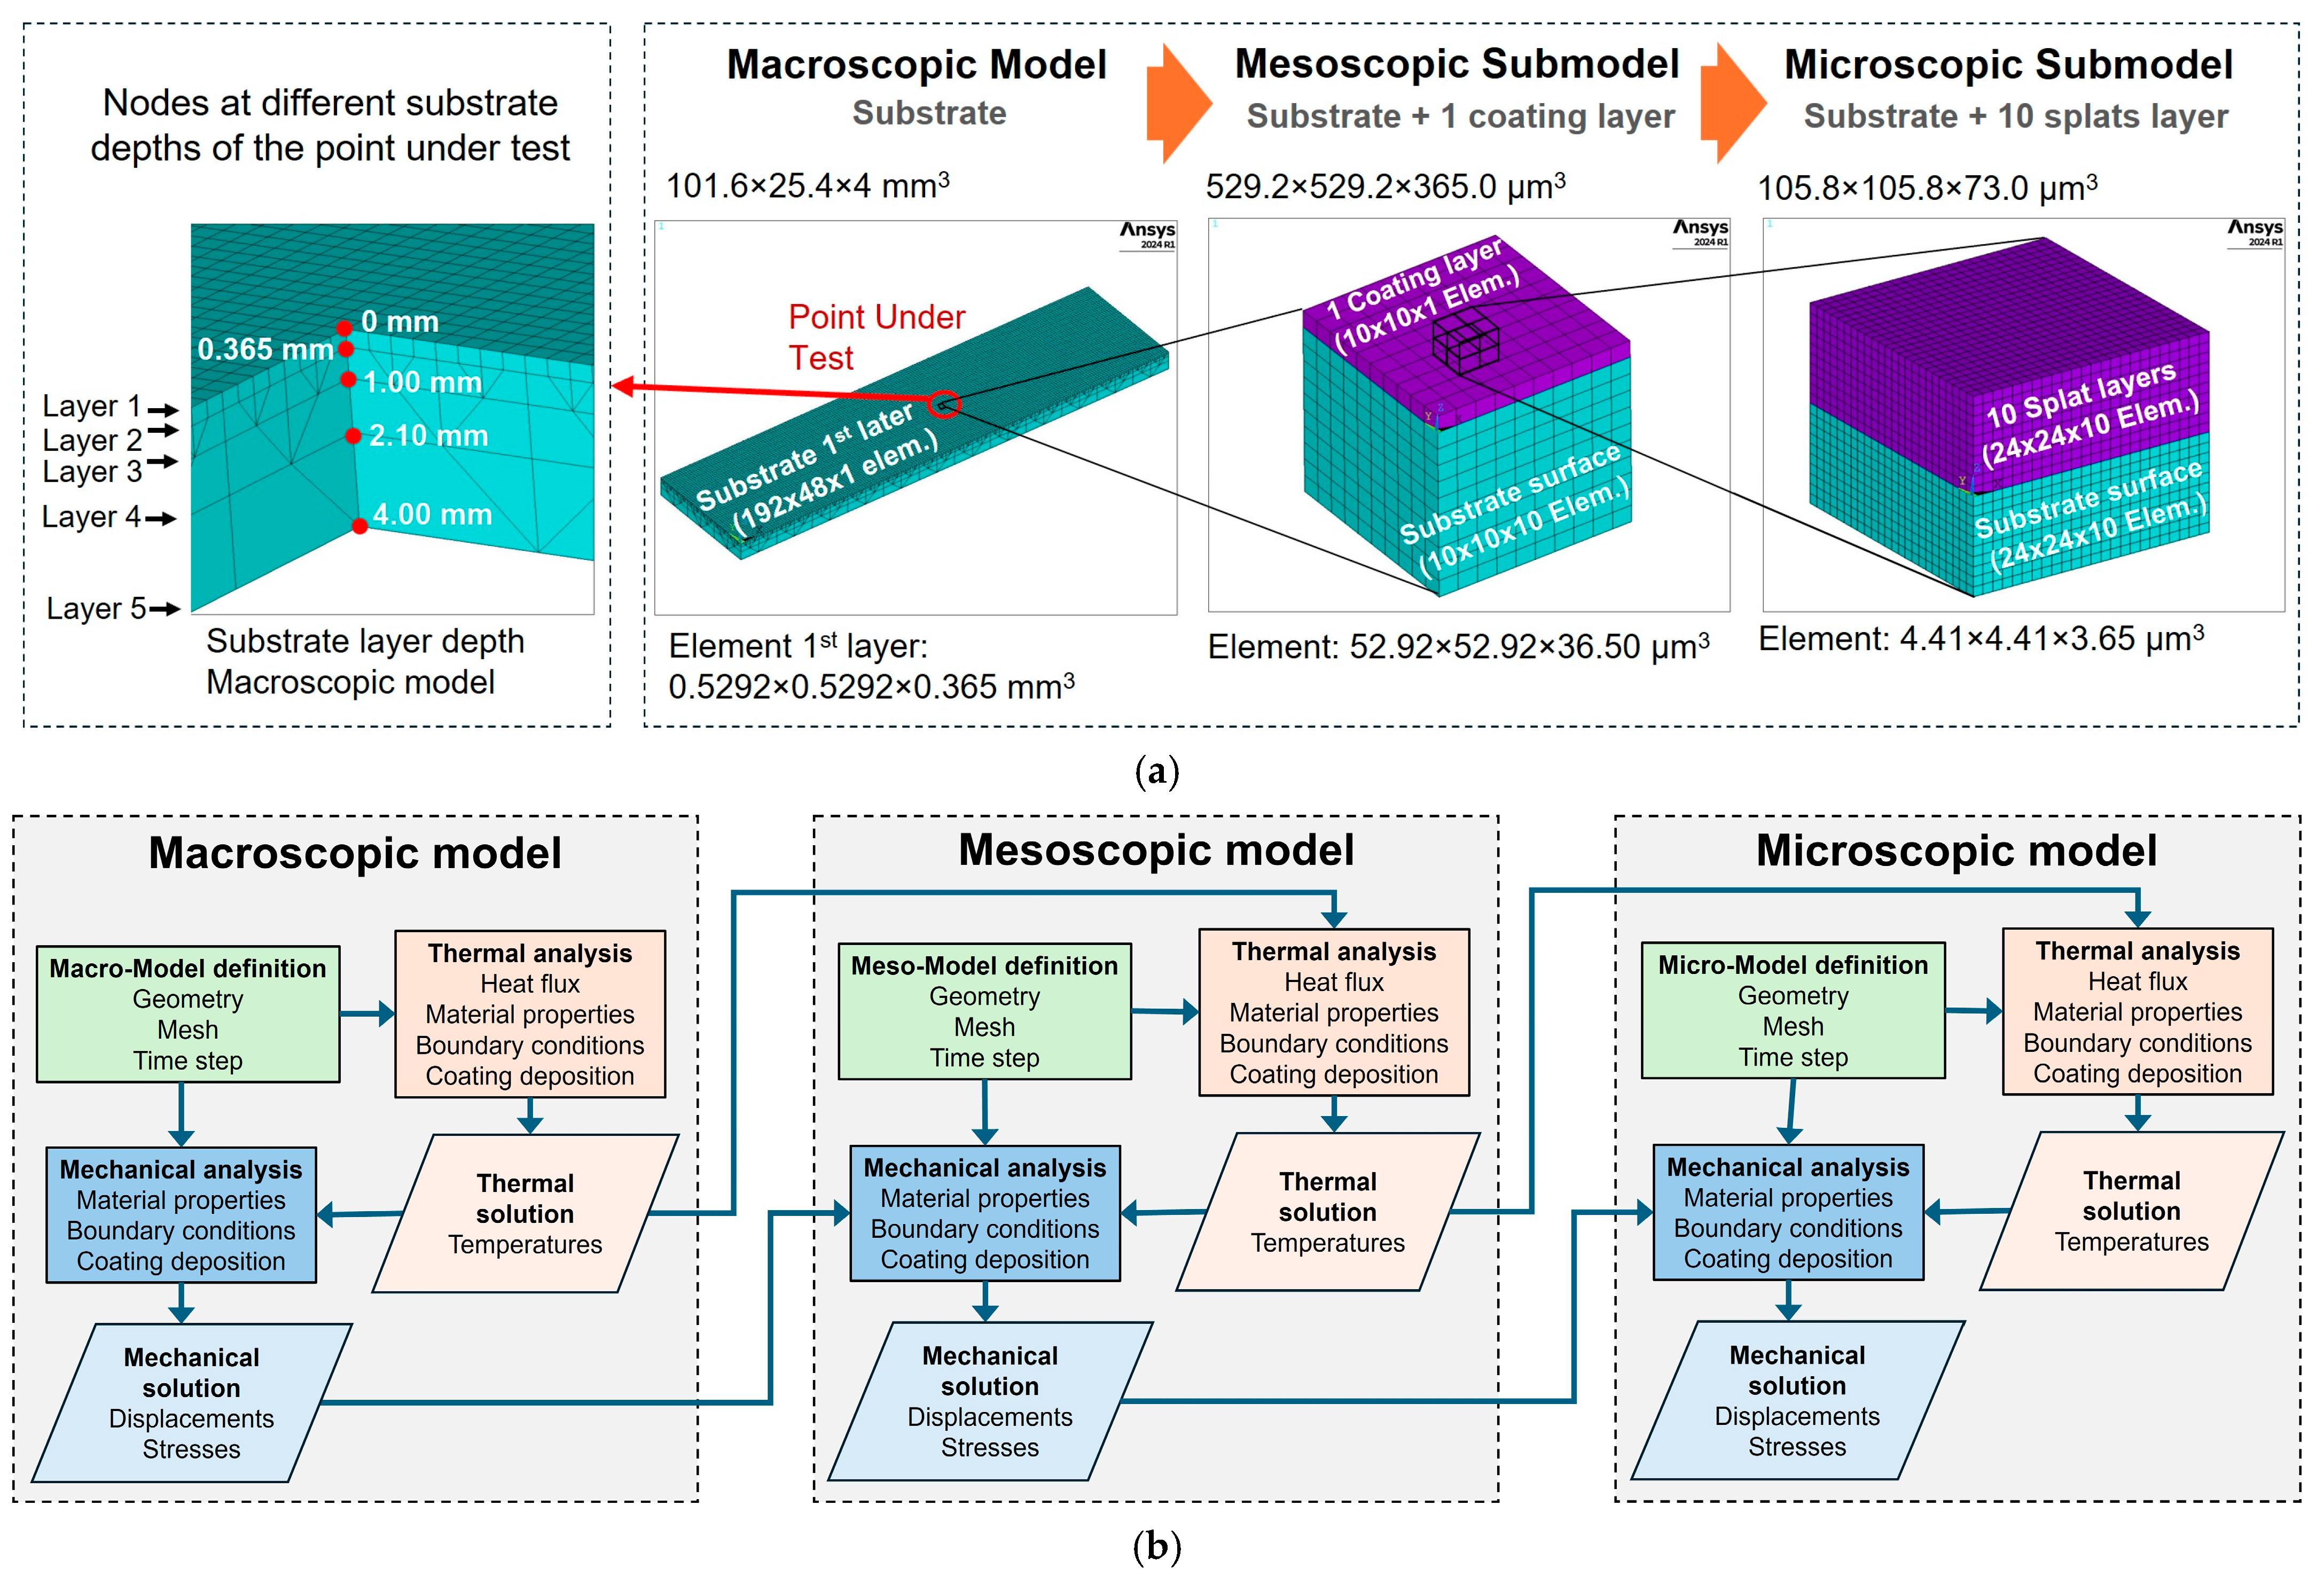
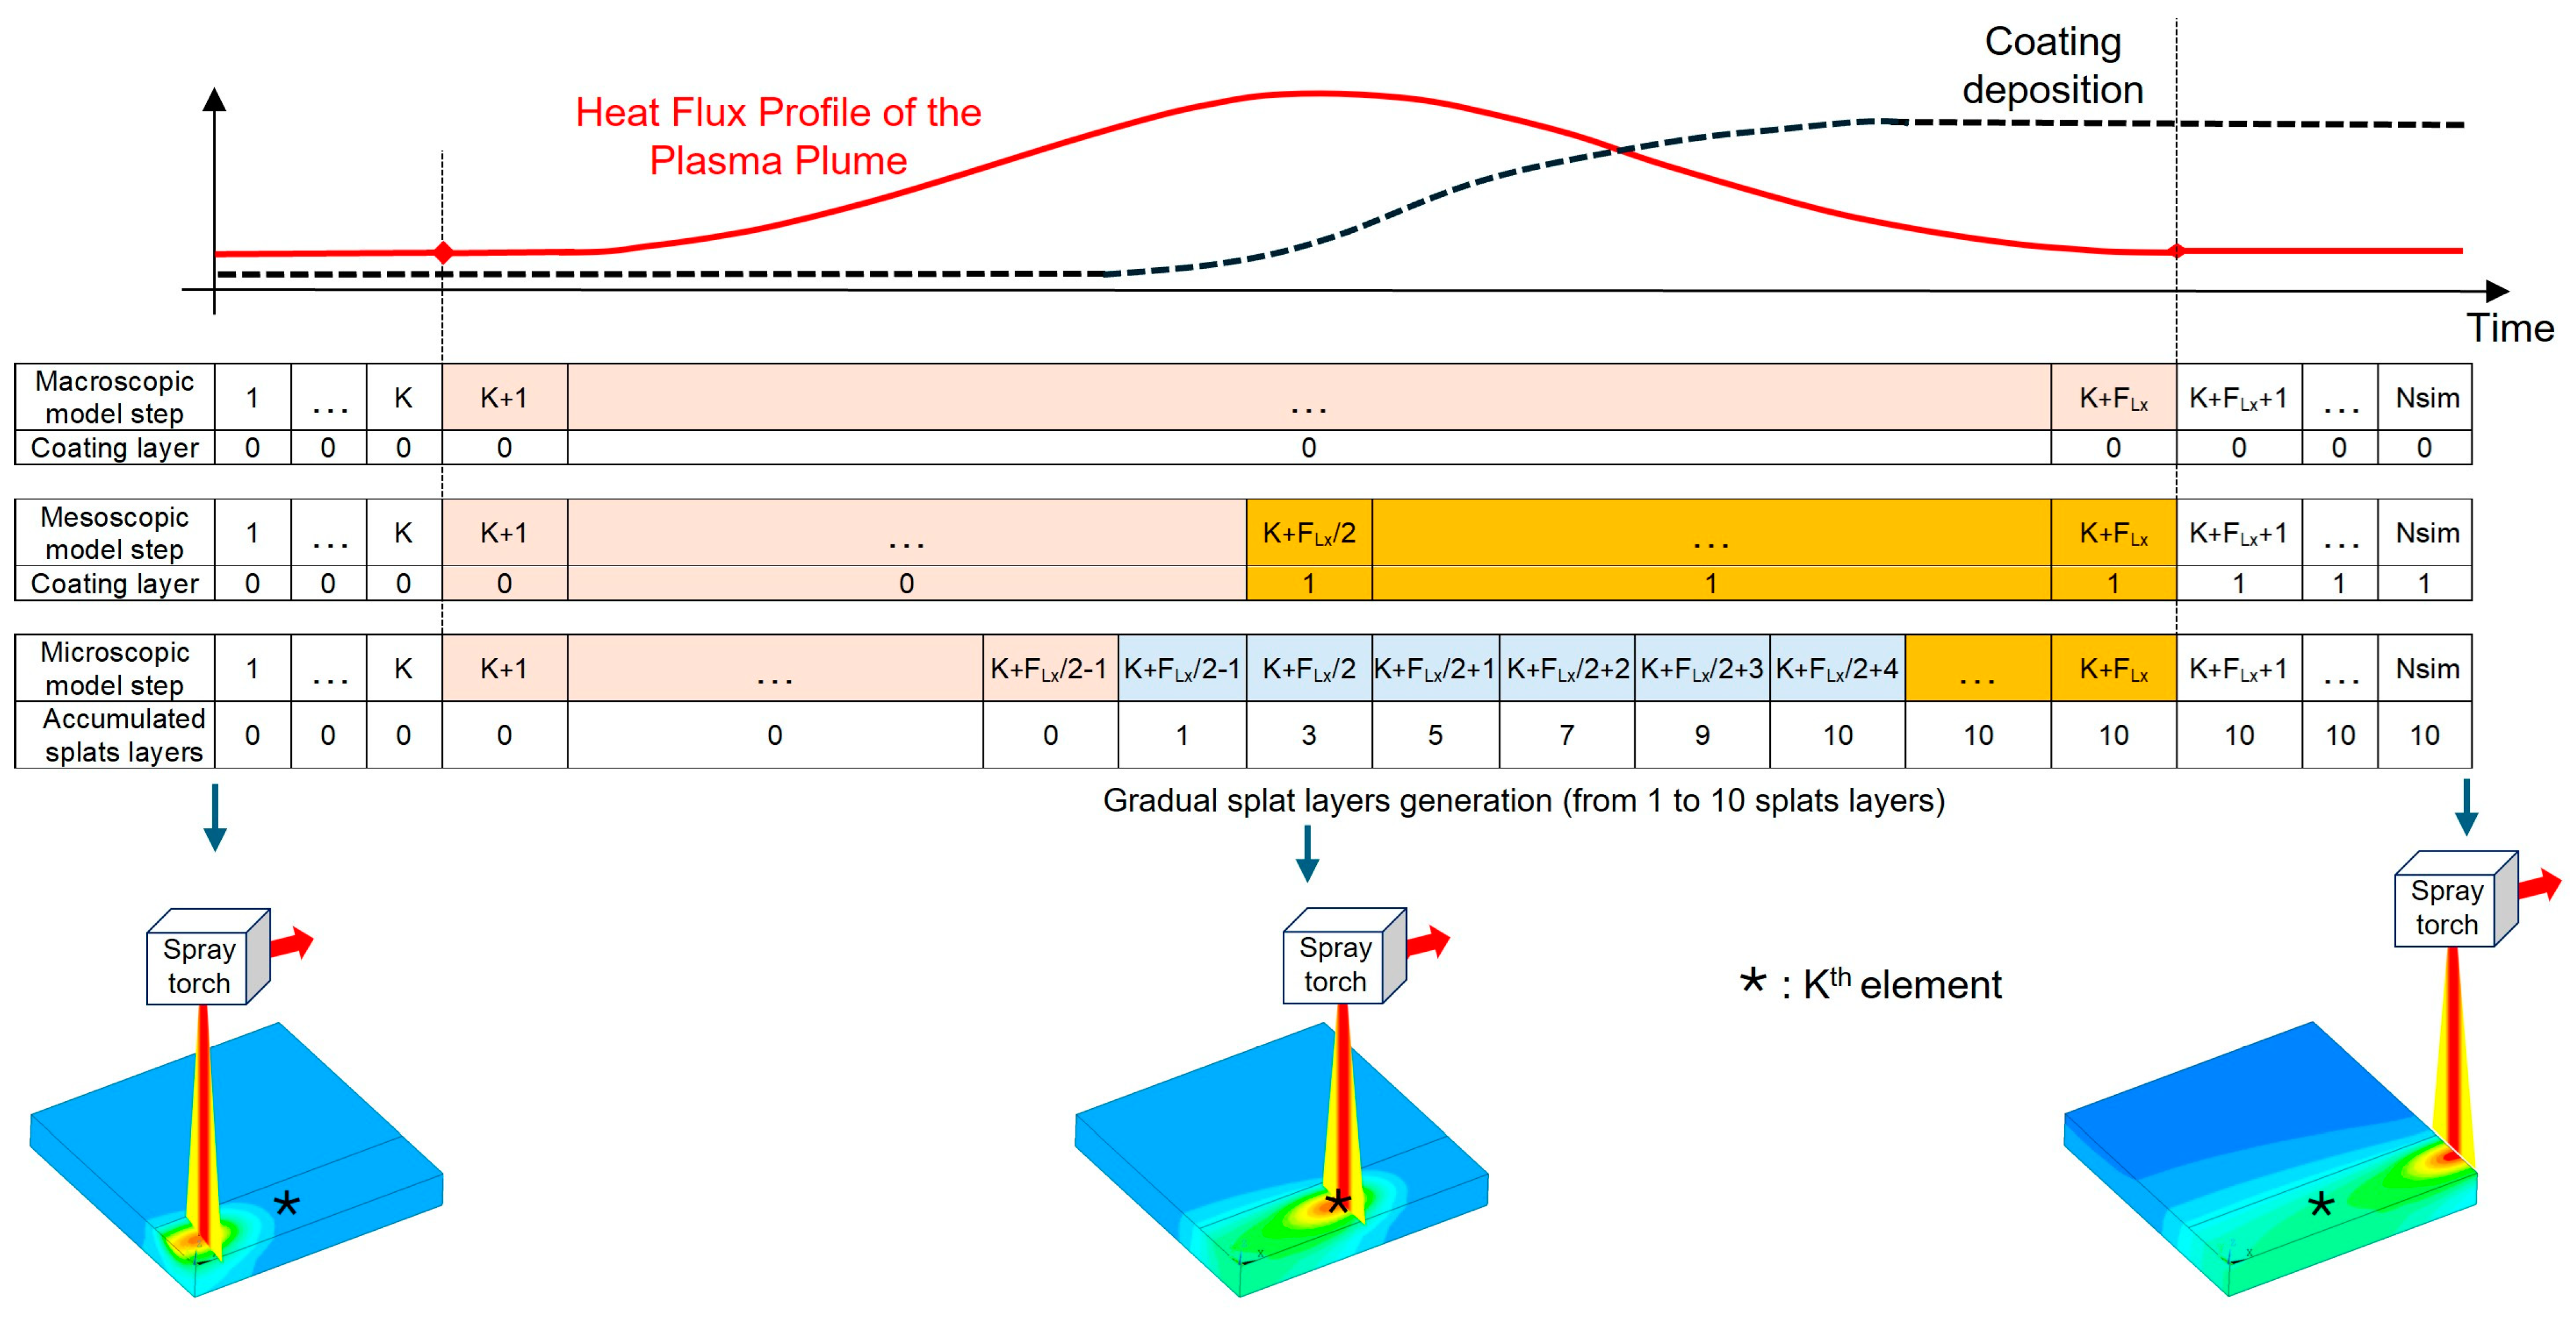
2.1. One-Way Coupled Thermo-Mechanical Analysis Based on Submodelling Method

A one-way coupled thermomechanical analysis has been proposed to study the residual stress generated in an APS coating process. First, a thermal analysis of the coating process is performed at each time step. Then, the temperature distribution obtained at each time step is used as a boundary condition in the mechanical analysis to obtain the residual stress at each time step [17,18,19]. Analysis was performed in ANSYS Mechanical APDL 2024 R1 software (ANSYS Inc., Canonsburg, PA, USA) [18].
The difference in the scale between the coating thickness in micrometres and the substrate thickness, usually in centimetres, requires adaptive meshing to increase the accuracy in the region close to the coating layer. Two techniques are usually used. The first technique is to create a full adaptive mesh of the sample, varying the size and density of the mesh [12,14]. This method has the disadvantage of a large number of elements with a high computational cost.
A second method is called submodelling [17,20,21,22]. A global sample mesh is analysed. From the results obtained in the global mesh, the region of interest is separated into a submodel, which is analysed independently with a more refined mesh. This technique is based on the Saint Venant Principle, which states that the stress, strain, and displacement fields caused by two different, but statically equivalent, force distributions on a body are approximately the same distance from the loading points. The distribution of stress and strains only changes near the load application regions. It is possible to select an area of the global model and analyse that area, defining the results of the global model in the study area as the boundary conditions for the submodel study.
On the other hand, additional material layers are deposited on the substrate in the coating process. The proposed model considers a sequential creation of additional layers. For this purpose, the element birth–death technique is used [9,12,14]. This technique activates or deactivates the mesh elements in a time step according to a specific criterion. Initially, all mesh elements are defined (substrate and coating), but the coating elements are deactivated and do not interfere with the thermo-mechanical analysis. In the time step where the plasma plume passes over the coating element, it is activated (birth) and participates in the thermo-mechanical analysis. This allows for the residual stress in the coating to be better estimated.
The model developed in this study is based on the submodelling technique, where three scale levels were defined from the full dimension of the sample (macroscopic model) to a splat coating layer (microscopic model) [17], as shown in Figure 1a. In the macroscopic model, the entire component is modelled with overall dimensions of 101.6 × 25.4 × 4 mm3. The first layer of the mesh was discretised into a total of 192 × 48 elements. Each element in the top layer was 0.5292 × 0.5292 × 0.365 mm3. One element of the top layer of the macroscopic level, Kth, was selected and discretised into 10 × 10 × 10 elements to create the mesoscopic model. Each element of this mesh had a size of 52.92 × 52.92 × 36.50 µm3. In addition, a layer of 10 × 10 × 1 elements was added to form the cover layer. To generate the microscopic model, a set of four elements of the coating layer and the four adjacent elements of the first layer of the substrate were selected. The total size of this set was 105.8 × 0.105.8 × 73.0 µm3. The set of eight elements was discretised into 24 × 24 × 20 elements. Each element had a size of 4.41 × 4.41 × 3.65 µm3. A layer thickness of 3.65 µm was considered for each coating layer [23]. All simulation parameters are summarised in Table 1.
Figure 1b summarises the simulation sequence using the proposed one-way coupled thermal–mechanical model. First, the geometry, mesh, and time step were defined for each modelling level. Second, thermal analysis was performed to obtain the temperature field. Third, mechanical analysis was performed to obtain the displacements and residual stress generated at each time step. The thermal results were the initial conditions for the mechanical analysis. The following submodels introduce the resulting temperatures and displacements as boundary conditions. The above simulation sequence is repeated in each submodel.
Three different types of mesh elements in ANSYS were used [18]. The eight-node hexahedral thermal solid element called SOLID70 was used for the thermal analysis. For the mechanical analysis, the SOLID185 element was used for the substrate and the SOLID65 element for the coating, in accordance with the material model utilised in this work.

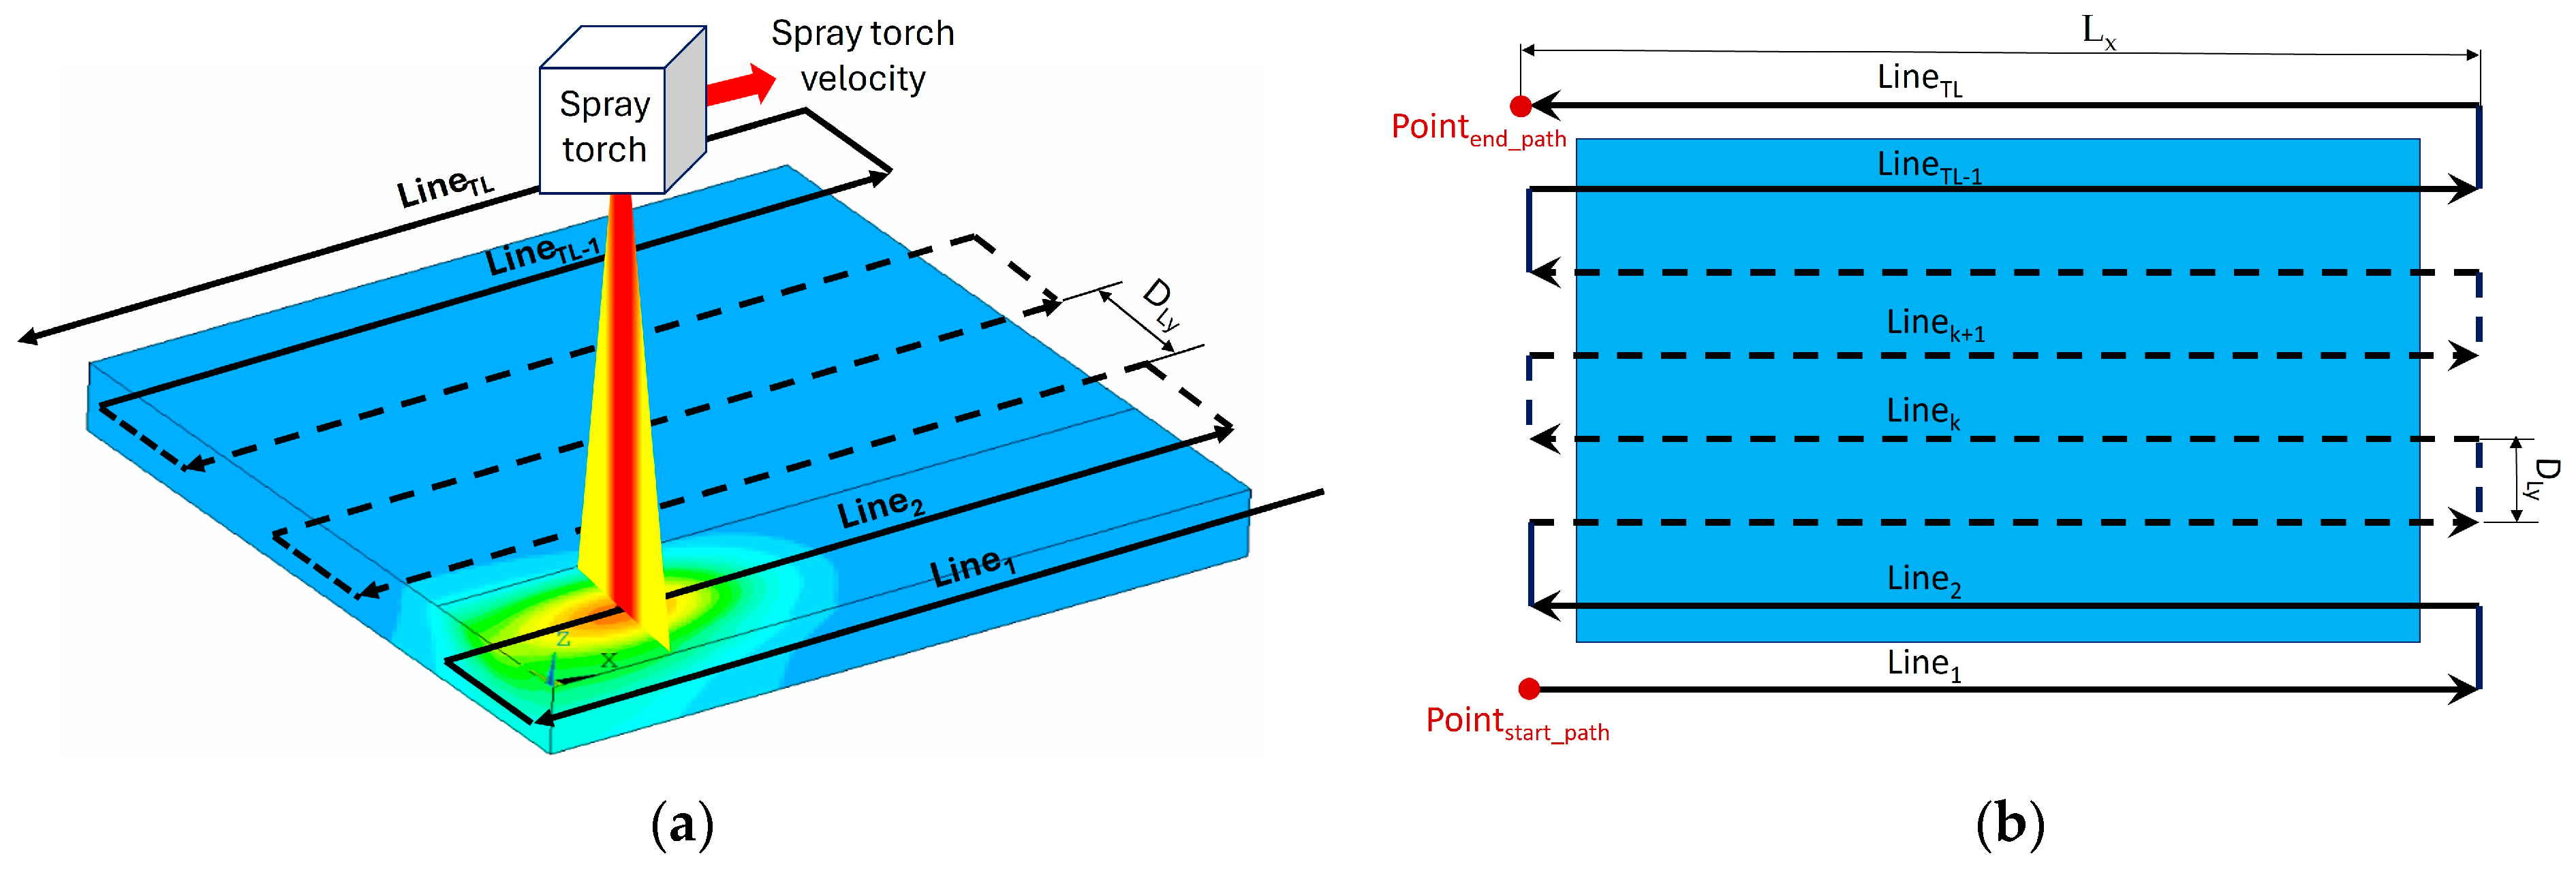
2.2. Plasma Spray Process Parameters

An APS process was simulated on an Al2O3 coating on a flat aluminium plate with dimensions of 101.6 × 25.4 × 4 mm3. An F6 APS torch (GTV, Luckenbach, Germany) and a six-axis robot (Type RX 130 B, Stäubli Tec-Systems GmbH, Bayreuth, Germany) were considered as references for the simulation and used for the experimental validation. The torch followed the path over the surface on the real process, as shown in Figure 2 [24]. The path was divided into a sequence of linear trajectories of length Lx, with a vertical distance between successive trajectories, DLy, to ensure uniform coating thickness. The operating parameters were defined as shown in Table 2.

2.3. Thermal Model

For the thermal analysis, the heat flux of the plasma plume on the substrate surface was modelled as a forced convection heat flux. Three parameters are required to define the heat fluxes: the flame footprint, the convective coefficient, and the flame temperature. The flame footprint was defined as an area of 36 × 16 elements, which was 19.05 × 8.46 mm2. A temperature profile and a convective coefficient within the flame footprint were defined based on a Gaussian heat flux distribution [9,10,19]. The Gaussian plasma plume temperature profile parameters used in this work are summarised in Table 3.
Before the plasma plume reaches the Kth substrate element, step K, the heat transfer is modelled as a convective and radiative heat flow from the substrate to the surroundings. When the plasma plume reaches the Kth substrate element, the heat flow is modelled as a forced convection flow [24]. At this step time, the coating element is activated at mesoscopic level. In the case of microscopic submodelling, the coating layer is divided into 10 successive splat layers that are activated during the plasma plume passage. The activation sequence of each of the ten layers is shown in Figure 3. Once the plasma plume leaves the deposited coating element, step K + FLx + 1, the heat transfer is modelled by the convective and radiative heat flow between the coating layer and the environment.
The ratio between the torch velocity, v t o r c h , and the element dimension in the forward direction of the flame, d x , defines the time step, t s t e p = d x / v t o r c h . At each time step of the simulation, a row of 16 elements perpendicular to the front line of the torch begins to receive the heat flux, while a row of 16 elements leaves the area covered by the plasma plume from the rear.
The heat transfer through the plasma plume, q t o r c h , is defined by Equation (1) [25]. The convective heat transfer through the surface to the surroundings, q c o n v , is given by Equation (2) [25]. The radiative heat transfer through the surface to the surroundings, q r a d , is given by Equation (3) [26]. The Fourier–Biot equation determines the heat balance between the heat flow on the surface and inside the material and is based on Equation (4) [26].
q t o r c h = h f l a m e · T f l a m e T s u r f
q c o n v = h c o n v · T s u r f T 0
q r a d = σ · ε · T s u r f 4 T 0 4
x k x · T x y k y · T y z k z · T z + q = ρ · C · T t
where hflame is the plasma plume convection coefficient, in W/(m2·K); hconv is the natural convection coefficient, in W/(m2·K); Tflame is the plasma plume temperature, in K; Tsurf is the surface temperature, in K; T0 is the ambient temperature, in K; σ represents the Stefan–Boltzmann constant, 5.67 × 10⁻⁸ J/(s·m2·K4); ε is the emissivity coefficient of the coating/substrate surface; kx, ky, and kz are the material’s conductivity, in W/(m2·K); ρ is the material density, in kg/m3; C is the specific heat capacity, in J/kg·K; and q is the heat transfer by convection and radiation through surfaces, in W/m3.

2.4. Thermal and Mechanical Material Properties

In the proposed model, the substrate material is aluminium AL99 AW 1050A H14, and the coating material is Al2O3 99.7%, melted and acid washed. ANSYS Mechanical APDL provides many material models for different material behaviours [18]. This work uses the ANSYS material model called Multilinear Isotropic Hardening Plasticity (MISO) for the ceramic coating. The MISO material model describes the multilinear isotropic hardening process of a material during the application of a force. The thermal and mechanical properties of the implemented materials are summarised in Table 4 and Table 5.

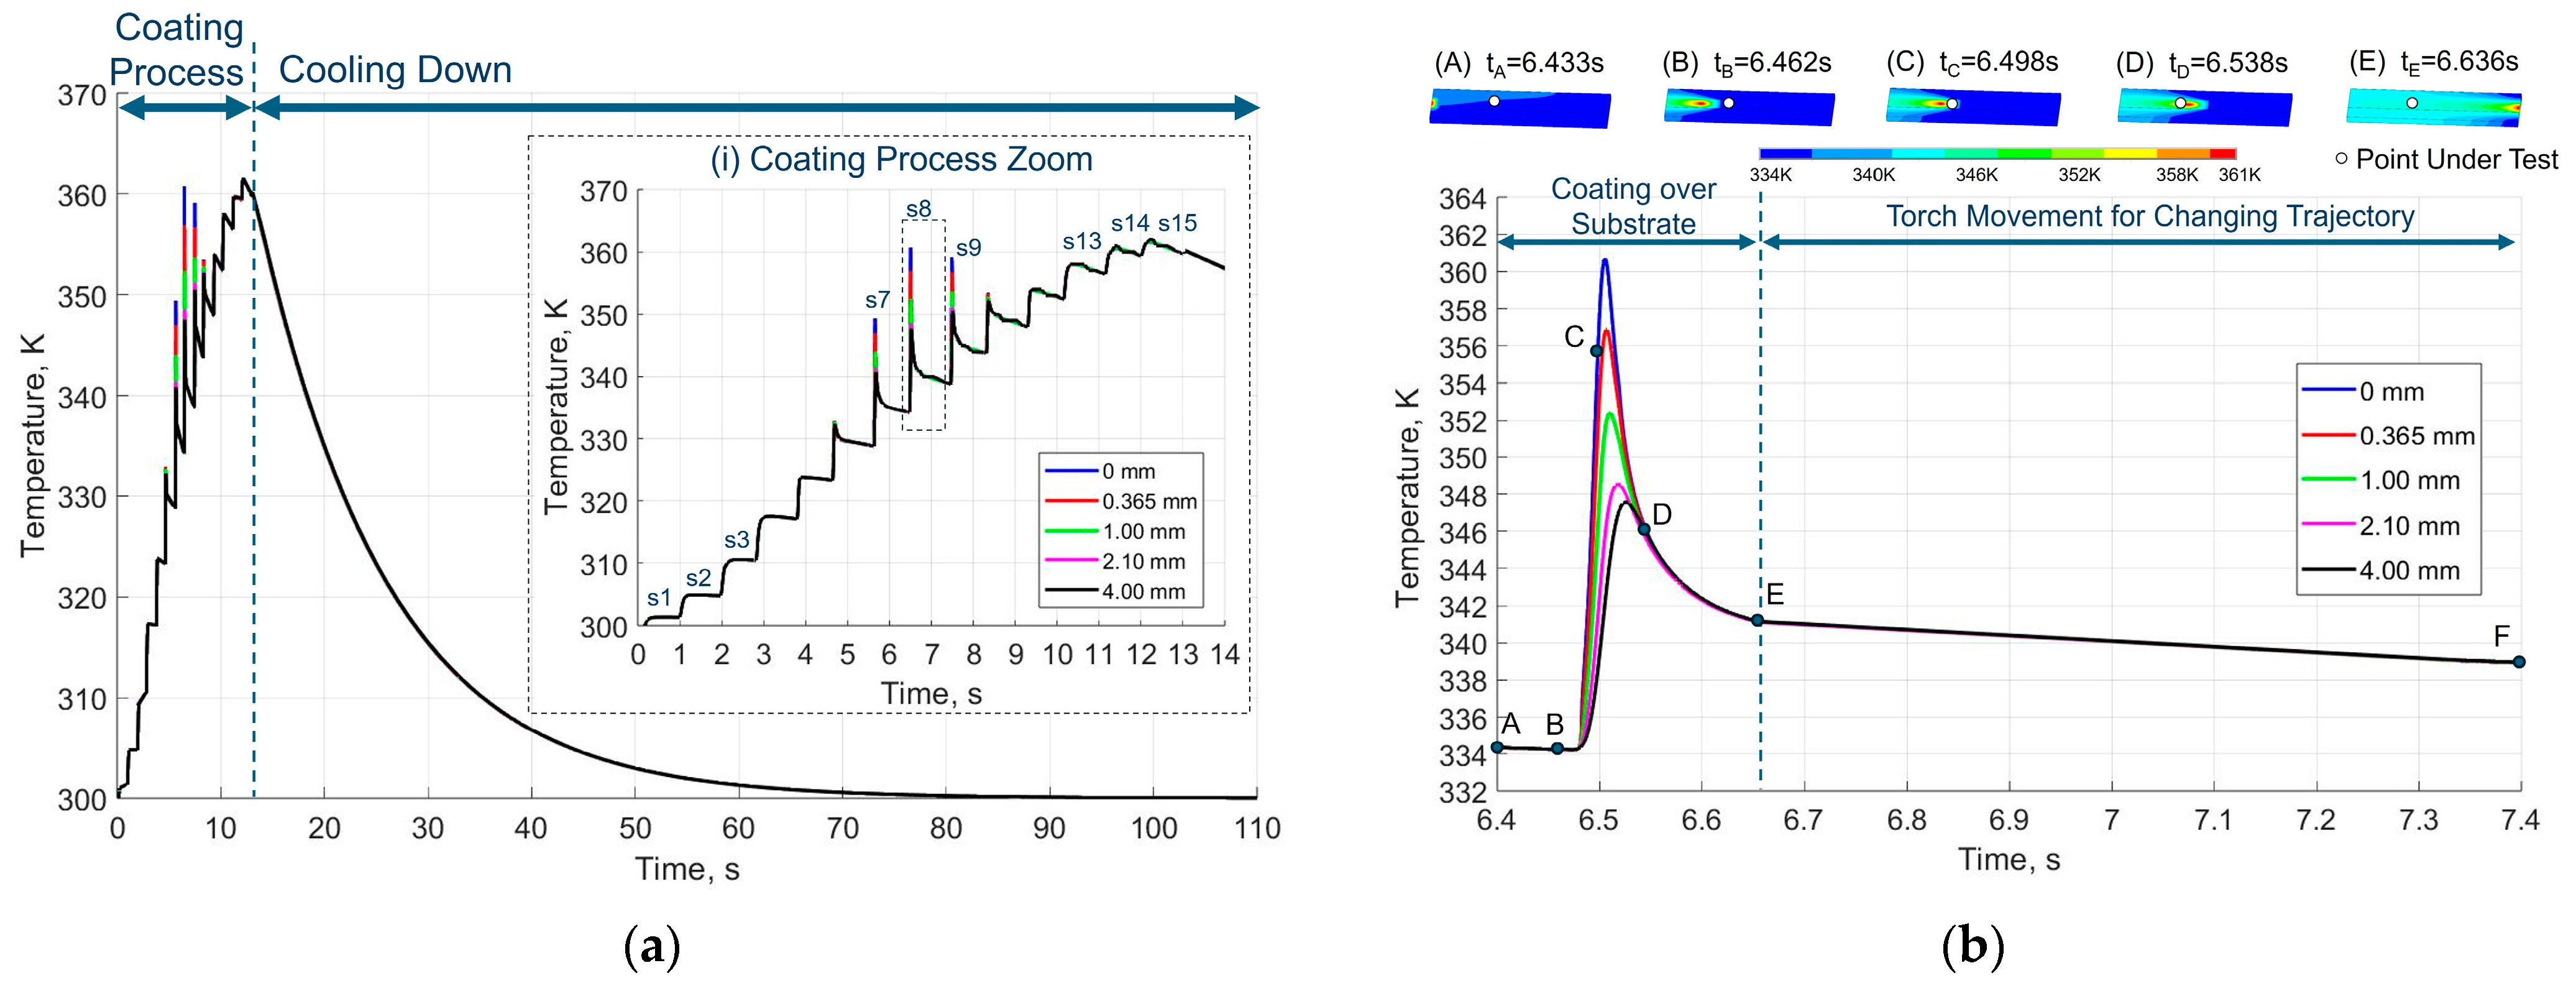
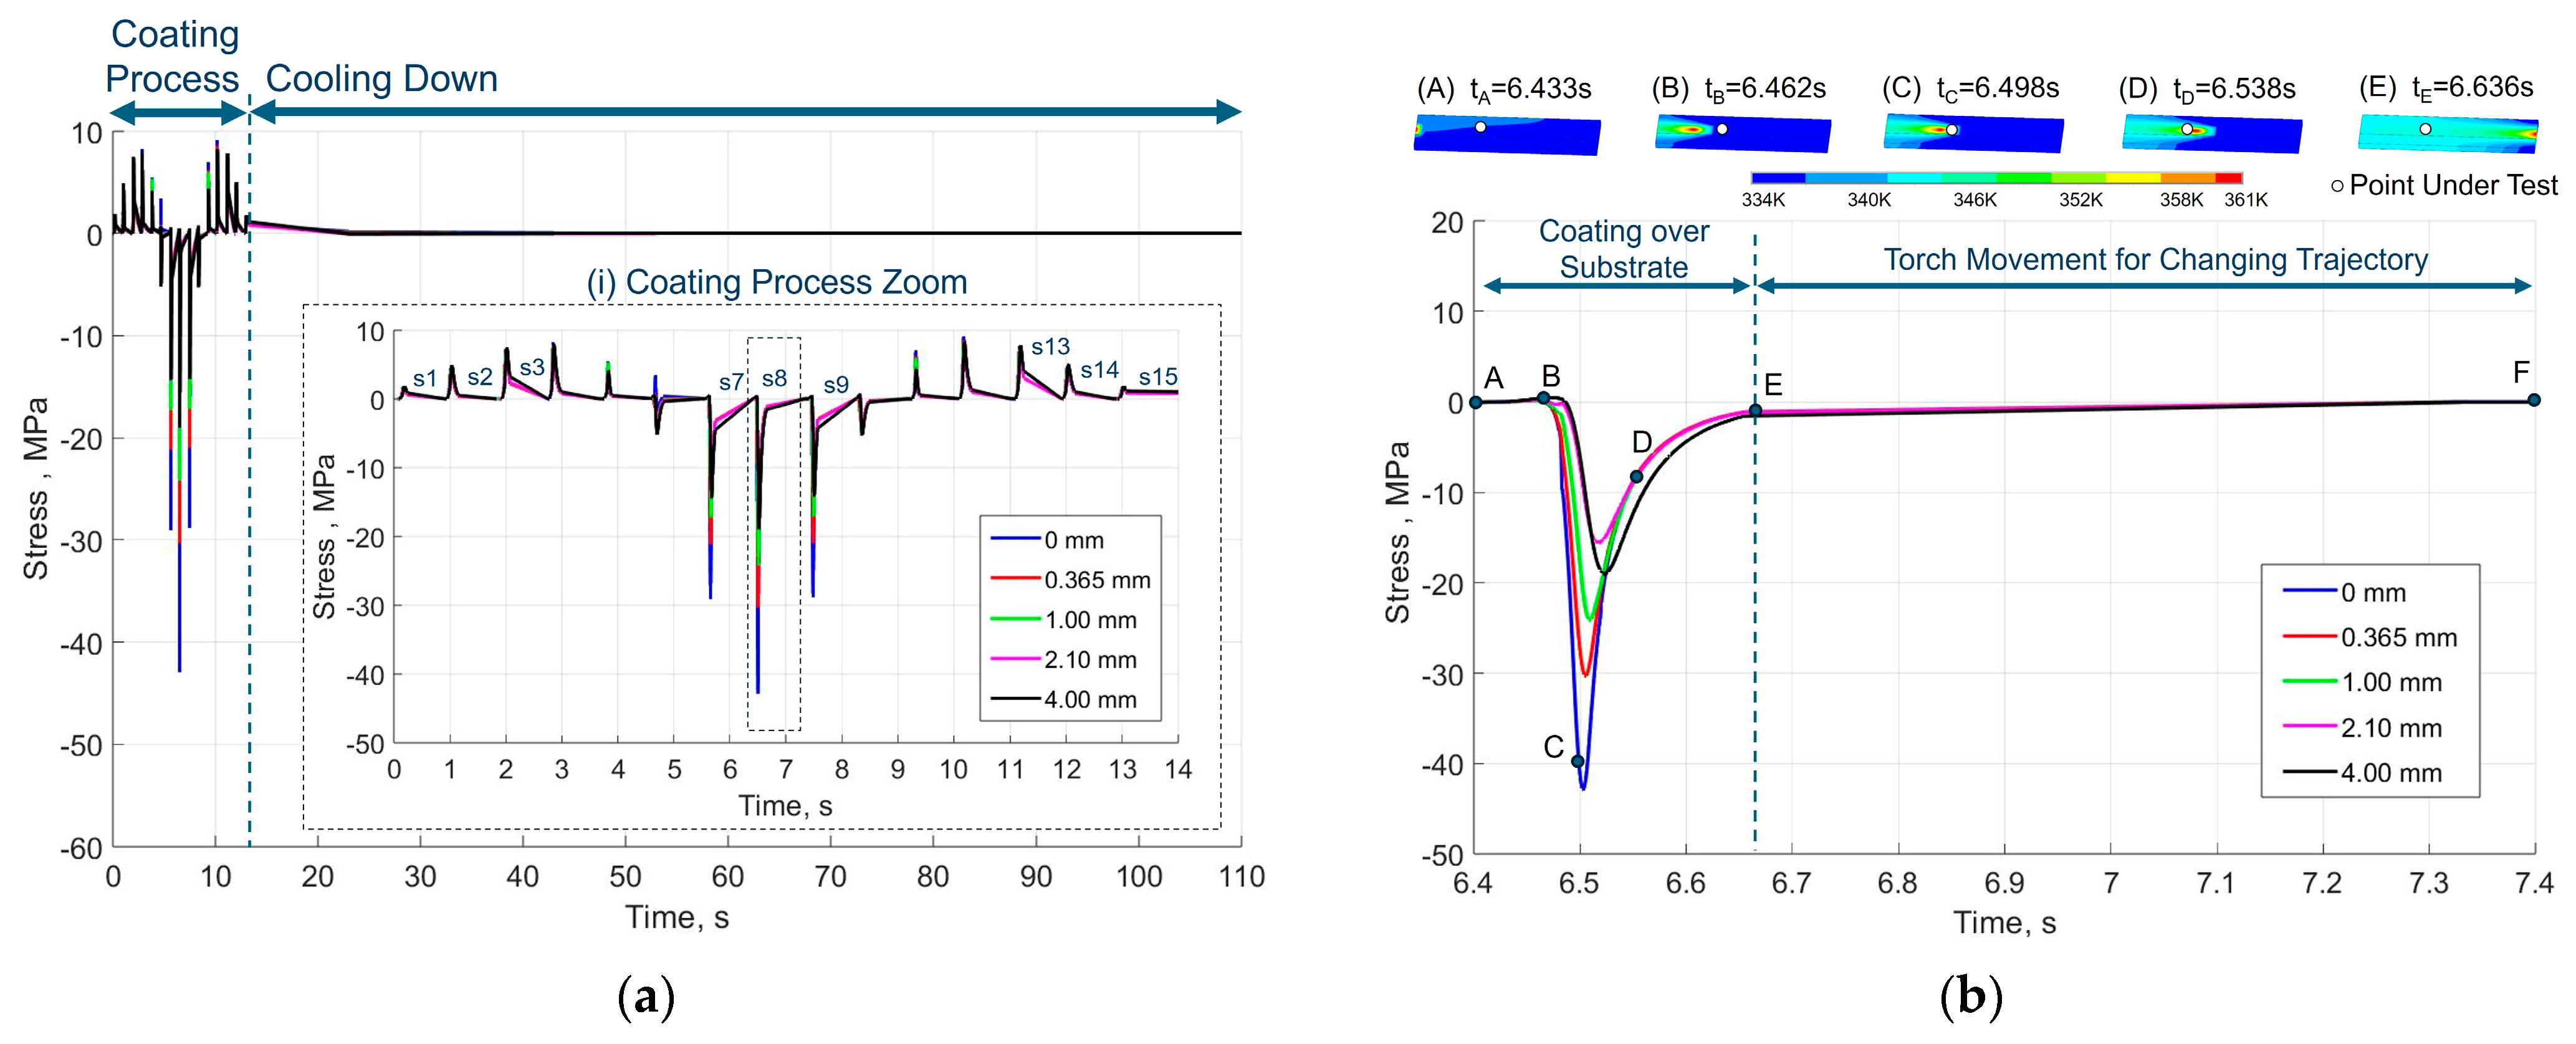
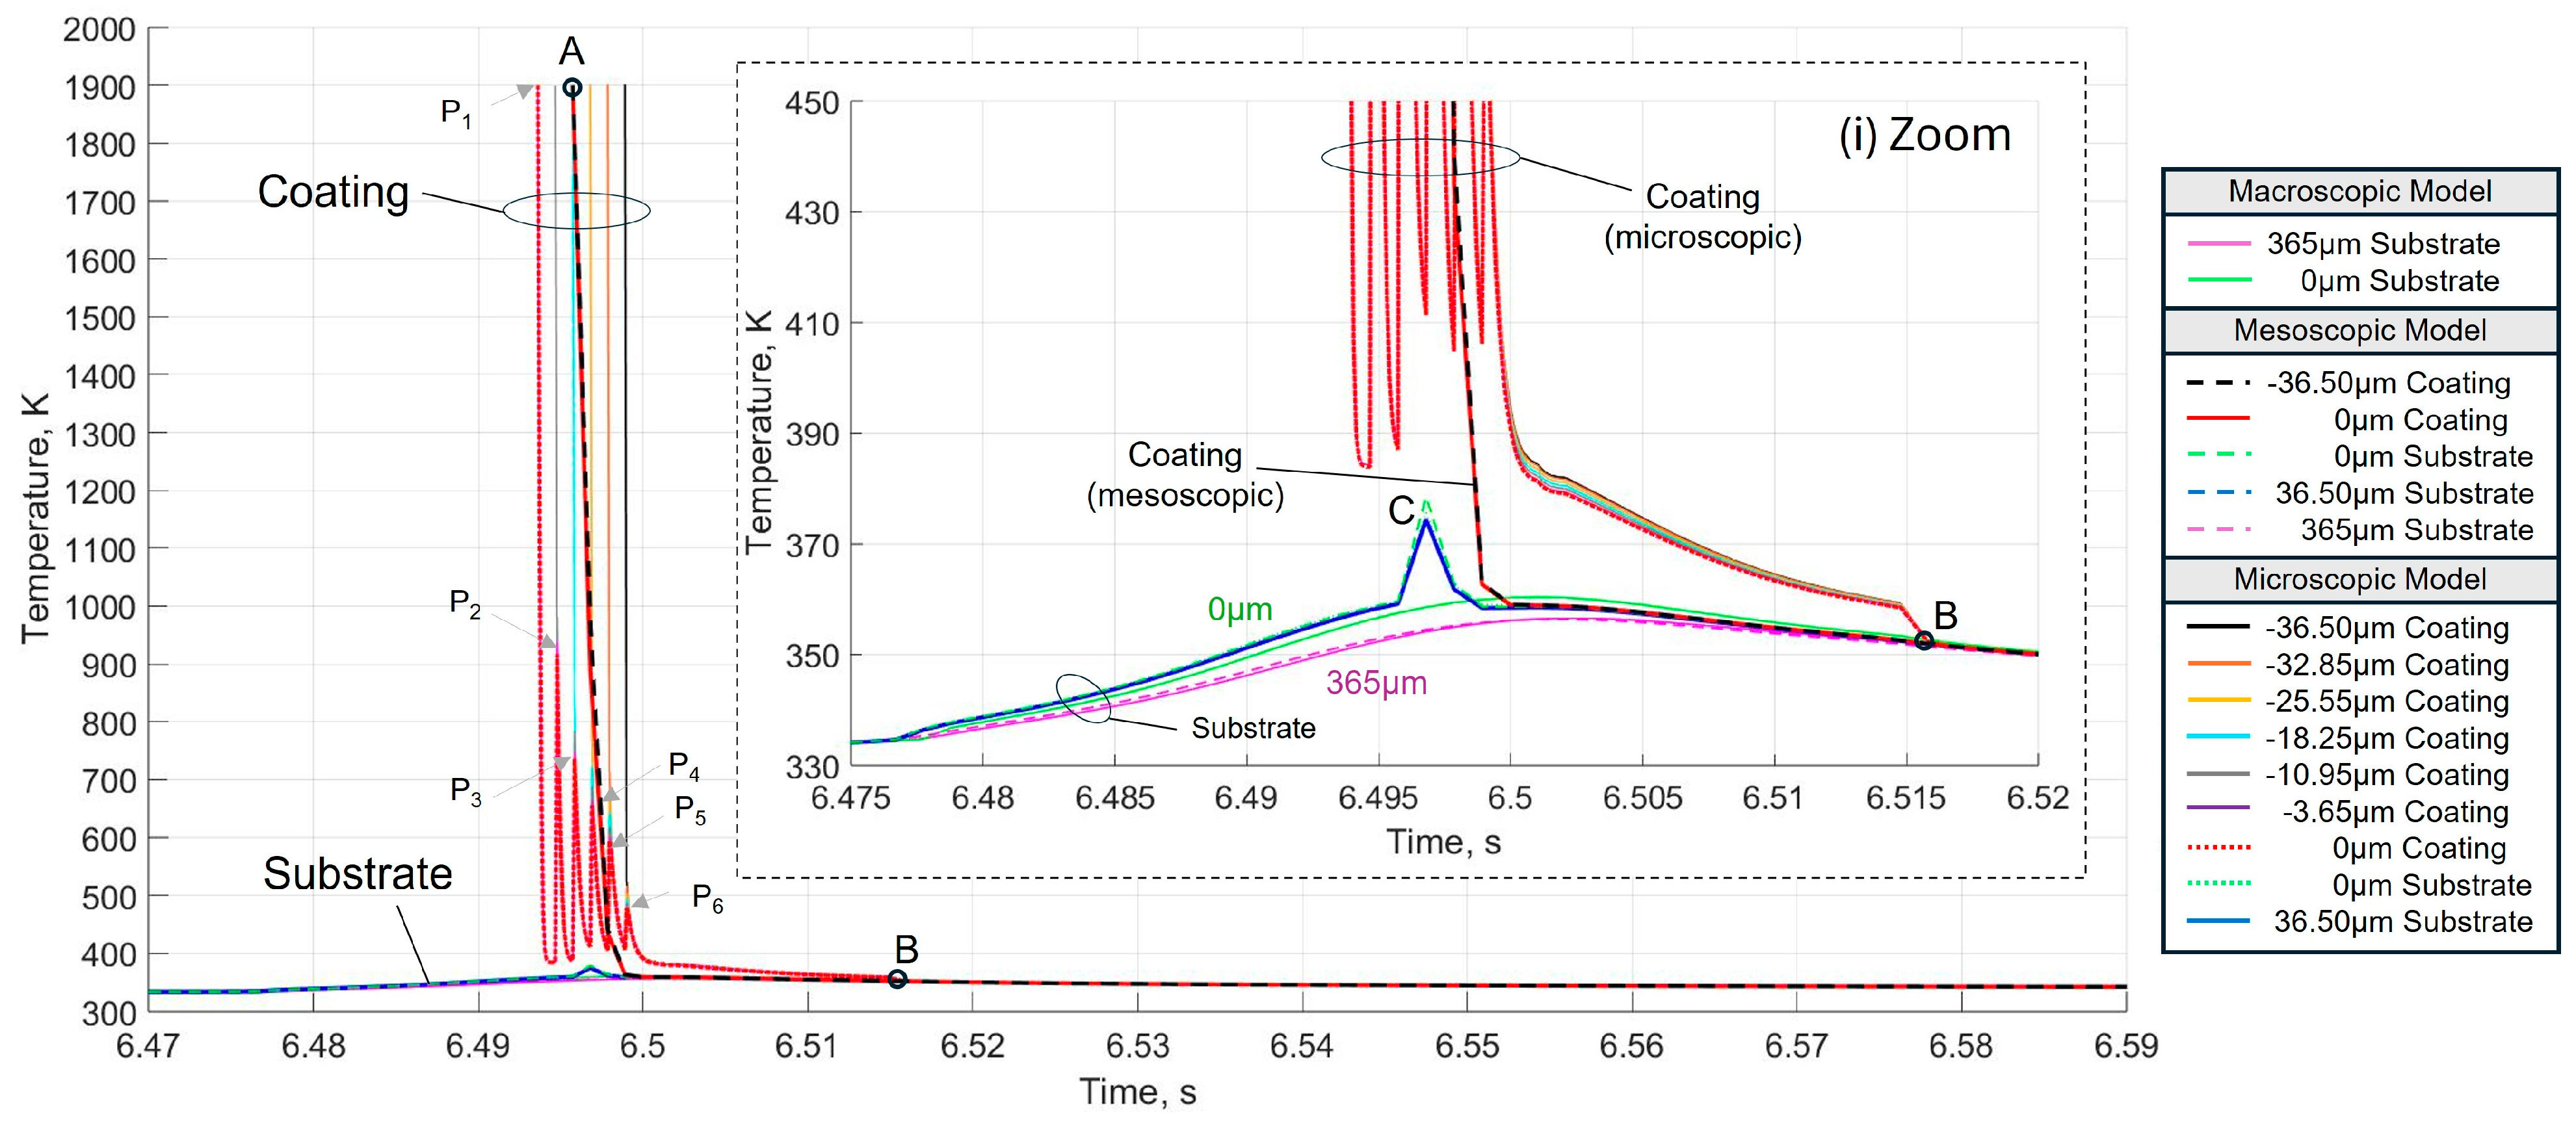
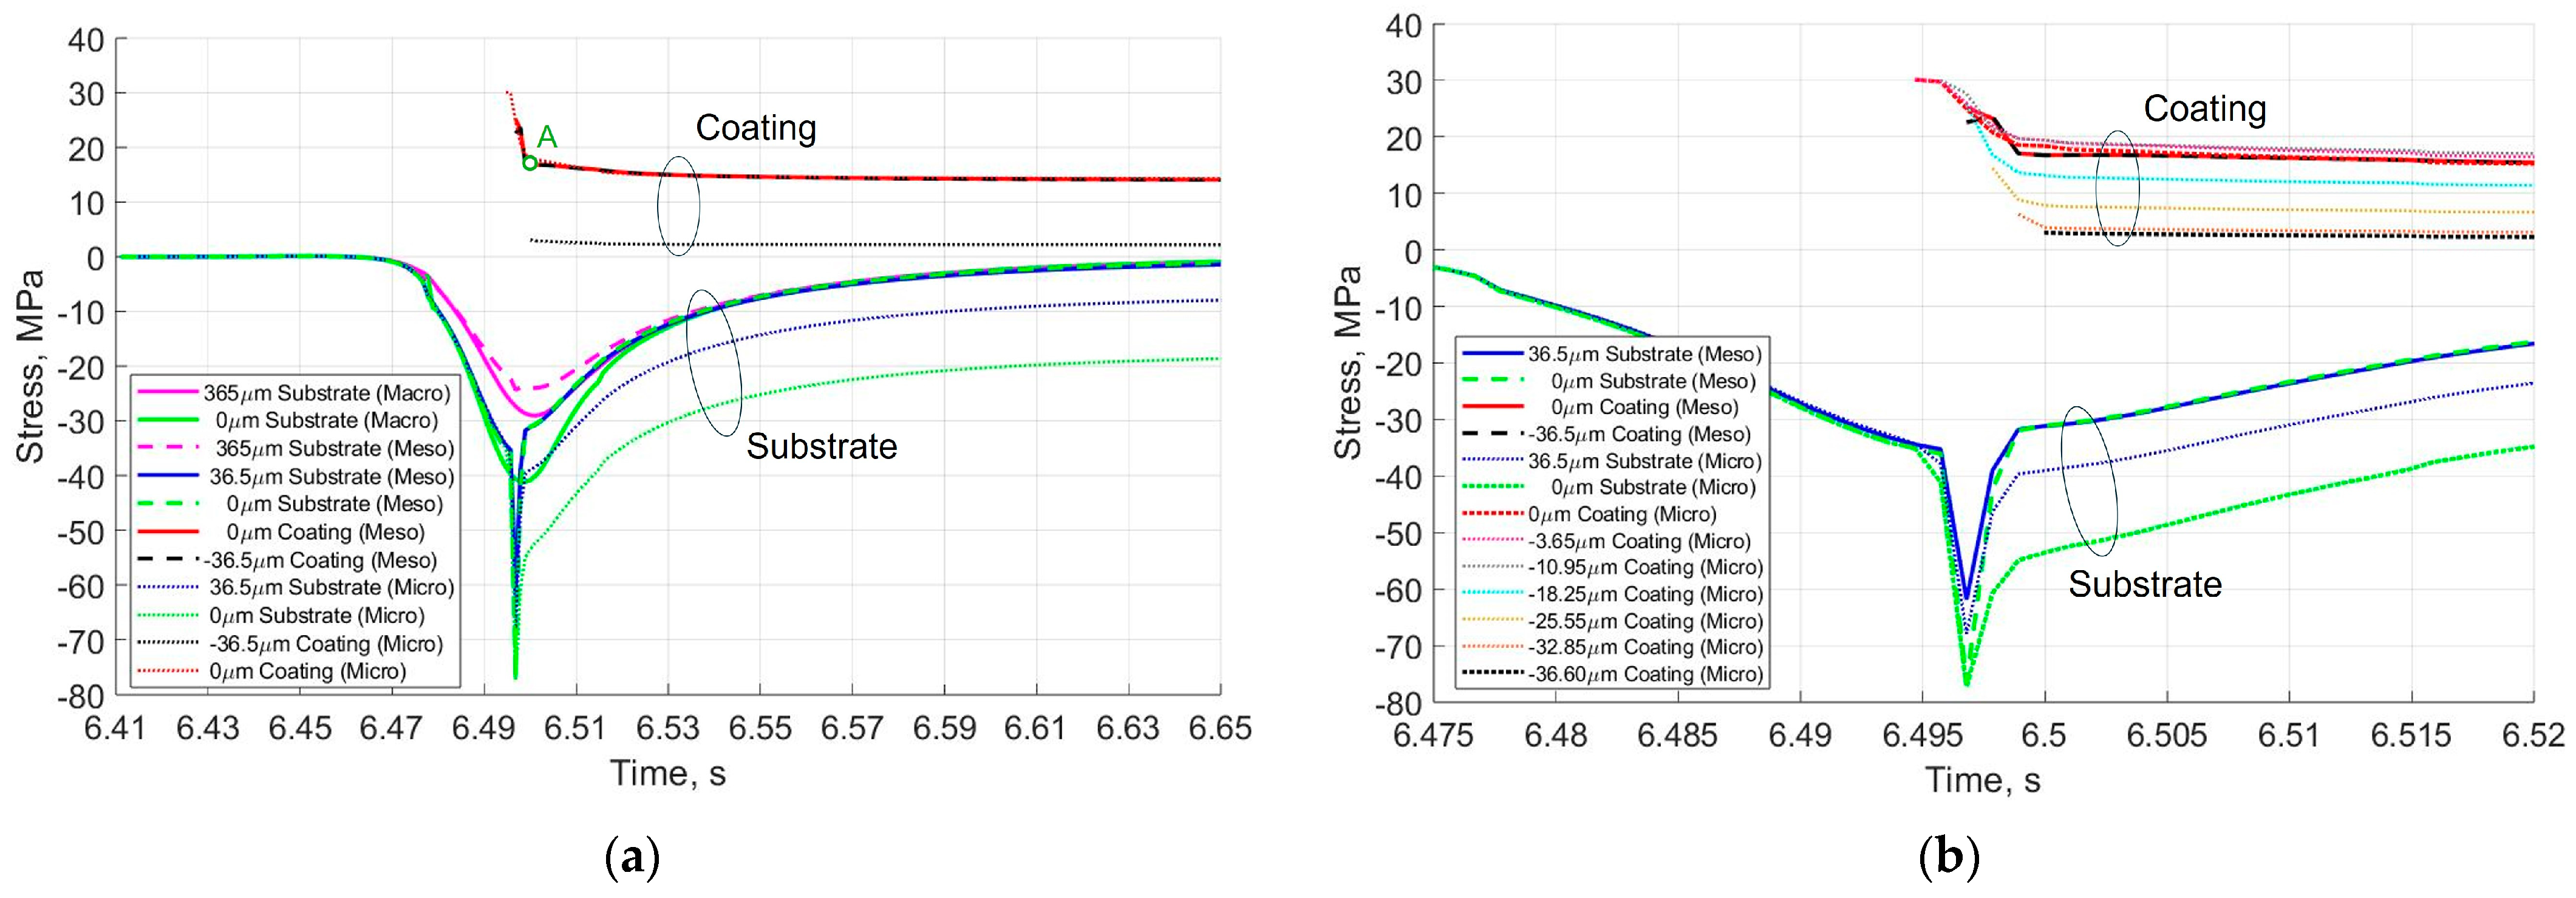
3. Simulation Results

This section presents the simulation results for the temperature and residual stress evolution at the three submodelling levels (macroscopic, mesoscopic, and microscopic) during the APS process of Al2O3 coating on an aluminium substrate plate preheated at 300 K.
In the macroscopic model, a path of 15 trajectories was simulated. An element in the centre of the top layer of the mesh was selected as a reference (point under test). Five vertical nodes through the thickness of the substrate were selected, as shown in Figure 1. These vertical nodes correspond to the substrate’s different depths at the point under test in the substrate. The simulated temperature evolution with the macroscopic submodel at different substrate depths at the point under test during the coating deposition is shown in Figure 4a. An increase in the temperature of the homogeneous substrate was due to the accumulation of heat during the 15 trajectories of the coating phase. A temperature peak pattern was observed when the plasma plume passed near the point under test in the central trajectories (sixth to tenth). The maximum temperature peak occurred when the plasma plume passed over the analysed element in the eighth trajectory, as shown in Figure 4b. Figure 4b describes the temperature evolution at different substrate depths of the point under test in the eighth trajectory in detail. In particular, the plasma plume comes into contact with the plate at point A at the beginning of the eighth trajectory, but does not affect the selected element until it arrives at point B. Heat transfer with the environment takes place during this time slot tB−tA. The temperature rises rapidly because of the heat input from the plasma plume at instant tB. The centre of the plasma plume reaches the point under test at instant tC. The maximum temperature peak showed a delay due to the thermal inertia of the plate. The temperature decreases from the maximum temperature peak until the plasma plume leaves the selected element at instant tD. From that moment, the selected element is cooled by heat transfer with the environment. The plasma plume leaves the surface of the plate at instant tE, and the plasma plume movement changes to the ninth trajectory, which takes place until instant tF, when the plasma plume starts at point A of the ninth trajectory.
The plasma plume on the selected element at 0 mm substrate depth produced a maximum increase in the substrate surface temperature of 27 K and an increase in the global plate temperature of 7 K at the end of the trajectory. It is observed that the largest thermal gradient occurred on the substrate’s surface (0 mm depth) during the passage of the plasma plume and had a much smaller effect with the simulated depth of the point under test in the substrate, where temperature increased by only 14 K and 13 K at half the substrate thickness (2.10 mm depth) and total substrate thickness (4 mm depth) respectively. This justifies the use of mesh refinement by concentrating this study on the first layers with a greater temperature gradient.
Figure 5a shows the stress evolution at different substrate depths of the point under test during the deposition and cooling phases of the entire APS coating process. There was a correlation between the temperature peaks of the plasma plume pass and the maximum peaks of the stress. The stress was due to the effect of the contraction of the substrate due to the heat provided by the plasma plume over an area of the plate. This generated compressive stresses in that area and tensile stresses on the rest of the plate. In the time interval from 0 s to 4 s, the plasma plume came into contact with the plate, producing tensile stresses at the point under test placed in the centre of the plate. The plasma plume passed over the centre area of the plate in the time interval from 4 s to 9 s and produced compressive stresses at the point under test. Finally, the plasma plume moved away from the upper edge of the plate in the time interval from 9 s to 14 s, generating tensile stresses at the point under test.
Figure 5b shows the details of stress evolution at the different depths of the point under test during the eighth trajectory. As for the simulated temperature, stress showed a low variation during the approach plasma plume movement at time slot tB−tA. The compressive stress rose rapidly due to the effect of the high plasma plume temperature from time tB up to a −43 MPa maximum stress value at the substrate’s surface (0 mm depth), corresponding to the maximum temperature in Figure 4b at the substrate’s surface. After that, the compressive stress decreases slowly when the torch trajectory moves away from the centre of the substrate plate.
The mesoscopic model mesh was generated from the element Kth selected in the macroscopic model, as shown as the point under test in Figure 1. The following discussion focuses on the eighth trajectory, where the plasma plume passes over the point under test and the deposition of the coating material occurs. In the mesoscopic model, the coating material is defined as an additional layer on the substrate that is activated when the plasma plume passes over the substrate surface. Figure 6a shows details of the mesoscopic model mesh and the depths of the nodes considered. The microscopic model was generated from the four elements in the centre of the substrate mesh’s top layer and the coating layer’s four adjacent elements, as shown in Figure 1a. Figure 6b shows details of the microscopic mesh and the depths of the nodes considered.
The thermal analysis results obtained in the macroscopic, mesoscopic, and microscopic models in the central time period of the eighth trajectory is shown in Figure 7. The substrate was heated progressively as the plasma plume approached. When the centre of the plasma plume arrived over element Kth, the coating layer (0 µm coating—mesoscopic and −35.6 µm coating—mesoscopic) was activated in the mesoscopic model at 1900 K, point A, and it cooled rapidly in contact with the substrate (0 µm substrate—mesoscopic). Concurrently, the substrate temperature rose to 375 K, point C. This temperature peak was not observed in the macroscopic model (0 µm coating—macroscopic) because the deposition process was not modelled at this level. The temperature gradient between the coating and substrate layers was due to the imperfect contact between the two surfaces, and thermal conduction occurred over a small fraction of the nominal contact area. This effect was defined in the model by the thermal contact conductivity [34]. Once deposited, the coating layer cooled down to point B, where the plasma plume left the substrate element and the temperatures of the coating and the substrate layer equalised.
In the microscopic model a more detailed effect was observed at this time. At this level, 10 splat layers were deposited progressively in six intervals, as explained in Section 2.1. Each splat layer caused an increase in temperature in the preceding coated splat layers. Six consecutive temperature peaks were observed for the first deposited layer (0 µm coating—microscopic). The P1 point corresponded to the deposition of the first layer at 1900 K, which cooled rapidly in contact with the substrate. As the second and third layers were deposited, the temperature of the first layer rose to P2, and the three layers cooled together. As the fourth and fifth layers were deposited, the temperature of the previous layers increased up to point P3, and all the coating layers cooled down together. This phenomenon was repeated at points P4, P5, and P6. These temperature peaks decreased as the volume of coating material increased. It is concluded that the thermal analysis results of the three models agree. At the substrate surface, the global temperatures were at the same level. The effect of coating deposition in the mesoscopic and microscopic models produced the same temperature peak at the substrate surface, point C. The coating temperature in the mesoscopic and microscopic models showed the same trend. The temperature curve of the coating in the mesoscopic model was centred with respect to the temperature curves of the different coating layers in the microscopic model.
Figure 8 compares the stresses obtained in the three submodels. The stress in the different layers showed similar trends at the three submodelling levels. Compressive stress was generated in the substrate layers during the coating phase, and tensile stress was generated in the coating layers, as expected [9]. The stress generated by the heat flux of the plasma plume was only considered in the macroscopic model, with a maximum compressive stress of −40 MPa. On the other hand, in the mesoscopic and microscopic models, a compressive stress peak of −80 MPa was observed in the substrate when the coating layers were activated. This compressive stress increment was due to the additional heat from the rapid solidification of the coating, not considered at the macroscopic level.
Figure 8b compares the stress of the coating layers in the mesoscopic and microscopic models. The single layer in the mesoscopic model produced a quenching stress of 17.07 MPa at point A. However, when the initial coating layer in the microscopic model was subdivided into 10 splats, stress progressively decreased as the number of layers increased. This effect was because each successive layer was deposited at a higher temperature than the previous one, so the stress was lower during the coating solidification. On the other hand, it was observed that the generation of splat layers in the microscopic model generated 70% higher residual stress in the surface layer of the substrate than in the mesoscopic model for the stress accumulated accumulative effect.
Quenching stress was generated by the sudden solidification of the deposited splats on the substrate surface, and is defined by point A in Figure 8a. The relationship between the simulated quenching stress and the substrate preheating temperature was analysed in the mesoscopic model for a 36.5 µm coating layer. Figure 9 illustrates the quenching stress for substrate preheating temperatures from 300 K to 600 K. The simulated quenching stress increased slightly with increasing substrate temperature, which agreed with the trend of the results from the literature [35]. It was also observed that the dependence is lower at high substrate preheating temperatures [14,35].

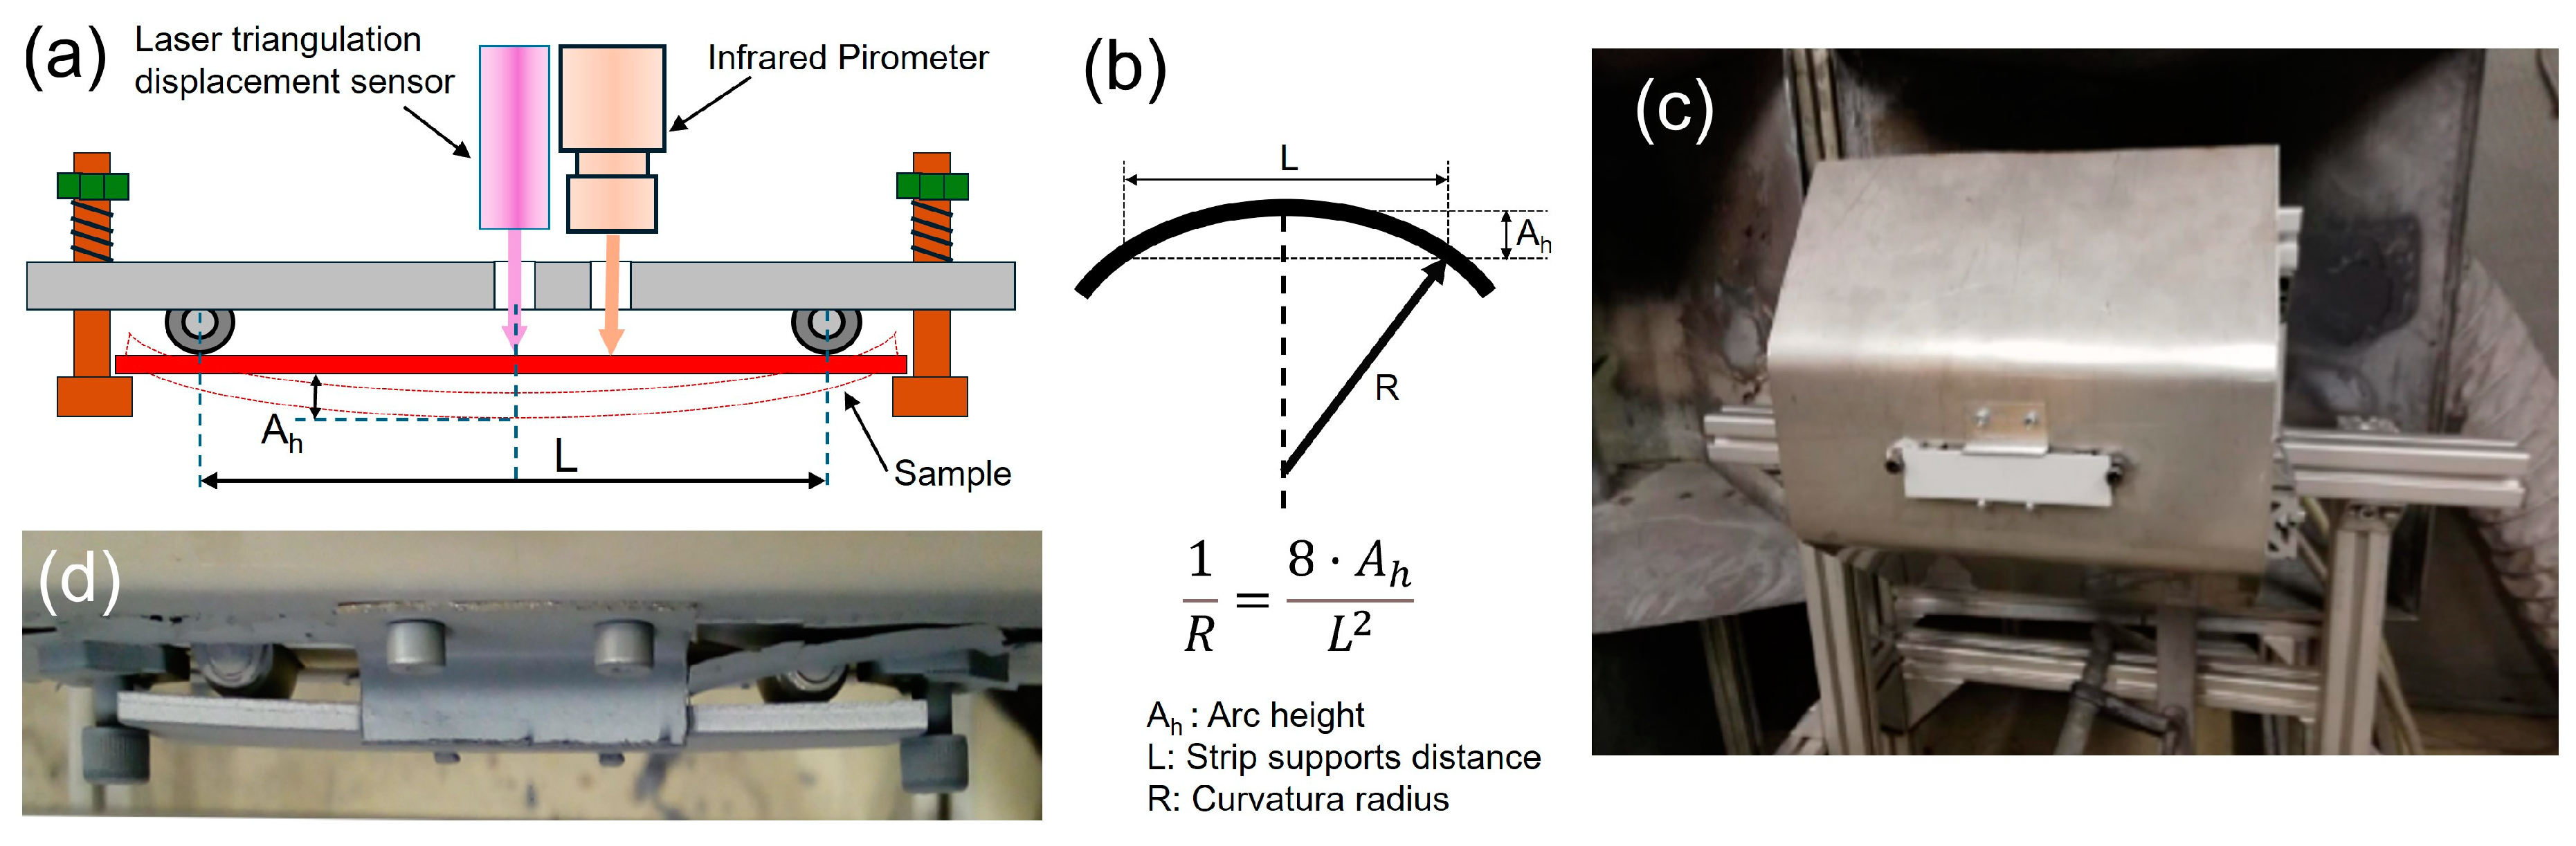
4. Experimental Quenching Stress

This section describes the experimental measurement of the quenching stress to validate the results obtained from the mesoscopic model for the APS coating process of Al2O3 coating on an aluminium substrate plate preheated to 300 K, point A in Figure 8a. An in situ curvature method based on continuously measuring the substrate curvature during the deposition process is proposed to measure the instant quenching stress. This non-destructive method allows for the direct calculation of residual stress from the curvature generated by a laser triangulation displacement sensor, and the substrate temperature measurement during the APS process through an infrared pyrometer. Several previous studies used the in situ curvature method to measure residual stress, and the thermocouple attached to the substrate to measure substrate temperature [36,37,38,39,40]. In contrast with previous works, the method proposed in this work allows for higher accuracy in non-contact temperature measurement, so it does not interfere with the curvature of the sample.
The quenching stress during the deposition phase could be determined using the Stoney Equation (5) [41,42].
σ q = k · E s · t s 2 6 · t c
E s = E s 1 ν s
where Δk is the radius of curvature, in m−1; E s is the corrected modulus of elasticity of the substrate, in Pa; t s is the thickness of the substrate, in m; t c is the thickness of the coating, in m; and ν s is the Poisson’s coefficient of the substrate. For the experiment in this work, these parameters are summarised in Table 6.
The thermal stress due to CTE mismatch during cooling down to room temperature could be calculated using the Tsui and Clyne Equation (7) [43,44].
σ y = 0 = F C T E b · h + E c · k c k n · δ
where, σy=0 is the residual stress due to cooling in the joint layer, Pa; FCTE is the force set up due to differential thermal contraction, N; δ is the neutral position to the link-layer, m; b is the sample width, m; h is the coating thickness, m; kc is the after-cooling curvature, m−1; and kn is the after-deposition coating process curvature, m−1.
An APS coating process was carried out on a flat aluminium plate (AL99 AW 1050A H14), with dimensions of 101.6 × 25.4 × 4 mm3 and Al2O3 as coating material (Al2O3 99.7%, melted and acid washed provided by Ceram GmbH Ingenieurkeramik, Albbruck, Germany). The F6 APS torch (GTV, Germany) was used, and a six-axis robot (Type RX 130 B, Stäubli Tec-Systems GmbH, Germany) was used to describe the movement of the torch. The substrate was degreased using acetone. A coating path was applied with the parameters summarised in Table 2. The experimental setup used is shown in Figure 10. The flat aluminium plate was placed on the supports fixed with springs. A laser triangulation displacement sensor (Micro-Epsilon ILD1420-10 OptoNCDT (Micro-Epsilon Messtechnik GmbH & Co. KG, Ortenburg, Germany)) was used to measure the central deflection. An infrared pyrometer (model Optris 3MH1-CF3-CB3 (Optris GmbH, Berlin, Germany)) was used to measure the temperature of the back surface of the plate.
The arc height, Ah, and temperature were measured during the APS process, as shown in Figure 11. Two phases can be clearly identified. The first phase corresponds to the coating process and the second phase corresponds to the cooling down phase. During the coating process, a global substrate temperature increase from 304 K to 413 K was observed as the torch progressed. Additionally, a pattern of temperature peaks was shown. Each temperature peak was due to the torch approaching the measurement point during each trajectory. It was also observed that as the torch began to pass over the surface of the plate, the peaks were lower, but broader. This was because, in the approaching torch trajectories, a gas reflux passed along the edge of the plate to the back part and affected the sensor measurement. This effect disappeared when the torch passed over the plate and reappeared when the torch left the plate.
On the other hand, the arc height also followed a peak pattern. It was observed that each maximum arc height peak corresponded to the maximum temperature peak of the trajectory. In addition, a change in the tendency of the arc height was observed when the torch reached the plate. The plate expanded due to the heat effect as the torch approached the plate. As the coating layer began to form on the plate, the tendency was inverted due to the tensile stress effect generated by the coating layer on the substrate surface. The maximum relative arc height occurred in the path where the plasma column passed through the centre of the plate. The deflection variations in each trajectory were attributed to the displacement of the plasma column, the pressure effect of the gas flow on the flat plate, and the vibration generated by the impact of the particles on the substrate surface.
The thermal analysis validation of the macroscopic model was discussed in a previous paper [24]. Figure 12 compares the measured and simulated temperatures in the macroscopic model. The experimental test traced a total path of 21 trajectories to ensure complete coating on the aluminium plate. Only 15 trajectories were simulated, corresponding to the trajectories where the torch passed directly over the substrate. It was verified that the model predicted the measured temperature curve quite accurately. The difference between the experimental and simulated temperature was because the model did not consider the indirect heat flow from the plasma torch in the approach trajectories, and trajectories m1 to m3 and m19 to m21, as shown in Figure 11b. On the other hand, the temperature peaks when the torch passed over the plate were lower in intensity but longer in duration than those in the simulation. This was because the heat contributed by the gas flow parallel to the plate surface was not considered in the flame profile model.
As shown in Figure 11b, from an initial arc height equal to zero, Pa, the relative arc height at the end of the deposition phase, Pb, was −1.60 µm. The relative arc height at the end of the cooling phase, Pc, was 36.05 µm. The curvature radius was calculated with the arc height and strip support distance, L, by the equation in Figure 10b [36]. The strip support distance was 7.68 cm in this experiment. Finally, a 16.45 MPa experimental quenching stress at the end of the deposition phase was calculated using Equation (5), the curvature radius and arc height relation in Figure 10b, and the relative arc height at the end of the deposition phase. This value fits perfectly with the simulated 17.07 MPa quenching stress at 300 K in Figure 9.

5. Conclusions

This work presents a multi-scale thermal and stress transient analysis based on a one-way-coupled thermal–mechanical method and submodelling technique during the APS process. This model enables an in-depth understanding of the deposition process not only at the mesoscopic level of a total single coating layer and how the coating interacts with the substrate, but also at the microscopic level of the splat layers. The temperature and stress results from the microscopic model show the behaviour of the splat layers produced during the deposition phase and how they interact with each other, and that they are involved in the APS process optimisation, such as flame temperature, substrate preheating temperature, torch speed, coating thickness, etc. An exhaustive thermal and stress analysis from the macroscopic level to microscopic or splat level was conducted to study the APS process of Al2O3 coating on a flat aluminium plate with dimensions of 101.6 × 25.4 × 4 mm3, which showed the consistency of the thermal and stress results between the three scaled submodels (macro, meso, and microscopic models). A study of the quenching stress at the end of the deposition phase of the APS process with respect to the substrate preheating temperature up to 600 K was conducted at the mesoscopic level. The results of this study show that the increment in the substrate preheating temperature caused a quenching stress increment in the layer–substrate interface from 17.07 MPa at 300 K to 28.6 MPa at 600 K. In conclusion, the quenching stress showed little dependence on the substrate preheating temperature for the Al2O3 coating on aluminium substrate. An APS coating process was carried out on a flat aluminium plate with Al2O3 coating material to validate the simulation results. An in situ curvature technique was developed to obtain the experimental arc height and temperature during one 35 µm Al2O3 coating deposition on 4 mm thick aluminium substrate at 300 K preheating temperature. The correlation between the two experimental parameters was justified. An arc height of −1.60 µm was obtained at the end of the deposition phase of the coating process. A quenching stress of 16.45 MPa was calculated using the Stoney equation. Therefore, the simulated quenching stress was 17.07 MPa at 300 K, which showed great fitting between the experimental and simulation results.

Author Contributions

Conceptualisation, J.M.-G.; experimental methodology, V.M.-G.; software development, J.M.-G.; validation, J.M.-G. and V.M.-G.; writing—original draft preparation, J.M.-G.; writing—review and editing, J.M.-G., V.M.-G., and A.K. All authors have read and agreed to the published version of the manuscript.

Funding

This research received no external funding.

Institutional Review Board Statement

Not applicable.

Informed Consent Statement

Not applicable.

Data Availability Statement

Data are contained within the article.

Acknowledgments

The authors thank the Institute for Manufacturing Technologies of Ceramic Components and Composites (IMTCCC) of the University of Stuttgart (Germany) for their support in the experimental tests.

Conflicts of Interest

The authors declare that they have no known competing financial interests or personal relationships that could have appeared to influence the work reported in this paper.

References

  1. Espallargas, N. Future Development of Thermal Spray Coatings, 1st ed.; Woodhead Publishing: Cambridge, UK, 2015; ISBN 978-0-85709-769-9. [Google Scholar]
  2. Hogmark, S.; Jacobson, S.; Larsson, M. Design And Evaluation Of Tribological Coatings. Wear 2000, 246, 20–33. [Google Scholar] [CrossRef]
  3. Li, C.J.; Luo, X.T.; Dong, X.Y.; Zhang, L.; Li, C.X. Recent Research Advances in Plasma Spraying of Bulk-Like Dense Metal Coatings with Metallurgically Bonded Lamellae. J. Therm. Spray Technol. 2022, 31, 5–27. [Google Scholar] [CrossRef]
  4. Heimann, R.B. Plasma-Spray Coating: Principles and Applications; VCH Verlagsgesellschaft mbH: Weinheim, Germany, 1996; ISBN 978-3-527-61484-4. [Google Scholar]
  5. Pawlowski, L. The Science and Engineering of Thermal Spray Coatings, 2nd ed.; John Wiley & Sons, Ltd.: London, UK, 2008; ISBN 978-0-471-49049-4. [Google Scholar]
  6. Ang, A.S.M.; Berndt, C.C. A Review of Testing Methods for Thermal Spray Coatings. Int. Mater. Rev. 2014, 59, 179–223. [Google Scholar] [CrossRef]
  7. Davis, J.R. Handbook of Thermal Spray Technology, 1st ed.; ASM International: Novelty, OH, USA, 2004; ISBN 0-87170-795-0. [Google Scholar]
  8. Bach, F.; Laarmann, A.; Wenz, T. Modern Surface Technology, 1st ed.; Wiley-VCH Verlag GmbH & Co. KgaA: Weinheim, Germany, 2006; ISBN 978-3-52731-532-1. [Google Scholar]
  9. Abubakar, A.A.; Arif, A.F.M.; Al-Athel, K.S.; Akhtar, S.S.; Mostaghimi, J. Modeling Residual Stress Development in Thermal Spray Coatings: Current Status and Way Forward. J. Therm. Spray Technol. 2017, 26, 1115–1145. [Google Scholar] [CrossRef]
  10. Buchmann, M.; Gadow, R. Estimation of Residual Stresses from the Simulation of the Deposition Process of Ceramic Coatings on Light Metal Cylinder Liners. In Proceedings of the 25th Annual Conference on Composites, Advanced Ceramics, Materials, and Structures, Cocoa Beach, FL, USA, 21–27 January 2001; Singh, B.M., Jessen, T., Eds.; pp. 67–74. [Google Scholar]
  11. Wenzelburger, M.; Riegert-Escribano, M.J.; Gadow, R. Methods of Residual Stress Analysis in Layer Composites and Their Application, Mech. Prop. Perform. Enginnering Ceram. Compos, Ceram. Eng. Sci. Proc. 2009, 26, 371–379. [Google Scholar]
  12. Elhoriny, M.; Wenzelburger, M.; Killinger, A.; Gadow, R. Finite Element Simulation of Residual Stress Development in Thermally Sprayed Coatings. J. Therm. Spray Technol. 2017, 26, 735–744. [Google Scholar] [CrossRef]
  13. Floristán, M.; Montesinos, J.A.; García-Marín, J.A.; Killinger, A.; Gadow, R. Robot Trajectory Planning For High Quality Thermal Spray Coating Processes On Complex Shaped Components. In Proceedings of the ITSC 2012, ASM International, Houston, TX, USA, 21–24 May 2012; pp. 448–453. [Google Scholar] [CrossRef]
  14. Liu, J.; Bolot, R.; Costil, S. Residual Stresses and Final Deformation of an Alumina Coating: Modeling and Measurement. Surf. Coat. Technol. 2015, 268, 241–246. [Google Scholar] [CrossRef]
  15. Ng, H.W.; Gan, Z. A Finite Element Analysis Technique For Predicting as-Sprayed Residual Stresses Generated by the Plasma Spray Coating Process. Finite Elem. Anal. Des. 2005, 41, 1235–1254. [Google Scholar] [CrossRef]
  16. Gan, Z.; Ng, H.W.; Devasenapathi, A. Deposition-Induced Residual Stresses In Plasma-Sprayed Coatings. Surf. Coat. Technol. 2004, 187, 307–319. [Google Scholar] [CrossRef]
  17. Martínez García, V.; Gadow, R.; Killinger, A.; Moreno Nicolás, J.A. Submodeling of Alumina Coatings by APS. In Proceedings of the ITSC 2017, Dusseldorf, Germany, 7–9 June 2017; pp. 1112–1117. [Google Scholar]
  18. ANSYS. Advanced Analysis Technique Guide; ANSYS Inc.: Canonsburg, PA, USA, 2009. [Google Scholar]
  19. Stamenkovic, D.; Vasovic, I. Finite Element Analysis of Residual Stress in Butt Welding Two Similar Plates. Sci. Tech. Rev. 2009, 59, 57–60. [Google Scholar]
  20. Cormier, N.G.; Smallwood, B.S.; Sinclair, G.B.; Meda, G. Aggressive Submodelling Of Stress Concentrations. Int. J. Numer. Meth. Engng. 1999, 46, 889–909. [Google Scholar] [CrossRef]
  21. Advanced Analysis Guide—Chapter 9: Submodeling, Release 12.1; ASNYS Inc.: Canonsburg, PA, USA, 2009.
  22. Soundararajan, B.; Sofia, D.; Barletta, D.; Poletto, M. Review On Modeling Techniques For Powder Bed Fusion Processes Based On Physical Principles. Addit. Manuf. 2021, 47, 102336. [Google Scholar] [CrossRef]
  23. Mulero, M.A.; Zapata, J.; Vilar, R.; Martínez, V.; Gadow, R. Automated Image Inspection System To Quantify Thermal Spray Splat Morphology. Surf. Coat. Technol. 2015, 278, 1–11. [Google Scholar] [CrossRef]
  24. Martínez-García, J.; Martínez-García, V.; Killinger, A. Modelling and Experimental Validation of the Flame Temperature Profile in Atmospheric Plasma Coating Processes on the Substrate. Coatings 2024, 14, 1248. [Google Scholar] [CrossRef]
  25. Verein Deutscher Ingenieure. VDI Heat Atlas, 2nd ed.; Springer: Heidelberg, Germany, 2010; ISBN 978-3-540-77876-9. [Google Scholar]
  26. Siegel, R.; Howell, J.R. Thermal Radiation Heat Transfer, 6th ed.; CRC Press: Boca Raton, FL, USA, 2015. [Google Scholar]
  27. Faghri, A.; Zhang, Y. Transport Phenomena Iin Multiphase Systems; Elsevier Academic Press: New York, NY, USA, 2006; pp. 1013–1030. [Google Scholar]
  28. Powell, R.W.; Ho, C.Y.; Liley, P.E. Thermal Conductivity of Selected Materials. United States National Bureau of Standards; United States Department of Commerce: Washington, DC, USA, 1966. [Google Scholar]
  29. McLellan, R.B.; Ishikawa, T. The Elastic Properties of Aluminum at High Temperatures. J. Phys. Chem. Solids 1987, 48, 603–606. [Google Scholar] [CrossRef]
  30. Touloukian, Y.S. Thermophysical Properties of High Temperature Solid Materials: Vol. 4. Oxides And Their Solutions And Mixtures—Part I: Simple Oxygen Compounds and Their Mixture; Macmillan: New York, NY, USA, 1967; pp. 3–48. [Google Scholar]
  31. Touloukian, Y.S. Thermophysical Properties of Matter. Volume 2: Nonferrous alloys—Part I: Nonferrous Binay Alloys; The MacMilan Company: New York, NY, USA, 1967. [Google Scholar]
  32. Metals, Alloys, Compounds, Ceramics, Polymers, Composites—Catalogue 1993/94; Goodfellow Metals Ltd.: Cambridge, UK, 1993.
  33. Morrell, J. Handbook of Technical and Engineering Ceramics, Part 1: An Introduction for the Engineer and Designer; Her Majesty’s Stationery Office (HMSO): London, UK, 1985. [Google Scholar]
  34. Sun, D.; You, E.; Zhang, T.; Xu, J.; Wang, X.; Ren, X.; Tao, W. A review of thermal contact conductance research of conforming contact surfaces, Part B. Int. Commun. Heat Mass Transf. 2024, 159, 108065. [Google Scholar] [CrossRef]
  35. Kuroda, S.; Clyne, T.W. The Quenching Stress In Thermally Sprayed Coatings. Thin Solid. Films 1991, 200, 49–66. [Google Scholar] [CrossRef]
  36. Mutter, M.; Mauer, G.; Mücke, R. Investigations on the Initial Stress Evolution During Atmospheric Plasma Spraying of YSZ by In Situ Curvature Measurement. J. Therm. Spray Technol. 2016, 25, 672–683. [Google Scholar] [CrossRef]
  37. Zhang, X.; Watanabe, M.; Kuroda, S. Effects of Processing Conditions on the Mechanical Properties and Deformation Behaviors of Plasma-Sprayed Thermal Barrier Coatings: Evaluation of Residual Stresses and Mechanical Properties of Thermal Barrier Coatings on the Basis of in Situ Curvature Measurement Under a Wide Range of Spray Parameters. Acta Mater. 2013, 61, 1037–1047. [Google Scholar] [CrossRef]
  38. Totemeier, T.C.; Wright, J.K. Residual Stress Determination in Thermally Sprayed Coatings—A Comparison of Curvature Models and X-Ray Techniques. Surf. Coat. Technol. 2006, 200, 3955–3962. [Google Scholar] [CrossRef]
  39. Matejicek, J.; Sampath, S. In Situ Measurement of Residual Stresses and Elastic Moduli in Thermal Sprayed Coatings: Part 1: Apparatus and Analysis. Acta Mater. 2003, 51, 863–872. [Google Scholar] [CrossRef]
  40. Liao, H.; Vaslin, P.; Yang, Y.; Coddet, C. Determination of Residual Stress Distribution from in Situ Curvature Measurements for Thermally Sprayed WC/Co Coatings. J. Therm. Spray Technol. 1997, 6, 235–241. [Google Scholar] [CrossRef]
  41. Stoney, G.G. The Tension of Metallic Films Deposited by Electrolysis. Proc. R. Soc. Lond. A 1909, 82, 172–175. [Google Scholar] [CrossRef]
  42. Clyne, T.W.; Gill, S.C. Residual Stresses in Thermal Spray Coatings and Their Effect on Interfacial Adhesion: A Review of Recent Work. J. Therm. Spray Technol. 1996, 5, 401–418. [Google Scholar] [CrossRef]
  43. Tsui, Y.C.; Clyne, T.W. An analytical Model for Predicting Residual Atresses in Progressively Deposited Coatings Part 1: Planar Geometry. Thin Solid Films 1997, 306, 23–33. [Google Scholar] [CrossRef]
  44. Chu, Y.; Hao, B.; Li, Z.; Zhu, J.; He, X. An Analytical Model for Predicting Residual Stresses in Multiple Layers By Plasma Cladding Process. AIP Adv. 2019, 9, 085103. [Google Scholar] [CrossRef]
Figure 1. (a) Mesh used for the macroscopic, mesoscopic, and microscopic submodels, and detail of the layers and nodes at different depths of the point under test for the macroscopic submodel. (b) Sequence diagram of one-way coupled thermo-mechanical analysis between the macroscopic, mesoscopic, and microscopic submodels.
Coatings 14 01547 g001
Figure 2. (a) Scheme of the coating process on a flat plate; (b) schematic diagram of the heat source path motion with a number of TL lines or trajectories, a line offset DLy (DLy = ΔLZ × dy), and the start and the end of the path, Pointstart_path and Pointend_path, respectively [24].
Coatings 14 01547 g002
Figure 3. Sequence schematic showing the torch trajectory over the Kth element, torch heat flux steps, and activation of the coating layers. K is the step when the plasma plume reaches the Kth element. K + FLx + 1 is the step when the plasma plume leaves the Kth element. Nsim is the total simulation steps.
Coatings 14 01547 g003
Figure 4. (a) Simulated temperature evolution at different substrate depths (0, 0.365, 1.0, 2.1, and 4.0 mm) of the point under test (Figure 1a) during the coating process with the macroscopic model. Inset (i) shows details of the simulated temperature evolution of the 15 trajectories of the full coating path, sx, x = 1, …, 15. (b) Simulated temperature evolution during the 8th trajectory at different substrate depths of the point under test and ANSYS’s temperature substrate images at different times: (A) tA = 6.433 s, (B) tB = 6.462 s, (C) tC = 6.498 s, (D) tD = 6.538 s, and (E) tE = 6.636 s.
Coatings 14 01547 g004
Figure 5. (a) Simulated stress evolution at different substrate depths (0, 0.365, 1.0, 2.1, and 4.0 mm) at the point under test (Figure 1a) during the coating process with the macroscopic model. Inset (i) shows details of the simulated stress evolution of the 15 trajectories of the full coating path, sx, x = 1, …, 15. (b) Simulated stress evolution during the 8th trajectory at different substrate depths of the point under test and ANSYS’s temperature substrate images at different times: (A) tA = 6.433 s, (B) tB = 6.462 s, (C) tC = 6.498 s, (D) tD = 6.538 s, and (E) tE = 6.636 s.
Coatings 14 01547 g005
Figure 6. (a) Section of the mesoscopic model indicting the node selection for the depth analysis. (b) Section of the microscopic model indicting the node selection for the depth analysis.
Coatings 14 01547 g006
Figure 7. Temperature evolution of macroscopic, mesoscopic, and microscopic numerical simulation at different coating and substrate depths of the point under test.
Coatings 14 01547 g007
Figure 8. (a) Stress evolution of macroscopic, mesoscopic, and microscopic numerical simulations at different coating and substrate depths of the point under test. (b) Detail of the stress evolution of mesoscopic and microscopic numerical simulation at different coating and substrate depths of the point under test.
Coatings 14 01547 g008
Figure 9. Simulated quenching stress versus substrate preheated temperature at the coating–substrate interface (0 µm) with the mesoscopic thermo-mechanical simulation model for a 36.5 µm coating layer.
Coatings 14 01547 g009
Figure 10. (a) Schematic measurement setup. (b) Arc height, Ah, and curvature radius, R, relation [18]. (c) Picture of the complete measurement system, and (d) detail of the sample in the measurement setup.
Coatings 14 01547 g010
Figure 11. (a) Arch height and temperature measured during the coating and cooling down phases. (b) Details of the arch height and temperature measured from the 21 trajectories of the full coating path, mx, x = 1, …, 21., during the coating process.
Coatings 14 01547 g011
Figure 12. Comparison of the measured temperature (red line) and the simulated temperature (black line) with the mesoscopic model.
Coatings 14 01547 g012
Table 1. Definition of the submodelling simulation parameters.
ParameterValue
Substrate dimensions (DX × DY × DZ), mm3101.6 × 25.4 × 4
Number elements: first layer (MTX × MTY)192 × 48
Number of node layers5
Surface element dimensions (dx × dy × dz), µm3529.2 × 529.2 × 365
Analyzed elements (Ne)21,312
Torch speed (vtorch), mm/s500
Torch line change time (timetor), s1
Ambient temperature (TAmb), K300
Number elements of the line offset (ΔLZ)5
Total number of spray lines (TL)15
Table 2. Plasma torch parameters.
ParameterValue
Plasma gunGTV F6
Torch distance to the plate, mm120
Torch Speed (vtorch), mm/s500
Hydrogen, slpm10
Argon, slpm44
Current, A500
Voltage, V75
Power, kW37.5
Powder carrier gas mass flow rate, slpm5
Powder feed rate, g/min4.2
Trajectory length (Lx), mm200
Line offset (DLy), mm 2.65
Table 3. Definition of the Gaussian plasma plume temperature profile parameters [24].
ParameterValue
Number of elements for the X-axis dimension of the plasma area or footprint (FLx)36
Number of elements for the Y-axis dimension of the plasma area or footprint (FLy)16
Maximum plasma plume temperature (THigh), K1476
Minimum plasma plume temperature (TLow), K634
X-Axis standard deviation of the Gaussian plasma plume temperature profile, σx249
Y-Axis standard deviation of the Gaussian plasma plume temperature profile, σy214.5
Maximum convective coefficient (FilmHigh), W/m2·K2500
Minimum convective coefficient (FilmLow), W/m2·K2000
Table 4. Thermal and mechanical properties of aluminium.
Temp
(K)
Density (kg/m3)
[27]
Thermal
Conductivity (W/(m·K))
[28]
Specific Heat (J/(kg·K))
[27]
Emissivity
Coefficient
[25]
Elastic
Modulus
(Pa)
[29]
Poisson’s
Ratio
[30]
Thermal Expansion Coefficient (10−6 K−1) [31]
30027002378710.0783.80 × 1090.33423.0
600232107256.16 × 10930.0
900213119048.00 × 10934.0
120099127310036.9
1500102133810039.1
1800103139110041.0
2100103143610042.5
Table 5. Thermal and mechanical properties of Al2O3.
Temp
(K)
Density (kg/m3)
[32]
Thermal
Conductivity (W/(m·K))
[30]
Specific Heat (J/(kg·K))
[30]
Emissivity
Coefficient
[25]
Elastic Modulus (Pa)
[32]
Poisson’s
Ratio
[30]
Thermal Expansion Coefficient (10−6 K−1) [33]
300395036.967890.83.85 × 10110.2544.3
60016.0111143.63 × 10117.1
9008.8712203.41 × 10118.7
12006.6612703.19 × 10119.9
15005.7813082.97 × 101110.8
18006.1313042.75 × 101111.5
21006.0913102.53 × 101112.1
24006.05131610012.6
27006.01132210013.1
Table 6. Parameters used in the calculation of Stoney’s quenching stress equation for aluminium and Al2O3 materials.
ParameterValue
Young’s modulus of aluminium, GPa69
Young’s modulus of Al2O3, GPa306
Poisson’s coefficient for aluminium0.334
Poisson’s coefficient for Al2O30.254
Specimen width, mm25.4
Substrate thickness, mm4
Coating thickness, µm35
Disclaimer/Publisher’s Note: The statements, opinions and data contained in all publications are solely those of the individual author(s) and contributor(s) and not of MDPI and/or the editor(s). MDPI and/or the editor(s) disclaim responsibility for any injury to people or property resulting from any ideas, methods, instructions or products referred to in the content.

