
Microstructure and Corrosion Behavior of PEO-Coated AA7075 Under Pulsed Unipolar Potential Control Mode

Abstract

1. Introduction
2. Materials and Methods
2.1. Materials and PEO Process
2.2. Characterization of PEO Coatings
3. Results and Discussion
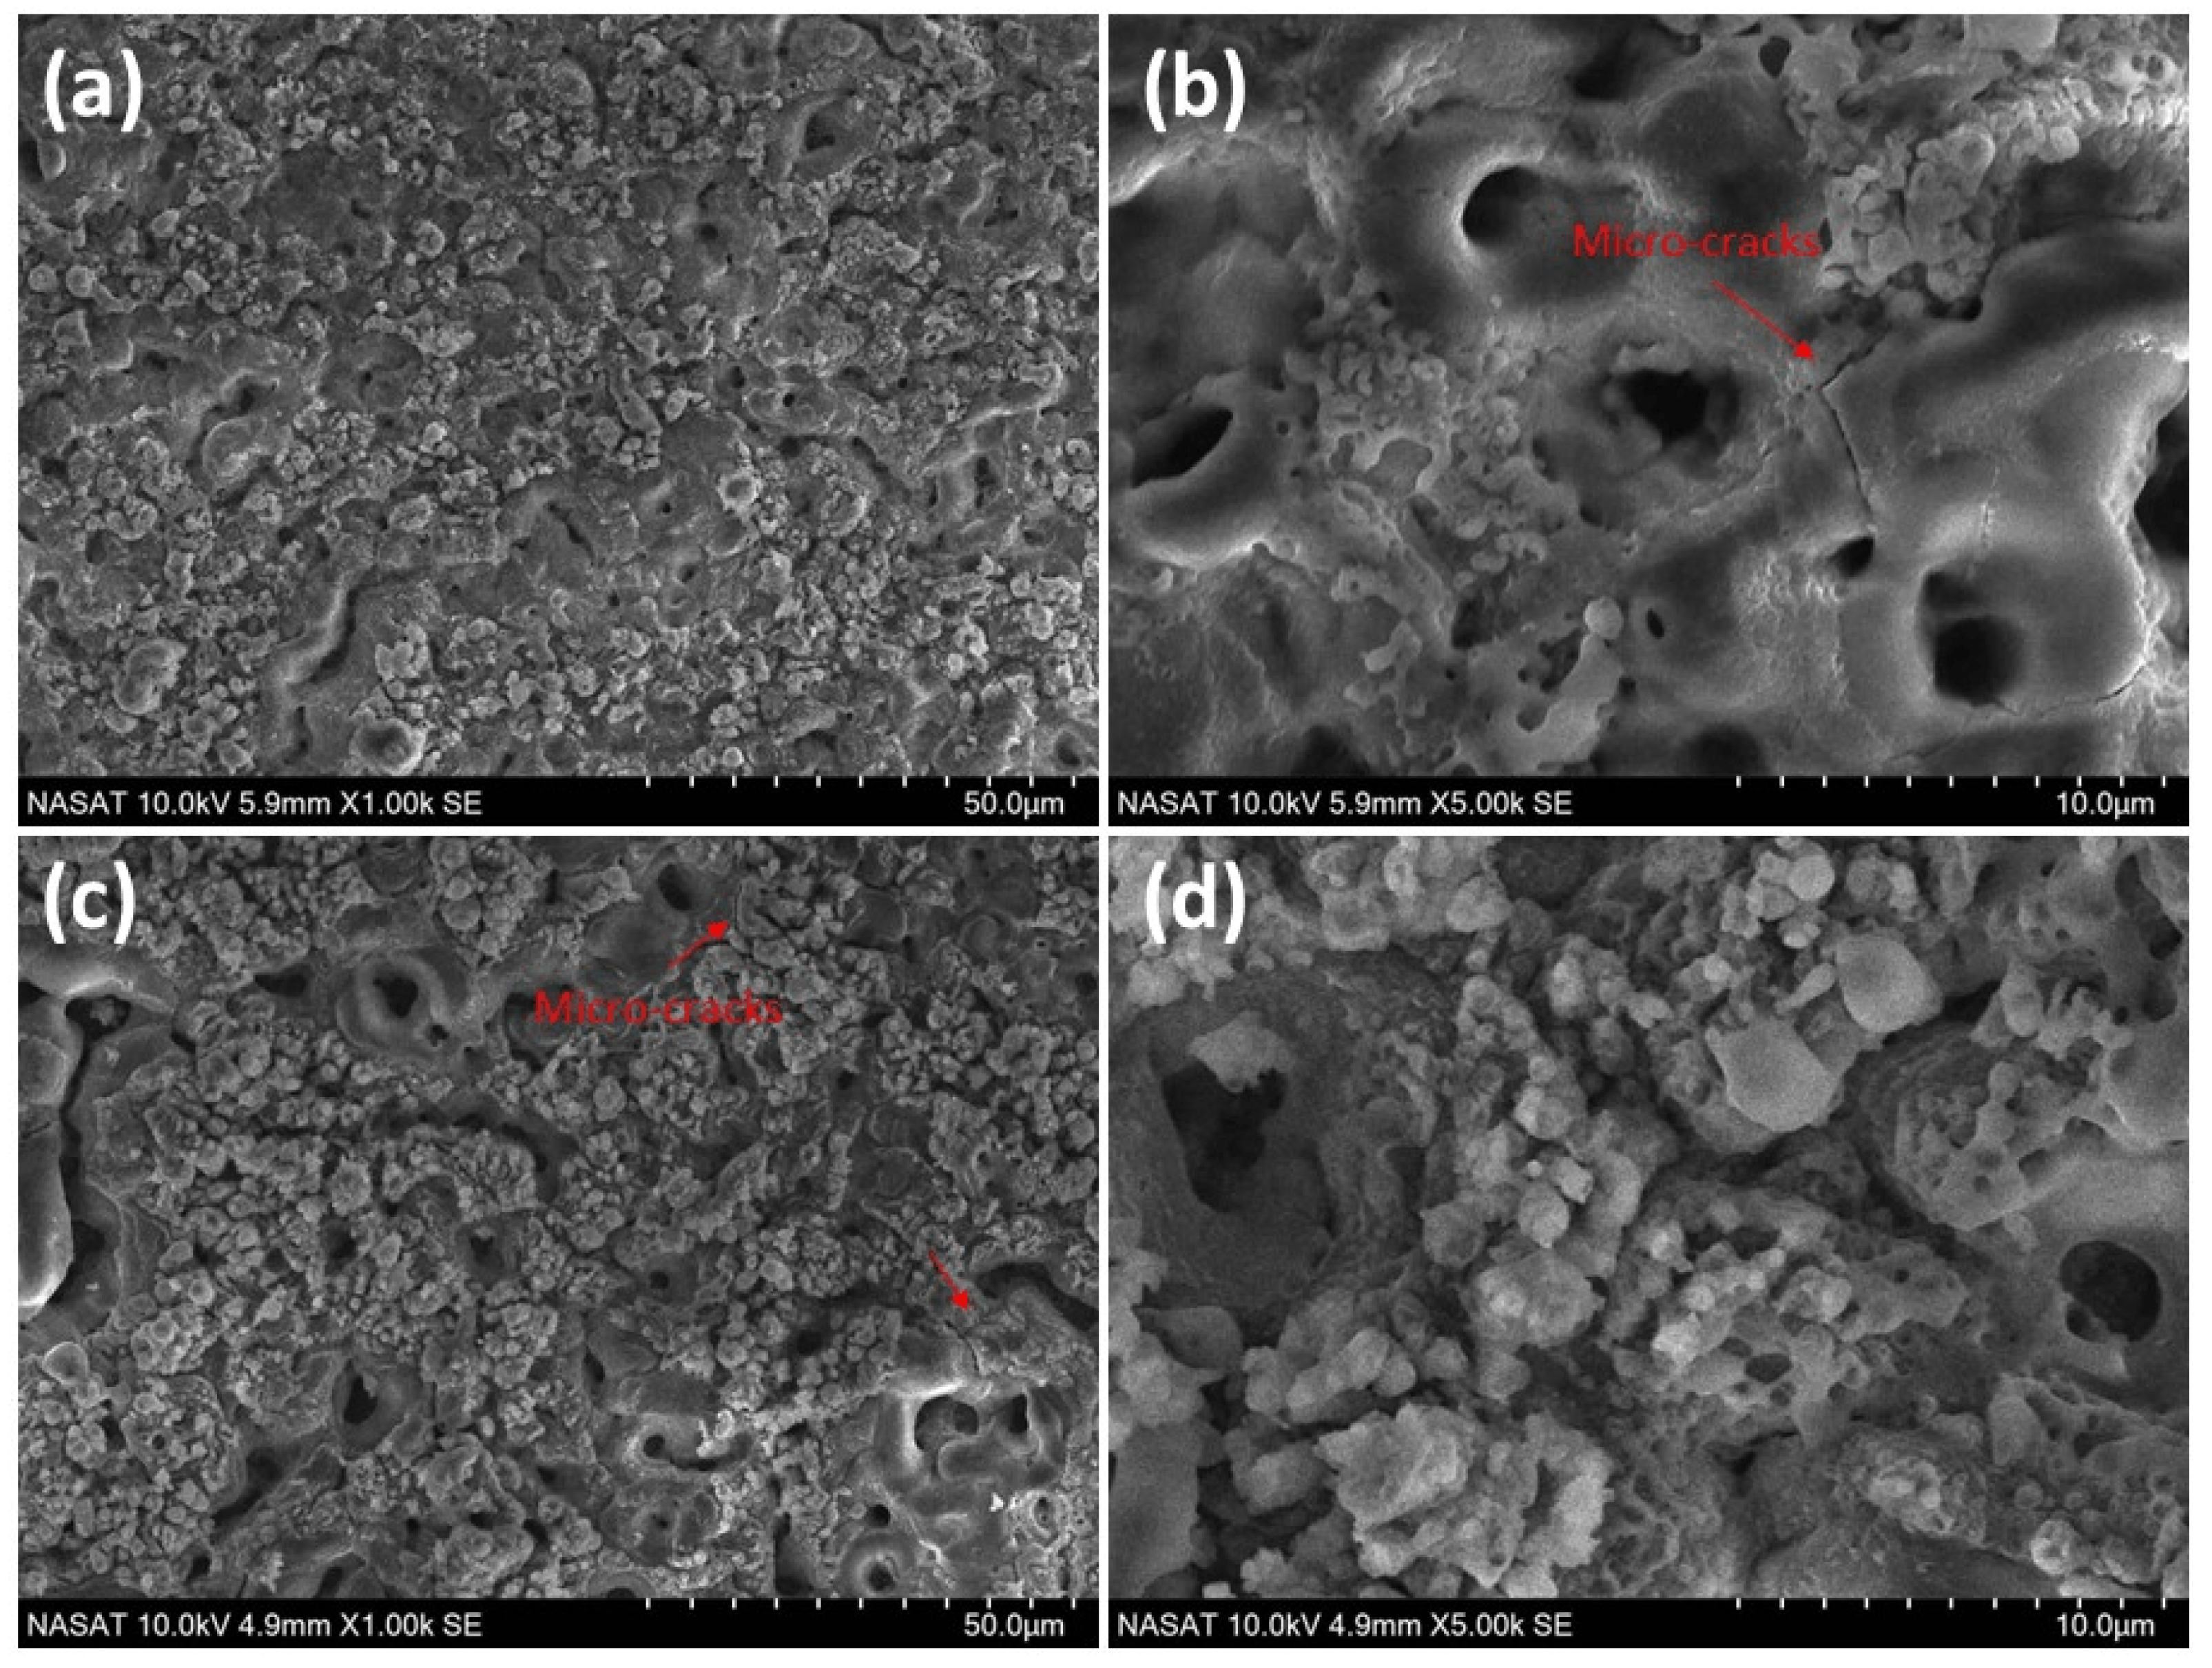
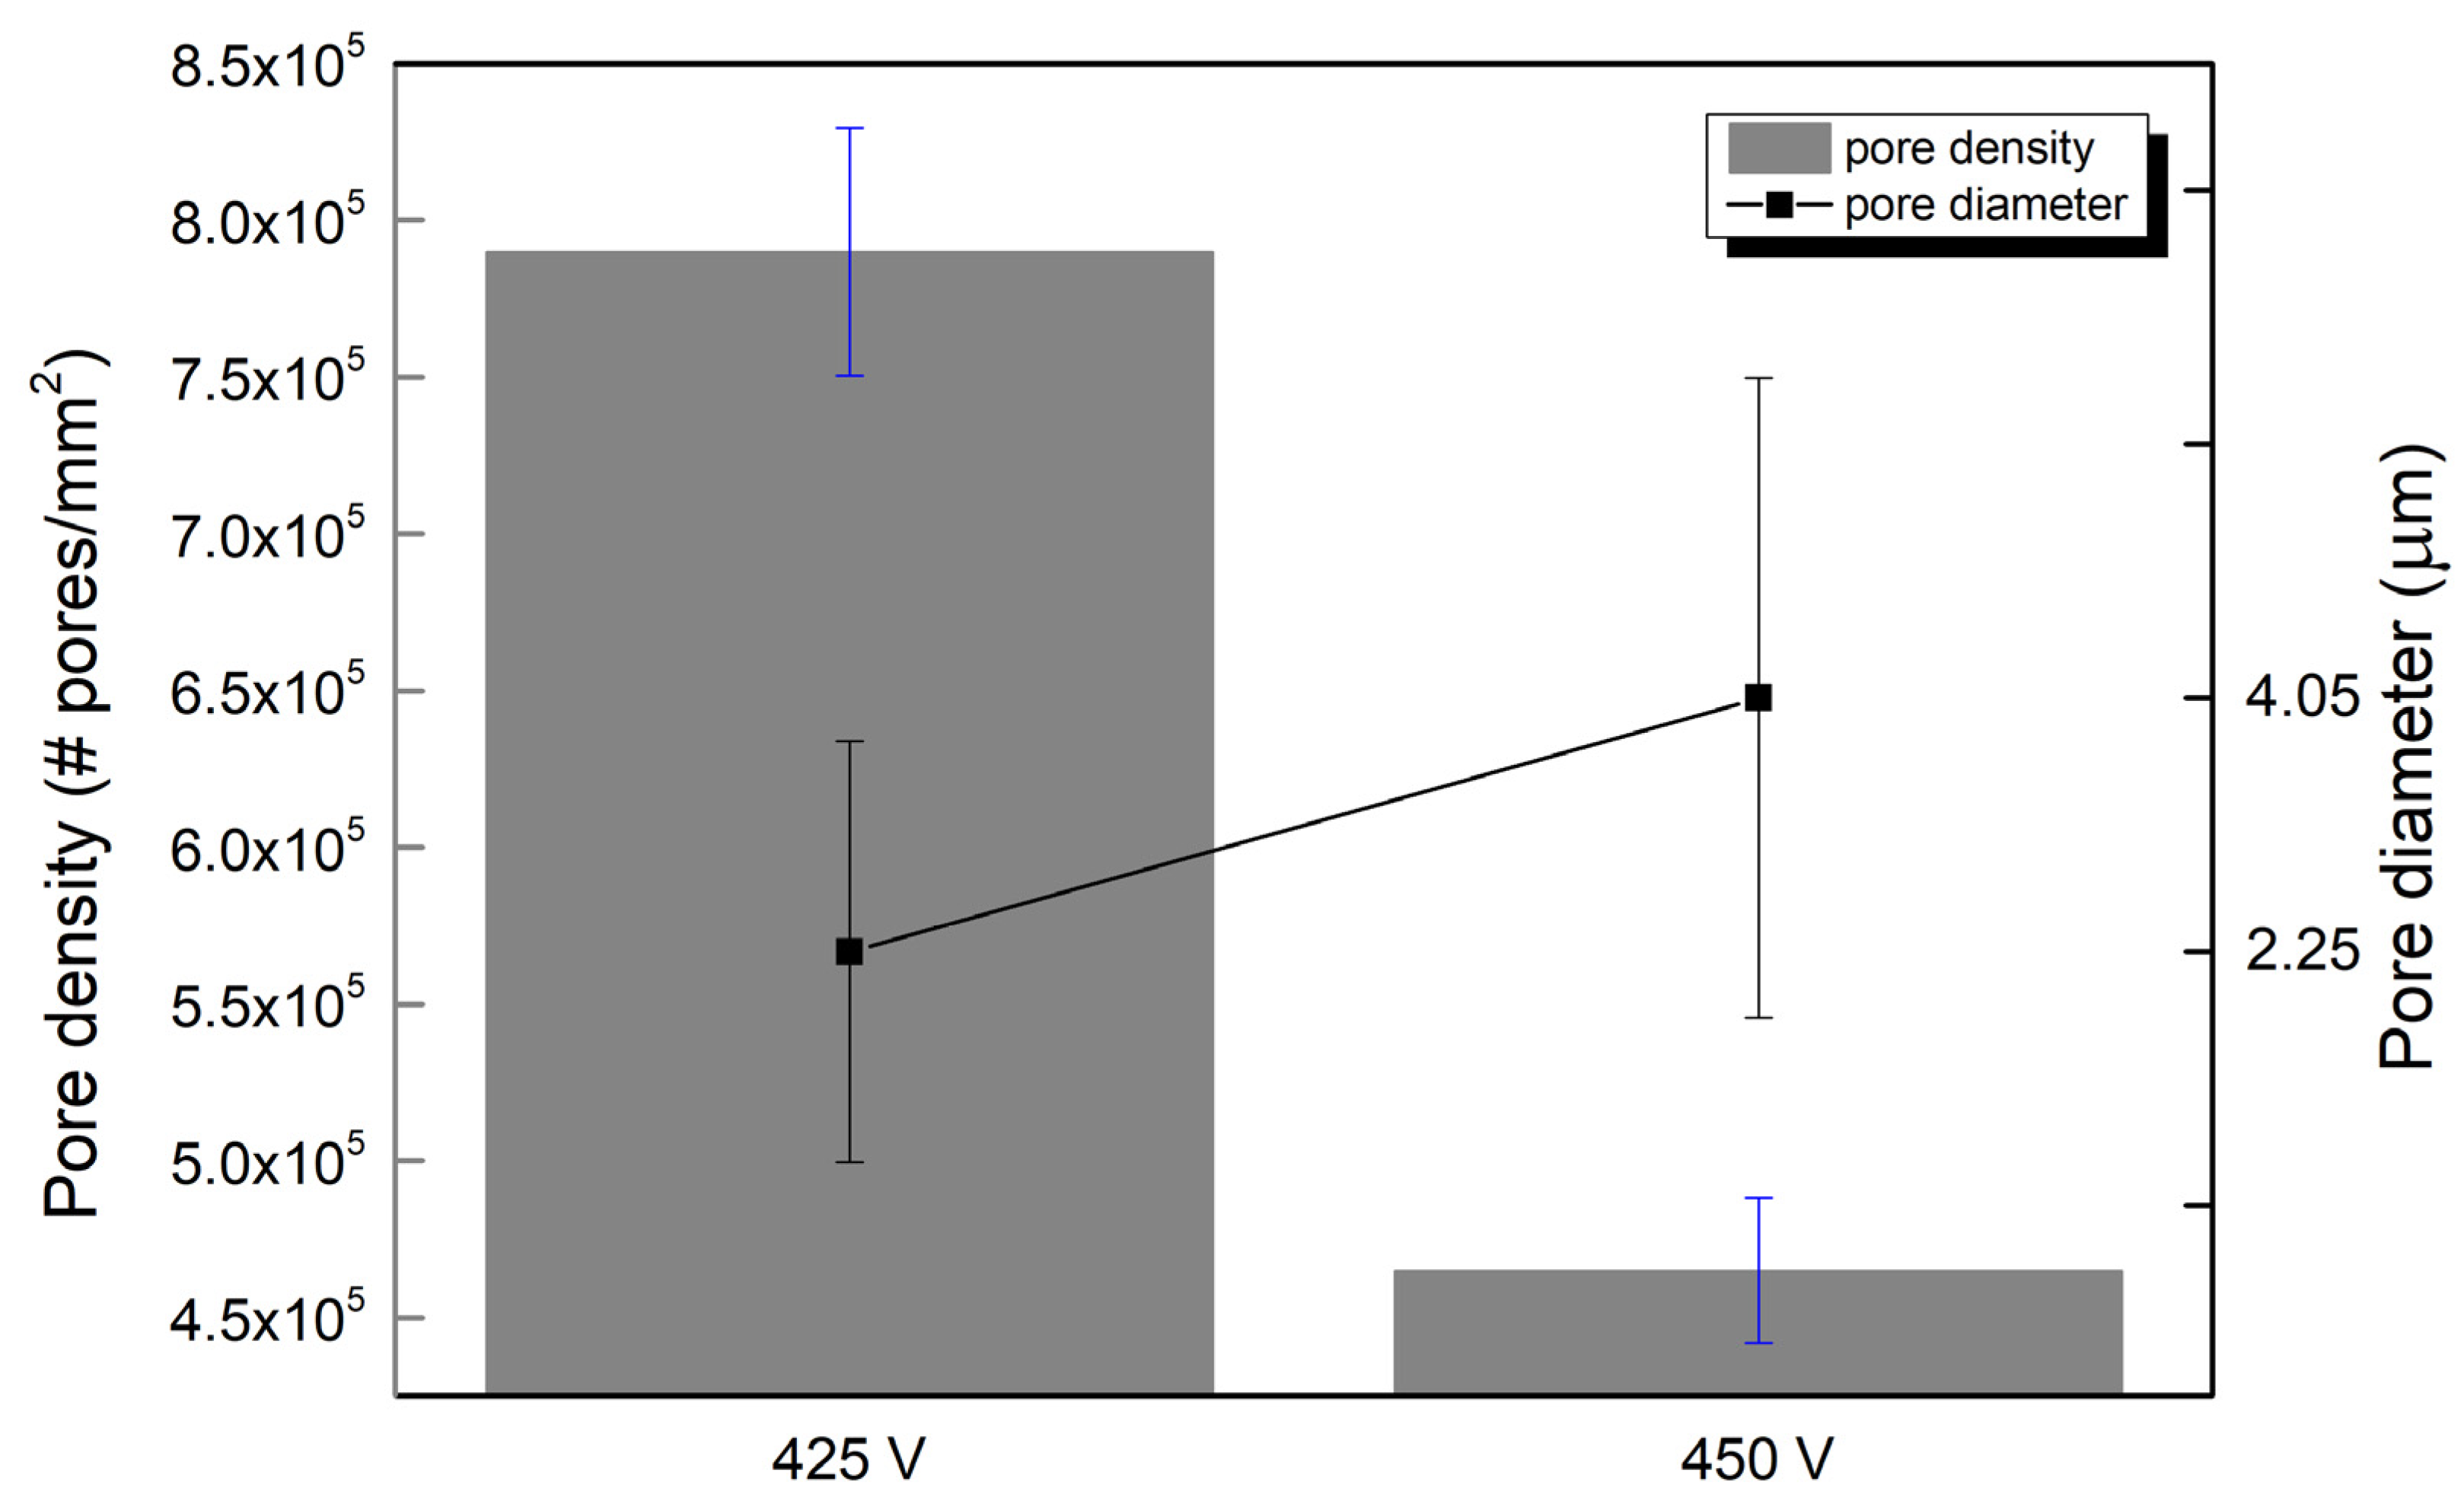
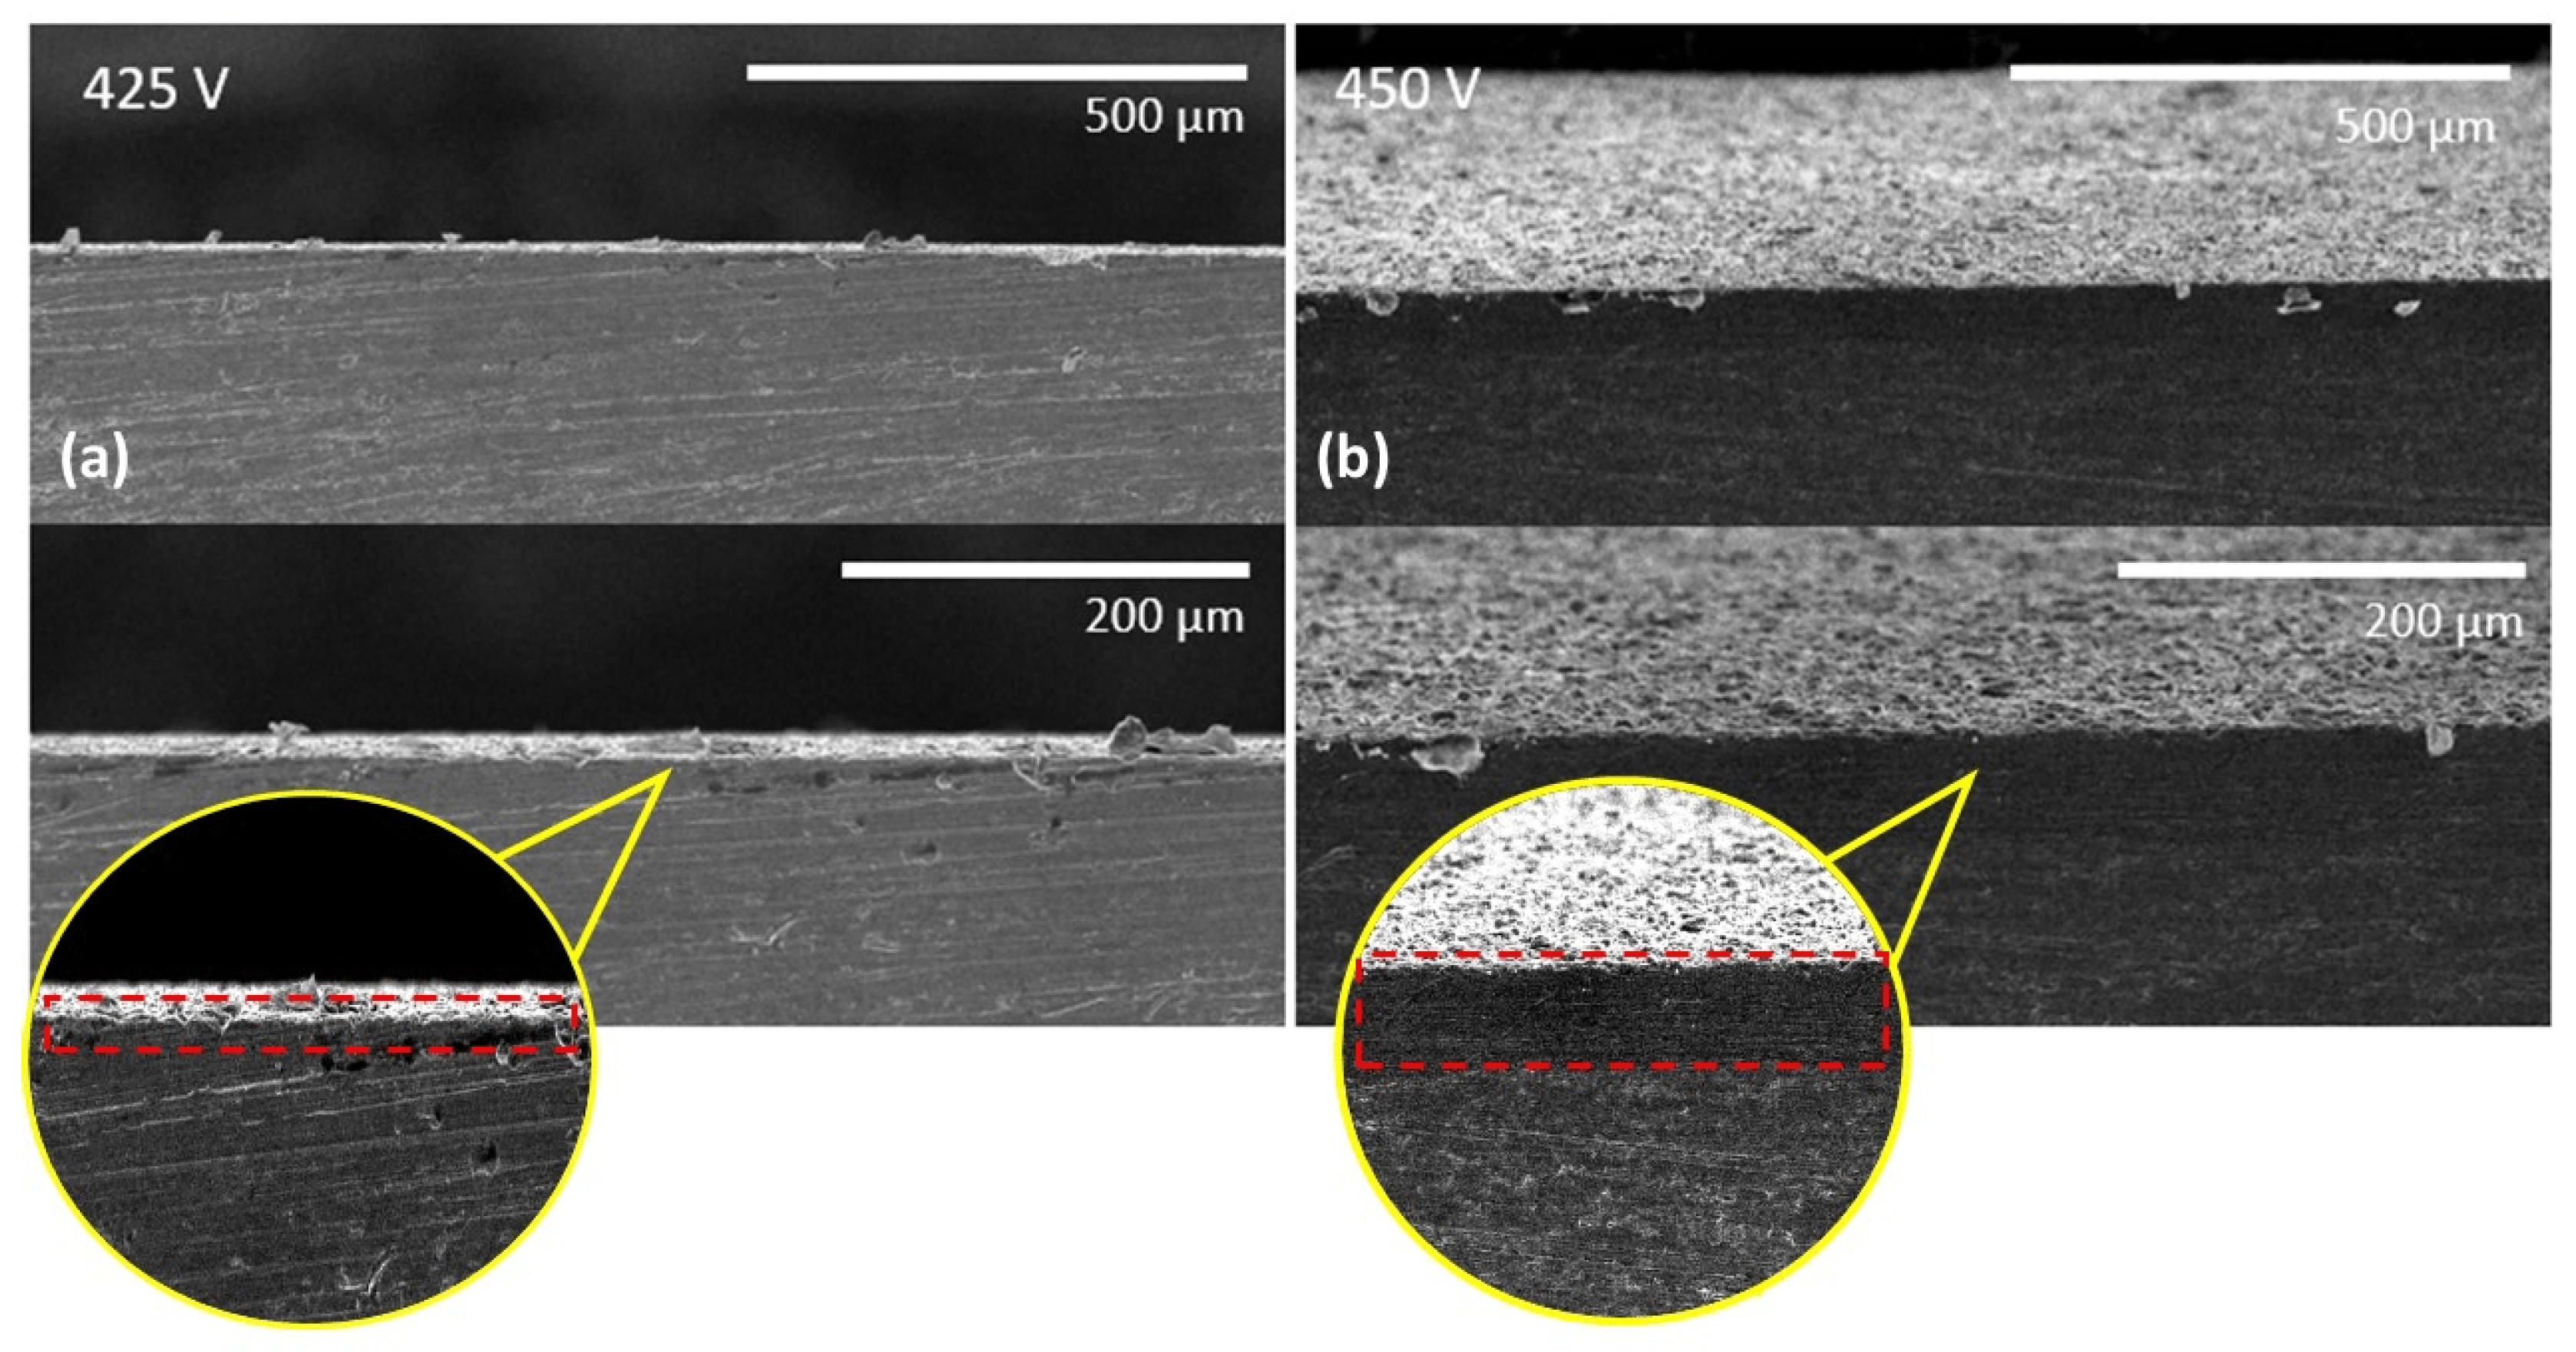
3.1. Surface Morphology of PEO Coatings
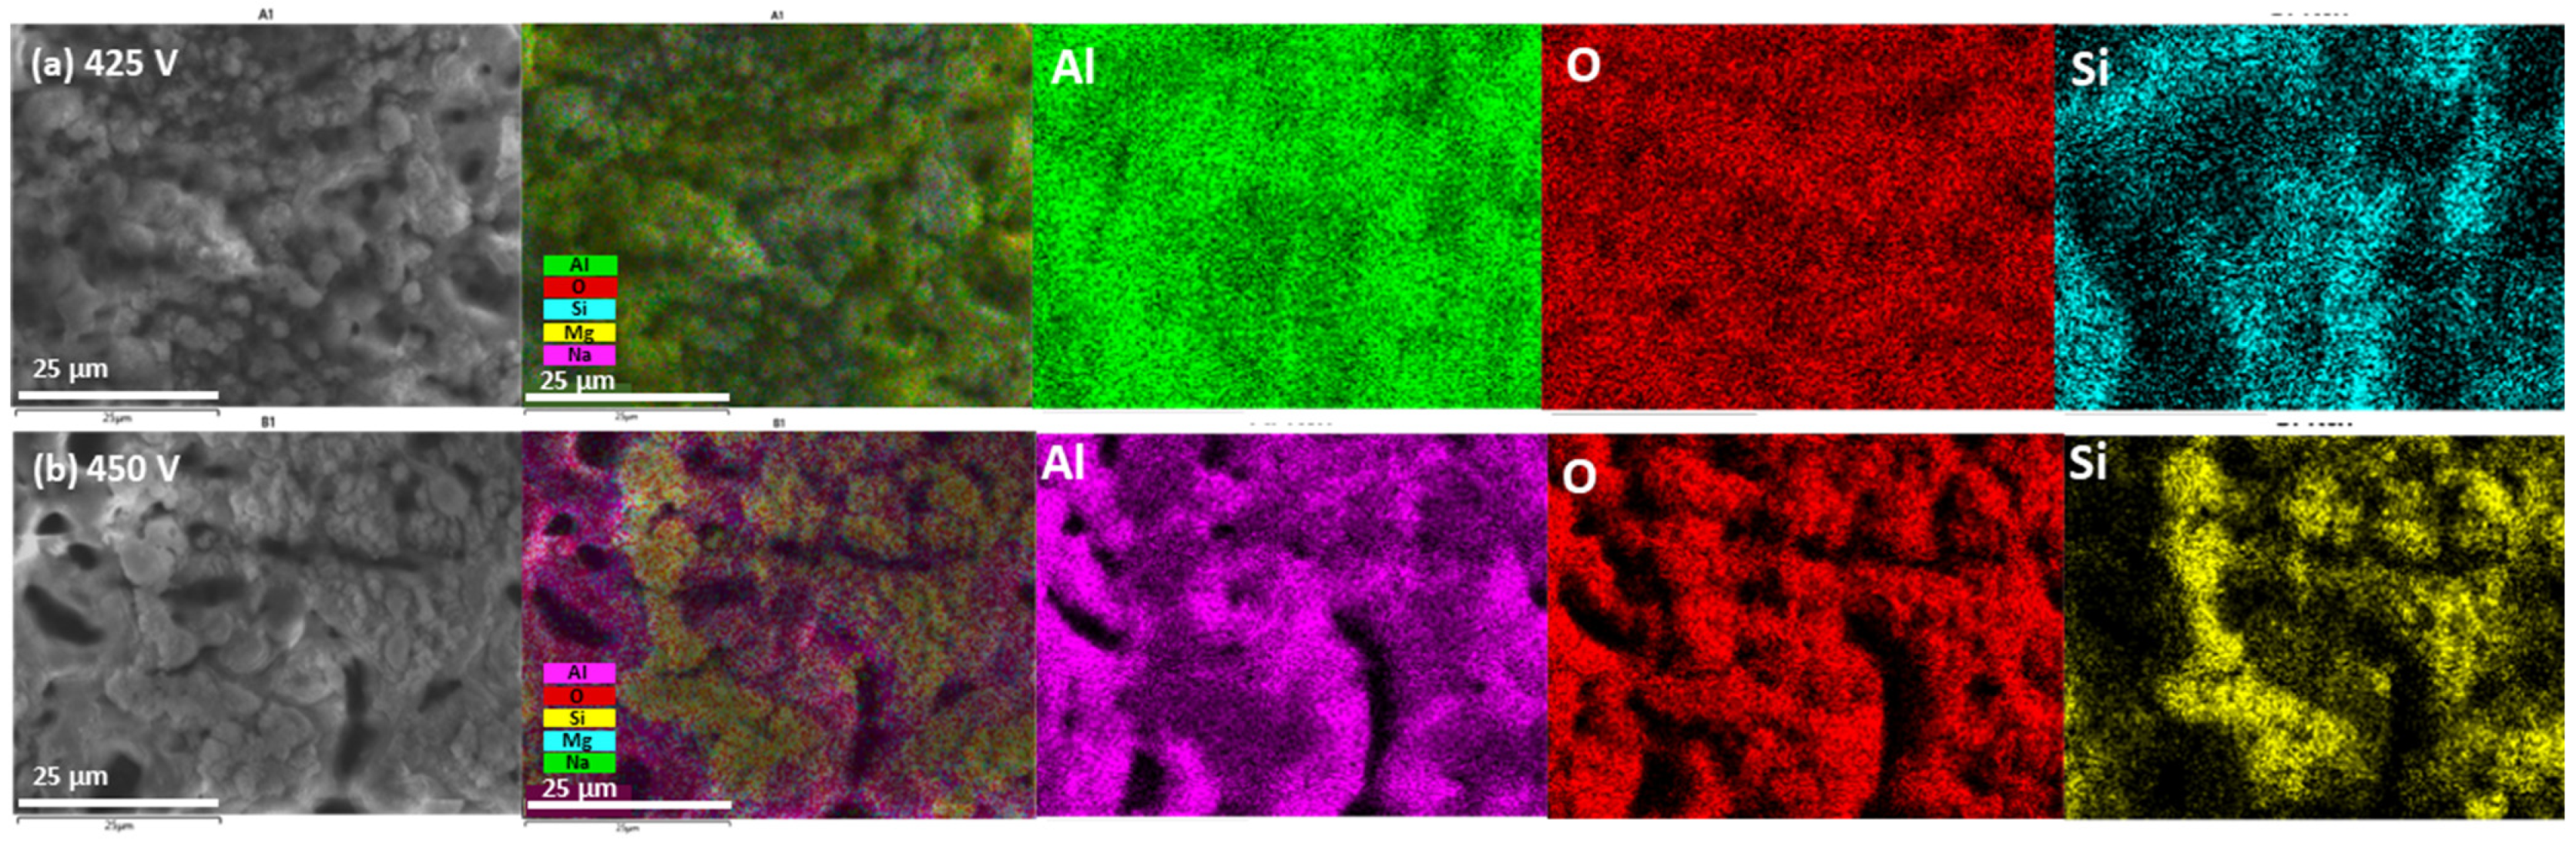
3.2. Elemental and Phase Composition of the PEO Coatings
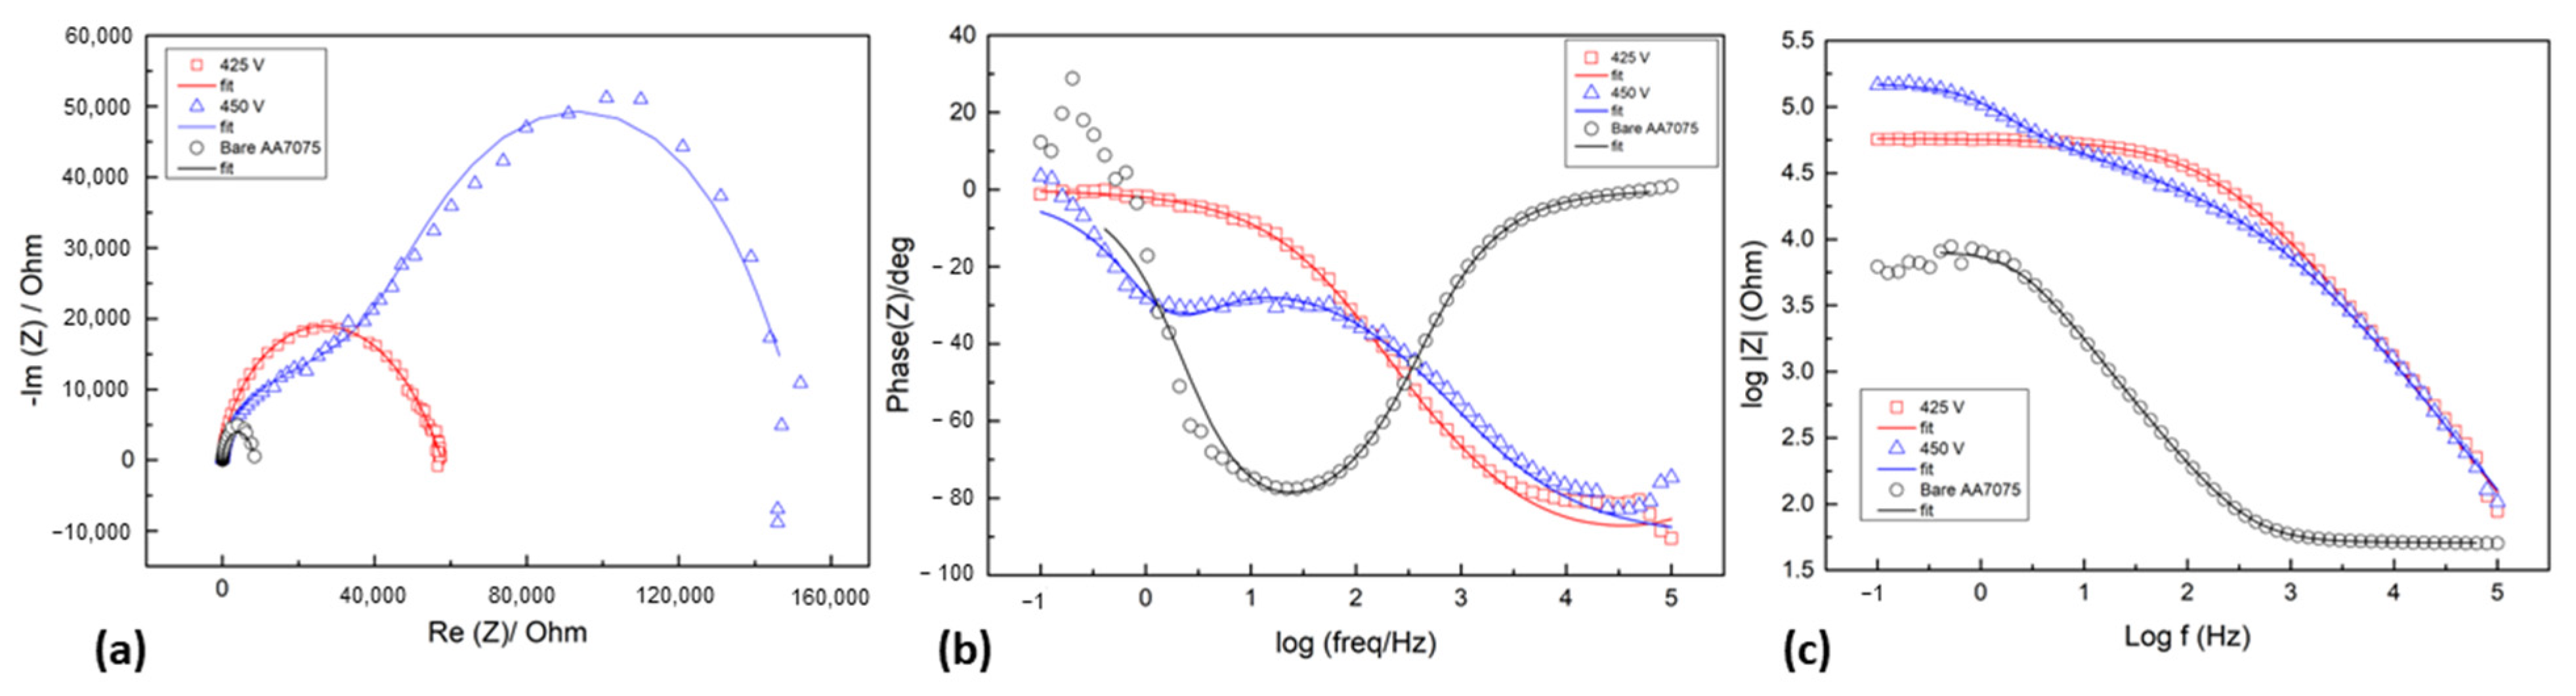
3.3. Corrosion Behavior of PEO-Coated AA7075
3.4. Oxide Growth Mechanism
4. Conclusions
Author Contributions
Funding
Institutional Review Board Statement
Informed Consent Statement
Data Availability Statement
Acknowledgments
Conflicts of Interest
References
- Raj, R.J.; Selvam, P.; Pughalendi, M. A review of aluminum alloys in aircraft and aerospace industry. J. Huazhong Univ. Sci. Technol. 2021, 1671, 4512. [Google Scholar]
- Megson, T.H.G. Introduction to Aircraft Structural Analysis; Elsevier: Amsterdam, The Netherlands, 2010; Volume 3, pp. 349–371. [Google Scholar]
- Yang, H.; Dong, Y.; Li, X.; He, W.; Liu, Y.; Mu, X.; Zhao, Y.; Wang, X.; Yang, F.; Fu, W.; et al. Enhancing tribological performance of AA3003 aluminum alloy via adjusting surface wettability: Synergistic effects of chemical etching and modification. Colloids Surf. A Physicochem. Eng. Asp. 2024, 696, 134330. [Google Scholar] [CrossRef]
- Peng, Z.; Xu, H.; Liu, S.; Qi, Y.; Liang, J. Wear and corrosion resistance of plasma electrolytic oxidation coatings on 6061 Al alloy in electrolytes with aluminate and phosphate. Materials 2021, 14, 4037. [Google Scholar] [CrossRef]
- Famiyeh, L.; Huang, X. Plasma electrolytic oxidation coatings on aluminum alloys: Microstructures, properties, and applications. Mod. Concepts Mater. Sci. 2019, 2, 000526. [Google Scholar]
- Walsh, F.C.; Low, C.T.J.; Wood, R.J.K.; Stevens, K.T.; Archer, J.; Poeton, A.R.; Ryder, A. Plasma electrolytic oxidation (PEO) for production of anodised coatings on lightweight metal (Al, Mg, Ti) alloys. Trans. IMF 2009, 87, 122–135. [Google Scholar] [CrossRef]
- Hryniewicz, T. Plasma electrolytic oxidation of metals and alloys. Metals 2018, 8, 1058. [Google Scholar] [CrossRef]
- Rahimi, S.; Khiabani, A.B.; Yarmand, B.; Kolahi, A. Comparison of corrosion and antibacterial properties of Al alloy treated by plasma electrolytic oxidation and anodizing methods. Mater. Today Proc. 2018, 5.7, 15667–15676. [Google Scholar] [CrossRef]
- Fernández-López, P.; Alves, S.A.; San-Jose, J.T.; Gutierrez-Berasategui, E.; Bayón, R. Plasma Electrolytic Oxidation (PEO) as a Promising Technology for the Development of High-Performance Coatings on Cast Al-Si Alloys: A Review. Coatings 2024, 14, 217. [Google Scholar] [CrossRef]
- Dzhurinskiy, D.V.; Dautov, S.S.; Shornikov, P.G.; Akhatov, I.S. Surface modification of aluminum 6061-O alloy by plasma electrolytic oxidation to improve corrosion resistance properties. Coatings 2020, 11, 4. [Google Scholar] [CrossRef]
- Keronite. What Impact Do Light Alloy Coatings Have on the Environment? Keronite Blog. Available online: https://blog.keronite.com/what-impact-do-light-alloy-coatings-have-on-the-environment (accessed on 3 September 2024).
- Sikdar, S.; Menezes, P.V.; Maccione, R.; Jacob, T.; Menezes, P.L. Plasma electrolytic oxidation (PEO) process—Processing, properties, and applications. Nanomaterials 2021, 11, 1375. [Google Scholar] [CrossRef] [PubMed]
- Hermanns, P.; Boeddeker, S.; Bracht, V.; Bibinov, N.; Grundmeier, G.; Awakowicz, P. Investigation of the frequency dependent spatio-temporal dynamics and controllability of microdischarges in unipolar pulsed plasma electrolytic oxidation. J. Phys. D Appl. Phys. 2020, 54, 045205. [Google Scholar] [CrossRef]
- Tsai, D.S.; Chou, C.C. Influences of growth species and inclusions on the current–voltage behavior of plasma electrolytic oxidation: A review. Coatings 2021, 11, 270. [Google Scholar] [CrossRef]
- Zhu, M.; Song, Y.; Dong, K.; Shan, D.; Han, E.H. Correlation between the transient variation in positive/negative pulse voltages and the growth of PEO coating on 7075 aluminum alloy. Electrochim. Acta 2022, 411, 140056. [Google Scholar] [CrossRef]
- Melhem, A.; Henrion, G.; Czerwiec, T.; Briançon, J.L.; Duchanoy, T.; Brochard, F.; Belmonte, T. Changes induced by process parameters in oxide layers grown by the PEO process on Al alloys. Surf. Coat. Technol. 2011, 205, S133–S136. [Google Scholar] [CrossRef]
- Rogov, A.B.; Nemcova, A.; Hashimoto, T.; Matthews, A.; Yerokhin, A. Analysis of electrical response, gas evolution and coating morphology during transition to soft sparking PEO of Al. Surf. Coat. Technol. 2022, 442, 128142. [Google Scholar] [CrossRef]
- Yerokhin, A.L.; Shatrov, A.; Samsonov, V.; Shashkov, P.; Pilkington, A.; Leyland, A.; Matthews, A. Oxide ceramic coatings on aluminum alloys produced by a pulsed bipolar plasma electrolytic oxidation process. Surf. Coat. 2005, 199, 150–157. [Google Scholar] [CrossRef]
- Shahzamani, S.; Ashrafi, A.; Toroghinejad, M.R.; Dehnavi, V.; Hakimizad, A. The use of low duty cycle pulsed-unipolar current mode for producing Alumina/ZnO nanocomposite coatings via plasma electrolytic oxidation process. Mater. Res. Express 2019, 6, 076555. [Google Scholar] [CrossRef]
- Dehnavi, V.; Liu, X.Y.; Luan, B.L.; Shoesmith, D.W.; Rohani, S. Phase transformation in plasma electrolytic oxidation coatings on 6061 aluminum alloy. Surf. Coat. 2014, 251, 106–114. [Google Scholar] [CrossRef]
- Vakili-Azghandi, M.; Fattah-Alhosseini, A. Effects of duty cycle, current frequency, and current density on corrosion behavior of the plasma electrolytic oxidation coatings on 6061 Al alloy in artificial seawater. Metall. Mater. Trans. A 2017, 48, 4681–4692. [Google Scholar] [CrossRef]
- Arunnellaiappan, T.; Babu, N.K.; Krishna, L.R.; Rameshbabu, N. Influence of frequency and duty cycle on microstructure of plasma electrolytic oxidized AA7075 and the correlation to its corrosion behavior. Surf. Coat. Technol. 2015, 280, 136–147. [Google Scholar] [CrossRef]
- Mengesha, G.A.; Chu, J.P.; Lou, B.S.; Lee, J.W. Effects of processing parameters on the corrosion performance of plasma electrolytic oxidation grown oxide on commercially pure aluminum. Metals 2020, 10, 394. [Google Scholar] [CrossRef]
- Chen, H.; Lv, G.-H.; Zhang, G.-L.; Pang, H.; Wang, X.-Q.; Zhang, Y.-W.; Lee, H.-J.; Yang, S.-Z. Effect of the pulse duty cycle on characteristics of plasma electrolytic oxidation coatings formed on AZ31 magnesium alloy. Chin. Phys. Lett. 2009, 26, 096802. [Google Scholar] [CrossRef]
- Liu, R.; Wu, J.; Xue, W.; Qu, Y.; Yang, C.; Wang, B.; Wu, X. Discharge behaviors during plasma electrolytic oxidation on aluminum alloy. Mater. Chem. Phys. 2014, 148, 284–292. [Google Scholar] [CrossRef]
- Dehnavi, V. Surface Modification of Aluminum Alloys by Plasma Electrolytic Oxidation. Ph.D. Thesis, The University of Western Ontario (Canada), London, ON, Canada, 2014. [Google Scholar]
- Pillai, A.; Rajendra, M.A.; Sharma, A.K. Influence of process parameters on growth behaviour and properties of coatings obtained by plasma electrolytic oxidation (PEO) on AA 6061. J. Appl. Electrochem. 2018, 48, 543–557. [Google Scholar] [CrossRef]
- Nadaraia, K.V.; Suchkov, S.N.; Imshinetskiy, I.M.; Mashtalyar, D.V.; Sinebrykhov, S.L.; Gnedenkov, S.V. Some new aspects of the study of dependence of properties of PEO coatings on the parameters of current in potentiodynamic mode. Surf. Coat. 2021, 426, 127744. [Google Scholar] [CrossRef]
- Wang, K.; Koo, B.H.; Lee, C.G.; Kim, Y.J.; Lee, S.; Byon, E. Effects of hybrid voltages on oxide formation on 6061 Al-alloys during plasma electrolytic oxidation. Chin. J. 2009, 22, 564–568. [Google Scholar] [CrossRef]
- Vakili-Azghandi, M.; Fattah-alhosseini, A.; Keshavarz, M.K. Optimizing the electrolyte chemistry parameters of PEO coating on 6061 Al alloy by corrosion rate measurement: Response surface methodology. Measurement 2018, 124, 252–259. [Google Scholar] [CrossRef]
- Fattah-Alhosseini, A.; Molaei, M.; Babaei, K. The effects of nano-and micro-particles on properties of plasma electrolytic oxidation (PEO) coatings applied on titanium substrates: A review. Surf. Interface Anal. 2020, 21, 100659. [Google Scholar] [CrossRef]
- Loghman, Z.M.; Fattah-Alhosseini, A.; Gashti, S.O. Corrosion Behavior of PEO Coatings on 6061 Al Alloy: Effect of Sodium Fluoride Addition to Aluminate based Electrolyte. Anal. Bioanal. Electrochem. 2019, 11, 8. [Google Scholar]
- Tavares, M.D.M.; Vitoriano, J.D.O.; da Silva, R.C.; Franco, A.R.; de Souza, G.B.; da Costa, J.A.P.; Alves-Junior, C. Effect of duty cycle and treatment time on electrolytic plasma oxidation of commercially pure Al samples. J. Mater. Res. Technol. 2019, 8, 2141–2147. [Google Scholar] [CrossRef]
- Ghorbanian, B.; Tajally, M.; Khoie, S.M.M.; Tavakoli, H. Formation mechanism of Al2O3/MoS2 nanocomposite coating by plasma electrolytic oxidation (PEO). Plasma Sci. Technol. 2020, 22, 065503. [Google Scholar] [CrossRef]
- Sowa, M.; Olesiński, A.; Szumski, B.; Maciej, A.; Bik, M.; Jeleń, P.; Sitarz, M.; Simka, W. Electrochemical characterization of anti-corrosion coatings formed on 6061 aluminum alloy by plasma electrolytic oxidation in the corrosion inhibitor-enriched aqueous solutions. Electrochim. Acta 2022, 424, 40652. [Google Scholar] [CrossRef]
- Lucas, R.R.; Sales-Contini, R.C.; da Silva, F.J.; Botelho, E.C.; Mota, R.P. Plasma electrolytic oxidation (PEO): An alternative to conventional anodization process. AIMS Mater. Sci. 2024, 11, 684–711. [Google Scholar] [CrossRef]
- Moga, S.G.; Negrea, D.A.; Ducu, C.M.; Malinovschi, V.; Schiopu, A.G.; Coaca, E.; Patrascu, I. The Influence of Processing Time on Morphology, Structure and Functional Properties of PEO Coatings on AZ63 Magnesium Alloy. Appl. Sci. 2022, 12, 12848. [Google Scholar] [CrossRef]
- Sharma, A.; Jang, Y.J.; Jung, J.P. Effect of KOH to Na2SiO3 ratio on microstructure and hardness of plasma electrolytic oxidation coatings on AA 6061 alloy. J. Mater. Eng. Perform. 2017, 26, 5032–5042. [Google Scholar] [CrossRef]


| Na2SiO3:KOH (g/L) | Conductivity (mS/cm) | pH | Viscosity (cP) | |||
|---|---|---|---|---|---|---|
| 25 °C | 40 °C | 25 °C | 40 °C | 25 °C | 40 °C | |
| 3:2 | 13.26 | 14.21 | 12.63 | 12.23 | 5.39 | 4.90 |
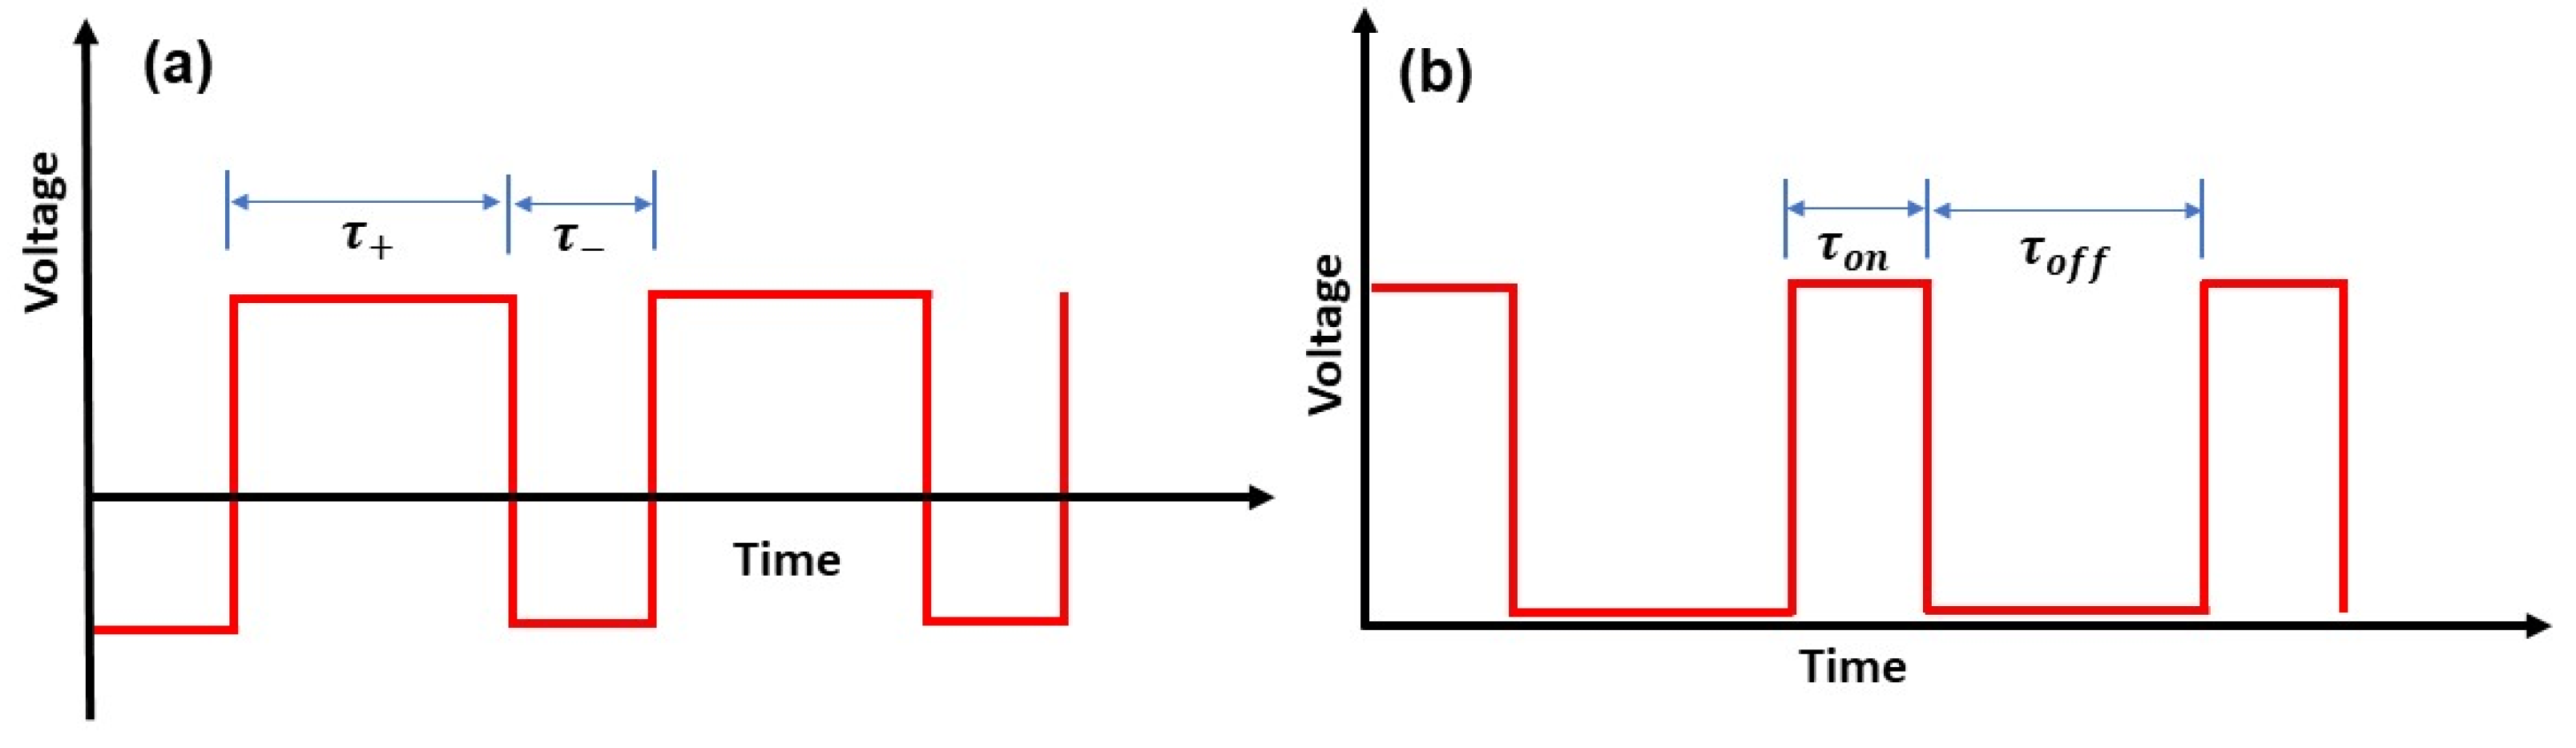
| Sample Code | Voltage (V) | Frequency (Hz) | Duty Cycle (%) | Ton (ms) | Toff (ms) |
|---|---|---|---|---|---|
| HC425 | 425 | 1000 | 80 | 0.8 | 0.2 |
| HC450 | 450 |
| wt% | Al | O | Si | Mg | Na |
|---|---|---|---|---|---|
| HC425 | 46.55 | 44.74 | 6.2 | 1.5 | 1.1 |
| HC450 | 41.15 | 45.31 | 10.9 | 1.56 | 1.04 |
| Sample | Ecorr (V) | icorr (µA/cm2) |
|---|---|---|
| Bare AA7075 | −1.121 ± 0.015 | 30.99 ± 8.69 |
| HC425 | −0.826 ± 0.026 | 0.82 ± 0.59 |
| HC450 | −0.744 ± 0.004 | 0.19 ± 0.16 s |
| Specimen | Rs/Area (Ω/cm2) | Q1 (F.s(a − 1)/ cm2) | a1 | R1/Area (Ω/cm2) | Q2 (F.s(a − 1)/ cm2) | a2 | R2/Area (Ω/cm2) | Q3 (F.s(a − 1)/cm2) | a3 | R3/Area (Ω/cm2) | X2/|Z| |
|---|---|---|---|---|---|---|---|---|---|---|---|
| Bare 7075 | 18.93 ± 0.24 | 1.52 × 10⁻⁵ ± 1.6 × 10⁻⁸ | 0.955 | 5.76 × 10³ ± 4.9 × 10⁻¹ | - | - | - | - | - | - | 0.405 |
| 425 V | 33.96 ± 0.54 | 8.80 × 10⁻⁷ ± 1.27 × 10⁻⁷ | 0.4136 | 6.06 × 10⁴ ± 4.38 × 10³ | 2.25 × 10⁻⁸ ± 1.15 × 10⁻⁹ | 0.9652 | 1.25 × 10² ± 4.38 × 100 | - | - | - | 0.030 |
| 450 V | 26.33 ± 0.27 | 2.79 × 10⁻⁸ ± 2.42 × 10⁻¹⁰ | 0.9581 | 1.57 × 10⁴ ± 7.19 × 101 | 2.26 × 10⁻⁶ ± 1.37 × 10⁻⁹ | 0.9505 | 1.26 × 10⁵ ± 5.65 × 101 | 9.18 × 10⁻⁷ ± 4.02 × 10⁻⁹ | 0.6782 | 4.66 × 10⁴ ± 1.23 × 10² | 0.320 |
Disclaimer/Publisher’s Note: The statements, opinions and data contained in all publications are solely those of the individual author(s) and contributor(s) and not of MDPI and/or the editor(s). MDPI and/or the editor(s) disclaim responsibility for any injury to people or property resulting from any ideas, methods, instructions or products referred to in the content. |
© 2024 by the authors. Licensee MDPI, Basel, Switzerland. This article is an open access article distributed under the terms and conditions of the Creative Commons Attribution (CC BY) license (https://creativecommons.org/licenses/by/4.0/).
Share and Cite
Orgen, S.B.; Dela Pena, E.M.B. Microstructure and Corrosion Behavior of PEO-Coated AA7075 Under Pulsed Unipolar Potential Control Mode. Coatings 2024, 14, 1498. https://doi.org/10.3390/coatings14121498
Orgen SB, Dela Pena EMB. Microstructure and Corrosion Behavior of PEO-Coated AA7075 Under Pulsed Unipolar Potential Control Mode. Coatings. 2024; 14(12):1498. https://doi.org/10.3390/coatings14121498
Chicago/Turabian StyleOrgen, Salvacion B., and Eden May B. Dela Pena. 2024. "Microstructure and Corrosion Behavior of PEO-Coated AA7075 Under Pulsed Unipolar Potential Control Mode" Coatings 14, no. 12: 1498. https://doi.org/10.3390/coatings14121498
APA StyleOrgen, S. B., & Dela Pena, E. M. B. (2024). Microstructure and Corrosion Behavior of PEO-Coated AA7075 Under Pulsed Unipolar Potential Control Mode. Coatings, 14(12), 1498. https://doi.org/10.3390/coatings14121498