Article

SEM-Guided Finite Element Simulation of Thermal Stresses in Multilayered Suspension Plasma-Sprayed TBCs

1
Centre for Manufacturing and Materials, Coventry University, Coventry CV1 5FB, UK
2
Mechanical Engineering Department, Southern Methodist University, Dallas, TX 75205, USA
3
Thermal Spray Innovations, 5662 Salzburg, Austria
4
CN Technical Services Ltd., Wisbech PE13 2XQ, UK
5
School of Mechanical Engineering, University of Leeds, Leeds LS2 9JT, UK
*
Author to whom correspondence should be addressed.
Coatings 2024, 14(1), 123; https://doi.org/10.3390/coatings14010123
Submission received: 8 December 2023 / Revised: 12 January 2024 / Accepted: 15 January 2024 / Published: 17 January 2024

Abstract

:
This study presents novel insights into thermal stress development and crack propagation mechanisms in single- and multilayered suspension plasma-sprayed (SPS) coatings of gadolinium zirconate (GZ) and yttria-stabilized zirconia (YSZ), thermally treated at 1150 °C. By combining image processing with finite element simulation, we pinpointed sites of high-stress concentration in the coatings, leading to specific cracking patterns. Our findings reveal a dynamic shift in the location of stress concentration from intercolumnar gaps to pores near the top coat/thermally grown oxide (TGO) interface with TGO thickening at elevated temperatures, promoting horizontal crack development across the ceramic layers. Significantly, the interface between the ceramic layer and TGO was found to be a critical area, experiencing the highest levels of both normal and shear stresses. These stresses influence failure modes: in double-layer SPS structures, relatively higher shear stresses can result in mode II failure, while in single-layer systems, the predominant normal stresses tend to cause mode I failure. Understanding stress behavior and failure mechanisms is essential for enhancing the durability of thermal barrier coatings (TBCs) in high-temperature applications. Therefore, by controlling the interfaces’ roughness along with improving interfacial toughness, the initiation and propagation of cracks can be delayed along these interfaces. Moreover, efforts to optimize the level of microstructural discontinuities, such as intercolumnar gaps and pores, within the creaming layer and close to the TGO interface should be undertaken to reduce crack formation in the TBC system.

1. Introduction

Thermal barrier coatings (TBCs) are extensively exploited in the thermal protection systems of aero-gas turbine engines and industrial components, owing to their favorable characteristics including low thermal conductivity, high thermal resistivity, oxidation, and corrosion resistance. TBC systems achieve temperature reduction at the substrate surface, thereby increasing the working temperature limits of the underlying material. For instance, a temperature reduction of up to 300 °C can be attained with TBCs and internal cooling systems in gas turbine engines [1]. Hence, the operating temperature limits of turbine engines can be extended, resulting in higher performance and better energy efficiency [1,2]. In such engineering applications, the TBC system is exposed to severe environmental and thermomechanical loading conditions (e.g., corrosion, wear, thermal cycling, thermal gradient, fatigue damage) during the in-service working conditions [3]. Subsequently, the TBC system may be subjected to internal cracks and interfacial fractures due to high thermal stresses under these severe working conditions [4,5].
A TBC system conventionally comprises two layers: a top ceramic coating (TC) is usually yttria-stabilized zirconia (YSZ), and a metallic bond coating (BC) is normally a metallic alloy based on MCrAlY (M is Ni, Co, or both). Additionally, a very thin scale named thermally grown oxide (TGO) is formed and grows gradually along the TC/BC interface at high temperatures due to oxidation of the metallic BC [1,6]. The continuous demands for increasing the efficiency and performance of gas turbines engines by extending the working temperature limit (>1200 °C) have revealed certain issues associated with YSZ-TBC that need to be addressed, including a high sintering rate, the loss of phase stability, hot corrosion, and calcia–magnesia–alumina–silicate (CMAS) attack [7,8,9]. As a promising alternative to YSZ, gadolinium zirconate (GZ, Gd2Zr2O7) is characterized by a lower sintering rate and thermal conductivity and better phase stability and resistance to CMAS attack [10,11]. However, GZ also has unfavorable characteristics that can affect its service lifetime such as a relatively lower fracture toughness compared with YSZ and a low thermal expansion coefficient (CTE), which results in increased thermal stresses owing to differences in the CTE within the TBC system [2,12]. Therefore, a multilayer TBC structure containing GZ and YSZ is a valid approach to mitigate those weaknesses and improve the overall performance of the TBC system [11,12,13].
Suspension plasma spraying (SPS) is considered a relatively new deposition technique that can develop TBC in columnar structures. The SPS columnar structure is characterized by intercolumnar gaps that can tolerate thermal expansion mismatch between the TBC layers resulting in reduced thermal stress, along with porosity and microcracks features contributing to lower thermal conductivity. However, the durability of SPS TBCs under varying thermal loadings is still an issue as its porous microstructure is prone to detrimental cracking [14]. Furthermore, the growth of the TGO layer during thermal exposure beyond a critical value leads to spallation and fracture of the TBC system, as pointed out by Evans et al. [15]. In our previously conducted investigation on the cracking behavior of multilayer SPS TBCs comprising GZ and YSZ layers, two types of cracking behavior were detected [16]. The multilayer TBC structure was exposed to thermal loading of 1150 °C for different durations. The ex situ experimental observations showed different cracking behavior including the development of horizontal cracks within the ceramic layer after a 10 h thermal treatment duration, while horizontal cracks appeared within the TC layer along with cracking at the TGO/YSZ interface after a 100 h duration, see Figure 1a,b [16]. The former cracking behavior can be related to stresses developed through thermal expansion mismatch, while the latter is due to the increase in TGO thickness beyond a critical value. However, the ex situ observations cannot give deep insight into the possible locations of crack initiations (e.g., intercolumnar gaps, porosity within the columnar structure, or rough interfaces). Furthermore, the thermal stress levels can be developed in single- and multilayer TBCs. Seeking a better understanding of the cracking behavior of single- and double-layer SPS TBCs, finite element analysis (FEA) has been used to study the thermal stress development in SPS coatings.
The initiation and propagation of internal cracks in TBC systems, especially in the ceramic brittle TC, is one of the major failure mechanisms of TBCs [14,16,17]. Typically, the TBC system can experience three cracking modes (i.e., horizontal, vertical, and interfacial cracks) due to the developed stress fields during the attained thermal loading procedures (e.g., thermal cycling). Horizontal cracks develop within the ceramic layers of the TBC system and contribute to coating spallation [16,18]. The propagation of these cracks is influenced by normal stresses (S22) in the Y-direction, perpendicular to the general orientation of the interface between the TC and the TGO, whereas vertical cracks can arise within the TBC system as a result of normal stress (S11) accumulated in the X-direction, aligned parallel to the TC/TGO interface [14,19]. Interfacial cracks are more likely to be developed along TBC interfaces (e.g., TC/TGO and BC/TGO interfaces) because of shear stresses (S12), which promote mode II-dominated fracture, while normal stress (S22) can contribute to a mode I-dominated fracture along the TBC interfaces. Hence, shear stress (S12) and normal stress (S22) along the interfaces can be considered to be the driving forces of interfacial cracking based on the shear failure and separation failure modes, respectively [19,20].
As mentioned above, the microstructure of the TBC itself contains many defects such as pores, microcracks, and intercolumnar gaps along with rough interfaces (e.g., TGO/TC and TGO/BC interfaces) are considered preferable crack nucleation sites. Therefore, it is crucial to study the thermal stress distribution in the vicinity of such microstructural defects to better understand TBC’s failure mechanisms. For instance, FEA procedures were used to study the influence of predefined geometrical shapes for the pore and splat microstructural features on the failure of TBC by Ming et al. [21]. They found that the presence of pores affects the thermal stress distribution near the BC/TC interface as well as the plastic deformation behavior of TBCs. Experimental and numerical investigations have shown that the TGO growth along with the imperfections and pores near the TGO/TC interface in atmospheric plasma spray (APS) TBC directly affects the development of microcracks [6,18]. Furthermore, numerical simulation investigations have revealed that the rough interface features (e.g., peaks and valleys) of TC/TGO or TGO/BC can introduce high-stress concentration regions due to the abrupt changes in interface’ morphology. Furthermore, thermal expansion mismatch between layers in the TBC system is considered a key reason for the variation in stress values along the sides of the interface, which can lead to interfacial delamination [20,22,23].
The real morphology of the porosity and rough interfaces in the TBC system has been considered one of the most challenging problems in finite element simulation. For instance, FE models have been developed with an idealized sinusoidal interface with and without predefined existing cracks to study the effect of geometry and stress distribution within the TBC system under thermal loading [24,25,26]. Krishnasamy et al. [27,28] developed a MATLAB code to generate artificial pore and splat features with varied morphology and orientation to numerically investigate the influence of such features on the fracture behavior of TBCs using FEA involving cohesive elements. It was observed that the existence of pores has a beneficial effect on the failure behavior of TBCs up to a certain volume fraction, then it becomes detrimental. The presence of pores has a positive influence on fracture behavior up to a certain level, beyond which the pores adversely affect the overall performance. Moridi et al. [29] conducted FE analysis on a TBC system and showed that the amplitude and wavelength of interface waves have a substantial role in the development of stress fields in TBC layers. Image processing techniques have enabled the possibility to import the real geometric characteristics of TBC microstructures, as captured with imaging techniques like secondary electron microscopy (SEM), into the FE software environment [18,19,20]. For instance, Arai et al. [30] and Kulczyk-Malecka et al. [31] utilized an SEM image-based finite element approach to study the effect of porosity on heat flux and thermal conductivity distribution in the TBC system. Image processing techniques coupled with FE procedures were used by Zhu et al. [20] to show that horizontal cracks tend to propagate through the TC during the cooling stage, while an interface crack initiates at the points located in the middle region and then propagates in two side directions simultaneously. Mohammadi et al. [32] numerically studied the delamination of the TC/TGO real interface based on an SEM image and showed that increasing the thermal loading duration leads to enlarged interface separation. The stress distribution and stress concentration zones in the APS TBC system due to the presence of pores were investigated using SEM image-based modeling, which revealed that pores have a direct impact on the stress distribution and can act as stress concentration locations for crack initiation [33,34].
Considering the real morphology of TBC microstructural features (e.g., pores, microcrack rough interfaces) and monitoring the thermal stress fields associated with such features in the TBC multilayer system are crucial to gaining more understanding of the cracking behavior of TBC. Thus, SEM image-based FE analysis is a reliable way to make this happen. The existing literature mostly focuses on FE studies related to the APS TBC system [18,19,20,28,32], with only limited research attention directed toward SPS coatings [14,35]. Furthermore, the majority of FE models used to simulate the thermomechanical and fracture behavior of TBCs have typically assumed idealized, simplified interfaces (e.g., sinusoidal or semi-circular shapes) between TBC layers [14,24,25,26]. While some researchers have disregarded the influence of pores within the TBC system [26,36], only a limited number of investigators have considered the microstructure of pores with basic geometrical shapes (such as circles, ellipses, rectangles, etc.) [21,27,28]. These latter studies have demonstrated that incorporating pores enables more accurate tracking of crack initiation and propagation, closely representing the actual behavior in TBCs. Accordingly, a better understanding of the various failure mechanisms associated with TBCs can be attained. Hence, the current work aims to study the thermal stress distribution in single- and double-layer SPS TBC systems comprising GZ and YSZ layers by developing an SEM image-based finite element simulation to model the real morphology of the SPS columnar structure. A MATLAB code was developed to perform image processing analysis on SEM images and transform the real geometry of the SPS microstructure into an FE model. Subsequently, a coupled temperature–displacement analysis was conducted using Abaqus 2022 software to study the thermal stress fields within single- and double-layer SPS coatings.

2. Finite Element Model

To develop an accurate FE geometrical model of the multilayer TBC system, an SEM image should go through several image processing steps to convert the cross-sectional image into a compatible CAD geometry that can be imported into FE software. Hence, a MATLAB code was written based on an image processing technique to enhance the quality of the image (i.e., reducing noise and sharpening fine details) and to extract meaningful information (i.e., real morphology of intercolumnar gaps, pores, and interfaces). Furthermore, to ensure the accuracy of the FE model, other factors such as material data (e.g., thermal expansion coefficient, Young’s modulus, thermal conductivity, etc.) and material models (e.g., creep model) that best represent the behavior of the system along with boundary conditions and meshing should be considered. This section introduces the geometry extraction procedures, used material data, and imposed thermal and mechanical boundary conditions. Coupled temperature–displacement analysis is considered in this work to study thermal stress development. The commercial FE software Abaqus is used in this investigation.

2.1. Geometry Preparation

This section introduces the steps followed to obtain a high-quality SEM image and the followed procedures to transfer this SEM image into a representative CAD model that can be implemented in Abaqus FE software. Initially, the coating sample was cross-sectioned using a SiC cutting wheel on a Struers secotom-50 machine at a relatively slow feed speed (0.07 mm/s) to avoid damage to the coating during the sectioning process. The cross-sectioned sample was mirror polished down to 50 nm using a colloidal silica polishing suspension on Buehler AutoMet™ 300 (Lake Bluff, IL, USA). Subsequently, the mirror-finished TBC sample was carbon sputtered (Quorum Q150T ES, Lewes, UK) to reduce charging during SEM analysis. Then, a cross-sectional SEM image of the as-deposited double-layer SPS TBC (comprising GZ and YSZ layers) was captured with a field emission FEG-SEM (Zeiss Sigma 500 VP, Oberkochen, Germany) using backscattered electron (BSE) mode. As the multilayer SPS coating comprises various layers of different materials, the BSE imaging mode was utilized to capture a compositional contrast image that would be beneficial in the subsequent image processing analysis. The SEM scanning parameters used were an acceleration voltage of 20 KeV, a working distance of approximately 5 mm, an aperture size of 30 µm, and a magnification of 200×. The SEM image for the cross-section of the double-layer SPS specimen is shown in Figure 2a. To perform the image processing analysis, the SEM image was called with MATLAB R2022a software, and a series of low-pass and high-pass filters were used to improve the image quality (e.g., reduce noise and faint artifacts) and emphasize fine details for better edge detection, respectively. For instance, low-pass filters such as the median filter and bilateral filtering were applied to reduce the noise and artifacts in the recorded SEM image, while a sharpening high-pass filter was used to retain high-frequency information and emphasize fine details. Subsequently, the Canny edge detection algorithm was used to extract the borders of the coating’s microstructural features. It is worth highlighting that the type of filter and the order of using it can differ depending on the quality of the image. An SEM image can be described as a two-dimensional function f(x, y), where x and y represent spatial (plane) coordinates, and the value of f at any given pair of coordinates is referred to as the image’s intensity (grey level) at that location [37]. An SEM image can be converted into a binary image with m × n pixels that can be specified as a matrix F and defined as follows [37]:
F = f ( 0 , 0 ) f ( 0 , 1 ) f ( 0 , n 1 ) f ( 1 , 0 ) f ( 1 , 1 ) f ( 1 , n 1 ) f ( m 1 , 0 ) f ( m 1 , 1 ) f ( m 1 , n 1 )
Such that each matrix element f(x, y) can be defined as:
f ( x , y ) = 0   ( with   a   pore )   1   ( without   a   pore )   0 x ( m 1 ) , 0 y ( n 1 )
In the original image, a single pore comprises numerous pixels with a value of “0”. Consequently, the percentage of pores within a structure can be determined using the following equation:
ϕ = f x , y = 0 m × n
Using Equations (1)–(3), the porosity level in the GZ and YSZ ceramic layers was determined to be 7.25% and 6.64%, respectively.
Figure 2. Image processing of a double-layered SPS TBC sample: (a) BSE cross-sectional image, (b) stages of image processing for detecting the real morphology of intercolumnar gaps, pores, and interfaces, and (c) final geometrical edge detection of TBC overlaid onto the SEM image for comparison purposes.
Coatings 14 00123 g002
To accurately extract the intercolumnar gaps and pore structure in the double-layer TBC structure, a threshold value should be specified appropriately. The microstructural discontinuity (i.e., intercolumnar gaps and pores) can be distinguished geometrically based on their aspect ratio (the length ratio between the minor axis and the major axis of an ellipse, which comprises such microstructural discontinuity). For instance, each microstructural discontinuity that has an aspect ratio lower than 0.3 is assumed to be an intercolumnar gap (refer to Figure 2b), while pores can be recognized as a discontinuity that has an aspect ratio greater than or equal to 0.3. The double-layer microstructure comprises two distinctive regions (i.e., GZ and YSZ) characterized by different grey intensity levels, thereby two threshold values should be defined. As can be seen in Figure 2b, the developed MATLAB code enabled the extraction of the required microstructural features for the double-layer SPS coating throughout three stages:
  • To reduce the image noise, a 2-D median filtering was applied to the SEM image. Subsequently, the gray intensity image was converted into a binary image by applying a threshold level using Otsu’s method [38] to differentiate intercolumnar gaps and pores in the GZ layer. Otsu’s method computes a global threshold value from the processed grayscale image. After that, the Canny edge detection algorithm was used to extract the boundaries of these microstructural features. The Canny method uses two thresholds that need to be specified to detect strong and weak edges. These threshold values are specified in such a way that best extracts the boundaries of the geometric features with a visual comparison between processed and original images. The specified lower and upper threshold values were 0.01 and 0.1, respectively. The Canny method is less affected by noise with more capability to detect weak edges [37].
  • A second threshold value was specified (i.e., 0.15) to convert the SEM grayscale image into a black–white image (i.e., binary representation) that only distinguishes the pores feature in the YSZ segment, followed by the edge detection step. The Canny edge detection method was again used by defining upper and lower threshold values, which were 0.1 and 0.01, respectively. These values were selected to achieve the best edge detection, by overlaying the output of the edge detection step onto the SEM image for comparison and accuracy-justifying purposes.
  • To properly extract the GZ/YSZ and YSZ/BC interfaces, a series of low-pass filters (e.g., median filter, bilateral filtering, etc.) were first used to reduce noise signals and artifacts, aiming to enhance the overall image quality and permitting only the detection of meaningful features (i.e., interfaces). Again, the type, number, and sequence of filters applied can differ based on the image quality and the complexity of identified features. Subsequently, a 3 by 3 kernel for a high pass filter was utilized to sharpen and emphasize the fine details (interface morphology) in the image followed by using the Canny method to detect the real interface morphology. The Canny threshold values used were 0.1 and 0.01 for the upper and lower levels, respectively.
Figure 2c illustrates the cumulative geometric information, as discussed in the previous section, generated with MATLAB software for the microstructure of SPS coatings. This detection was superimposed onto the original SEM image to evaluate the conducted image processing. It is worth mentioning that any pores with boundaries overlapping with the interfaces (GZ/YSZ and YSZ/BC) were excluded to maintain perfect contact between the TBC layers and to easily control the TGO layer. Furthermore, the BC/substrate interface was represented as a flat surface in the conducted FE simulation. At this point, the extracted geometrical information represented in digital image format (i.e., bitmap) could not be imported into FE software. Therefore, Inkscape 1.2.1 software [39] was used to transform the bitmap image into vector format, creating a closed geometry of splines with the utilization of the image tracing technique [20,32,33]. The vectorized image for the double-layer SPS coating can subsequently be imported into any CAD software for conversion into a solid geometry, see Figure 3. The methodology outlined in this section for extracting geometric features from an SEM image is consistent with prior research practices [18,19,20,40]. The thicknesses of the GZ, YSZ, BC, and substrate layers are 0.225 mm, 0.04 mm, 0.1 mm, and 1.5 mm, respectively. It is worth highlighting that FE modeling of the TBC system requires large numbers of elements (strong mesh refinement) to accurately capture the fine geometrical details (e.g., pores and interfaces) and ensure the accuracy of the results [41]. Therefore, it is a common practice to use local or representative geometrical 2D models to simulate the TBC system, thereby reducing the compositional cost [19,20,40,41,42].
To model the influence of varying TGO thicknesses, the interface between the BC and the YSZ layer was offset by 3, 5, and 8 μm to form a TGO layer. Therefore, the uneven and dynamic growth of TGO (i.e., swilling) due to the induced oxidation in real service conditions was ignored in this research work due to computational difficulties [18,27,28]. Modeling the TGO growth or swilling may result in self-intersection of the TGO layer due to the geometrical irregularity of the interface. Moreover, this work focuses more on studying the thermal stresses developed in multilayer SPS TBC considering the presence of intercolumnar gaps, pores, and interfaces.
To study the thermal stress levels and their distribution in a single-layer SPS TBC system, the same geometrical model of the double-layer TBC was used. However, only the outermost ceramic layer (GZ layer in the double-layer model) was considered while excluding the geometrical representation of the YSZ layer to form a single-layer FE model, see Figure 3b,c. To study stress concentration and distribution in single-layer and double-layer structures while mitigating the effect of changing microstructure morphology, the geometrical features remained the same. Two FE models for the single-layer SPS TBC were considered by modeling the behavior of the TC ceramic layer using the thermomechanical properties of YSZ and GZ materials, Figure 3b,c. In the single-layer model, the lower surface of the ceramic layer was offset by 2, 5, and 8 μm to form the TGO layer. Therefore, the uneven and dynamic growth of the TGO layer was not modeled.

2.2. Material Properties

As previously mentioned, the double-layer SPS coating system comprises two ceramic layers, namely, gadolinium zirconate (GZ, Gd2Zr2O7) and 8 wt.% yttria-stabilized zirconia (8YSZ), which are plasma sprayed above a multiphase metallic alloy (bond coat, BC) consisting of NiCoCrAlY [16]. This entire SPS coating system is deposited on top of a substrate made of Hastelloy-X. As the system is exposed to elevated temperatures, a TGO layer composed of Al2O3 forms at the interface between the ceramic and BC layers due to the oxidation of the BC layer. All layers in the SPS TBC system are assumed to be isotropic and homogeneous materials. The substrate, BC, and the TGO are considered to behave as elastic-perfectly plastic materials, while the ceramic layers (GZ, YSZ) behave as linear elastic material [18,19,20]. To properly model the thermomechanical response of the TBC system under the applied thermal loading (i.e., 1150 °C), there is a need to define the thermal and mechanical properties (e.g., thermal expansion coefficient, elastic modulus, thermal conductivity, etc.) of each layer and at different temperatures. These temperature-dependent thermomechanical properties of TBC layers were obtained from the literature and are listed in Table 1. The thermomechanical properties of the TBC layers are challenging to measure, so the data were acquired from the literature, introducing a potential source of uncertainty into the obtained results. It is worth highlighting that the generation of thermal stresses in TBC structures is primarily caused by varying thermal expansion coefficients among the constituent layers and the temperature gradient across these layers [7]. The differences in thermal expansion coefficients (CTEs) give rise to the formation of an incompatible thermal strain field [7,19,43]. Hence, microcracks can be developed in the TBC system driven by these CTE mismatch stresses. These stresses are defined as [44]:
σ T B C = α Δ T E T B C / 1 v T B C
where α is the difference in the thermal mismatch between the coating and substrate layers, ΔT is the temperature difference, v T B C is the poisons ratio of the coating, and E T B C is the coating modulus of elasticity.
Creep is a material behavior that is both temperature and time-dependent and causes stress relaxation during the long-term thermal loading of TBCs at high temperatures [20,26]. For instance, RanjbarFar et al. [45] reported that creep influences the evolution of thermal stress during the TBC holding stage, while creep can be ignored at both the heating and cooling stages as their durations are shorter in comparison with the holding stage [26]. Furthermore, Chen et al. [46] suggested that plastic rather than creep behavior mainly affects stress development at the cooling stage. At the heating and holding stages, the stress magnitude in TBCs is smaller than its yield strength; thus, plastic yielding is only taken into account at the cooling stage, and the interaction of plastic yielding with creep is neglected. Additionally, Chen et al. [46] proposed that plastic behavior has a higher influence than creep on stress development during the cooling stage. In the current work, the Norton power law is used for creep behavior evaluation as follows [20]:
ε ˙ ¯ = A σ ¯ n
where ε ˙ ¯ is the critical strain rate, A is the creep rate coefficient, σ ¯ is the equivalent von Mises stress, and n is the Norton creep law exponent. Rösler et al. [47] investigated the influence of different creep rates on the stress states of TBC layers. For simplification, the mean value is used for the ceramic layers, TGO, and substrate whereas the creep rate coefficient for the BC is kept as a temperature-dependent value [17,18,19,20]. The material constant values for A and n are listed in Table 2. The TGO layer behavior is considered an elastic–viscoplastic material that experiences stress relaxation under constant thermal loading. The yield strength of the TGO linearly descends from 10 GPa at 925 °C to 1 GPa at 1125 °C [19,20].
Table 1. Temperature-dependent material properties of TBC layers and substrate.
Substrate [48]BC [22,49]TGO [20,22,49]YSZ [17,50,51]GZ [17,52]
Temperature range (T), °C20–100020–110020–110020–120020–1200
Young’s modulus (E), GPa205–148200–110400–320109–69109–69
Poisson’s ratio (ν)0.32–0.320.3–0.330.23–0.250.25–0.250.284–0.284
Thermal expansion coefficient (α × 10−6)/°C13.9–16.613.6–17.68–9.69–12.27.69–11.43
Thermal conductivity (k), W/(m·°C)9.2–26.75.8–1710–42.03–1.751.45–1.17
Density (ρ), kg/m382208100397850825936
Specific heat (Cp), J/(kg·°C)486–784501–764755–755469–649359–486
Yield Strength (σY), MPa376–43426–11410,000–1000
Table 2. Creep data for TBC layers [20].
MaterialA (S−1 MPa−n)nTemperature (°C)
GZ1.8 × 10−91
YSZ1.8 × 10−91
TGO7.3 × 10−91
BC6.54 × 10−194.57≤625
2.2 × 10−122.99725
2.15 × 10−82.45≥875
Substrate3.08 × 10−103

2.3. Thermo-Mechanical Boundary Conditions

In our previous investigation, which concerned studying the cracking behavior of single- and multilayer SPS coatings, the SPS samples were placed above a crucible brick inside a Lenton furnace (AWF 12/12, Hope Valley, UK) and subjected to isothermal heat treatment at 1150 °C [16]. Therefore, the free surface of the ceramic coating should be directly exposed to thermal loading, whereas the substrate’s rear side (in direct contact with the crucible’s surface) should be less affected by thermal waves due to the induced heat dissipation through conduction. Additionally, under in-service conditions, the TBC system experiences a hot gas flow on the coating side, while the substrate side is kept at lower temperatures using a cooling system [2], resulting in thermal stresses due to the temperature gradient. Therefore, for the present study, we assume that the lower surface temperature of the substrate is held at 950 °C, approximately 15% lower than the temperature of the coating’s free surface. The non-uniform temperature gradient between the upper surface of the ceramic layer and the lower surface of the substrate is considered a factor contributing to thermal stress development inside the TBC system. Additionally, thermal stresses are generated within TBCs during the cooling stage, owing to the mismatch in the thermal expansion coefficient between the TBC layers [14,19]. Based on experimental observation, horizontal cracks within the ceramic layer along with interfacial cracking at the TGO/TC interface were detected. As the present study aims to explore the stress distribution within this multilayer structure using a finite element approach based on SEM image analysis, the following thermal boundary conditions were applied in the developed FE model. The free surface of the SPS coating (i.e., TTop Surface) was heated to a temperature of 1150 °C in 60 s, maintained at 1150 °C for 3600 s, and then cooled to 25 °C in 300 s. At the same time, the lower surface of the substrate (i.e., TBottom Surface) was assumed to be exposed to a lower temperature of approximately 15%. Hence, the rear surface of the substrate was heated to 950 °C in 60 s, then held at 950 °C for 3600 s, and cooled to 25 °C in 300 s, as shown in Figure 4b.
As previously mentioned, it is a common practice to utilize local or representative 2D geometrical models for simulating the TBC system, thereby minimizing computational costs [14,17,40,41,42]. Thus, the following mechanical boundary conditions were applied. The left side boundary of the model was subjected to an x-symmetry constraint; hence, the horizontal displacement of all nodes along this boundary is restricted. The substrate’s bottom surface was allowed to move along the x-axis while being constrained in the y-direction. Moreover, it was assumed that all interfaces maintained a perfect bond using a tie constraint. To simulate material continuity on the right boundary of the model, a coupling constraint was applied to ensure that nodes on this boundary share the same displacement in the X-direction. Simultaneously, this constraint allows nodes along the right boundary to move freely in the Y-direction [14,18,19]. All thermomechanical boundary conditions are represented in Figure 4a.

2.4. Meshing Procedure and Element Type

The complexity of the geometrical features (e.g., pores, intercolumnar gaps, and interfaces) of the TBC structure requires a reduction in the element size to achieve stability and accuracy of the results. However, it is well known that reducing the element size leads to a significant increase in the run time. Therefore, to attain the accuracy of results and reduce the computational cost, mesh sensitivity analysis was carried out. To do this, the FE model was run using six different mesh sizes, as introduced in Table 3. The maximum stress in the Y-direction (S22) was chosen to assess mesh convergence. It was plotted against the reciprocal of the element size for visualization, see Figure 5. Reducing the minimum element size beyond 0.5 μm had no considerable effect on the analysis results (Figure 5). Hence, a minimum element size of 0.5 μm was used in the meshing procedure with a total number of 295,322 quadrilateral elements generated for the double-layer SPS TBC model. The eight-node plane strain thermally coupled biquadratic displacement bilinear temperature reduced integration element (CPE8RT) was used in this analysis. Quadratic shape functions enable a higher interpolation order of the displacement fields to attain a more precise distribution of the predicted stress.

2.5. Limitations and Capabilities of the FE Model

FE modeling of thermal barrier coatings is considered a relatively complex process due to the need to accurately simulate their anisotropic behavior and heterogeneous and complicated microstructure. The SPS-TBC is deposited preferentially comprising numerous microstructural defects (e.g., intercolumnar gaps, pores, microcracks, irregular interfaces) to improve strain tolerance and reduce thermal conductivity, which can promote cracking under real service conditions [7,12]. During the deposition process of the TBC system, thermal stresses are developed within the coatings that can promote the formation of microcracks. These thermal mismatch stresses can be released to some extent at high temperatures [20]. At elevated temperatures, different phenomena act together that can affect the lifetime of the coating including sintering, phase change, thermal stress development, creep, and uneven and dynamic growth of the TGO layer due to induced oxidation [7,8,11,13,16,20,53]. Hence, FE modeling of a TBC usually seeks simplification that would impart uncertainty to the obtained results. For instance, in the current research work, it was assumed that the coating was in a stress-free state at the start of the numerical analysis, neglecting the deposition thermal stresses. A 2D local FE model was used, neglecting the 3D structure of the coating, and the TBC layers were treated as isotropic and homogeneous materials. Furthermore, the irregular and dynamic growth of the TGO layer was not addressed in this work. All the mentioned assumptions were made to mitigate the difficulties associated with numerical modeling procedures, which also aligns with those proposed in the literature [14,17,18,19,20,40]. Consequently, the obtained FE results are subject to uncertainty. Despite these limitations, this research primarily focuses on comparing the stress nature and distribution among different TBC system structures (single- and double-layer) and analyzing the impact of real microstructural geometry on the coatings’ cracking behaviors. The goal is to enhance understanding and explore potential improvements in TBC performance.
The FE predictions reported and discussed in the next section were validated by comparing them with the published numerical and experimental data including our previous investigation [16], which show good agreement. The developed MATLAB code for image processing and the FE model can be used to investigate the stress development within the complicated microstructure of the multilayer coatings to evaluate the life expectancy of the TBC system. FE modeling can provide a better understanding of the crack initiation and propagation behavior (e.g., potential sites for crack formation and possible propagation direction) as well as the possible failure modes (e.g., mode I or II failure) for the multilayer SPS-TBC system. The developed FE model can be applied to a larger-scale structure or 3D representation of the TBC system to provide a wider perspective of the microstructural feature effect on the failure of multilayer TBC systems incorporating fracture modeling techniques such as cohesive zone modeling (CZM) and the extended finite element method (XFEM).

3. Results and Discussion

In this section, we highlight the impact of the actual morphology of microstructural features in SPS coatings, including intercolumnar gaps, pores, and irregular interfaces, on the development of complex stress fields within TBC systems (i.e., double- and single-structure) due to the thermal expansion mismatch among TBC layers. Additionally, we examine the influence of varying TGO thicknesses on the thermal stress distribution after the cooling process within the investigated TBC structures.

3.1. Thermal Stresses Evolution in Double-Layer TBC

Variation in the thermo-mechanical properties along with the geometrical features of TBC layers would result in considerable variation in the thermal stresses; hence, the thermal stress field of each layer is presented separately and with its legend. Figure 6a–c shows the X-direction (S11) stress distribution for the double-layer SPS-TBC components (i.e., GZ, YSZ, TGO, and BC layers) at TGO thicknesses of 2, 5, and 8 μm. Different locations within the TBC microstructure along the cross-sectional thickness direction were identified using magnified frames A, B, C, D, and E to enhance the visibility of stress concentration in the vicinity of pores and intercolumnar gaps. The red and blue colors stand for the tensile and compressive stress regions, respectively. The complex geometry along with the interaction zones between the pores and intercolumnar gaps can create stress concentration sites (high compressive and tensile values), which can be recognized clearly in the magnified frames, see Figure 6a–c. It can be noted that with the increase in the TGO thickness, the magnitude of both tensile and compressive stresses is decreased within the GZ ceramic layer. For instance, the FE predictions for the S11 tensile stress at 2, 5, and 8 μm TGO were 874 MPa, 856 MPa, and 835 MPa, respectively (see Figure 6a–c, magnified frames A1–3). The localized compressive stresses decrease from −7921 MPa at a TGO thickness of 2 μm to –7558 MPa at an 8 μm TGO thickness, Figure 6a,c (magnified frames A1,3). The same behavior was detected at different locations within the GZ ceramic layer, see Figure 6a–c (frames B1–3, C1–3). Such high-stress predictions are attributed to the interaction between the microstructural discontinuity (pores and gaps), which may not reflect the real stress values within the coatings. Furthermore, beyond these regions of stress concentration, the GZ layer experiences relatively low-magnitude stresses, ranging from approximately 200 MPa to −800 MPa in areas with low pore concentration or away from interaction zones with pores and columnar gaps. The magnitude and nature of the stresses (tensile or compressive) within the TBC system can considerably affect the development of cracks during thermal loading procedures. For instance, compressive stresses can restrict crack initiation and propagation due to the applied closure forces [26]. However, these compressive stresses may cause the formation of microcracks due to induced buckling. On the other hand, no obvious trend was detected for the thermal tensile and compressive stresses developed in the YSZ ceramic layer. Both the tensile and compressive stresses increased as the TGO layer thickness increased from 2 to 5 μm and then decreased at an 8 μm TGO thickness, see Figure 6a–c (frames D1–3, E1–3). For example, the S11 stress experienced an increase from 681 MPa to 743 MPa followed by a reduction to 646 MPa as the TGO thickness varied between 2 and 8 μm, see Figure 6a–c (frames D1–3). However, the S11 stress fields were found to be in the vicinity of pores that are close to the YSZ/TGO interface. The same observation was detected in other studies [18,19]. Based on Figure 6a–c, it is evident that the interaction regions between pores and the geometrical complicity of the intercolumnar gaps create critical regions with high-stress concentrations, which may lead to crack initiation. The thermal stresses (S11) developed across the various TGO thicknesses range from a maximum tensile stress of approximately 400 MPa to a maximum compressive stress of nearly—10,700 MPa, see Figure 6a–c. Once again, the high values of compressive stress can be attributed to stress concentration in critical regions resulting from the interface roughness of the TGO layer. Apart from these regions of stress concentration, the compressive stress within the TGO falls within the range of 2000 MPa to 6000 MPa. However, it is essential to highlight that these stress values can vary significantly due to the uneven and dynamic growth of the TGO layer, a factor not considered in the current study. The TGO layer primarily experiences compressive stresses, influenced by its lower thermal expansion coefficient compared with the metallic layers (i.e., substrate and BC) [53]. The FE-predicted compressive stress in the TGO layer can be considered close to experimental measurements of thermal stress in the TGO layer conducted with the piezo-spectroscopy technique [53,54,55,56]. These experimental measurements revealed that compressive stress in the TGO layer can reach approximately 4.5 to 8 GPa [53,54,55,56]. For the BC layer, the S11 stress component experienced a variation between nearly 400 MPa and 370 MPa, as can be seen in Figure 6a–c. Some stress concentrations were detected at the BC interface due to its irregularity; however, as mentioned before, the normal stress in the Y-direction (S22) and shear stress (S12) are the most responsible for the interfacial cracking.
Normal stresses in the Y-direction (S22) that are perinuclear to the general configuration of TBC interfaces are the prime driving force for horizontal crack initiation and propagation within the ceramic layer of the TBC system, leading to coating spallation and delamination [40,42]. The S22 stress distribution within the double-layer TBC layers (i.e., GZ, YSZ, TGO, and BC) at different TGO thicknesses (2, 5, and 8 μm) is presented in Figure 7a–c. Frames A, B, C, D, and E distinguish critical regions of high-stress concentration that may cause crack initiation, see Figure 7a–c. It is obvious from Figure 7a–c that, the S22 stress distribution was considerably impacted by intercolumnar gaps and pores within the ceramic layers (GZ, YSZ), resulting in S22 being localized around the corners of the pores and intercolumnar gaps. The increase in the TGO layer thickness has the effect of reducing the magnitude of S22 stress in the GZ layer, as illustrated in the magnified frames in Figure 7a–c (A1–3, B1–3, C1–3). Figure 7a–c (frame A1–3) shows that the maximum stress S22 in the GZ layer dropped from 2524 MPa to 2415 MPa as the TGO thickness increased from 2 to 8 μm, respectively. Generally, the YSZ layer has a lower stress level, around 800 MPa, compared with the GZ layer, see Figure 7a–c. Hence, there is a higher potential for the development of horizontal cracks within the GZ layer compared with the YSZ layer, which is consistent with our previous experimental observations [16]. Based on the FE results, it was observed that increasing the thickness of the TGO layer caused a shift in stress localization toward the corners of pores near the YSZ/TGO interface and altered the S22 stress level within the YSZ layer. For instance, the maximum stress of 1623 MPa was detected at 2 μm TGO to localize at the vicinity of a relatively large pore located in nearly the middle of the YSZ layer, see Figure 7a (frame D1). Thickening of the TGO layer results in shifting the stress localization to pores close to the YSZ/TGO interface in addition to relatively increasing the S22 stress value to be 1703 MPa and 1659 MPa at 5 and 8 μm TGO, respectively (Figure 7b,c (frame D2,3)). A similar trend, that is localization and shifting of the stresses in the vicinity of pores near the interface between the TC layer and TGO layer has been reported in the published literature [18,19,40].
As observed in the FE simulation, the shift in stress concentration locations within the TBC system aligns with and supports our earlier experimental findings [16] regarding the formation of horizontal cracks within the ceramic layer at different locations (such as 60, 130, and 180 μm away from the TGO layer), following the attained thermal treatment procedures. Consequently, these horizontal cracks may cause the SPS coating to spall, particularly at the coating’s upper sections with thin TGO layers (e.g., column tips) or close to the TC/TGO interface with thicker TGO layers, thereby reducing the overall thickness of the ceramic layer. Therefore, the lifespan of the TBC system is reduced, making the coating more susceptible to environmental factors, such as corrosion, oxidation, and CMAS attack, and decreasing its resilience against thermal loading (e.g., thermal cycling and thermal shock). To retain the functionality of the TBC system, local or global maintenance procedures should be used [57]. The development of horizontal cracks either causing coating delamination (i.e., reduced thickness) or not can result in accelerated growth of the thermally grown oxide (TGO) due to increased oxygen infiltration. The thickening of the TGO layer can lead to stress concentration in the vicinity of pores near the ceramic layer/TGO interface or along the rough TGO interface due to the dynamic and uneven growth of this layer, eventually leading to coating failure [18,20,58]. Hence, the dynamic shift in the location of stress concentration with the potential for crack development can lower the fracture toughness and delamination strength of the coatings, leading to reduced mechanical durability. Furthermore, as the coating undergoes delamination due to the development of horizontal cracks, the thermal insulation property of the ceramic layer deteriorates with the reduction in its total thickness [17]. The increased cracking area, combined with the thinner TBC layer from spallation, facilitates oxygen penetration through the ceramic layer. This accelerates the growth of the TGO scale by depleting the aluminum in the β-NiAl phase of the bond coat layer. Thereby, phase transformation within the bond coat from the β to γ/γ′ phases takes place [16,59]. Also, as a result of β-NiAl phase depletion, metal oxides such as Cr2O3, NiO, CoO, or spinel (Co, Ni) (Cr, Al)2O4 can be formed that affect the adhesion strength at the TGO interface.
The TGO layer has a lower thermal expansion coefficient compared with the YSZ ceramic layer. Because of this, the TGO layer contracts at a slower rate than the YSZ layer. Additionally, the interface between the YSZ and TGO layers is uneven and has multiple peak and valley features. As a result, the valley regions along the YSZ/TGO interface (see Figure 7a–c (frame E1–3)) are featured with high tensile stress in the Y-direction, whereas the peak areas in the YSZ layer undergo compressive S22 stress. This phenomenon in the BC layer is reversed (Figure 7a–c), with the peak region experiencing tensile S22 stress and the valleys subjected to compressive S22 stress [20,29]. The tensile stresses at the peaks can cause debonding between the ceramic layer and TGO [60]. As can be seen in Figure 7a–c (magnified frame E1–3), the tensile stress in the valley region increases from 407 to 527 MPa as the TGO thickness increases, and the compressive stress in the peak area decreases from −1075 to −645 MPa. Upon comparing the stress levels in the X-direction (S11) and the Y-direction (S22), as shown in Figure 6 and Figure 7, respectively, it is evident that the stress localization in the Y-direction is significantly higher than the stress fields in the X-direction in both the YSZ and GZ layers. Hence, horizontal cracks are more likely to initiate and propagate than vertical cracks in the SPS TBC ceramic layers. Furthermore, the increases in the TGO layer thickness have the effect of altering the stress concentration value and location as previously discussed, leading to the development of horizontal cracks at different locations inside the ceramic layers. These FE stress field predictions show agreement with the experimental observations [16]. Horizontal cracks were mostly detected in the SPS coatings after being subjected to a thermal loading of 1150 °C, which were located at various positions, such as 60, 130, and 180 μm away from the TGO layer, within the ceramic layers [16]. The pores located near the TC/TGO interface with S22 stress concentration points drive horizontal crack growth toward the interface, as reported in [26,40]. It can be deduced that the distribution of stress in SPS ceramic layers is affected by the amount and shape of porosity and gaps between columns. These factors make the ceramic more brittle. Moreover, the thickness of the TGO layer can change the stress fields in the SPS ceramic layers. The distribution of S22 stress within the TGO layer experienced insignificant variation across different thickness values (2, 5, and 8 μm), with S22 ranging between approximately 500 MPa and −2400 MPa, as shown in Figure 7a–c.
This section presents the predicted FE stress distributions for the S12 and S22 stresses at different TGO thicknesses along the interfaces in a double-layer SPS coating, namely, the GZ/YSZ, YSZ/TGO, and TGO/BC interfaces. As highlighted before, shear stress (S12) causes mode II fractures (i.e., shear failure) along the interface, while normal stress (S22) causes mode I fractures (i.e., separation failure) [19,20,29]. The stress variation in S12 and S22 along the GZ/YSZ interface at the 2 μm TGO thickness is shown in Figure 8a,b. The distribution of shear stress (S12) and normal stress (S22) depends distinctly on the interface roughness [20]. It is evident that some critical regions along the GZ/YSZ interface result in both shear and normal stress concentration, recognized as sharp peaks (tensile stress) and deep valleys (compressive stress), see Figure 8a,b. While apart from these regions, the stress levels are comparatively lower. The GZ/YSZ interface experiences relatively low shear (S12) and normal (S22) stresses ranging between 160 MPa and −280 MPa and 135 MPa and −500 MPa. It is worth mentioning that normal compressive stresses can help prevent interface crack initiation and propagation [18,20,60]. Increasing the TGO thickness was found to have a negligible effect on both the magnitude and distribution of the shear (S12) and normal (S22) stresses along the GZ/YSZ interface, which is evident from the constancy in the value and location of the maximum and minimum stress concentrations, see Figure 9a,b and Figure 10a,b. The shear stress ranged from approximately 160 MPa to −275 MPa as the TGO thickness increased to 5 and 8 μm, while the normal stress ranged from nearly 135 MPa to −490 MPa. The stress levels developed across the interface between the ceramic layers (i.e., GZ and YSZ) at different TGO thicknesses are considered low as compared with the stress values developed along the YSZ/TGO and BC/TGO interfaces, especially the YSZ/TGO interface. This can be attributed to the close values of the thermal expansion coefficient between the GZ and YSZ layers, which leads to potentially lower stresses. Furthermore, this can be correlated to the experimental studies [12,13,16], where cracks were recorded inside the ceramic layer or at the TGO interface in multilayer SPS coatings after isothermal and cyclic thermal loading procedures.
The distribution of shear stress (S12) and normal stress (S22) along the YSZ/TGO interface was found to be considerably higher than those along the BC/TGO and GZ/YSZ interfaces. The S12 stress distribution along the YSZ/TGO interface at a TGO thickness of 2 μm ranged between 750 MPa and −785 MPa (as seen in Figure 8c). As the TGO thickness increased, the difference in the S12 stress concentration levels also increased. At 5 μm TGO, the stress concentration levels ranged from 770 MPa to −720 MPa (Figure 9c), while at 8 μm TGO, they varied from 825 MPa to −735 MPa (Figure 10c). In contrast, the tensile normal stress (S22) across the YSZ/TGO interface increased from 625 MPa at 2 μm TGO (refer to Figure 8d) to 785 MPa and 650 MPa at the 5 and 8 μm TGO thicknesses, respectively (see Figure 9d and Figure 10d). It is worth highlighting that in this study, the dynamic growth of the TGO layer was not taken into consideration. Increasing the thickness of the TGO layer did not significantly impact the distribution of the S12 and S22 stress components along the interfaces. However, there was detected variation in tensile and compressive stress concentration as pointed out, which can be revealed from the change in the location of the maximum and minimum stress values. In Figure 8d, Figure 9d and Figure 10d, the tensile S22 stress concentrations were observed to take place at the valley regions in the YSZ/TGO interfaces, while the compressive stresses were noted at the peaks, as illustrated in the prior section (see Figure 7a–c (frame E1–3)). From peak to valley region, the normal stress S22 changes from compressive to tensile along the trace of the TGO morphology. The nature of stress concentration at the peak and valley regions between the ceramic and TGO layers has been similarly reported in the literature [19,20,29]. Hence, it can be deduced that the interface regions subjected to high tensile stresses are highly prone to initiation and growth of horizontal or oblique microcracks, which may lead to the spallation of the coating at the TC/TGO interface and eventually failure of the TBC system [20,29]. One of the common modes of cracking in the TBC system occurs at the TC/TGO or TGO/BC interface [58,61]. These interfaces are vulnerable to failure due to the oxidation-induced volume increase in TGO and the variances in the thermal expansion between the TGO and the remaining TBC layers. Dong et al. [58] investigated the effect of TGO thickness on the failure of plasma-sprayed TBCs and found that the critical thickness of TGO was nearly 6 µm. However, the multilayered TBC structure introduces a higher potential for interfacial delamination since the number of interfaces is increased. For instance, the investigated double-layer SPS coating comprises three interfaces, i.e., the GZ/YSZ, YSZ/TGO, and TGO/BC interfaces. Our previous ex situ investigation of the cracking behavior of multilayer SPS coatings after thermal loading showed that there is interfacial delamination at the interface between the ceramic layer and the TGO layer [16]. The predictions of shear stress (S12) and normal stress (S22) along the YSZ/TGO interface confirm and match the findings of our investigation.
The morphology of the BC/TGO interface can introduce possible locations for stress concentration, which can lead to crack initiation and propagation. The shear stress (S12) distribution along the BC/TGO interface clearly depends on interface roughness (see Figure 8e, Figure 9e and Figure 10e). The shear stress along the BC/TGO interface varied from a tensile stress of approximately 225 MPa to a compressive stress of nearly −220 MPa for the different TGO thicknesses investigated. The increase in TGO thickness does not significantly affect shear stress distribution or magnitude along the BC/TGO interface, refer to Figure 8e, Figure 9e and Figure 10e. Again, this can be attributed to not considering the uneven growth of the TGO layer. The distribution of normal stress (S22) across the BC/TGO interface (see Figure 8f, Figure 9f and Figure 10f) is higher than the shear stress along the same interface. For instance, the S22 stress changes between approximately 410 MPa and −470 MPa for the different TGO thicknesses (i.e., 2, 5, and 8 μm). In contrast with the stress distribution at the YSZ/TGO interface, from the peak to the valley region, the normal stress S22 changes from tensile to compressive because of the regularity in the BC/TGO interface. Tensile stress appears in the peak region and compressive stress occurs in the valley region for the BC/TGO interface. The distribution of the S22 component does not vary with the increase in TGO thickness because of BC/TGO interface regularity. Since the normal stress component is almost double the shear stress value, the potential for mode I failure along the BC/TGO interface is higher than mode II failure. In the present research, the trends in the thermal mismatch stresses along the YSZ/TGO and BC/TGO interfaces are consistent with those reported in Refs. [20,26]. In a study conducted by Zhu et al. [20], they reported similar levels of shear stress (220 and −210 MPa) and normal stress (410 MPa and −470 MPa) along the BC/TGO interface. Their study considered the actual morphology of the TGO layer with varying thicknesses.

3.2. Thermal Stress Evolution in YSZ Single-Layer TBCs

In this section, the thermal stresses developed within a single-layer YSZ-TBC system are explored. Vertical cracks in TBCs are caused by normal stresses in the X-direction (S11). Figure 11a–c shows the S11 stress distribution for single-layer TBC components (YSZ, TGO, and BC layers) at TGO thicknesses of 2, 5, and 8 µm. Different locations in the YSZ ceramic layer along its thickness were identified using auxiliary magnified frames A, B, and C to enhance the visibility of stress concentration near pores and intercolumnar gaps. Again, the pores and intercolumnar gaps can create stress concentration sites due to their complex geometry and interaction zones, which are clearly visible in the magnified frames, Figure 11a–c. On the other hand, areas away from the interaction zones between the intercolumnar gaps and pores exhibit comparatively lower stress values. The increase in the TGO thickness has the effect of changing both the magnitude and the distribution of the S11 stress component within the YSZ ceramic layer. For instance, the magnitude of the tensile S11 stress at the upper region of the YSZ layer was reduced from 783 MPa to 750 MPa as the TGO thickness increased from 2 to 8 µm, respectively, see Figure 11a–c (magnified frame (A1–3). Similarly, the compressive stress exhibited a reduction of approximately −300 MPa. Simultaneously, the S11 stress distribution revealed a tendency to evolve and localize in the vicinity of pores that are relatively closer to the YSZ/TGO interface, corresponding to the increase in TGO thickness. At 2 µm TGO, the tensile S11 stress was found to localize (798 MPa) at the corner of the pore, as shown in the magnified frame C1, Figure 11a. The increase in TGO thickness to 5 and 8 µm resulted in both an increase and a shift in stress concentration toward the vicinity of a pore that is relatively closer to the YSZ/TGO interface, see Figure 11b,c (magnified frame (B2,3)). The tensile S11 stress at this highlighted porosity (shown in frames B1–3) increases from 699 MPa at 2 µm TGO to 915 MPa at 8 µm TGO. Hence, the swelling of TGO at elevated temperatures has the effect of reducing stress levels at the upper regions of the TC, while increasing stress localization at the lower portion of the ceramic TC layer. This can lead to the initiation of cracks at different locations within the TBC system. Furthermore, the S11 stress level in the single-layer YSZ model is relatively lower than that in the double-layer model, that is, increasing the number of ceramic layers can increase the thermal stresses [62]. The TGO layer exhibited mostly compressive stresses ranging between approximately 900 MPa and −10,000 MPa at different TGO thicknesses, see Figure 11a–c. The increase in the TGO thickness resulted in an increase in the compressive stress concentrations, as evident from the stress contour. Again, this can be attributed to the low thermal expansion of the TGO layer as compared with the other TBC layers, especially the metallic bond coat and substrate materials [53]. The compressive stresses apart from the stress concentration areas approximately ranging from −2000 MPa to −6000 MPa, which can be aligned with the experimental measurements that show thermal stresses in the TGO layer, can reach around −8000 MPa [53,54]. Moreover, it was observed that the compressive stress developed across the TGO layer in the single-layer model is comparatively lower than that generated in the double-layer model, see Figure 6a–c and Figure 11a–c. The bond coat (BC) layer exhibits thermal stresses (S11) within the range of approximately 320 MPa to −950 MPa. The increase in the TGO thickness can result in some stress localization along the BC interface, owing to its irregularity, and affect the stress distribution, as evident from the S11 contour shown in Figure 11a–c.
The distribution of normal stresses in the Y-direction (S22) within the YSZ single-layer TBC layers (i.e., YSZ, TGO, and BC) at various TGO thicknesses (2, 5, and 8 μm) is illustrated in Figure 12a–c. The concentration of the S22 component around pores and intercolumnar gaps is significantly higher than the normal stress in the X-direction. This promotes the development of horizontal cracks rather than vertical ones [12,16,17]. The increase in TGO thickness was observed to impact the distribution of the S22 stress within the YSZ layer in such a way that stress localizes in the proximity of pores near the YSZ/TGO interface as the TGO thickness increases, similar to the S11 stress fields. At 2 μm TGO, the S22 stress is localized (2275 MPa) at the proximity of the intercolumnar gap located at the upper side of the YSZ layer, see Figure 12a (frame A1). Increasing the TGO thickness to 5 and 8 μm results in a significant increase in the magnitude of the S22 stress, reaching 2684 MPa and 2895 MPa, respectively, and additionally shifts the location of the stress concentration to the corners of pores adjacent to the YSZ/TGO interface, see Figure 12b,c (frame C2,3). As mentioned earlier, the S22 stress developed along the YSZ/TGO interface exhibited a tensile nature in the valley regions and compressive values at the peaks. On the contrary, this behavior was reversed in the BC layer, where the peak regions exhibited tensile S22 stresses, and the valleys experienced compressive stresses, Figure 12a–c. The increase in TGO thickness led to an increase in the localization of tensile and compressive stresses along the BC interface, generally varying between approximately 560 MPa and 720 MPa and from −350 MPa to −400 MPa, respectively. These highlighted findings match well with the reported numerical and experimental investigations [12,16,18,20]. The distribution of S22 stress within the TGO layer at different thickness values (2, 5, and 8 μm) ranges between approximately 1400 MPa and −4500 MPa, as shown in Figure 12a–c.
The single-layer TBC system includes two interfaces, namely, the TC/TGO and BC/TGO interfaces, at which cracks can potentially develop due to the thermal shear and normal stresses generated along these interfaces under thermal loading [58,61]. Based on the conducted finite element simulation for the YSZ single-layer TBC, it was observed that the shear (S12) and normal (S22) stresses developed along the YSZ/TGO interface were higher than those generated along the BC/TGO interface. At the YSZ/TGO interface, the shear (S12) stress varied between 710 MPa and −1170 MPa, and the normal (S22) stress changed between 1000 MPa and −825 MPa, whereas the BC/TGO interface exhibited shear stress ranging between 230 MPa and −170 MPa, and the normal stress varied between nearly 700 MPa and −350 MPa. These trends in thermal stress concentration along the TC/TGO interface, as compared with those developed at the BC/TGO interface, match the findings reported by Zhu et al. [20]. Hence, this section reports and discusses the shear and normal stresses for the YSZ/TGO interface developed at different TGO thicknesses. The shear stress (S12) distribution along the YSZ/TGO interface at different thicknesses of the TGO layer (2, 5, and 8 μm) is shown in Figure 13a,c,e. It is evident that the increase in TGO thickness primarily affects the distribution of S12 stress along the interface rather than causing high-stress localization in specific regions. The highlighted regions along the YSZ/TGO interface (refer to Figure 13a,c,e) illustrate the redistribution of shear stresses as a result of the increase in TGO thickness. Figure 13b,d,f shows the distribution of the S22 stress component along the YSZ/TGO interface at TGO thicknesses of 2, 5, and 8 μm. Furthermore, it can also be observed that the location of maximum and minimum stress localization can change according to the thickness of the TGO layer. Again, the influence of the increase in TGO thickness redistributes the stress concentration across certain regions at the interface, as highlighted in Figure 13b,d,f. At different TGO thicknesses, the levels of normal tensile stress are approximately 200 MPa higher than the corresponding shear stress values, indicating a higher potential for separation mode failure (mode I).

3.3. Thermal Stress Evolution in GZ Single-Layer TBCs

In this part, the thermal stresses generated inside GZ single-layer TBCs are discussed. The S11 stress distribution for the GZ, TGO, and BC layers in the single-layer TBC system at TGO thicknesses of 2, 5, and 8 µm is shown in Figure 14a–c. The magnified frames A, B, and C were chosen across the GZ layer to provide a clearer display of tensile and compressive stress concentration in the proximity of pores and intercolumnar gaps. Again, the TGO thickness increase led to altered S11 stress levels and stress concentration across the ceramic layer (i.e., GZ) thickness. The tensile S11 stress at the upper region of the GZ layer was reduced from 883 MPa to 847 MPa as the TGO thickness increased from 2 to 8 µm, see Figure 14a–c (magnified frame (A1–3)). Simultaneously, the compressive stress experienced a reduction of roughly –300 MPa. The tensile S11 stress started to evolve and localize in the proximity of pores relatively closer to the GZ/TGO interface as the TGO thickness increased from 5 to 8 µm. At 5 µm TGO, the tensile S11 stress localized (897 MPa) at the corner of the pore is shown in magnified frame C2, Figure 14b. While at 8 µm TGO, the localization of S11 stress increased by approximately 100 MPa and shifted to the vicinity of the pores that were relatively closer to the GZ/TGO interface, Figure 14c (frame B3). Comparing the stress levels in the GZ single-layer model and the YSZ model, it is evident that the stress levels in the GZ model are higher by around 100 MPa. This can be attributed to the lower thermal expansion of the GZ layer compared with the YSZ layer. Therefore, it is a common practice to deposit a thin YSZ layer in direct contact with the BC layer in the multilayer TBC system (i.e., double- and triple-structure) to improve the overall system compatibility and reduce thermal stresses [7,12]. Moreover, the presence of an intermediate YSZ layer serves to prevent the tendency of the GZ layer to undergo detrimental reactions with the TGO layer at elevated temperatures to form GdAlO3 [17]. In the GZ model, the localization of S11 stress at pores near the TC/TGO interface was observed at a later stage of TGO thickening (i.e., 8 µm TGO), in contrast to the YSZ model, where stress concentration and shifting were noted at an earlier TGO thickness (5 µm TGO). The normal stress S11 in the BC layer ranges from approximately 320 MPa to −950 MPa. An increase in TGO thickness affects the stress localization and distribution along the BC interface due to its irregularity, see Figure 14a–c. The FE results show that changing the ceramic layer material (from YSZ to GZ) has no noticeable effect on the S11 thermal stress developed in the BC layer, refer to Figure 11a–c and Figure 14a–c. The distribution of S11 stress within the TGO layer at different thickness values (2, 5, and 8 μm) ranges between approximately 1000 MPa and −10,000 MPa, Figure 14a–c. The increase in the TGO layer thickness led to increased compressively stresses across TGO. The S11 compressive stresses developed across the TGO layer are considered consistent in both the YSZ-TBC and GZ-TBC models, see Figure 11a–c and Figure 14a–c.
The distribution of normal stresses (S22) in the single-layer TBC layers (GZ, TGO, and BC) at different TGO thicknesses (2, 5, and 8 μm) is shown in Figure 15a–c. The S22 fields show a notably higher concentration around structural discontinuities, like pores and intercolumnar gaps, in comparison with the corresponding normal stress in the X-direction. This aligns with and confirms experimental observations concerning the detection of horizontal cracks in the ceramic layer of SPS coatings [16]. The increase in TGO thickness led the stress redistribution to localize at the corner of pores adjacent to the GZ/TGO interface, as has been reported previously. At 2 μm TGO, the S22 stress localized (2555 MPa) at the upper side of the GZ layer, see Figure 15a (frame A1). Increasing the TGO thickness to 5 and 8 μm amplifies the S22 stress, reaching 2630 MPa and 2825 MPa, respectively. This is accompanied by a shift in the stress concentration to the corners of pores near the GZ/TGO interface, as illustrated in Figure 15b,c (frame C2,3). Stress shifting across the GZ layer thickness can be detected by comparing the auxiliary magnified frames (A–C), Figure 15a,c. The increase in TGO thickness increases the concentration of tensile and compressive stresses along the BC interface, generally varying between approximately 570 MPa and 720 MPa and from −360 MPa to −390 MPa, respectively. The stress predictions indicate that altering the ceramic layer material from YSZ to GZ in the developed FE models does not have an obvious impact on the thermal stress (S11) distribution in the BC layer, as shown in Figure 12a–c and Figure 15a–c. The distribution of S22 stress within the TGO layer at different thickness values (2, 5, 8 μm) ranges between approximately 1500 MPa and −4500 MPa, as shown in Figure 15a–c.
Interfacial delamination can take place either along the TC/TGO interface or the BC/TGO interface in a traditional TBC system (single-layer) due to the shear (S12) and normal (S22) stresses developed during thermal loading. It was observed that the shear (S12) and normal (S22) stresses developed along the GZ/TGO interface are greater than those generated along the BC/TGO interface. The shear (S12) stress developed at the GZ/TGO interface was found to vary between 700 MPa and −1200 MPa, and the normal (S22) stress ranged from 1000 MPa to −1020 MPa, whereas the BC/TGO interface exhibited shear stress within the range of 230 MPa to −175 MPa, and normal stress varied from approximately 725 MPa to −390 MPa. Therefore, this section presents and analyzes the shear and normal stress distributions at the GZ/TGO interface under varying TGO thicknesses. The distribution of shear stress (S12) along the GZ/TGO interface at varying TGO layer thicknesses (2, 5, and 8 μm) is shown in Figure 16a,c,e. Notably, the increase in TGO thickness alters the distribution of S12 stress along the interface rather than inducing high-stress localization in specific regions (see the max and min values in Figure 16a,c,e). Highlighted areas along the GZ/TGO interface (as shown in Figure 16a,c,e) illustrate the redistribution of shear stresses resulting from the increased TGO thickness. The distribution of the S22 stress component along the GZ/TGO interface at the 2, 5, and 8 μm TGO thicknesses is presented in Figure 16b,d,f. Once again, the increase in TGO thickness influences the redistribution of the stress profile across specific areas at the interface, as highlighted in Figure 16b,d,f. At varying TGO thicknesses, the normal tensile stress levels are around 200 MPa higher than the corresponding shear stress values, suggesting an increased potential for mode I failure.
Many factors can affect interfacial durability in the TBC system including material compatibility, the TGO growth rate, the deposition method, and the existence of micro discontinues (e.g., pores) along the interface as well as the interface roughness. Hence, the utilization of materials with compatible thermal expansion coefficients can reduce stress at the interfaces and mitigate the possibility of crack formation along the interface [7]. For instance, YSZ has a higher thermal expansion coefficient than GZ, which makes YSZ more compatible with the metallic layers of the TBC system (i.e., bond coat and substrate). Therefore, the conducted FE simulation shows that the level of thermal stress predictions in the YSZ single-layer model is generally lower than in the GZ FE model. Moreover, the utilization of a multilayer TBC system or a functionally graded material (FGM) structure to improve the overall durability and performance of the TBC system is a valid approach. Essentially, a bond coat is used in the TBC system to tolerate the thermal expansion mismatch between the metallic substrate and ceramic top coat to reduce the developed stress within and along the interfaces for an extended lifetime [7,13,59]. The interfacial bonding between the ceramic top coat and bond coat typically relies on mechanical interlocking through rough interfaces obtained by sand or grit blasting of the bond coat surface to increase the interfacial bonding area [63]. However, such rough surfaces and interfaces can lead to stress concentration sites and the potential for crack initiation and propagation [19,20,64]. Therefore, optimizing the roughness degree of the TC/BC interface by selecting appropriate grit blasting parameters, such as the blasting angle, pressure, media (e.g., alumina, silica sand, silicon carbide), working distance, grit particle size, etc., are critical for interfacial adhesion, which is need for dedicated investigations [63]. Furthermore, controlling or restricting the growth rate of the Al2O3 oxide layer (i.e., TGO) within the TBC system at elevated temperatures could beneficially reduce the magnitude of the developed thermal stresses, leading to improved interfacial durability and a longer lifetime of the coating. For instance, the experimental investigation conducted by Farzin et al. [65] revealed that a vacuum heat-treated NiCoCrAlY coating (i.e., bond coat) had a higher isothermal and cyclic oxidation resistance compared with a non-treated coating, leading to a lower growth rate of the aluminum oxide layer. Also, High-Entropy Alloy (HEA) coatings have shown good oxidation resistance [66], which can be applied in the TBC system to serve as a bond coat to restrict the formation of the TGO layer. These practices can improve the interfacial characteristics of the TBC system leading to overall enhanced durability and performance. Thereby, the TBC system can increase the working temperature limits of the underlying components (e.g., turbine blades), thus attaining higher performance and better energy efficiency [1,2].
The nature and magnitude of the stress concentration within the coating and along its interfaces were mostly found to be affected by the increase in the thickness of the TGO layer, the morphology of microstructural features (e.g., columnar gaps, pores, and interfaces), the number of ceramic layers, and its mechanical characteristics (e.g., thermal expansion). The process parameters of the SPS deposition method (e.g., spray distance, suspension feed, deposition rate, environmental pressure, etc., can influence the SPS microstructure [12,13,67], and thereby, potentials for altered stress concentration behavior could be attained. For instance, depositing dense coatings with low porosity content by optimizing the SPS process parameters (e.g., suspension feed, deposition rate, and environmental pressure) [12,67,68] can lead to less opportunity for stress concentration in the vicinity of pores within the TBC system. However, low porosity levels can negatively affect the thermal insulation of the TBC system by increasing its extrinsic thermal conductivity. It is noteworthy to mention that as the number of layers increased, the porosity level of the ceramic top coating also increased [7]. This increase in porosity can lead to increased likelihood of stress concentration and crack formation in a multilayer TBC system compared with a single-layer configuration. Furthermore, Xie et al. [67] showed that controlling the environmental pressure of the SPS process can change a column-like structural coating into a vertical crack-segmented structure, accompanied by a reduction in surface roughness. Both structures are engineered to provide strain tolerance of the coating due to thermal expansion mismatch between the TBC layers [7,16,67]. For the SPS columnar-like structure, the conducted FE analysis showed that columnar gaps can act as stress concentration sites, promoting horizontal crack initiation and propagation. This behavior would change in the case of a vertical crack-segmented structure, promoting a higher possibility of vertical crack propagation rather than horizontal cracks.

4. Conclusions

A finite element model guided with an SEM image processing technique, incorporating the actual morphology of microstructural features (such as intercolumnar gaps, pores, and irregular interfaces) in a multilayer SPS TBC system, was developed to analyze the thermal stress fields generated within the coatings under thermal loading conditions. The FE results were validated by comparing them with the published numerical and experimental data, and the following conclusions were drawn:
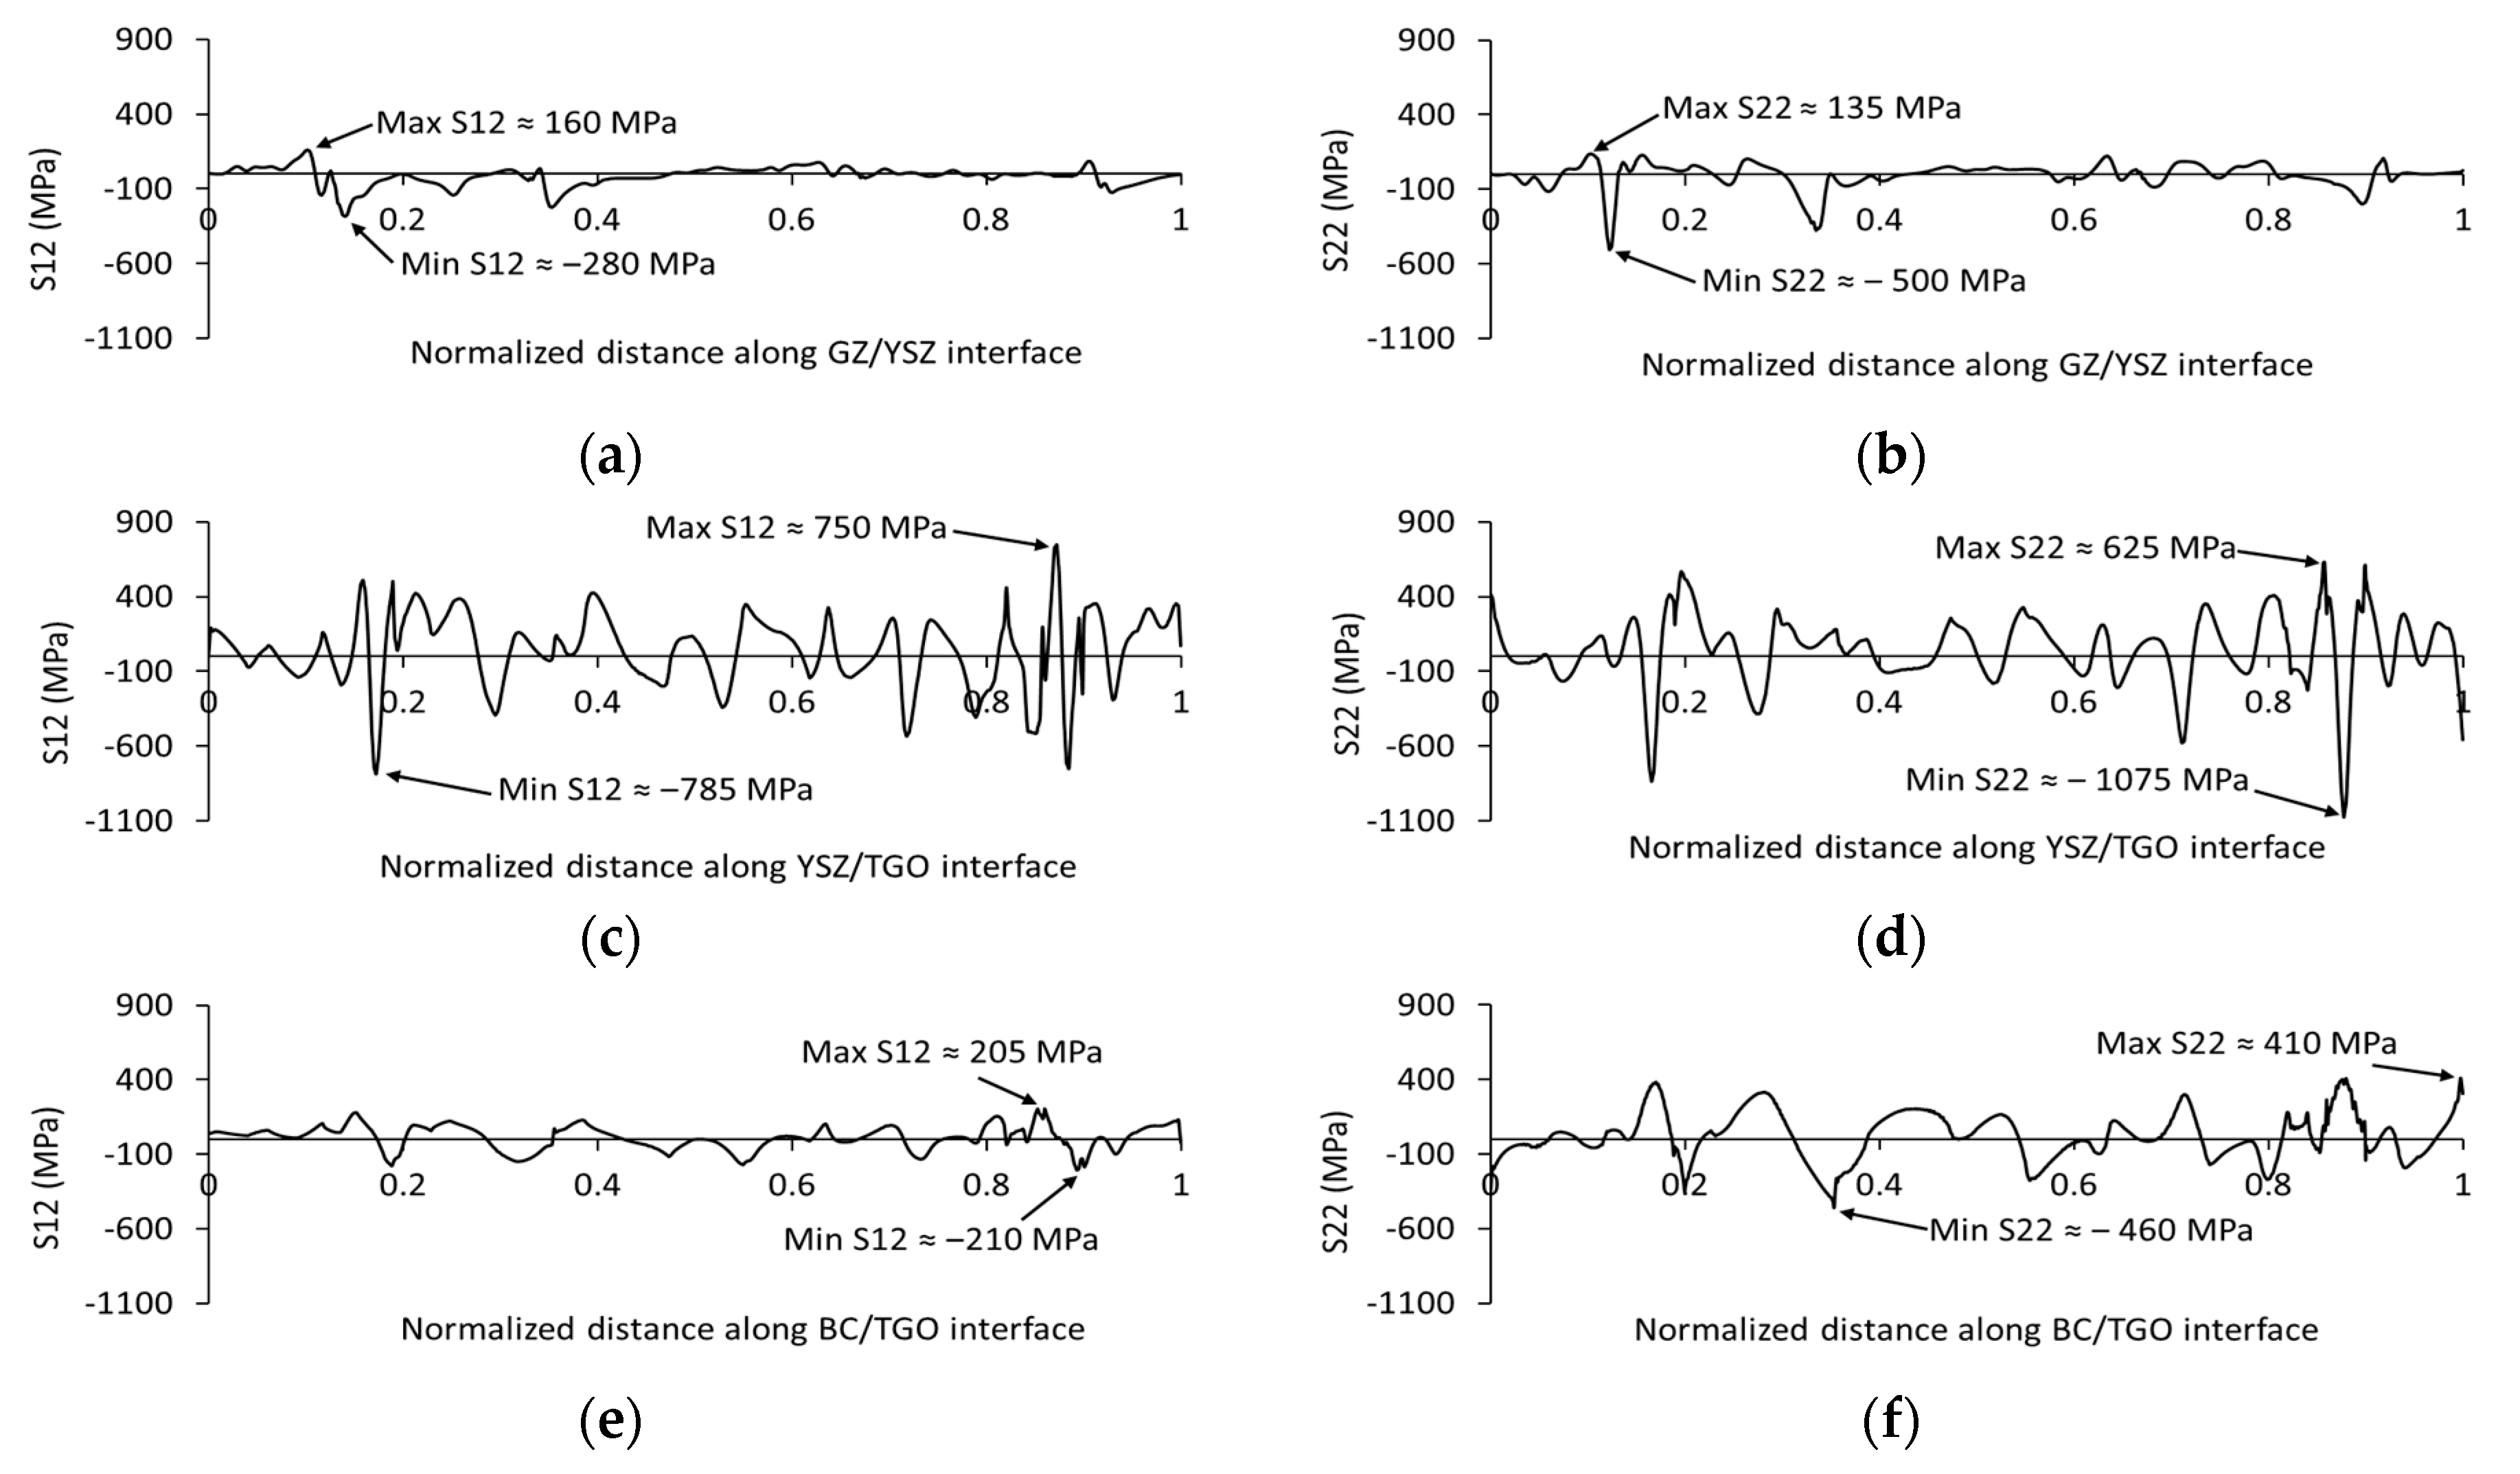
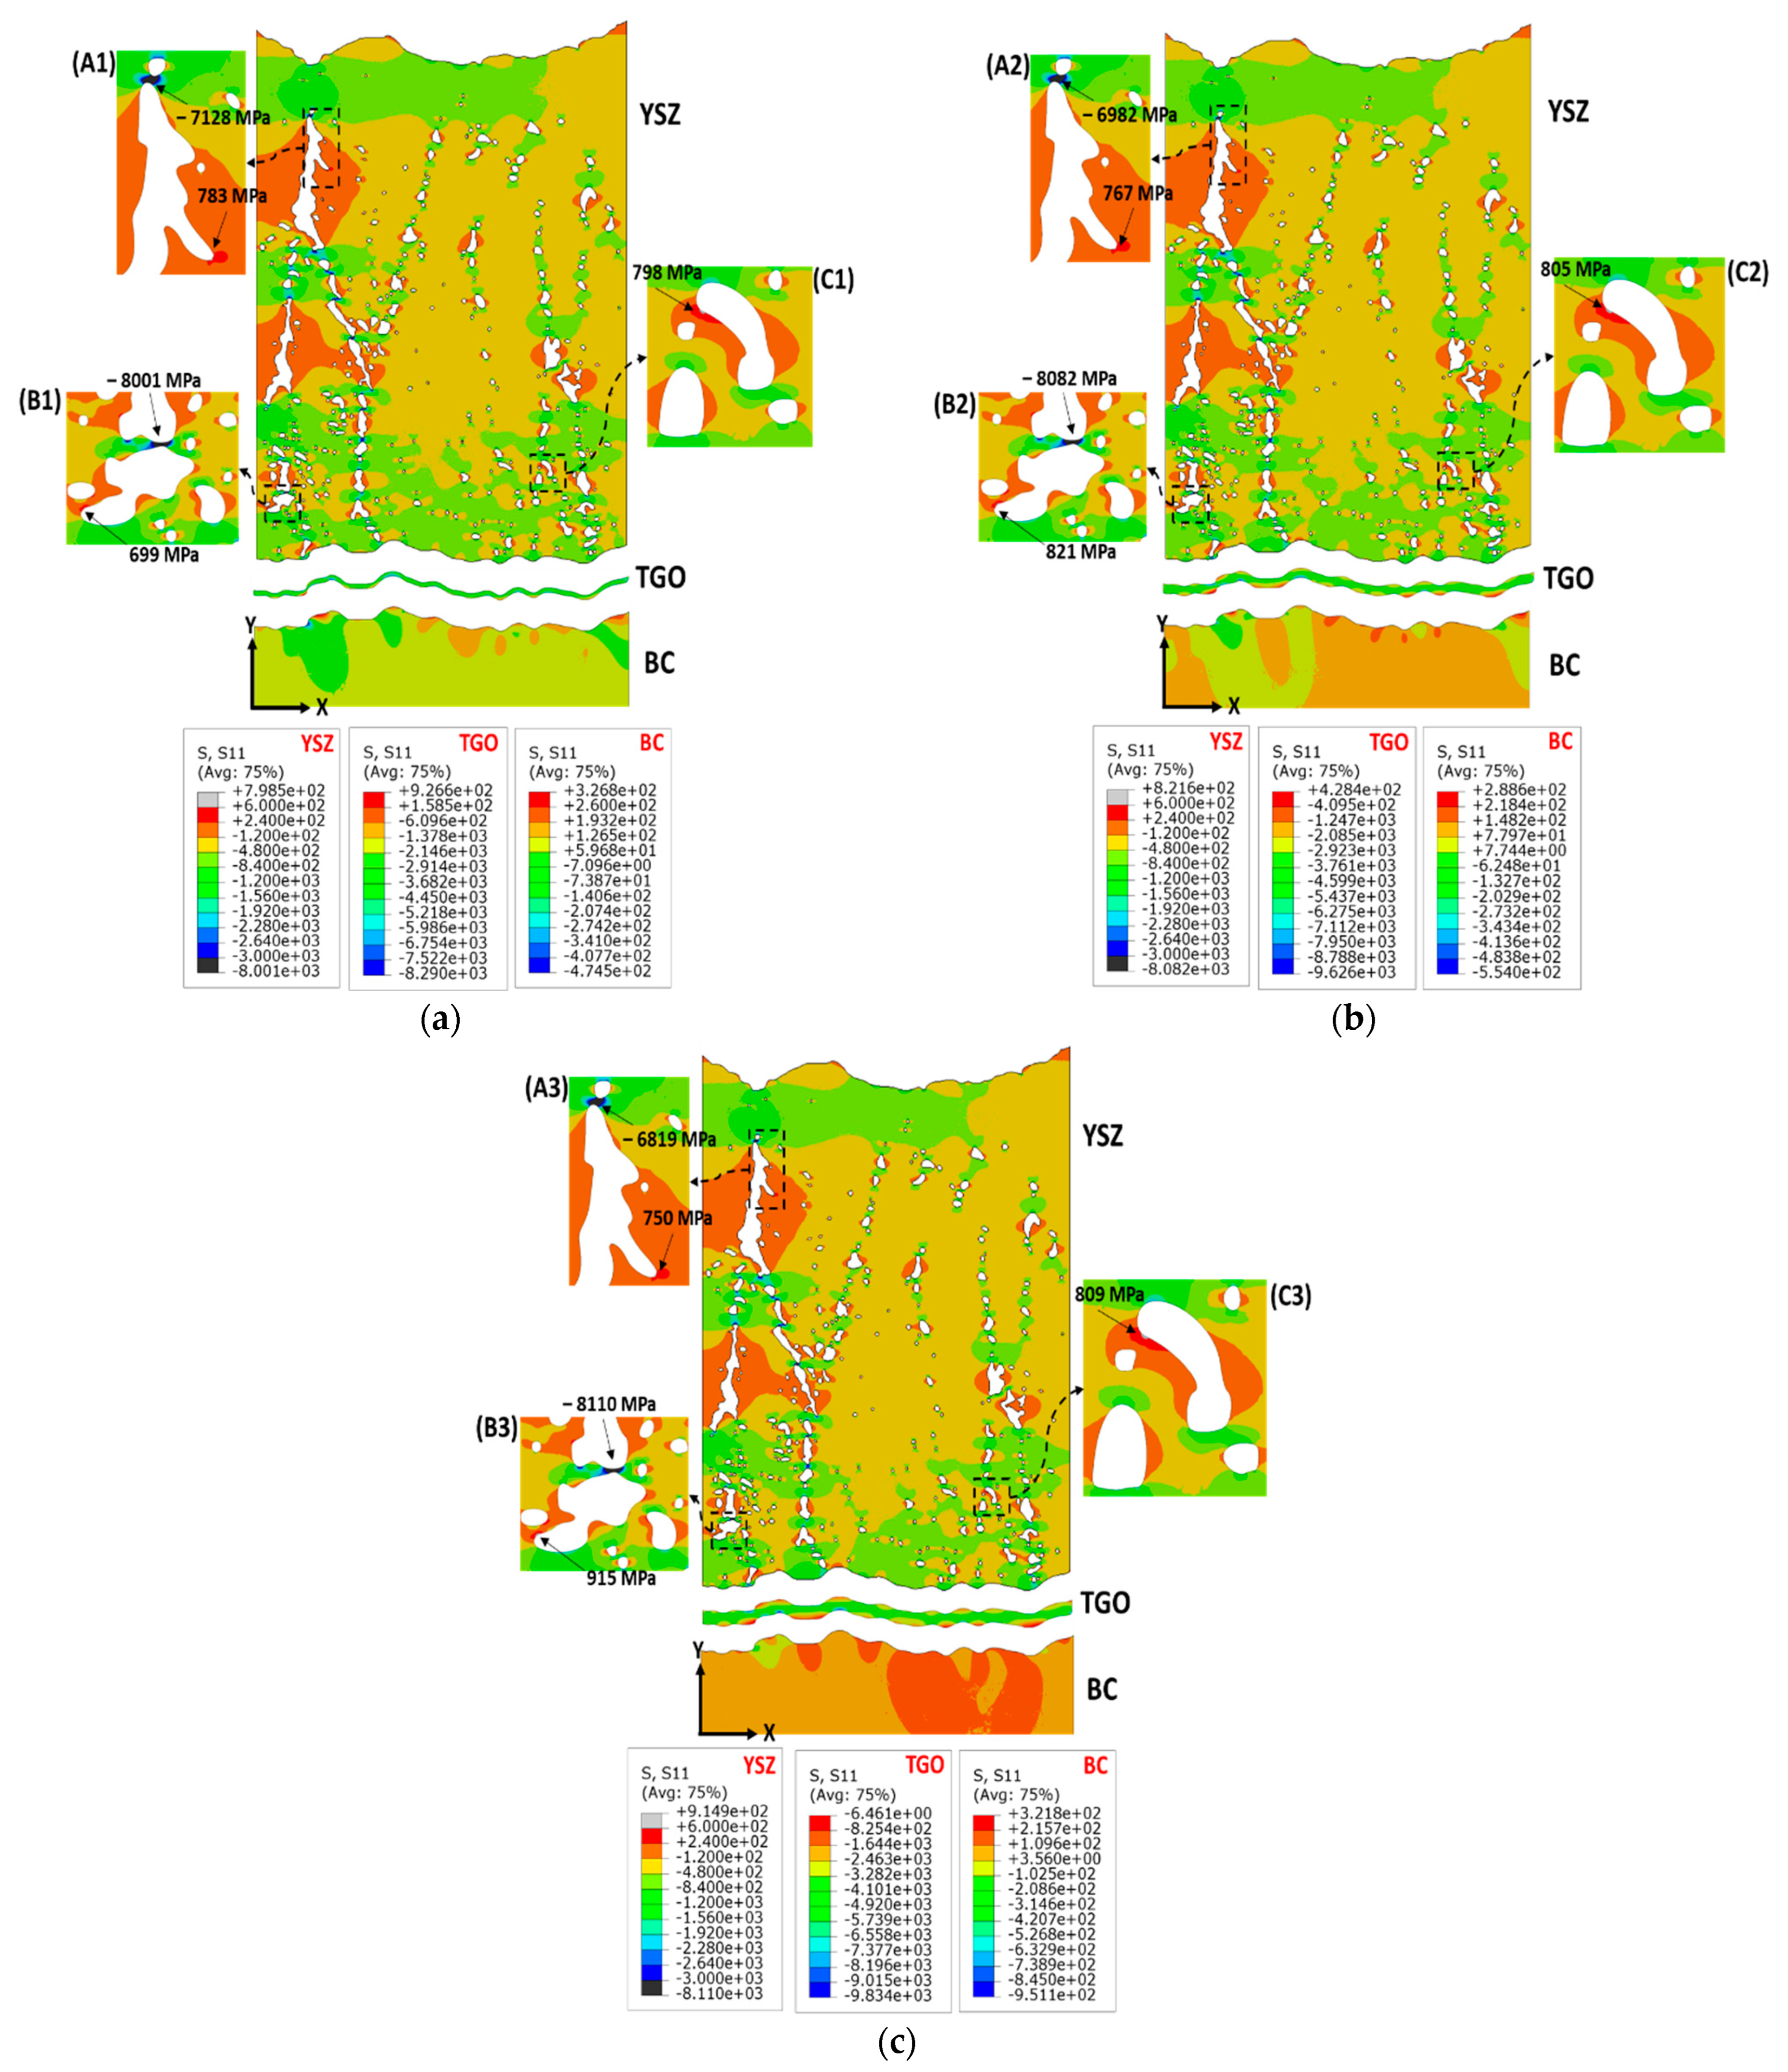
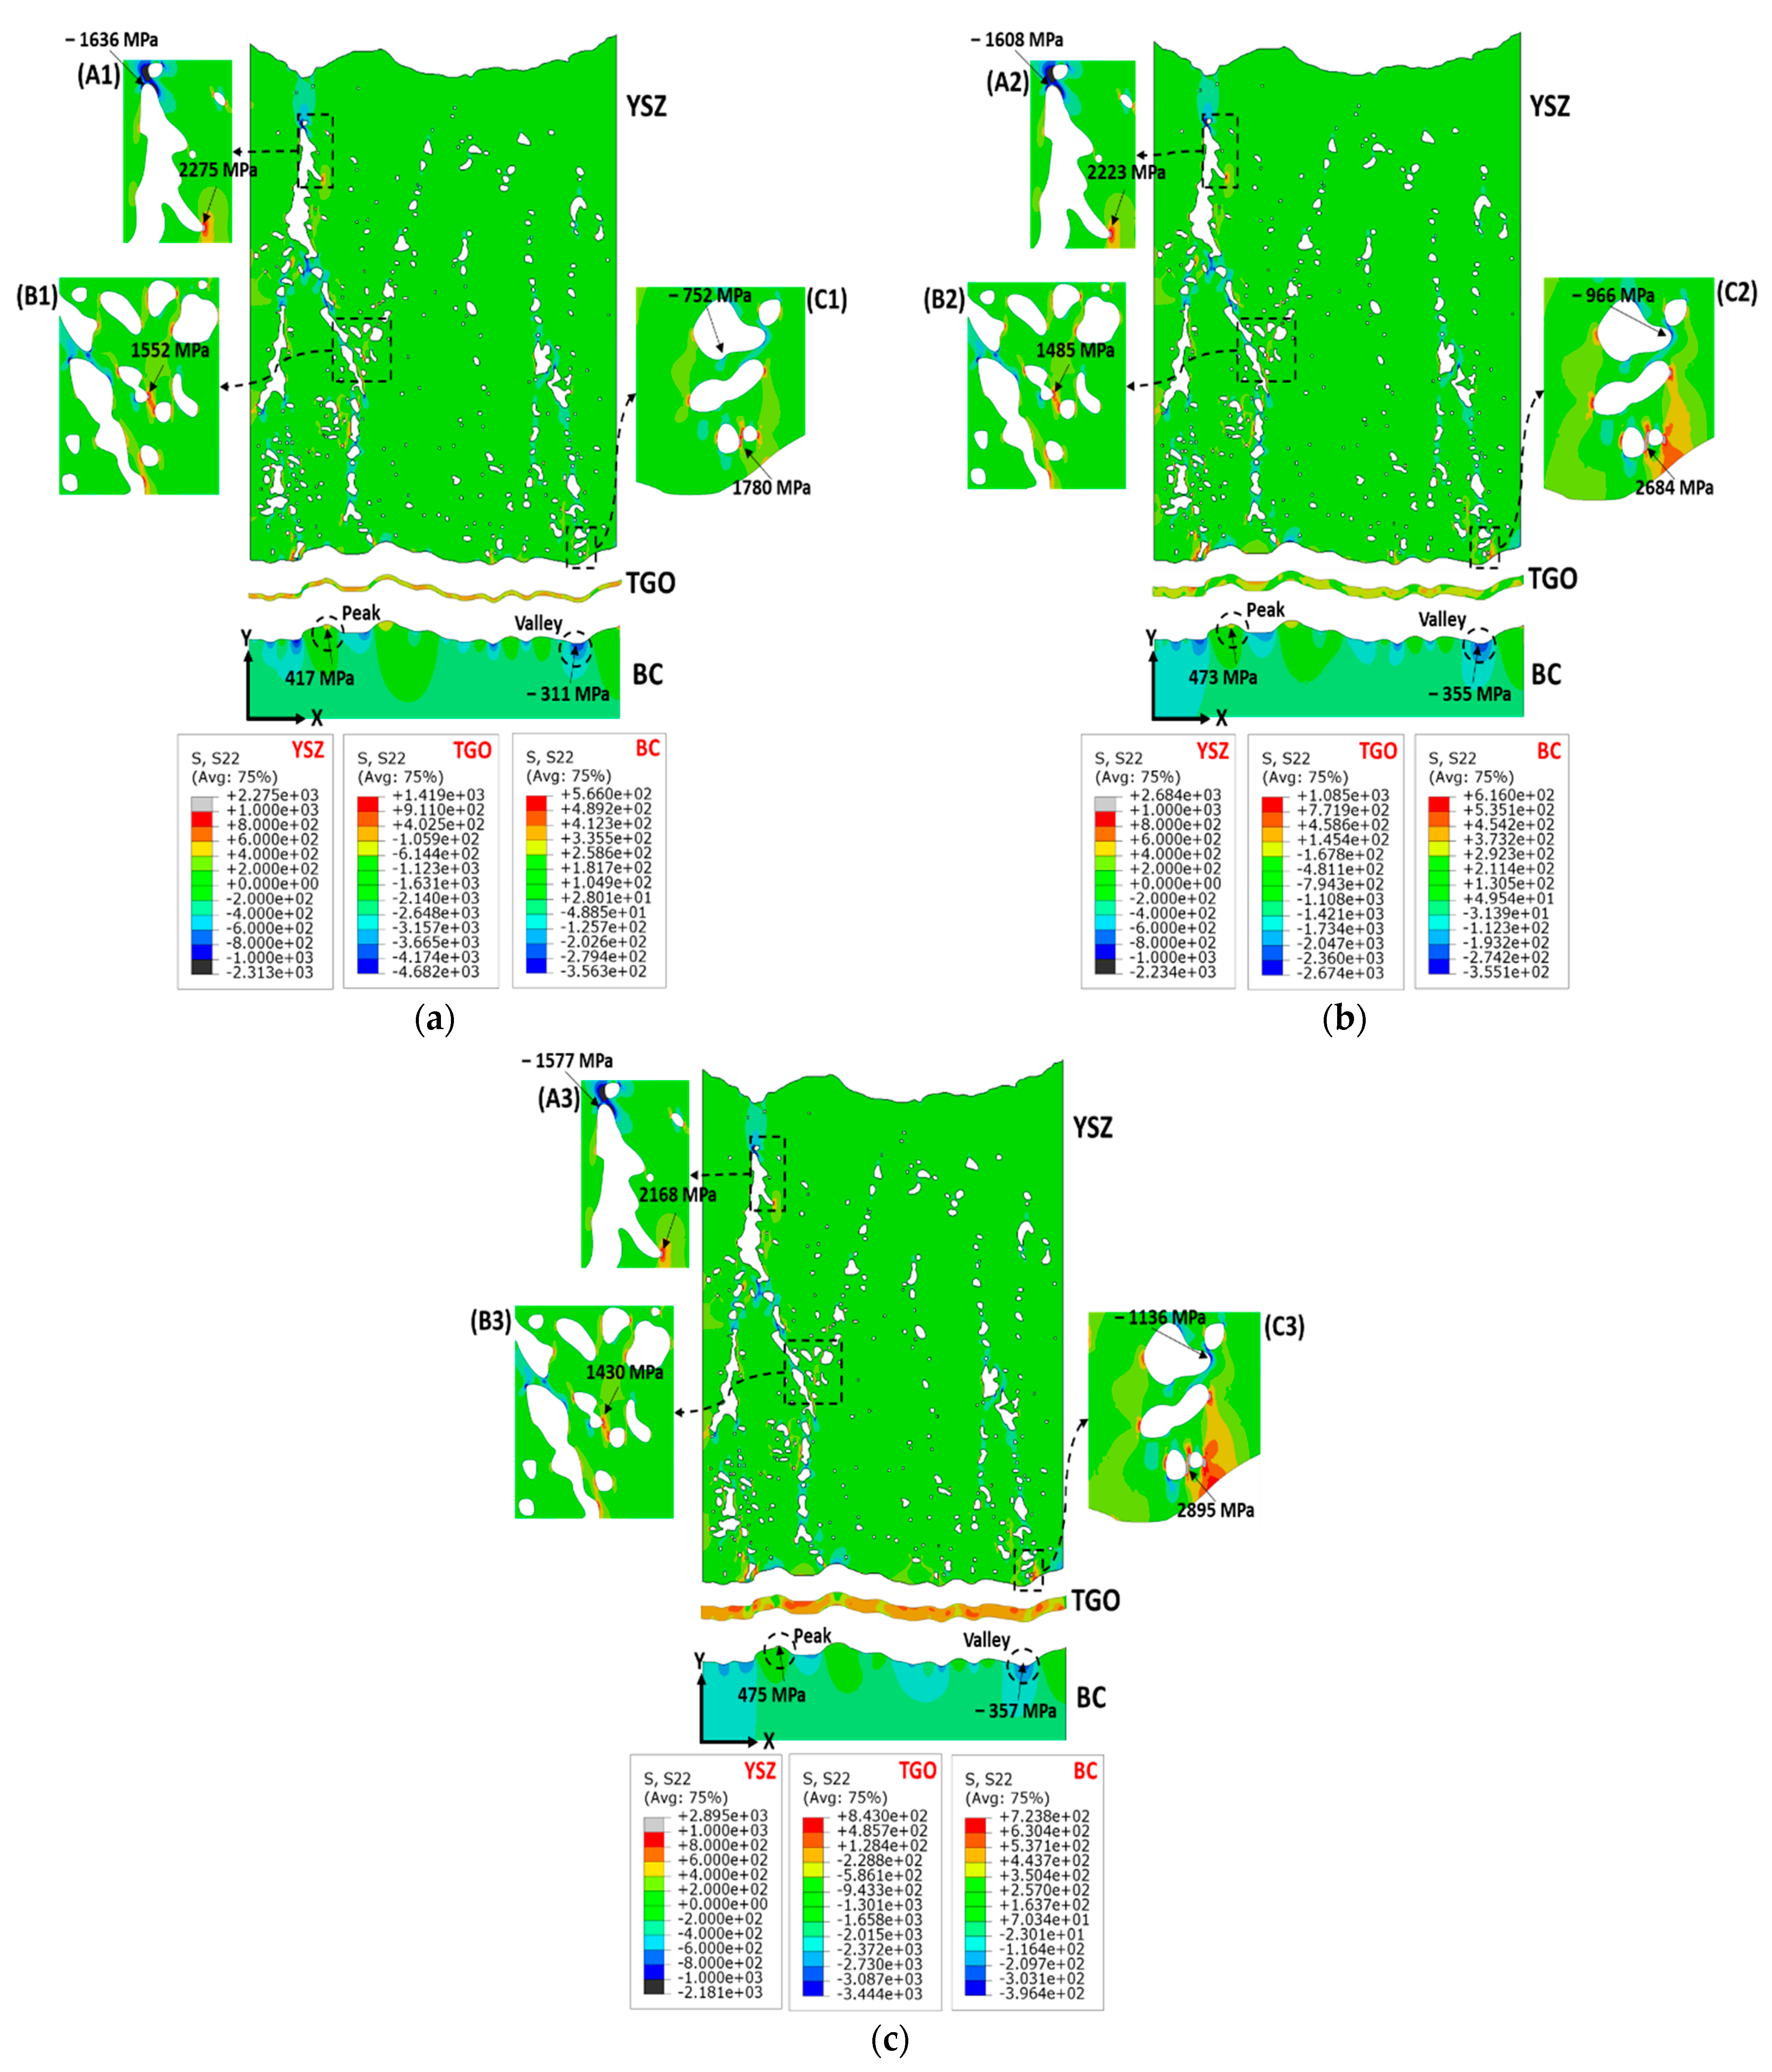
  • The morphology of microstructural features, such as intercolumnar gaps and pores, along with their distribution and interaction zones, can serve as stress concentrators in the direction perpendicular to the general interface layout. Therefore, the tensile stresses developed along the Y-direction (S22) are nearly twice as much as the tensile stresses developed along the X-direction (S11), increasing the likelihood of horizontal crack initiation and propagation and ultimately leading to coating spallation.
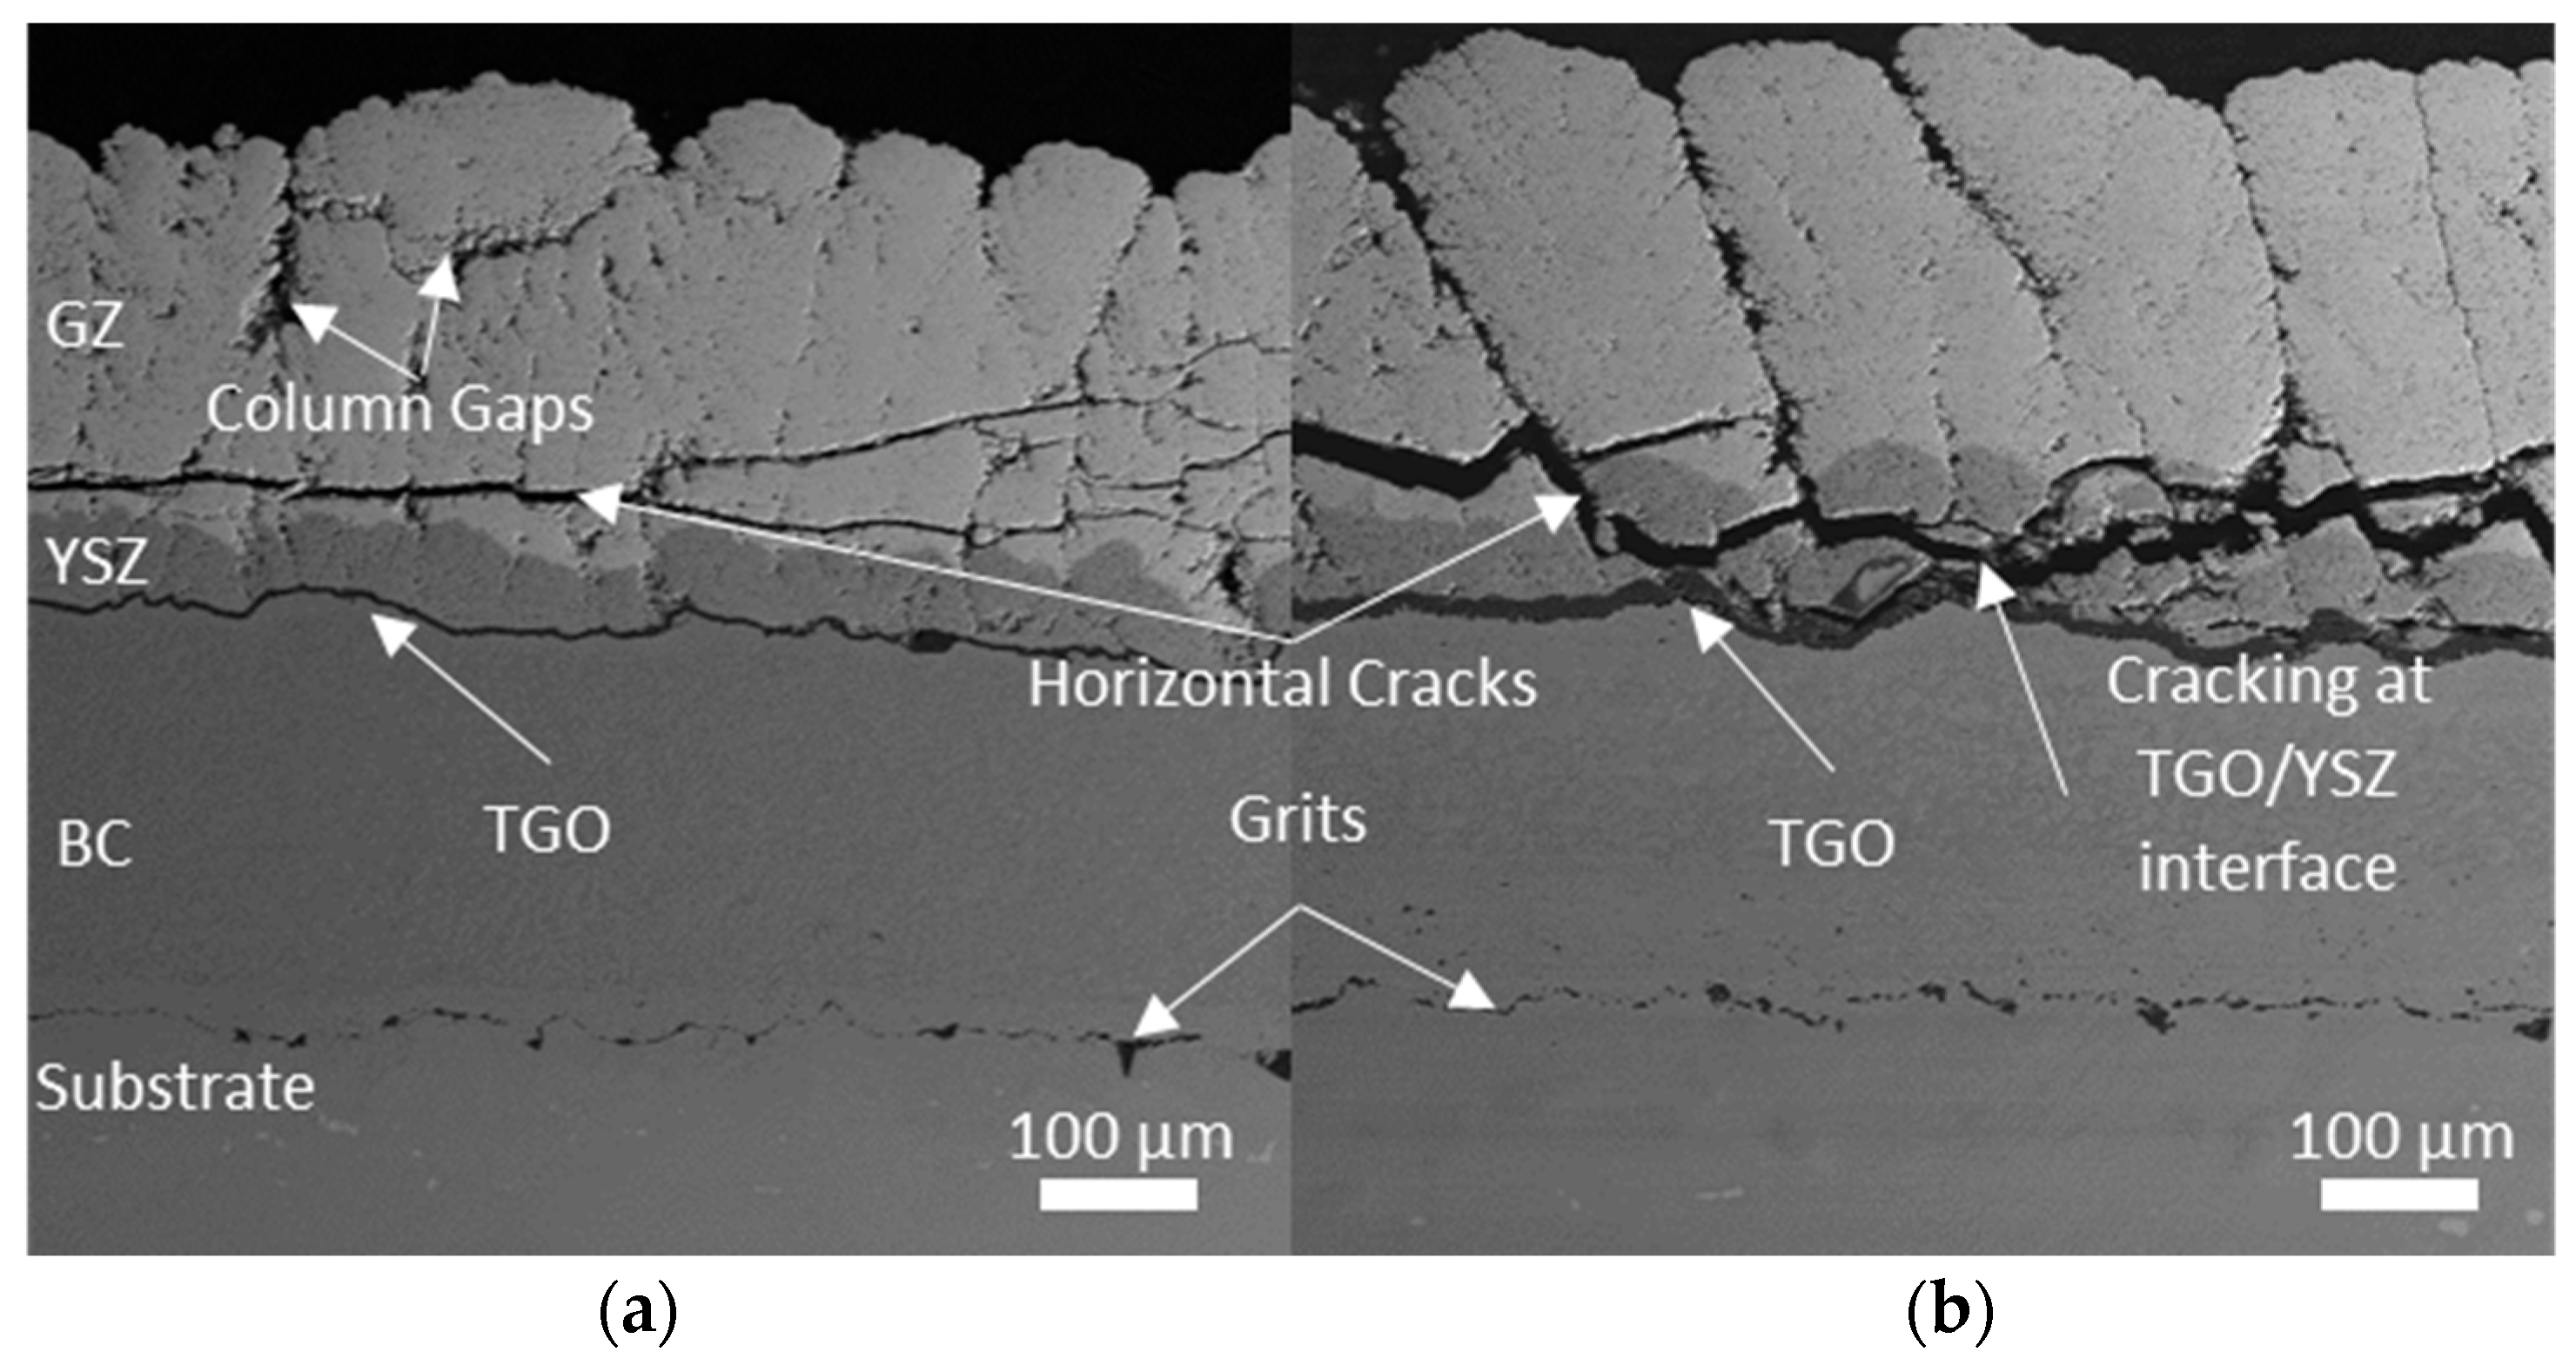
  • The thermomechanical FE results suggest that the swelling of the TGO layer during high-temperature oxidation has a significant influence on both the distribution and evolution of thermal mismatch stresses. The increase in the TGO thickness was observed to elevate stress levels (e.g., an increase of over 500 MPa in S22 stress detected in the YSZ single-layer model when comparing the 2 μm to 8 μm TGO thicknesses). Additionally, the TGO thickening led to the relocation of stress concentration from the upper side of the ceramic layer toward the TC/TGO interface, promoting crack initiation at different locations across the thickness of the ceramic layer. These findings align with and confirm our ex situ experimental observations, where horizontal cracks were recorded at varied locations, such as 60, 130, and 180 μm away from the TGO layer, within the ceramic layer. This contributes to a better understanding of the crack initiation behavior of the multilayer TBC system.
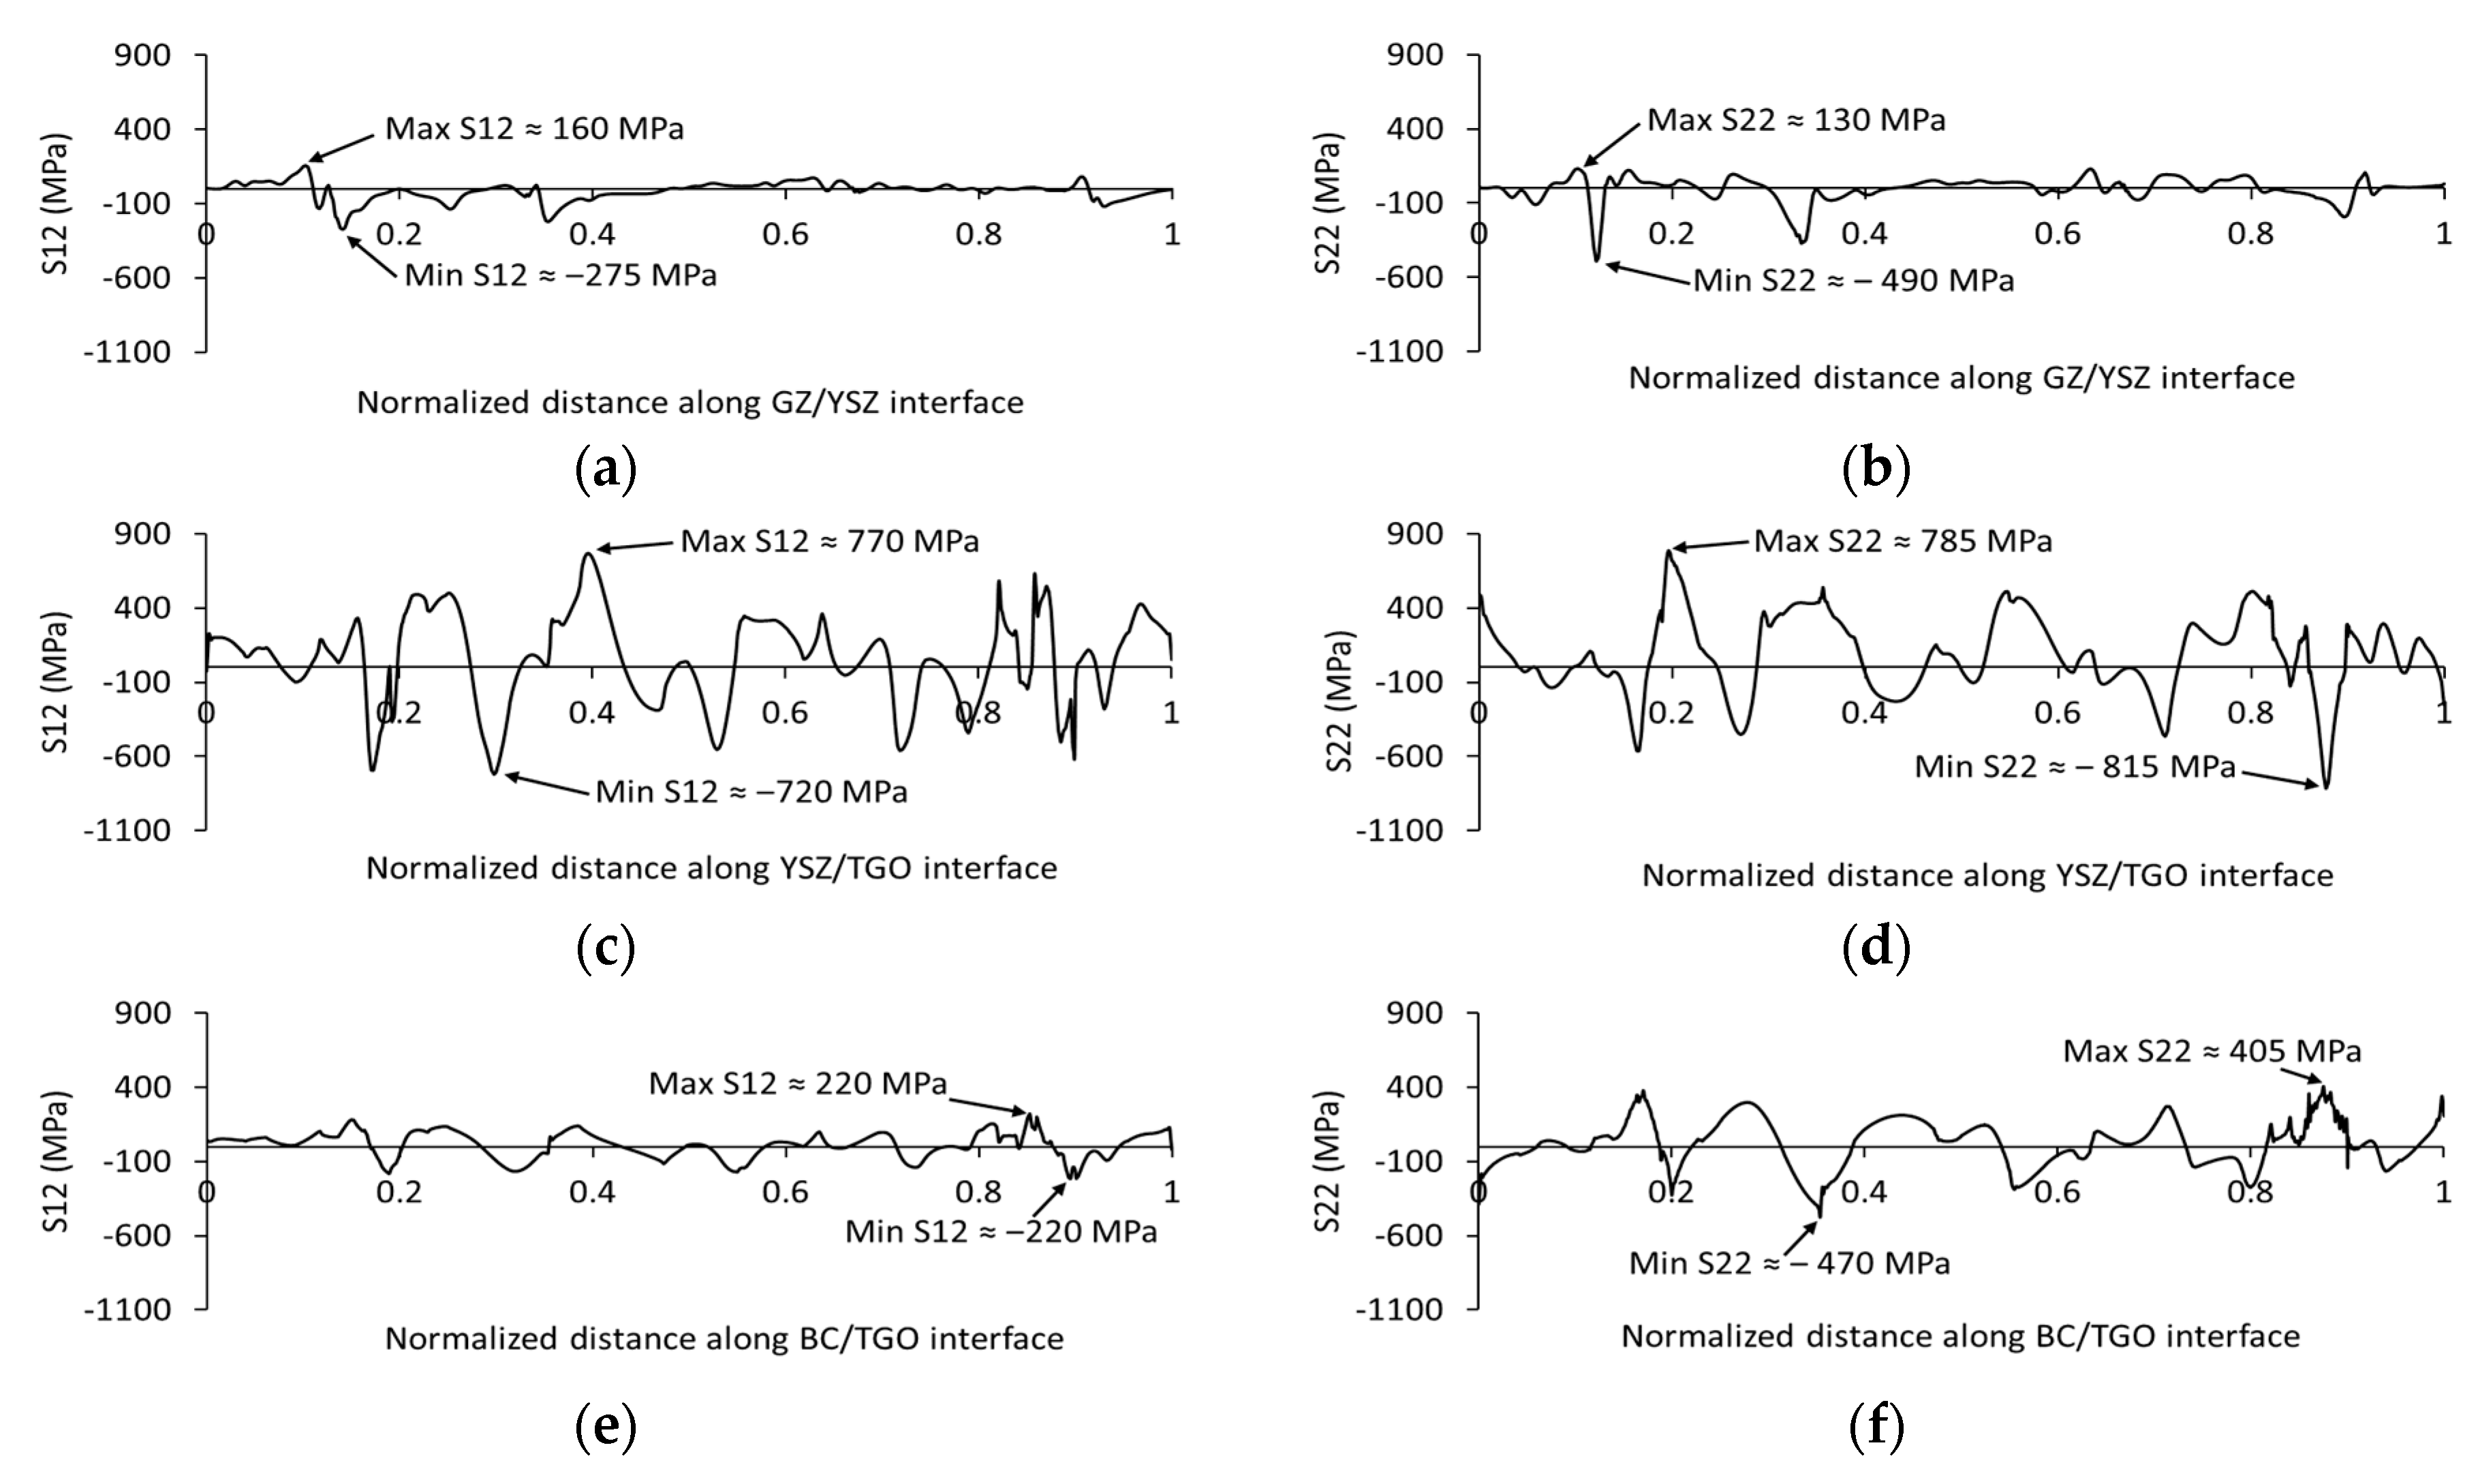
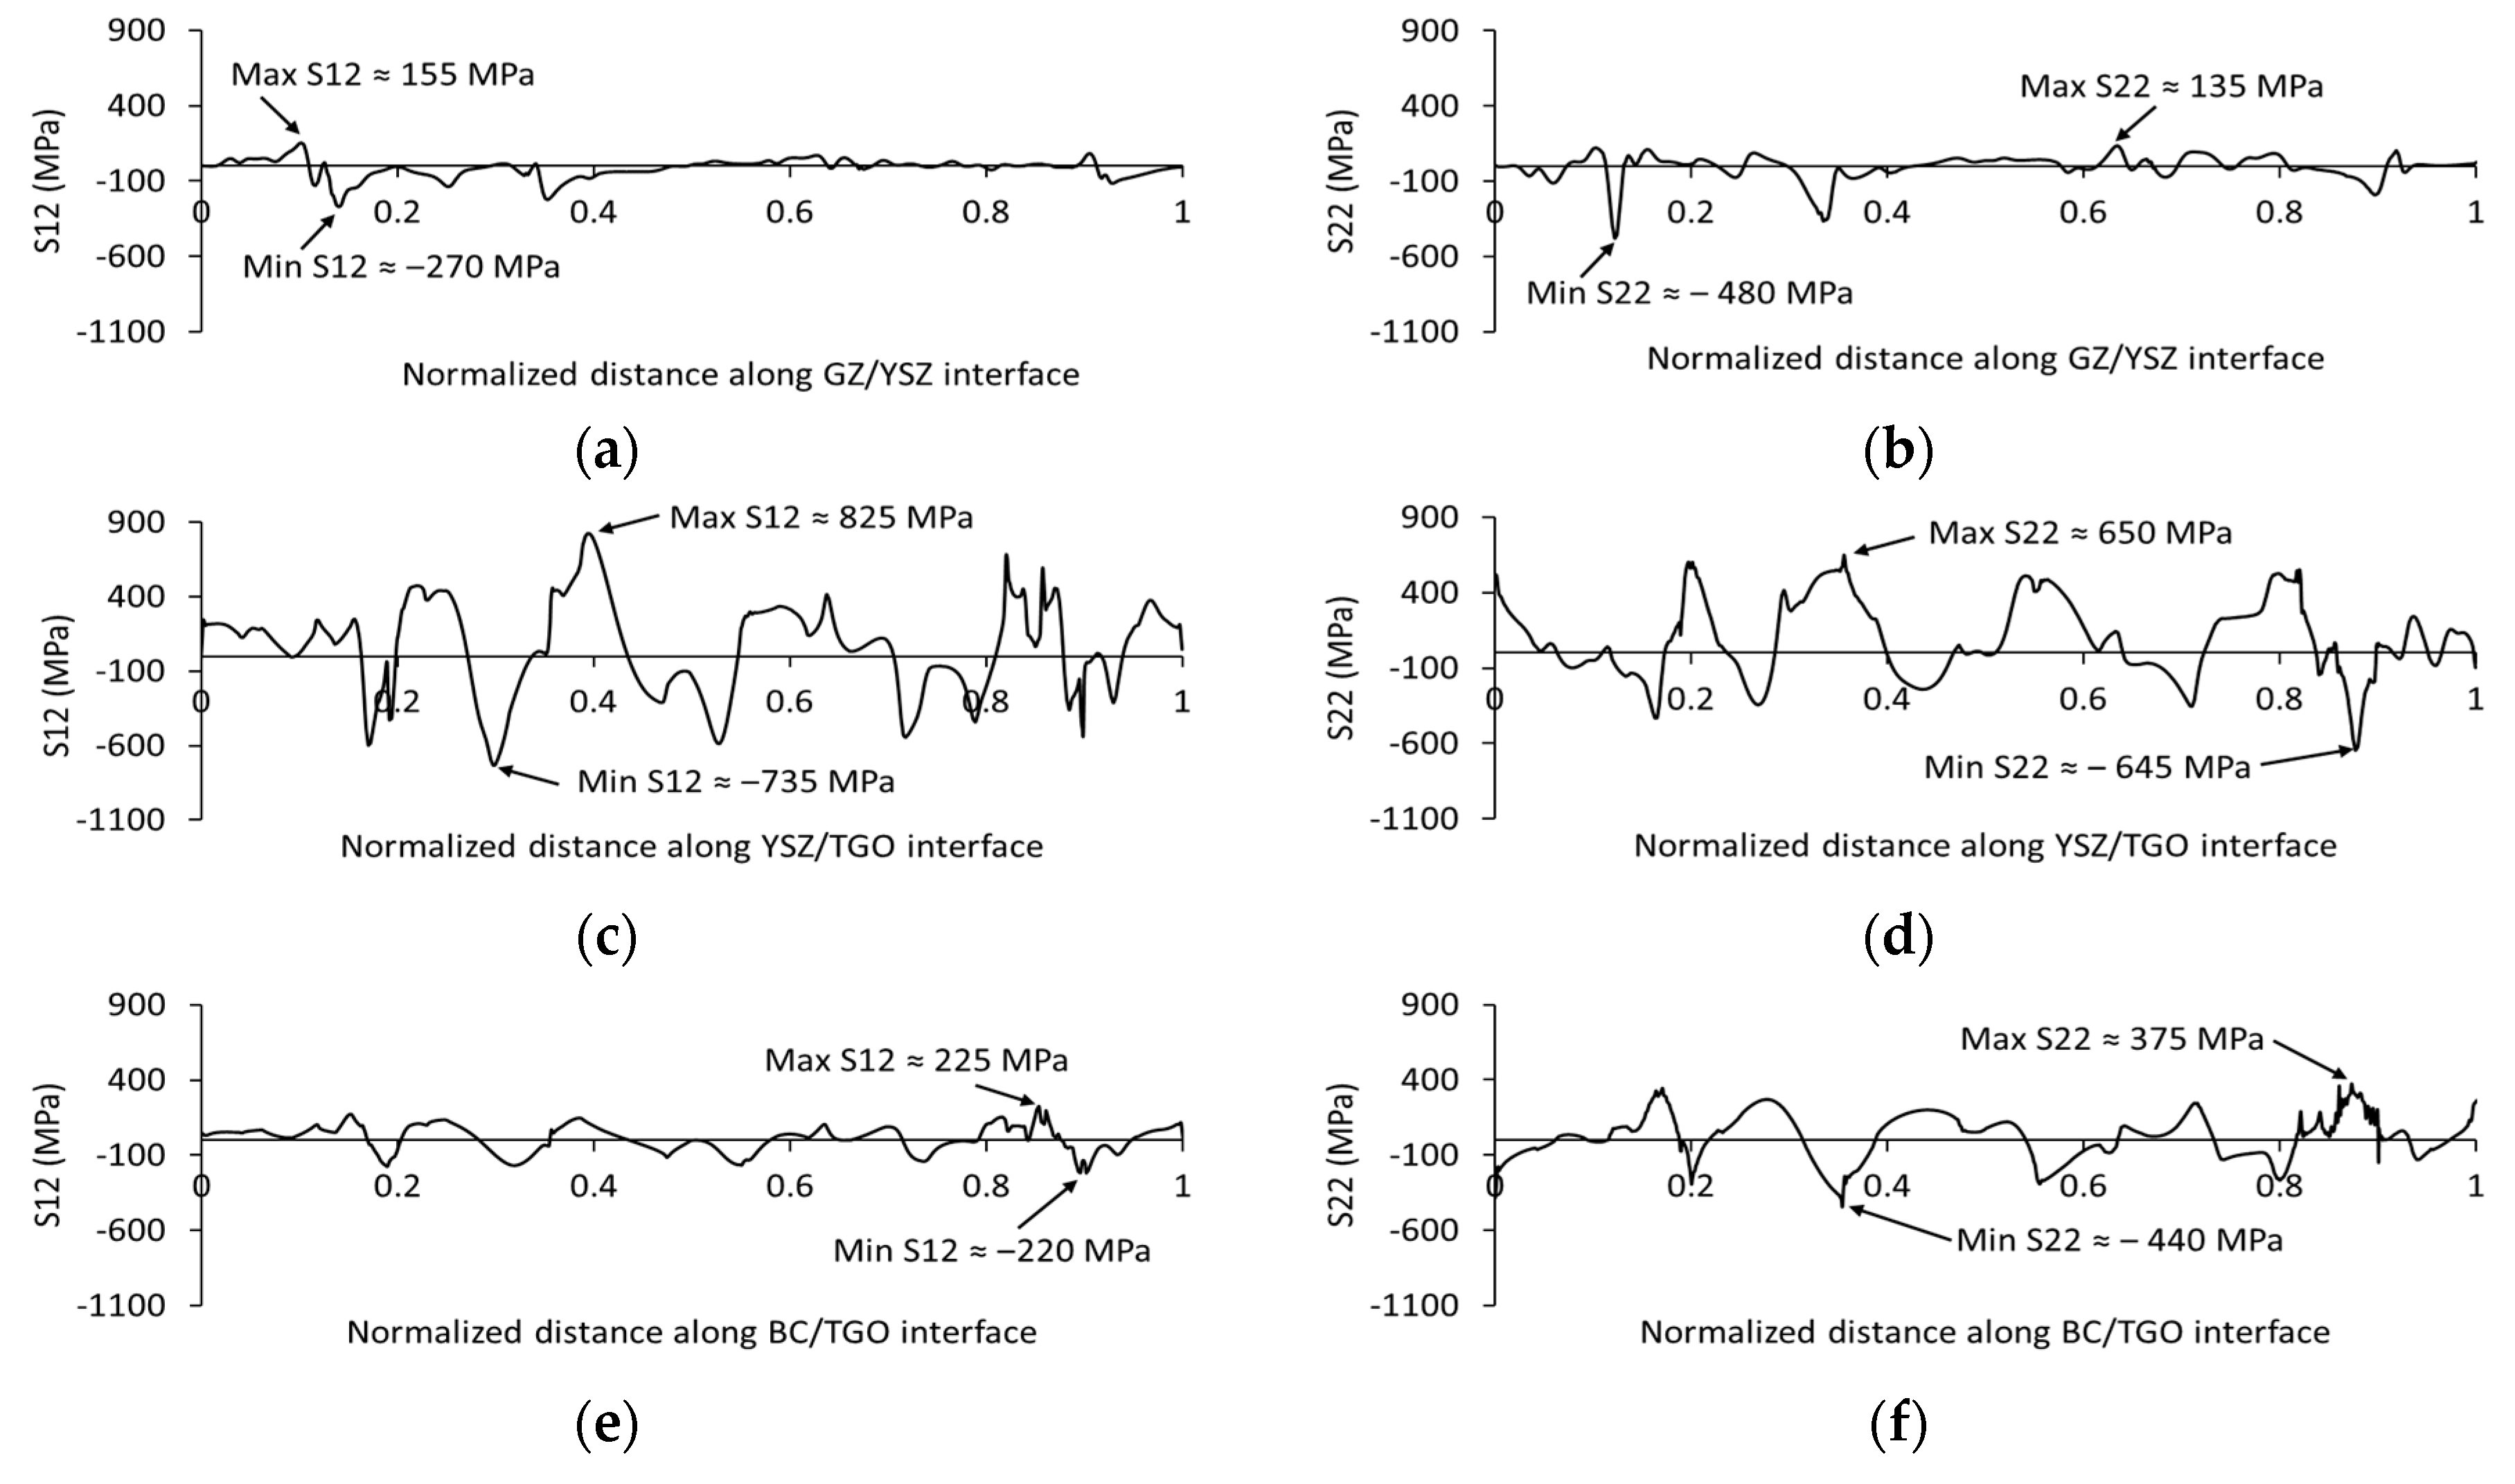
  • The interface between the ceramic layer and the TGO scale was found to be the most critical interface, accommodating higher normal and shear stresses compared with other interfaces in the multilayer TBC system. Generally, the tensile shear stresses along the interface between the ceramic layer and the TGO were greater than the normal stresses in the double-layer SPS structure, with a difference of about 150 MPa at 8 μm TGO, promoting mode II failure. In contrast, in a single-layer TBC system, the tensile normal stresses along the TC/TGO interface were higher, reaching approximately 200 MPa difference at 8 μm TGO, thereby increasing the likelihood of mode I failure. This promotes the understanding of potential failure modes in a multilayer TBC system, which cannot be achieved with ex situ experimental observations.
  • The irregularity in the morphology of the TGO layer can accommodate thermal stresses of different natures (tensile or compressive), promoting arbitrary crack initiation and propagation. For instance, deteriorating microcracks can develop in the valley region through tensile stress S22, while in the peak region, it is dominated by compressive stress S22. Hence, controlling the roughness and thickness of the TGO layer along with improving the interfacial toughness (especially at the ceramic layer/TGO interface) can extend the coating performance and lifetime.

Author Contributions

M.B., M.A. (Mohamed Amer), and N.C. proposed the idea of this article and structured this paper in addition to revising this paper. M.A. (Mohamed Amer) and A.A. were responsible for the FE modeling procedures. M.A. (Mohamed Amer) was responsible for image processing and MATLAB coding. M.A. (Mohamed Amer), M.A. (Muhammad Arshad), and Q.H. were responsible for interpreting, analyzing, and writing this paper. N.C., V.J. and J.N. were responsible for revising and refining this article. All authors have read and agreed to the published version of the manuscript.

Funding

This research received no external funding.

Institutional Review Board Statement

Not applicable.

Informed Consent Statement

Not applicable.

Data Availability Statement

Data are contained within this article.

Conflicts of Interest

Author Nicholas Curry was employed by the company Thermal Spray Innovations. Author Jon Nottingham was employed by the company CN Technical Services Ltd. The remaining authors declare that the research was conducted in the absence of any commercial or financial relationships that could be construed as a potential conflict of interest.

References

  1. Xu, H.; Guo, H.; Gong, S. 16—Thermal Barrier Coatings. In Developments in High Temperature Corrosion and Protection of Materials; Woodhead Publishing Series in Metals and Surface Engineering; Gao, W., Ed.; Woodhead Publishing: Cambridge, UK, 2008; pp. 476–491. ISBN 978-1-84569-219-3. [Google Scholar]
  2. Clarke, D.R.; Oechsner, M.; Padture, N.P. Thermal-Barrier Coatings for More Efficient Gas-Turbine Engines. MRS Bull. 2012, 37, 891–898. [Google Scholar] [CrossRef]
  3. Mušálek, R.; Kovářík, O.; Matějíček, J. In-Situ Observation of Crack Propagation in Thermally Sprayed Coatings. Surf. Coat. Technol. 2010, 205, 1807–1811. [Google Scholar] [CrossRef]
  4. Xue, Z.; Tian, X.; Luan, Y.; Liu, J. Size Effect on Heat Conduction and Associate Thermal Fracture Behavior of Thin Ceramic Plates. Theor. Appl. Fract. Mech. 2021, 113, 102951. [Google Scholar] [CrossRef]
  5. Jiang, C.P.; Wu, X.F.; Li, J.; Song, F.; Shao, Y.F.; Xu, X.H.; Yan, P. A Study of the Mechanism of Formation and Numerical Simulations of Crack Patterns in Ceramics Subjected to Thermal Shock. Acta Mater. 2012, 60, 4540–4550. [Google Scholar] [CrossRef]
  6. Rabiei, A.; Evans, A.G. Failure Mechanisms Associated with the Thermally Grown Oxide in Plasma-Sprayed Thermal Barrier Coatings. Acta Mater. 2000, 48, 3963–3976. [Google Scholar] [CrossRef]
  7. Gok, M.G.; Goller, G. State of the Art of Gadolinium Zirconate Based Thermal Barrier Coatings: Design, Processing and Characterization. In Methods for Film Synthesis and Coating Procedures; IntechOpen: London, UK, 2019. [Google Scholar]
  8. Ballard, J.D.; Davenport, J.; Lewis, C.; Doremus, R.H.; Schadler, L.S.; Nelson, W. Phase Stability of Thermal Barrier Coatings Made from 8 Wt.% Yttria Stabilized Zirconia: A Technical Note. J. Therm. Spray Technol. 2003, 12, 34–37. [Google Scholar] [CrossRef]
  9. Zhang, D.-B.; Wang, B.-Y.; Cao, J.; Song, G.-Y.; Liu, J.-B. Investigation on the Thermo-Chemical Reaction Mechanism between Yttria-Stabilized Zirconia (YSZ) and Calcium-Magnesium-Alumino-Silicate (CMAS). Front. Mater. Sci. 2015, 9, 93–100. [Google Scholar] [CrossRef]
  10. Levi, C.G.; Hutchinson, J.W.; Vidal-Sétif, M.-H.; Johnson, C.A. Environmental Degradation of Thermal-Barrier Coatings by Molten Deposits. MRS Bull. 2012, 37, 932–941. [Google Scholar] [CrossRef]
  11. Mensah, P.F.; Diwan, R.; Nandikolla, S.; Coker, O.; Sahoo, P. Thermo-Mechanical Study of the Role of Gd2Zr2O7 (GZ) in Improving Life of YSZ and GZ Double Layered Thermal Barrier Coatings. In Proceedings of the ASME International Mechanical Engineering Congress and Exposition, Houston, TX, USA, 9–15 November 2012; American Society of Mechanical Engineers: New York, NY, USA, 2012; Volume 45233, pp. 3083–3088. [Google Scholar]
  12. Mahade, S.; Curry, N.; Björklund, S.; Markocsan, N.; Nylén, P.; Vaßen, R. Functional Performance of Gd2Zr2O7/YSZ Multi-Layered Thermal Barrier Coatings Deposited by Suspension Plasma Spray. Surf. Coat. Technol. 2017, 318, 208–216. [Google Scholar] [CrossRef]
  13. Mahade, S.; Zhou, D.; Curry, N.; Markocsan, N.; Nylén, P.; Vaßen, R. Tailored Microstructures of Gadolinium Zirconate/YSZ Multi-Layered Thermal Barrier Coatings Produced by Suspension Plasma Spray: Durability and Erosion Testing. J. Mater. Process. Technol. 2019, 264, 283–294. [Google Scholar] [CrossRef]
  14. Gupta, M.; Kumara, C.; Nylén, P. Bilayer Suspension Plasma-Sprayed Thermal Barrier Coatings with Enhanced Thermal Cyclic Lifetime: Experiments and Modeling. J. Therm. Spray Technol. 2017, 26, 1038–1051. [Google Scholar] [CrossRef]
  15. Evans, A.G.; Clarke, D.R.; Levi, C.G. The Influence of Oxides on the Performance of Advanced Gas Turbines. J. Eur. Ceram. Soc. 2008, 28, 1405–1419. [Google Scholar] [CrossRef]
  16. Amer, M.; Curry, N.; Hayat, Q.; Sharma, R.; Janik, V.; Zhang, X.; Nottingham, J.; Bai, M. Cracking Behavior of Gd2Zr2O7/YSZ Multi-Layered Thermal Barrier Coatings Deposited by Suspension Plasma Spray. Coatings 2023, 13, 107. [Google Scholar] [CrossRef]
  17. Li, J.; Li, S.; Shi, J.; He, J.; He, W.; Wei, L.; Guo, H. The Failure Behavior Analysis Based on Finite Element Simulation of PS-PVD (Gd0.9Yb0.1)2Zr2O7/YSZ Coatings during Burner Rig Tests. Mater. Des. 2023, 231, 112013. [Google Scholar] [CrossRef]
  18. Abdelgawad, A.; Al-Athel, K. Effect of TGO Thickness, Pores, and Creep on the Developed Residual Stresses in Thermal Barrier Coatings under Cyclic Loading Using SEM Image-Based Finite Element Model. Ceram. Int. 2021, 47, 20064–20076. [Google Scholar] [CrossRef]
  19. Fartash, A.H.; Lyavoli, H.F.; Poursaeidi, E.; Schmauder, S. Interfacial Delamination of Porous Thermal Barrier Coatings Based on SEM Image Processing in Finite Element Model. Theor. Appl. Fract. Mech. 2023, 125, 103915. [Google Scholar] [CrossRef]
  20. Zhu, W.; Zhang, Z.B.; Yang, L.; Zhou, Y.C.; Wei, Y.G. Spallation of Thermal Barrier Coatings with Real Thermally Grown Oxide Morphology under Thermal Stress. Mater. Des. 2018, 146, 180–193. [Google Scholar] [CrossRef]
  21. Yang, M.; Zhu, Y.; Wang, X.; Guo, S.; Hu, J.; Zhao, L.; Chu, Y. Effect of Five Kinds of Pores Shape on Thermal Stress Properties of Thermal Barrier Coatings by Finite Element Method. Ceram. Int. 2017, 43, 9664–9678. [Google Scholar] [CrossRef]
  22. Dong, H.; Yang, G.-J.; Cai, H.-N.; Ding, H.; Li, C.-X.; Li, C.-J. The Influence of Temperature Gradient across YSZ on Thermal Cyclic Lifetime of Plasma-Sprayed Thermal Barrier Coatings. Ceram. Int. 2015, 41, 11046–11056. [Google Scholar] [CrossRef]
  23. Zhu, W.; Cai, M.; Yang, L.; Guo, J.W.; Zhou, Y.C.; Lu, C. The Effect of Morphology of Thermally Grown Oxide on the Stress Field in a Turbine Blade with Thermal Barrier Coatings. Surf. Coat. Technol. 2015, 276, 160–167. [Google Scholar] [CrossRef]
  24. Chang, G.C.; Phucharoen, W.; Miller, R.A. Behavior of Thermal Barrier Coatings for Advanced Gas Turbine Blades. Surf. Coat. Technol. 1987, 30, 13–28. [Google Scholar] [CrossRef]
  25. Martena, M.; Botto, D.; Fino, P.; Sabbadini, S.; Gola, M.M.; Badini, C. Modelling of TBC System Failure: Stress Distribution as a Function of TGO Thickness and Thermal Expansion Mismatch. Eng. Fail. Anal. 2006, 13, 409–426. [Google Scholar] [CrossRef]
  26. Ranjbar-Far, M.; Absi, J.; Mariaux, G.; Dubois, F. Simulation of the Effect of Material Properties and Interface Roughness on the Stress Distribution in Thermal Barrier Coatings Using Finite Element Method. Mater. Des. 2010, 31, 772–781. [Google Scholar] [CrossRef]
  27. Krishnasamy, J.; Ponnusami, S.A.; Turteltaub, S.; van der Zwaag, S. Computational Investigation of Porosity Effects on Fracture Behavior of Thermal Barrier Coatings. Ceram. Int. 2019, 45, 20518–20527. [Google Scholar] [CrossRef]
  28. Krishnasamy, J.; Ponnusami, S.A.; Turteltaub, S.; Van Der Zwaag, S. Numerical Investigation into the Effect of Splats and Pores on the Thermal Fracture of Air Plasma-Sprayed Thermal Barrier Coatings. J. Therm. Spray Technol. 2019, 28, 1881–1892. [Google Scholar] [CrossRef]
  29. Moridi, A.; Azadi, M.; Farrahi, G.H. Thermo-Mechanical Stress Analysis of Thermal Barrier Coating System Considering Thickness and Roughness Effects. Surf. Coat. Technol. 2014, 243, 91–99. [Google Scholar] [CrossRef]
  30. Arai, M.; Ochiai, H.; Suidzu, T. A Novel Low-Thermal-Conductivity Plasma-Sprayed Thermal Barrier Coating Controlled by Large Pores. Surf. Coat. Technol. 2016, 285, 120–127. [Google Scholar] [CrossRef]
  31. Kulczyk-Malecka, J.; Zhang, X.; Carr, J.; Carabat, A.L.; Sloof, W.G.; van Der Zwaag, S.; Cernuschi, F.; Nozahic, F.; Monceau, D.; Estournès, C. Influence of Embedded MoSi2 Particles on the High Temperature Thermal Conductivity of SPS Produced Yttria-Stabilised Zirconia Model Thermal Barrier Coatings. Surf. Coat. Technol. 2016, 308, 31–39. [Google Scholar] [CrossRef]
  32. Mohammadi, M.; Poursaeidi, E.; Torkashvand, K. Finite Element Analysis of the Effect of Thermal Cycles and Ageing on the Interface Delamination of Plasma Sprayed Thermal Barrier Coatings. Surf. Coat. Technol. 2019, 375, 243–255. [Google Scholar] [CrossRef]
  33. Cui, S.; Liang, W.; Mora, L.S.; Miao, Q.; Domblesky, J.P.; Lin, H.; Yu, L. Mechanical Analysis and Modeling of Porous Thermal Barrier Coatings. Appl. Surf. Sci. 2020, 512, 145706. [Google Scholar] [CrossRef]
  34. Rad, M.R.; Farrahi, G.H.; Azadi, M.; Ghodrati, M. Stress Analysis of Thermal Barrier Coating System Subjected to Out-of-Phase Thermo-Mechanical Loadings Considering Roughness and Porosity Effect. Surf. Coat. Technol. 2015, 262, 77–86. [Google Scholar]
  35. Yamazaki, Y.; Morikawa, M.; Hamaguchi, T.; Habu, Y.; Ohide, Y.; Takagi, K. Relationship between the Mechanical Properties and Structure of a Suspension Plasma-Sprayed Thermal Barrier Coating with Columnar Microstructure. Surf. Coat. Technol. 2022, 439, 128430. [Google Scholar] [CrossRef]
  36. Kyaw, S.T.; Jones, I.A.; Hyde, T.H. Simulation of Failure of Air Plasma Sprayed Thermal Barrier Coating Due to Interfacial and Bulk Cracks Using Surface-Based Cohesive Interaction and Extended Finite Element Method. J. Strain Anal. Eng. Des. 2016, 51, 132–143. [Google Scholar] [CrossRef]
  37. Solomon, C.; Breckon, T. Fundamentals of Digital Image Processing: A Practical Approach with Examples in Matlab; John Wiley & Sons: Hoboken, NJ, USA, 2011; ISBN 1119957001. [Google Scholar]
  38. Otsu, N. A Threshold Selection Method from Gray-Level Histograms. IEEE Trans. Syst. Man Cybern. 1979, 9, 62–66. [Google Scholar] [CrossRef]
  39. Inkscape Draw Freely. Available online: https://inkscape.org/ (accessed on 1 November 2023).
  40. Abdelgawad, A.; Al-Athel, K.; Albinmousa, J. Analysis of Crack Initiation and Propagation in Thermal Barrier Coatings Using SEM-Based Geometrical Model with Extended Finite Element Method. Ceram. Int. 2021, 47, 33140–33151. [Google Scholar] [CrossRef]
  41. Bäker, M.; Seiler, P. A Guide to Finite Element Simulations of Thermal Barrier Coatings. J. Therm. Spray Technol. 2017, 26, 1146–1160. [Google Scholar] [CrossRef]
  42. Zhang, L.; Wang, Y.; Fan, W.; Gao, Y.; Sun, Y.; Bai, Y. A Simulation Study on the Crack Propagation Behavior of Nanostructured Thermal Barrier Coatings with Tailored Microstructure. Coatings 2020, 10, 722. [Google Scholar] [CrossRef]
  43. Vencl, A.A.; Mrdak, M.R. Thermal Cycling Behaviour of Plasma Sprayed NiCr-Al-Co-Y2O3 Bond Coat in Thermal Barrier Coating System. Therm. Sci. 2019, 23, 1789–1800. [Google Scholar] [CrossRef]
  44. Hosford, W.F. Mechanical Behavior of Materials; Cambridge University Press: Cambridge, UK, 2010; ISBN 0521195691. [Google Scholar]
  45. Ranjbar-Far, M.; Absi, J.; Mariaux, G. Finite Element Modeling of the Different Failure Mechanisms of a Plasma Sprayed Thermal Barrier Coatings System. J. Therm. Spray Technol. 2012, 21, 1234–1244. [Google Scholar] [CrossRef]
  46. Chen, L.; Yueming, L. Interface Stress Evolution Considering the Combined Creep–Plastic Behavior in Thermal Barrier Coatings. Mater. Des. 2016, 89, 245–254. [Google Scholar] [CrossRef]
  47. Rösler, J.; Bäker, M.; Aufzug, K. A Parametric Study of the Stress State of Thermal Barrier Coatings: Part I: Creep Relaxation. Acta Mater. 2004, 52, 4809–4817. [Google Scholar]
  48. Haynes International HASTELLOY® X Alloy Principal Features. Available online: https://haynesintl.com/docs/default-source/pdfs/new-alloy-brochures/high-temperature-alloys/brochures/x-brochure.pdf?sfvrsn=15b829d4_40 (accessed on 7 November 2023).
  49. Zhou, Y.C.; Hashida, T. Coupled Effects of Temperature Gradient and Oxidation on Thermal Stress in Thermal Barrier Coating System. Int. J. Solids Struct. 2001, 38, 4235–4264. [Google Scholar] [CrossRef]
  50. Cheng, J.; Jordan, E.H.; Barber, B.; Gell, M. Thermal/Residual Stress in an Electron Beam Physical Vapor Deposited Thermal Barrier Coating System. Acta Mater. 1998, 46, 5839–5850. [Google Scholar] [CrossRef]
  51. Taylor, R.E.; Wang, X.; Xu, X. Thermophysical Properties of Thermal Barrier Coatings. Surf. Coat. Technol. 1999, 120, 89–95. [Google Scholar] [CrossRef]
  52. Guo, L.; Guo, H.; Peng, H.; Gong, S. Thermophysical Properties of Yb2O3 Doped Gd2Zr2O7 and Thermal Cycling Durability of (Gd0.9Yb0.1)2Zr2O7/YSZ Thermal Barrier Coatings. J. Eur. Ceram. Soc. 2014, 34, 1255–1263. [Google Scholar] [CrossRef]
  53. Peng, X.; Sridhar, N.; Clarke, D.R. The Stress Distribution around Holes in Thermal Barrier Coatings. Mater. Sci. Eng. A 2004, 380, 208–214. [Google Scholar] [CrossRef]
  54. Nychka, J.A.; Xu, T.; Clarke, D.R.; Evans, A.G. The Stresses and Distortions Caused by Formation of a Thermally Grown Alumina: Comparison between Measurements and Simulations. Acta Mater. 2004, 52, 2561–2568. [Google Scholar] [CrossRef]
  55. Xu, B.Q.; Luo, L.R.; Lu, J.; Zhao, X.F.; Xiao, P. Effect of Residual Stress on the Spallation of the Thermally-Grown Oxide Formed on NiCoCrAlY Coating. Surf. Coat. Technol. 2020, 381, 125112. [Google Scholar] [CrossRef]
  56. Sohn, Y.H.; Vaidyanathan, K.; Ronski, M.; Jordan, E.H.; Gell, M. Thermal Cycling of EB-PVD/MCrAlY Thermal Barrier Coatings: II. Evolution of Photo-Stimulated Luminescence. Surf. Coat. Technol. 2001, 146, 102–109. [Google Scholar] [CrossRef]
  57. Yang, X.; Zhang, J.; Lu, Z.; Park, H.-Y.; Jung, Y.-G.; Park, H.; Koo, D.D.; Sinatra, R.; Zhang, J. Removal and Repair Techniques for Thermal Barrier Coatings: A Review. Trans. IMF 2020, 98, 121–128. [Google Scholar] [CrossRef]
  58. Dong, H.; Yang, G.; Li, C.; Luo, X.; Li, C. Effect of TGO Thickness on Thermal Cyclic Lifetime and Failure Mode of Plasma-sprayed TBC S. J. Am. Ceram. Soc. 2014, 97, 1226–1232. [Google Scholar] [CrossRef]
  59. Doleker, K.M.; Karaoglanli, A.C.; Ozgurluk, Y.; Kobayashi, A. Performance of Single YSZ, Gd2Zr2O7 and Double-Layered YSZ/Gd2Zr2O7 Thermal Barrier Coatings in Isothermal Oxidation Test Conditions. Vacuum 2020, 177, 109401. [Google Scholar] [CrossRef]
  60. Gupta, M.; Skogsberg, K.; Nylén, P. Influence of Topcoat-Bondcoat Interface Roughness on Stresses and Lifetime in Thermal Barrier Coatings. J. Therm. Spray Technol. 2014, 23, 170–181. [Google Scholar] [CrossRef]
  61. Shi, J.; Zhang, T.; Sun, B.; Wang, B.; Zhang, X.; Song, L. Isothermal Oxidation and TGO Growth Behavior of NiCoCrAlY-YSZ Thermal Barrier Coatings on a Ni-Based Superalloy. J. Alloys Compd. 2020, 844, 156093. [Google Scholar] [CrossRef]
  62. Song, Y.; Wu, W.; Xie, F.; Liu, Y.; Wang, T. A Theoretical Model for Predicting Residual Stress Generation in Fabrication Process of Double-Ceramic-Layer Thermal Barrier Coating System. PLoS ONE 2017, 12, e0169738. [Google Scholar] [CrossRef] [PubMed]
  63. Luo, L.; Chen, Y.; Zhou, M.; Shan, X.; Lu, J.; Zhao, X. Progress Update on Extending the Durability of Air Plasma Sprayed Thermal Barrier Coatings. Ceram. Int. 2022, 48, 18021–18034. [Google Scholar] [CrossRef]
  64. Amer, M.; Curry, N.; Arshad, M.; Hayat, Q.; Janik, V.; Nottingham, J.; Bai, M. Unraveling the Cracking Mechanisms of Air Plasma-Sprayed Thermal Barrier Coatings: An In-Situ SEM Investigation. Coatings 2023, 13, 1493. [Google Scholar] [CrossRef]
  65. Ghadami, F.; Sabour Rouh Aghdam, A.; Ghadami, S.; Zeng, Q. Effect of Vacuum Heat Treatment on the Oxidation Kinetics of Freestanding Nanostructured NiCoCrAlY Coatings Deposited by High-Velocity Oxy-Fuel Spraying. J. Vac. Sci. Technol. A 2020, 38, 022601. [Google Scholar] [CrossRef]
  66. Ghadami, F.; Davoudabadi, M.A.; Ghadami, S. Cyclic Oxidation Properties of the Nanocrystalline AlCrFeCoNi High-Entropy Alloy Coatings Applied by the Atmospheric Plasma Spraying Technique. Coatings 2022, 12, 372. [Google Scholar] [CrossRef]
  67. Xie, S.; Song, C.; Yu, Z.; Liu, S.; Lapostolle, F.; Klein, D.; Deng, C.; Liu, M.; Liao, H. Effect of Environmental Pressure on the Microstructure of YSZ Thermal Barrier Coating via Suspension Plasma Spraying. J. Eur. Ceram. Soc. 2021, 41, 535–543. [Google Scholar] [CrossRef]
  68. He, P.; Sun, H.; Gui, Y.; Lapostolle, F.; Liao, H.; Coddet, C. Microstructure and Properties of Nanostructured YSZ Coating Prepared by Suspension Plasma Spraying at Low Pressure. Surf. Coat. Technol. 2015, 261, 318–326. [Google Scholar] [CrossRef]
Figure 1. Cross-sectional backscattered electron (BSE) morphology of a GZ/YSZ SPS coating showing different cracking modes corresponding to thermal treatment: (a) horizontal cracking after 10 h of thermal treatment and (b) horizontal and interfacial cracking after 100 h of thermal treatment [16].
Coatings 14 00123 g001
Figure 3. The generated solid geometry: (a) double-layer model including GZ and YSZ ceramic layers, (b) single-layer model with a ceramic layer of YSZ material, and (c) single-layer model with a ceramic layer of GZ material.
Coatings 14 00123 g003
Figure 4. The geometrical model includes the used (a) mechanical boundary conditions and (b) thermal loading history for the FE model.
Coatings 14 00123 g004
Figure 5. FE model convergence and mesh independence.
Coatings 14 00123 g005
Figure 6. The stress fields in the X-direction (S11, MPa) within double-layer TBC components at different TGO thicknesses: (a) 2 μm TGO, (b) 5 μm TGO, and (c) 8 μm TGO.
Coatings 14 00123 g006
Figure 7. The stress fields in the Y-direction (S22, MPa) within double-layer TBC components at different TGO thicknesses: (a) 2 μm TGO, (b) 5 μm TGO, and (c) 8 μm TGO.
Coatings 14 00123 g007
Figure 8. The variation in shear stress (S12) and normal stress (S22) along the double-layer SPS interfaces at a TGO thickness of 2 μm: (a,b) GZ/YSZ interface, (c,d) YSZ/TGO interface, and (e,f) BC/TGO interface.
Coatings 14 00123 g008
Figure 9. The variation in shear stress (S12) and normal stress (S22) along the double-layer SPS interfaces at a TGO thickness of 5 μm: (a,b) GZ/YSZ interface, (c,d) YSZ/TGO interface, and (e,f) BC/TGO interface.
Coatings 14 00123 g009
Figure 10. The variation in shear stress (S12) and normal stress (S22) along the double-layer SPS interfaces at a TGO thickness of 8 μm: (a,b) GZ/YSZ interface, (c,d) YSZ/TGO interface, at (e,f) BC/TGO interface.
Coatings 14 00123 g010
Figure 11. The stress fields in the X-direction (S11, MPa) within YSZ single-layer TBC components at different TGO thicknesses: (a) 2 μm TGO, (b) 5 μm TGO, and (c) 8 μm TGO.
Coatings 14 00123 g011
Figure 12. The stress fields in the Y-direction (S22, MPa) within YSZ single-layer TBC components at different TGO thicknesses: (a) 2 μm TGO, (b) 5 μm TGO, and (c) 8 μm TGO.
Coatings 14 00123 g012
Figure 13. The variation in shear stress (S12) and normal stress (S22) along the YSZ/TGO interface in single-layer SPS (a,b): 2 μm TGO thickness, (c,d) 5 μm TGO thickness, and (e,f) 8 μm TGO thickness.
Coatings 14 00123 g013
Figure 14. The stress fields in the X-direction (S11, MPa) within GZ single-layer TBC components at different TGO thicknesses: (a) 2 μm TGO, (b) 5 μm TGO, and (c) 8 μm TGO.
Coatings 14 00123 g014
Figure 15. The stress fields in the Y-direction (S22, MPa) within GZ single-layer TBC components at different TGO thicknesses: (a) 2 μm TGO, (b) 5 μm TGO, and (c) 8 μm TGO.
Coatings 14 00123 g015
Figure 16. The variation in shear stress (S12) and normal stress (S22) along the GZ/TGO interface in single-layer SPS: (a,b) 2 μm TGO thickness, (c,d) 5 μm TGO thickness, and (e,f) 8 μm TGO thickness.
Coatings 14 00123 g016
Table 3. Studying the mesh independence of the developed FE model.
Minimum Element Size
(µm)
1/Minimum Element Size
(µm−1)
Maximum S22
(GPa)
1.80.561.935
1.50.672.052
112.168
0.71.432.389
0.522.472
0.2542.489
Disclaimer/Publisher’s Note: The statements, opinions and data contained in all publications are solely those of the individual author(s) and contributor(s) and not of MDPI and/or the editor(s). MDPI and/or the editor(s) disclaim responsibility for any injury to people or property resulting from any ideas, methods, instructions or products referred to in the content.

