Abstract
This work demonstrates the successful additive manufacturing of an in situ-alloyed CoCrFeNi HEA with a single phase (FCC) structure via the laser metal deposition (LMD) technique. In this work, bulk specimens of the CoCrFeNi high entropy alloy (HEA) of size 15 mm × 15 mm × 45 mm were additive-manufactured (AMed). An H320-type additive-subtractive manufacturing all-in-one system with a 2 kW fiber laser with a coaxial nozzle head integrated in a five-axis CNC machine was used. The effect of varying laser powers (1000 W, 1300 W, and 1600 W) on the microstructure and mechanical and electrochemical properties of the AMed HEA specimens was investigated. The AMed specimens were analyzed for their microstructure, elemental distributions, microhardness, and mechanical and electrochemical properties. An increase in the laser power led to a non-uniform cooling rate and non-steady solidification rates of the molten area during the AM process. As a result, the crystal constant decreased, and the microhardness fluctuated within a narrow range across the specimen. Among the three laser powers, the AMed CoCrFeNi HEA at 1300 W had the optimal mechanical properties and the best electrochemical behavior in 3.5 wt.% NaCl solution.
1. Introduction
High entropy alloys (HEA) have attracted considerable attention from both academia and industries because of their outstanding comprehensive properties [,]. Each HEA configuration, such as powder, wire, coating, and bulk, requires a unique manufacturing technique. HEA powders and wires have usually been produced as raw materials. Film deposition and sputtering of HEAs have been used for coating purposes [,,]. Bulk HEAs are the most popular configuration of all due to their potential in extensive engineering applications. Arc melting is the foremost and most widely used technique to melt and cast bulk HEAs, but large-sized uniform cast parts are seriously restricted in terms of size and structure uniformity. Cold spraying technology has also been explored to produce bulk HEAs [,]. Additive manufacturing (AM) has the advantage of different energy sources, including laser, arc, plasma, and electron beams, to directly manufacture components and parts with complex geometries. Laser metal deposition (LMD) [], selective laser melting (SLM) [], wire arc additive manufacturing (WAAM) [], plasma arc additive manufacturing (PAAM) [,], and selective electron beam melting (SEBM) [] have been employed to fabricate bulk HEAs. Several investigations have been conducted in recent years on the optimal AM processing parameters to improve the mechanical properties of AMed HEAs [,,,,]. The consensus surrounding laser power is that excessive energy input generates defects and decreases density. However, the optimization of the LMD method has seldom been reported on. All AM processes require some post-processing, also known as subtractive manufacturing. This can be achieved within the AM process itself when using the LMD method. The LMD method in conjunction with CNC technology can implement additive and subtractive hybrid manufacturing, thus enhancing the possibility for the manufacture of high-precision complex HEA parts.
CoCrFeNi HEA with an FCC structure has attracted considerable attention for various engineering applications due to its perfect combination of strength and toughness, as well as no obvious temperature-dependent ductile–brittle transition. Many scholars have successfully prepared CoCrFeNi HEA through LMD [,,]. The results show that CoCrFeNi HEA prepared through application of the LMD method has a fine and regularly distributed lamellar structure and improved properties compared to the casting, due to its direct change to the liquid state. The performance of CoCrFeNi HEA prepared with the addition of other elements to CoCrFeNi HEA has been widely reported. Luo et al. [] studied laser cladding CoCrFeNi HEA/W-composite coatings on 316L SS surfaces and showed that 40% HEA/W achieved the highest average hardness of 743.86 HV, and that 10% HEA/W showed the best corrosion resistance. Huang et al. [] found that the LMD-fabricated AlCoCrFeNi2.1 HEA showed significantly enhanced tensile strength (increased by 19.7%) and tensile ductility (increased by 56.4%). Preuß el al. [] studied the microstructural evolution of untreated LMD Al0.3CoCrFeNiNb0.5 HEA with the highest average hardness of 715 HV0.5. The microstructure and mechanical properties of LMD-prepared CoCrFeNi HEAs with the addition of Si [], Mn [,,,,], WC [], and Al [] were also studied to improve its micro-mechanical properties [] or comprehensive performance []. Additionally, the LMD process itself has also been seen to affect the mechanical properties of bulk materials. Hence, it is pertinent to understand the effect of the LMD process on the comprehensive mechanical and electrochemical properties of CoCrFeNi HEA to further expand the range of its engineering application.
This work employed four equiatomic elemental powders of Co, Cr, Fe, and Ni as the raw materials. The LMD method was used to produce bulks in order to verify the printability of the blended powder. Further, the microstructures and the mechanical and electrochemical properties of the in situ-alloyed HEA were studied.
2. Materials and Methods
Equiatomic elemental powders (Co, Cr, Fe, and Ni) with a size of 53–105 µm and purity of >99.99 wt.% were selected as the raw material. They were dried at 120 °C for 2 h, and then mixed using a planetary ball milling machine (MSK-SFM-1, Hefei Kejing, Hefei, China) with a ball-to-powder weight ratio of 1:1, a rotating speed of 100 r/min, and a mixing time of 12 h. H13 steel with a dimension of 50 mm × 50 mm × 20 mm was used as the substrate. Its chemical composition is shown in Table 1. Prior to additive manufacturing, the substrate surface was mechanically ground by using 2000 grit paper and then ultrasonically cleaned with ethanol and acetone.

Table 1.
Nominal chemical composition of the H13 substrate (wt.%).
Additive manufacturing was performed using a five-axis hybrid additive - subtractive manufacturing machine (H320, Guangdong Additive and Subtractive Technology Co., Ltd., Foshan, China) integrated on a five-axis CNC machine with a coaxial powder-feeding direct laser deposition system and a 2000 W semiconductor fiber laser (RFL-2000-SM-ABP-R, RAYCUS manufacturing Technology Co., Ltd., Wuhan, China) with wavelength of 1.06 μm (Figure 1a). High-purity nitrogen was used as the shielding and powder-feeding gas to protect the molten pool from oxidation. The process parameters were as follows: laser powers of 1000 W, 1300 W, and 1600 W, scanning speed of 10 mm/s, powder feeding rate of 3.5 g/min, laser focus size of 2 mm, and a defocus distance of 2 mm. The flow rates of the carrier gas and the shielding gas were 4 and 16 L/min, respectively. The overlapping ratio of multi-pass layers was 40%. HEA bulk specimens with a size of 15 mm × 15 mm × 45 mm (Figure 2) were fabricated with a layer-by-layer deposition mode using a zigzag scanning path (Figure 1b).

Figure 1.
(a) AM equipment and laser deposition nozzle; (b) laser scanning path.
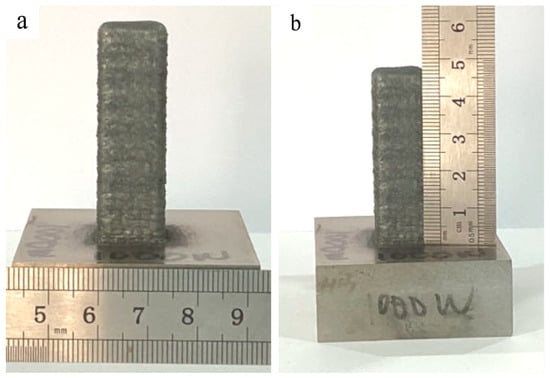
Figure 2.
AMed CoCrFeNi HEA bulk specimen: (a) front view and (b) side view.
The phase composition was determined via X-ray diffraction (XRD) on a high-resolution X-ray diffraction (SmartLab 9 KW, Rigaku, Tokyo, Japan). The microstructure of the HEA was observed on the field emission scanning electron microscope (QUANT 250, FEI, Eindhoven, The Netherlands) with an energy dispersion spectroscope (Noran System 7, ThermoFisher Scientific, Walthamm, MA, USA). The grain morphology was observed by metallographic microscope (Ario Imager. M2m, OK, Berlin, Germany). The microhardness was measured by vickers microhardness tester (Wilson VH1202, Fort Worth, TX, USA). Yield strength and elongation were tested with a 1 mm/min tensile rate by the universal testing machine (CMT5105, MTS, Minneapolis, MS, USA). The specimens were sectioned using wire-electrode cutting in a direction perpendicular to the deposition direction. Their dimensions are shown in Figure 3. Finally, the tensile fracture morphologies of the specimens were analyzed.
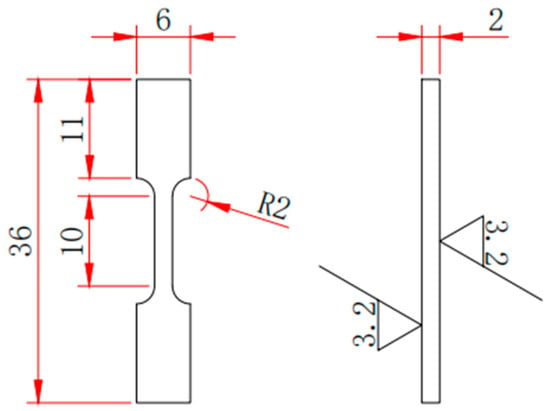
Figure 3.
Dimensions of the tensile specimen.
Open circuit potential (OCP) measurement, electrochemical impedance spectroscopy (EIS), and potentiodynamic polarization tests were performed using an Ametek Versa SCAN electrochemical workstation with a three-electrode system. The working electrode was the HEA specimen (working area of 1 cm2), the auxiliary electrode was the Pt plate, and the reference electrode was the saturated calomel electrode (SCE). The electrolyte was 3.5 wt.% NaCl. The OCP of the working electrode was measured while it stabilized in the electrolyte for 30 min before further testing. The EIS was conducted in a frequency range of 10−2–104 Hz at OCP, with a peak-to-peak sinusoidal AC perturbation amplitude of ±5 mV. The potentiodynamic polarization was conducted in a potential range of −1.0 V–+1.0 V vs. OCP at a scanning speed of 5 mV/s.
3. Results and Discussion
3.1. Phase Characterization Using XRD
The XRD patterns of the AMed CoCrFeNi HEAs fabricated at different laser powers of 1000 W, 1300 W, and 1600 W are illustrated in Figure 4. Four peaks were observed for each specimen, corresponding to the crystal faces of (111), (200), (220), and (311), respectively. The main XRD peaks for the HEAs fabricated at 1000 W were located at 43.8399°, 50.9683°, 75.1358°, and 91.1922°. Those for the HEAs produced at 1300 W were at 43.8837°, 51.0015°, 75.2022°, and 91.2420°. The HEAs manufactured at 1600 W showed peaks at 43.9012°, 51.0346°, 75.2188°, and 91.2751°. After the AM process, all of the HEAs presented only FCC phases, independent of laser power. Thus, the LMD method is able to produce an in situ alloy with the desirable FCC HEA microstructure from elemental metal powders [,]. During the laser deposition process, residual stress was generated after the rapid melting and cooling of the deposition layers, changing the lattice spacing. Thus, the migration and intensity of the main peaks were affected []. Figure 4b shows that with an increase in the laser power, the intensity of the main peak decreased and the width increased, along with an overall slight shift of the peaks to the right, which further verifies the existence of micro stress in the deposition layers. This is as per Bragg’s law [], where an increase in the laser power led to a gradual decrease in the residual stress generated during the cooling process, causing the crystal plane spacing to shrink and shifting the main peak positions to the right. The crystal plane spacing and lattice constant of the AMed CoCrFeNi HEAs obtained from the XRD patterns are given in Table 2. While the crystal plane spacing decreased from 0.20634 nm to 0.20607 nm, the lattice constant reduced from 0.35740 nm to 0.35692 nm. Both the crystal parameters decreased with an increase in laser power. This phenomenon is attributed to the higher cooling speed at a higher energy input.
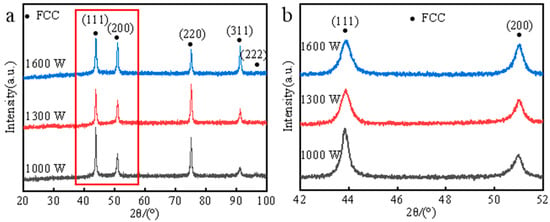
Figure 4.
XRD patterns of AMed CoCrFeNi high entropy alloy at different laser powers: (a) complete spectra and (b) magnification of the peaks in the red box in (a).

Table 2.
Variation of lattice parameters with respect to laser power.
3.2. Analysis of Microstructure
The appearance of an AMed HEA specimen is shown in Figure 2. Figure 5 shows the optical micrographs of the AMed CoCrFeNi HEAs produced at varying laser powers of 1000 W, 1300 W, and 1600 W. These prove that CoCrFeNi HEA bulks with a high forming precision can be successfully additive manufactured using the LMD method. There are no obvious defects such as microcracks or pores. Traces of the fusion lines between the deposition layers are conspicuous, representative of the typical epitaxial growth characteristics, due to the directional cooling mode of the LMD method. This is because LMD is a typical non-equilibrium solidification process, where the nucleation rate of the crystal is faster than the growth rate, and the crystal is inclined to form a flat crystal or a vertical columnar crystal along the heat dissipation direction []. Further, as shown in Figure 5, the grains above and below the fusion lines are dissimilar; the grains in the lower layers are slightly coarser than those in the upper layers. This is because during multi-layer LMD fabrication, the deposition and solidification of the new layer is similar to that of single-layer deposition, and the deposited layer acts as the substrate for the next LMD layer. After laser scanning, the top of the deposited layer is heated and melted to form a molten pool and re-solidified with the newly melted metal powder to form a newly deposited layer. The remelting and re-solidifying act as a heat treatment to induce grain growth.

Figure 5.
Optical micrographs of AMed CoCrFeNi HEAs at different laser powers: (a) 1000 W; (b) 1300 W; and (c) 1600 W.
A good metallurgical bond was formed between the deposited layers, and there were no obvious cracks, large holes, or other defects, as seen in the SEM images in Figure 6. All the AMed HEAs at different laser powers presented a columnar crystal structure, due to the rapid melting and non-equilibrium solidification caused by the LMD method. During the rapid melting process, the powder on the surface of the matrix melts and diffuses rapidly, and finally solidifies through the heat dissipation of the matrix. This shows that the powder temperature was high, but the temperature of the matrix was low, which contributed to the formation of the columnar crystal structure.
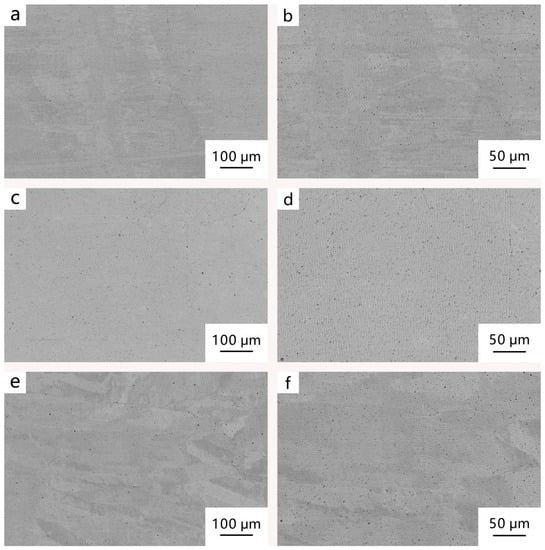
Figure 6.
SEM images of AMed CoCrFeNi HEAs at different laser powers: (a,b) 1000 W; (c,d) 1300 W; and (e,f) 1600 W.
Figure 7 shows the electron dispersive spectroscopy (EDS) elemental maps of the AMed HEAs at different laser powers and Table 3 shows the corresponding component content. It can be observed that the amount of each component element is uniform in the HEAs, and the amount of each element in Table 3 further proves that the composition of HEA is uniformly distributed, as shown in Figure 7. The results indicate that all the elements are close to the nominal composition and distributed uniformly without obvious elemental segregation. This is due to the high energy density of the laser leading to the rapid melting of the metal powder, resulting in the rapid cooling and solidification of the melted metal powder. This process ensured that the elements did not have sufficient time for long-distance diffusion.
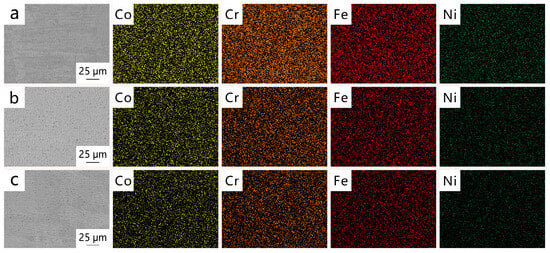
Figure 7.
EDS mapping of AMed CoCrFeNi HEAs at varying laser powers: (a) 1000 W; (b) 1300 W; and (c) 1600 W.

Table 3.
Element contents of EDS mapping regions.
Electron back-scattered diffraction (EBSD) was performed on the planes perpendicular to the printing direction of the AM process. As shown in Figure 8a–d, the transverse directions, which are parallel to scanning directions, revealed the formation of irregular columnar grains. The pole figure (PF) and inverse pole figure (IPF) maps are shown in Figure 8g,h. In the transverse directions, grains were not typically equiaxed. The IPF revealed a dominant <001> texture, because the <001> orientation is the preferred growth direction for the FCC crystals along the heat gradient, which was parallel to the printing direction. Furthermore, with a gradual increase in the laser power, the growth direction gradually migrated to <101> direction [,]. In addition to the printing direction, FCC columnar grains with <001> orientation accumulated along the scanning directions in the PF, and the orientation became gradually inclined to the printing direction, indicating that the crystal growth was affected by variation in local heat transferring directions caused by the scanning directions during the LMD process.
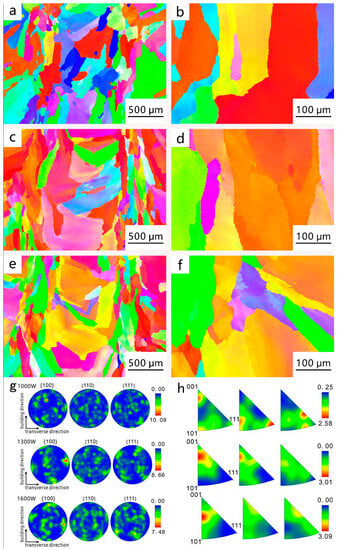
Figure 8.
EBSD images of AMed CoCrFeNi HEAs at varying laser powers: (a,b) 1000 W; (c,d) 1300 W; and (e,f) 1600 W. PF and IPF diagrams of AMed CoCrFeNi HEAs at varying laser powers (g,h).
Figure 9 shows the distribution diagram of grain sizes of AMed CoCrFeNi HEAs at different laser powers, and the average grain sizes obtained from the EBSD of the specimens are given in Table 4. The grain sizes of the AMed specimens were relatively small compared to those of the cast specimens []. They increased from 91.14 μm to 112.44 μm with an increase in laser power.
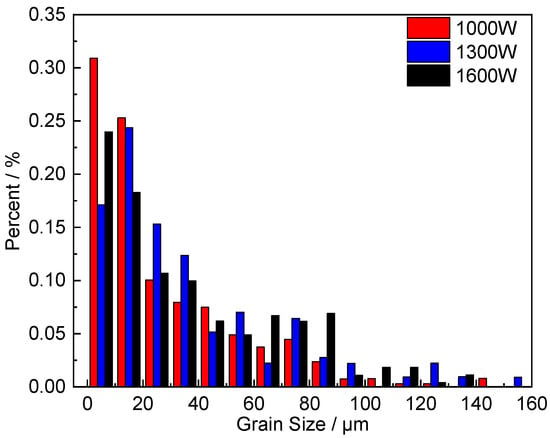
Figure 9.
Grain size distribution for AMed CoCrFeNi HEAs at varying laser powers.

Table 4.
Grain sizes obtained from EBSD diagram of AMed CoCrFeNi HEAs at varying laser powers.
3.3. Mechanical Properties
Figure 10 shows the cross-sections of the specimens and the microhardness trace tests run along the printing direction of the AMed CoCrFeNi HEAs at different laser powers. Three points were selected for each deposited layer. The results of the microhardness tests are presented in Figure 11. The overall hardness trend is relatively stable, as seen in Figure 11a, indicating that the AMed CoCrFeNi HEAs have stable performance. Figure 11b shows the average value of the microhardness values. The microhardness of all specimens was over 180 HV, higher than the reported values for a CoCrFeNi HEA manufactured using casting [] and other AM methods []. The superiority of the LMD method over those of other processes for the in situ formation of HEA due its rapid melting and solidification process was successfully demonstrated. Moreover, the maximum microhardness value of 190.95 HV was observed in the specimen produced at 1300 W, while the corresponding grain size was an intermediate value of 109.52 μm, between those of the HEAs produced using the other two laser powers.
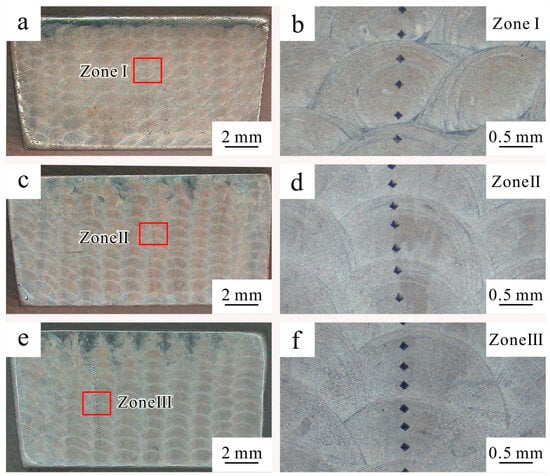
Figure 10.
Cross-section images and microhardness traces of AMed CoCrFeNi HEAs at varying laser powers: (a,b) 1000 W; (c,d) 1300 W; and (e,f) 1600.
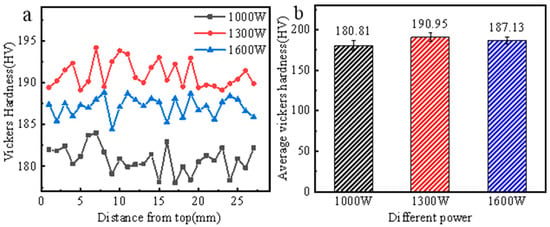
Figure 11.
(a) Distribution of microhardness from top to base and (b) average microhardness value of AMed CoCrFeNi HEAs at varying laser powers.
Figure 12 shows the true stress–true strain curves of the AMed CoCrFeNi HEAs at different powers of 1000 W, 1300 W, and 1600 W, with the corresponding ultimate tensile strengths being 476.4 MPa, 537.8 MPa, and 476.3 MPa. The details are given in Table 5. No yield behavior was observed due to the unique property of pure FCC HEA. Therefore, the plastic extension strength was used to characterize the yield strength, which was 248.9 MPa, 305.3 MPa, and 219.2 MPa for the laser powers of 1000 W, 1300 W, and 1600 W, respectively. The elongation increased markedly from 32.0% to 48.5%, with an increase in the laser power and grain size. When the laser power increased from 1000 W to 1300 W, the yield strength, tensile strength, and elongation of the AMed HEAs increased by 23%, 13%, and 30%, respectively. With the increase in laser power to 1600 W, the yield strength and tensile strength of the high entropy alloy significantly reduced, while the elongation increased slightly. The highest value of yield strength appeared at the laser power of 1300 W with a grain size of 109.52 μm.
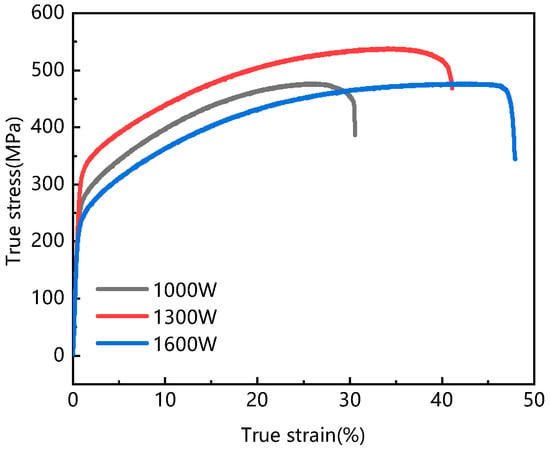
Figure 12.
True stress–true strain curves of AMed CoCrFeNi HEAs at different laser powers.

Table 5.
Tensile properties of AMed CoCrFeNi HEAs at different laser powers.
The morphologies of tensile fracture in the AMed CoCrFeNi HEAs at different laser powers of 1000 W, 1300 W, and 1600 W are shown in Figure 13. All specimens showed a dimple fracture. The density of these specimens increased with increasing laser power, accompanied by increasing grain size. Furthermore, the AMed CoCrFeNi HEA at laser power of 1300 W had the densest dimples.
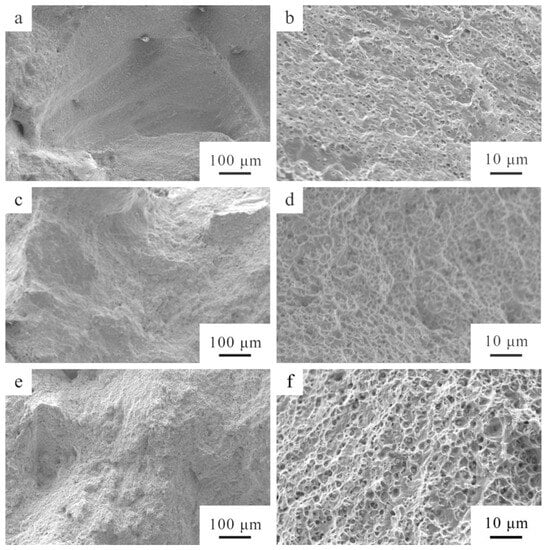
Figure 13.
SEM morphology of tensile fracture of AMed CoCrFeNi HEAs at different laser powers: (a,b) 1000 W; (c,d) 1300 W; and (e,f) 1600 W.
3.4. Electrochemical Behavior Analysis
Figure 14 shows the variation in the OCP of AMed CoCrFeNi HEAs at different laser powers in 3.5 wt.% NaCl. The OCP became stable over 3000 s, indicating the formation of passive films, with that of the 1600 W specimen being the highest among all three cases. The OCP was relatively stable, indicating that the corrosion process and the corrosion products on the surface had reached a stable state.
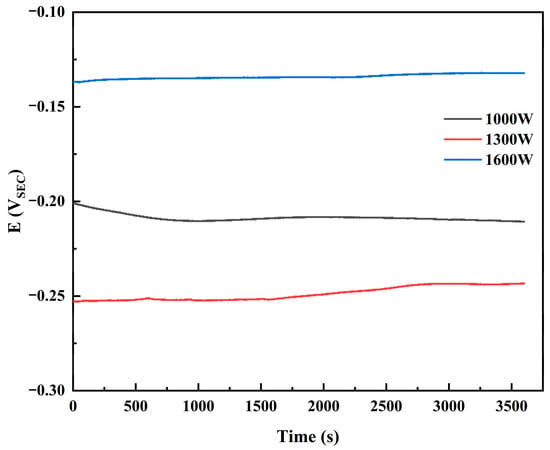
Figure 14.
Open circuit potentials of AMed CoCrFeNi HEAs at different laser powers.
Figure 15 presents the polarization curves for AMed CoCrFeNi HEAs at different laser powers tested in 3.5 wt.% NaCl. Obvious vertical passive regions in the anodic branch indicate the formation of passive films. The horizontal inflection line segments, also known as transpassive regions, in the anodic branch above 0.5 V indicate the breakage of the passive films. In NaCl, alloy dissolution occurred at the anode, which in this case was the working electrode, while the depolarization of hydrogen ions occurred at the cathode, which was the counter electrode. In this process, passive films composed of metal oxides and metal hydroxides are crucial for corrosion resistance []. The corrosion kinetics parameters calculated via the Tafel fitting method are shown in Table 6. Here, corrosion potential (Ecorr) reflects the corrosion tendency of the alloys. The more positive the Ecorr, the slower the corrosion trend. Corrosion current density (icorr) is directly correlated with the corrosion rate of AMed HEAs. A lower icorr and higher Ecorr indicate better corrosion resistance []. Critical pitting potential is the smallest positive potential at which pitting can form, and the higher the Epit the better the corrosion resistance of the material. Passive current density can react to the corrosion rate of metal under anodic protection; the smaller the ipass, the lower electrolytic consumption and the better the corrosion resistance. As seen in Table 6, when the laser power was 1300 W, the AMed CoCrFeNi HEA had the minimum icorr of 4.169 × 10⁻⁸ A/cm2, the maximum Ecorr of −0.263 V, the minimum ipass of 6.021 × 10⁻⁶ A/cm2 and the relatively high Epit of −0.851 V. Therefore, the AMed CoCrFeNi HEA prepared at a laser power of 1300 W possessed the best corrosion resistance.
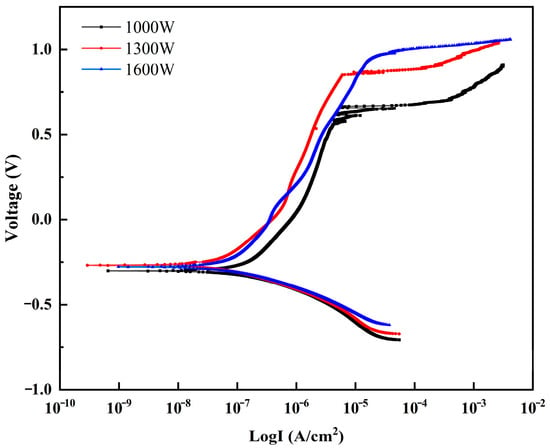
Figure 15.
Polarization curves of AMed CoCrFeNi HEAs at different laser powers.

Table 6.
Corrosion kinetics parameters of AMed CoCrFeNi HEAs at different laser powers.
EIS was conducted at OCP for the AMed CoCrFeNi HEAs at different laser powers in 3.5 wt.% NaCl solution to study the electrochemical properties of the surfaces of the specimens. The results are presented as the Nyquist, Bode, and phase angle plots in Figure 16. The Nyquist plots of all of the specimens show capacitive arcs (Figure 16a). The maximum arc diameter was observed in the 1300 W specimen, indicating a good passive film. The radius of the capacitive arc is indicative of the charge transfer resistance, which represents the tendency of interaction between the surface and electrolyte. For metals and alloys, the larger the charge transfer resistance, the better the corrosion resistance. The arc diameter for the 1600 W specimen was larger than that of the 1000 W specimen.
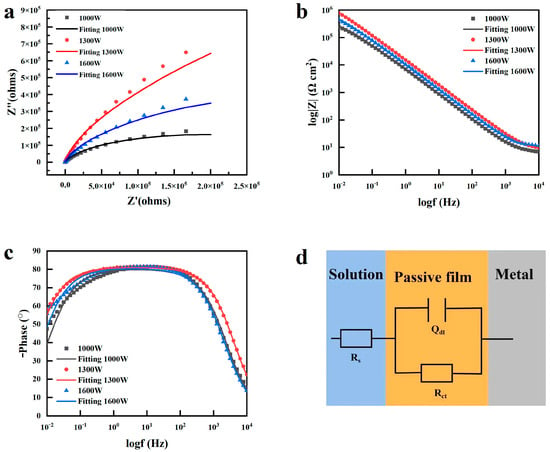
Figure 16.
(a) Nyquist, (b) Bode, and (c) phase angle plots and (d) equivalent circuit of AMed CoCrFeNi HEAs at different laser powers.
In the Bode plots (Figure 16b), the impedance at the least frequency indicates the best electrochemical behavior. The 1300 W specimen had the highest impedance at the lowest frequency, indicating the maximum corrosion resistance, similar to the results in Nyquist and polarization plots. As seen in Figure 16c, the phase angle curves of all AMed HEAs show a plateau in the middle frequency range between 10−1 and 102 Hz. The maximum phase angles are close to 80°, indicating a relatively ideal capacitive response obtained due to the formation and growth of the passive films at the middle frequency, according to Melchers []. Thus, the passive films play a major role in corrosion protection in the CoCrFeNi HEAs. There are phase lags with the frequencies in the middle- to high-frequency range for the 1300 W, 1000 W, and 1600 W specimens, representing the corresponding order of the ability to form passive films.
The Nyquist plots were fitted using the equivalent circuit (RsQdlRct) shown in Figure 16d, and the variations in the EIS fitting data are shown in Table 6. In this equivalent circuit, Rs is the solution resistance and Rct represents the charge transfer resistance of the alloy to electrolyte, which can be referred to as the corrosion resistance of the specimen. Qdl is the constant phase element (CPE) corresponding to the inhomogeneous capacitance of the alloy. QCPE can be expressed as []:
where Y is the proportionality factor, ω is the angular frequency, and n is the surface inhomogeneity exponent. The larger the value of n, the denser the passivation film []. Once a dense passive film forms and grows in a stable state, it prevents the charge transfer process between the alloy and the solution, reflecting a larger Rct value and implying a better corrosion resistance. The EIS fitting data in Table 7 show that the Rct and n of the 1300 W specimen were highest, with values of 1.7687 × 10⁶ Ω·cm2 and 0.90129, indicating that its corrosion resistance was the best and the passive film was the most dense among all the specimens, which is consistent with the results of the potentiodynamic polarization.

Table 7.
Variations in the impedance parameters obtained from the EIS data.
4. Conclusions
In this study, bulk CoCrFeNi HEAs with a single FCC phase were additively manufactured and in situ alloyed from a blend of elemental powders of Co, Cr, Fe, and Ni through the LMD method. The laser power was found to considerably influence the microstructure and properties of the AMed CoCrFeNi HEAs.
The chief conclusions are as follows:
- With an increase in the laser power, the XRD peaks of the AMed CoCrFeNi HEAs shifted slightly to the right, the lattice constant decreased from 0.35740 nm to 0.35692 nm, and the grain size of the columnar crystals increased from 91.14 μm to 112.44 μm.
- The average microhardness values of the AMed CoCrFeNi HEAs at different laser powers remained relatively constant. The AMed CoCrFeNi HEA fabricated at 1300 W had the maximum average microhardness value of 190.95 HV. The tensile strength and yield strength of the AMed CoCrFeNi HEAs increased for higher laser powers. The optimum mechanical properties were obtained at the laser power of 1300 W, with a yield strength of 312.11 MPa, tensile strength of 574.25 MPa, and elongation of 41.5%.
- The electrochemical tests showed that the AMed CoCrFeNi HEA produced at 1300 W possessed the maximum electrochemical properties in 3.5 wt.% NaCl solution when compared with those of the HEAs produced at 1000 W and 1600 W, which was attributed to the stability of the dense passive film.
Author Contributions
Software, J.L.; Validation, H.H.; Investigation, K.W., P.T. and J.Y.; Resources, J.Y.; Data curation, J.L., F.Z. and S.W.; Writing—review & editing, H.H. and K.W.; Funding acquisition, G.S. All authors have read and agreed to the published version of the manuscript.
Funding
This research was funded by Guangdong Basic and Applied Basic Research (2022A1515010761), Foshan Technology Project (1920001000409), and the Key Laboratory of Guangdong Regular Higher Education (2017KSYS012).
Institutional Review Board Statement
Not applicable.
Informed Consent Statement
Not applicable.
Data Availability Statement
The data that support the findings of this study are available from the corresponding author upon reasonable request.
Conflicts of Interest
The authors declare no conflict of interest.
References
- Yeh, J.W.; Chen, S.K.; Lin, S.J.; Gan, J.Y.; Chin, T.S.; Shun, T.T.; Tsau, C.H.; Chang, S.Y. Nanostructured high-entropy alloys with multiple principal elements: Novel alloy design concepts and outcomes. Adv. Eng. Mater. 2004, 6, 299–303. [Google Scholar] [CrossRef]
- Zhang, Y.; Zuo, T.T.; Tang, Z.; Gao, M.C.; Dahmen, K.A.; Liaw, P.K.; Lu, Z.P. Microstructures and properties of high-entropy alloys. Prog. Mater. Sci. 2014, 61, 1–93. [Google Scholar] [CrossRef]
- Cai, Y.P.; Wang, G.J.; Ma, Y.J.; Cao, Z.H.; Meng, X.K. High hardness dual-phase high entropy alloy thin films produced by interface alloying. Scr. Mater. 2019, 162, 281–285. [Google Scholar] [CrossRef]
- Cao, Z.H.; Ma, Y.J.; Cai, Y.P.; Wang, G.J.; Meng, X.K. High strength dual-phase high entropy alloys with a tunable nanolayer thickness. Scr. Mater. 2019, 173, 149–153. [Google Scholar] [CrossRef]
- Cao, Z.H.; Zhai, G.Y.; Ma, Y.J.; Ding, L.P.; Li, P.F.; Liu, H.L.; Lu, H.M.; Cai, Y.P.; Wang, G.J.; Meng, X.K. Evolution of interfacial character and its influence on strain hardening in dual-phase high entropy alloys at nanoscale. Int. J. Plast. 2021, 145, 103081. [Google Scholar] [CrossRef]
- Yu, P.F.; Fan, N.S.; Zhang, Y.Y.; Wang, Z.J.; Li, W.Y.; Lupoi, R.; Yin, S. Microstructure evolution and composition redistribution of FeCoNiCrMn high entropy alloy under extreme plastic deformation. Mater. Res. Lett. 2022, 10, 124–132. [Google Scholar] [CrossRef]
- Fan, N.S.; Rafferty, A.; Lupoi, R.; Li, W.Y.; Xie, Y.C.; Yin, S. Microstructure evolution and mechanical behavior of additively manufactured CoCrFeNi high-entropy alloy fabricated via cold spraying and post-annealing. Mater. Sci. Eng. 2023, 873, 144748. [Google Scholar] [CrossRef]
- Zhao, S.L.; Xin, D.Q.; Chen, X.Z.; Stasic, J.; Trtica, M.; Siddiquee, A.N.; Mohan, S. Microstructure and enhanced tensile properties of AlCoCrFeNi high entropy alloys with high Co content fabricated by laser melting deposition. J. Alloys Compd. 2022, 917, 165403. [Google Scholar] [CrossRef]
- Brif, Y.; Thomas, M.; Todd, I. The use of high-entropy alloys in additive manufacturing. Scr. Mater. 2015, 99, 93–96. [Google Scholar] [CrossRef]
- Shen, Q.K.; Kong, X.D.; Chen, X.Z. Fabrication of bulk Al-Co-Cr-Fe-Ni high-entropy alloy using combined cable wire arc additive manufacturing (CCW-AAM): Microstructure and mechanical properties. J. Mater. Sci. Technol. 2021, 74, 136–142. [Google Scholar] [CrossRef]
- Shi, B.; Xin, D.; Chen, X.; Wang, Y.; Singh, A. Fabrication of high-strength dual FCC phase Co-Cr-Fe-Ni-Cu-Mo high entropy alloy by plasma arc additive manufacturing using a combined cable wire. Mater. Lett. 2023, 337, 133983. [Google Scholar] [CrossRef]
- Xin, H.Y.; Chen, X.Z.; Wang, Y.H.; Su, C.C.; Xin, D.Q.; Xia, J.Y.; Liang, Y. Effects of Cold Rolling and Annealing Treatment on Microstructure and Properties of CoFeNiMnV High-Entropy Alloys. Adv. Eng. Mater. 2023, 25, 2201340. [Google Scholar] [CrossRef]
- Kuwabara, K.; Shiratori, H.; Fujieda, T.; Yamanaka, K.; Koizumi, Y.; Chiba, A. Mechanical and corrosion properties of AlCoCrFeNi high-entropy alloy fabricated with selective electron beam melting. Addit. Manuf. 2018, 23, 264–271. [Google Scholar] [CrossRef]
- Li, X. Additive manufacturing of advanced multi-component alloys: Bulk metallic glasses and high entropy alloys. Adv. Eng. Mater. 2018, 20, 1700874. [Google Scholar] [CrossRef]
- Chen, S.; Tong, Y.; Liaw, P.K. Additive manufacturing of high-entropy alloys: A review. Entropy 2018, 20, 937. [Google Scholar] [CrossRef]
- Nguyen, Q.B.; Zhu, Z.; Ng, F.L.; Chua, B.W.; Nai, S.M.L.; Wei, J. High mechanical strengths and ductility of stainless steel 304L fabricated using selective laser melting. J. Mater. Sci. Technol. 2019, 35, 388–394. [Google Scholar] [CrossRef]
- Han, C.; Fang, Q.; Shi, Y.; Tor, S.B.; Chua, C.K.; Zhou, K. Recent advances on high entropy alloys for 3D printing. Adv. Mater. 2020, 32, 1903855. [Google Scholar] [CrossRef]
- Torralba, J.M.; Campos, M. High entropy alloys manufactured by additive manufacturing. Metals 2020, 10, 639. [Google Scholar] [CrossRef]
- Luo, F.; Yang, T.; Zhao, Y.; Xiong, Z.; Huang, J. Effect of W Content on Microstructure and Properties of Laser Cladding CoCrFeNi HEA Coating. Coatings 2023, 13, 1301. [Google Scholar] [CrossRef]
- Huang, L.; Sun, Y.; Chen, N.; Luan, H.; Le, G.; Liu, X.; Ji, Y.; Lu, Y.; Liaw, P.K.; Yang, X.; et al. Simultaneously Enhanced Strength Ductility of AlCoCrFeNi2.1 Eutectic High-Entropy Alloy via Additive Manufacturing. Mater. Sci. Eng. A 2022, 830, 142327. [Google Scholar] [CrossRef]
- Preuß, B.; Lindner, T.; Uhlig, T.; Tapia Cabrera, J.E.; Schwarz, H.; Wagner, G.; Seyller, T.; Lampke, T. Microstructure Evolution and Wear Resistance of the Eutectic High-Entropy Alloy Al0.3CoCrFeNiNb0.5 Produced by Laser Metal Deposition. Coatings 2023, 13, 585. [Google Scholar] [CrossRef]
- Shu, F.Y.; Yang, B.; Dong, S.Y.; Zhao, H.Y.; Xu, B.S.; Xu, F.J.; Liu, B.; He, P.; Feng, J.C. Effects of Fe-to-Co ratio on microstructure and mechanical properties of laser cladded FeCoCrBNiSi high-entropy alloy coatings. Appl. Surf. Sci. 2018, 450, 538–544. [Google Scholar] [CrossRef]
- Zhang, H.F.; Yan, H.L.; Yu, H.; Ji, Z.W.; Hu, Q.M.; Jia, N. The effect of Co and Cr substitutions for Ni on mechanical properties and plastic deformation mechanism of FeMnCoCrNi high entropy alloys. J. Mater. Sci. Technol. 2020, 48, 146–155. [Google Scholar] [CrossRef]
- Maier-Kiener, V.; Schuh, B.; George, E.P.; Clemens, H.; Hohenwarter, A. Insights into the deformation behavior of the CrMnFeCoNi high-entropy alloy revealed by elevated temperature nanoindentation. J. Mater. Res. 2017, 32, 2658–2667. [Google Scholar] [CrossRef]
- Piglione, A.; Dovgyy, B.; Liu, C.; Gourlay, C.M.; Hooper, P.A.; Pham, M.S. Printability and microstructure of the CoCrFeMnNi high-entropy alloy fabricated by laser powder bed fusion. Mater. Lett. 2018, 224, 22–25. [Google Scholar] [CrossRef]
- Shabani, M.; Indeck, J.; Hazeli, K.; Jablonski, P.D.; Pataky, G.J. Effect of strain rate on the tensile behavior of CoCrFeNi and CoCrFeMnNi high-entropy alloys. J. Mater. Eng. Perform. 2019, 28, 4348–4356. [Google Scholar] [CrossRef]
- Chen, P.; Li, S.; Zhou, Y.H.; Yan, M.; Attallah, M.M. Fabricating CoCrFeMnNi high entropy alloy via selective laser melting in-situ alloying. J. Mater. Sci. Technol. 2020, 43, 40–43. [Google Scholar] [CrossRef]
- Wu, T.; Chen, Y.; Lin, B.; Yu, L.; Gui, W.; Li, J.; Wu, Y.; Zeng, D. Effects of WC on the Microstructure, Wear and Corrosion Resistance of Laser-Deposited CoCrFeNi High Entropy Alloy Coatings. Coatings 2022, 12, 985. [Google Scholar] [CrossRef]
- Joseph, J.; Jarvis, T.; Wu, X.; Stanford, N.; Hodgson, P.; Fabijanic, D.M. Comparative study of the microstructures and mechanical properties of direct laser fabricated and arc-melted AlxCoCrFeNi high entropy alloys. Mater. Sci. Eng. A 2015, 633, 184–193. [Google Scholar] [CrossRef]
- Zhao, W.; Han, J.K.; Kuzminova, Y.O.; Evlashin, S.A.; Zhilyaev, A.P.; Pesin, A.M.; Jang, J.I.; Liss, K.D.; Kawasaki, M. Signif-icance of grain refinement on micro-mechanical properties and structures of additively-manufactured CoCrFeNi high-entropy alloy. Mater. Sci. Eng. A 2021, 807, 140898. [Google Scholar] [CrossRef]
- Huo, W.; Fang, F.; Liu, X.; Tan, S.; Xie, Z.; Jiang, J. Remarkable strain-rate sensitivity of nanotwinned CoCrFeNi alloys. Appl. Phys. Lett. 2019, 114, 101904. [Google Scholar] [CrossRef]
- Jiang, C.P.; Zhang, J.; Chen, Y.N.; Hou, Z.M.; Zhao, Q.Y.; Li, Y.; Zhu, L.X.; Zhang, F.Y.; Zhao, Y.Q. On enhancing wear resistance of titanium alloys by laser cladded WC-Co composite coatings. Int. J. Refract. Met. Hard Mater. 2022, 107, 105902. [Google Scholar] [CrossRef]
- Zhao, Y.; Wang, X.; Cao, T.; Han, J.K.; Kawasaki, J.J.; Han, M.H.N.; Ramamurty, U.; Wang, L.; Xue, Y. Effect of grain size on the strain rate sensitivity of CoCrFeNi high-entropy alloy. Mater. Sci. Eng. A 2020, 782, 139281. [Google Scholar] [CrossRef]
- Macdonald, D.D. The history of the Point Defect Model for the passive state: A brief review of film growth aspects. Electrochim. Acta. 2011, 56, 1761–1772. [Google Scholar] [CrossRef]
- Melchers, R.E. Modelling immersion corrosion of structural steels in natural fresh and brackish waters. J. Corros. Sci. 2006, 48, 4174–4201. [Google Scholar] [CrossRef]
- Jiang, D.; Cui, H.; Zhao, X.; Chen, H.; Ma, G.; Song, X. Synergistic improvement of wear and corrosion resistance of CoCrNiMoCB coatings obtained by laser cladding: Role of Mo concentration. Mater. Des. 2022, 219, 110751. [Google Scholar] [CrossRef]
Disclaimer/Publisher’s Note: The statements, opinions and data contained in all publications are solely those of the individual author(s) and contributor(s) and not of MDPI and/or the editor(s). MDPI and/or the editor(s) disclaim responsibility for any injury to people or property resulting from any ideas, methods, instructions or products referred to in the content. |
© 2023 by the authors. Licensee MDPI, Basel, Switzerland. This article is an open access article distributed under the terms and conditions of the Creative Commons Attribution (CC BY) license (https://creativecommons.org/licenses/by/4.0/).