Article

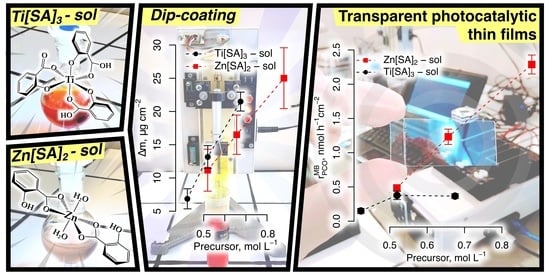
Optically Transparent TiO2 and ZnO Photocatalytic Thin Films via Salicylate-Based Sol Formulations

by
Bozhidar I. Stefanov
Department of Chemistry, Faculty of Electronic Engineering and Technologies, Technical University of Sofia, 8 Kliment Ohridski Blvd, 1756 Sofia, Bulgaria
Coatings 2023, 13(9), 1568; https://doi.org/10.3390/coatings13091568
Submission received: 19 August 2023 / Revised: 29 August 2023 / Accepted: 5 September 2023 / Published: 7 September 2023

Abstract

:
Sol compositions for transparent TiO2 and ZnO photocatalytic thin film deposition are of interest for the wet-chemical fabrication of self-cleaning coatings. The choice of stabilizing agent is crucial for the sol film-forming properties, with acetylacetone and monoethanolamine conventionally employed for TiO2 and ZnO deposition sols, respectively. Salicylic acid (SA), capable of chelating both Ti(IV) and Zn(II) precursors, remains underexplored. This study presents novel SA-based sol formulations for the deposition of both TiO2 and ZnO films, based on titanium tetraisopropoxide (TTIP) and zinc acetate dihydrate (ZAD) precursors, in a fixed 1:3 (TTIP:SA) and 1:2 (ZAD:SA) ratio, and isopropanol solvent, varied across the 1:10 to 1:20 precursor-to-solvent ratio range. Fourier-Transform Infrared Spectroscopy analysis and Density Functional Theory computations confirmed the formation of H2Ti[SA]3 and Zn[SA]2·2H2O complexes. Scanning Electron Microscopy, X-ray diffraction, and Ultraviolet-Visible spectroscopy were employed to study the structural and optical properties of the dip-coated films, revealing dense TiO2 (86–205 nm) and ZnO (35–90 nm) layers of thickness proportional to the salicylate concentration and transmittance in the 70–90% range. Liquid-phase Methylene blue (MB) photooxidation experiments revealed that all films exhibit photocatalytic activity, with ZnO films being superior to TiO2, with 2.288 vs. 0.366 nm h−1 cm−2 MB removal rates.

Graphical Abstract

1. Introduction

Since its discovery in the late 1970s by Honda and Fujishima [1], semiconductor heterogeneous photocatalysis has become pivotal in “green” environmental technologies, such as water and air pollution abatement [2,3,4]; photoelectrochemical water splitting and CO2 reduction for energy conversion [5,6,7]; microbial disinfection [8]; and others [9]. Photocatalytic activity is attributed to a variety of wide-bandgap transition metal oxides; however, titanium dioxide (TiO2) and zinc oxide (ZnO) are the most widely studied photocatalysts [4,10,11]. Absorbing light quanta of energy exceeding their respective bandgaps, Eg ≈ 3.2 eV (λ ≤ 387 nm) for TiO2 and Eg ≈ 3.37 eV (λ ≤ 367 nm) for ZnO [7,12], these materials generate electron-hole pairs, also known as excitons. While most of the photogenerated excitons recombine, a small fraction (typ. < 1%) manage to migrate to the photocatalyst surface, interacting with surface-adsorbed species and facilitating their photocatalytic degradation through photooxidation and photoreduction reactions [12].
While TiO2 and ZnO photocatalysts are frequently used as nanoparticle suspensions in research [4,13] for practical applications and catalyst reusability, the development of photocatalytic coatings holds greater significance [11]. Typically, highly efficient TiO2 and ZnO coatings are in the form of thick mesoporous layers to maximize their specific surface area [14]. However, these mesoporous coatings may not be practical for applications requiring functional photocatalytic layers with intrinsic optical transparency, such as self-cleaning and antifogging coatings on windowpanes or photovoltaics [15,16,17].
Transparent TiO2 and ZnO layers can be fabricated through a variety of deposition methods. Vacuum-based physical vapor deposition (PVD) techniques, such as reactive magnetron sputtering [15,17,18,19], are commonly favored, however, they can be cost-prohibitive and require specialized equipment and expertise, making them less suitable for small-scale applications. As a result, wet-chemical methods, particularly the sol-gel-based techniques, are preferred, especially in research-scale applications, due to their simplicity, cost-effectiveness, and ability to deposit films without the need for high-vacuum conditions [16,20,21]. In sol-gel deposition, the coating is initially formed from a liquid sol formulation, applied to the substrate using techniques like dip-coating or spin coating, and subsequently converted to the desired metal oxide via post-deposition heat-treatment step [22].
The sol formulation contains at least three main components: a metal-ion-containing precursor, an organic solvent, and a stabilizing agent to limit undesired hydrolysis and improve sol stability. In TiO2 sol formulations, titanium tetrachloride (TiCl4) [13] and titanium (IV) tetraisopropoxide (TTIP, Ti(O-iPr)4) [14,17,21,23] are commonly used as precursors, with the latter preferred due to its lower volatility and absence of toxic HCl released during hydrolysis. Isopropyl alcohol (IPA) is generally used as a solvent in the TTIP case. As for ZnO deposition sols, while examples based on zinc alkoxides have been demonstrated [23], ionic Zn(II) compounds like zinc nitrate [17,24] and, in the predominant case, zinc acetate dihydrate (ZAD, Zn(CH3COO)2·2H2O), are more commonly employed in the literature [13,25,26,27]. Formulating ZAD-based ZnO deposition sols presents challenges due to ZAD’s poor solubility in organic solvents and proneness for self-hydrolysis, even in anhydrous media, due to the hydration water molecules [28]. These factors affect both the ease of preparation and long-term stability of ZAD-based formulations, necessitating the use of specialized, harmful solvents like 2-methoxyethanol (2-ME) [24,25,26,27].
The choice of stabilizing agent in both TiO2 and ZnO sol formulations significantly impacts the quality and structure of the resulting thin films. Acetylacetone (AcAc) is typically used to stabilize TTIP-based sols [13,21,29], while monoethanolamine (MEA) or other substituted amines are employed in the ZAD case [20,26]. However, some studies have shown the interchangeability of these chelating agents between the two cases [13,30]. For instance, Verma et al. compared the effects of AcAc and diethanolamine (DEA) on TiO2 films, finding that AcAc-stabilized sols produced films with increased transparency, while DEA led to improved electrochemical performance in terms of ion storage capacity, attributed to enhanced porosity [30]. Vajargah et al. studied the effects of different substituted amines on ZAD-based ZnO deposition sols and found that the stabilizer significantly affects sol stability, with mono- and di-substituted amines having the strongest effect [20]. Vilà et al. compared the influence of MEA and its substituted derivatives to aromatic amino alcohols and observed that aromatic-based stabilizers resulted in films with increased transparency [26].
To enhance sol stability and shelf-life and improve the chances of forming transparent coatings, ligands that form stronger chelates with Ti (IV) and Zn (II) could be advantageous stabilizing agents for TiO2 and ZnO deposition sols. Sato and Nishide demonstrated that sols based on Ti[EDTA] complexes yield TiO2 thin films with excellent optical transparency and defined this technique as the molecular precursor method (MPM) [31,32]. Similarly, a more recent work by Amakali et al. showed the successful application of this approach for ZnO thin films [25]. While EDTA is the default chelating agent in chemistry practice, there are more environmentally friendly alternatives available. One such example is salicylic acid (SA), a member of the catechol class of molecules, which has been shown to form stable complexes with both Ti [33] and Zn [34], and the stability of the Ti[SA] complex has been demonstrated to surpass that of Ti[EDTA] [35].
Thus, SA shows promise as a stabilizing agent for TiO2 and ZnO deposition sols. However, this premise remains underexplored in the literature. The SA film-forming properties have been investigated only on one occasion of ZnO deposition sols by Kuznetsova et al. [36], revealing that salicylate sols yield optically transparent ZnO films with improved electrical properties. This study employed a zinc precursor-to-SA ratio of 1:1, deviating from the typical zinc salicylate complex stoichiometry of 1:2 [34]. Additionally, the photocatalytic activity of the ZnO layers was not explored. In the case of TiO2, the sole available demonstration of SA-stabilized deposition sol is found in the previous work of this paper’s author [37], where a SA-based TTIP sol with a 1:3 TTIP:SA molar ratio proved suitable for a highly-conformal TiO2-functionalization coating on a high-aspect ratio anodic alumina substrate [36], and the selection of SA as the stabilizing agent stemmed from its affinity to the alumina surface. Hence, in the present study, the deposition of photocatalytic thin films of TiO2 and ZnO from novel SA-based sol formulations, governed by Ti[SA] and Zn[SA] complexation stoichiometry of 1:3 and 1:2, respectively, is thoroughly investigated. Fourier Transform Infrared (FTIR) spectroscopy, along with Density Functional Theory (DFT) simulations, are employed to confirm the formation of salicylate complexes in the deposition sols. The effects of salicylate concentration vs. IPA solvent (1:10, 1:10, and 1:20 molar ratio) and their impact on the morphology and optical properties of the final coatings are investigated. These findings are further correlated to the photocatalytic activity in terms of liquid-phase Methylene blue (MB) dye photooxidation rates obtained at varied (UV) illumination intensity. The results may facilitate advancements in the field of photocatalytic thin film deposition, opening new possibilities for environmentally friendly and optically transparent photocatalytic coatings from SA-based formulations.

2. Materials and Methods

2.1. Reagents

All chemicals were of reagent grade or higher: titanium (IV) tetraisopropoxide (TTIP, ≥97%, Alfa Aesar, Haverhill, MA, USA); zinc acetate dihydrate (ZAD, Zn(CH3COO)2·2H2O, ≥98%, Alfa Aesar); Salicylic acid (SA, ≥99%, Alfa Aesar); isopropyl alcohol (IPA, HPLC grade, ≥97%, Macron Fine Chemicals, Shanghai China); Methylene blue (MB, biological stain grade, Alfa Aesar). Distilled water (conductivity > 18 MΩ cm−1) was used for all aqueous solution preparations.

2.2. TiO2 and ZnO Sol Preparation and Thin Film Deposition

The workflow for the preparation of SA-based TiO2 and ZnO sols and photocatalytic thin film deposition is illustrated schematically in Figure 1. The steps include synthesis and aging of the deposition sol solutions and dip-coating deposition on glass substrates and are described in greater detail in the following two subsections.

2.2.1. TiO2 and ZnO Sol Synthesis

Both TiO2 and ZnO deposition sols were based on the same general recipe, with SA as a stabilizing agent and IPA solvent, differing in several aspects: (1) the precursor—TTIP and ZAD for TiO2 and ZnO deposition sols, respectively; (2) the precursor-to-stabilizer molar ratio, which was 1:3 for TTIP:SA and 1:2 for the ZAD:SA sol, as determined by the stoichiometry of the most-stable salicylate complex of the respective metal ion [33,34]; and (3) the use of reflux heating in the ZnO case, applied to accelerate the poor solubility of ZAD in IPA at room temperature (RT).
To investigate the impact of salicylate concentration on photocatalytic coatings, three formulations with different precursor-to-solvent molar ratios were prepared. The syntheses began with a fixed volume of 35 mL IPA. The appropriate amount of SA was added under magnetic stirring for 30 min, followed by the precursor. The specific synthesis procedures were as follows:
  • TiO2 Sol: TTIP was added dropwise into the SA/IPA mixture. During this step, a light-yellow fluffy precipitate was observed, especially in the Ti:10 and Ti:15 mixtures, but it redissolved under magnetic stirring. The mixture was continuously stirred for 3 h at RT, resulting in a clear, intensively red-orange colored sol. The three sols are denoted as Ti:10, Ti:15, and Ti:20, with 1:3:10, 1:3:15, and 1:3:20 TTIP:SA:IPA molar ratios, respectively.
  • ZnO Sol: The calculated amount of ZAD was added to the SA/IPA solution at RT and magnetic stirring. The mixture was then brought up to 60 °C under reflux and stirred for an additional 3 h until the ZAD was completely dissolved. Finally, a clear sol with a faint pink color was obtained. The three sols are denoted as Zn:10, Zn:15, and Zn:20, with 1:2:10, 1:2:15, and 1:2:20 ZAD:SA:IPA molar ratios, respectively.
After synthesis, the sols were transferred to sealed polypropylene containers and aged for 1 week before deposition.

2.2.2. Dip-Coating of TiO2 and ZnO Thin Films

The thin films were deposited via dip-coating on standard microscopy (soda-lime) glass slides (76 mm × 26 mm × 1.1 mm, Deltalab, Barcelona, Spain) serving as substrates. The substrates were mechanically cleaned with a mild detergent, thoroughly rinsed with distilled water, and dried before a 3-min ultrasonic cleaning in acetone. The initial weight of each slide was measured on an analytical balance (0.1 mg precision) to determine the deposition mass-loading.
Dip-coating was performed using a custom-made setup with a stepper-motor-driven linear actuator. The substrate immersion rate was set at 2.5 mm s−1, followed by a 5-s dwell time in the sol, and a withdrawal at a 0.25 mm s−1 rate. After coating, the samples underwent a two-step heat-treatment process: 15 min at 300 °C and 60 min at 450 °C, with a 4 °C min−1 temperature ramp rate, and allowed to cool naturally in the furnace. Two coating cycles were applied to all samples used in characterization and photocatalytic experiments.

2.3. Characterization Methods

2.3.1. Physico-Chemical Characteristics of the Sols

The sol specific gravity ( ρ ) was determined gravimetrically in a 10 mL pycnometer flask. Surface tension was estimated by the stalagmometric (drop-counting) method, employing a capillary stalagmometer with a 2.5 mL capacity. The number of drops for each sol ( n s o l ) was counted, and the surface tension ( σ S o l ) calculated, according to the formula  σ S o l = σ I P A ( ρ S o l n I P A / ρ I P A n S o l ) , where  ρ S o l  is the specific gravity of the sol,  n I P A  is the number of drops for pure IPA, and  ρ I P A  and  n I P A  are the density (0.781 g cm−1) and surface tension (20.9 mN m−1) of IPA according to the literature values [38,39]. The kinematic viscosity (ν) was measured using a calibrated Ubbelohde viscometer (viscometer constant  κ  = 0.010022 mm2 s−1), based on the average flow time (τ) from three separate measurements, and converted to dynamic viscosity (η) using the respective sol density, according to Equation (1):
η   [ P a   s 1 ] = τ s × κ   m m 2 s 1 × 10 6 × ρ   [ k g   m 3 ] .

2.3.2. Instrumental Methods

Attenuated Total Reflection Fourier-Transform Infrared (ATR-FTIR) spectra of the sols were acquired using an Carry 630 spectrometer (Agilent Technologies Inc., Santa Clara, CA, USA) equipped with a Diamond-ATR sampling module. Transmittance Ultraviolet-Visible (UV-Vis) spectra of the thin films were measured in the 300–1000 nm range on an Evolution 300 spectrometer equipped with a DRA-EV-300 Diffuse Reflectance Accessory. Scanning Electron Microscopy (SEM, Thermo Fischer Scientific Inc., Waltham, MA, USA) was performed on a LYRA I XMU microscope (TESCAN GROUP, Brno, Czech Republic), and X-ray Diffraction (XRD) patterns were obtained on D8 Advance diffractometer (Bruker AXS GmbH, Karlsruhe, Germany) with CuKα X-Ray source and LynxEye PSD detector.

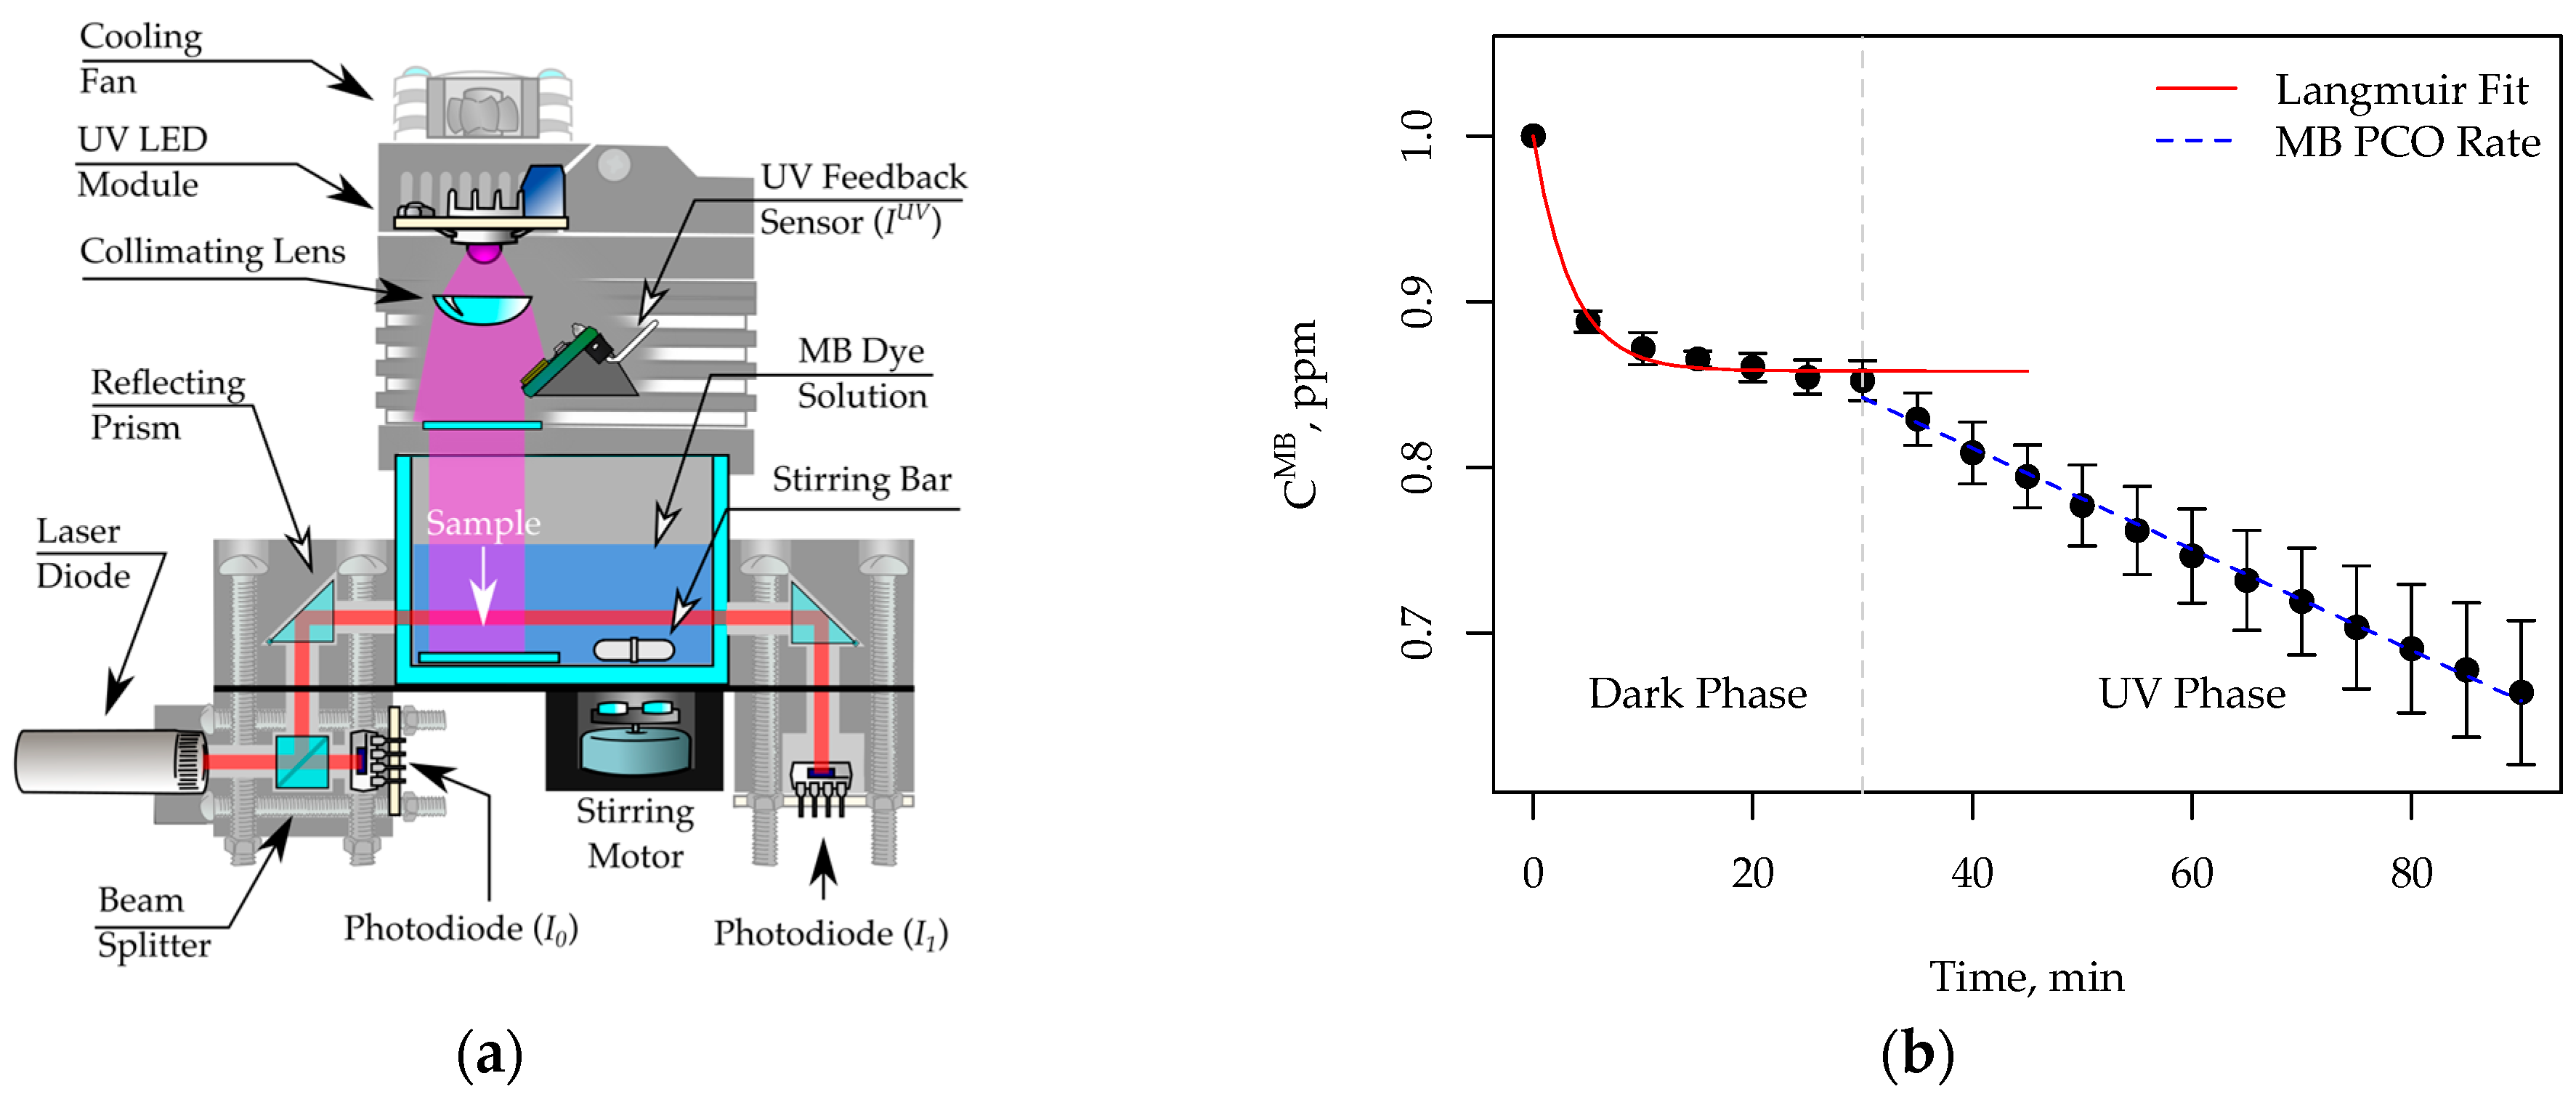
2.4. Photocatalytic Activity Determination

The photocatalytic activity of the TiO2 and ZnO thin films was assessed by liquid-phase photooxidation (PCO) experiments of Methylene blue (MB) dye—a widely-employed model pollutant and the by-default standard for photocatalyst coatings activity screening, as featured in the ISO 10678:2010 specification. The MB PCO removal mechanism is relatively well-understood and thoroughly investigated by Houas et al. [40]. In the aqueous liquid-phase, it is known to be governed mainly through the generation of reactive species, such as hydroxyl radicals ( H O ), as shown in Equations (2)–(5), which in turn react with the MB dye molecules, resulting in its decolorization and mineralization.
T i O 2 ,   Z n O h υ h + + e
H 2 O + h + H O + H +
O 2 + e O 2
2 O 2 + 2 H + 2 H O 2 H 2 O 2 + O 2 H O + O H
For the MB PCO screening experiments, the as-deposited TiO2 and ZnO photocatalyst-coated slides were cut to 15 mm × 26 mm rectangles, corresponding to a geometric area of 3.9 cm2, noting that approx. 5 mm from the bottom and top of the microscope slides were discarded to exclude dip-coating artifacts.
The experiments were conducted in a custom-made automated setup, whose development has been previously detailed in a separate publication [41]. A cross-sectional view of the photocatalytic reactor is depicted in Figure 2a. In brief, a 5-cm-path optical cuvette (50 mm × 18 mm × 36 mm inside dimensions), serving as the reaction cell, contains the sample, reaction medium, and a 10-mm stirring bar to ensure its agitation.
Illumination was provided by a 3W UV (λ = 365 ± 5 nm) LED (GP-3WUVA-G45, GMKJ LED, Shenzen, China), positioned above the sample, behind a collimating lens, and a UV intensity sensor (ML8511, Lapis Semiconductor, Kanagawa, Japan) to provide optical power feedback, which was correlated to the UV illumination intensity (IUV, mW cm−2) at the sample surface by calibration with a PM400 optical power meter, equipped with a S175C thermopile sensor head (Thorlabs Inc., Newton, NJ, USA).
MB concentration is measured in situ by a laser-diode-based (λ = 650 nm, 5 mW optical power) colorimeter, whose emission wavelength is a close match with the MB absorbance peak at 662 nm, as shown by the MB UV-Vis absorbance spectra available in Figure S1a in the Supplementary materials.
The laser intensity is monitored by photodiode detectors before (I0) and after (I1) the liquid reaction cell, allowing the calculation of the MB absorbance ( A M B ) according to Equation (6):
A M B = l o g ( I 1 / I 0 )
MB concentration ( C M B ) is proportional to  A M B  and can be calculated for each data point using Equation (7), where  A 0 M B  and  C 0 M B  represent the initial absorbance and concentration of MB, respectively. A set of  A M B  vs.  C M B  calibration plots are supplemented in Figure S1b–d in the Supplementary Materials.
C M B = C 0 M B × ( A M B / A 0 M B )
In experiments, 15 mL of aqueous MB solution ( C 0 M B  = 1 ppm) was added to the reaction cell. Initially, a 30 min phase ensures for adsorption-desorption equilibrium is reached, followed by 60 min of UV illumination.  C M B  is measured every 5 min throughout the entire sequence of the experiment to obtain a concentration profile, as shown in Figure 2b. Two quantitative descriptors were extracted from each such dataset:
  • The MB saturation concentration ( C s a t M B ) was estimated by fitting the non-dissociative Langmuir adsorption model (Equation (8)).
    ( 1 C M B ) = C s a t M B × 1 e K A d s M B t
    where  K A d s M B  is the MB adsorption rate constant, and  t  is the time coordinate.  C s a t M B  was then converted to molar saturation coverage per geometric area (nmol cm−2), as shown in Equation (9), where  V C e l l  represents the reaction volume (15 mL),  M W M B  is the molecular weight of MB dye (319.85 g mol−1), and  S F i l m  is the geometric area of the sample (3.9 cm2).
    θ M B [ n m o l   c m 2 ] = C s a t M B [ p p m ] × V C e l l [ m L ] × 10 3 M W M B g   m o l 1 × S F i l m [ c m 2 ]
    The  θ M B  parameter is thus indicative of the differences in the specific surface area between the photocatalytic samples.
  • The MB PCO reaction rate ( r P C O M B ) and reaction rate constant ( K P C O M B ) were determined from the decrease in  C M B  during UV illumination.  r P C O M B  was obtained by linear regression, as shown in Equation (10), where  C 0 P C O M B  represents the initial  C M B  after the dark adsorption phase.
    C M B [ p p m ] = C 0 P C O M B [ p p m ] r P C O M B [ p p m   h 1 ] × t [ h ]
    r P C O M B  was converted to molar MB PCO removal rate per geometric area (nmol h−1 cm−2) using a similar approach as that shown in Equation (9). Additionally,  K P C O M B  rate constants (h−1) were calculated using the pseudo-first-order kinetic model, commonly employed to describe MB PCO removal rates, as shown in Equation (11).
    l n ( C M B / C 0 P C O M B ) = K P C O M B [ h 1 ] × t [ h ]
To provide context for the PCO values, a reference coating of a commercial photocatalyst was evaluated alongside the SA-based TiO2 and ZnO thin films. It was prepared by drop-casting an aqueous suspension of 0.5 mg mL−1 Degussa P25 (now AEROXIDE® TiO2 P25, Evonik Industries AG, Essen, Germany). The suspension was sonicated for 15 min, and a 2 mL aliquot was applied to the surface of a clean 15 mm × 26 mm glass substrate and allowed to dry naturally at RT, followed by heat treatment at 450 °C for 1 h.
Additionally, to compensate for the contributions of MB adsorption on the reaction cell walls and stirring bar during, as well as photolysis during, the PCO phase, a set of blank experiments was conveyed using uncoated glass slides of the same 15 mm × 26 mm dimension.  θ M B  was determined to be 0.146 ± 0.05 nmol cm−2 and  r P C O M B  was found to be 0.109 ± 0.029 nmol h−1 cm−2.

2.5. Computational Methods

2.5.1. Density Functional Theory (DFT) Computations

Density Functional Theory (DFT) computations were employed to predict the vibrational frequencies of the expected Ti[SA] and Zn[SA] complexes. The structures and input files were created using Avogadro ver. 1.2.0 [42], and the GAMESS 2021-R1 [43] package was utilized for the computations. The B3LYP DFT functional [44,45] with Grimme’s D3 dispersion corrections [46] was employed. Hydrogen, oxygen, and carbon atoms were described with 6-311G(d,p) triple zeta basis sets [47], while Ti and Zn atoms were treated with the LANL2DZ-ECP basis with effective core potentials [48,49]. The basis set parameters were obtained from the Basis Set Exchange software [50]. All geometry optimizations and IR-frequency predictions were carried out with simulated IPA solvent with the Polarizable Continuum Model (PCM) implemented in GAMESS.

2.5.2. Data Treatment and Model Fitting

All data treatment, plotting, and model fitting were performed in R version 4.2.2 [51]. Non-linear multivariate fitting was carried out using the Hooke and Jeeves method, as implemented in the {optimr} R package [52]. Additionally, the {pracma} package was used for its complex implementation of the digamma and cotangent functions [53], which were required for some of the optical data model fitting.

3. Results and Discussion

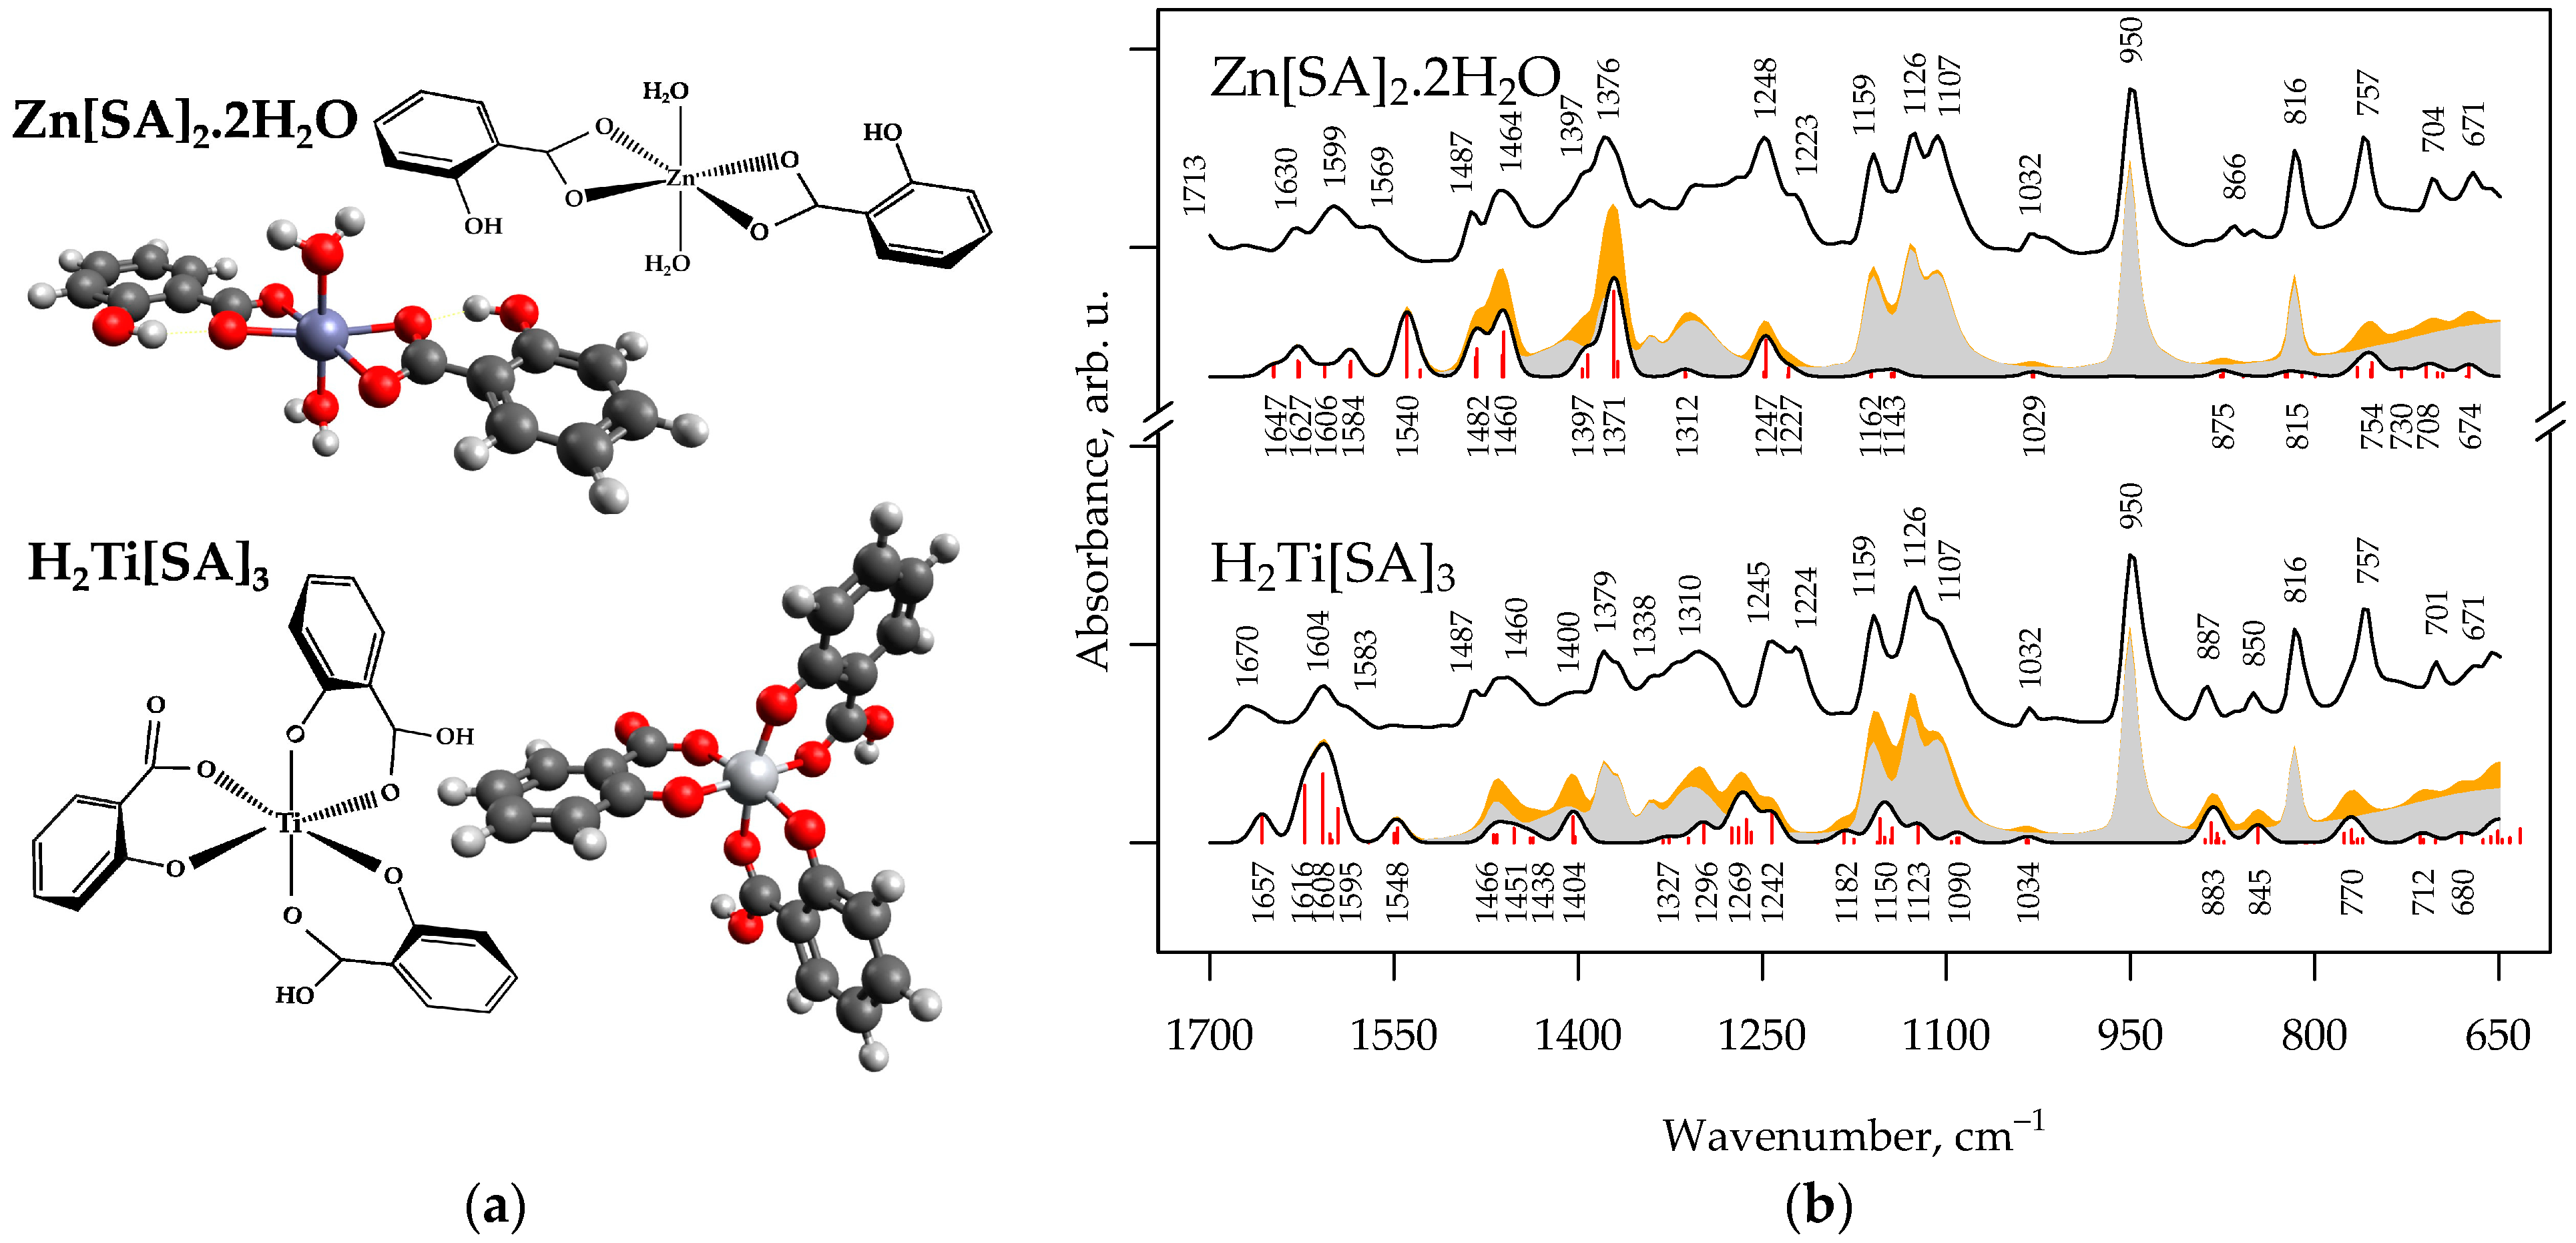
3.1. ATR-FTIR & DFT Investigation of the TiO2 and ZnO Salicylate Sols

ATR-FTIR spectra of the salicylate TiO2 and ZnO deposition sols are shown in Figure 3b,c, alongside a reference spectrum of the SA ligand in IPA depicted in Figure 3a. The spectra encompass the fingerprint region (1800–650 cm−1), which will be comprehensively discussed in the subsequent paragraphs. The ν(C-H) and ν(O-H) group frequency range (3500–2800 cm−1) is also presented, although no significant changes are apparent within this interval. It features a broad band around 3337 cm−1 and a triplet at 2972, 2934, and 2886 cm−1, correlated with ν(O-H) and ν(C-H) modes, respectively, and dominated by the signature of the IPA solvent. The full-scale, uncropped, experimental spectra are included in the Supplementary Materials (Figure S2).
In the free SA ligand spectrum (Figure 3a), the carboxylic ν(C=O) stretching band is evident at 1670 cm−1, followed by a peak at 1610 cm−1 with a 1588 cm−1 shoulder, corresponding to the νas(COO) asymmetric vibration and ν(C=C) aromatic ring modes [54,55,56], implying partial dissociation of SA in IPA. IR absorbance bands at 1487 cm−1 and 1465 cm−1 are linked to ν(C=C) vibrational modes of the aromatic ring [56,57]. The νs(COO) symmetric band is anticipated around 1380 cm−1 [55,56] and apparently is obscured by the IPA solvent background. A broad peak at 1301 cm−1 is associated with the carboxylic δ(OH) bending mode, while the doublet at 1245 cm−1 and 1219 cm−1 corresponds to phenolic ν(C-OH) and δ(OH) modes, respectively [54]. Relatively low-intensity features at 1032 cm−1, 850 cm−1, 757 cm−1, 701 cm−1, and 657 cm−1 arise from δ(C-H) modes of the benzene ring [55]. Other discernible features in the free SA spectra include a pronounced IPA solvent contribution, evident from its standalone FTIR spectra overlayed as a grey infill in the Figure 3a plot for reference.
In the Ti[SA] set (Figure 3b), the ν(C=O) band is reduced in intensity while remaining discernible at 1670 cm−1, alongside the νas(COO), ν(C=C) doublet, subtly shifted to 1604 cm−1 and 1583 cm−1. Within the ring vibration area, 1500–1400 cm−1, a 1460 cm−1 band emerges, growing more prominent with the Ti[SA] concentration. The carboxylic δ(OH) peak at 1301 cm−1 broadens and becomes upshifted to 1310 cm−1. Concomitantly, a decrease in absorbance is observed in the phenolic δ(OH) shoulder, implying an interaction between the Ti atom and oxygens in both the -COOH and -OH groups of SA. New peaks manifest at 887 cm−1 and 671 cm−1, potentially associated with Ti-O-C modes.
By comparison, in the Zn[SA] set (Figure 3c), the ν(C=O) band is suppressed, indicative of a robust interaction between the Zn atom and the carboxyl oxygens. The emergence of a new band at 1713 cm−1 corresponds to the ν(C=O) of CH3COOH released by the dissolution of ZAD. The νas(COO) and ν(C=C) doublet transforms into a triplet, centered at 1599 cm−1, whereas the 1610 cm−1 and 1588 cm−1 bands shift in opposite directions: to 1630 cm−1 and 1569 cm−1. This effect, akin to observations in other bivalent metal salicylates, such as Cu2+ and Fe2+ [56], underscores interaction with the -COOH group. Significantly, the νs(COO) region, now centered at 1376 cm−1, becomes more prominent, while the phenolic ν(CO) and δ(OH) peaks broaden, rendering the carboxylic δ(OH) peak indistinguishable. Analogous to the Ti[SA] case, the ν(C=C) feature at 1460 cm−1 becomes more pronounced, accompanied by the emergence of new bands at 866 cm−1 and 671 cm−1, potentially assignable to Zn-O-C modes.
In both instances, the emerging spectral features attributed to the salicylate formation exhibit an increase proportional to that of the precursor concentration. The evidence of bidentate bridging configuration, reliant on both the carboxylic and phenolic moieties of SA for the Ti[SA] complex and exclusively on the carboxyl group for the Zn[SA] one aligns with the existing literature regarding the preferred complexation modes of these ions with catechol molecules [34,58,59]. Drawing from this insight, it is plausible to infer that the Ti[SA] structure aligns with the H2Ti[SA]3 configuration elucidated by Gigant et al. [33]. Similarly, the Zn[SA] complex matches with the Zn[SA]2·2H2O structure proposed by Klug et al. [60], accommodating the hydration water molecules released by the ZAD precursor, as well.

DFT Modelling of Ti[SA] and Zn[SA] Complexes

To match the experimental ATR-FTIR data with the expected H2Ti[SA]3 and Zn[SA]2·2H2O complexes structure, their IR spectra were predicted computationally. The geometries of both complexes, depicted in Figure 4a, were based on the aforementioned studies by Gigant and Klug [33,60] and optimized at the B3LYP-D3 LANL2DZ-ECP/6-311(d,p) level of theory. The XYZ coordinates of the optimized geometries are provided in the Supplementary Materials (Tables S1 and S2).
Figure 4b presents the predicted IR vibrational frequencies for both complexes, juxtaposed with the experimental ATR-FTIR spectra of the Ti:10 and Zn:10 sols. A synthetic IR spectrum is generated by augmenting them with Gaussian functions (7 cm−1 RMS width). The experimental IPA spectrum is included as a grey overlay in Figure 4b, alongside its sum with the Gaussian-broadened DFT-predicted spectra. Qualitatively, the DFT predictions match well the principal features observed in the experimental spectra.
Table 1 provides a compilation of significant IR vibrational frequencies predicted for both complexes, as well as the free SA ligand. The frequencies are attributed to distinct vibrational modes based on the associated atom displacements. The table also correlates these frequencies with the most prominent ATR-FTIR spectral characteristics that were experimentally detected within corresponding spectral ranges.
For the free SA ligand, the calculated frequencies are in line with previous combined FTIR-DFT investigations [55]. The predicted ν(C=O) frequency (1731 cm−1) is higher compared to the observed one (1650 cm−1). However, in organic solvents, SA tends to form dimeric structures [54], while in this case, free SA was modeled as a monomer. For the H2Ti[SA]3 and Zn[SA]2·2H2O complexes, the predicted frequencies account well for the emergence of new bands in the lower-frequency range, including Ti-O-C and Zn-O-C stretching modes, anticipated at 883 cm−1 and 875 cm−1, respectively, consistent with experimental observations.
The primary distinctions between the two complexes spectra stem from the different interactions between the Ti and Zn central atom and the -COOH group. In the H2Ti[SA]3, this interaction exhibits asymmetry with respect to the two carboxyl oxygens, which is further accentuated by the presence of SA ligands with different protonation states (Ti[SA2−][HSA]2), in accordance with the structure proposed by Gigant et al. [33]. Notably, the appearance of a ν(C=O) band is solely caused by the doubly-deprotonated SA ligand, whereas the other two contribute to carboxylate FTIR region through their νas(COO) modes, collectively intensifying the ~1600 cm−1 area. The νs(COO) mode is suppressed and red-shifted from 1380 cm−1 (in free SA) to 1327 cm−1, resulting in a broad feature, combined with the carboxylic δ(OH) mode and phenolic ν(Ph-OH) C-O stretch, predicted at 1296 cm−1 and 1269 cm−1.
In the Zn[SA]2·2H2O complex, the Zn center engages symmetrically with both carbonyl oxygens, resulting in a subdued ν(C=O) band. The νas(COO) disperses across several IR frequencies in the 1630–1540 cm−1 range, with a concurrent reduction in intensity. In contrast, the νs(COO) band, predicted around 1397–1371 cm−1, displays enhanced intensity, in agreement with the observations from the experimental Zn:10 spectra.
An interesting aspect illuminated by the calculated IR spectra is the subtle difference between the two complexes, observed in the in-plane δ(CH) bending region (1160–1100 cm−1) of the experimental ATR-FTIR spectra. For Zn[SA]2·2H2O, the predicted intensity of the in-plane δ(CH) bending modes is notably attenuated when compared to the H2Ti[SA]3 case. In the standalone IPA spectrum, this region is characterized by a distinct triplet at 1159 cm−1, 1126 cm−1, and 1107 cm−1, a pattern maintained in the Zn:10 case, as shown in Figure 4b. However, for H2Ti[SA]3, the additional absorbance in this area contributes to enhancing the 1159 cm−1 and 1126 cm−1 peaks, causing the 1107 cm−1 band to appear as a shoulder, in line with the experimental Ti:10 result.
In summary, the DFT calculations provide strong confirmation of the presence of the H2Ti[SA]3 and Zn[SA]2·2H2O complexes, offering a qualitative match with the experimental ATR-FTIR observations. These results underscore the formation of these complexes within the TiO2 and ZnO deposition sols.

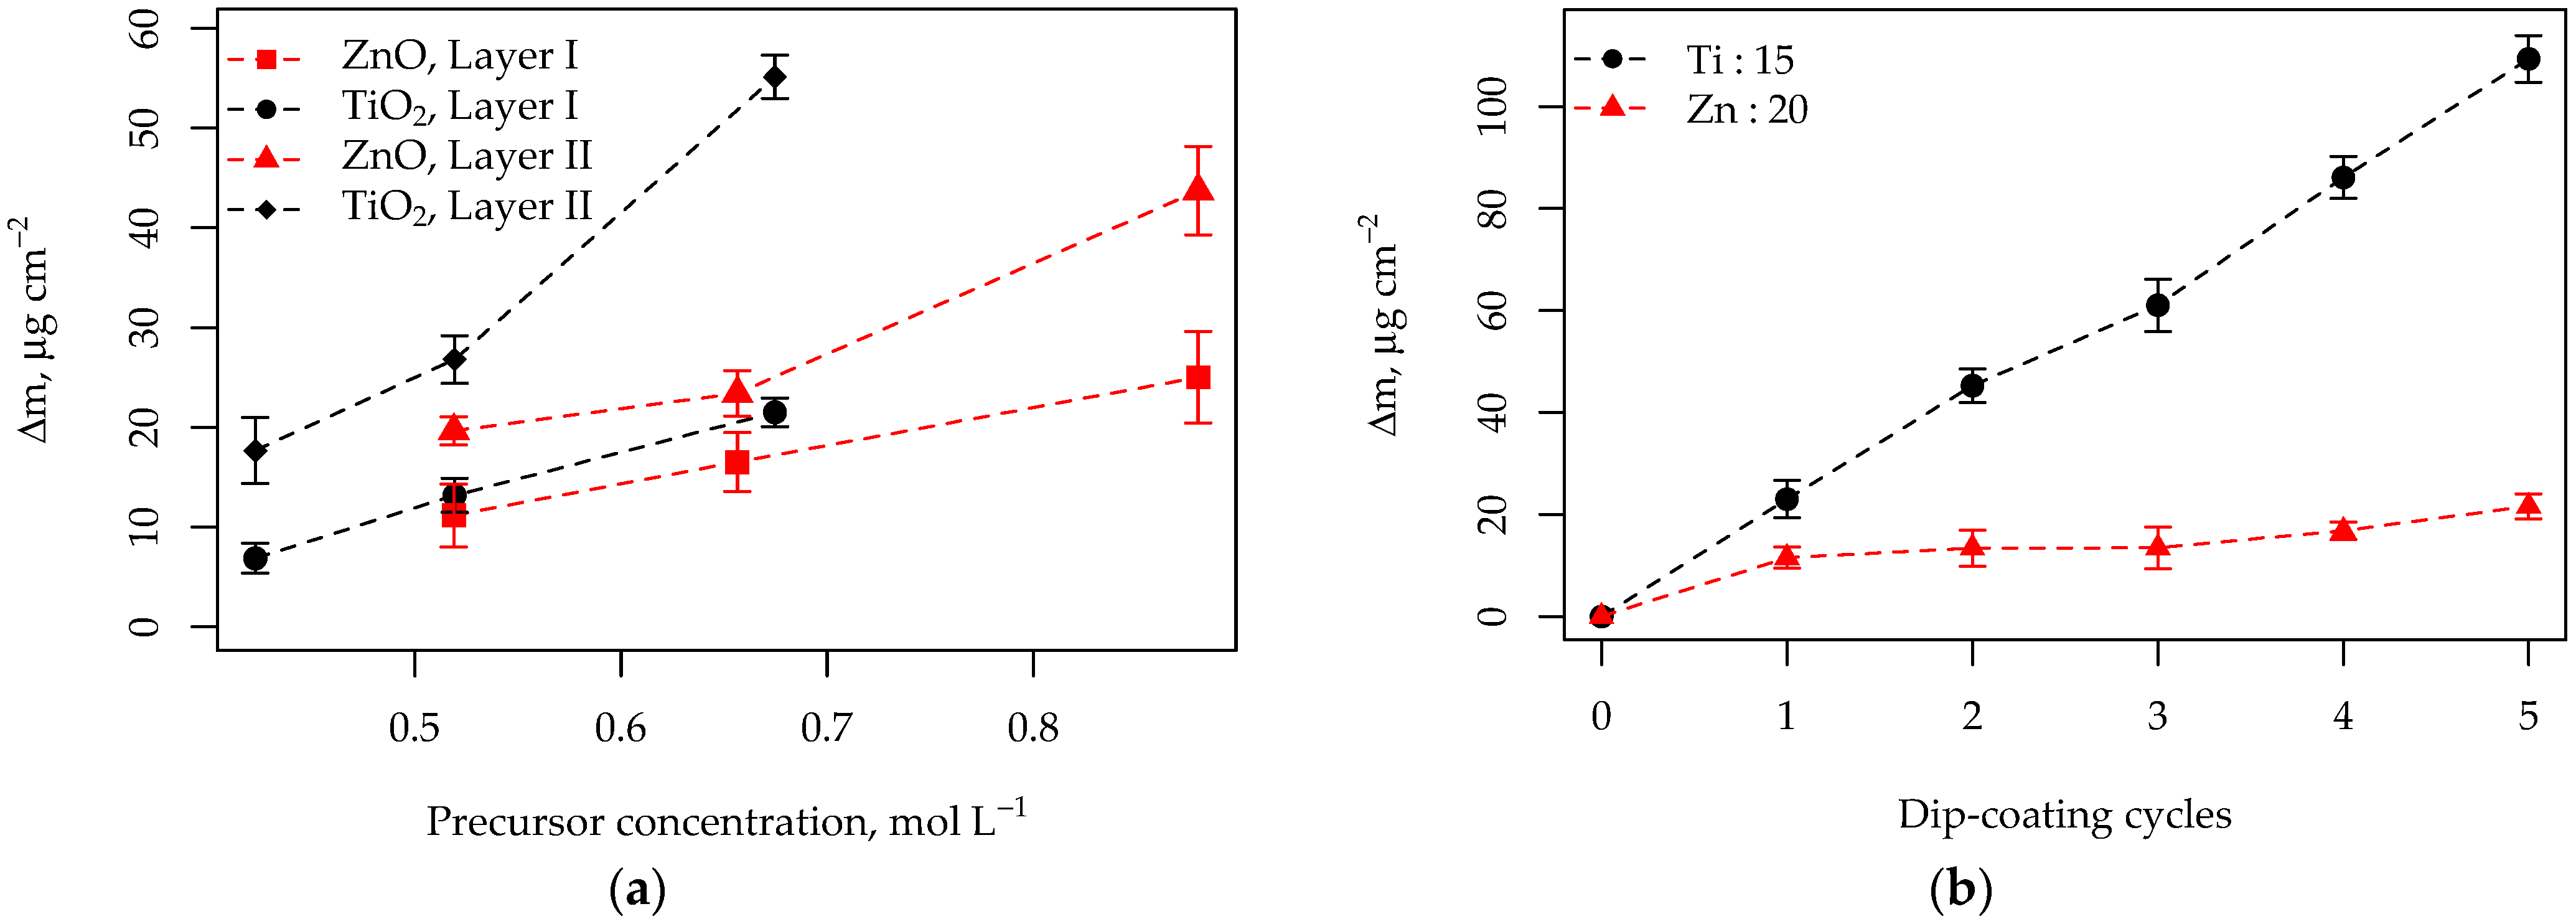
3.2. Effect of Precursor Concentration on the Physicochemical Parameters of TiO2 and ZnO Deposition Sols and Resulting Thin Film Mass-Loading

Elucidating the formation of Ti and Zn salicylates in the sols, the next aim is to investigate the effects of their concentration on the physicochemical properties of the deposition solutions. The sol-specific gravity ( ρ ), surface tension ( σ ), and viscosity ( η ) collectively impact the thickness of the dip-coated layers [22]. Table 2 lists the experimentally obtained  ρ σ , and  η  values, measured immediately after aging and prior dip-coating, for all six sols as a function of their precursor-to-solvent ratios (1:20, 1:15, and 1:10).
Using the values of  ρ σ , and  η , the anticipated dip-coated layer thickness ( h L L ) can be predicted by the Landau–Levich equation [22,61]:
h L L = 0.94 ( η U ) 2 / 3 σ 1 / 6 ρ g ,
where  U  is the withdrawal velocity (0.25 mm s−1) and  g  signifies the gravitational acceleration (9.8 m s−2). Thus obtained,  h L L  reflects the thickness of the liquid sol layer drawn along the moving substrate during the dip-coating process. However, it can be readily converted to the anticipated post-calcination mass-per-area metal oxide loading, using Equation (13) to enable a comparison with experimental gravimetric analysis values:
m t h e o r = h L L ρ   w p r e c M w p r e c M w o x i d e ,
where  ρ  denotes the sol density,  w p r e c  is the precursor weight fraction, and  M w p r e c  and  M w o x i d e  are the molar masses of the precursor (220 g mol−1 for ZAD and 284 g mol−1 for TTIP), and the oxide (81 g mol−1 for ZnO and 78 g mol−1 for TiO2), respectively.
The  m t h e o r  values, predicted via Equations (12) and (13), for all sol compositions are listed in Table 2, along with experimentally obtained values. The latter were averaged from sets of six thin films, deposited in two dip-coating cycles, from each sol composition, with a full 450 °C calcination after each cycle. The experimental values reflect the mass change after the first ( m I ) and second ( m I I ) cycle, as well as the cumulative loading ( m t o t ).
The data in Table 2 clearly demonstrates that precursor concentration results in a proportional rise in  ρ σ , and  η  in both the TiO2 and ZnO deposition sols, which, in accordance with the Landau–Levich model, consequently, leads to an increased mass loading, respectively thickness, of the dip-coated layers. A qualitative comparison between  m t h e o r  and experimental ∆m values reveal a good agreement. The Landau–Levich model accurately predicts a marginally higher mass loading for ZnO films in all cases. However, the predicted values tend to underestimate the observed values by approximately 20% for the Ti-sols and 35% for the Zn-sols.
This discrepancy can be attributed to the effects of solvent evaporation during dip-coating, which are not accounted for by the Landau–Levich equation and are generally thought to increase the solute concentration in the deposited liquid layer, as demonstrated by Kuznetsov and Xiong [62], which in turn effectively increases the resulting mass-loading.
A notable difference in the behavior of the TiO2 and ZnO deposition sols, reflected in the application of subsequently dip-coated layers, is illustrated in Figure 5. Figure 5a plots the effect of precursor concentrations against the experimentally observed mass-change ( m ) for the initial- ( m I  in Table 2) and subsequently dip-coated layer ( m I + m I I , or  m t o t  in Table 2). To aid interpretation, the salicylate content was converted to molar concentration, applicable both for the TTIP and ZAD precursors, as well as the anticipated H2Ti[SA]3 and Zn[SA]2·2H2O complexes. Notably, the linear increase in mass-loading vs. precursor content, discussed above, is observed in both cases only for the initial layer. However, for the overcoated layer,  m  is systematically lower in the ZnO case.
This discrepancy may be attributed to differing interactions between the salicylate solution and the two surfaces. Catechols, such SA, possess a strong affinity towards MeOx surfaces, including TiO2, with the possibility of forming bridging structures [59] even with the available -COOH groups when in the H2Ti[SA]3 complex. Consequently, when overcoated on the previously deposited TiO2 surface, the Ti-sol may have a lower surface tension, facilitating a highly conformal coating, akin to the observations for alumina surfaces using a salicylate-based Ti-sol in our previous publication [37].
Conversely, ZnO is known for low stability in acidic environments and in the presence of strong ligands [63]. Hence, potential dissolution of previously deposited ZnO cannot be discounted. To test this hypothesis, in a separate experiment, TiO2 and ZnO films were deposited with up to five consecutive layers, employing the Ti:15 and Zn:20 sols, which yield similar mass loading per layer, of 11 μg cm−2. As shown in Figure 5b, a clear linear increase in  m  vs. the number of dip-coating cycles is obtained for the Ti:15 sol, while a plateau in the  m  values after the second dip-coating cycle is notably observed in the Zn:20 case, indicating dissolution of the previously deposited layers.
In summary, the results demonstrate that precursor concentration affects the physicochemical parameters of the sol deposition solutions, which in hand have a direct effect on the resulting thin film thicknesses. The experimental data also suggest greater applicability of the Ti-salicylate system on the more chemically stable TiO2 surface for achieving tunable film thickness through multiple dip-coating cycles, as compared to the Zn-salicylate sol, due to ZnO dissolution.

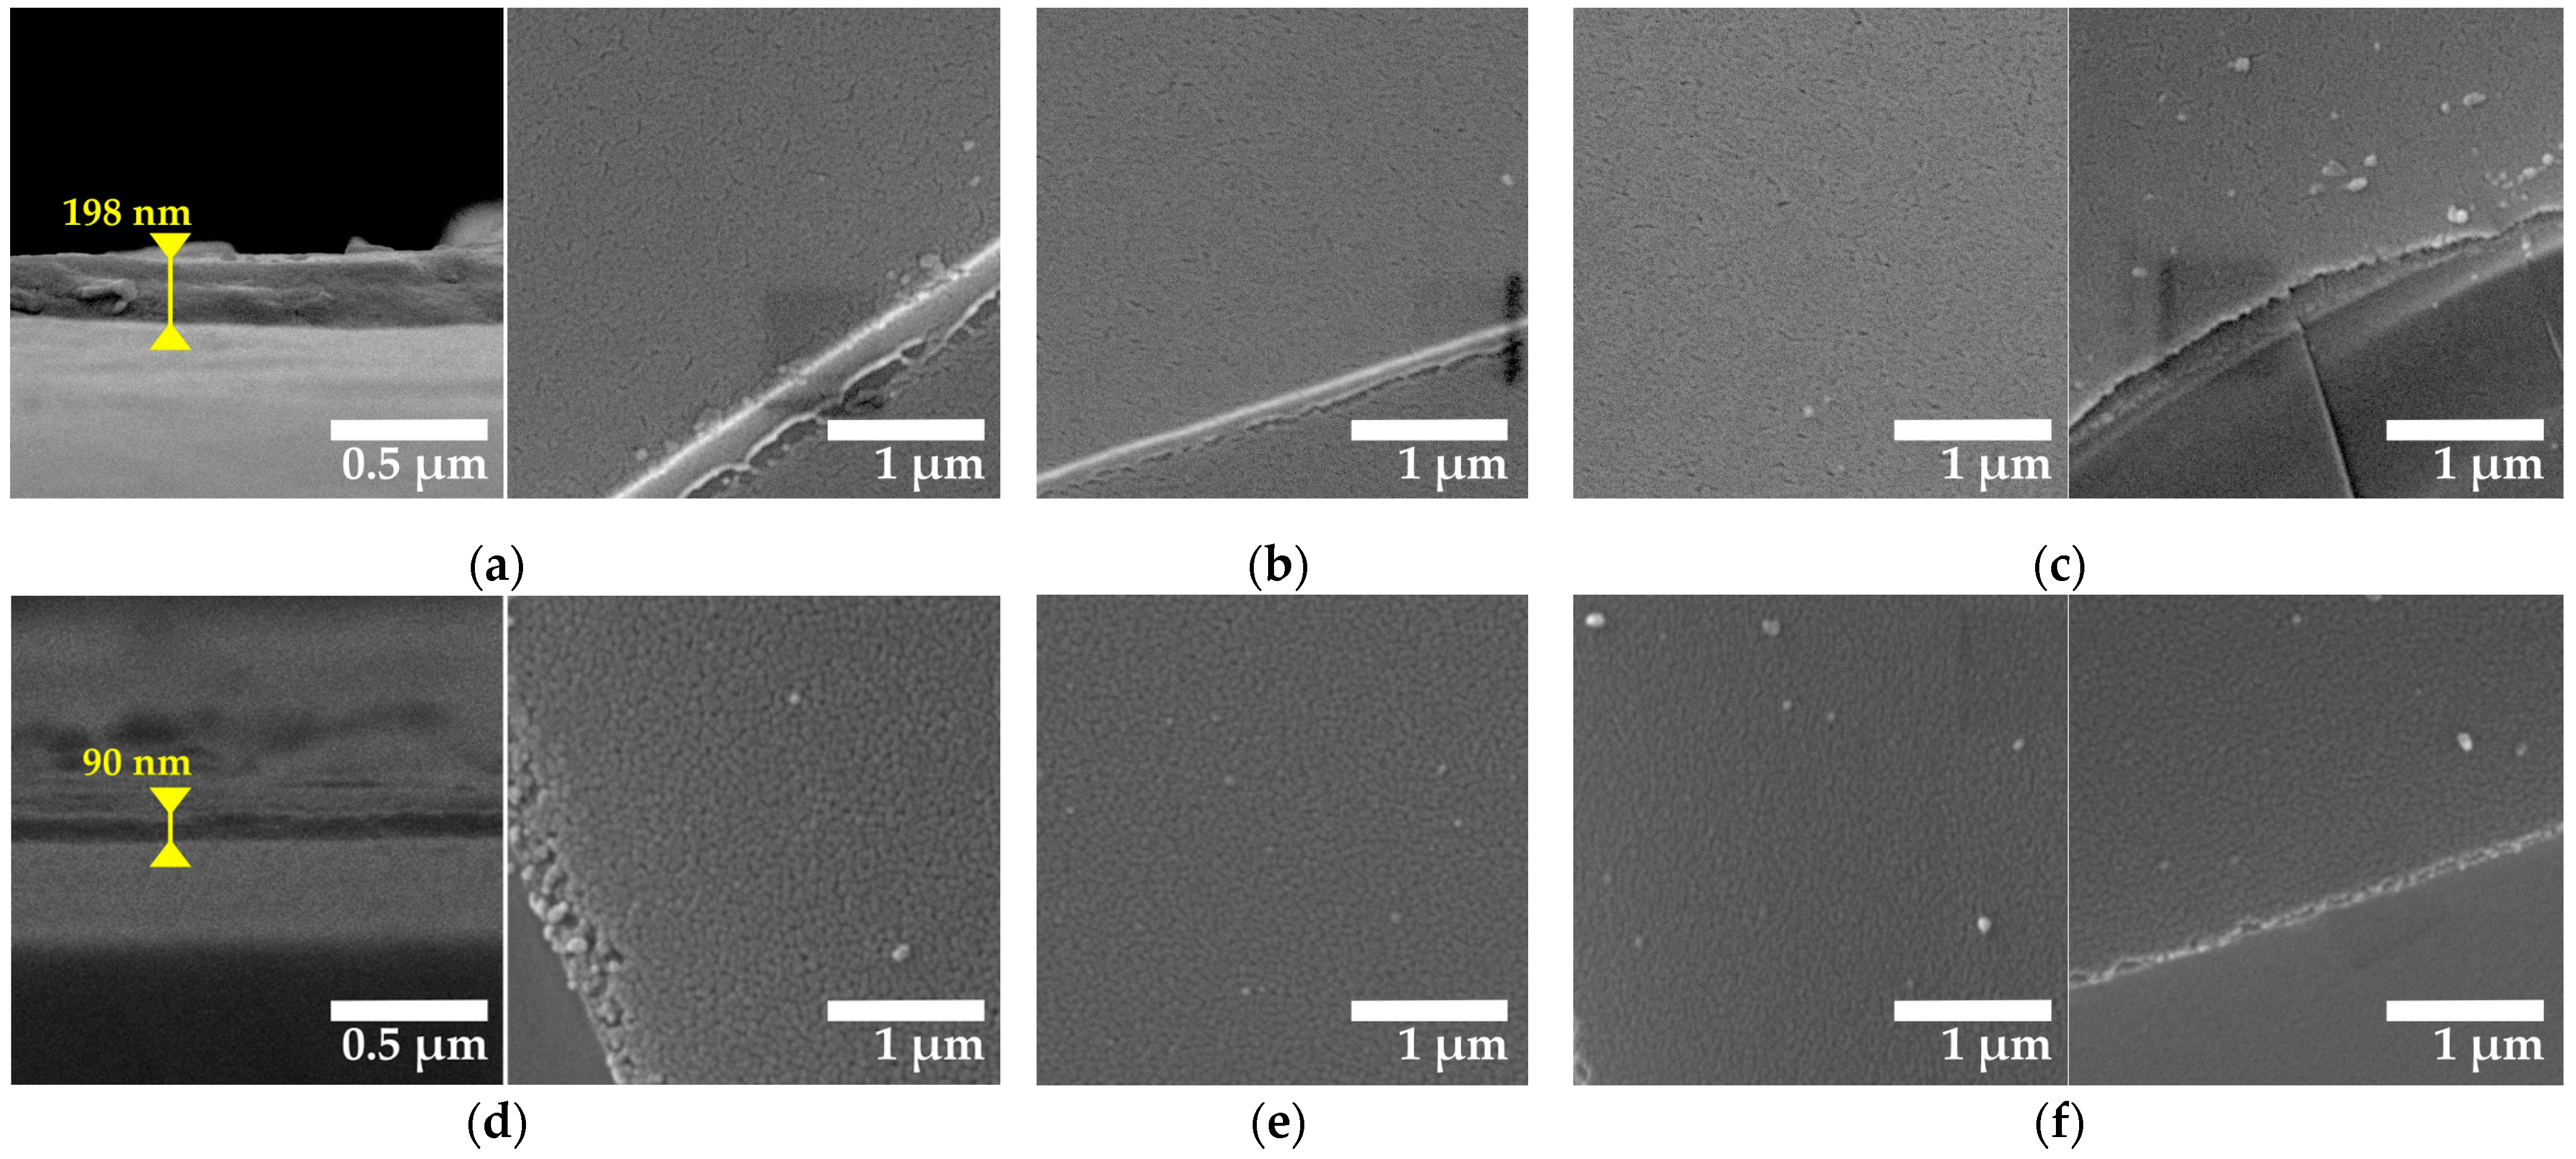
3.3. Structure & Morphology of Salicylate-Based TiO2 and ZnO Thin Films

SEM micrographs revealing the morphology of films deposited through two dip-coating cycles from each of the six sol compositions are shown in Figure 6.
The TiO2 films (Figure 6a–c) exhibit dense, uniform surfaces with fine grains, consistent with typical sol-gel titania films [29,30]. No apparent morphological changes attributed to precursor concentration effects are discernible. Cross-sectional micrographs (Figure 6a) reveal a thickness of approx. 200 nm for the Ti:10-deposited layers, alongside a compact internal structure.
The ZnO films (Figure 6d–f) exhibit a comparable morphology, featuring slightly more granular structures. Notably, this morphology differs from traditional sol-gel films obtained from ZAD:MEA:2-ME sols, often defined as “wrinkled,” ganglia-like patterns [26], and is more consistent with the one obtained by the EDTA-based MPM method [25]. Nevertheless, the solvent influence cannot be ignored, as evidenced by the work of Vajargah et al. [20], where uniform, finely granular morphologies were achieved using ethanolamine-stabilized sols based on 1-propanol. The thickness of the Zn:10-deposited ZnO film is approximately 90 nm (Figure 6d).
Comparing the Ti:10 and Zn:10 cases, the observed thickness contrasts with their similar  m t o t  values of 55 ± 2 µg cm−2 for TiO2 and 44 ± 4 µg cm−2 for ZnO, which, alongside bulk densities of 4.2 g cm−3 for TiO2 and 5.6 g cm−3 for ZnO, can be used to roughly estimate an expected thickness of 131 ± 5 nm and 79 ± 7 nm, assuming dense films. This discrepancy suggests that the deposited films are of lower density due to intrinsic porosity.
XRD diffraction patterns for all TiO2 and ZnO films are shown in Figure 7 and, given their low thickness, exhibit a strong amorphous halo caused by the glass substrate.
Nevertheless, in the TiO2 films’ XRD patterns (Figure 7a) the formation of anatase TiO2 can be suggested by the (101) reflection observed in the Ti:10-deposited film. Scherrer analysis estimates an average crystallite size of 14 nm for this case.
Similarly, the ZnO films from the Zn:10-sol (Figure 7b) exhibit (100), (002), and (101) reflections, consistent with the zincite structure. Noticeably, the comparable intensity of the (100) reflection to that of (101) implies an a-axis preferential orientation, characteristic of ZnO sols with precursor concentrations > 0.2 mol L−1, as noted by Znaidi [27]. Scherrer analysis of the (101) peak indicates a mean crystallite size of 22 nm for the Zn:10 deposited film.
Quantitative analysis of crystallite size was unfeasible for other cases due to lower XRD peak intensity, potentially attributed to film thinness or lower crystallinity, resulting from salicylate compositions with precursor-to-solvent ratios below 1:10.

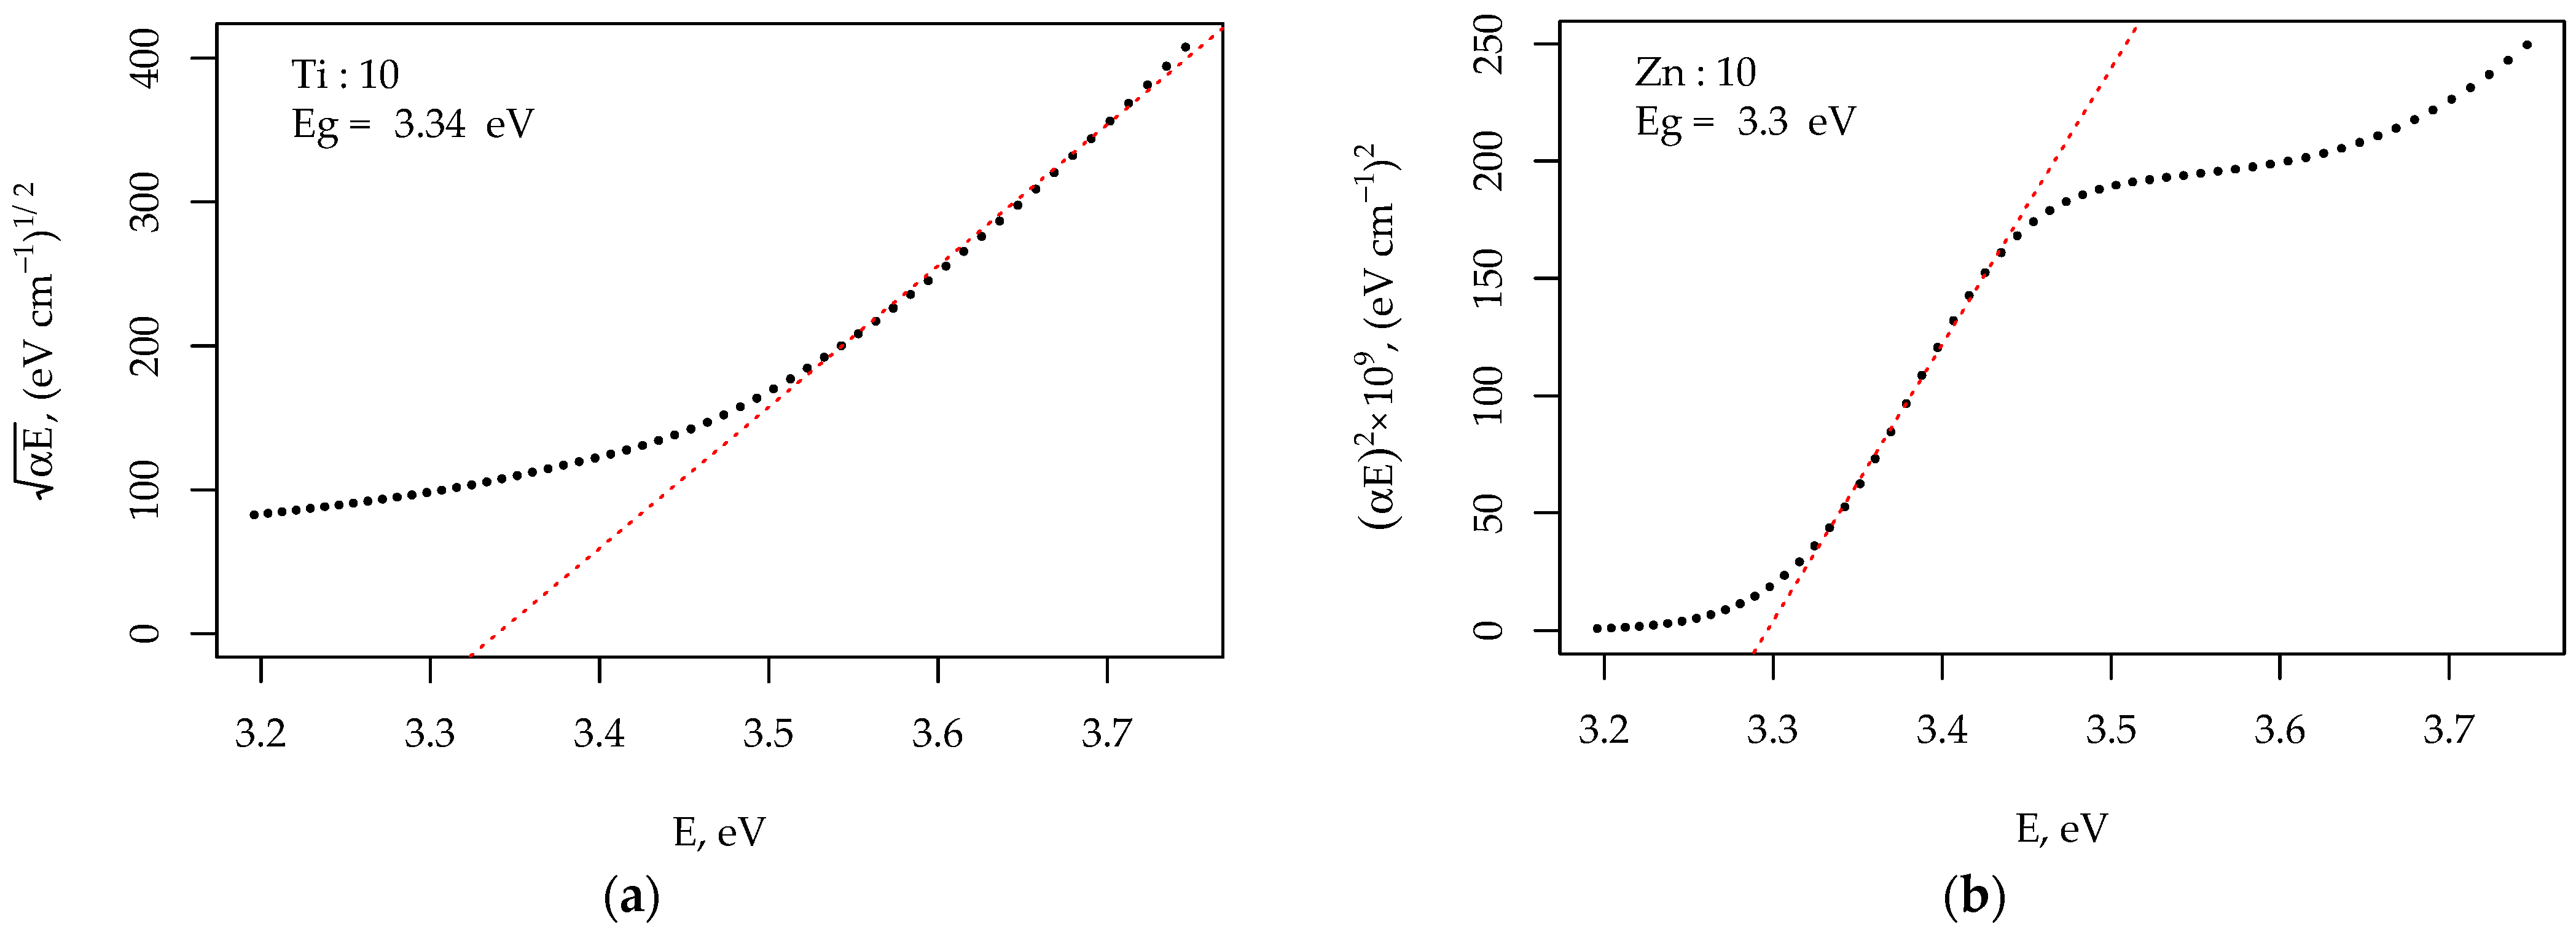
3.4. Optical Properties of the TiO2 and ZnO Thin Films

As evident by the photographic images and UV-Vis transmittance spectra, shown in Figure 8, all of the TiO2 (Figure 8a,c) and ZnO films (Figure 8b,c), exhibited optical transparency in the visible region, regardless of the deposition sol concentration. The transmittance spectrum of the bare glass substrate is also shown in Figure 8b,d for reference.
The TiO2 films exhibited a slight color tint, also reflected as interference fringes in their transmittance spectra (Figure 8b), with a noticeable red-shift in proportion to deposition sol precursor concentration, arising from TiO2‘s higher refractive index (2.52 for bulk anatase) compared to ZnO (2 for bulk zincite), combined with and greater film thickness of the titania films, as discussed in the previous sections.
The ZnO films exhibited no significant features in their transparency range (400 nm < λ < 1000 nm), with transmittance values approaching that of the bare substrate. Below 400 nm, the TiO2 films show a sharp transmittance drop due to bandgap excitation. Instead, ZnO films are defined by a distinct dip-and-plateau feature around 359 nm, attributed to excitonic absorption [26], which becomes more prominent in the films deposited from higher precursor concentration sols and apparently is related to their thickness.
The optical bandgaps ( E g ) of the TiO2 and ZnO thin films were determined using the Tauc relation,  α E n = B ( E E g ) , where  α  represents the absorption coefficient obtained from transmittance spectra,  B  is a constant, and  E  is the photon energy in eV. For indirect bandgap semiconductors like TiO2 n = ½  [18], while for direct-bandgap semiconductors like ZnO,  n = 2  [19,26]. Analysis of  α E n  vs. ( E ) plots for Ti:10 deposited TiO2 (Figure 9a), and Zn:10 deposited ZnO films (Figure 9b) revealed  E g  values of 3.34 eV and 3.3 eV, respectively.
Tauc plots for films obtained from the other sol solutions are provided in Supplementary Materials (Figure S3). Reducing the Ti[SA] complex-to-solvent ratio from 1:10 (Ti:10) to 1:20 (Ti:20) led to an  E g  increase to 3.43 eV, attributed to poorer crystallinity and reduced thickness. Conversely, in ZnO films,  E g  remained stable, with a marginal redshift from 3.30 to 3.28 eV for the lower Zn[SA] precursor concentration sols, values consistent with that of sol-gel deposited ZnO thin films [25].

3.4.1. Transfer Matrix Method Modelling of TiO2 and ZnO Thin Film Transmittance Spectra

To gain further insight into the thin films’ optical properties, their UV-Vis transmittance spectra were mathematically modeled, employing the transfer matrix method (TMM) [64]. As depicted in Figure 10, the dip-coated samples were modeled as a three-layer configuration.
Each layer is defined by its thickness ( d ) and complex refractive index ( n ~ ), defined as  n ~ = n + i k , where  n  represents its ordinary index of refraction and  k —the optical extinction coefficient. The thin films layers (TiO2 or ZnO) are symmetrically deposited on both sides of the substrate ( d 2 = d s u b n ~ 2 = n ~ s u b ), and assumed to be of the same thickness ( d 1 = d 3 = d f i l m ) and refractive index ( n ~ 1 = n ~ 3 = n ~ f i l m ). The stack is enveloped by air ( n ~ 0 = n ~ 4 = 1 + i 0 ).
Assigning distinct transmittance coefficients ( T m ) to each of the three layers, the overall transmittance of the structure ( T ) can be defined as their product:
T = m = 1 3 T m ,
where the values of  T m  are determined from each layer’s individual system transfer matrices  S m :
S m = S 11 S 12 S 21 S 22 = I m 1 ,   m P m I m ,   m + 1
where  I m 1 ,   m  and  I m ,   m + 1  denote the interface matrices between the m-layer and its neighboring media, and  P m  is the propagation matrix. The interface and propagation matrices for the optically coherent thin film layers (m = 1, 3 in Figure 10) are defined in Equations (16) and (17):
I m , n = 1 t m , n 1 r n , m r m , n t m , n t n , m r m , n r n , m w h e r e   t m , n = 2 n ~ m n ~ m + n ~ n   a n d   r m , n = n ~ m n n ~ m + n ~ n
P m = e i δ m 0 0 e i δ m ,   w h e r e   δ m = 2 π n ~ m d m λ
and  λ  is the transmitted light wavelength. Thus, for the optically coherent thin films  T m  is obtained by applying Equation (18) on the  S 11  element, returned by the system transfer matrix in Equation (15).
T m = 1 S 11 2
Applying the abovementioned approach to the substrate (m = 2 in Figure 10), whose thickness is three orders of magnitude greater than the transmitted wavelengths, results in high-frequencies oscillations in the resulting transmittance spectra, which cannot be resolved by instrumental UV-Vis spectroscopy. Thus, optical incoherence is introduced for the substrate by converting its transfer matrix to an intensity matrix, employing the square magnitude of its elements, by modifying Equations (16) and (17) into the form shown in Equation (19) [65].
I m , n = 1 t m , n 2 1 r n , m 2 r m , n 2 t m , n t n , m 2 r m , n r n , m 2 ,   a n d   P m = e i δ m 2 0 0 e i δ m 2
Using this approach, Equation (18) is simplified to:
T m = 1 S 11
The division of the overall transfer matrix into separate ones allows for separate treatment of the thin films and the intermediate substrate layer as optically coherent and incoherent components, respectively. Consequently, the overall transmittance of the dip-coated layer stack becomes a functional relationship of the transmitted wavelength, the complex refractive index dispersions of the substrate,  n ~ s u b ( λ ) , with constant, and the unknown thickness,  d f i l m , and complex refractive index dispersion,  n ~ f i l m ( λ ) , of the dip-coated layers, that can be treated as fitting parameters.
The refractive index dispersion of the substrate,  n ~ s u b ( λ ) , is modeled using the wavelength-dependent refractive index,  n ( λ ) , and optical extinction constants,  k ( λ ) , derived from UV-Vis transmittance and reflectance spectra of the bare substrate, following the procedure of González-Leal [66]. These values were fitted to parametrize a Cauchy absorbent model [67], expressed in Equation (21).
n λ = A + B × 10 4 λ 2 + C × 10 9 λ 4 k λ = D × 10 5 + E × 10 4 λ 2 + F × 10 9 λ 4
where A through F are the empiric constants. Consequently, the complex refractive index of the substrate becomes:  n ~ s u b λ = n A ,   B ,   C ,   λ + i k ( D ,   E ,   F ,   λ ) .
The refractive indices of the thin films are described with appropriate dispersion models of their complex dielectric function  ε ~ ( λ ), instead, and subsequently transformed into a complex refractive index through the relation  n ~ ( λ ) = ε ~ ( λ ) .
In the case of TiO2, a single Tauc–Lorentz oscillator model was employed, which is typically used for titania thin films [68]. Its functional form is:  ε ~ T L = ε T L R e E g , ε ,   E 0 , A , C ,   E + i ε T L I m ( E g , ε ,   E 0 , A , C ,   E ) , where  E g  signifies the optical bandgap,  ε  represents the dielectric function value at high frequencies,  E 0  stands the oscillator energy, and  A  and  C  denote the amplitude and broadening coefficient of the oscillator peak, respectively.  E  is the photon energy ( E = h c / λ ). The complete analytical expressions for both  ε T L R e  and  ε T L I m , as proposed by Jellison and Modine [69], were directly employed in the TiO2-coated samples TMM models without modification.
For ZnO films, features in the transmittance spectra emerge only below its  E g  and are not covered by the Tauc–Lorentz dispersion. Instead, the Tanguy dispersion model, based on Wannier excitons [70], was applied and shown to yield a good description of ZnO’s excitonic features [19,71]. In this context, the complex dielectric function is directly given by Tanguy’s dispersion:  ε ~ T a n g u y ( E g ,   A ,   Γ ,   R ) . Here  E g  signifies the optical bandgap,  A  represents the amplitude pre-factor,  Γ  is a broadening term of the energy levels, and  R  denotes the exciton binding energy. The analytical solution given by Tanguy is applied directly [72] with the addition of the Sellmeier term, as shown in Equation (22), to improve the description of the transparency region.
ε ~ = ε + B E 2 E S 2 + ε ~ T a n g u y ( E g ,   A ,   Γ ,   R )
The entire mathematical apparatus described above, including the transfer matrix equations, Cauchy, Tauc–Lorentz, and Tanguy dispersion functions, were implemented in R-scripts, which are provided in the Supplementary Materials (Appendix S1).

3.4.2. Results from Modelling of TiO2 and ZnO Thin Film Transmittance Spectra

The TMM model fits the transmittance data presented in Figure 11, and the extracted parameters for the TiO2 and ZnO films, obtained from all of the salicylate sol compositions, are listed in Table 3. The quality of the fits is assessed using the  χ 2  parameter. While the mathematical model fits do not perfectly match the experimental transmittance profiles, particularly in the extreme transparency regions dominated by free-carrier absorption, the results qualitatively capture the interference pattern of the TiO2 films and the position and absorbance of the excitonic band in ZnO. These fits offer a satisfactory basis for extracting additional analytical insights into the impact of sol concentration on the resulting film properties from the transmittance spectra.
For the TiO2 films, the TMM results estimate a film thickness ( d f i l m ) of 205 nm in the Ti:10 case, consistent with SEM observations. At lower precursor concentrations in sols Ti:15 and Ti:20,  d f i l m  decreases to 137 nm and 86 nm, respectively, aligning well with gravimetric analysis data and the observed interference peaks (Figure 11a). Concerning the Tauc–Lorentz fitting parameters, the obtained  E g  values qualitatively match those from the Tauc plots, revealing a blueshift from 3.39 eV for Ti:10 to 3.47 eV for Ti:20. Further fitting parameters are detailed in Table 3 and show good agreement with the literature values for sol-gel TiO2 thin films [68]. The refractive index of TiO2 films falls within the range of 2.02 to 1.91, decreasing with precursor concentration. Employing these values, the film porosity is estimated at 21% to 27%, determined by Equation (23), derived from the Lorentz-Lorenz effective medium model:
P = 1 n 2 1 n B 2 + 2 n 2 + 2 n B 2 1 × 100 [ % ]
where  n B  represents, in this case, the refractive index of bulk anatase TiO2 (2.52).
For the ZnO films model fits, the number of free variables was limited, considering the limited features in their UV-Vis spectra. The eight parameters encompassed by Equation (22) to describe Tanguy’s dispersion underwent a reduction by setting  ε = 1  for all fits; fixing the exciton energy  R = 60   m e V , typical for ZnO films [71]; and optimizing Sellmeier term’s  B  and  E s  independently. These are then fixed to the values specified in Table 3 across all three fits. Consequently, the description of ZnO thin films was streamlined to four parameters:  E g A , and  Γ , along the film thickness  d f i l m .
The resulting fits, depicted in Figure 11b, generally exhibit lower  χ 2  values and comparatively lower fitting quality compared to the TiO2 fits. However, they offer some valuable insights. Notably, the TMM fitting indicates  d f i l m  to span the range of 72 to 35 nm, exhibiting a decreasing trend with precursor concentration—congruent with expectations and gravimetric analysis data.  E g  values in the range of 3.45 to 3.46 eV are notably higher than those obtained from Tauc plots. The decrease in film thickness correlates with a systematic reduction in the amplitude ( A ) parameter, concurrently accompanied by an increase in the broadening ( Γ ) term. Such trends align with the anticipated behavior for ZnO films of lower crystallinity [71,73].
Discernible from the UV-Vis spectra and TMM-predicted, the refractive indices within the ZnO films lie between 1.57 and 1.48, diminishing with increasing precursor concentration. Assuming a bulk refractive index of 2.0 for ZnO, these values translate to porosities spanning 34% to 43%.

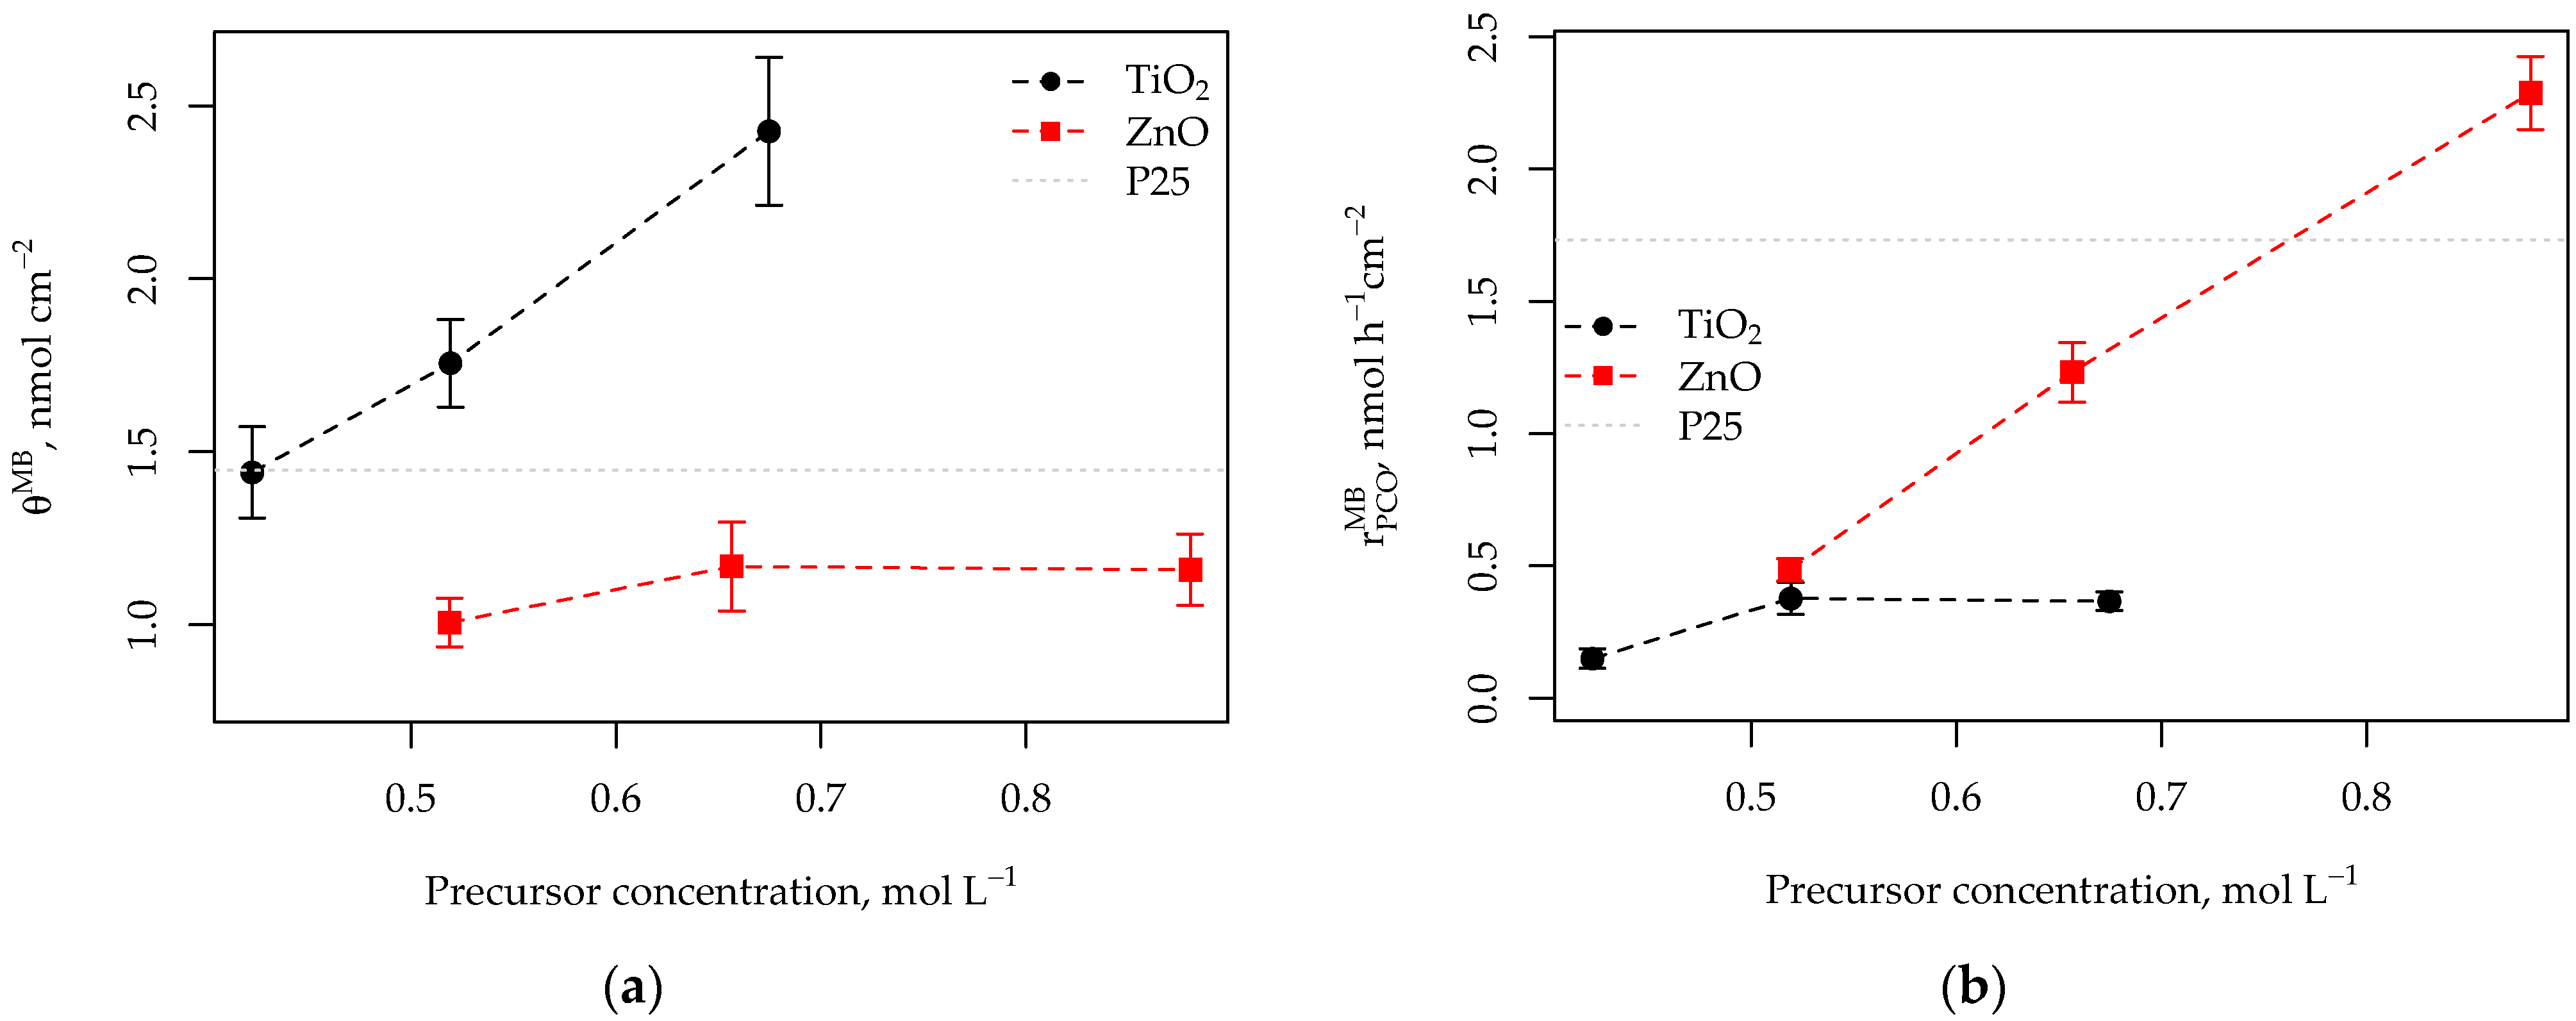
3.5. Photocatalytic Activity of the TiO2 and ZnO Thin Films

The effects of Ti[SA] and Zn[SA] precursor concentration in the deposition sols on the photocatalytic activity of the resulting coatings were investigated in liquid-phase MB photocatalytic oxidation (PCO) experiments. Each data point, discussed in this section is obtained from three separate runs of three parallel experiments and, hence, is based on an average of nine experimental values. As discussed in Section 2.3, each experiment provided two parameters: the saturation coverage of the model pollutant ( θ M B ) and the rate of pollutant removal ( r P C O M B K P C O M B ).
Beginning with the effects on the deposition sol composition on  θ M B , the results are depicted in Figure 12a. Notably, in TiO2 films, the deposition sol concentration yields a linear increase in  θ M B , from 1.4 to 2.4 nmol cm−2. This corresponds to approximately 0.87 × 10¹⁵ to 1.47 × 10¹⁵ molecules per square centimeter, while the established surface density of Ti-sites, relevant for monolayer formation on a planar titania surface, is documented at 0.52 × 10¹⁵ [74]. However, it should be noted that MB, being a bulky molecule, would probably not form monolayers with a single molecule per active site. The observed linear correlation between film thickness and  θ M B  for TiO2, alongside SEM analysis (Figure 6a–c), suggests that MB adsorption extends beyond the film surface, with dye molecules adsorbed inside the porous structure. Conversely, the  θ M B  values for ZnO films were relatively stagnant, ranging from 1 nmol cm−2 to 1.2 nmol cm−2, regardless the concentration of the deposition sol or its corresponding impact on film thickness. This observation implies that any internal porosity within the ZnO films seems to have limited accessibility to MB dye adsorption.
The MB removal rate ( r P C O M B ) across the Figure 12a sample set is shown in Figure 12b. Intriguingly, the increased MB adsorption accessible surface area does not yield a concomitant correlation with a high intrinsic photocatalytic activity. Specifically, films derived from the Ti:20 sol exhibited an  r P C O M B  value of 0.149 nmol h−1 cm−2, increasing to 0.377 nmol h−1 cm−2 for Ti:15 and stagnating in the Ti:10 case, while the benchmark P25 reference notably outperformed these figures with an  r P C O M B  value of 1.733 nmol h−1 cm−2.
In contrast, the ZnO films exhibit a clear linear increase in  r P C O M B  with sol concentration, with rates increasing from 0.485 nmol h−1 cm−2 to 2.288 nmol h−1 cm−2 along Zn:20 to Zn:10 cases, surpassing the activity of the commercial P25 photocatalyst. This observation could be attributed to several factors. Firstly, the XRD patterns (Figure 7) indicate better crystallinity in the ZnO films, particularly evident in the Zn:10 and Zn:15 cases. Secondly, it is noteworthy that the soda-lime glass microscope slide substrates may allow diffusion of Na+ ions into the TiO2 layer during heat treatment, thereby potentially lowering its activity [75]. This effect is less pronounced in the P25 sample, as it is not reliant on crystallization during this step. In contrast, for ZnO, Na+ incorporation has been demonstrated as a form of doping without any detrimental effects [76].
All  r P C O M B  rates shown in Figure 12 were obtained under a similar UV irradiation intensity,  I U V = 0.88 ± 0.09 mW cm−2. However, varying  I U V  during PCO experiments and analyzing the resulting dependence of  r P C O M B  on this parameter can offer insights into the stability and quantum efficiency of a given photocatalyst. Mills et al. [77] established an interpretation that the photocatalytic reaction rate dependency on  I U V  follows three functional regimes: (1) low-to-medium  I U V  results in a linear effect on  r P C O M B ; (2) medium-to-high  I U V  leads to a square-root relationship with  r P C O M B ; and (3) at high  I U V r P C O M B  is anticipated to plateau due to saturation. The precise transition values between these regimes hinge on the particular photocatalyst, as determined by its reaction turnover number per provided photon count. Typically, medium  I U V  values are considered to be above 1 mW cm−2 for thin films of P25.
Figure 13 presents a comparison of the  r P C O M B  vs.  I U V  profiles derived for TiO2 thin films deposited using the Ti:10 sol, ZnO thin films from the Zn:10 sol, and the reference P25 sample.
The reference P25 sample exhibits a positive  r P C O M B  vs.  I U V  dependence, characterized by the expected square-root increase across the 0.8–4.9 mW cm−2  I U V  range, where  r P C O M B  increases from 1.733 nmol nmol h−1 cm−2 to 2.878 nmol nmol h−1 cm−2, beyond which no further  r P C O M B  increases are anticipated. Similarly, the Ti:10 deposited TiO2 thin film displays an increase in  r P C O M B , from 0.366 nmol nmol h−1 cm−2 to 0.768 nmol nmol h−1 cm−2, discernible primarily at higher  I U V . This could imply that the Ti:10 film is already in the UV saturation region, a notion explored in the preceding paragraphs. Interestingly, the ZnO films manifest a detrimental effect of  I U V  on  r P C O M B , decreasing by about 25%, from 2.288 nmol nmol h−1 cm−2 to 1.691 nmol nmol h−1 cm−2. Notably, akin behavior is evident in all Ti- and Zn-salicylate sol deposited samples, irrespective of precursor concentration, which primarily influences the extent of the reaction rate in the ZnO case. One potential explanation for this phenomenon is the photo-dissolution effect, wherein ZnO is prone to photocorrosion in aqueous solutions, especially under UV illumination. This effect hinges on the interaction of photogenerated holes ( h + ) with nearby oxygen atoms on the ZnO surface, ultimately inducing photooxidative dissolution of the ZnO layer itself, as illustrated in Equation (24):
2 Z n O ( s ) + 4 h +   2 Z n a q . 2 + + O 2
The influence of  I U V  on the photodissolution rates was examined by Han et al., revealing a positive dependence [63]. Given that the ZnO layers possess a thickness below 100 nm, photodissolution effects are likely to exert an adverse impact on their activity.
In summary, the impacts of sol concentration on both TiO2 and ZnO deposited thin films prove intricate, affecting both MB saturation coverage and its PCO reaction rate contingent upon the inherent activity of the sample. Nonetheless, all photocatalytic thin films demonstrate satisfactory PCO activity when related to their thinness. This attribute, coupled with their intrinsic optical transparency, renders them suitable for applications necessitating this particular combination. All the data discussed in this subsection is tabulated in Table 4 for convenient reference. For the purpose of comparison with the existing literature, MB PCO rates are presented as conventional pseudo-first-order rate constants ( K P C O M B ), as well.
Such comparison with the recent literature data, which is available for similar thin film TiO2 and ZnO coatings, is presented in Table 5. In this case, only the  K P C O M B  values are employed, as they are typically reported in these studies. Clearly, the salicylate deposited TiO2 and ZnO films, albeit with limited thickness and crystallinity, show a comparable activity with that of those presented in other studies. It should be noted, however, that a direct comparison between the reported apparent pseudo-first-order rate constants is difficult and, in this case, verging on meaningless, as they do not reflect on the variations in reaction conditions (e.g., UV illumination intensity, model pollutant concentration, reaction volume or exposed geometric area of the photocatalyst layer, etc.) and only on the MB removal rate from its relative liquid-phase concentration decrease point of view.

4. Conclusions and Outlook

In summary, the results outlined in this work successfully demonstrated the use of salicylic acid (SA) as a stabilizing agent in sol formulations, suitable for dip-coating deposition of thin films of titanium dioxide (TiO2) and zinc oxide (ZnO). The use of SA, as a strong chelating agent, allowed the same general sol recipe to be used in both cases, employing isopropyl alcohol (IPA) as a solvent, which is notable for the ZnO case, where the higher-toxicity 2-methoxyethanol solvent was effectively replaced. The successful application of traditionally employed precursors for each of the photocatalytic materials—titanium tetraisopropoxide (TTIP) for TiO2 and zinc acetate dihydrate (ZAD) for ZnO, demonstrates that the salicylate route is universal and may probably be extended for the deposition of other metal oxide photocatalysts, where similar formulations can be devised, based on the stoichiometry of the most-stable salicylate complex.
Regarding the salicylate complex formation, the ATR-FTIR investigation, paired with DFT computations, underscored the formation of titanium (IV) and zinc (II) salicylate complexes in the deposition sol solutions, ascribed to H2Ti[SA]3 and Zn[SA]2·2H2O, which are established as stable products of the reaction between the respective metal oxide precursors and the SA ligand, and the results of this investigation may be helpful in guiding other researchers in FTIR vibrational mode assignments of metal salicylate complexes.
The relationship between the concentration of the Ti[SA] and Zn[SA] complexes and the sol physicochemical parameters—viscosity, density, and surface tension—was revealed to have a direct influence on the characteristics of the thin films prepared via dip-coating. Notably, the variations in sol concentration exhibited a pronounced impact on the thicknesses of both the resulting salicylate-based sol TiO2 and ZnO thin films, as evident from SEM imaging, UV-Vis spectroscopy, and mathematical modeling of the transmittance spectra.
The investigation into the photocatalytic activity of the thin films yielded that sol concentration can be linked to the effective surface area of the films, as judged by their saturation coverage. However, it cannot be directly translated to intrinsic photocatalytic activity. In terms of saturation coverage, TiO2 films exhibited a linear increase in MB saturation coverage with sol concentration, while the ZnO films remained relatively stagnant. Conversely, in MB PCO rate terms, the ZnO films surprisingly displayed a linear increase with sol concentration, surpassing the activity even of the reference P25 TiO2 sample. However, the dependence of photooxidation reaction rate on the UV illumination intensity revealed a detrimental effect in the ZnO case, possibly caused by photodissolution, indicating potential challenges in the stability of ZnO films under prolonged UV exposure.
In conclusion, this study offers a comprehensive exploration of salicylate-based sol-gel derived TiO2 and ZnO thin films. The transparency and photocatalytic properties of the films makes them promising for applications, such as transparent coatings for environmental remediation and advanced photoelectrochemical and photonic devices. Further research could explore the optimization of film properties and address challenges related to photodissolution, thereby unlocking the full potential of these materials for practical applications.

Supplementary Materials

The following supporting information can be downloaded at https://www.mdpi.com/article/10.3390/coatings13091568/s1, Figure S1. UV-Vis absorbance spectrum of 1 ppm MB dye stock solution with the laser emission peak of the colorimetry system used in the photocatalytic reactor indicated (dotted lines signify the ± 5 nm wavelength spread) (a); MB calibration plots for the three cells operated in parallel in the photocatalytic reactor system (b–d); Figure S2: Uncropped ATR-FTIR spectra of IPA (2-propanol) solvent; SA (salicylic acid) IPA solution; Titanium(IV)isopropoxide (TTIP), TTIP:SA:IPA sols with molar ratios 1:3:20 (Ti:20), 1:3:15, (Ti:15), 1:3:10 (Ti:10); and (Zn(CH3COO)2·2H2O (ZAD), ZAD:SA:IPA sols with molar ratios 1:2:20 (Zn:20), 1:2:15, (Zn:15), 1:2:20 (Zn:10). Table S1: Optimized geometry of the H2Ti[SA]3 complex structure in XYZ-coordinate style.; Table S2: Optimized geometry of the Zn[SA]2·2H2O complex structure in XYZ-coordinate style.title.; Figure S3: Tauc plots, along the obtained Eg values for thin films of two dip-coated layers, deposited from: Ti:10 sol composition (a); Ti:15 sol composition (c); Ti:20 sol composition (e); Zn:10 sol composition (b); Zn:15 sol composition (d); Zn:20 sol composition (f); Appendix S1: R-code for simulating UV-Vis spectra of dip-coated thin films, according to the Transfer Matrix Method and Tauc–Lorentz and Tanguy dispersion functions.

Funding

This research was funded by the Bulgarian National Science Fund (BNSF), grant number KP-06-N59/11 (KΠ-06-H59/11) “Photocatalytic activity of thin films with selectively photodeposited cocatalysts”.

Institutional Review Board Statement

Not applicable.

Informed Consent Statement

Not applicable.

Data Availability Statement

Data underlying the results presented in this paper are not publicly available at this time but may be obtained from the author upon reasonable request.

Acknowledgments

B.I.S. acknowledges technical support from the following colleagues: Rostislav P. Rusev of the Department of Technologies and Management of Communication Systems, Technical University of Sofia for providing access to a FTIR-ATR spectrometer; Hristo G. Kolev from the Institute of Catalysis, Bulgarian Academy of Sciences for support in obtaining the XRD data; and Nina V. Kaneva from the Faculty of Chemistry and Pharmacy, Sofia University, for providing access to an UV-Vis spectrometer.

Conflicts of Interest

The author declares no conflict of interest.

References

  1. Fujishima, A.; Honda, K. Electrochemical photolysis of water at a semiconductor electrode. Nature 1972, 238, 37. [Google Scholar] [CrossRef]
  2. Armaković, J.; Savanović, M.M.; Armaković, S. Titanium dioxide as the most used photocatalyst for water purification: An overview. Catalysts 2022, 13, 26. [Google Scholar] [CrossRef]
  3. Muscetta, M.; Russo, D. Photocatalytic Applications in Wastewater and Air Treatment: A Patent Review (2010–2020). Catalysts 2021, 11, 834. [Google Scholar] [CrossRef]
  4. Wetchakun, K.; Wetchakun, N.; Sakulsermsuk, S. An overview of solar/visible light-driven heterogeneous photocatalysis for water purification: TiO2- and ZnO-based photocatalysts used in suspension photoreactors. J. Ind. Eng. Chem. 2019, 71, 19–49. [Google Scholar] [CrossRef]
  5. Ahmad, K.; Ghatak, H.R.; Ahuja, S.M. A review on photocatalytic remediation of environmental pollutants and H2 production through water splitting: A sustainable approach. Environ. Technol. Innov. 2020, 19, 100893. [Google Scholar] [CrossRef]
  6. Wang, J.; Guo, R.; Bi, Z.; Chen, X.; Hu, X.; Pan, W. A review on TiO2−x-based materials for photocatalytic CO2 reduction. Nanoscale 2022, 14, 11512–11528. [Google Scholar] [CrossRef]
  7. Hamid, S.B.A.; Teh, S.J.; Lai, C.W. Photocatalytic Water Oxidation on ZnO: A Review. Catalysts 2017, 7, 93. [Google Scholar] [CrossRef]
  8. Castro-Muñoz, R. The Role of New Inorganic Materials in Composite Membranes for Water Disinfection. Membranes 2020, 10, 101. [Google Scholar] [CrossRef]
  9. Arun, J.; Nachiappan, S.; Rangarajan, G.; Alagappan, R.P.; Gopinath, K.P.; Lichtfouse, E. Synthesis and application of titanium dioxide photocatalysis for energy, decontamination and viral disinfection: A review. Environ. Chem. Lett. 2023, 21, 339–362. [Google Scholar] [CrossRef]
  10. Olea, M.; Bueno, J.; Pérez, A. Nanometric and surface properties of semiconductors correlated to photocatalysis and photoelectrocatalysis applied to organic pollutants—A review. J. Environ. Chem. Eng. 2021, 9, 106480. [Google Scholar] [CrossRef]
  11. Navidpour, A.H.; Hosseinzadeh, A.; Zhou, J.L.; Huang, Z. Progress in the application of surface engineering methods in immobilizing TiO2 and ZnO coatings for environmental photocatalysis. Catal. Rev. Sci. Eng. 2021, 65, 822–873. [Google Scholar] [CrossRef]
  12. Fujishima, A.; Zhang, X.; Tryk, D.A. TiO2 photocatalysis and related surface phenomena. Surf. Sci. Rep. 2008, 63, 515–582. [Google Scholar] [CrossRef]
  13. Yang, B.; Ma, Z.; Wang, Q.; Yang, J. Synthesis and Photoelectrocatalytic Applications of TiO2/ZnO/Diatomite Composites. Catalysts 2022, 12, 268. [Google Scholar] [CrossRef]
  14. Mani, J.; Sakeek, H.; Habouti, S.; Dietze, M.; Es-Souni, M. Macro–meso-porous TiO2, ZnO and ZnO–TiO2-composite thick films. Properties and application to photocatalysis. Catal. Sci. Technol. 2012, 2, 379–385. [Google Scholar] [CrossRef]
  15. Wiatrowski, A.; Wojcieszak, D.; Mazur, M.; Kaczmarek, D.; Domaradzki, J.; Kalisz, M.; Kijaszek, W.; Pokora, P.; Mańkowska, E.; Lubanska, A.; et al. Photocatalytic Coatings Based on TiOx for Application on Flexible Glass for Photovoltaic Panels. J. Mater. Eng. Perform. 2022, 31, 6998–7008. [Google Scholar] [CrossRef]
  16. Zhao, W.; Lu, H. Self-Cleaning Performance of Super-Hydrophilic Coatings for Dust Deposition Reduction on Solar Photovoltaic Cells. Coatings 2021, 11, 1059. [Google Scholar] [CrossRef]
  17. Panžić, I.; Juraić, K.; Krstulović, N.; Šantić, A.; Belić, D.; Blažeka, D.; Plodinec, M.; Mandić, V.; Macan, J.; Hammud, A.; et al. ZnO@TiO2 Core Shell Nanorod Arrays with Tailored Structural, Electrical, and Optical Properties for Photovoltaic Application. Molecules 2019, 24, 3965. [Google Scholar] [CrossRef]
  18. Hanková, A.; Kuzminova, A.; Kylián, O. Nanostructured Semi-Transparent TiO2 Nanoparticle Coatings Produced by Magnetron-Based Gas Aggregation Source. Coatings 2023, 13, 51. [Google Scholar] [CrossRef]
  19. Ehrmann, N.; Reineke-Koch, R. Ellipsometric studies on ZnO:Al thin films: Refinement of dispersion theories. Thin Solid Films 2010, 519, 1475–1485. [Google Scholar] [CrossRef]
  20. Vajargah, P.H.; Abdizadeh, H.; Ebrahimifard, R.; Golobostanfard, M. Sol–gel derived ZnO thin films: Effect of amino-additives. Appl. Surf. Sci. 2013, 285, 732–743. [Google Scholar] [CrossRef]
  21. Lu, B.-J.; Lin, K.-T.; Kuo, Y.-M.; Tsai, C.-H. Preparation of High-Transparency, Superhydrophilic Visible Photo-Induced Photocatalytic Film via a Rapid Plasma-Modification Process. Coatings 2021, 11, 784. [Google Scholar] [CrossRef]
  22. Brinker, C.J.; Frye, G.C.; Hurd, A.J.; Ashley, C.S. Fundamentals of sol-gel dip coating. Thin Solid Films 1991, 201, 97–108. [Google Scholar] [CrossRef]
  23. Ohya, Y.; Saiki, H.; Tanaka, T.; Takahashi, Y. Microstructure of TiO2 and ZnO Films Fabricated by the Sol-Gel Method. J. Am. Ceram. Soc. 1996, 79, 825–830. [Google Scholar] [CrossRef]
  24. Toyoda, M.; Watanabe, J.; Matsumiya, T. Evolution of structure of the precursor during sol-gel processing of ZnO and low temperature formation of thin films. J. Sol-Gel Sci. Technol. 1999, 16, 93–99. [Google Scholar] [CrossRef]
  25. Amakali, T.; Daniel, L.S.; Uahengo, V.; Dzade, N.Y.; de Leeuw, N.H. Structural and Optical Properties of ZnO Thin Films Prepared by Molecular Precursor and Sol–Gel Methods. Crystals 2020, 10, 132. [Google Scholar] [CrossRef]
  26. Vilà, A.; Gómez-Núñez, A.; Alcobé, X.; Palacios, S.; Puig Walz, T.; López, C. Influence of the Nature of Aminoalcohol on ZnO Films Formed by Sol-Gel Methods. Nanomaterials 2023, 13, 1057. [Google Scholar] [CrossRef]
  27. Znaidi, L. Sol–gel-deposited ZnO thin films: A review. Mater. Sci. Eng. B 2010, 174, 18–30. [Google Scholar] [CrossRef]
  28. Rodríguez-Gattorno, G.; Santiago-Jacinto, P.; Rendon-Vázquez, L.; Németh, J.; Dékány, I.; Díaz, D. Novel Synthesis Pathway of ZnO Nanoparticles from the Spontaneous Hydrolysis of Zinc Carboxylate Salts. J. Phys. Chem. B 2003, 107, 12597–12604. [Google Scholar] [CrossRef]
  29. Spiridonova, J.; Katerski, A.; Danilson, M.; Krichevskaya, M.; Krunks, M.; Oja Acik, I. Effect of the Titanium Isopropoxide:Acetylacetone Molar Ratio on the Photocatalytic Activity of TiO2 Thin Films. Molecules 2019, 24, 4326. [Google Scholar] [CrossRef]
  30. Verma, A.; Samanta, S.B.; Bakhshi, A.K.; Agnihotry, S.A. Effect of stabilizer on structural, optical and electrochemical properties of sol–gel derived spin coated TiO2 films. Sol. Energy Mater. Sol. Cells 2005, 88, 47–64. [Google Scholar] [CrossRef]
  31. Sato, M.; Hara, H.; Nishide, T.; Sawada, Y. A water-resistant precursor in a wet process for TiO2 thin film formation. J. Mater. Chem. 1996, 6, 1767–1770. [Google Scholar] [CrossRef]
  32. Nishide, T.; Sato, M.; Hara, H. Crystal structure and optical property of TiO2 gels and films prepared from Ti-edta complexes as titania precursors. J. Mater. Sci. 2000, 35, 465–469. [Google Scholar] [CrossRef]
  33. Gigant, K.; Rammal, A.; Henry, M. Synthesis and Molecular Structures of Some New Titanium(IV) Aryloxides. J. Am. Chem. Soc. 2001, 123, 11632–11637. [Google Scholar] [CrossRef] [PubMed]
  34. Gusev, A.; Baluda, Y.; Braga, E.; Kryukova, M.; Kiskin, M.; Chuyan, E.; Ravaeva, M.; Cheretaev, I.; Linert, W. Mn(II), Co(II), Ni(II) and Zn salicylates: Synthesis, structure and biological properties studies. Inorg. Chim. Acta 2021, 528, 120606. [Google Scholar] [CrossRef]
  35. Lee, B.P.; Narkar, A.; Wilharm, R. Effect of metal ion type on the movement of hydrogel actuator based on catechol-metal ion coordination chemistry. Sens. Actuators B Chem. 2016, 227, 248–254. [Google Scholar] [CrossRef]
  36. Kuznetsova, S.; Mongush, E.; Lisitsa, K. Zinc oxide films obtained by sol-gel method from film-forming solutions. J. Phys. Conf. Ser. 2019, 1145, 012020. [Google Scholar] [CrossRef]
  37. Stefanov, B.I.; Milusheva, V.S.; Kolev, H.G.; Tzaneva, B.R. Photocatalytic activation of TiO2-functionalized anodic aluminium oxide for electroless copper deposition. Catal. Sci. Technol. 2022, 12, 7027–7037. [Google Scholar] [CrossRef]
  38. Pang, F.; Seng, C.; Teng, T.; Ibrahim, M.H. Densities and viscosities of aqueous solutions of 1-propanol and 2-propanol at temperatures from 293.15 K to 333.15 K. J. Mol. Liq. 2007, 136, 71–78. [Google Scholar] [CrossRef]
  39. Hoke, B.C., Jr.; Chen, J.C. Binary aqueous-organic surface tension temperature dependence. J. Chem. Eng. Data 1991, 36, 322–326. [Google Scholar] [CrossRef]
  40. Houas, A.; Lachheb, H.; Ksibi, M.; Elaloui, E.; Guillard, C.; Herrmann, J.M. Photocatalytic degradation pathway of methylene blue in water. Appl. Catal. B 2001, 31, 145–157. [Google Scholar] [CrossRef]
  41. Stefanov, B.I. Photocatalytic reactor for in situ determination of supported catalysts activity in liquid-phase based on 3D-printed components and Arduino. In Proceedings of the 2020 XXIX International Scientific Conference Electronics (ET), Sozopol, Bulgaria, 16–18 September 2020. [Google Scholar] [CrossRef]
  42. Hanwell, M.D.; Curtis, D.E.; Lonie, D.C.; Vandermeersch, T.; Zurek, E.; Hutchison, G.R. Avogadro: An advanced semantic chemical editor, visualization, and analysis platform. J. Cheminform. 2012, 4, 17. [Google Scholar] [CrossRef] [PubMed]
  43. Barca, G.M.; Bertoni, C.; Carrington, L.; Datta, D.; De Silva, N.; Deustua, J.E.; Fedorov, D.G.; Gour, J.R.; Gunina, A.O.; Guidez, E.; et al. Recent developments in the general atomic and molecular electronic structure system. J. Chem. Phys. 2020, 152, 154102. [Google Scholar] [CrossRef] [PubMed]
  44. Becke, A.D. Density-functional exchange-energy approximation with correct asymptotic behavior. Phys. Rev. A 1988, 38, 3098. [Google Scholar] [CrossRef] [PubMed]
  45. Lee, C.; Yang, W.; Parr, R.G. Development of the Colic-Salvetti correlation-energy formula into a functional of the electron density. Phys. Rev. B 1988, 37, 785. [Google Scholar] [CrossRef]
  46. Grimme, S.; Antony, J.; Ehrlich, S.; Krieg, H. A consistent and accurate ab initio parametrization of density functional dispersion correction (DFT-D) for the 94 elements H-Pu. J. Chem. Phys. 2010, 132, 154104. [Google Scholar] [CrossRef]
  47. Krishnan, R.; Binkley, J.; Seeger, R.; Pople, J. Self-consistent molecular orbital methods. XX. A basis set for correlated wave functions. J. Chem. Phys. 1980, 72, 650–654. [Google Scholar] [CrossRef]
  48. Hay, J.P.; Wadt, W.R. Ab initio effective core potentials for molecular calculations. Potentials for the transition metal atoms Sc to Hg. J. Chem. Phys. 1985, 82, 270–283. [Google Scholar] [CrossRef]
  49. Hay, J.P.; Wadt, W.R. Ab initio effective core potentials for molecular calculations. Potentials for K to Au including the outermost core orbitals. J. Chem. Phys. 1985, 82, 299–310. [Google Scholar] [CrossRef]
  50. Pritchard, B.P.; Altaravwy, D.; Didier, B.; Gibson, T.D.; Windus, T.L. A New Basis Set Exchange: An Open, Up-to-date Resource for the Molecular Sciences Community. J. Chem. Inf. Model 2019, 59, 4814–4820. [Google Scholar] [CrossRef]
  51. R Core Team. R: A Language and Environment for Statistical Computing; R Foundation for Statistical Computing: Vienna, Austria, 2021; Available online: https://www.R-project.org/ (accessed on 4 September 2023).
  52. Nash, J.C. {optimr}: A Replacement and Extension of the ‘Optim’ Function. 2016. Available online: https://CRAN.R-project.org/package=optimr (accessed on 4 September 2023).
  53. Borchers, H. Pracma: Practical Numerical Math Functions. R Package Version 2.4.2. 2022. Available online: https://CRAN.R-project.org/package=pracma (accessed on 4 September 2023).
  54. Khamar, D.; Zeglinski, J.; Mealey, D.; Rasmuson, Å.C. Investigating the role of solvent–solute interaction in crystal nucleation of salicylic acid from organic solvents. J. Am. Chem. Soc. 2014, 136, 11664–11673. [Google Scholar] [CrossRef]
  55. Humbert, B.; Alnot, M.; Quilès, F. Infrared and Raman spectroscopical studies of salicylic and salicylate derivatives in aqueous solution. Spectrochim. Acta A Mol. Biomol. Spectrosc. 1998, 54, 465–476. [Google Scholar] [CrossRef]
  56. Alvarez-Ros, M.C.; Sánchez-Cortés, S.; García-Ramos, J.V. Vibrational study of the salicylate interaction with metallic ions and surfaces. Spectrochim. Acta A Mol. Biomol. Spectrosc. 2000, 56, 2471–2477. [Google Scholar] [CrossRef]
  57. Koksharova, T.V.; Kurando, S.V.; Stoyanova, I.V. Coordination compounds of 3d-metals salicylates with thiosemicarbazide. Russ. J. Gen. Chem. 2012, 82, 1481–1484. [Google Scholar] [CrossRef]
  58. Rodríguez, I.; Fernández-Vega, L.; Maser-Figueroa, A.N.; Sang, B.; González-Pagán, P.; Tinoco, A.D. Exploring Titanium(IV) Complexes as Potential Antimicrobial Compounds. Antibiotics 2022, 11, 158. [Google Scholar] [CrossRef] [PubMed]
  59. Liu, C.; Hu, J.; Liu, W.; Zhu, F.; Wang, G.; Tung, C.; Wang, Y. Binding Modes of Salicylic Acids to Titanium-Oxide Molecular Surfaces. Chem. Eur. J. 2020, 26, 2666–2674. [Google Scholar] [CrossRef] [PubMed]
  60. Klug, H.P.; Alexander, L.E.; Sumner, G.G. The crystal structure of zinc salicylate dihydrate. Acta Cryst. 1958, 11, 41–46. [Google Scholar] [CrossRef]
  61. Landau, L.; Levich, B. Dragging of a Liquid by a Moving Plate. In Dynamics of Curved Fronts; Pelcé, P., Ed.; Academic Press: Cambridge, MA, USA, 1988; pp. 141–153. [Google Scholar] [CrossRef]
  62. Kuznetsov, A.; Xiong, M. Effect of evaporation on thin film deposition in dip coating process. Int. Commun. Heat Mass Transf. 2002, 29, 35–44. [Google Scholar] [CrossRef]
  63. Han, J.; Qiu, W.; Gao, W. Potential dissolution and photo-dissolution of ZnO thin films. J. Hazard. Mater. 2010, 178, 115–122. [Google Scholar] [CrossRef]
  64. Knittl, Z. Optics of Thin Films (An Optical Multilayer Theory); Wiley: London, UK, 1976. [Google Scholar]
  65. Katsidis, C.C.; Siapkas, D.I. General transfer-matrix method for optical multilayer systems with coherent, partially coherent, and incoherent interference. Appl. Opt. 2002, 41, 3978–3987. [Google Scholar] [CrossRef]
  66. González-Leal, J.; Prieto-Alcón, R.; Angel, J.; Minkov, D.A.; Márquez, E. Influence of substrate absorption on the optical and geometrical characterization of thin dielectric films. Appl. Opt. 2002, 41, 7300–7308. [Google Scholar] [CrossRef]
  67. Makhlouka, Y.; Sanaâ, F.; Gharbia, M. Ordinary and Extraordinary Complex Refractive Indices Extraction of a Mylar Film by Transmission Spectrophotometry. Polymers 2022, 14, 1805. [Google Scholar] [CrossRef]
  68. Blanco, E.; González-Leal, J.; Ramírez-del Solar, M. Photocatalytic TiO2 sol-gel thin films: Optical and morphological characterization. Sol. Energy 2015, 122, 11–23. [Google Scholar] [CrossRef]
  69. Jellison, G.E., Jr.; Modine, F.A. Parameterization of the optical functions of amorphous materials in the interband region. Appl. Phys. Lett. 1996, 69, 371–373, Erratum in Appl. Phys. Lett. 1996, 69, 2137. [Google Scholar] [CrossRef]
  70. Tanguy, C. Optical dispersion by Wannier excitons. Phys. Rev. Lett. 1995, 75, 4090. [Google Scholar] [CrossRef] [PubMed]
  71. Ochoa-Martínez, E.; Navarrete-Astorga, E.; Ramos-Barrado, J.; Gabás, M. Evolution of Al: ZnO optical response as a function of doping level. Appl. Surf. Sci. 2017, 421, 680–686. [Google Scholar] [CrossRef]
  72. Tanguy, C. Refractive index of direct bandgap semiconductors near the absorption threshold: Influence of excitonic effects. IEEE J. Quantum Electron. 1996, 32, 1746–1751. [Google Scholar] [CrossRef]
  73. Bouzourâa, M.; En Naciri, A.; Moadhen, A.; Rinnert, H.; Guendouz, M.; Battie, Y.; Chaillou, A.; Zaïbi, M.; Oueslati, M. Effects of silicon porosity on physical properties of ZnO films. Mater. Chem. Phys. 2016, 175, 233–240. [Google Scholar] [CrossRef]
  74. Brinkley, D.; Engel, T. Active site density and reactivity for the photocatalytic dehydrogenation of 2-propanol on TiO2 (110). Surf. Sci. 1998, 415, L1001–L1006. [Google Scholar] [CrossRef]
  75. Krýsa, J.; Novotná, P.; Kment, Š.; Mills, A. Effect of glass substrate and deposition technique on the properties of sol gel TiO2 thin films. J. Photochem. Photobiol. A 2011, 222, 81–86. [Google Scholar] [CrossRef]
  76. Elangovan, S.; Chandramohan, V.; Sivakumar, N.; Senthil, T. Synthesis and characterization of sodium doped ZnO nanocrystals and its application to photocatalysis. Superlattices Microstruct. 2015, 85, 901–907. [Google Scholar] [CrossRef]
  77. Mills, A.; Wang, J.; Ollis, D.F. Kinetics of Liquid Phase Semiconductor Photoassisted Reactions:  Supporting Observations for a Pseudo-Steady-State Model. J. Phys. Chem. B 2006, 110, 14386–14390. [Google Scholar] [CrossRef] [PubMed]
  78. Acosta-Silva, Y.d.J.; Toledano-Ayala, M.; Gallardo-Hernández, S.; Godínez, L.A.; Méndez-López, A. Investigation of TiO2 Deposit on SiO2 Films: Synthesis, Characterization, and Efficiency for the Photocatalytic Discoloration of Methylene Blue in Aqueous Solution. Nanomaterials 2023, 13, 1403. [Google Scholar] [CrossRef] [PubMed]
  79. Khalifa, Z.S.; Shaban, M.; Ahmed, I.A. Photocatalytic Degradation of Methyl Orange and Methylene Blue Dyes by Engineering the Surface Nano-Textures of TiO2 Thin Films Deposited at Different Temperatures via MOCVD. Molecules 2023, 28, 1160. [Google Scholar] [CrossRef] [PubMed]
  80. Abboudi, A.; Iaiche, S.; Djelloul, A.; Chala, A.; Kezzoula, F.; Bensouici, F.; Bououdina, M.; Humayun, M. Effect of fluoric acid concentration on the structural, optical, and photocatalytic properties of TiO2 thin films. Inorg. Chem. Commun. 2023, 155, 111073. [Google Scholar] [CrossRef]
  81. Seifi, A.; Salari, D.; Khataee, A.; Çoşut, B.; Arslan, L.Ç.; Niaei, A. Enhanced photocatalytic activity of highly transparent superhydrophilic doped TiO2 thin films for improving the self-cleaning property of solar panel covers. Ceram. Int. 2023, 49, 1678–1689. [Google Scholar] [CrossRef]
  82. Widyastuti, E.; Chiu, C.T.; Hsu, J.L.; Lee, Y.C. Photocatalytic antimicrobial and photostability studies of TiO2/ZnO thin films. Arab. J. Chem. 2023, 16, 105010. [Google Scholar] [CrossRef]
  83. Deepthi, V.; Vidhya, B.; Sebastian, A. Photocatalytic degradation of model pollutants using ZnO/Ag3PO4 heterostructure thin films under visible and solar irradiation. Opt. Mater. 2023, 138, 113646. [Google Scholar] [CrossRef]
  84. Daher, E.A.; Riachi, B.; Chamoun, J.; Laberty-Robert, C.; Hamd, W. New approach for designing wrinkled and porous ZnO thin films for photocatalytic applications. Colloids Surf. A 2023, 658, 130628. [Google Scholar] [CrossRef]
Figure 1. Schematic representation of the procedures used to prepare the TiO2 and ZnO thin films in this study. The scheme also depicts the notations used for the respective TiO2 and ZnO sols, based on the precursor:SA:IPA molar ratios, as indicated.
Coatings 13 01568 g001
Figure 2. (a) Cross-sectional view of the setup used for MB PCO experiments; (b) MB concentration profile for a 30 min dark phase MB adsorption/60 min PCO run. Error bars signify the standard error of a triplicate run with the same sample type. The red and blue lines indicate the Langmuir model and linear regression fits applied to obtain the MB saturation coverage and MB PCO rate, respectively.
Coatings 13 01568 g002
Figure 3. ATR-FTIR of: (a) Free SA in IPA with a standalone IPA spectrum overlayed for reference (grey infill); (b) TTIP:SA:IPA sols with 1:3:10 (Ti:10), 1:3:15 (Ti:15), and 1:3:20 (Ti:20) molar ratios; and (c) ZAD:SA:IPA sols with 1:2:10 (Zn:10), 1:2:15 (Zn:15), and 1:2:20 (Zn:20) molar ratios. Peaks marked with □ indicate a strong contribution from the IPA solvent, while ● depicts areas with new features or changes in absorbance.
Coatings 13 01568 g003
Figure 4. (a) Structures and optimized geometries of the H2Ti[SA]3 and Zn[SA]2·2H2O complexes; (b) Predicted IR vibrational frequencies (red bars) along the experimental ATR-FTIR spectra for the Ti:10 and Zn:10 cases (black line). The grey infill area depicts the ATR-FTIR spectra of pure IPA solvent, and the orange infill is the sum of it, and a Gaussian-function broadened result of the DFT predicted frequencies.
Coatings 13 01568 g004
Figure 5. Cumulative, mass-per-area loading profiles, as a function of: (a) the precursor molar concentration for both Ti[SA] and Zn[SA] sols after I and II layers; (b) the number of dip-coating cycles for the Ti:15 and Zn:20 case.
Coatings 13 01568 g005
Figure 6. SEM micrographs of TiO2 films deposited from sol composition: (a) Ti:10 cross-sectional (left) and top-view (right); (b) Ti:15 top view; (c) Ti:20 top-view (left) and sectional view near the cutline (right); and ZnO films deposited from sol composition; (d) Zn:10 cross-sectional (left) and top-view (right); (e) Zn:15 top view; (f) Zn:20 top-view (left) and sectional view near the cutline (right).
Coatings 13 01568 g006
Figure 7. XRD patterns for: (a) TiO2 thin films, deposited from the Ti:10, Ti:15, and Ti:20 sol compositions, along the reflection pattern for anatase titania (PDF 00-064-0863); (b) ZnO thin films, obtained from the Zn:10, Zn:15, and Zn:20 compositions, along the reflection pattern for zincite (PDF 00-036-1451).
Coatings 13 01568 g007
Figure 8. Optical images and corresponding UV-Vis transmittance spectra obtained for: (a,b) TiO2 films deposited from sols Ti:10, Ti:15, and Ti:20; (c,d) ZnO films deposited from sols Zn:10, Zn:15, and Zn:20.
Coatings 13 01568 g008
Figure 9. Tauc plots for (a) TiO2 thin films deposited from the Ti:10 sol compositions and (b) ZnO thin, deposited from the Zn:10 sol composition. Tauc plots for Ti:15, Ti:20, Zn:15, and Zn:20 deposited thin films are available in the Supplementary Materials (Figure S3).
Coatings 13 01568 g009
Figure 10. Schematic representation of the three-layer configuration used to construct the transfer matrix method model employed to model the UV-Vis transmittance spectra. Each of the three layers is defined by its complex refractive index ( n ~ ) and thickness ( d ).
Coatings 13 01568 g010
Figure 11. Experimental UV-Vis transmittance spectra along TMM fitting result for (a) TiO2 films deposited from sols Ti:10, Ti:15, and Ti:20; (b) ZnO films deposited from sols Zn:10, Zn:15, and Zn:20.
Coatings 13 01568 g011
Figure 12. Effect of the precursor concentration of the Ti- and Zn salicylate sols on: (a) the MB saturation coverage,  θ M B , obtained during the dark phase of the photocatalytic experiments; (b) the MB removal rate  r P C O M B , at  I U V =  0.88 ± 0.09 mW cm−2. The grey dotted line is the result, obtained from the reference P25 photocatalyst sample.
Coatings 13 01568 g012
Figure 13. UV intensity (IUV) dependent photocatalytic MB removal rate ( r P C O M B ) profiles, obtained for the TiO2 thin films (sol Ti:10), ZnO thin films (sol Zn:10), and the P25 reference sample.
Coatings 13 01568 g013
Table 1. A list of vibrational frequencies predicted by DFT modeling of the free SA ligand and H2Ti[SA]3 and Zn[SA]2·2H2O complexes, assigned to experimentally observed features in their respective ATR-FTIR spectra. All of the predicted frequencies were scaled by a factor of 0.98.
Vibrational Modes *SAH2Ti[SA]3Zn[SA]2·2H2O
DFT, cm−1Observed, cm−1DFT, cm−1Observed, cm−1DFT, cm−1Observed, cm−1
ν(C=O)1731167016571670--
νas(COO)
+ ν(C=C)
1623
1577
1610
1588
1616, 1608
1595
1604
1583
1627
1584
1540
1630
1599
1569
ν(C=C)1483
1470
1487
1465
1466
1451, 1438
1487
1460
1482
1460
1487
1464
νs(COO)13801379132713381397, 13711397, 1376
δ(OH)
+ ν(COO)
1324, 131213011404
1296
1400
1310
--
ν(Ph-OH)124012451269, 12421245, 122412471248
δ(Ph-OH)12361219--12271223
δ(CH)1181
1155
1100
1159
1126
1107
1182
1150
1123, 1090
1159
1126
1107
1162
1143
1159
1126
1107
δ(C=C)1023
842
631
1032
850
657
1034
845
-
1032
850
-
1029
815
-
1032
-
-
δ(C=C), δ(CH) + δ(COO)
out of plane
753
695
757
701
770
712
757
701
754
708
757
704
ν(Me-O)--883
680
887
671
875
674
866
671
* Notation: ν—stretching (νas—asymmetric, νs—symmetric), δ—bending, C=O—carboxylic carbonyl, C=C—aromatic ring, COO—carboxylic group, OH—carboxylic hydroxyl, Ph-OH—phenolic hydroxyl, CH—aromatic hydrogens.
Table 2. Summary of physicochemical parameters of the TiO2 and ZnO deposition sols at the precursor to IPA ratios of 1:10, 1:15, and 1:20. Values include specific gravity ( ρ ), surface tension ( σ ), and dynamic viscosity ( η ). The theoretically predicted area-normalized mass loadings, according to the Landau–Levich model ( m t h e o r ), are also listed, as well as the experimentally obtained ones for the first ( m I ) and second ( m I I ) dip-coated layers, and their cumulative value ( m t o t ).
Composition ρ  *
g cm−3
σ  *
mN m−2
η  *
mPa s−1
m t h e o r  
µg cm−2
m I  
µg cm−2
m I I  
µg cm−2
m t o t  
µg cm−2
Ti:100.913 ± 0.00526.80 ± 1.038.38 ± 0.0117.3121.49 ± 1.4233.63 ± 1.7055.12 ± 2.16
Ti:150.878 ± 0.00424.26 ± 0.736.07 ± 0.0311.3213.16 ± 1.7013.64 ± 1.5426.80 ± 2.38
Ti:200.856 ± 0.00122.19 ± 0.544.77 ± 0.018.156.86 ± 1.5110.80 ± 3.1017.66 ± 3.32
Zn:100.960 ± 0.00125.62 ± 0.536.83 ± 0.0118.2125.00 ± 4.5818.70 ± 2.8043.71 ± 4.42
Zn:150.912 ± 0.00124.34 ± 0.144.46 ± 0.0110.5916.50 ± 2.966.89 ± 1.5523.40 ± 2.30
Zn:200.876 ± 0.00123.09 ± 0.813.53 ± 0.017.3711.17 ± 3.158.49 ± 3.1419.65 ± 1.40
* Values were obtained at room temperature (25 ± 1 °C) immediately prior to the dip-coating of the respective samples for validity during the dip-coating process.
Table 3. A summary of parameters obtained from optical modeling of the UV-Vis spectra of TiO2 and ZnO thin films. The optical bandgap from Tauc analysis, denoted as  E g T a u c , is provided for reference.  χ 2  is the quality of fit parameter.
TiO2
Sample
E g T a u c (eV)Tauc—Lorentz model fitting parameters χ 2 d f i l m (nm) n *2 P *3
(%)
ε E g (eV) A (eV) E 0 (eV) C (eV)
Ti:103.341.883.39111.254.361.2030.492052.0221
Ti:153.361.773.44111.494.531.1610.501371.9922
Ti:203.432.283.47114.264.350.8970.51861.9127
ZnO
Sample
E g T a u c
(eV)
Tanguy model fitting parametersχ2d
(nm)
n *2 P *3
(%)
ε E g (eV) A (eV3/2) R (meV) Γ (meV) B (eV2) E s (eV)
Zn:103.301 *13.458.2260 *14826 *17.1 *10.88721.5734
Zn:153.293.467.68600.57521.5536
Zn:203.283.455.69680.44351.4843
*1 Values fixed during model fitting. *2 Calculated via the respective model at λ = 450 nm. *3 Calculated via Equation (19), against  n B = 2 for ZnO and 2.52 for TiO2.
Table 4. A summary of parameters obtained from the MB adsorption and PCO experiments for the reference P25 sample and all the TiO2 and ZnO thin films deposited from the sols with a varied precursor concentration, including MB saturation coverage ( θ M B ), UV illumination intensity (IUV), and MB removal rate ( r P C O M B ) and corresponding pseudo-first-order rate constant ( K P C O M B ).
Sample θ M B  
nmol cm−2
IUV
mW cm−2
r P C O M B  
nmol h−1 cm−2
K P C O M B  
h−1
P251.447 ± 0.0780.87 ± 0.091.733 ± 0.0960.153 ± 0.009
2.08 ± 0.312.495 ± 0.2010.228 ± 0.020
4.85 ± 0.332.878 ± 0.2060.266 ± 0.021
Ti:102.426 ± 0.2130.88 ± 0.090.366 ± 0.0350.031 ± 0.003
2.01 ± 0.260.324 ± 0.0550.027 ± 0.005
4.13 ± 0.270.768 ± 0.3180.068 ± 0.029
Ti:151.756 ± 0.1270.88 ± 0.090.377 ± 0.0610.032 ± 0.005
2.04 ± 0.280.347 ± 0.0570.029 ± 0.005
4.42 ± 0.290.475 ± 0.0670.040 ± 0.006
Ti:201.441 ± 0.1320.88 ± 0.090.149 ± 0.0370.012 ± 0.003
2.09 ± 0.290.228 ± 0.0350.019 ± 0.003
4.30 ± 0.240.404 ± 0.0710.034 ± 0.006
Zn:101.159 ± 0.1030.87 ± 0.092.288 ± 0.1380.206 ± 0.014
2.01 ± 0.261.931 ± 0.2040.173 ± 0.019
4.46 ± 0.361.691 ± 0.1760.150 ± 0.017
Zn:151.169 ± 0.1280.88 ± 0.091.232 ± 0.1120.107 ± 0.010
1.95 ± 0.251.040 ± 0.1640.090 ± 0.015
4.31 ± 0.360.750 ± 0.0770.064 ± 0.007
Zn:201.007 ± 0.0700.87 ± 0.090.485 ± 0.0430.041 ± 0.004
2.11 ± 0.280.508 ± 0.0410.043 ± 0.004
4.23 ± 0.250.468 ± 0.0630.040 ± 0.005
Table 5. Comparison between the apparent MB PCO removal constant of the samples with the highest activity in this article and the literature values for similar transparent TiO2 and ZnO films.
Film (Thickness)/SubstrateDeposition MethodReaction Conditions K P C O M B
h−1
Ref.
TiO2 (198 nm)/GlassSol-gel dip-coating
TTIP:SA:IPA
15 mL, 1 mg L−1 MB
3 W UV LED (365 nm)
0.068This work
ZnO (90 nm)/GlassSol-gel dip-coating
ZAD:SA:IPA
0.206
TiO2 (262 nm)/GlassSol-gel dip-coating
TTIP:HCl:IPA
3 mL, 5.4 mg L−1 MB
15 W UV lamp (254 nm)
0.406[78]
TiO2 (171 nm)/SiO2/Glass0.397
TiO2 (219 nm)/SiO2/Glass0.498
TiO2 (262 nm)/SiO2/Glass0.798
TiO2 (203 nm)/QuartzMetal-Organic CVD
TTIP precursor
10 mg L−1 MB
Natural sunlight
0.462 *[79]
TiO2 (192 nm)/GlassSol-gel dip-coating
Ti(oEt)4:EtOH:HNO3:H2O
35 mL, 2.5×10⁻⁵ mol L−1 MB
15 W UV lamp (254 nm)
0.882 *[80]
TiO2 (199 nm)/GlassSol-gel dip-coating
TTIP:AcAc:EtOH:HNO3:SDS
50 mL, 5 mg L−1 MB
11 W UV lamp
0.255 *[81]
TiO2 (132 nm)/GlassMagnetron Sputtering10 mL, 10 mg L−1 MB
8 W UV tube
0.145 *[82]
ZnO (122 nm)/Glass0.412 *
ZnO (324 nm)/GlassSpin-coating + hydrothermal
ZAD:MEA:EtOH
100 mL, 20 mg L−1 MB
300 W Tungsten-Halogen
0.360 *[83]
ZnO (47 nm)/GlassSol-gel dip-coating
ZAD:MEA:IPA
45 mL, 10−5 mol L−1 MB
500 lx UV lamp (365 nm)
0.246 *[84]
ZnO (130 nm)/Glass0.276 *
ZnO (250 nm)/Glass0.294 *
* Recalculated from the reported value in min−1.
Disclaimer/Publisher’s Note: The statements, opinions and data contained in all publications are solely those of the individual author(s) and contributor(s) and not of MDPI and/or the editor(s). MDPI and/or the editor(s) disclaim responsibility for any injury to people or property resulting from any ideas, methods, instructions or products referred to in the content.

