Abstract
The aim of this study was to determine the potential pharmaceutical applications of quercetin—a natural flavonoid compound with a polyphenolic structure—following its encapsulation in polymeric microspheres resistant to degradation. The microspheres were prepared from natural polymeric compounds (chitosan and sodium alginate) via a complex coacervation method, with the goal of protecting quercetin from the degradation reactions that can affect its bioactivity. After the microspheres were prepared, they were characterized using various analytical methods. The encapsulation efficiency (EE (%)), swelling index (idxSWL%), roughness (measured using confocal laser scanning microscopy—CLSM), and surface morphology (measured using scanning electron microscopy—SEM) were all analyzed. In addition, the release capacity of quercetin from the microspheres (mQrel%) and the antimicrobial activity of the microspheres were evaluated in vitro. Finally, a multivariate statistical analysis (MANOVA, p = 0.05, PCA, and AHC) was conducted. This analysis showed that chitosan–sodium alginate–quercetin microspheres (CAQ-Ms) entrap 86.91 ± 1.10–93.11 ± 0.72% quercetin; in vitro, 71.46 ± 0.25–91.06 ± 0.15% quercetin was released, and the swelling index was higher (6701.29 ± 0.39–10,009.30 ± 1.11%) in the phosphate-buffered solution with a pH of 7.4. The CLSM and SEM analyses showed that the polymer concentration in CAQ-Ms was increased, and the roughness and smoothness of the microspheres were also increased. SEM also showed that the external layer of CAQ-Ms was formed from chitosan and the internal layer was formed from sodium alginate. Antimicrobial tests showed that CAQ-Ms had antibacterial and antifungal effects on the analyzed strains and produced larger inhibition zones between 15.3 and 14.4 mm on Escherichia coli and between 13.3 and 14.2 mm on Candida albicans, and smaller inhibition zones, between 12.4 and 13.6 mm, on Staphylococcus aureus. According to the obtained results, after the multivariate statistical analysis, it can be observed that the best performance was presented by samples P1, P2, and P3. In conclusion, the method used for the formulation of CAQ-Ms was efficient because it enabled an increase in the solubility of quercetin in water and its protection against external and internal degradation in the gastrointestinal tract. This system can be further used to produce new pills for oral administration that are able to reach the small intestine, where they can then release loaded active drugs.
1. Introduction
Microencapsulation is an advantageous technology for quality assurance, and for the maximization and preservation of the bioactivity of active pharmaceutical ingredients (API) found in any state of aggregation (solid, liquid, or gaseous). The content after encapsulation is closed into micron-sized capsules (named microparticles) that can be administered orally; under certain conditions, these can have a controlled release and can be protected against external factors (heat, temperature, pH), which may affect their bioactivity [1,2,3,4,5].
Among the microencapsulation methods that can be used to obtain microparticles, in this work, a complex coacervation technique was used. Using complex coacervation, a high encapsulation threshold of API 80%–99% [6,7,8] can be reached and over time this has been proven to be an adequate method for the controlled, prolonged, and sustained delivery of hydrophilic or hydrophobic API to the gastrointestinal (GI) tract. In complex coacervation, the API is covered with two biopolymers that have opposing charges and can interact electrostatically to produce a complex shell [9].
In the microencapsulation process, researchers found that, for obtaining efficient and stable products, the chosen technological process, as well as the nature, ratio, and properties of the walls of the material used, can influence the quality of the final product [3,10]. Material walls refer to the outer layer or coating that surrounds a tiny particle or droplet of a material (the core). These walls are typically made of a polymeric material and serve to protect and control the release of the core material. The size and composition of the wall can be tailored to achieve specific properties such as stability, solubility, and controlled release kinetics [11]. Good encapsulation material walls, in the opinion of Bayraktar O. et al., should improve the functioning and stability of the API [4]. Currently, a wide range of natural, synthetic, or semi-synthetic polymeric substances can be used as material walls. For building microparticle walls, the preferred and cheapest option is using natural polymers, as opposed to synthetic ones. They are biocompatible with the body and free from side effects [12,13]. Today, innovative mucoadhesive nanocapsules from natural polymers (NP) have been developed using a complex coacervation method for ocular delivery [14], and polymeric nanoparticles that increase the permeability, solubility, and prolonged release of cefixime [15], nanoparticles that can stimulate the production of glucose in skeletal muscle cells [16], and cross-linked chitosan microspheres for the prolonged release of levofloxacin have been created using the spray-drying method [17]. Two polymers were used in this study, chitosan and sodium alginate, with opposite charges [13,18,19]. Chitosan is a natural polycationic polysaccharide, positively charged at biological pH, which makes it possible to electrostatically interact via complex coacervation with negative polysaccharides [20]. Additionally, it is considered a biodegradable and biocompatible polymer, it has antimicrobial, antitumor, antioxidant, anti-inflammatory, analgesic, hemostatic, and anticholesterolemic actions [21,22,23], and its pharmaceutical form can be administered via different routes: oral, parenteral, percutaneous or mucosal [1,24]. On the other hand, sodium alginate is a natural polysaccharide with a negative charge, a linear structure, and it is biodegradable and biocompatible; it can be included in the matrix of particulate pharmaceutical systems because it has gelling and stabilizing properties and the ability to retain water [1,25].
Flavonoid polyphenols are widespread plant secondary metabolites with antioxidant properties, which can be used for the prevention of cancer, osteoporosis, diabetes, heart protection, and for the treatment of neurodegenerative diseases. Even though these substances have beneficial health effects on the body, their applicability in clinical studies is limited by flavonoids’ poor bioavailability [26], which is caused by their poor solubility in water [27], low absorption from the gastrointestinal tract, rapid metabolism, and poor stability under physiological conditions [28].
As a flavonoid polyphenolic compound presenting a good antioxidant action, but with low stability and water solubility, in our study, we investigated quercetin [29,30]. Quercetin is known to have some other beneficial effects: antihypertensive, antiatherogenic, neuroprotective, anticancer, antitumor, antiulcer, antiallergic, antiviral, antibacterial [31,32,33], anti-proliferative, and anti-inflammatory [34,35]. According to scientific information and clinical tests conducted on humans and laboratory animals, quercetin is currently considered a natural remedy that improves mental/physical performance, reduces the risk of infections, protects the body from metal ions, has an antiplatelet effect, and protects the arteriolar microcirculation from damaging ischemic episodes, determining vasodilatation [36,37,38]. Low water solubility, stability, and bioavailability limit the use of quercetin in clinical trials [39]. To overcome these obstacles in the literature, Aluani D. et al. reported that, by including quercetin in chitosan and sodium alginate nanoparticles using the ionic gelation technique, it is possible to increase the protective activity of quercetin against oxidative-stress-associated injuries [40]. Hazra et al. loaded quercetin into microparticles in a single step to modify the profile of low water-soluble quercetin and to increase the oral bioavailability of quercetin [41]. Nalini et al. successfully encapsulated the hydrophobic quercetin into sodium alginate and chitosan nanoparticles, improving the stability and bioavailability of quercetin using the ionic gelation method [34,35]. Through encapsulation methods, the bioactivity of natural compounds such as quercetin is maximized and preserved because it ensures protection from oxidation, dehydration reactions, and other unwanted reactions that can affect its bioactivity [4]. Compared to previous studies, our work lies in the preparation of other encapsulated pharmaceutical systems such as microspheres, using another technique—complex coacervation. The novelty of this work lies in the fact that quercetin could be used as an alternative medication in the treatment of various microbial infections, even when used in quantities of less than 0.2 g/mL in pharmaceutical preparations such as microspheres. Previous results reported in the literature showed that quercetin exhibits antimicrobial effects when included in chitosan films [42] and starch-aldehyde solution [43], but less so when included in microspheres prepared by the complex coacervation method. Although little is known about the biological activity of quercetin microspheres, in this study the results showed that quercetin exhibits a high antibacterial effect on Escherichia coli and Pseudomonas aeruginosa, as well as an antifungal effect on Candida albicans. Unlike other studies, this research only used natural materials for the encapsulation of quercetin in microspheres of chitosan obtained from shrimp, with a degree of deacetylation > 75% and high molecular weight, and sodium alginate which is, in fact, a sodium salt of alginic acid extracted from brown algae.
The aim of present study was to determine the potential pharmaceutical applications of quercetin in different antimicrobial therapies, because of its encapsulation in microspheres composed of natural polymers. By using an effective preparation method, such as coacervation, and by using an adequate amount of polymer and quercetin, prepared microspheres can ensure the increase of quercetin solubility in water, and can protect it from external and internal degradation in the gastrointestinal tract. Concomitantly, it can improve quercetin bioavailability and its targeted delivery to the specific sites of infection. This system can be further used to produce new oral pills capable of reaching the small intestine where a contained active drug can be yielded. In addition, quercetin usage in pharmaceutical formulation can provide a safer and more sustainable alternative to conventional antibiotics.
The novelty of the present paper is given by the fact that quercetin can be used as an alternative medication in the treatment of various microbial diseases, even if it is used in quantities lower than 0.2 g/mL. Quercetin-loaded microspheres present a high antibacterial effect on Escherichia coli, Pseudomonas aeruginosa, and an anti-fungal effect on Candida albicans. The successful encapsulation of quercetin in microspheres was due to the complex coacervation method and to the nature of the materials used—natural chitosan with a deacetylation degree > 75% and high molecular weight, and sodium alginate which is, in fact, sodium salt of alginic acid extracted from brown algae.
2. Materials and Methods
2.1. Materials and Reagents
The materials and reagents used in the present work were analytical grades. The chitosan (with a degree of deacetylation > 75% and a molar mass between 310,000 and 375,000 Da, obtained from shrimps) and quercetin hydrate were purchased from Sigma–Aldrich Co. (Burlington, MO, USA), alginic acid sodium salt from brown algae was purchased from Sigma–Aldrich (Saint Louis, MO, USA), anhydrous calcium chloride and sodium hydroxide 1M were from Chempur (Piekary Slaskie, Poland), and glacial acetic acid was from Promochem (Wesel, Germany).
The apparatus used in the preparation of Ms was: analytical balance of type Kern ABT 220-5DNM Kern and Sohn GmbH (Balingen, Germany), pH meter type pH 7310 Inolab Xylem Analytics GmbH (Wellheim, Germany), magnetic stirrer Ecostris Dlab Scientific Co., Ltd. (Beijing, China), universal centrifuge 320R Hettich GmbH and Co., KG (Tuttingen, Germany), and SLW 115 STD POL-EKO-APPLIANCES SPJ (Wodzislaw Slaski, Poland).
2.2. Preparation of Chitosan-Alginate-Quercetin Microspheres (CAQ-Ms)
The microspheres were prepared using the complex coacervation method [42,43] where it was necessary to prepare more aqueous colloidal solutions: chitosan of different concentrations (0.1, 0.2, and 0.4%) and sodium alginate of different concentrations (0.75%, 2%). After the desired amount of chitosan was dissolved in an aqueous solution of acetic acid (2%), calcium chloride 4% and NaOH 10% were added to each solution to obtain a pH of 5.5 suitable for obtaining microspheres. The sodium alginate was dissolved in distilled water to form a homogeneous solution, and then quercetin was added by dispersion (0.05, 0.075, and 0.1 g). The different formulations used for the preparation of different microspheres are detailed in Table 1.

Table 1.
Formulations of different microspheres.
The preparation of chitosan solutions involves dispersing 0.1 g, 0.2 g, or 0.4 g of chitosan in 99.9 mL, 99.8 mL, and 99.6 mL of 2% acetic acid solution, which is left to hydrate for about 20 min, after which it is magnetically stirred at 100 rpm for 30 min. For good homogenization, the solutions are introduced into an ultrasound bath for 30 min, and then 4 g of calcium chloride is added under magnetic stirring at a speed of 100 rpm, and the pH is read and adjusted to 5.5 using a 10% sodium hydroxide solution. From the obtained solution, 50 mL of Ch/sample was used. To prepare the Na-Alg solution, 0.75 g or 2 g of Na-Alg is dispersed in 99.25 mL or 98 mL of distilled water and left to hydrate for 35 min. The solution is magnetically stirred at 100 rpm for 30 min to prevent the formation of aggregates and to promote the complete dissolution of Na-Alg in water. Then, it is homogenized in an ultrasound bath for 20 min to promote the removal of air bubbles. To prepare the 10 samples, 20 mL of Na-Alg/sample was used from the viscous, clear solution and, in six of them, quercetin was dispersed in different amounts: 0.05 g, 0.075 g, and 0.1 g.
The preparation of CAQ-Ms is carried out by introduction of a 20 mL mixture of quercetin-sodium alginate into a syringe, with a needle size of 23 G, which was added drop wise into the 100 mL chitosan solution, with shaking for 60 min at 100 rpm. The microspheres obtained were separated by simple filtration, washed with distilled water, dried at a temperature of 30 °C, and were kept in brown containers, tightly closed at a temperature of 20 ± 2 °C until further use.
2.3. Characterization of Quercetin Microspheres by Analytical Methods
2.3.1. Determination of Entrapping Efficiency (EE(%))
The proportion of quercetin contained in microspheres was determined by measuring their absorbance, at a wavelength of 376 nm, using a UV-VIS T70+ spectrophotometer (PG Instruments Ltd., Lutterworth, UK) after weighing 0.25 g of Ms and vigorously stirring for 6 h at 500 rpm, before rotating for 15 min at 1500 rpm and 37 °C [44]. The experiment was performed three times and the outcomes are given as an average value with standard deviation (±SD). Equation (1) was utilized to calculate the entrapping efficiency:
where:
= the weight (grams) of the encapsulated quercetin;
= the stipulated weight of quercetin (grams) that the microspheres should contain.
2.3.2. Analysis of the Swelling Index (idxSWL(%))
After immersing 5 dry microspheres, with known masses, in 3 mL of five different pH media, namely simulated gastric fluid—pH of 1.2, acetate buffer solution—pH of 3.0 and 5.0, and simulated intestinal fluid–phosphate buffer pH of 6.8 and 7.4., an idxSWL(%) examination [41] was carried out [45,46]. The idxSWL(%) of microspheres was calculated taking into account Formula (2), by weighing them at the analytical balance, every hour for eight hours, after wiping the excess water with a Whatman filter paper No.1. The analysis was performed in triplicate and the results of idxSWL(%) are expressed as the average (±SD).
where:
= mass of swollen microspheres, expressed in grams;
= mass of dried microspheres, expressed in grams.
2.3.3. Analysis by Confocal Laser Scanning Microscopy (CLSM)
Using a 405 nm laser light source and a 3D laser measuring microscope (Lext OLS 4000, Olympus, Tokyo, Japan), measurements of the roughness of Ms were made [47].
2.3.4. Analysis by Scanning Electron Microscopy (SEM)
Characterization of Ms by scanning electron microscopy was carried out using an FEI Quanta FEG 250 scanning microscope (Hillsboro, OR, USA). For this, given microspheres were analyzed. The SEM images recorded non-coated microspheres in a low-vacuum system so as not to affect the samples [48].
2.4. In Vitro Release Studies of Quercetin
Using the principles of the procedure established in United States Pharmacopeia (USP 43) [49], the quercetin release test from Ms was carried out within 24 h, using the Electrolab TDT-08L-Dissolving Tester (USP) testing device, which is equipped with 8 baskets of 400 mL capacity.
The in vitro release test was conducted under the following conditions: dissolution time of 24 h, temperature of 37 °C, spin frequency of 30 rpm for the device’s baskets, and a volume of 400 mL phosphate-buffered solution of pH 7.4 per basket [46].
The content of the quercetin, released from the microspheres, was determined [42] after which 0.25 g of dry microspheres were put into the baskets containing a phosphate-buffered solution of pH 7.4. From each basket, after 0.25, 0.5, 0.75, 1, 2, 3, 4, 5, 6, 8, and 24 h, samples were taken, the absorbance of which was measured spectrophotometrically using a wavelength of 376 nm. The experiment was carried out in triplicate, and the results are presented as the total mean (±SD).
2.5. Determination of the Antimicrobial Activity
Microspheres were subjected to antimicrobial analysis, using the agar disk-diffusion method, in which various Gram-positive and Gram-negative bacteria (reference microbial strains and human clinical isolated) and yeasts were used. As reference strains, the American Type Culture Collection (ATCC) was used: Staphylococcus aureus (ATCC 25923), Pseudomonas aeruginosa (ATCC 27853), Escherichia coli (ATCC 25922), and Candida albicans (ATCC 90028), Microbiologics, Inc. USA. Mueller–Hinton agar (Oxoid) was used as culture medium for staphylococci, Escherichia coli, Pseudomonas aeruginosa, and Klebsiella pneumonia; Mueller–Hinton 2 agar + 5% sheep blood (BioMerieux) was used for streptococcal strains and for Candida albicans (Sabouraud) Gentamicin Chloramphenicol 2 agar (BioMerieux). Culture media were inoculated with the tested microorganism suspension and its concentration was adjusted to 108 CFU/mL by comparison with McFarland turbidity scale no. 0.5. Standard Sterile discs (Hi-Media Laboratories) impregnated with quercetin solution 0.1 mg/mL (dissolved in DMSO), chitosan 0.1, 0.2, 0.4% (dissolved in 2% glacial acetic acid solution), and sodium alginate 0.75, 2% (dissolved in distilled water); solutions of microspheres in which the amount of quercetin was 0.100 g (P3, P4, P5, and P6) were applied to the surface of the agar plates, after inoculation, at a distance of at least 13 mm from the edges of the plate and a minimum of 25 mm between two adjacent discs, using a sterile brush. As negative controls, filter papers impregnated with distilled water (20 μL) were used, and as positive controls, penicillin (10 U, Oxoid), vancomycin discs (30 μg; Oxoid), ofloxacin discs (5 μg; Oxoid), meropenem discs (10 μg; Oxoid), and fluconazole (25 μg; BD BBL) were used. Sample plates were incubated in an incubator at 37 °C for 24 h [50]. The inhibition areas obtained, in the case of the strains used, must be verified to be within the limits accepted by EUCAST, or the Clinical and Laboratory Standards Institute’s (CLSI), “Performance Standards for Antimicrobial Susceptibility Testing” (32nd informational supplement, (CLSI M100–S32 Clinical and Laboratory Standards Institute) CLSI, Wayne (PA), 2022). The reading is made from the point where there is complete inhibition able to be appreciated by the naked eye [51].
2.6. Statistical Analysis
The Design of the Experiment (DOE) was a multivariate analysis of more parameters: EE(%), idxSWL(%), and mQrel(%). The statistical multivariate analysis consisted of PCA (Principal Component Analysis), MANOVA (Multivariate ANOVA, p = 0.05), and AHC (Agglomerative Hierarchical Cluster Analysis). Multivariate analysis was performed [52] to decide which samples had the best combination performance regarding entrapping efficiency, swelling index, and in vitro drug release. Data for all sample parameters were analyzed in triplicate and the results obtained are presented as mean (±SD, n = 3, p = 0.05). Statistical analysis and graphical representations were carried out with homemade subroutines, including standardized statistical methods from MATLAB software (MatWorks Inc., 1 Apple Hill Drive, Natick, MA, USA).
3. Results and Discussions
3.1. Entrapping Efficiency (EE(%))
Determination of EE(%) of quercetin was made using UV-VIS spectrophotometry, taking into account the calibration curve of standard quercetin solution and Equation (1) of EE(%). From the analysis of the results obtained (Table 2), it can be seen that the average of the EE(%) was the highest and close in value for samples P4 (91.35 ± 1.07%), P5 (92.26 ± 0.27%), and P6 (93.11 ± 0.72%), in which the concentration of sodium alginate used was the highest (2%). The lowest EE(%) was observed into the microspheres with lowest alginate concentration (0.75%): P1 (86.91 ± 1.10%), P2 (87.02 ± 0.74), and P3 (88.16 ± 0.61%). Additionally, it was observed that the increase in quercetin concentration led to an increase in EE(%), so for the microspheres prepared using 0.05 g of quercetin, the entrapping was 86.91 ± 1.10%; furthermore, by using 0.075 g of quercetin, the entrapping increased to 87.02 ± 0.74%. When 0.100 g of quercetin was used, the entrapping was 88.16 ± 0.61%, 91.35 ± 1.07%, 92.26 ± 0.27%, and 93.11 ± 0.72% API. In conclusion, increasing the concentration of polymers and quercetin used as microspheres leads to an increase in EE(%).
Table 2.
Entrapping efficiency of microspheres.
Studies show that, while preparing microspheres, the concentration of the polymer used in their preparation should be taken into account, because it may affect the morphology, dimensions, and EE(%) of the API. Many studies show that, with an increase in the polymer concentration, the EE(%) of API increases and the viscosity of the polymeric solution increases [53]. If too low a concentration of polymer is used, microspheres with a low density, a large distribution surface, and a rapid release of the entrapped API are obtained [54].
The results obtained are in line with the results of other researchers who obtained microspheres through the oil-in-water emulsion process, who entrapped 74% quercetin [55], and, using the emulsion-assisted method, who entrapped 53.2% quercetin [56].
3.2. Swelling Index Analysis (idxSWL(%))
Microspheres are formed by a biodegradable and hydrophilic polymeric matrix, that tends to absorb water, which means that they have the property of swelling in contact with it [45,57]. Considering this property, microspheres were subjected to a swelling test on different pH media: 1.2, 3.0, 5.0, 6.8, and 7.4, in order to be able to determine the optimal time and pH at which their disintegration occurs. Results of the idxSWL(%) time series for samples (P1–P6, E1–E4) and all pH factor levels are presented in Table 3, Tables S1–S10—from the Supplementary Material and in Figure 1. From the analysis, it was observed that, after 8 h, samples reached the maximum swelling threshold and after 12 h they could no longer be weighed because they began to break, which is in line with the results obtained from the in vitro release test. Additionally, it can be seen that the swelling process was faster in the alkaline pH of 6.8 (4787.32 ± 0.63–7332.92 ± 0.43%) and pH 7.4 (6701.29 ± 0.39–10,009.30 ± 1.11%) for all samples, and slower in the acid pH 1.2 (537.76 ± 0.99–948.77 ± 1.98%), pH 3 (864.17 ± 1.06–1639.72 ± 1.06%), and pH 5 (1926.48 ± 0.43–4185.83 ± 1.09%), because this index was influenced by the concentration of the quercetin and polymers used (Table 3, Figure 1).
Table 3.
Swelling index of CAQ-Ms as a function of pH.
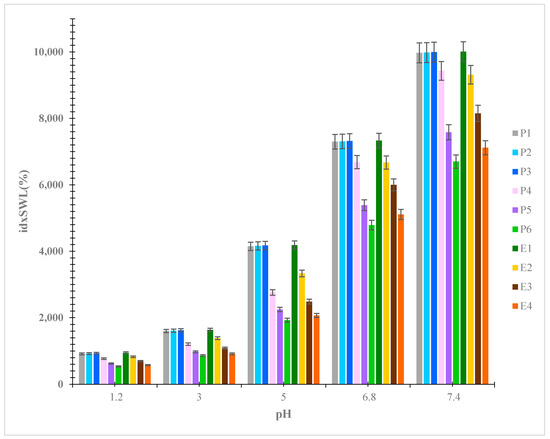
Figure 1.
Swelling index of CAQ-Ms as a function of pH.
When samples were introduced into a buffer solution of pH 1.2 (Tables S11–S13—from the Supplementary Material), the swelling index of the microspheres was the lowest (537.76 ± 0.99–948.77 ± 1.98%), which means that microspheres have low solubility in acidic media. According to the literature, the small percent of swelling could be produced by the chitosan swelling, located on the outside of microspheres, due to the cationic character and the presence in the structure of aminic groups, that become easily ionizable and positively charged at low pH values. When samples were added into the buffer solutions with a pH of 6.8 (4787.32 ± 0.63–7332.92 ± 0.43%) or slightly basic 7.4 (6701.29 ± 0.39–10,009.30 ± 1.11%), the swelling tendency of samples was greater, due to the aminic groups of chitosan molecules that have a low load density. High water absorption, the rupture of the complex, and the hydrogen bonds formed between the chitosan, sodium alginate, and quercetin molecules, increased the affinity of the dissolution medium to the microspheres [58,59,60].
According to Table 3 and Table S14 in the Supplementary Material, idxSWL(%) decreases with increasing concentration of the two polymers in microspheres, therefore, empty samples (E1–E4) show the highest idxSWL(%) values (E1: 948.77 ± 1.98–10,009.30 ± 1.11, E2: 827.34 ± 0.32–9315.42 ± 0.35%, E3: 697.028 ± 0.54–8150.10 ± 0.98%, E4: 576.96 ± 0.62–7117.48 ± 0.77%), followed by quercetin samples (P1: 914.81 ± 1.12–9973.05 ± 0.51%, P2: 924.67 ± 0.77–9983.94 ± 0.25%, P3: 935.68 ± 1.2–9996.62 ± 0.79%, P4: 772.21 ± 0.8–9431.45 ± 0.82, P5: 623.97 ± 0.24–7582.58 ± 0.73, P6: 537.76 ± 0.99–6701.29 ± 0.39). For samples with higher quercetin amounts, the idxSWL(%) also increases at all pH levels and the highest values were recorded in the case of microspheres where the concentrations of polymers remained constant. Figure 1 and Figures S1 and S2 from the Supplementary Material, showed that, of the pH levels tested, in a pH of 7.4, all samples had the highest idxSWL(%) results; in other words, this was the most suitable pH for the disintegration of microspheres in vitro.
Other authors’ data analysis, unlike ours, proved that the quercetin-chitosan-pectin microspheres also had a low tendency to swell in the acidic medium of pH 2.1 [44], and that other chitosan-natrum alginate-isoniazid microspheres swelled more in an alkaline medium (pH of 7.4) than in an acidic medium (pH of 1.2) [61]. Other authors obtained ketoprofen-chitosan-sodium alginate microspheres, using the extrusion method, that did not swell in water and a pH of 1, but swelled in pHs of 6.8 and 7.4 [62].
3.3. Confocal Laser Scanning Microscopy (CLSM) Analysis
The determination of microsphere roughness was carried out by 2D and 3D laser scanning. The micrography obtained represents the areas on which roughness has been determined. The scanned surface showed 1279 × 1280 μm, and the magnification that was worked on was x 108. Using a specific formula, some parameters designate the texture or appearance of the analyzed samples. All the roughness values obtained for each sample are shown in Table 4.
Table 4.
Calculated roughness of microspheres.
The roughness values obtained for Sa and Sq were situated between 4.32 and 47.66 μm, respectively, between 8.91 and 112.45 μm. These parameters were used to designate the degree of roughness of the samples. The highest roughness was found in the P3 sample (Sa-47.66 ± 0.47 μm), in which the three constituents Ch: Na-Alg: Q exist in the mass ratio (g) of 0.4: 0.75: 0.100, followed by P2 (Sa-33.20 ± 0.53 μm), E1 (Sa-32.93 ± 0.88 μm), P1 (Sa-31.31 ± 0.12 μm), E2 (Sa-15.24 ± 0.63 μm), P4 (Sa-10.49 ± 0.36 μm), E3 (10.01 ± 0.21 μm), P5 (9.95 ± 1.09 μm), E4 (Sa-6.32 ± 0.08 μm), and P6 (Sa-5.95 ± 2.07 μm). The discrepancy between parameter values (Sa, Sq, and Sz), may be due to the zonal particularity of the analyzed area. For example, P3, whose Sq value is higher than in the case of sample P2. This may be due to the lower degree of wrinkling of the P3 sample compared to the P2 sample, which has a more uniform/smooth surface. The high roughness of microspheres creates a large contact surface and therefore, in our opinion, accelerates their swelling, which favors drug release. Roughness (Sa), Square root of the average roughness (Sq), Maximum height (Sp), and Maximum depth (Sv), in the case of P1, P2, P3, and E1 microspheres that contain a smaller concentration of polymers, were the highest (Sa: 47.66 ± 0.47–31.31 ± 0.12 μm, Sq: 112.45 ± 0.63–70.16 ± 0.71 μm, Sp: 773.21 ± 0.31–630.69 ± 0.63 μm, Sv: 668.63 ± 0.26–514.03 ± 0.35 μm) compared to in case of P4-P6 and E2-E4 microspheres that contain a higher concentration of polymers (Sa: 15.24 ± 0.63–5.95 ± 2.07 μm, Sq: 38.45 ± 0.18–16.99 ± 1.08 μm, Sp: 464.26 ± 0.15–60.80 ± 0.41 μm, Sv: 532.05 ± 0.40–219.23 ± 0.85 μm). The increased polymer concentration in samples decreased the roughness of the samples. As for appearance, the samples that contained 0.75% Na-Alg (P1, P2, P3, and E1) had a more wrinkled and approximately similar appearance compared to the other samples that contain 2% Na-Alg (P4–P6 and E2–E4), that have a smoother appearance that is free of roughness, wrinkles, and creases due to the higher amount of polymer.
3.4. Scanning Electron Microscopy Analysis (SEM)
SEM imaging technology proved the structure, appearance, and surface morphology of the CAQ-Ms. Based on the recorded micrograph presented in Figure 2 and Figure 3, it is possible to show the compact structure, roughness, and whetstone appearance of most microspheres, which makes the compounds relatively uniformly distributed throughout the CAQ-Ms. Microspheres P1, P2, and P3—where the concentration of chitosan and sodium alginate were constant (0.4% chitosan and 0.75% sodium alginate), and the amount of quercetin varied between 0.05 and 0.1 g—did not show morphological variations at first, but the detailed images revealed a veiled surface that tended to smooth with quercetin increase as well as the slight swelling tendency of Ms (P3). These observations correlate directly with the EE(%) degree of the samples. The CAQ-Ms swelling tendency is obvious in the series of samples P1-P6. Sample P6, which contains the highest concentration of natural polymers and has shown the highest degree of entrapment from a morphological point of view, has an unveiled surface with a granular aspect. Microspheres containing quercetin (P1-P6) have a higher rugosity degree than those without quercetin (E1-E4). The smoothest surface is the E4 sample, which has the highest concentration of sodium alginate (2 g%), and the highest concentration of chitosan, in the absence of quercetin.
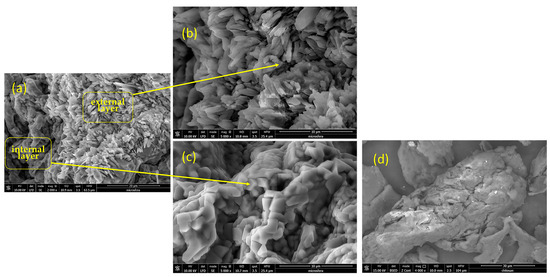
Figure 2.
Scanning Electron Microscopy (SEM) for microspheres. (a) SEM micrography of surface structure; (b) sodium alginate appearance in the internal layer; (c) chitosan appearance in the external layer; and (d) chitosan structure.
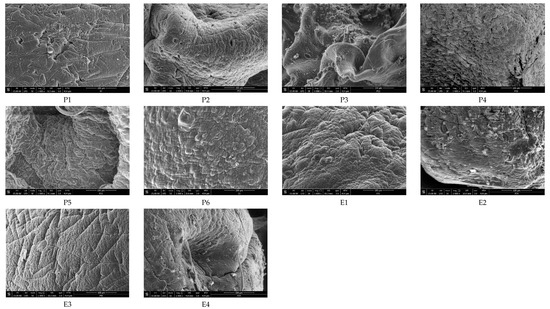
Figure 3.
Scanning Electron Microscopy (SEM) for microspheres (P1–P6, E1–E4).
An increase in Q concentration under the condition of keeping a constant concentration of Na-Alg (0.75%) and Ch (0.4%) causes some modification of the microspheres’ surface—a wrinkling and rippling of the surface, as well as an increase in surface roughness in series P1 < P2 < P3. Upon reaching the maximum Q concentration (P4) at the highest Na-Alg concentration (2%) and the lowest Ch concentration (0.1%), the microsphere surface presents a granular appearance, and prepared microspheres are spherical. This can be due to the Ms swelling into the presence of Na-Alg and the spherical shape is correlated with rigidity due to the presence of Ch. These considerations were also supported by the morphology of sample P6—maximum Ch and Na-Alg concentration leading to a spherical and rigid Ms structure. The role of Na-Alg in the spherical appearance can be observed by comparing the structure of the E1 sample with the E4.
According to Figure 2, after CAQ-Ms was sectioned, a morphological difference between the internal and external layer of the microsphere was observed. The core of the microsphere, consisting of sodium alginate, is enveloped/protected by a layer of chitosan. Based on these data presented in Figure 2b, we can observe that the external layer of quercetin microspheres presents a similar structure to chitosan. From this comparison, we can conclude that the external layer consists of chitosan. In our opinion, this coating may be thinner or thicker, depending on the concentration of chitosan used. From the structural analysis of CAQ-Ms, it can be seen that the internal layer is about 6 μm thick and consists of prismatic elements, while the external layer has a needle shape, with an average thickness of about 4 μm. The advantage of covering CAQ-Ms with a layer of chitosan derives from the fact that coverage favored protecting quercetin by the action of external physicochemical factors.
3.5. In Vitro Release Test of Quercetin (mQrel(%))
The in vitro release test of quercetin loaded in CAQ-Ms was performed at 37 °C temperature, in simulated intestinal fluid–phosphate buffer at a pH of 7.4, because the swelling test results were highest in this pH solution. The controlled release of API from the CAQ-Ms was complete after 24 h. According to Table 5, and Figure 4 and Figure 5, samples P1-P3, containing lower concentrations of sodium alginate (0.75%), trigger a much faster and higher quercetin release than samples P4-P6, containing higher concentrations of sodium alginate (2%). For example, the P3 sample released, after 24 h, 91.06% quercetin, compared to the P6 sample which released 71.46%. The slow or delayed release of API from CAQ-Ms that contained 2% sodium alginate, may be due to the rigid and compact polymeric matrix, through which quercetin is difficult to release [57].
Table 5.
In vitro release results of different microspheres.
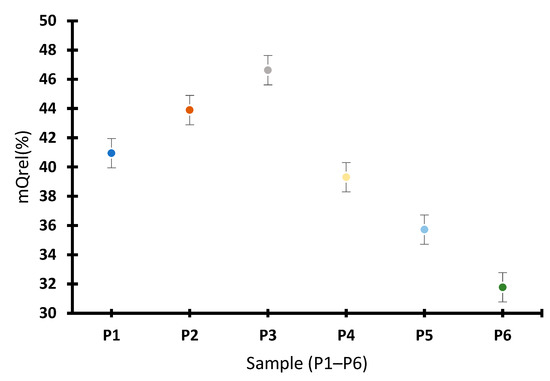
Figure 4.
Evaluation of the in vitro release mode of quercetin from the (P1–P6) samples.
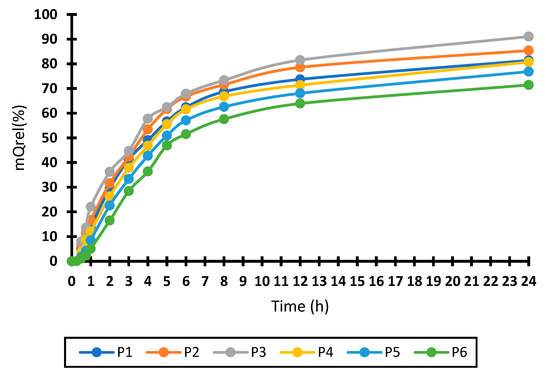
Figure 5.
Graphic representation of the in vitro quercetin release from the P1–P6 samples, over 24 h.
Ms were subjected to an in vitro release study, in order to find out the amount of quercetin that can be released over time in the chosen dissolution medium, because the formulation can influence the release of the API. After being encapsulated in the polymeric matrix of microspheres (as observed in the SEM analysis) the release of quercetin was controlled by the diffusion and erosion process [45]. The sodium alginate and chitosan used to obtain these systems may favor the diffusion and release of quercetin through the polymeric matrix, as a result of its swelling (due to the insolubility of quercetin in water) [63,64]. In conclusion, after oral administration, these samples are not affected by the hard physiological environment of the gastrointestinal tract, because the polymers chosen for formulation have the ability to protect quercetin from gastric acidity and enzymatic activity, increasing its solubility in the lumen and its transport through the gastrointestinal barrier, unlike classical pharmaceutical forms, in which degradation can cause a loss of potential action [65].
3.6. Determination of the Antimicrobial Activity of Microspheres
The inhibition zones obtained from the microbial testing of quercetin, chitosan, alginate, and microsphere solutions are presented in Table 6 and Table 7.
Table 6.
Results of testing the antimicrobial activity of the microspheres against different bacterial (Gram + and Gram -) and fungal strains.
Table 7.
Results of testing the antimicrobial activity of the microspheres against different bacterial strains (Gram + and Gram -) from clinical isolate strains.
Following the results from Table 6 and Table 7, among the control samples analyzed, only the samples that contained chitosan solutions (SCh0.1, SCh0.2, SCh0.4) presented an antimicrobial effect on the reference microbial strains and clinically isolated human strains. Among the three tested chitosan solutions, SCh0.4 showed the strongest degree of inhibition on the reference microbial strains: Gram + bacteria (Staphylococcus aureus—12.8 ± 0.4 mm), Gram—bacteria (Escherichia coli—12.4 ± 0.5 mm and Pseudomonas aeruginosa—11.5 ± 2.7 mm), Candida albicans—12.1 ± 0.4 mm, and on the clinically isolated human strains: Gram + bacteria (Staphylococcus aureus—12.9 ± 0.1 mm, Streptococcus pyogenes—12.3 ± 0.7 mm) and Gram—bacteria (Klebsiella pneumoniae—12.3 ± 0.8 mm). The other control sample tests (SQ0.1, SNa-Alg0.75, and SNa-Alg2) did not show any antimicrobial effect on the reference microbial strains and clinically isolated human strains.
According to studies, the chitosan solution may alter the permeability of bacterial cells, due to its interaction with the surface of the bacterial cells [66], and can be used in regenerative medicine for use as a biocompatible material in the production of orthopedic prostheses [67], as well as in the management of diabetes mellitus, in the form of nanoparticles that can stimulate the production of glucose in skeletal muscle cells [16]. After the introduction of a quercetin solution—SQ0.1—and sodium alginate solution (SNa-Alg0.75, SNa-Alg2) in chitosan solution, the antimicrobial effect of chitosan increased, and the mixture from which the CAQ-Ms is obtained (SP3, SP4, SP5, SP6) produced much higher inhibition zones than the solution of chitosan itself. Additionally, SP3 produced 12.2–13.9 mm inhibition zones, SP4: 12.3–12.9 mm, SP5: 12.3–13.4 mm, and SP6: 12.2–13.8 mm, on the tested microorganisms.
Among the analyzed microsphere solutions, the samples in which larger concentrations of chitosan were used (0.4%) showed the greatest antimicrobial effect (SP3, SP6). SP3 and SP6 showed the highest inhibition zones on the Escherichia coli (SP3—15.3 ± 0.3 mm, SP6—15.2 ± 0.3 mm), Candida albicans (SP3—14.2 ± 0.7 mm, SP6—14.2 ± 0.8 mm), and Staphylococcus aureus (SP3—13.9 ± 0.6 mm, SP6—13.8 ± 0.3 mm). The lowest antimicrobial effect was recorded in sample SP4, in which 0.1% chitosan was used, and in sample SP5, in which 0.2% chitosan was used. All these results may suggest that quercetin may exhibit antibacterial activity, even when it is included in low concentrations in different pharmaceutical formulations alongside chitosan, considering that sodium alginate has not shown an antibacterial effect.
To better understand the antimicrobial activity of prepared microspheres, studies of classical antibiotics against the same microbial strains were performed, the data of which are presented in Table 8.
Table 8.
Results of testing the antimicrobial activity of different antibiotics against different bacterial strains (Gram + and Gram -).
From the data presented in Table 6, Table 7 and Table 8, one can observe that the prepared microspheres present significant antimicrobial activity against the studied microbial strains. As the literature showed, if quercetin is used at concentrations below 200 μg/mL, its solution may not exhibit antimicrobial effects [68], unless it is included (along with chitosan) in various pharmaceutical formulations. For example, chitosan-quercetin films showed an inhibitory capacity between 29.3 and 24.0 mm against Escherichia coli, Shigella sonnei, Proteus mirabilis, Morganella morganii, Staphylococcus epidermidis, and Bacillus subtilis [66]. In another study, a solution of quercetin (25 mg/mL), a mixture of starch-aldehyde-quercetin (25 mg/mL), and a mixture of starch-aldehyde (25 mg/mL) were subjected to antimicrobial testing. The results showed that Escherichia coli, Salmonella sp., Staphylococcus aureus, and Listeria monocytogenes strains were the most strongly inhibited (18.82–20.81 mm) by the quercetin solution, followed by the starch-aldehyde-quercetin solution that showed zones of inhibition located between 12.18 and 13.67 mm, and the least by the starch-aldehyde solution whose inhibition zones were 9.46–10.28 mm [69]. According to the literature, quercetin it is a flavonoid substance, that can produce an antibacterial effect by blocking the synthesis of nucleic acid, when the DNA-gyrase and nuclein are blocked due to increasing the permeability of the cytoplasmic membrane of the microbial cell [67,70,71].
While it is true that previous studies have shown that quercetin may not exhibit antimicrobial effects at concentrations below 200 μg/mL, the current study suggests that incorporating quercetin into pharmaceutical formulations with chitosan and sodium alginate could still be a promising approach for developing effective antimicrobial therapies, even at low concentrations. By incorporating quercetin into pharmaceutical formulations, it is possible to enhance the bioavailability and targeted delivery of quercetin to specific sites of infection. This could lead to the development of more effective antimicrobial therapies with reduced side effects. Furthermore, the use of natural compounds like quercetin in pharmaceutical formulations could provide a safer and more sustainable alternative to conventional antibiotics.
3.7. Statistical Analysis
To find which sample has the highest combination efficiency in quercetin release, a multivariate analysis was performed. The correct number of microparticle clusters and, consequently, their analysis, had to obtain the desired outcomes. Only after grouping the samples into clusters can we appropriately interpret the PCA findings. The principal component analysis (PCA), which generates the main coordinates (PC1-PC5) of examined parameters for all microspheres, is the first step in the multivariate data sequence (i.e., the quercetin and chitosan combinations). PC1 through PC2 account for 97.99% of the total explained variation. The variable vectors pointing in the direction where the relevant factor has the information updated, or concentration values, are shown in the PCA 2D bi-plots (Figure 6a,b). In this approach, PCA is an alignment multivariate statistical method that creates relative comparisons between examined samples depending on the parameter values.
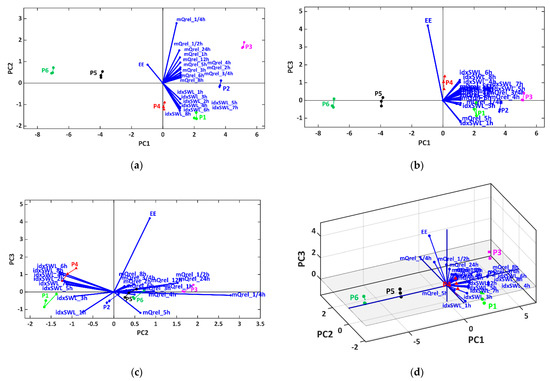
Figure 6.
Biplots of PCA results: (a) 2D representation for PC1 and PC2 principal components; (b) 2D representation for PC1 and PC3; (c) 2D representation for PC2 and PC3 principal components; and (d) 3D representation for PC1, PC2, and PC3.
The numerical parameters of the MANOVA test product were the PC1–PC5 matching main coordinates (p = 0.05). A matrix of the statistical importance of the bilateral sample evaluations (Bonferroni corrected levels, p = 0.05) and standard coordinates (Canon1–Canon5) of the variables for each microsphere sample of microspheres are the emerging findings of this procedure (Table 9).
Table 9.
Statistical significance p-values generated by MANOVA (p = 0.05) method in post hoc pairwise multiple comparisons. Values less than p = 0.05 denote significant statistical mean differences from pairwise sample comparison.
The AHC clustering algorithm was applied to the coordinate values from Canon1 to Canon11 to produce the microsphere clusters. The AHC results are shown as heat maps with a dendrogram (Figure 7) and as a basic dendrogram with the cut-off similarity distance value (Figure 8), which is based on the MANOVA’s p-values matrix and used to determine the correct number of clusters (Table S8 in the Supplementary Material).
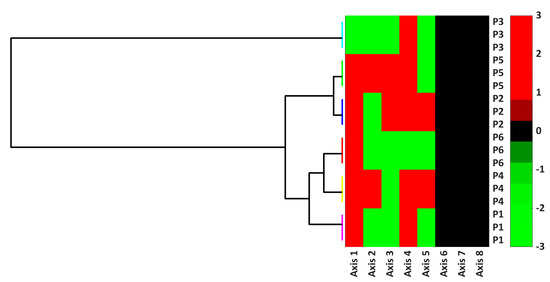
Figure 7.
Cluster analysis of MANOVA (p = 0.05) results: heatmap representation for PC1–PC5 principal coordinates. Different colors for grouping horizontal lines denotes a sample cluster.
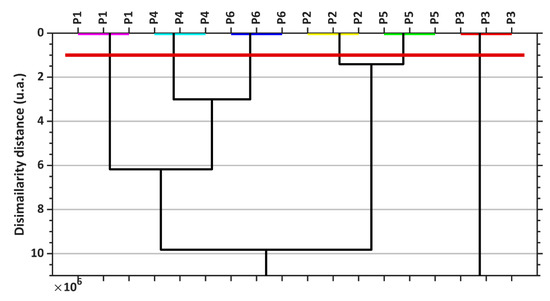
Figure 8.
Cluster analysis of MANOVA (p = 0.05) results: dendrogram representation for PC1–PC5 principal coordinates with the cut-off red line that generates the clusters. Different colors for grouping horizontal lines denotes a sample cluster.
According to the PCA and heat map representation, the PC1–PC5 main coordinates have notable high values that might provide the right number of clusters when utilizing the AHC approach. To create the heatmap and the clustering dendrogram, linear discriminant analysis was applied to the chosen variables (like the PCA) and used with the AHC method. The results matched those of the PCA quite closely. Figure 9a,b display the 2D and 3D LDA biplots and highlight how they resemble PCA biplots. As a result, the LDA heatmap and LDA clustering dendrogram are not displayed, but Table 10 does provide the AHC with LDA canonical coordinates clustering findings (which are the same as with PCA coordinates).
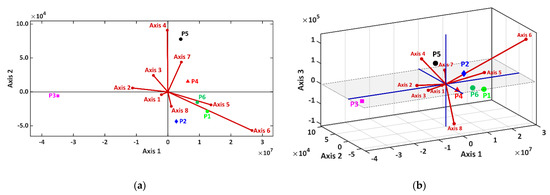
Figure 9.
Biplots of LDA result in (a) 2D and (b) 3D representation for Axis1 and Axis2 canonical components.
Table 10.
Multivariate analysis final results on sample clusters content, according to MANOVA (p = 0.05) and AHC methods.
All sample levels are singleton clusters, according to the PCA/LDA clustering results, which means that they are statistically significantly distinct based on their multivariate profiles.
At this point, the PCA biplots can be used to accurately compare the sample heights (i.e., microsphere samples). The maximum levels of EE (%) and mQrel(%) are shown in sample P3. Additionally, sample P3 shows swelling index values higher than those of P1 and P2. Despite this, the subsequent samples, P4, P5, and P6, exhibit higher values for EE (%), but lower levels of mQrel(%) and idxSWL(%), than in the P3. In conclusion, P3 which entraps enough quercetin with the maximum roughness and in vitro drug release study, is the finest microsphere specimen for quercetin entrapment and has high values for all criteria.
4. Conclusions
The complex coacervation method used for the encapsulation of quercetin in microspheres was efficient and offered the highest entrapment efficiency. A microscopic analysis using CLSM and SEM suggested that microspheres that contained a smaller concentration of polymers had a more wrinkled, were more veiled, and had a higher degree of roughness than those where the concentration of polymers was higher, which showed a smoother and rough spherical appearance. The SEM analysis of the cross-section of CAQ-Ms revealed the existence of the chitosan layer at the surface and the core consisting of sodium-alginate. It was also demonstrated that, by increasing the concentration of quercetin, the entrapping efficiency, the swelling index, and in vitro drug release are positively influenced.
The increase in Q concentration under the condition of keeping a constant concentration of Na-Alg (0.75%) and Ch (0.4%) caused some modification of the microspheres’ surface—a wrinkling and rippling of the surface as well as an increase in surface roughness in series P1 < P2 < P3. Upon reaching the maximum Q concentration (P4) at the highest Na-Alg concentration (2%) and the lowest Ch concentration (0.1%), microspheres have a granular surface and spherical shape. This may be due to the Ms swelling in the presence of Na-Alg, and the spherical shape is correlated with the rigidity due to the presence of Ch. These considerations were also supported by the morphology of sample P6, wherein the maximum Ch and Na-Alg concentrations led to a spherical and rigid Ms structure. The role of Na-Alg in the spherical appearance can be noticed by comparing the structure of the E1 sample with E4.
When increasing the concentration of polymers, it was observed that the entrapment efficiency increased but that the values of the swelling index and those of in vitro drug release decreased. As a result of antimicrobial studies, it has been observed that CAQ-Ms exhibit antimicrobial activity towards Escherichia coli, possibly due to the presence of chitosan. Based on the obtained data analysis, by correlating the microsphere swelling index with swelling time and pH, and by determining the entrapment efficiency, roughness, morphology, drug release, and antimicrobial activity, our statistical study can conclude that the CAQ-Ms can be further used for any in vivo and cell culture studies. Additionally, from these results, we can conclude that the CAQ-Ms can reach the small intestine where it can release the active drug and facilitate its adsorption, followed by its transfer into the circulatory system.
Supplementary Materials
The following are available online at https://www.mdpi.com/article/10.3390/coatings13081376/s1. Table S1: Results of the non-linear regression of the idxSWL (%) time series for sample P1 and all pH factor levels, Table S2: Results of the non-linear regression of the idxSWL (%) time series for sample P2 and all pH factor levels, Table S3: Results of the non-linear regression of the idxSWL (%) time series for sample P3 and all pH factor levels, Table S4: Results of the non-linear regression of the idxSWL (%) time series for sample P4 and all pH factor levels, Table S5: Results of the non-linear regression of the idxSWL (%) time series for sample P5 and all pH factor levels, Table S6: Results of the non-linear regression of the idxSWL (%) time series for sample P6 and all pH factor levels, Table S7: Results of the non-linear regression of the idxSWL (%) time series for sample E1 and all pH factor levels, Table S8: Results of the non-linear regression of the idxSWL (%) time series for sample E2 and all pH factor levels, Table S9: Results of the non-linear regression of the idxSWL (%) time series for sample E3 and all pH factor levels, Table S10: Results of the non-linear regression of the idxSWL (%) time series for sample E4 and all pH factor levels, Table S11: Results of the idxSWL (%) for P1-P6 samples in all pH levels, Table S12: Results of the idxSWL (%) in all pH levels, expressed in terms of time and pH, Table S13: Results of idxSWL (%) of CAQ-Ms in all pH levels, Table S14: Results of idxSLW (%) of CAQ-Ms with/without quercetin, Figure S1: Analysis of swelling capacity of Ms as a function of: (a) Time*Sample and (b) pH*Sample, Figure S2: idxSWL of Ms expressed as a function of pH.
Author Contributions
Conceptualization, N.D., L.G.V. and E.M.; methodology, D.M.D.-S. and M.E.M.; software, A.T.; validation, C.M.M. and O.M.; investigation, O.-D.F., N.S.N., B.P., T.J., A.P., L.G.V. and E.M., writing—original draft preparation, E.M., C.M.M., N.D. and O.-D.F.; writing—review and editing, C.M.M., D.M.D.-S., N.S.N. and N.D. All authors have read and agreed to the published version of the manuscript.
Funding
The research has been funded by the University of Oradea, within the Grants Competition “Scientific Research of Excellence Related to Priority Areas with Capitalization through Technology Transfer INO-TRANSFER-UO”, Project No. 129/2021.
Data Availability Statement
Data will be provided upon request.
Conflicts of Interest
The authors declare no conflict of interest.
References
- Distantina, S.; Susanti, A.D.; Fitriyani, E.; Damayanti, A.D. Microencapsulation of Rice Bran Oil by Complex Coacervation Using Chitosan–k-carrageenan: Influence of Glutaraldehyde and Tween 20. Jt. J. Nov. Carbon Resour. Sci. Green Asia Strategy 2023, 10, 546–552. [Google Scholar]
- Hussain, S.A.; Abdelkader, H.; Abdullah, N.; Kmaruddin, S. Review on micro-encapsulation with Chitosan for pharmaceuticals applications. MOJ Curr. Res. Rev. 2018, 1, 77–84. [Google Scholar] [CrossRef]
- Estevinho, B.N.; Rocha, F.; Santos, L.; Alves, A. Microencapsulation with chitosan by spray drying for industry applications—A review. Trends Food Sci. Technol. 2013, 31, 138–155. [Google Scholar] [CrossRef]
- Bayraktar, O.; Oder, G.; Erdem, C.; Kose, M.D.; Cheaburu-Yilmaz, C.N. Selective Encapsulation of the Polyphenols on Silk Fibroin Nanoparticles: Optimization Approaches. Int. J. Mol. Sci. 2023, 24, 9327. [Google Scholar] [CrossRef]
- Tripathi, D.; Ray, P.; Singh, A.V.; Kishore, V.; Singh, S.L. Durability of Slippery Liquid-Infused Surfaces: Challenges and Advances. Coatings 2023, 13, 1095. [Google Scholar] [CrossRef]
- Bakry, A.M.; Huang, J.; Zhai, Y.; Huang, Q. Myofibrillar protein with κ- or λ-carrageenans as novel shell materials for microencapsulation of tuna oil through complex coacervation. Food Hydrocoll. 2019, 96, 43–53. [Google Scholar] [CrossRef]
- Rios-Mera, J.D.; Saldaña, E.; Ramírez, Y.; Auquiñivín, E.A.; Alvim, I.D.; Contreras-Castillo, C.J. Encapsulation optimization and pH- and temperature-stability of the complex coacervation between soy protein isolate and inulin entrapping fish oil. LWT 2019, 116, 108555. [Google Scholar] [CrossRef]
- Tavares, L.; Noreña, C.P.Z. Encapsulation of Ginger Essential Oil Using Complex Coacervation Method: Coacervate Formation, Rheological Property, and Physicochemical Characterization. Food Bioprocess Technol. 2020, 13, 1405–1420. [Google Scholar] [CrossRef]
- Mu, H.; Song, Z.; Wang, X.; Wang, D.; Zheng, X.; Li, X. Microencapsulation of algae oil by complex coacervation of chitosan and modified starch: Characterization and oxidative stability. Int. J. Biol. Macromol. 2021, 194, 66–73. [Google Scholar] [CrossRef]
- Tran, V.T.; Benoît, J.P.; Venier-Julienne, M.C. Why and how to prepare biodegradable, monodispersed, polymeric microparticles in the field of pharmacy? Int. J. Pharm. 2011, 407, 1–11. [Google Scholar] [CrossRef]
- Lu, W.; Yang, X.; Shen, J.; Li, Z.; Tan, S.; Liu, W.; Cheng, Z. Choosing the appropriate wall materials for spray-drying microencapsulation of natural bioactive ingredients: Taking phenolic compounds as examples. Powder Technol. 2021, 394, 562–574. [Google Scholar] [CrossRef]
- Bayryamov, S.G. A comparative study on the synthesis of rose oil containing microcapsules by complex coacervation using different solvents. J. Chem. Technol. Metall. 2023, 58, 318–326. [Google Scholar]
- Garrison, T.F.; Murawski, A.; Quirino, R.L. Bio-Based Polymers with Potential for Biodegradability. Polymers 2016, 8, 262. [Google Scholar] [CrossRef]
- Dubey, V.; Mohan, P.; Dangi, J.S.; Kesavan, K. Brinzolamide loaded chitosan-pectin mucoadhesive nanocapsules for management of glaucoma: Formulation, characterization and pharmacodynamic study. Int. J. Biol. Macromol. 2019, 152, 1224–1232. [Google Scholar] [CrossRef]
- Balya, H.; Radhakrishnan, A.; Jabaris, S.L.; Sai Gopal, D.V.R.; Kuppusamy, G.; Seetharaman, S. Fabrication of novel bio-compatible cefixime nanoparticles using chitosan and Azadirachta indica fruit mucilage as natural polymers. J. Drug Deliv. Sci. Technol. 2021, 66, 102750. [Google Scholar] [CrossRef]
- Wong, C.Y.; Al-Salami, H.; Dass, C.R. Formulation and characterisation of insulin-loaded chitosan nanoparticles capable of inducing glucose uptake in skeletal muscle cells in vitro. J. Drug Deliv. Sci. Technol. 2020, 57, 101738. [Google Scholar] [CrossRef]
- Zhou, J.; Chen, Y.; Luo, M.; Deng, F.; Lin, S.; Wu, W.; Li, G.; Nan, K. Dual cross-linked chitosan microspheres formulated with spray-drying technique for the sustained release of levofloxacin. Drug Dev. Ind. Pharm. 2019, 45, 568–576. [Google Scholar] [CrossRef]
- Han, J.; Zhao, D.; Li, D.; Wang, X.; Jin, Z.; Zhao, K. Polymer-Based Nanomaterials and Applications for Vaccines and Drugs. Polymers 2018, 10, 31. [Google Scholar] [CrossRef]
- Periayah, M.H.; Halim, A.S.; Saad, A.Z.M. Chitosan: A promising marine polysaccharide for biomedical research. Pharmacogn. Rev. 2016, 10, 39–42. [Google Scholar] [CrossRef]
- Tavares, L.; Souza, H.K.; Gonçalves, M.P.; Rocha, C.M. Physicochemical and microstructural properties of composite edible film obtained by complex coacervation between chitosan and whey protein isolate. Food Hydrocoll. 2020, 113, 106471. [Google Scholar] [CrossRef]
- Dong, R.; Zhou, Y.; Huang, X.; Zhu, X.; Lu, Y.; Shen, J. Functional Supramolecular Polymers for Biomedical Applications. Adv. Mater. 2014, 27, 498–526. [Google Scholar] [CrossRef]
- Hamed, I.; Özogul, F.; Regenstein, J.M. Industrial applications of crustacean by-products (chitin, chitosan, and chitooligosaccharides): A review. Trends Food Sci. Technol. 2016, 48, 40–50. [Google Scholar] [CrossRef]
- Ozcelik, E.; Uslu, S.; Burukoglu, D.; Musmul, A. Chitosan and blueberry treatment induces arginase activity and inhibits nitric oxide production during acetaminophen-induced hepatotoxicity. Pharmacogn. Mag. 2014, 10, S217–S224. [Google Scholar] [CrossRef]
- Li, B.; Elango, J.; Wu, W. Recent Advancement of Molecular Structure and Biomaterial Function of Chitosan from Marine Organisms for Pharmaceutical and Nutraceutical Application. Appl. Sci. 2020, 10, 4719. [Google Scholar] [CrossRef]
- Fernando, I.P.S.; Lee, W.; Han, E.J.; Ahn, G. Alginate-based nanomaterials: Fabrication techniques, properties, and applications. Chem. Eng. J. 2019, 391, 123823. [Google Scholar] [CrossRef]
- Kaushal, N.; Singh, M.; Sangwan, R.S. Flavonoids: Food associations, therapeutic mechanisms, metabolism and nanoformulations. Food Res. Int. 2022, 157, 111442. [Google Scholar] [CrossRef]
- Colombo, M.; Michels, L.R.; Teixeira, H.F.; Koester, L.S. Flavonoid delivery by solid dispersion: A systematic review. Phytochem. Rev. 2021, 21, 783–808. [Google Scholar] [CrossRef]
- Li, M.; Liu, Y.; Weigmann, B. Biodegradable Polymeric Nanoparticles Loaded with Flavonoids: A Promising Therapy for Inflammatory Bowel Disease. Int. J. Mol. Sci. 2023, 24, 4454. [Google Scholar] [CrossRef]
- Stanescu, U.; Hancianu, M.; Gird, C.E. Farmacognozie: Produse Vegetale Cu Substanțe Bioactive; Ploirom: Bucharest, Romania, 2020. [Google Scholar]
- Wu, T.-H.; Yen, F.-L.; Lin, L.-T.; Tsai, T.-R.; Lin, C.-C.; Cham, T.-M. Preparation, physicochemical characterization, and antioxidant effects of quercetin nanoparticles. Int. J. Pharm. 2008, 346, 160–168. [Google Scholar] [CrossRef]
- Jaisinghani, R.N. Antibacterial properties of quercetin. Microbiol. Res. 2017, 8, 1. [Google Scholar] [CrossRef]
- Rauf, A.; Imran, M.; Khan, I.A.; Ur-Rehman, M.; Gilani, S.A.; Mehmood, Z.; Mubarak, M.S. Anticancer potential of quercetin: A comprehensive review. Phytotherapy Res. 2018, 32, 2109–2130. [Google Scholar] [CrossRef] [PubMed]
- Vafadar, A.; Shabaninejad, Z.; Movahedpour, A.; Fallahi, F.; Taghavipour, M.; Ghasemi, Y.; Akbari, M.; Shafiee, A.; Hajighadimi, S.; Moradizarmehri, S.; et al. Quercetin and cancer: New insights into its therapeutic effects on ovarian cancer cells. Cell Biosci. 2020, 10, 32. [Google Scholar] [CrossRef]
- Nalini, T.; Basha, S.K.; Sadiq, A.M.M.; Kumari, V.S.; Kaviyarasu, K. Development and characterization of alginate/chitosan nanoparticulate system for hydrophobic drug encapsulation. J. Drug Deliv. Sci. Technol. 2019, 52, 65–72. [Google Scholar] [CrossRef]
- Nalini, T.; Basha, S.K.; Sadiq, A.M.; Kumari, V.S. In vitro cytocompatibility assessment and antibacterial effects of quercetin encapsulated alginate/chitosan nanoparticle. Int. J. Biol. Macromol. 2022, 219, 304–311. [Google Scholar] [CrossRef]
- Elbarbry, F.; Ung, A.; Abdelkawy, K. Studying the Inhibitory Effect of Quercetin and Thymoquinone on Human Cytochrome P450 Enzyme Activities. Pharmacogn. Mag. 2018, 13, S895–S899. [Google Scholar]
- Hubbard, G.P.; Wolffram, S.; De Vos, R.; Bovy, A.; Gibbins, J.M.; A Lovegrove, J. Ingestion of onion soup high in quercetin inhibits platelet aggregation and essential components of the collagen-stimulated platelet activation pathway in man: A pilot study. Br. J. Nutr. 2006, 96, 482–488. [Google Scholar]
- Lapi, D.; Vagnani, S.; Pignataro, G.; Esposito, E.; Paterni, M.; Colantuoni, A. Protective effects of quercetin on rat pial microvascular changes during transient bilateral common carotid artery occlusion and reperfusion. Front. Physiol. 2012, 3, 32. [Google Scholar] [CrossRef]
- Huang, K.-T.; Wu, C.-T.; Chang, Y.; Ho, F.-M.; Chiang, C.-K.; Liu, S.-H. Therapeutic effect of quercetin polymeric nanoparticles on ischemia/reperfusion-induced acute kidney injury in mice. Biochem. Biophys. Res. Commun. 2022, 608, 122–127. [Google Scholar] [CrossRef]
- Aluani, D.; Tzankova, V.; Kondeva-Burdina, M.; Yordanov, Y.; Nikolova, E.; Odzhakov, F.; Apostolov, A.; Markova, T.; Yoncheva, K. Evaluation of biocompatibility and antioxidant efficiency of chitosan-alginate nanoparticles loaded with quercetin. Int. J. Biol. Macromol. 2017, 103, 771–782. [Google Scholar] [CrossRef]
- Hazra, M.; Mandal, D.D.; Mandal, T.; Bhuniya, S.; Ghosh, M. Designing polymeric microparticulate drug delivery system for hydrophobic drug quercetin. Saudi Pharm. J. 2015, 23, 429–436. [Google Scholar] [CrossRef]
- Simi, S.; Saraswathi, R.; Sankar, C.; Krishnan, P.; Dilip, C.; Ameena, K. Formulation and evaluation of Albendazole microcapsules for colon delivery using chitosan. Asian Pac. J. Trop. Med. 2010, 3, 374–378. [Google Scholar] [CrossRef]
- Frenț, O.D.; Duteanu, N.; Teusdea, A.C.; Ciocan, S.; Vicaș, L.; Jurca, T.; Muresan, M.; Pallag, A.; Ianasi, P.; Marian, E. Preparation and Characterization of Chitosan-Alginate Microspheres Loaded with Quercetin. Polymers 2022, 14, 490. [Google Scholar] [CrossRef]
- Miere, F.; Teusdea, A.C.; Laslo, V.; Fritea, L.; Moldovan, L.; Costea, T.; Uivaro, D.; Vicas, S.I.; Pallag, A. Natural Polymeric Beads for Encapsulation of Stellaria Media Extract with Antioxidant Properties. J. Mater. Plast 2019, 56, 671–679. [Google Scholar] [CrossRef]
- Leucuta, S. Biofarmacie Si Farmacocinetica; Editura Dacia: Cluj-Napoca, Romania, 2002. [Google Scholar]
- *** Farmacopeea Română. Ediția a X-a; Edutura Medicală: București, Romania, 1993. [Google Scholar]
- Bhushan, B. Surface Roughness Analysis and Measurement Techniques. In Modern Tribology Handbook, Two Volume Set; CRC Press: Boca Raton, FL, USA, 2000; pp. 79–150. [Google Scholar]
- Pascu, B.; Ardean, C.; Davidescu, C.M.; Negrea, A.; Ciopec, M.; Duțeanu, N.; Negrea, P.; Rusu, G. Modified Chitosan for Silver Recovery—Kinetics, Thermodynamic, and Equilibrium Studies. Materials 2020, 13, 657. [Google Scholar] [CrossRef] [PubMed]
- The United States Pharmacopoeia and National Formulary USP38-NF33; The United States Pharmacopoeial Convention: Rockville, MD, USA, 2015.
- Benkova, M.; Soukup, O.; Marek, J. Antimicrobial susceptibility testing: Currently used methods and devices and the near future in clinical practice. J. Appl. Microbiol. 2020, 129, 806–822. [Google Scholar] [CrossRef] [PubMed]
- Matuschek, E.; Brown, D.F.J.; Kahlmeter, G. Development of the EUCAST disk diffusion antimicrobial susceptibility testing method and its implementation in routine microbiology laboratories. Clin. Microbiol. Infect. 2014, 20, O255–O266. [Google Scholar] [CrossRef] [PubMed]
- Memete, A.R.; Ioan, S.; Cristian, T.A.; Ruben, B.; Mariana, B.; Ioana, V.S. Bioactive Compounds and Antioxidant Capacity of Several Blackberry (Rubus spp.) Fruits Cultivars Grown in Romania. Horticulturae 2023, 9, 556. [Google Scholar] [CrossRef]
- Uyen, N.T.T.; Hamid, Z.A.A.; Tram, N.X.T.; Ahmad, N. Fabrication of alginate microspheres for drug delivery: A review. Int. J. Biol. Macromol. 2019, 153, 1035–1046. [Google Scholar] [CrossRef]
- Yang, Y.-Y.; Chung, T.-S.; Bai, X.-L.; Chan, W.-K. Effect of preparation conditions on morphology and release profiles of biodegradable polymeric microspheres containing protein fabricated by double-emulsion method. Chem. Eng. Sci. 2000, 55, 2223–2236. [Google Scholar] [CrossRef]
- Karthick, V.; Panda, S.; Kumar, V.G.; Kumar, D.; Shrestha, L.K.; Ariga, K.; Vasanth, K.; Chinnathambi, S.; Dhas, T.S.; Suganya, K.U. Quercetin loaded PLGA microspheres induce apoptosis in breast cancer cells. Appl. Surf. Sci. 2019, 487, 211–217. [Google Scholar] [CrossRef]
- Liu, C.-J.; Yao, L.; Hu, Y.-M.; Zhao, B.-T. Effect of Quercetin-Loaded Mesoporous Silica Nanoparticles on Myocardial Ischemia-Reperfusion Injury in Rats and Its Mechanism. Int. J. Nanomed. 2021, 16, 741–752. [Google Scholar] [CrossRef] [PubMed]
- Nalini, T.; Basha, S.K.; Sadiq, A.M.; Kumari, V.S. Pectin/chitosan nanoparticle beads as potential carriers for quercetin release. Mater. Today Commun. 2022, 33, 104172. [Google Scholar] [CrossRef]
- Devi, N.; Kakati, D.K. Smart porous microparticles based on gelatin/sodium alginate polyelectrolyte complex. J. Food Eng. 2013, 117, 193–204. [Google Scholar] [CrossRef]
- Shivhare, U.D.; Singare, S.S.; Mathur, V.B. Formulation and evaluation of microspheres for immediate and sustained release of different drugs using same polymer. Int. J. Pharm Dev. Technol. 2014, 4, 1–7. [Google Scholar]
- Suryavanshi, V.; Suresh, P.K.; Das, C.; Maharana, T. Physicochemical properties and in-vitro release study of CFLE-chitosan microsphere beads. J. Polym. Res. 2019, 26, 288. [Google Scholar] [CrossRef]
- Cahyaningrum, S.E.; Herdyastuti, N.; Qomariah, N. Synthesis and Characterization of Chitosan- Alginate for Controlled Release of Isoniazid Drug. Indones. J. Chem. 2015, 15, 16–21. [Google Scholar] [CrossRef][Green Version]
- Cheng, B.; Li, D.; Huo, Q.; Zhao, Q.; Lan, Q.; Cui, M.; Pan, W.; Yang, X. Two kinds of ketoprofen enteric gel beads (CA and CS-SA) using biopolymer alginate. Asian J. Pharm. Sci. 2017, 13, 120–130. [Google Scholar] [CrossRef]
- George, M.; Abraham, T.E. Polyionic hydrocolloids for the intestinal delivery of protein drugs: Alginate and chitosan—A review. J. Control. Release 2006, 114, 1–14. [Google Scholar] [CrossRef]
- Goh, C.H.; Heng, P.W.S.; Chan, L.W. Alginates as a useful natural polymer for microencapsulation and therapeutic applications. Carbohydr. Polym. 2012, 88, 1–12. [Google Scholar] [CrossRef]
- Guo, S.; Liang, Y.; Liu, L.; Yin, M.; Wang, A.; Sun, K.; Li, Y.; Shi, Y. Research on the fate of polymeric nanoparticles in the process of the intestinal absorption based on model nanoparticles with various characteristics: Size, surface charge and pro-hydrophobics. J. Nanobiotechnol. 2021, 19, 32. [Google Scholar] [CrossRef]
- Souza, M.P.; Vaz, A.F.M.; Silva, H.D.; Cerqueira, M.A.; Vicente, A.A.; Carneiro-Da-Cunha, M.G. Development and Characterization of an Active Chitosan-Based Film Containing Quercetin. Food Bioprocess Technol. 2015, 8, 2183–2191. [Google Scholar] [CrossRef]
- Kulkarni, P.G.; Paudel, N.; Magar, S.; Santilli, M.F.; Kashyap, S.; Baranwal, A.K.; Zamboni, P.; Vasavada, P.; Katiyar, A.; Singh, A.V. Overcoming Challenges and Innovations in Orthopedic Prosthesis Design: An Interdisciplinary Perspective. Biomed. Mater. Devices 2023. [Google Scholar] [CrossRef] [PubMed]
- Gatto, M.T.; Falcocchio, S.; Grippa, E.; Mazzanti, G.; Battinelli, L.; Nicolosi, G.; Lambusta, D.; Saso, L. Antimicrobial and Anti-Lipase Activity of Quercetin and its C2-C16 3-O-Acyl-Esters. Bioorganic Med. Chem. 2002, 10, 269–272. [Google Scholar] [CrossRef] [PubMed]
- Yong, H.; Bai, R.; Bi, F.; Liu, J.; Qin, Y.; Liu, J. Synthesis, characterization, antioxidant and antimicrobial activities of starch aldehyde-quercetin conjugate. Int. J. Biol. Macromol. 2020, 156, 462–470. [Google Scholar] [CrossRef]
- Cushnie, T.P.T.; Lamb, A.J. Antimicrobial activity of flavonoids. Int. J. Antimicrob. Agents 2005, 26, 343–356. [Google Scholar] [CrossRef]
- Nguyen, T.L.A.; Bhattacharya, D. Antimicrobial Activity of Quercetin: An Approach to Its Mechanistic Principle. Molecules 2022, 27, 2494. [Google Scholar] [CrossRef]


Disclaimer/Publisher’s Note: The statements, opinions and data contained in all publications are solely those of the individual author(s) and contributor(s) and not of MDPI and/or the editor(s). MDPI and/or the editor(s) disclaim responsibility for any injury to people or property resulting from any ideas, methods, instructions or products referred to in the content. |
© 2023 by the authors. Licensee MDPI, Basel, Switzerland. This article is an open access article distributed under the terms and conditions of the Creative Commons Attribution (CC BY) license (https://creativecommons.org/licenses/by/4.0/).