Article

Comparison of the Physical Properties and Electronic Structure of Nb2B3 and Ta2B3

1
College of Semiconductors and Physics, North University of China, Taiyuan 030051, China
2
College of Materials Science and Engineering, North University of China, Taiyuan 030051, China
*
Author to whom correspondence should be addressed.
Coatings 2023, 13(8), 1302; https://doi.org/10.3390/coatings13081302
Submission received: 27 June 2023 / Revised: 15 July 2023 / Accepted: 19 July 2023 / Published: 25 July 2023

Abstract

:
Based on the first-principles method, the effects of pressure and temperature on the physical properties of Nb2B3 and Ta2B3 were discussed. The approximate linear increase in B, G, and E with pressure was observed for Nb2B3 and Ta2B3 with a minor difference for bulk modulus and similar values for shear and Young’s modulus. Nb2B3 shows higher Vickers hardness and similar fracture toughness as compared with Ta2B3. An abnormal phenomenon of the simultaneous increase in hardness and B/G (σ) with the increased pressure was observed. The strong anisotropies of bulk, Young’s, and shear modulus were observed, and the differences of anisotropy between Nb2B3 and Ta2B3 increased with pressure. At low temperatures, the α of Nb2B3 is smaller than that of Ta2B3, but is larger than that of Ta2B3 at high temperatures. The Θ of Nb2B3 are larger than those of Ta2B3 under the same conditions. The combination of relatively high Vickers hardness and fracture toughness is determined by the metallic bond and covalent bond. With the increased pressure, Nb2B3 possesses the greater strength of B–B bonds than Ta2B3, which leads to its high hardness and Debye temperature.

1. Introduction

As a potential superhard metal, transition metal borides (TMBs) have received extensive interest due to their excellent mechanical, thermal, and chemical properties [1,2,3,4,5,6,7,8,9,10,11,12]. Especially, compared with the traditional superhard material, their metallic character provides outstanding electrical (thermal) conductivity, thus it is easily shaped post-synthesis by electric discharge machining. For TMBs, the high hardness is attributed to the high valence-electron concentration of TM atoms and strong covalent bonds of B atoms formed [8]. Thus, some researchers have focused on the effect of valence electron concentration (VEC) and B atom content for the hardness [9,10,11,12]. Contrary to the common opinion that there is a positive correlation between hardness and VEC, Liang et al. found the maximum hardness approaching 40 GPa when the VEC was ~8 electrons per formula unit for transition metal monoborides [9]. Li et al. found that boron content did not positively correlate to hardness in WBn (n = 2,3,4) compounds; this intriguing behavior originated from the different bonding configurations of B atoms formed [10]. By replacing the W of WB with Ta sites, the high hardness ~42.8 GPa under 0.49 N was achieved in W0.5Ta0.5B [11]. It was also found that the low B content increased the hardness, whereas the high B content reduced the hardness of TM1−xBx (TM = V, Nb and Ta) [12]. Based on these studies, it is meaningful to study the TMBs with low B content for superhard metals.
As an important family of TMBs, it is meaningful to study the physical properties of 5d-series transition metal borides with low B content. Thus, in this study, the mechanical and thermal properties (such as the polycrystalline elastic moduli, hardness, fracture toughness, Poisson’s ratio σ, the volume thermal expansion coefficient, and Debye temperature) and elastic anisotropy of Nb2B3 and Ta2B3 under high pressure and temperature are investigated and compared. For a further understanding the physical properties, the electronic structure is also discussed to investigate the underlying micro-mechanism.

2. Results and Discussion

2.1. Equilibrium Structure

The space group of Nb2B3 and Ta2B3 with an orthorhombic structure is Cmcm (No. 63); see Figure 1. The optimized lattice constants are in good agreement with the available results (see Table 1), indicating that the parameters used in our calculations are reliable.

2.2. Physical Properties

The stress–strain relationship is used to calculate the elastic constants with six strain steps for the optimized structures [14]. Nb2B3 and Ta2B3 are mechanically stable under the considered pressure based on the mechanical stability criteria [15]. The polycrystalline bulk modulus B and shear modulus G are determined using the elastic constants using the Voigt–Reusse–Hill (VRH) approximation [16], and the Young’s modulus E and Poisson’s ratio σ are obtained according to the bulk and shear modulus [17]. An empirical model proposed by Chen et al. is used to predict the Vickers hardness of the material [18]. The fracture toughness is estimated according to Niu’s model K IC = α V 1 / 6 G B / G 1 / 2 , α = 1 for transition metal borides, the unit of volume V is m3, and that of shear and bulk modulus G and B are MPa [19], which measures the resistance-to-crack propagation of a material. The variation trends of polycrystalline bulk modulus B, shear modulus G, Young’s modulus E, Vickers hardness HV, fracture toughness KIC, Poisson’s ratio σ, and ratio B/G of Nb2B3 and Ta2B3 are shown in Figure 2. The bulk modulus expresses the resistance to volume change under hydrostatic pressure and reflects the incompressibility of materials. The shear modulus correlates the shape change under shear force and reflects the ability of resistance to the shape change of materials. Young’s modulus provides the resistance to tensile (compressive) deformations and reflects the stiffness of materials. It can be seen that the approximate linear dependence of pressure of B, G, and E for Nb2B3 and Ta2B3 is observed. Under pressure, the increase in G is slower than that of B and E. The small shear modulus is determined by the small elastic constants C44 and C66, indicating the low resistance to shear deformation. The difference in bulk modulus between Nb2B3 and Ta2B3 is very small, while that between shear and Young’s modulus is nearly negligible.
It is important to characterize hardness and fracture toughness for the wear-resistance of materials. The hardness increases slowly with the increased pressure, but the increased speed of Nb2B3 is slower than that of Ta2B3. In addition, the values of hardness of Nb2B3 are larger than those of Ta2B3 under the same pressure. The fracture toughness increases rapidly with pressure. At low pressures, the values of Nb2B3 and Ta2B3 are equal, but minor differences appear with the increased pressure. When P~100 GPa, the fracture toughness exceeds the experimental values of diamond 5.3–6.7 MPa·m0.5 [19]. The high hardness and fracture toughness make it suitable for drill bits or ballistic vests.
The values of B/G and Poisson’s ratio σ are used to estimate the ductile (brittle) behavior of a material [20,21]. For brittle materials, B/G < 1.75 or σ < 0.26. As can be seen from Figure 2c, Nb2B3 and Ta2B3 show brittle behavior, though σ and B/G increase with pressure. The ductile feature of Ta2B3 is superior to that of Nb2B3. The counterintuitive phenomenon of the simultaneous increase in hardness and ductility with the increased pressure makes it applicable in the mechanical processing area, which is different from the previously reported results [22,23,24].
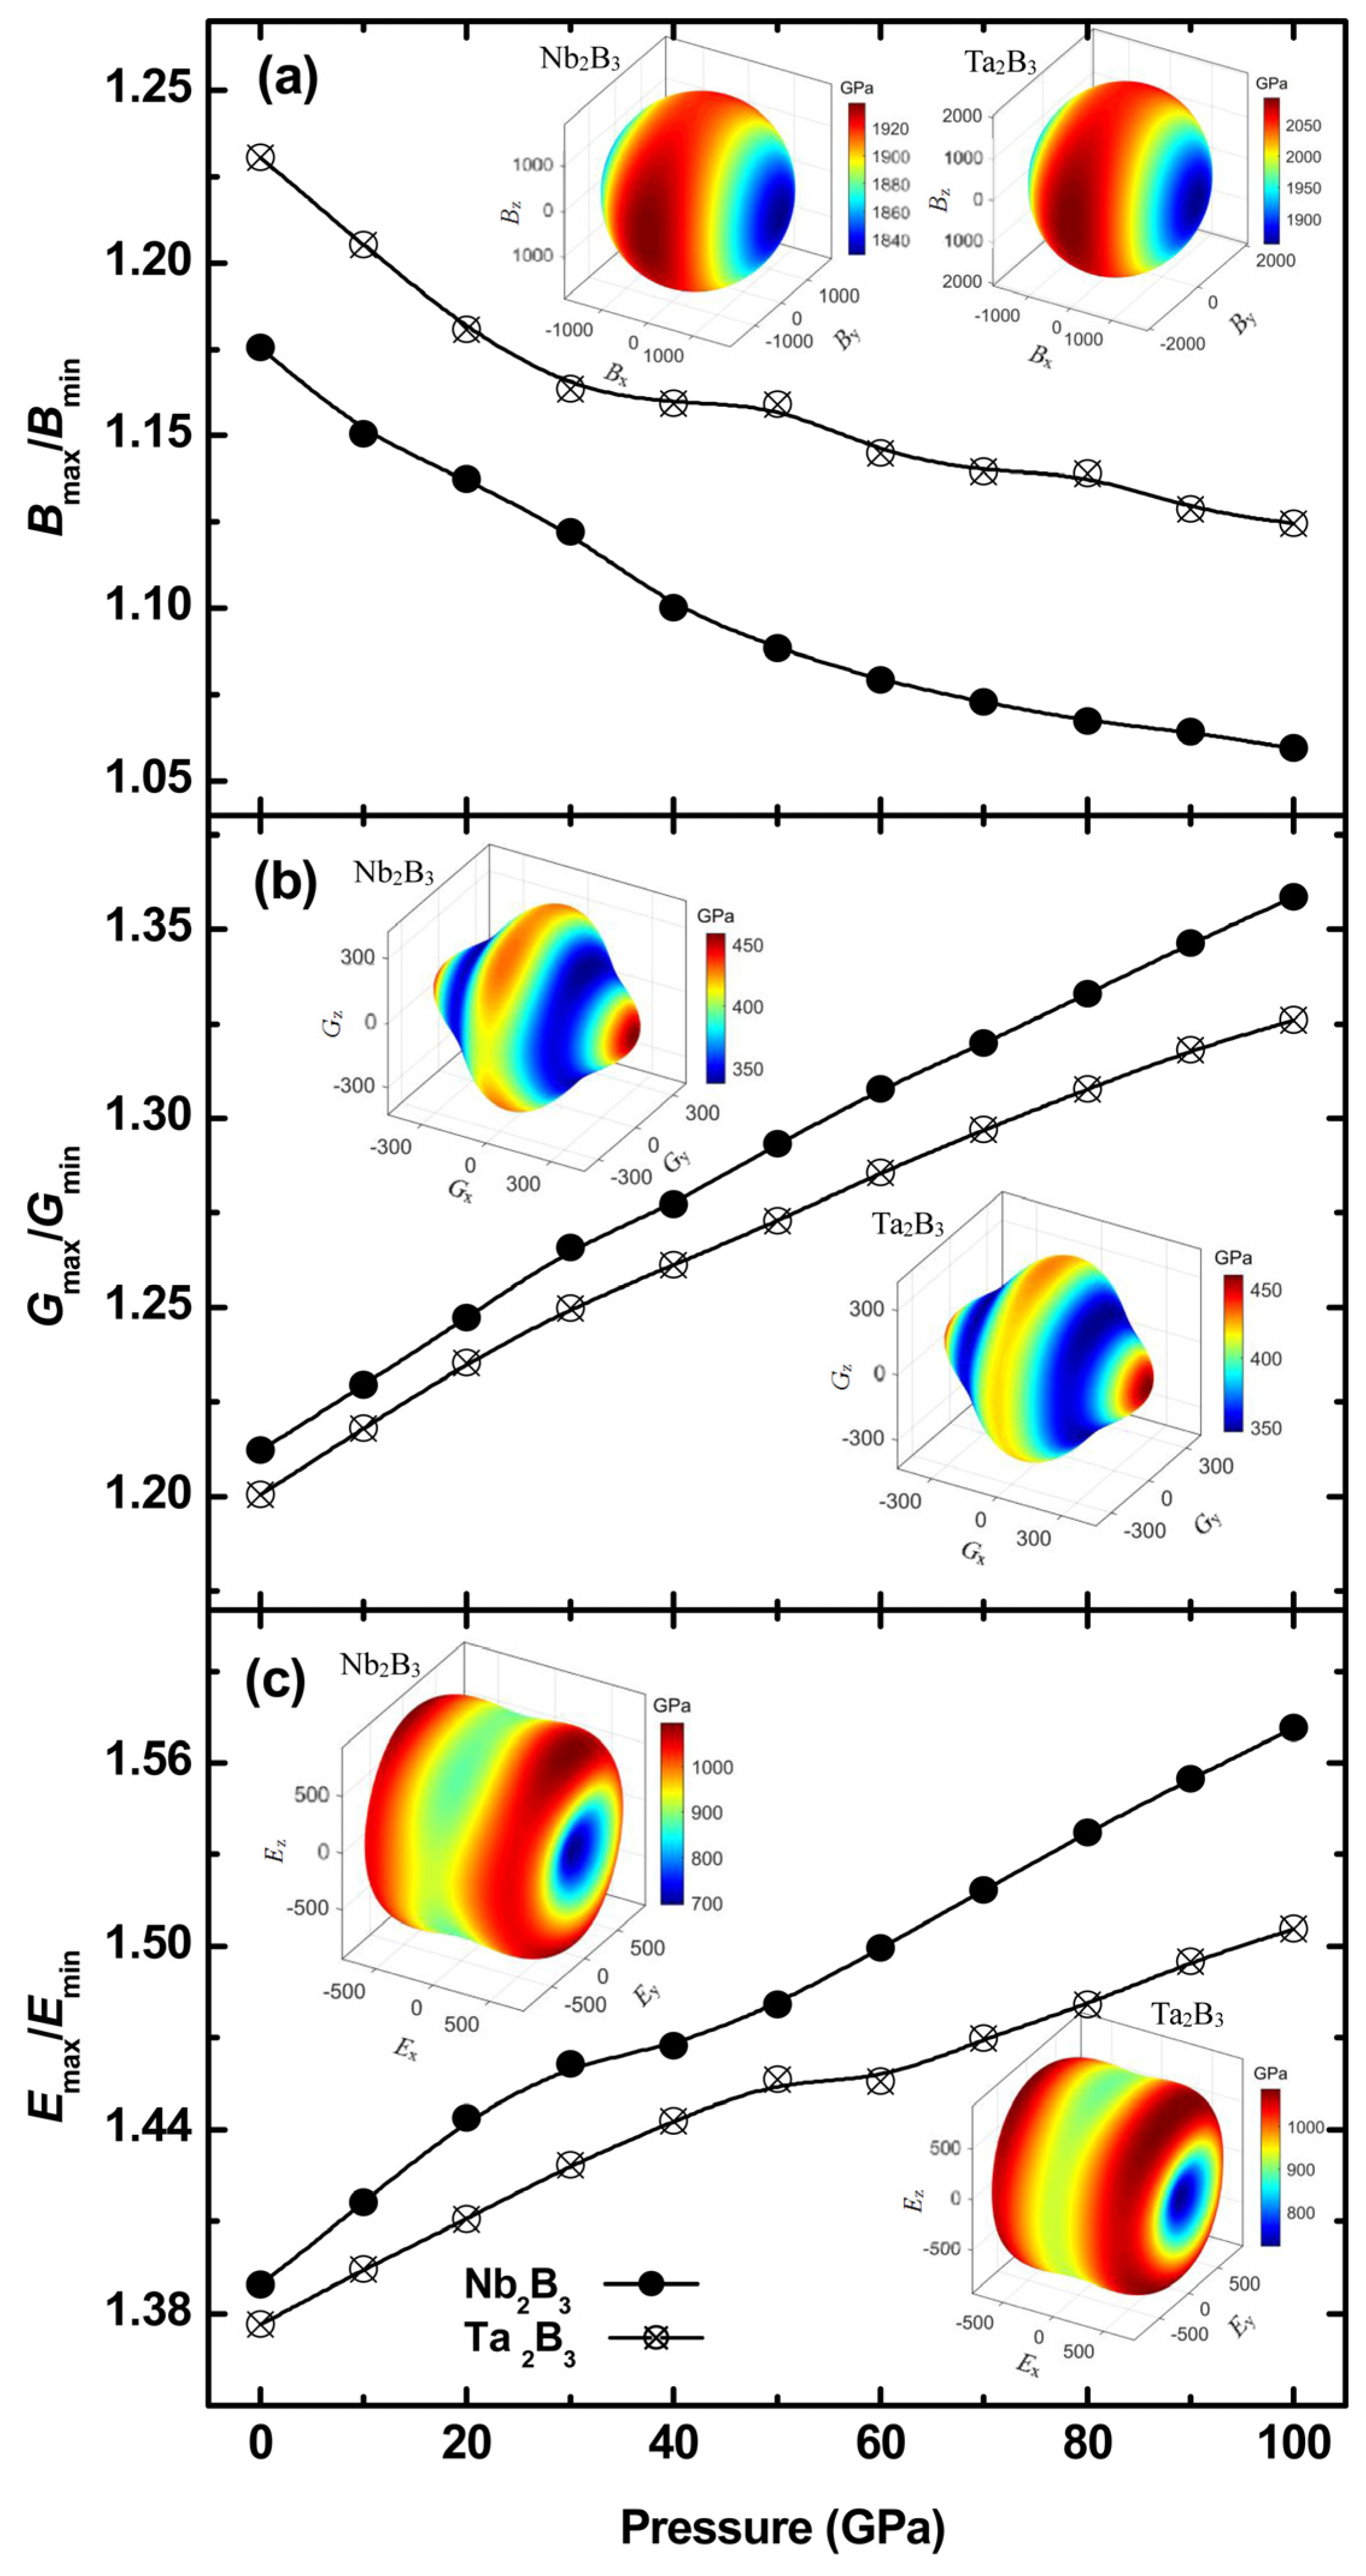
Figure 3 shows the effects of pressure on elastic anisotropy of Nb2B3 and Ta2B3 based on the ratio of maximum to minimum of directional bulk and Young’s and shear modulus Bmax/Bmin, Gmax/Gmin, Emax/Emin. As a representative 3D orientation dependence on bulk, shear and Young’s modulus of Nb2B3 and Ta2B3 at 100 GPa are given. Due to the same atom arrangement, 3D plots of Nb2B3 and Ta2B3 present similar shapes. The blue expresses the shrink and the red expresses the bulge. The obvious shrink meant larger axial compressibility along the [100] direction (see the inset of Figure 3a) is attributed to small C11, and appearance of small difference along the [010] and [001] directions is due to the relatively small C22 compared with C33. The bulge along the [100] direction (see the inset of Figure 3b) makes it difficult to slip along x direction. These results are correlated to the layer structure along the x axis with B–B covalent bond in the yz plane. It can be seen that the anisotropy of the bulk modulus decreases, while the anisotropy of shear and Young’s modulus increases with pressure. Furthermore, the differences of anisotropy between Nb2B3 and Ta2B3 increase with pressure.
The thermodynamic properties are calculated using the quasi-harmonic Debye model implemented in the Gibbs program [25]. Figure 4 shows the temperature dependences of volume thermal expansion coefficient α at different pressures for Nb2B3 and Ta2B3. The pressure influences the increased speed of α with temperature. At fixed pressure, α increases rapidly above ~100 K, and gradually slows down at high temperatures. Furthermore, the increased speed of α with the temperature of Nb2B3 and Ta2B3 is different. Thus, the α of Nb2B3 is smaller than that of Ta2B3 at low temperatures and gradually larger than that of Nb2B3 at high temperatures. When the pressure increases, α decreases for a given temperature.
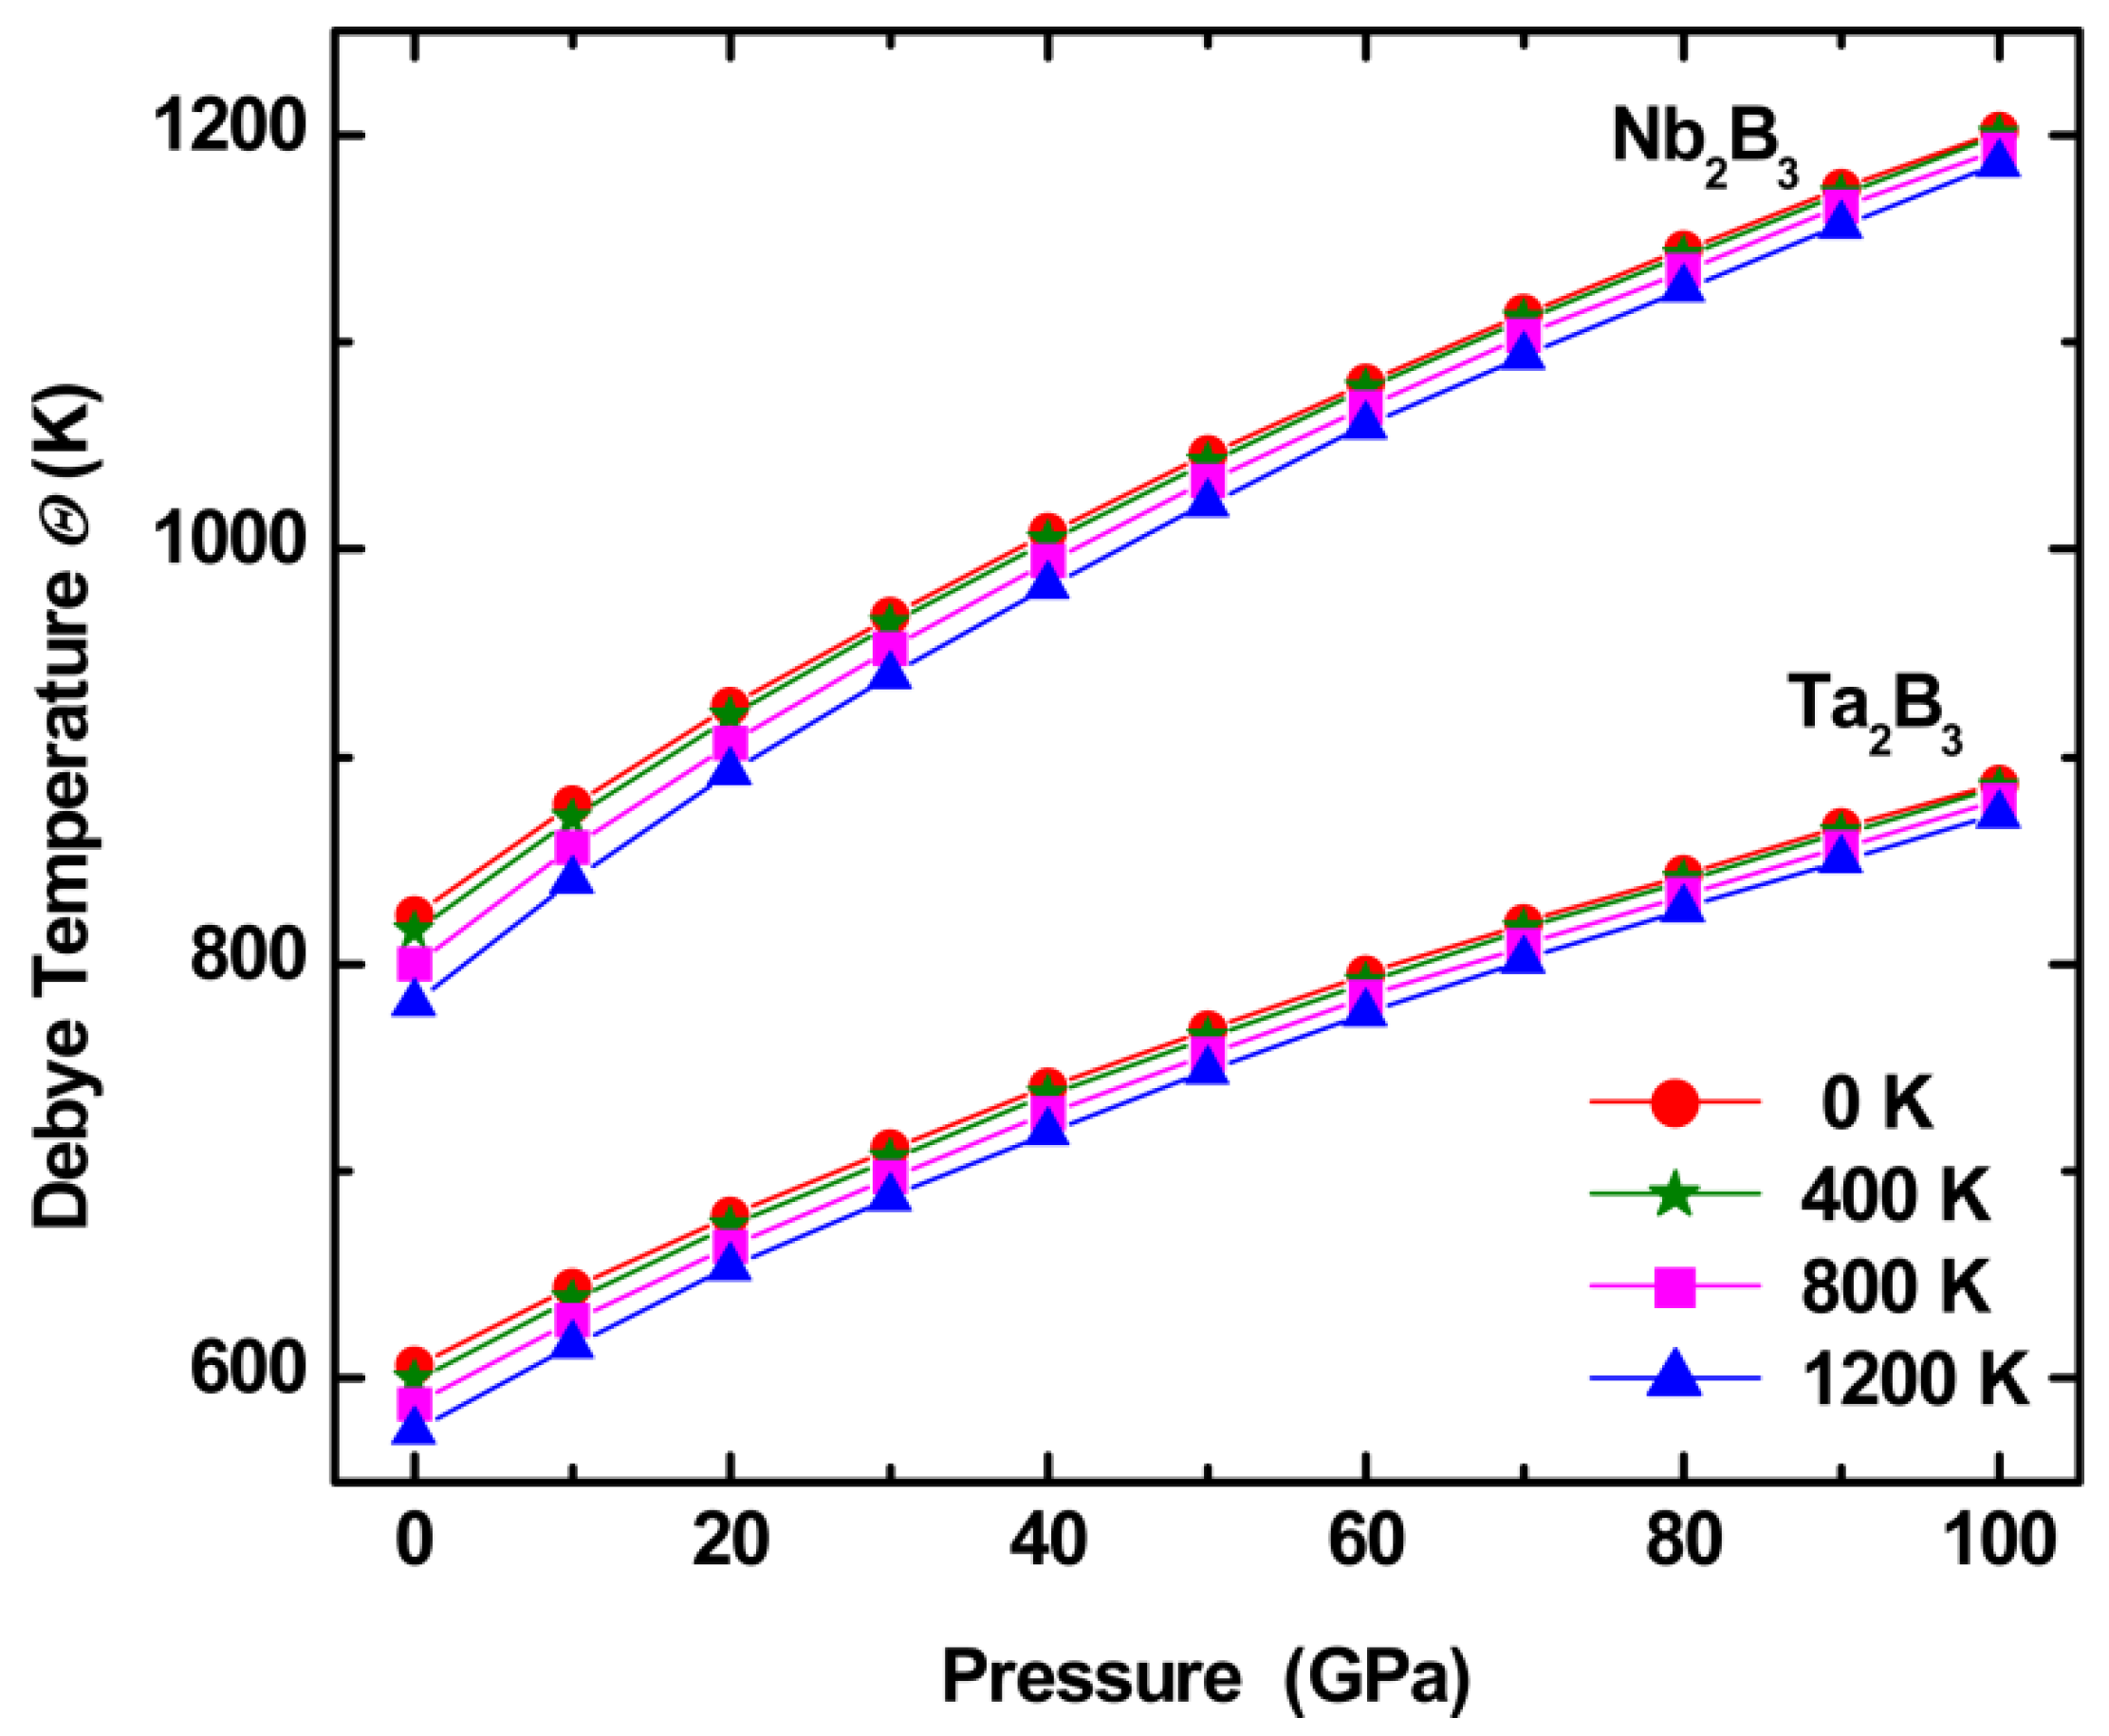
Figure 5 shows the pressure dependences of Debye temperature for Nb2B3 and Ta2B3 at different temperatures. The Debye temperature Θ of Nb2B3 and Ta2B3 at 0 GPa and 0 K is 823.2 K and 605.9 K, in line with the results 833.4 K and 610.4 K based on the equation using the first principles [26]:
Θ D = h k B 3 n 4 π ρ N A M 1 / 3 v m
where h is Planck’s constant, n is the number of atoms per molecule, ρ is the density, NA is the Avogadro number, kB is Boltzmann’s constant, M is the molecular molar mass, and v m = 2 / v t 3 + 1 / v l 3 / 3 1 / 3 is the average sound velocity with v t = G / ρ (transverse acoustic wave velocity) and v l = 3 B + 4 G / 3 ρ (longitudinal acoustic wave velocity).
At a given temperature, the increased speed with pressure of Θ for Nb2B3 is faster than that of Ta2B3. At a given pressure, the values decrease slightly with temperature. The effect of temperature is small and gradually diminishes with the increased pressure. For the same conditions, the values of Nb2B3 are larger than Ta2B3. Based on the Callaway–Debye theory, the minimum thermal conductivity is correlated to the Debye temperature [26]. So, Nb2B3 will possess a larger minimum thermal conductivity than that of Ta2B3.

2.3. Electronic Structure

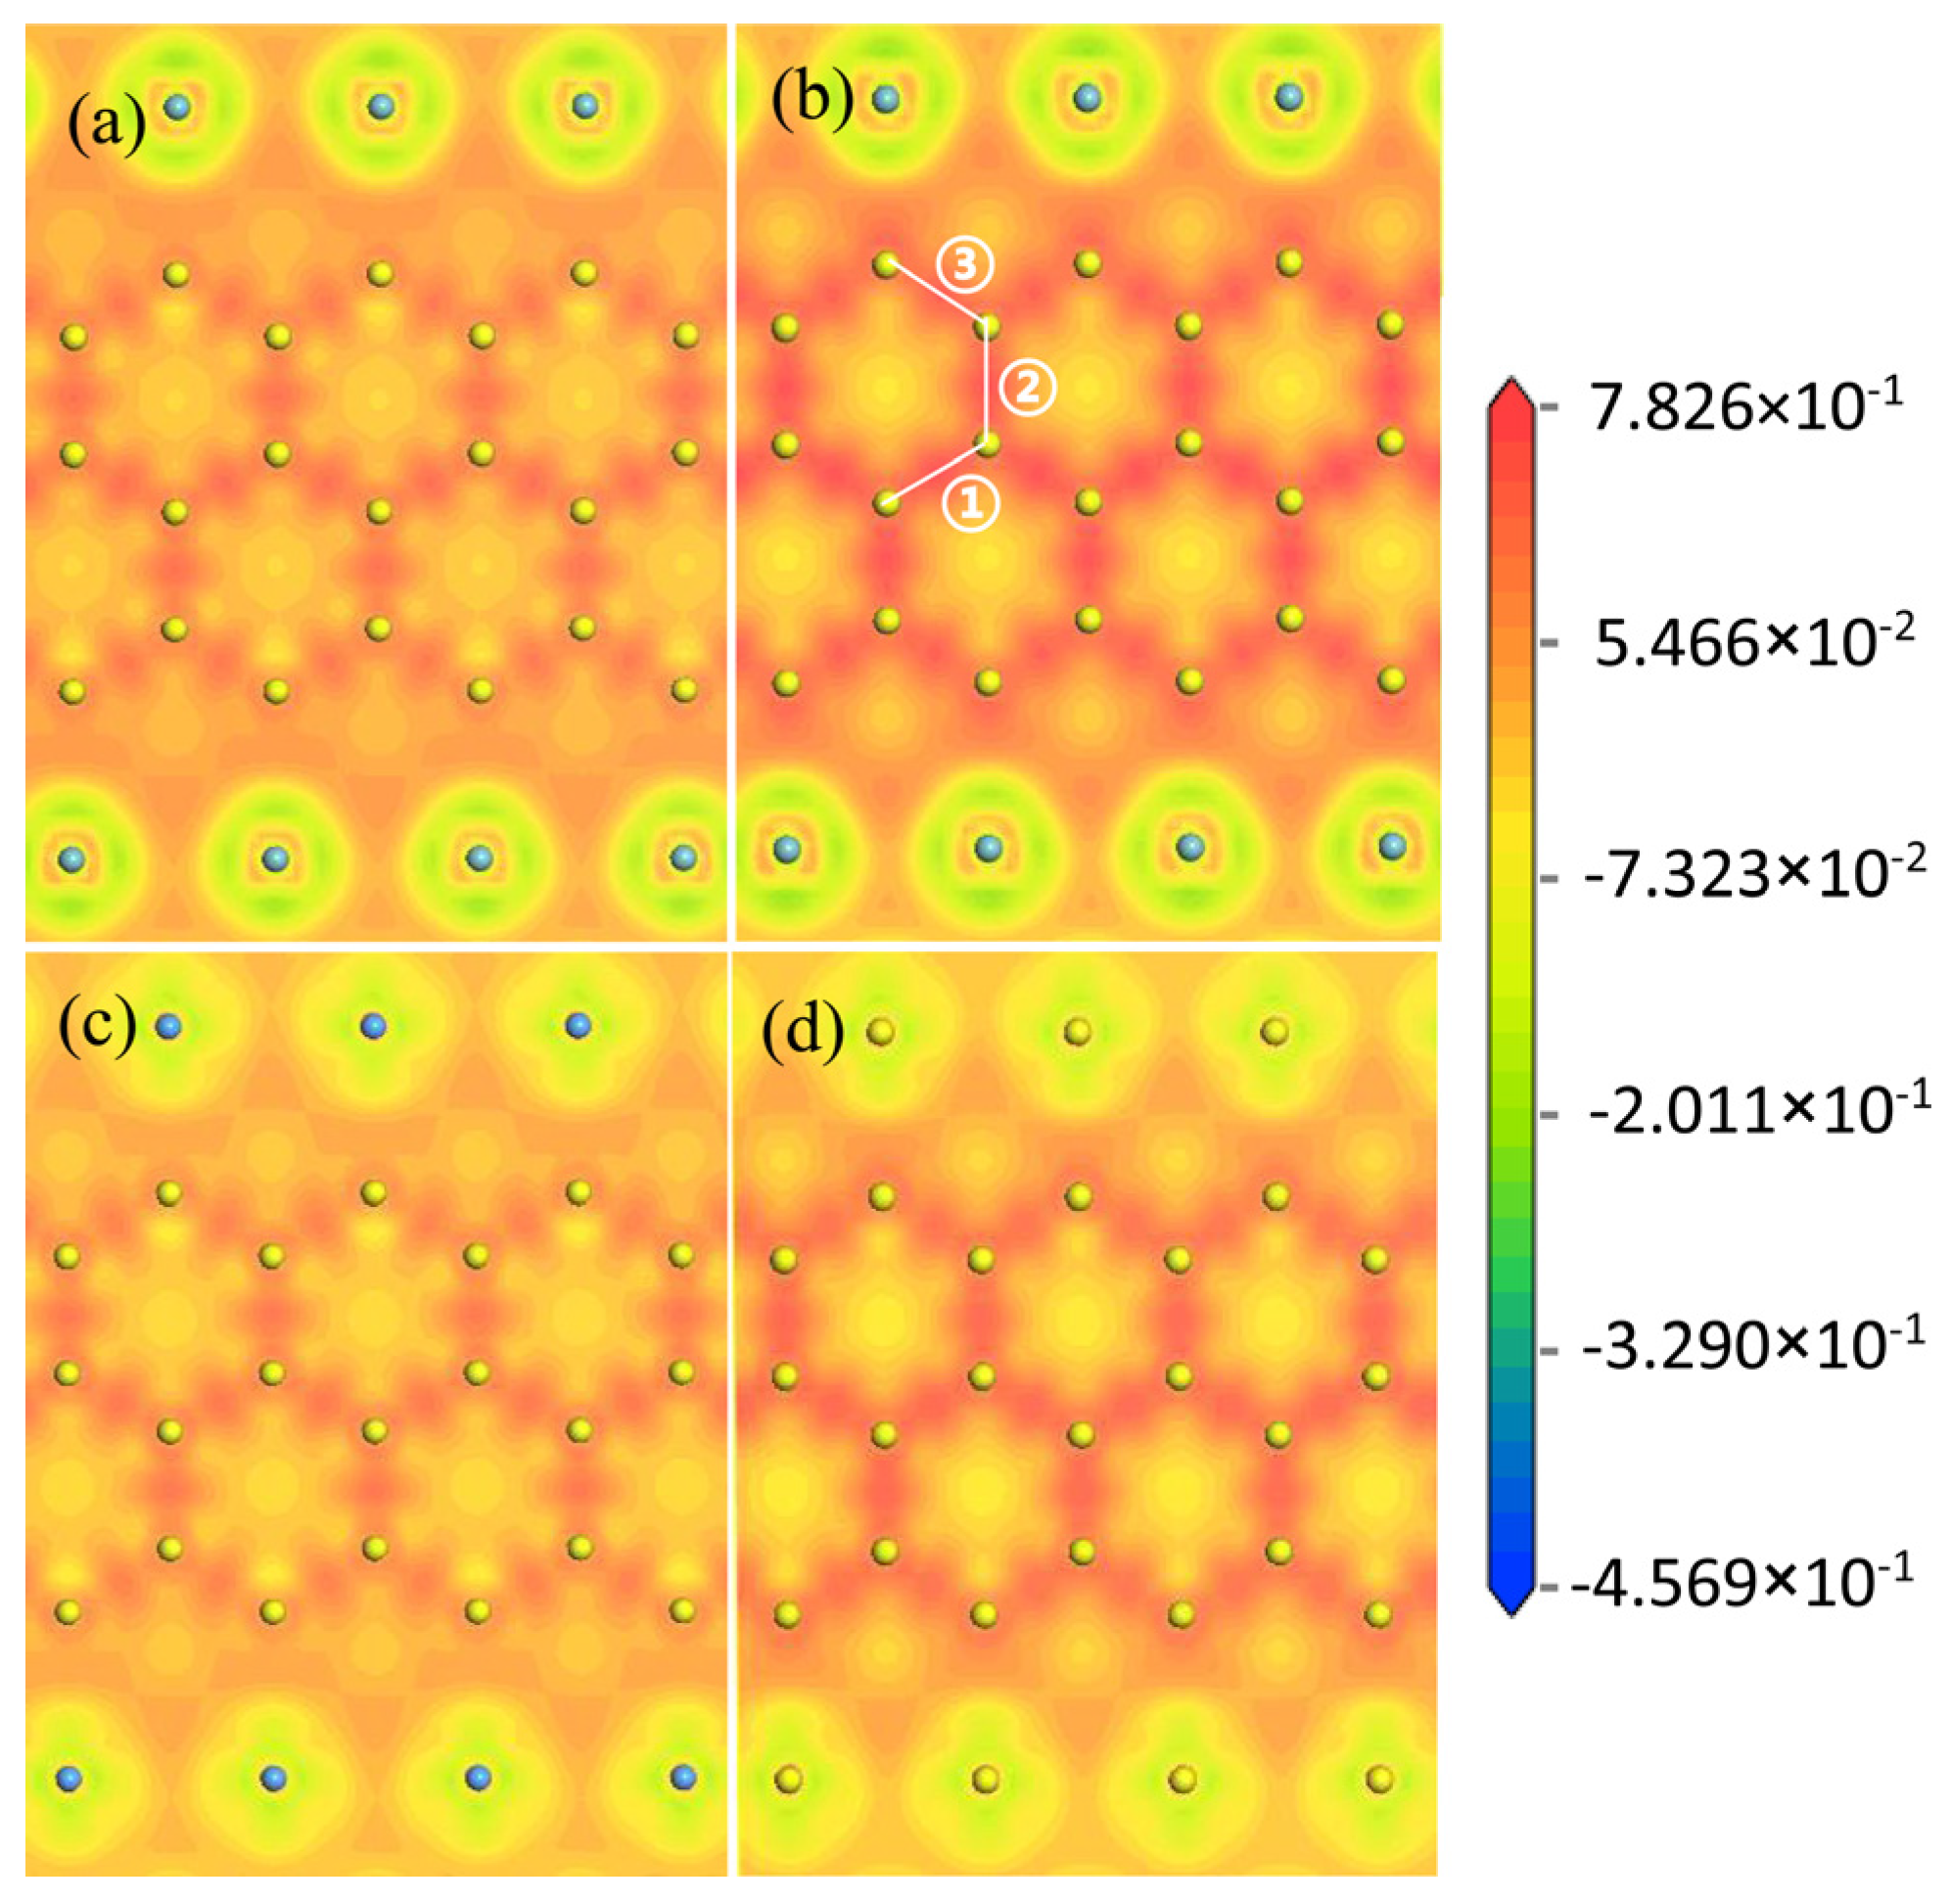
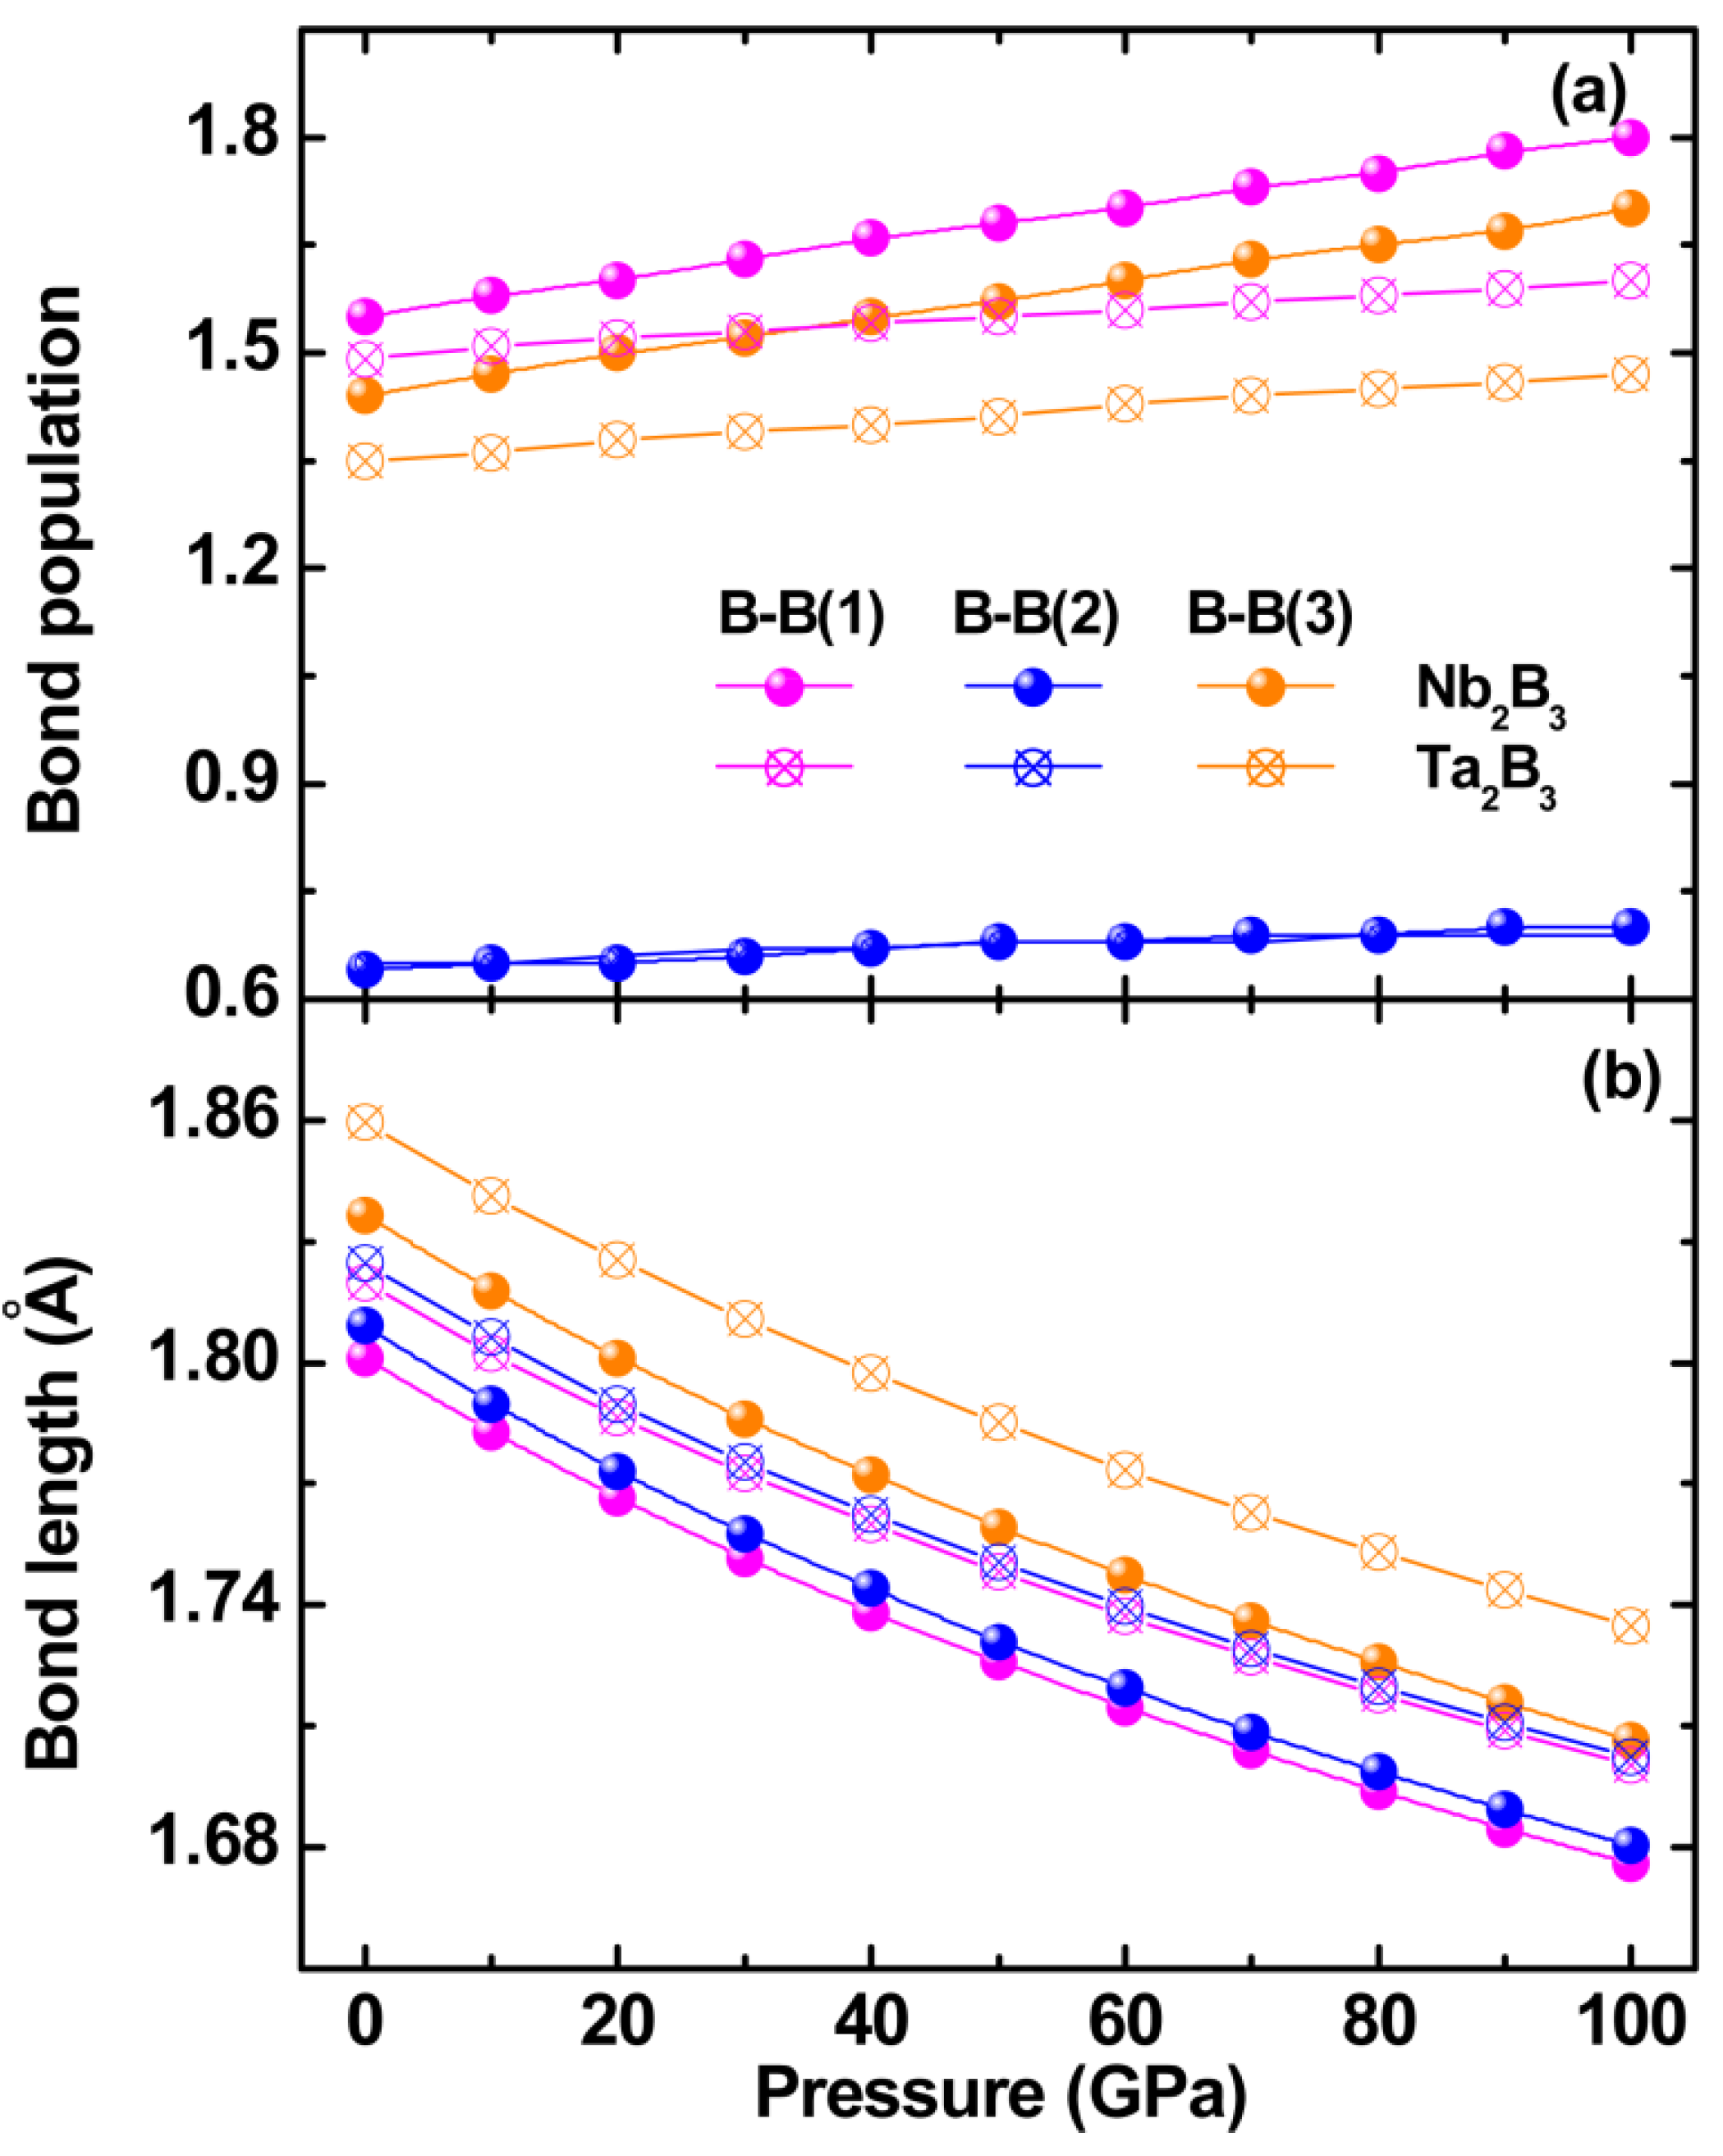
To uncover the origin of physical properties, the bonding nature of materials is investigated. The energies of Fermi level EF are 2.91 (2.19) electrons/eV and 2.67 (2.00) electrons/eV at 0 (100) GPa for Nb2B3 and Ta2B3, respectively. The nonzero values point to a metallic feature. Previous works indicated that the hardness of TM borides was mainly determined by the B–B and B–TM bonds [27]. Figure 6 shows the electron density differences in the (100) plane of Nb2B3 and Ta2B3 under different pressures. The electrons (red region) distribute in the interstitial region around the Nb(Ta) atom, indicating a typical metallic-like bond. The electron accumulations between B–B atoms and B–Nb (Ta) atoms indicate the covalent interaction. According to the structural feature, the ring structure formed with six B atoms shows three different bonds. With the increased pressure, the electron accumulations between B–B atoms and B–Nb (Ta) atoms increase, meaning the increased strength of B–B bonds and B–Nb (Ta) bonds with pressure. Furthermore, the strength of B–Nb (Ta) covalent bonds is weaker than that of covalent B–B bonds. The larger electron accumulation between B–Nb atoms than that of B–Ta atoms means that the strength of the B–Nb bond is greater than that of the B–Ta bond. The positive bond populations of B–B atoms gradually increase with pressure, and the bond lengths decrease; see Figure 7. These results also show that pressure enhances the strength of B–B covalent bonds. Under the same pressure, Nb2B3 shows relatively larger bond populations and shorter bond lengths than that of Ta2B3, thus possesses strong covalent interactions between B–B atoms. Table 2 gives the atomic bond populations, bond lengths, and atomic Mulliken charge of B–Nb (Ta) bonds for Nb2B3 and Ta2B3. It can be found that there is positive a bond population between B and Nb (Ta), but the values are small and the bond lengths are relatively longer compared with B–B bonds. These results explain the weaker strength of B–Nb (Ta) covalent bonds than that of covalent B–B bonds. With the increased pressure, the number of covalent bonds decreases, and the bond lengths and bond populations decrease. So, the increased strength of B–Nb(Ta) with pressure is attributed the decreased bond length. Compared to B–Nb bonds, the number of covalent bonds in B–Ta bonds is small, and the bond lengths and bond populations increase. So, the weak strength of B–Ta covalent bonds is attributed to the longer bond lengths and lower number of covalent bonds.
In addition, there is electron accumulation (red region) around B atoms and electron depletion (blue region) around Nb (Ta) atoms, creating electron transportation from Nb (Ta) atoms to B atoms; see Figure 6. Thus, there is an ionic feature of B–Nb(Ta) bonds, which can also be obtained from Table 2. B atoms gain electrons, while Nb(Ta) atoms lose electrons. With the increased pressure, the increased transferred electrons and short bond length indicate that the ionic feature becomes stronger. Furthermore, the number of transferred electrons from Nb to B is smaller than that from Ta to B at 0 GPa, indicating that the ionic bonding strength of B–Ta bonds is stronger than that of B–Nb bonds. But, with the increased pressure, the difference of transferred electrons disappears.
Based on the above discussions, the interatomic interaction of Nb2B3 and Ta2B3 is mainly determined by metallic bonds, covalent bonds, and some ionic bonds, which lead to high Vickers hardness and fracture toughness. The covalent interaction of B–B bonds is stronger than that of B–Nb(Ta) bonds. With the increased pressure, the strength of interactions increases. Nb2B3 possesses stronger interatomic interaction than Ta2B3, which leads to the high hardness and Debye temperature.

3. Methods and Computation Details

The space group of Nb2B3 and Ta2B3 is Cmcm (No. 63). In this work, the first-principles method implemented in MedeA VASP code was used [28]. The Perdew-Burke-Ernzerh (PBE) form within the generalized gradient approximation (GGA) was adopted to describe the exchange correlation energy in the electron–electron interaction [29]. The valence electrons considered in the atom pseudo potential calculation were Nb:4p64d45s1, Ta:5p35d36s2, and B:2s22p1, respectively. In all calculations, the cutoff energy for the plane wave expansion was selected as 550 eV with Monkhorst-Pack k point meshes of less than 0.015Å−1 for Brillouin zone sampling [30]. The structure reached the convergence state with the total energy 5.0 × 10⁻⁶ eV/atom, maximum force per atom 0.01 eV/Å, maximum stress 0.02 GPa, and maximum displacement 5.0 × 10⁻⁴Å, respectively.

4. Conclusions

The effects of pressure and temperature on the physical properties of Nb2B3 and Ta2B3 are investigated based on the first-principles method. The approximate linear increase in B, G, and E with pressure is observed for Nb2B3 and Ta2B3 with a minor difference for bulk modulus and similar values for shear and Young’s modulus. Nb2B3 is more suitable for drill bits or ballistic vests due to its high Vickers hardness and similar fracture toughness as compared to Ta2B3. Although Nb2B3 and Ta2B3 show the brittle behavior, the values of B/G and Poisson’s ratio σ increase as pressure increases. The simultaneous increase in hardness and ductility with the increased pressure makes it applicable in some mechanical processing area. The strong anisotropy of the bulk, Young’s, and shear modulus is observed, and the differences in anisotropy between Nb2B3 and Ta2B3 increase with pressure. The effect of temperature is opposite to that of pressure for the volume thermal expansion coefficient α and Debye temperature Θ. At low temperatures, the α of Nb2B3 is smaller than that of Ta2B3, but is larger than that of Ta2B3 at high temperatures. The values of Θ for Nb2B3 are larger than that of Ta2B3 under the same conditions. The interatomic interaction of Nb2B3 and Ta2B3 is determined by metallic bonds, covalent bonds, and some ionic bonds. The high hardness and Debye temperature of Nb2B3 are mainly derived from the strong covalent interaction of B–B atoms. We expect that these results are meaningful for the further study of superhard metals.

Author Contributions

Conceptualization, Y.Z.; formal analysis, Y.Z.; funding acquisition, X.Z.; visualization, H.W. and X.W.; writing—original draft, Y.Z.; writing—review and editing, Y.G. All authors have read and agreed to the published version of the manuscript.

Funding

This research was funded by the National Natural Science Foundation of China, grant number 11904329, and the Applied Basic Research Foundation of Shanxi Province, grant number 201801D221153, 202203021212122.

Institutional Review Board Statement

Not applicable.

Informed Consent Statement

Not applicable.

Data Availability Statement

Not applicable.

Conflicts of Interest

The authors declare that they have no conflict of interest.

References

  1. Yeung, M.T.; Mohammadi, R.; Kaner, R.B. Ultraincompressible, superhard materials. Annu. Rev. Mater. Res. 2016, 46, 465–485. [Google Scholar] [CrossRef]
  2. Akopov, G.; Pangilinan, L.E.; Mohammadi, R.; Kaner, R.B. Perspective: Superhard metal borides: A look forward. APL Mater. 2018, 6, 070901. [Google Scholar] [CrossRef]
  3. Chung, H.Y.; Weinberger, M.B.; Levine, J.B.; Kavner, A.; Yang, J.M.; Tolbert, S.H.; Kaner, R.B. Synthesis of ultra-incompressible superhard rhenium diboride at ambient pressure. Science 2007, 306, 436–439. [Google Scholar] [CrossRef]
  4. Akopov, G.; Yeung, M.T.; Kaner, R.B. Rediscovering the Crystal Chemistry of Borides. Adv. Mater. 2017, 29, 1604506. [Google Scholar] [CrossRef]
  5. Young, A.F.; Sanloup, C.; Gregoryanz, E.; Scandolo, S.; Hemley, R.J.; Mao, H.K. Synthesis of Novel Transition Metal Nitrides IrN2 and OsN2. Phys. Rev. Lett. 2006, 96, 155501. [Google Scholar] [CrossRef] [PubMed] [Green Version]
  6. Lu, C.; Li, Q.; Ma, Y.; Chen, C. Extraordinary indentation strain stiffening produces superhard tungsten nitrides. Phys. Rev. Lett. 2017, 119, 115503. [Google Scholar] [CrossRef] [PubMed] [Green Version]
  7. Li, Q.; Wang, J.; Liu, H. Theoretical research on novel orthorhombic tungsten dinitride from first principles calculations. RSC Adv. 2018, 8, 9272–9276. [Google Scholar] [CrossRef]
  8. Kaner, R.B.; Gilman, J.J.; Tolbert, S.H. Designing superhard materials. Science 2005, 308, 1268–1269. [Google Scholar] [CrossRef] [PubMed] [Green Version]
  9. Liang, Y.; Gao, Z.; Qin, P.; Gao, L.; Tang, C. The mechanism of anomalous hardening in transition-metal monoborides. Nanoscale 2017, 9, 9112–9118. [Google Scholar] [CrossRef]
  10. Li, Q.; Zhou, D.; Zheng, W.; Ma, Y.; Chen, C. Anomalous Stress Response of Ultrahard WBn Compounds. Phys. Rev. Lett. 2015, 115, 185502. [Google Scholar] [CrossRef] [Green Version]
  11. Yeung, M.T.; Lei, J.; Mohammadi, R.; Turner, C.L.; Wang, Y.; Tolbert, S.H.; Kaner, R.B. Superhard Monoborides: Hardness Enhancement through Alloying in W1−xTaxB. Adv. Mater. 2016, 28, 6993–6998. [Google Scholar] [CrossRef]
  12. Liang, Y.; Qin, P.; Jiang, H.; Zhang, L.; Zhang, J.; Tang, C. Designing superhard metals: The case of low borides. AIP Adv. 2018, 8, 045305. [Google Scholar] [CrossRef] [Green Version]
  13. Yao, T.; Wang, Y.; Li, H.; Lian, J.; Zhang, J.; Gou, H. A universal trend of structural, mechanical and electronic properties in transition metal (M = V, Nb, and Ta) borides: First-principle calculations. Comput. Mater. Sci. 2012, 65, 302–308. [Google Scholar] [CrossRef]
  14. Fan, C.-Z.; Zeng, S.-Y.; Li, L.-X.; Zhan, Z.-J.; Liu, R.-P.; Wang, W.-K.; Zhang, P.; Yao, Y.-G. Potential superhard osmium dinitride with fluorite and pyrite structure: First-principles calculations. Phys. Rev. B 2006, 74, 125118. [Google Scholar] [CrossRef] [Green Version]
  15. Grimvall, G.; Magyari-Köpe, B.; Ozoliņš, V.; Persson, K.A. Lattice instabilities in metallic elements. Rev. Mod. Phys. 2012, 84, 945–986. [Google Scholar] [CrossRef] [Green Version]
  16. Hill, R. The elastic behaviour of a crystalline aggregate. Proc. Phys. Soc. A 1952, 65, 349–354. [Google Scholar] [CrossRef]
  17. Zhang, Y.; Zhao, Y.; Hou, H.; Wen, Z.; Duan, M. Comparison of mechanical and thermodynamic properties of fcc and bcc titanium under high pressure. Mater. Res. Express 2019, 6, 1065c4. [Google Scholar] [CrossRef]
  18. Chen, X.-Q.; Niu, H.; Li, D.; Li, Y. Modeling hardness of polycrystalline materials and bulk metallic glasses. Intermetallics 2011, 19, 1275–1281. [Google Scholar] [CrossRef] [Green Version]
  19. Niu, H.; Niu, S.; Oganov, A.R. Simple and accurate model of fracture toughness of solids. J. Appl. Phys. 2019, 125, 065105. [Google Scholar] [CrossRef] [Green Version]
  20. Pugh, S.F. XCII. Relations between the elastic moduli and the plastic properties of polycrystalline pure metals. Philos. Mag. 1954, 45, 823–843. [Google Scholar] [CrossRef]
  21. Frantsevich, I.N.; Voronov, F.F.; Bokuta, S.A. Elastic Constants and Elastic Moduli of Metals and Insulators: Handbook; Naukova Dumka: Kiev, Ukraine, 1983; p. 60. [Google Scholar]
  22. Li, X.H.; Yong, Y.L.; Cui, H.L.; Zhang, R.Z. Mechanical behavior, electronic and phonon properties of ZrB12 under pressure. J. Phys. Chem. Solids 2018, 117, 173–179. [Google Scholar] [CrossRef]
  23. Pan, Y.; Wang, X.; Li, S.; Li, Y.; Wen, M. DFT prediction of a novel molybdenum tetraboride superhard material. RSC Adv. 2018, 8, 18008–18015. [Google Scholar] [CrossRef]
  24. Liang, Y.; Zhong, Z.; Zhang, W. A thermodynamic criterion for designing superhard transition-metal borides with ultimate boron content. Comput. Mater. Sci. 2013, 68, 222–228. [Google Scholar] [CrossRef]
  25. Blanco, M.A.; Francisco, E.; Luanan, V. GIBBS: Isothermal-isobaric thermodynamics of solids from energy curves using a quasi-harmonic Debye model. Comput. Phys. Commun. 2004, 158, 57–72. [Google Scholar] [CrossRef]
  26. Luo, Y.; Wang, J.; Li, J.; Hu, Z.; Wang, J. Theoretical study on crystal structures, elastic stiffness, and intrinsic thermal conductivities of β-, γ-, and δ-Y2Si2O7. J. Mater. Res. 2015, 30, 493–502. [Google Scholar] [CrossRef]
  27. Pan, Y.; Lin, Y.H.; Guo, J.M.; Wen, M. Correlation between hardness and bond orientation of vanadium borides. RSC Adv. 2014, 4, 47377–47382. [Google Scholar] [CrossRef]
  28. Kresse, G.; Furthmuller, J. Efficient iterative schemes for ab initio total-energy calculations using a plane-wave basis set. Phys. Rev. B 1996, 54, 11169. [Google Scholar] [CrossRef]
  29. Perdew, J.P.; Burke, K.; Ernzerhof, M. Generalized Gradient Approximation Made Simple. Phys. Rev. Lett. 1996, 77, 3865–3868. [Google Scholar] [CrossRef] [Green Version]
  30. Monkhorst, H.J.; Pack, J.D. Special points for Brillouin-zone integrations. Phys. Rev. B 1976, 13, 5188–5192. [Google Scholar] [CrossRef]
Figure 1. Crystal structures of TM2B3 (TM = Nb, Ta) borides.
Coatings 13 01302 g001
Figure 2. Pressure dependence of the bulk, shear, and Young’s modulus (a), Vickers hardness and fracture toughness (b), and B/G and Poisson’s ratio σ (c) of Nb2B3 and Ta2B3.
Coatings 13 01302 g002
Figure 3. Pressure effects on the anisotropy of the (a) bulk modulus, (b) shear modulus, and (c) Young’s modulus of Nb2B3 and Ta2B3. The insets give the 3D plots of elastic modulus at 100 GPa.
Coatings 13 01302 g003
Figure 4. Temperature dependences of the volume thermal expansion coefficient α at different pressures for Nb2B3 ( ) and Ta2B3 ( ).
Coatings 13 01302 g004
Figure 5. Pressure dependences of the Debye temperature Θ at different temperatures for Nb2B3 and Ta2B3.
Coatings 13 01302 g005
Figure 6. The difference in charge density maps in the (100) plane for Nb2B3 (a) 0 GPa, (b) 100 GPa and Ta2B3 (c) 0 GPa, and (d) 100 GPa.
Coatings 13 01302 g006
Figure 7. Pressure dependence of the bond population (a) and bond length (b) of B–B bonds for Nb2B3 and Ta2B3. B-B(1), B-B(2) and B-B(3) corresponds to ① ② ③ in Figure 6.
Coatings 13 01302 g007
Table 1. Calculated lattice constants a, b, c (Å) of Nb2B3 and Ta2B3 with the available data for comparison.
abc
Nb2B3present3.31019.5073.159
Cal. [13]3.31019.5043.128
Ta2B3present3.33719.6873.159
Cal. [13]3.33719.6853.159
Table 2. Atomic bond population (P), bond length of B–Nb(Ta) bonds, and atomic Mulliken charge for Nb2B3 and Ta2B3.
0 GPa100 GPa
BondPBond
Length (Å)
AtomCharge
(e)
PBond Length (Å)AtomCharge
(e)
Nb2B3B5--Nb4−0.092.36768 −0.452.20505
B2--Nb2−0.092.36768 −0.452.20505
B6--Nb20.772.39143B1−0.530.212.21945B1−0.65
B3--Nb40.772.39143B2−0.530.212.21945B2−0.65
B4--Nb30.032.43817B3−0.54−0.112.26022B3−0.67
B1--Nb10.032.43817B4−0.53−0.112.26022B4−0.65
B4--Nb10.182.44751B5−0.53−0.532.26572B5−0.65
B1--Nb30.182.44751B6−0.540.532.26572B6−0.67
B2--Nb30.322.45273Nb11.03−0.212.27156Nb11.25
B5--Nb10.322.45273Nb20.58−0.212.27156Nb20.72
B6--Nb30.162.50015Nb31.030.192.31677Nb31.25
B3--Nb10.162.50015Nb40.580.192.31677Nb40.72
B6--Nb40.122.58615 0.022.37148
B3--Nb20.122.58615 0.022.37148
Ta2B3B5--Ta4−0.052.39181 −0.352.23146
B2--Ta2−0.052.39181 −0.352.23146
B6--Ta21.142.41141B1−0.610.982.24347B1−0.63
B3--Ta41.142.41141B2−0.590.982.24347B2−0.60
B4--Ta3−0.012.46156B3−0.64−0.352.28940B3−0.69
B1--Ta1−0.012.46156B4−0.61−0.352.28940B4−0.63
B4--Ta10.542.46975B5−0.590.422.29339B5−0.60
B1--Ta30.542.46975B6−0.640.422.29339B6−0.69
B2--Ta30.622.47436Ta11.230.452.29746Ta11.30
B5--Ta10.622.47436Ta20.610.452.29746Ta20.62
B6--Ta3−0.002.52862Ta31.23−0.302.34801Ta31.30
B3--Ta1−0.002.52862Ta40.61−0.302.34801Ta40.62
B6--Ta40.252.59587 0.282.40293
B3--Ta20.252.59587 0.282.40293
Disclaimer/Publisher’s Note: The statements, opinions and data contained in all publications are solely those of the individual author(s) and contributor(s) and not of MDPI and/or the editor(s). MDPI and/or the editor(s) disclaim responsibility for any injury to people or property resulting from any ideas, methods, instructions or products referred to in the content.