Abstract
The dynamic contact behavior between multi-component droplets and the surface of iron ore dust was taken as the research object, analysis of the maximum spreading coefficient, maximum acting diameter, maximum acting area, and maximum bouncing height of solid-liquid contact, from a microscopic perspective, using high-speed photography and image analysis and processing technology. The experimental results indicate that (1) with the particle size of dust particles decreases, the solid-liquid contact behavior sequentially manifests as spread immediately after broken, retraction, negative bounce, primary bounce, and secondary bounce. (2) When the surface tension of the droplets decreases from 55.5 to 34.8 mN/m, the maximum spreading diameter of the droplet has increased by 30% to 40%, the maximum bounce heights (coefficients) decreased by 100%, 57.14%, and 53.57%, respectively, the maximum spreading coefficient of the droplet exhibits no obvious pattern. (3) With decreasing droplet surface tension, the unidirectional acting diameter and the maximum acting area increase when the dust surface size is over 100 μm. When the surface particle size is less than 100 μm, there is no significant change in the unidirectional acting diameter and maximum acting area despite decreasing surface tension. Thus, droplet diffusion is mainly influenced by particle size. These findings contribute to enhancing the theory of water mist dust removal and improving dust removal efficiency.
1. Introduction
The common fields in daily production, such as water mist dust removal [1], food engineering [2], inkjet printing [3], pesticide spraying [4], and oil and energy transmission [5,6], all involve solid-liquid interface contact behavior issues. The behavior of solid-liquid contact is a complex process that depends on various physical and chemical properties such as the shape, material, and motion parameters of droplets and solid surfaces [7]. The contact behavior of droplets on dust surfaces is even more variable due to the particularity of the dust surface. When a droplet hits a solid surface, it may spread, bounce, or even break. The change in droplet shape during impact depends on factors such as droplet size, surface tension, viscosity, density, surface morphology, surface roughness, and surface temperature.
Despite the late start of high-speed photography technology in the field of droplet collision on dust walls, research in this area has made significant achievements. In 1876, Worthington [8] first conducted research on the phenomenon of liquid colliding with solid surfaces and found that droplets would break up at high impact velocities, laying the foundation for later research on solid-liquid collision phenomena. When a droplet acts on a solid, the impact phenomenon can be divided into several sub processes such as diffusion, progression, splashing, and bouncing. Rang et al. [9,10] studied the influence of liquid viscosity on the droplet impact process. Further experiments have proved that droplet expansion, retraction, partial rebound, and complete rebound can occur after impact on the wall. Qualitative analysis has been made on influencing factors such as impact velocity, fluid properties, and surface wettability. Early research with low-speed and low-resolution cameras has studied the effects of various parameters on the maximum spreading diameter and rebound ground, and the influence of liquid viscosity on the droplet impact process has also been investigated. Huang et al. [11] studied the effect of wettability of solid surfaces on droplet spreading speed, and introduced the concept of auxiliary dissipation into traditional models for the first time. Bi et al. [12] found that the viscosity of liquids plays a dominant role in the spreading process, while surface tension plays a dominant role in the retraction of droplets. Andrade et al. [13] found that in the contact process between the liquid drop and the solid food surface, the lower surface tension will promote the expansion of the liquid drop in the relaxation stage and weaken the oscillation process of the liquid drop, while the higher viscosity will inhibit the spreading and retreating process of the liquid drop. Rioboo et al. [14] obtained the critical impact velocity of the droplet bouncing on the super-hydrophobic surface according to the conservation of energy, and verified this conclusion through experiments. Roeland et al. [15] studied the influence of the height and distance of the microstructure of the hydrophobic surface on the air film, aiming at the development law of the air film between the collision droplet and the wall.
Roisman et al. [16] found that the diffused liquid layer on the wall after a single droplet retreats due to surface tension effect has been found to be surrounded by a free edge determined by the interaction between the free edge and the internal liquid layer, as well as the force exerted by the wall on the edge. Hardalupas et al. [17] used laser Doppler technology to measure the particle size and velocity of the mass droplets near the collision surface, and the test showed that the angle which the droplets hit the wall directly affected the particle size generated by sputtering. In order to explore the solid-liquid contact mechanism of coal water under gas atmosphere, Wei and Xu et al. [18,19] analyzed the adsorption characteristics of coal water contact under gas atmosphere, and found that coal dust particle size and surface roughness are important factors for water adsorption. Jin et al. [20,21,22,23] previously studied the wettability of metal mine blasting dust and found that the smaller the dust particles, the more complex the surface pore structure, and the thicker the air film on the surface of the dust solid, reducing the spreading performance of the liquid on the dust solid. With the advancement of computer technology, virtual simulation technology has become an effective means to study droplet interface behavior and improve the visibility of droplet morphology changes. The Volume of Fluid (VOF) method was first proposed in 1981 and is a surface tracking method fixed under the Euler grid [24]. The fluid volume function is obtained by defining the ratio of the target fluid volume to the mesh volume in each grid of the flow field, and the volume function is introduced into the fluid control equations for solving, so as to track the multiphase flow interface. This method has been used to study the crushing model of liquid particles at different velocities and conduct numerical simulation of the collision between droplets and walls in a typical three-dimensional two-phase turbulent field, thus verifying the model [25]. Ji et al. [26] established a CFD-DEM coupled dynamic model suitable for liquid-solid two-phase flow and found that as the viscosity of the fluid increased, the ability of the fluid to transport particles increased, and the collision impact of particles on the wall in unconstrained space became more severe. Xie et al. [27,28] established a high-speed water droplet impact model with blade steel, and studied the impact of water droplets with various velocities and particle sizes on the blade. The transient pressure distribution inside the water droplet and the compression, expansion, and splashing of the water droplet after impact were obtained.
In the field of water mist dust removal research, commonly used dust removal measures include hydraulic dust removal [29], purified air flow [30], and ventilation dust removal [31]. Hydraulic dust removal is one of the most widely used, convenient, and effective dust removal methods. However, the surface tension of water is high, and the wetting effect of dust is poor. The dust removal efficiency of spraying clean water underground is only about 30% [32,33]. With the advancement of technology, chemical dust suppression has become an effective means to improve dust removal efficiency. In 2003, Wu [34] first introduced chemical dust suppression in detail from principle to application, providing systematic guidance for the development of chemical dust suppression related work. Wang et al. [35,36,37] developed a complete set of new mine foam dust suppression technology, analyzed the advantages of this technology, and applied it according to different environments. Zhang et al. [38] prepared a new polymer spray dust remover that can enhance the wettability and cohesiveness, providing a new choice of surfactant for chemical dust suppression. Bao et al. [39] prepared a new type of hydrogel based on cross-linked polymer and tested its inhibition on coal dust. At present, in the field of chemical dust suppression, the analysis of dust suppression effects and the optimization of dust suppressant materials and formulas is mostly from a macro perspective [40]. In recent years, there has been little micro and micro research on the laws of dust suppression effect [41,42], especially from a micro perspective on the contact behavior between dust suppression droplets and dust surfaces. However, this has important theoretical and practical value for improving the theory of water mist dust removal and improving dust removal efficiency.
In this study, we aim to experimentally investigate the dynamic contact behavior between multi-component droplets and iron ore dust surfaces using high-speed photography, image analysis, and other technologies. We will compare and analyze the difference characteristics under different dust particle sizes and surface tension conditions to optimize the wetting agent formulation and improve dust collection efficiency.
2. Materials and Methods
2.1. Materials
(1) Sample preparation and characterization
The experimental samples are from the underground iron ore of Meishan Iron Mine in Nanjing city, Jiangsu Province, China. The XRD analysis shows that the main components are hematite (Fe2O3), quartz (SiO2), siderite (Fe(CO3)), calcite (Ca(CO3)), and ferridolomite (Ca(Fe2+,Mg)(CO3), and contain iron oxides, silica, and carbonates.
Firstly, the iron ore is crushed in the jaw crusher, and then it is ground in the sampling machine. After the dust is dried, it is screened by the vibrating screen machine for the first time, selecting standard testing of 300 mesh (Dahan machinery, Xinxiang, China) and placing from large to small according to the size of the sieve hole. After the end of the first screening, the screen mesh is cleaned, and the dust is dried twice, and then the secondary screening is carried out. After the screening, the particles of different particle sizes are obtained and sealed in the sealed tank for reserve.
The steps are as follows: take an appropriate amount of dust (3~5 g) and spread it on the utensil (5 mm in diameter), and scrape the excess dust along the edge of the utensil with a slide, so that the edge of the utensil is flush with the surface of the dust pile and the depth of the utensil is about (3 mm) of the dust thickness. According to the above steps, dust in different particle size intervals was taken to make six samples (see Table 1), which were denoted as S1~S6. As shown in Table 1, the dust diameter range in S1 is 125~150 mm, S2 is 105~125 mm, S3 is 100~105 mm, S4 is 90~100 mm, S5 is 74~90 mm, and S6 is 65~74 mm.

Table 1.
Screen size statistics.
(2) Solution preparation
Multi-component wetting agent was selected as the experimental solution. The multi-component wetting agent was a kind of reagent made by thermal synthesis process of hygroscopic inorganic salt and several kinds of surfactants. We ensured that the surface tension of the solution met a certain gradient, the mass concentrations of the prepared solutions were 0 g/mL, 0.005% g/mL, 0.01% g/mL, 0.05% g/mL, 0.10% g/mL, and 0.15% g/mL (see Table 2), denoted by Y0~Y5, respectively. It was found that the surface tension value of solution A was relatively stable at 0.15% g/mL, so the maximum mass concentration of solution was selected as 0.15% g/mL.
Table 2.
Mass fraction, surface tension, and viscosity of the solution.
The results show that the surface tension decreases with the increase in solution mass fraction. The overall distribution of viscosity is 1.26~1.30 mPa·s, with a variation range of 3.2%. Therefore, the influence of viscosity change is ignored in this study.
2.2. Apparatus
In order to capture the whole process of contact between droplets and dust surfaces under microscopic conditions, a set of observation and analysis test equipment was independently built, as shown in Figure 1. The device is divided into image observation unit, droplet generation unit, dust regulation unit, and image analysis and processing unit. Among them, the image observation unit is a high-speed camera device and its related components, the droplet generation unit consists of a micro-sampler and a micro-injection pump, the dust regulation unit is a dust placing vessel and a horizontal spiral lifting platform, and the image processing unit is image analysis and contact angle analysis software.
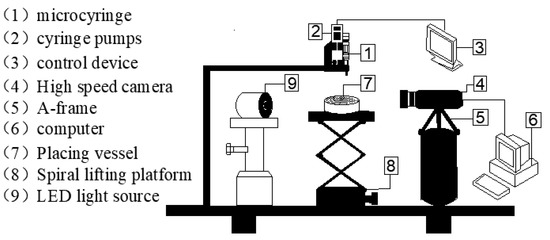
Figure 1.
Test device system.
The preparation of test droplets was completed with a microsampler pump and a microsampler (10 microliters). The microsampler sucked and pumped liquid under the control of the control panel, and stably generated droplets (with a diameter of about 2.48 mm) at its front end. The distance H between the sampler and the dust container was fixed to ensure that the droplet velocity V was consistent during each contact.
2.3. Testing Plan
The contact process between the dust suppression droplet and the surface of the dust pile was captured by high speed camera technology. The experimental process includes the following two processes:
(1) The capture of the contact process. Taken by a computer-controlled high-speed camera with the shortest time interval of 500 milliseconds and the image pixel of 512 × 512. During the test, the start time of the shooting should be manually controlled and the capture should be started at the moment of the drop, and the contact process should be automatically photographed and saved by the computer. In this process, the micro-injection pump control interface is used to control the discharge of liquid from the micro-injector, and the supporting software of high-speed camera controls the start and end of the shooting. The key point of the experiment is to control the start time of the shooting, so as to avoid the failure to observe the whole process of the contact between droplets and dust surface due to early or late shooting. After the shooting, the dust surface should be left standing for 3 min, and the effect of liquid drops on the dust surface should be photographed by optical microscope.
(2) Image processing. The completed pictures are classified according to the difference of droplet behavior, and the pictures meeting the conditions of droplet contact angle measurement are screened out, and the relevant processing software is used for measurement. By observing the complete contact process between droplet and dust surface, the droplet behavior is statistically classified, the basic behavior types of droplet are summarized, and the same behavior phenomenon and its unique behavior phenomenon as other solid-liquid contact in the contact process between droplet and dust surface are summarized. The image analysis and processing software was used to measure the relevant parameters in the contact process between the droplet and the dust surface, and the influence of different factors on the droplet behavior was quantitatively analyzed.
Considering that the droplet is approximately elliptical, the equivalent diameter D0 was used to measure the droplet size.
where, Dh was the horizontal diameter, mm; Dv was the vertical diameter, mm.
In order to reduce the error, the average value of multiple measurements was taken as D0 before the experiment. After repeated debugging, the experimental parameters were set as follows: droplet height h = 100 mm, droplet diameter D0 = 2.34~2.38 mm, droplet velocity 1.589~1.602 m/s.
2.4. Testing Items
2.4.1. Droplet Behavior Types
This study has provided valuable insights into the behavior of liquid droplets on dust surfaces. Through a thorough analysis of the energy dynamics involved in the spreading, retracting, and bouncing stages of droplets, as well as an investigation of the various types of energy loss during the contact process between droplets and dust, this study has laid a solid foundation for future multi-factor analysis. Additionally, the identification and classification of different contact behaviors of droplets on dust surfaces, including direct spread, fragmentation, retraction, negative bounce, primary bounce, and secondary bounce, have opened up new avenues for understanding the underlying mechanisms driving these phenomena.
(1) Contact behavior analysis
As shown in Figure 2, through numerous experimental observations, we have discovered that the behavior of liquid droplets on dust surfaces can be classified into distinct categories, including direct fragmentation, retraction, negative bounce, primary bounce, and secondary bounce, which have been denoted as 10, 20, 30, 40, and 50, respectively.
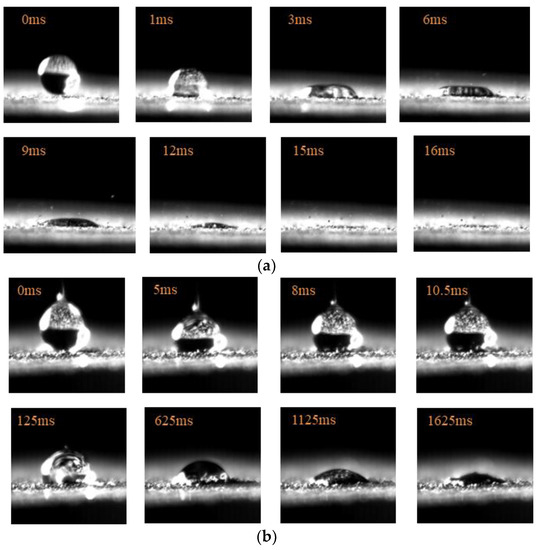
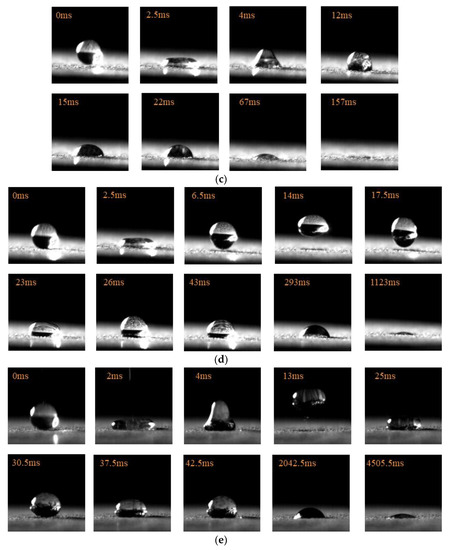
Figure 2.
Droplet behavior types. (a) Spread immediately after broken; (b) retraction; (c) negative bounce; (d) primary bounce; (e) secondary bounce.
(2) Decision process of contact behavior
Figure 3 illustrates the process of determining the contact behavior type for one or more dynamic stages included in the contact process between droplets and dust surfaces.
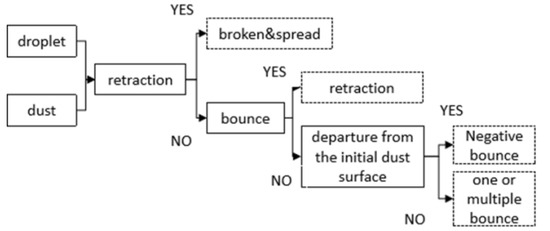
Figure 3.
Process for determining contact behavior between droplets and dust surfaces.
2.4.2. Maximum Spreading Coefficient
The spreading stage is an essential phase that occurs when a liquid droplet comes into contact with a dust surface. During this process, the maximum contact diameter between the droplet and the surface is the droplet’s maximum spreading diameter. The maximum spreading coefficient, which can be calculated using the droplet’s maximum spreading diameter, is a critical parameter for measuring the droplet’s spreading performance in solid-liquid contact. Therefore, studying the maximum spreading coefficient holds great value. The calculation formula for the maximum spreading coefficient is presented in Formula (2).
where, βmax is the maximum spreading coefficient; Dmax is the droplet’s maximum spreading diameter, mm; D0 is the initial diameter of the droplet, mm.
2.4.3. Maximum Acting Diameter and Acting Area
In the realm of solid-liquid contact, the spread area of droplets on solid surfaces is a common focus of study [43,44]. However, due to the internal infiltration behavior of droplets when in contact with dust surfaces, analyzing the spread area alone may not fully capture the effect of the droplets. To address this, after the droplets have completely disappeared on the dust surface, the test dust sample is left to stand for 3 min before being placed under an Olympus optical microscope to capture the maximum effect of the droplets. This approach ensures that the droplets’ effect is accurately measured without the interference of evaporation or complete spreading on the dust surface. Image analysis software is then used to measure the acting diameter and area of droplets, as shown in Figure 4.
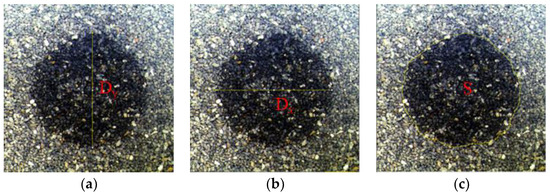
Figure 4.
Measurement of droplet effect. (a) the longitudinal maximum acting diameter; (b) the transverse maximum acting diameter; (c) the maximum acting area. Dx represents the diameter in the x direction; Dy represents the diameter in the x direction; S represents the wetting area.
2.4.4. Maximum Bounce Height
The bouncing behavior of a droplet is influenced by various experimental conditions, resulting in fluctuations in its bouncing height. During the bouncing process, the droplet eventually reaches its maximum height, Hmax, as depicted in Figure 5. To determine the maximum bouncing height of the droplet, image screening was conducted and analyzed using image processing software. Subsequently, the maximum bouncing height under different conditions was compared and analyzed, leading to a better understanding of the droplet’s behavior.
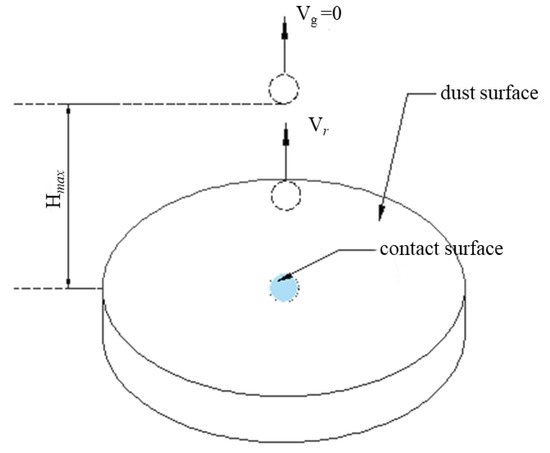
Figure 5.
Schematic diagram of the maximum bouncing height of single drop.
To minimize the influence of particle size differences on droplet behavior under different conditions, it is necessary to introduce a dimensionless parameter to describe the impact of dust surface differences on the bounce-height of droplets. This parameter is known as the maximum bounce-coefficient H, which is calculated using Equation (2). The H parameter provides a standardized way to compare and analyze the maximum bouncing height of droplets under different experimental conditions, despite the slight variations in droplet diameter.
where, Hmax is the maximum bouncing height of the droplet, mm; D0 is the initial diameter of the droplet, mm.
3. Results and Discussion
3.1. Pattern of Contact Behavior
Figure 6 illustrates the contact behavior of pure water droplets on different dust surfaces. The contact behavior of pure water droplets on the surface of S1, S2, and S3 dust is fragmentation and direct spreading. As the overall particle size of the dust surface continues to decrease, pure water droplets begin to exhibit negative bouncing on the S4 dust surface, and bouncing behavior occurs on the S5 and S6 dust surfaces.
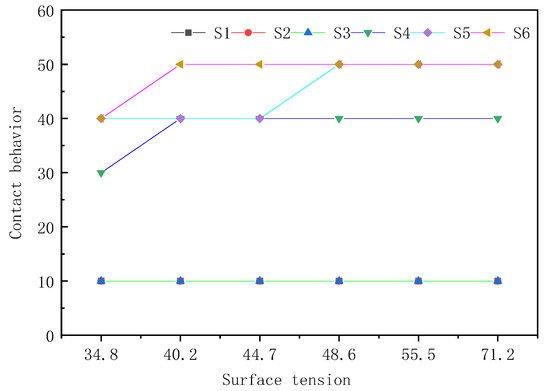
Figure 6.
Contact behavior of droplets under different conditions.
From the perspective of energy conversion, if a droplet can undergo bouncing behavior, the formula [45] should be met:
where, Evf is the final kinetic energy of the droplet recovery stage, J; Es is the surface energy of the droplet, J/m2; Eh is the gravitational potential energy of the droplet, J.
According to Formula (4), when the droplet undergoes direct spreading behavior and there is no retraction stage, then:
Evf = 0
If the droplet only undergoes retraction behavior, then:
The contact behavior between droplets and dust mainly depends on the particle size of the dust. When the dust particle size is greater than 100 μm, liquid droplets can adsorb on the dust surface, making it difficult for the remaining energy of the droplets to support their retraction behavior. As the dust particle size decreases, the pores on the surface of the dust pile decrease, increasing the thickness of the surface air film, hindering the spread of droplets on the dust surface, reducing the energy consumption of the first spread of droplets, and allowing sufficient energy for the droplets to retract and rebound.
Furthermore, it is observed that the contact behavior of droplets is independent of the droplet’s surface tension within a certain range when the dust particles are large. However, as the surface tension decreases and the dust particle size becomes smaller, the droplet’s behavior changes from secondary bouncing to primary bouncing, such as on the surface of S5 and S6 dust. Notably, the surface of S4 dust changes from one bounce to negative bounce under the action of Y5 droplets. This is attributed to the increase in wettability of liquid to solid and adhesion between solid and liquid, due to the decrease in droplet surface tension and contact angle. This, in turn, leads to increased energy required to cope with the dust surface during the spreading and shrinking stage. As the surface energy of the droplets decreases, the energy provided for the droplets to bounce also decreases, resulting in weakened droplet bounce performance.
3.2. Maximum Spreading Diameter
When the surface tension of the droplets decreases from 55.5 to 34.8 mN/m, the maximum spreading diameter of the droplet has increased by 30% to 40%, indicating that droplets with lower surface tension tend to spread further on the dust surface, as shown in Figure 7. However, the maximum spreading coefficient of the droplet exhibits no obvious pattern, as shown in Figure 8. This is due to the interplay of several factors, such as the reduction of initial surface energy and the increase in adhesive forces between the droplet and dust surface, which contribute to increased energy dissipation during spreading. Furthermore, the spreading process is also influenced by the occurrence of longitudinal penetration behavior, which is promoted by the reduction in surface tension and further increases the energy loss during spreading. Despite these factors contributing to a weakened horizontal spreading effect, the reduction in surface tension also strengthens the wetting effect of the droplet and promotes spreading behavior. Ultimately, it is the interplay of all these factors that results in the complex behavior of the droplet spreading coefficient.
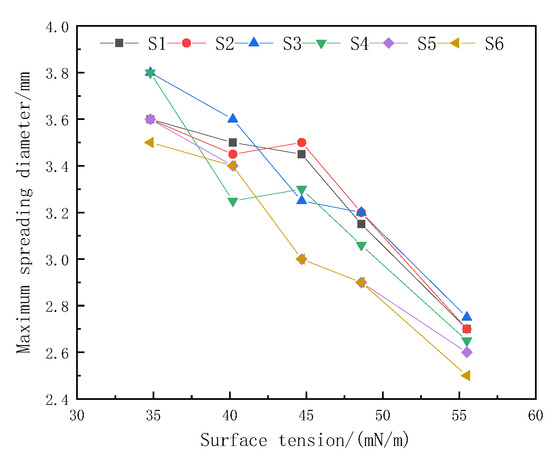
Figure 7.
Maximum spreading diameter.
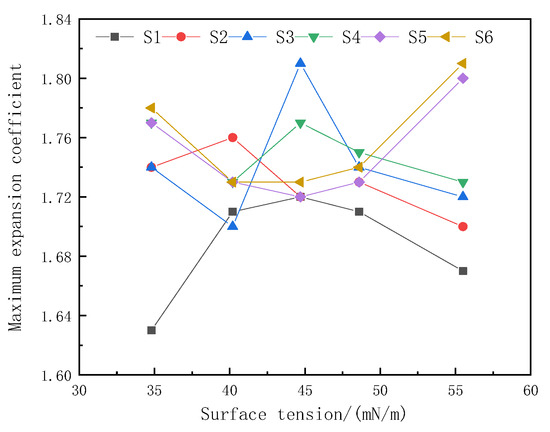
Figure 8.
Maximum spreading coefficient.
3.3. Maximum Acting Diameter and Acting Area
Figure 9 and Figure 10 demonstrate that the impact of liquid droplets on the surface of dust is non-uniform. There are discernible distinctions between the horizontal and longitudinal effects on certain dust surfaces, with the range of action assuming an irregular shape, reflecting variations in the wetting behavior of the dust surfaces. With decreasing droplet surface tension, the unidirectional acting diameter and the maximum acting area increase when the dust surface size is over 100 μm. For example, in S3, when the surface tension of the droplet decreases from 55.5 to 34.8 mN/m, the acting diameter in the x direction increases by 22.2%, the acting diameter in the y direction increases by 35.2%, and the maximum action area increases by 58%. However, when the surface particle size is less than 100 μm, there is no significant change in the unidirectional acting diameter and maximum acting area despite decreasing surface tension. This suggests that surface tension reduction can enhance solution wettability to a certain degree, but cannot augment the acting area. Moreover, lowering the solution’s surface tension accelerates the longitudinal penetration of droplets, transforming a portion of the droplet from transverse spreading to longitudinal penetration. This weakens the lateral action of the droplet and ultimately reduces the droplet’s action area.
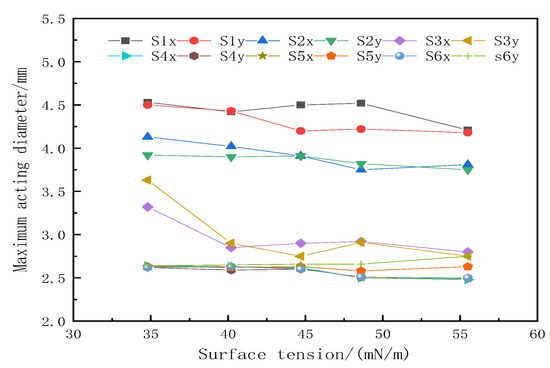
Figure 9.
Maximum diameter.
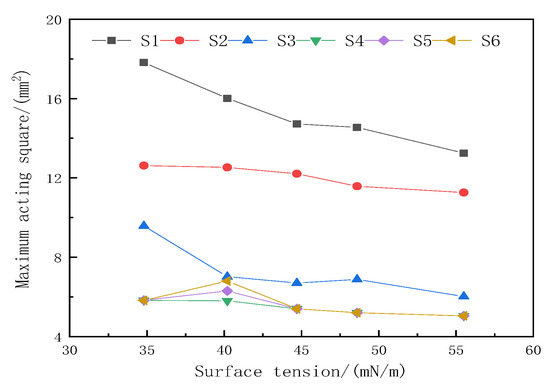
Figure 10.
Maximum active area.
The experimental results reveal that the fundamental behavior exhibited by the droplets is retraction and rebound. Upon contact with the dust surface for the second time at the end of the bouncing stage, the droplets deviate from the first contact site, forming a new contact interface and increasing the maximum acting area of the droplets, as shown in Figure 11.
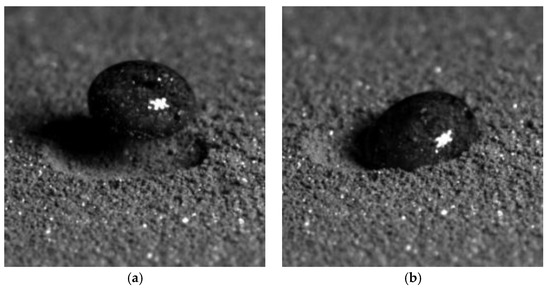
Figure 11.
The process of increasing the action area of liquid droplets when they come into contact with dust surfaces. (a) Droplet rebound; (b) Deviation of droplet spreading position.
Furthermore, the maximum acting area of droplets experiences a sudden change point on the surface of S6 dust, which is not consistent with the overall trend. This may be attributed to the small particle size.
3.4. Maximum Vertical Bounce
As show in Figure 12, when the surface tension of the droplets decreased from 55.5 to 34.8 mN/m, the maximum bounce heights (coefficients) of S3, S4, and S5 decreased by 100%, 57.14%, and 53.57%, respectively. Previous research indicates that droplet surface tension weakens its bouncing performance, and the decline in these two parameters confirms this conclusion. The reduction in surface tension causes a decrease in the droplet’s initial surface energy. Additionally, the enhancement of the droplet’s wettability leads to increased energy dissipation during its spreading and retracting behavior. Consequently, the energy available to support the droplet’s bouncing is reduced, leading to a decline in the maximum bouncing height.
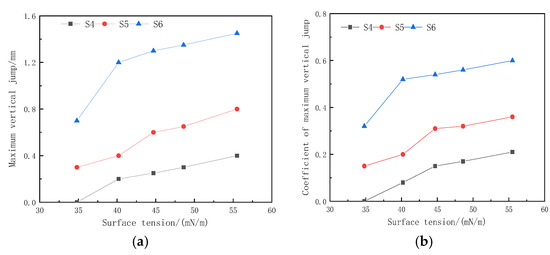
Figure 12.
Drop bounce parameters. (a) maximum droplet bounce height; (b) maximum droplet bounce height coefficient.
4. Conclusions
(1) The effect of dust particle size on the behavior of liquid droplets is evident. As the particle size decreases, the droplet’s bouncing ability increases while its spreading effect weakens, resulting in a decrease in the maximum spreading diameter. This is due to the fact that smaller particle sizes make it more difficult for droplets to wet the surface. Therefore, particle size is a key factor in determining droplet spreading. It is worth noting that when the dust surface particle size exceeds 100 μm, the decrease in droplet surface tension has minimal effect on increasing the droplet spreading area. This is because the decrease in surface tension accelerates the longitudinal penetration of the droplet, causing some droplets to transform from transverse spreading to longitudinal penetration, thereby weakening the lateral action of the droplet and decreasing its acting area.
(2) When the particle size of the dust surface is larger than 100 μm, the effect of decreasing the surface tension of the liquid droplet solution within a certain range on the contact behavior between the liquid droplet and the dust surface is negligible, and the contact behavior is mainly direct spreading or fragmentation. However, when the particle size is less than 100μm, the contact behavior of the droplet shows a sequential occurrence of negative bouncing and bouncing behavior with the decrease in the particle size. In other words, decreasing the surface tension of the liquid droplet solution weakens its bouncing performance. This implies that reducing the surface tension of the liquid droplet solution can improve the spreading ability of the droplet on the dust surface and increase the likelihood of wetting the dust particles.
(3) As the surface tension of the droplet solution decreases, the maximum spreading diameter of the droplet increases by more than 30%. However, the maximum spreading coefficient of the droplet does not follow the same pattern. During the spreading process of droplets on the dust surface, the initial surface energy of the droplets decreases as the surface tension decreases, leading to a stronger adhesion force between the droplets and the dust surface, and a greater longitudinal permeability of the droplets. The interplay of these four forces results in an increase in the maximum spreading diameter of the droplets with increasing surface tension, while the maximum spreading coefficient does not exhibit a clear trend.
(4) Reducing the surface tension of water mist can reduce the thickness of the air film when dust and liquid droplets come into contact, weaken the blocking effect of surface tension during the dust mist coupling process, strengthen the wetting behavior of water mist and dust contact, and achieve dust mist coupling.
Author Contributions
J.G., writing—original draft and experiments; L.J.; conceptualization, supervision and project administration; Y.Y., experiments and investigation; R.C., investigation and data curation; N.M.K., visualization, review and editing; M.L., investigation; Q.Z., experiments; X.Y., experiments. All authors have read and agreed to the published version of the manuscript.
Funding
This research was funded by the National Natural Science Foundation of China (No.51874015), development program of China (No.2017YFC0805204).
Institutional Review Board Statement
This article does not involve ethical issues.
Informed Consent Statement
This article does not involve human research.
Data Availability Statement
The data that supports the findings of this study are available from the corresponding author upon reasonable request.
Conflicts of Interest
The authors declare no conflict of interest.
References
- Li, J.; Zhou, F.; Li, S. Experimental study on the dust filtration performance with participation of water mist. Process Saf. Environ. Prot. 2017, 109, 357–364. [Google Scholar] [CrossRef]
- Werner, S.R.; Jones, J.R.; Paterson, A.H.; Archer, R.H.; Pearce, D.L. Droplet impact and spreading on lecithinated anhydrous milkfat surfaces. J. Food Eng. 2009, 90, 525–530. [Google Scholar] [CrossRef]
- van Dam, D.B.; Le Clerc, C. Experimental study of the impact of an ink-jet printed droplet on a solid substrate. Phys. Fluids 2004, 16, 3403–3414. [Google Scholar] [CrossRef]
- Jia, W.; Zhu, H.; Dong, X.; Xue, F. Study on spray droplets hitting soybean leaf surface. J. Agric. Mach. 2013, 44, 87–94. [Google Scholar]
- Kamgar, A.; Hassanajili, S. Super-hydrophobic Fe3O4@SiO2@MPS nanoparticles for oil remediation: The influence of pH and concentration on clustering phenomenon and oil sorption. J. Mol. Liq. 2020, 315, 113709. [Google Scholar] [CrossRef]
- Hosseinzadeh, K.; Ganji, D.; Ommi, F. Effect of SiO2 super-hydrophobic coating and self-rewetting fluid on two phase closed thermosyphon heat transfer characteristics: An experimental and numerical study. J. Mol. Liq. 2020, 315, 113748. [Google Scholar] [CrossRef]
- Rein, M. Phenomena of liquid drop impact on solid and liquid surfaces. Fluid Dyn. Res. 1993, 12, 61–93. [Google Scholar] [CrossRef]
- Worthington, A. On the forms assumed by drops of liquids falling vertically on a horizontal plate. Proc. R. Soc. Lond. 1876, 25, 261–272. [Google Scholar]
- Kai, R.; Feuillebois, F. Influence of surface roughness on liquid drop impact. J. Colloid Interface Sci. 1998, 203, 16–30. [Google Scholar]
- Sikalo, S.; Marengo, M.; Tropea, C.; Ganic, E. Analysis of impact of droplet on horizontal surface. Exp. Therm. Fluid Sci. 2002, 25, 503–510. [Google Scholar] [CrossRef]
- Huang, H.; Chen, X. Energetic analysis of drop’s maximum spreading on solid surface with low impact speed. Phys. Fluids 2018, 30, 022106. [Google Scholar] [CrossRef]
- Bi, F.; Guo, Y.; Shen, S.; Li, Y. Experimental study of spread characteristics of droplet impacting solid surface. Acta Phys. Sin. 2012, 61, 293–298. [Google Scholar]
- Andrade, R.; Skurtys, O.; Osorio, F. Experimental study of drop impacts and spreading on epicarps: Effect of fluid properties. J. Food Eng. 2011, 109, 430–437. [Google Scholar] [CrossRef]
- Rioboo, R.; Voue, M.; Vaillant, A.; Coninck, J. Drop impact on porous super-hydrophobic polymer surfaces. Langmuir ACS J. Surf. Colloids 2008, 24, 14074–14077. [Google Scholar] [CrossRef] [PubMed]
- Roeland, C.; Henderix, M.; Tran, T.; Sun, C.; Tsai, P.; Lohse, D. How microstructures affect air film dynamics prior to drop impact. Soft Matter 2014, 10, 3703. [Google Scholar]
- Roisman, I.; Rioboo, R.; Tropea, C. Normal impact of a liquid drop on a dry surface: Model for spreading and receding. Proc. R. Soc. Lond. Ser. A Math. Phys. Eng. Sci. 2002, 458, 1411–1430. [Google Scholar] [CrossRef]
- Hardalupas, Y.; Okamoto, S.; Taylor, A.; Whitelaw, J. Application of a phase Doppler anemometer to a spray impinging on a disc. In Proceedings of the 6th International Symposium on the Applications of Laser Techniques to Fluid Mechanics, Lisbon, Portugal, 20–23 July 1992; pp. 490–506. [Google Scholar]
- Wei, J.; Wang, H.; Si, L.; Xi, Y. Characteristics of solid-liquid contact between coal and water under gas atmosphere. J. Coal Sci. 2022, 47, 323–332. [Google Scholar]
- Xu, T.; Sun, H.; Dai, L. Research on the mechanism of the influence of fine coal particle size on coal seam gas content. Min. Res. Dev. 2023, 43, 138–142. [Google Scholar]
- Jin, L.; Guo, J.; Li, G.; Wang, T.; Liu, J. Research progress and prospect of dust poisoning Control Technology in Metal mine stope. Metal Mine 2021, 1, 120–134. [Google Scholar]
- Jin, L.; Wang, J.; Liu, J.; Guo, J.; Wang, T. Influence of dust surface characteristics on wettability of inlet roadway in Luoshan Gold Mine. Saf. Environ. 2019, 19, 1954–1962. [Google Scholar]
- Liu, J.; Jin, L.; Wang, J.; Ou, S.; Ghio, J.; Wang, T. Micromorphology and physicochemical properties of hydrophobic blasting dust in iron mines. Int. Miner. Met. Mater. 2019, 26, 665–672. [Google Scholar] [CrossRef]
- Jin, L.; Liu, J.; Guo, J.; Wang, J.; Wang, T. Physicochemical factors affecting the wettability of copper mine blasting dust. Int. Coal Sci. Technol. 2021, 8, 265–273. [Google Scholar] [CrossRef]
- Hirt, C.; Nichols, B. A computational method for free surface hydrodynamics. J. Press. Vessel Technol. 1981, 103, 136–141. [Google Scholar] [CrossRef]
- Pilch, M.; Erdman, C. Use of breakup time data and velocity history data to predict the maximum size of stable fragments for acceleration-induced breakup of a liquid drop. Int. J. Multiph. Flow 1987, 13, 741–757. [Google Scholar] [CrossRef]
- Ji, S.; Ge, J.; Tan, D. Research on Particle Wall Impact Collision Wall Effects in Liquid Solid Two Phase Fluids. J. Zhejiang Univ. Sci. A 2017, 18, 958–973. [Google Scholar] [CrossRef]
- Xie, Y.; Wang, Y.; Zhang, D. Dynamic response of turbine blades under high-speed impact of water droplets. J. Electr. Eng. China 2008, 280, 76–81. [Google Scholar]
- Xie, Y.; Han, Y.; Zhang, D.; Lan, J. Numerical simulation on elastic-plastic response of high speed liquid-solid impact. In Proceedings of the 10th National Conference on Impact Dynamics, Taiyuan, China, 26 July 2011. [Google Scholar]
- Yang, H.; Yi, H. Experimental study on hydraulic reduction of blasting dust toxicity. Met. Mines 2016, 8, 148–151. [Google Scholar]
- Wu, J.; Yuan, M. Research and Application of Underground High Air Flow Purification Technology in Metal Mines. Min. Res. Dev. 2014, 34, 78–81. [Google Scholar]
- Guo, F.; Yang, T.; Yang, J.; Mo, J. Design and application of exhaust ventilation and dust removal system for rock roadway excavation working face. Min. Saf. Environ. Prot. 2021, 48, 97–100+111. [Google Scholar]
- Li, G.; Wu, J.; Jin, L.; Guo, J. Research Status and Prospects of Dust Control Technology in Metal Mines in China. Met. Mines 2021, 1, 154–167. [Google Scholar]
- Wang, P.; Wang, X.; Liu, Y. Research Status and Prospects of Dust Suppressants for Coal Mines in China. Chem. Miner. Process. 2021, 50, 49–54+64. [Google Scholar]
- Wu, C. Chemical Dust Suppression; Central South University Press: Changsha, China, 2003. [Google Scholar]
- Wang, D. Mineralogy; Science Press: Beijing, China, 2015. [Google Scholar]
- Lu, X.; Wang, D.; Ren, W.; Wang, H. Experimental research on foam dust suppression technology in Zaozhuang Binhu Coal Mine. Coal Technol. 2012, 11, 35. [Google Scholar]
- Lu, X.; Wang, D.; Wang, H.; Ren, W.; Gao, Q. Experimental study on foam for mine dust removal. Coal Mine Saf. 2011, 42, 1–3. [Google Scholar]
- Zhang, H.; Nie, W.; Yan, J.; Bao, Q.; Liu, Q. Preparation and performance study of a novel polymeric spraying duet suppression agent with enhanced wetting and coagulation properties for coal mine. Powder Technol. 2020, 364, 901–914. [Google Scholar] [CrossRef]
- Bao, Q.; Nie, W.; Liu, C.; Zhang, H.; Liu, Q. The preparation of a novel hydrogel based on crosslinked polymers for suppressing coal dusts. J. Clean. Prod. 2020, 249, 119343. [Google Scholar] [CrossRef]
- Yang, C.; Wu, C. Study on chemical dust suppression performance of nano-fluids. China Saf. Sci. J. 2019, 29, 147–152. [Google Scholar]
- Gao, Y.; Jun, S.; Pan, L. Interaction and instability of air films between bituminous coal surfaces and surfactant droplets. Fuel 2020, 274, 117839. [Google Scholar] [CrossRef]
- Wang, X.; Yuan, S.; Jiang, B. Wetting process and adsorption mechanism of surfactant solutions on coal dust surface. J. Chem. 2019, 2019, 9085310. [Google Scholar] [CrossRef]
- Li, M.; Guan, Z. Dust suppression of dynamic contact between droplets and dust heap surface behavior research. J. Saf. Environ. 2021, 21, 2550–2556. [Google Scholar]
- Wang, J.; Jin, L.; Guo, J.; Liu, J.; Wang, T.; Gong, Q. Key influencing factors on wettability of blasting dust in Meishan Iron Mine. J. Cent. South Univ. 2019, 50, 2527–2535. [Google Scholar]
- Dai, C.; Ji, X.; Zhou, D.; Wang, Y.; Xu, J. Behavioral characteristics of droplets colliding with different wetted surfaces. J. Zhejiang Univ. 2018, 52, 36–42. [Google Scholar]


Disclaimer/Publisher’s Note: The statements, opinions and data contained in all publications are solely those of the individual author(s) and contributor(s) and not of MDPI and/or the editor(s). MDPI and/or the editor(s) disclaim responsibility for any injury to people or property resulting from any ideas, methods, instructions or products referred to in the content. |
© 2023 by the authors. Licensee MDPI, Basel, Switzerland. This article is an open access article distributed under the terms and conditions of the Creative Commons Attribution (CC BY) license (https://creativecommons.org/licenses/by/4.0/).